
Submitted:
11 November 2025
Posted:
13 November 2025
You are already at the latest version
Abstract
Modern medium-voltage (MV) distribution networks face increasing reliability challenges driven by aging assets, climate variability, and evolving operational demands. In Colombia and across Latin America, reliability metrics such as the system average interruption frequency index (SAIFI), standardized under IEEE 1366, serve as key indicator for regulatory compliance and service quality. However, existing analytical approaches struggle to jointly deliver predictive accuracy, interpretability, and traceability required for regulated environments. Here, we introduces CRITAIR (Criticality Analysis through Interpretable Artificial Intelligence-based Recommendations), an integrated framework that combines predictive modeling, explainable analytics, and regulation-aware reasoning to enhance reliability management in MV networks. CRITAIR unifies three components: (i) a TabNet-based predictive module that estimates SAIFI using outage, asset, and meteorological data while producing global and local attributions; (ii) an agentic retrieval-and-reasoning layer that grounds recommendations in regulatory evidence from RETIE and NTC 2050; and (iii) interpretable reasoning graphs that map decision pathways for full auditability. Evaluations conducted on real operational data demonstrate that CRITAIR achieves competitive predictive performance—comparable to Random Forest and XGBoost—while maintaining transparency through sparse attention and sequential feature explainability. Also, our regulation-aware reasoning module exhibits coherent and verifiable recommendations, achieving high semantic alignment scores (BERTScore) and expert-rated interpretability. Overall, CRITAIR bridges the gap between predictive analytics and regulatory governance, offering a transparent, auditable, and deployment-ready solution for digital transformation in electric distribution systems.
Keywords:
artificial intelligence
; agentic RAG
; tabular data
; explainable AI
; power systems
; TabNet
1. Introduction
Modern Medium-Voltage (MV, 1–36 kV) distribution networks operate under heterogeneous and evolving conditions—aging assets, climate variability, and growing demand—that erode service continuity and, in turn, system-level reliability indicators [1]. Improving those indicators is a central objective for electric distribution companies seeking to elevate power supply quality [2]. In this sense, reliability is internationally assessed via the System Average Interruption Duration Index (SAIDI) and the System Average Interruption Frequency Index (SAIFI), standardized in IEEE Std 1366, which harmonizes interruption-event data collection and categorization to ensure consistency in reporting [3]. These technical frameworks are further contextualized by trend and policy analyzes that track recent performance, alongside regional studies across Latin America and the Caribbean that use SAIDI/SAIFI to evaluate regulatory impacts on service quality [4,5]. In addition, the sector’s growing emphasis on distribution-system resilience expands the remit of traditional indices by integrating preparedness, response, and recovery practices into planning and operations [6].
In Colombia, these international standards are instantiated through the regulatory framework established by the Comisión de Regulación de Energía y Gas (CREG), which in 2024 operationalized annual SAIDI/SAIFI targets for distribution system operators [7]. Oversight and enforcement fall to the Superintendencia de Servicios Públicos Domiciliarios (Superservicios), which publishes sector diagnostics. Meanwhile, XM—as the system and market operator—provides official data series that enable continuous quality monitoring [8]. This regulatory scaffolding is underpinned by a robust technical corpus: the Reglamento Técnico de Instalaciones Eléctricas (RETIE) and the Código Eléctrico Colombiano (NTC 2050) ensure traceability and regulatory compliance in asset management and operations [9,10]. At the regional level, the Central Hidroeléctrica de Caldas (CHEC-Grupo EPM) exemplifies this scheme, with public reports on targets, outcomes, and investment plans aligned to SAIDI/SAIFI improvements that provide an operational substrate to connect analytics with capital planning and decision-making [11,12].
To meet these regulatory and operational demands, utilities are advancing digital-transformation agendas whose strategic aim is to convert large, multi-source datasets—outage logs, equipment metadata, and meteorological information—into actionable, regulation-aware decisions that strengthen resilience and transparency [13]. Significant hurdles persist; however, manual analyzes and static reports are insufficient to surface complex, cross-factor patterns at scale. In contrast, whereas “black-box” analytics face adoption barriers in regulated environments that require full traceability and auditability of results [14,15,16].
On this basis, Explainable Artificial Intelligence (XAI) and Interpretable Machine Learning (IML) provide a pragmatic bridge between high predictive performance and auditable decision support systems. Recent research has systematized explainability techniques and discussed pathways for their integration and governance in the power sector [17]. Empirical evidence supports this direction, with studies demonstrating successful applications of machine-learning models to predict outage duration and restoration time—leveraging transfer learning strategies and feature sets compiled from public data that enable reproducible forecasting pipelines [18,19]. Taken together, these advances facilitate a transition from opaque analytics to transparent, auditable recommendation systems, thereby improving risk management and the prioritization of operational actions in a highly regulated service environment [20].
In this context, the challenge coalesces around two complementary fronts that hinder proactive reliability management in MV networks: First, the lack of models with predictive and explanatory capabilities—approaches must estimate SAIFI while articulating the drivers of interruptions, explicitly incorporating external variables (e.g., meteorology, construction metadata) to capture cross-circuit and cross-season variability. Namely, they should provide consistent global and local explanations and remain stable under shifts in asset configurations so that forecasts can support maintenance scheduling and capital planning [21,22,23,24]. Second, the absence of integrated, interpretable decision-support systems, in which insights from heterogeneous data are fused with domain knowledge (e.g., RETIE, NTC 2050), leads to unclear, actionable, and trustworthy recommendations with full traceability and explicit justification. Then, such systems should link analytical evidence to regulatory clauses and procedural artifacts while maintaining audit trails [25,26,27].
Existing approaches bifurcate into predictive modeling and decision-support. Linear and other classical regressors are simple but struggle with nonlinearities and exogenous drivers; ensemble methods improve accuracy yet provide limited transparency for regulated use [28]. Moreover, deep neural networks can be accurate yet opaque, while TabNet-based approaches offer a balanced alternative for tabular reliability modeling: sparse attention and sequential feature selection provide global/local attributions [29,30]. For decision-support, LLM-based QA improves access to RETIE/NTC but risks hallucinations and limited traceability [31]. Retrieval-Augmented Generation (RAG) grounds answers in retrieved evidence, though remains constrained for multi-source, tool-based reasoning [32]. Agentic and Multi-Agent RAG extend this by adding planning and tool orchestration across structured (outage logs) and unstructured (regulations, reports) sources, enabling auditable recommendations [33].
We propose CRITAIR (Criticality Analysis through Interpretable AI-based Recommendations), a hybrid, interpretable reliability framework that delivers accurate predictions, regulation-aware recommendations, and full auditability for MV operations. The core idea is to couple an interpretable TabNet pipeline with an agentic retrieval-and-reasoning layer and explicit reasoning graphs, unifying predictive attribution, verifiable evidence retrieval, and transparent decision paths. CRITAIR is implemented as an end-to-end architecture consisting of three key stages:
- –
- Predictive and Interpretable Modeling (TabNet): Train a TabNet-based pipeline employing enhanced data outage records (endogenous and exogenous variables) to estimate SAIFI while producing global and local attributions for critical factors (e.g., precipitation, wind gusts, conductor gage).
- –
- Regulation-Aware Retrieval and Reasoning (Agentic RAG): Enable multi-step retrieval over RETIE/NTC and internal documents, grounding answers and suggested actions in cited clauses and context, with planning/tool-use for multi-source evidence integration.
- –
- Interpretable Reasoning Graphs and Evidence Attribution: Transform the complete decision pathway—prioritized characteristics, extracted regulatory components, and inference processes—into auditable graphs that fulfill explainability standards in power system operations.
We evaluate CRITAIR on a real MV operational dataset from CHEC, comprising historical outage records, asset metadata, and 24-hour antecedent meteorological variables. For the predictive stage, TabNet is benchmarked against strong baselines (linear models, Random Forest, XGBoost), showing fast convergence and competitive reliability estimates while maintaining instance-level and global interpretability via sparse attention and sequential feature selection. In parallel, the agentic RAG subsystem is evaluated for querying structured outage tables, interpreting regulatory documents (e.g., RETIE, NTC 2050), and generating criticality-based recommendations; performance is measured using BERTScore across structured queries, normative interpretation, and recommendation synthesis, complemented by expert validation. Qualitative analysis—via TabNet attention masks and interpretable reasoning graphs—demonstrate clear inter-asset separability, stable feature salience across contexts, and regulation-aware semantic coherence in recommended actions, underscoring CRITAIR’s suitability for deployment in audit-constrained utility environments.
2. Related Work
Research on reliability prediction in medium-MV networks has evolved from basic statistical regressors to advanced deep learning architectures designed for tabular data. Linear models, such as ordinary least squares regression, are computationally efficient and easy to implement, making them attractive for utilities with limited analytical resources [34]. However, their inability to capture nonlinear interactions or integrate exogenous variables—such as precipitation, wind gusts, or construction metadata—limits their effectiveness in real-world settings [3].
To overcome these shortcomings, more flexible models have been introduced. Tree-based ensembles, such as Random Forests and XGBoost, have demonstrated higher predictive accuracy by handling nonlinear relationships and complex feature interactions [19]. These models are capable of estimating reliability indices, such as SAIDI and SAIFI, across heterogeneous operating conditions, but their opacity limits adoption in regulated environments where interpretability and auditability are required [20,23]. Feature importance scores alone are insufficient to satisfy domain experts and regulators seeking full traceability. The advent of deep learning models has added another layer of predictive capability. Deep neural networks (DNNs) trained on large-scale outage and meteorological datasets have achieved strong performance in predicting outage duration, restoration time, and related indices [15,16]. Still, their “black-box” nature makes them unsuitable for high-stakes decisions, especially in contexts governed by regulatory standards [30].
A more recent development is TabNet, a deep learning architecture explicitly designed for tabular data. By leveraging sparse attention and sequential feature selection, TabNet provides both global and local interpretability [29]. It integrates exogenous variables, highlights their relative contribution to outage risk, and preserves transparency in the decision process. This makes it particularly well suited for reliability studies in MV, where utilities must justify both predictive performance and regulatory compliance.
In turn, large language models (LLMs) have evolved into three principal architectural families—only-encoder, only-decoder, and encoder–decoder—each tailored to specific natural language processing (NLP) task types. Understanding their respective strengths and limitations is essential to selecting models suitable for explainable, regulation-sensitive reliability systems. Only-encoder models, such as BERT, RoBERTa, and DistilBERT, rely on bidirectional transformers that contextualize input sequences without generating text [35,36]. They excel in extractive and discriminative tasks, including text classification, entity recognition, and span-based question answering. Their deep bidirectional attention enables fine-grained contextual understanding. However, the lack of generative capability limits their use in tasks that require producing coherent explanations, summaries, or recommendations—functions central to decision-support systems.
Only-decoder models, typified by autoregressive architectures such as GPT, Gemini, LLaMA, Qwen, and DeepSeek, generate text token by token in a unidirectional manner [37,38,39]. This makes them inherently generative, excelling at tasks such as dialogue systems, reasoning, and contextual report synthesis. Their autoregressive design allows the progressive construction of fluent, semantically consistent text, making them especially suitable for explanatory and reasoning-oriented applications. Although only-decoder models lack the explicit bidirectional context of encoder–decoder architectures, their ability to handle long prompts and instruction-based conditioning compensates for this limitation in most real-world reasoning pipelines. Furthermore, through instruction tuning and reinforcement learning, these models can align text generation with domain-specific constraints—such as regulatory compliance or reliability terminology—while maintaining adaptability across diverse task types. Further, encoder–decoder models combine both paradigms, using a dedicated encoder to process the input and a decoder to generate outputs [40,41]. They are particularly effective for sequence-to-sequence tasks, such as translation or summarization, where input and output spaces differ. Despite their interpretability and structured conditioning, encoder–decoder models are typically more computationally demanding and slower during inference, which limits their applicability in interactive or multi-agent reasoning systems.
Beyond predictive modeling, another research frontier focuses on decision-support systems capable of translating analytical outputs into clear, auditable, and regulation-aware recommendations. Early approaches relied on LLM-based question answering (QA) systems, which allowed practitioners to query technical regulations such as RETIE or NTC 2050 directly [31,42]. These systems facilitated access to normative documents but suffered from hallucinations, lack of traceability, and limited contextual reasoning. To address these issues, Retrieval-Augmented Generation (RAG) architectures emerged, combining semantic retrieval with grounded text generation. RAG systems reduce hallucinations and improve factual consistency by explicitly citing retrieved passages [17,32]. However, most implementations remain constrained to single-step queries and are limited in their ability to integrate structured datasets (e.g., outage logs, asset metadata) or to reason over temporal dynamics. Recent advances have introduced Agentic RAG and Multi-Agent RAG architectures, where autonomous agents plan, decompose, and execute multi-step reasoning processes [33,43]. These agents can orchestrate multiple tools—such as SQL connectors for outage tables, vector search engines for technical manuals, and regulatory parsers for RETIE/NTC clauses—to integrate heterogeneous evidence into contextualized recommendations.
Complementary to these developments, Knowledge Graphs (KGs) play a central role in improving interpretability and reasoning. KGs represent entities, attributes, and relationships explicitly, enabling structured reasoning that complements statistical models [44,45]. In the power sector, they have been applied to fault diagnosis and asset management, encoding equipment lifecycles, causal dependencies, and environmental stressors to guide maintenance and investment strategies [46,47]. From an explainability perspective, rule-enhanced cognitive graphs have been proposed to embed logical rules into graph structures, supporting transparent causal inference in grid operations [46]. Beyond domain-specific applications, KGs also enhance NLP-driven decision support. Recent frameworks such as GraphRAG extend standard RAG by embedding KGs alongside vector indices, grounding outputs in explicit relational structures rather than isolated fragments [48]. Other approaches, such as KG-SMILE, attribute specific entities and relations as explanatory evidence for generated recommendations [49].
The main advantage of combining NLP-based retrieval, RAG architectures, and KGs lies in their ability to produce traceable, regulation-aware explanations. For instance, if precipitation and conductor gauge are identified as key variables affecting SAIDI, the KG can simultaneously retrieve relevant RETIE or NTC clauses and connect them to historical outage cases, offering an auditable reasoning chain that bridges analytics with regulations. Challenges remain, including ontology design, dynamic updates, and scalability of multi-hop reasoning, but the literature suggests that KG-enhanced reasoning is a promising pathway toward transparent, regulation-compliant decision support.
Taken together, the literature review highlights two complementary fronts in advancing reliability management for MV networks: predictive modeling with interpretability, where TabNet and related attention-based architectures combine predictive accuracy with global and local attributions [18,19,29]; and decision-support through NLP and KGs, where Agentic RAG and GraphRAG systems integrate heterogeneous evidence sources into contextualized and auditable recommendations [33,43,48]. These two fronts converge in the proposed CRITAIR methodology, which integrates interpretable predictive modeling, regulation-aware retrieval and reasoning, and explicit reasoning graphs. By unifying these advances, CRITAIR directly addresses the limitations of existing approaches and provides a hybrid, interpretable framework for reliability-oriented decision-making in MV networks under regulatory scrutiny.
3. Materials and Methods
3.1. CHEC Medium-Voltage Reliability Prediction Dataset
A comprehensive dataset was constructed for this study to support the prediction of electrical grid interruptions, utilizing statistical records from the CHEC from January 1, 2019, to June 30, 2024. The objective is to model the complex interaction between the structural characteristics of the network and dynamic environmental variables. The foundation of the dataset comprises interruption records, which document the operating protection device, the start and end times of the event, and service quality indices such as the SAIFI, formally defined as:
where is the number of customers affected by interruption i, is the duration of said interruption, k is the total number of interruptions over the analysis period, and is the total number of customers served by the system.
Each record was subsequently enriched with detailed structural information of the network assets, including poles, switches, transformers, and line sections. Following this, exogenous variables were integrated through spatiotemporal queries to contextualize each event. This enrichment process consists of three primary data blocks.
The first block comprises climatic variables, for which an extensive dataset was incorporated using the Weatherbit API (https://www.weatherbit.io). For each interruption, hourly time series were extracted for the event’s location over the 24-h period preceding the report time. An example of the time series extracted for a single event is illustrated in Figure 1.
Moreover, the variables integrated to characterize the operational environment include:
- –
- Precipitation (precip): Associated with moisture-related risks for electrical components and grounding systems.
- –
- Atmospheric Pressure (pres): Relevant at high altitudes, where it affects thermal dissipation and dielectric strength.
- –
- Relative Humidity (rh): A critical indicator for corrosion and partial discharges.
- –
- Sea Level Pressure (slp): Complements local pressure analysis and its impact on sensitive equipment.
- –
- Solar Radiation (solar_rad): Influences the degradation of materials exposed to sunlight.
- –
- Ambient Temperature (temp): Affects the thermal performance and lifespan of transformers and conductors.
- –
- UV Index (uv): A determinant for the accelerated deterioration of polymeric materials.
- –
- Visibility (vis): Relevant information for planning maintenance activities.
- –
- Wind Gust Speed (wind_gust_spd): Related to additional mechanical loads on poles and conductors.
- –
- Average Wind Speed (wind_spd): Affects the mechanical design and stability of overhead lines.
- –
- Clouds (clouds): Satellite-based cloud coverage (%).
Furthermore, lightning strike activity was quantified by associating each event with discharges occurring within a 500 m radius during the preceding 24 hours. From this data, descriptive statistics for the current and altitude of the discharges were computed. Vegetation presence was determined by performing a spatial query within 30 m of each network section. This spatial enrichment process, depicted in Figure 2, culminates in the creation of the first primary structural database, where each event record is augmented with its immediate environmental context.
To address the complexity of fault diagnostics, the dataset is constructed through the horizontal integration of multiple data sources, linked by operational keys (e.g., event ID, operating device, feeder). The structure of these data blocks and their preprocessing is summarized in Table 1.
It is important to note that the total number of climatic features (242, corresponding to columns 51-293) is less than the theoretical maximum of 264 (11 variables over 24 hours). This difference arises from occasional unavailability during the data acquisition process. Also, a central difficulty in fault diagnostics is that the device that operates during an interruption is not necessarily the site of fault initiation. To address this, we implemented a downstream network-tracing algorithm that enumerates all assets electrically connected beyond the operated device. The event-level dataset was restructured into a component-level table tailored for root-cause analysis: each record corresponds to a candidate failing asset rather than an aggregated outage record. The associated metadata and climatic covariates were replicated across downstream assets for the relevant incident, whereas structural, lightning, and vegetation descriptors were assigned at the asset level. This representation enables the model to estimate, for each recorded event, the failure probability of every candidate asset independently.
Afterward, we assembled a regulation-focused corpus comprising RETIE, NTC, and CHEC technical standards. This corpus is augmented with a set of structured, asset-specific documents that map structural and exogenous variables to specific sections of each non-structural source. The resulting resource serves as input to an Interpretable Reasoning Graphs and Evidence Attribution module, which transforms the full decision pathway—prioritized characteristics, extracted regulatory clauses, and inference steps—into auditable graphs that satisfy explainability requirements for power-system operations.
3.2. Classical Regression Models
As a baseline for regression, Ordinary Least Squares (OLS) assumes a linear relationship between the input matrix (with N samples and P features) and the continuous target vector . The model coefficients define this mapping as , estimated via the Moore–Penrose pseudoinverse:
A regularized form is obtained by solving:
where . When and , the formulation yields LASSO regression [50]; when both and , it becomes Elastic Net regression [51]. A key advantage of linear models is the direct interpretability of the coefficients . A schematic pipeline is shown in Figure 3.
Transcending linear constraints, Random Forests (RF) provide a powerful non-linear modeling approach by aggregating predictions from an ensemble of decision trees [52]. Operating on the same input data and target , a non-linear prediction is formed by averaging the outputs from individual trees, where each tree function maps the input data to a vector of predictions [53]:
Each tree t is trained on a bootstrap sample of indices and, at each split, considers a random subset of feature indices . Formally, let tree t have leaves. The structure of the tree is captured by an indicator matrix that routes each of the N observations to one of the leaves. The prediction values for these leaves are stored in a vector . The per-tree output is then:
The set of split parameters for tree t, (comprising a feature index from and a threshold in for each internal node), is chosen greedily via recursive partitioning on the bootstrap sample , maximizing the reduction of node impurity [54]. Unlike single-tree CART pruning, RF typically grows unpruned trees (equivalently in the cost–complexity term):
where denotes the number of leaves and is the cost–complexity coefficient. Out-of-bag (OOB) samples provide an internal, nearly unbiased generalization estimate (see Figure 4).
Building on the ensembling concept, XGBoost constructs an additive model in a stage-wise fashion. Key hyperparameters include the learning rate (shrinkage) and the number of boosting rounds [55]. The prediction evolves as:
At iteration t, the learner is found by minimizing a second-order approximation of the regularized objective :
Here, for each sample n, the scalars are the first and second-order derivatives of the loss with respect to the previous prediction . For a tree with leaves, the regularization is controlled by the L2 coefficient on leaf scores and the complexity penalty . The split selection criterion (Gain) is derived as [56]:
where and represent the sum of gradients over samples in the left/right child nodes. The primary hyperparameters to be optimized are thus , , , and . A general schematic of the stage-wise procedure is shown in Figure 5.
In terms of interpretability, the mechanisms sketched above translate into well-defined global importance scores. In RF, global importance of a feature j is obtained by summing, across all trees t, the reduction in squared error produced at every split within the partition parameters that utilizes feature j. This process is directly tied to the training objective of minimizing . In XGBoost, the analogous global importance for feature j is computed by accumulating the regularized split Gain dictated by the stage-wise objective . This gain depends on the first- and second-order gradients, and , as well as the regularization parameters and ; consequently, features repeatedly selected with high Gain receive larger global importance scores.
3.3. Deep Learning-based Tabular Data Regression with Localized Relevance Analysis
We now transition from classical estimators to deep learning models. Accordingly, let denote the input, the output, and the prediction induced by the parametric mapping:
with , denoting the s-th feature extractor, and the set of trainable parameters. This generic representation extends naturally to tabular data; in particular, TabNet realizes f as a composition that couples predictive performance with built-in explainability [29]. Its core mechanism is a sequence of S decision steps, as in Equation 10, that employs attention to select a sparse subset of features. At each step s, an attention mask performs soft feature selection:
This computation involves several components: is a prior-scale matrix that tracks feature usage; is the processed feature representation from the previous step, with as the attention embedding dimension; and denotes a trainable mapping (e.g., a neural network). The sparsemax activation is used to produce a sparse probability distribution, forcing the model to concentrate its attention on a limited subset of features [57]. The prior scale is updated recursively:
where the scalar hyperparameter controls feature reuse. The masked features, , are computed via an element-wise product, , and are then processed by a feature transformer . This component employs Gated Linear Units (GLUs) as building blocks [58]:
For an input vector , are weight matrices, are bias vectors, and is the element-wise sigmoid activation function. Residual connections are normalized by a factor of to stabilize training. The transformer takes the filtered features and produces two outputs: an embedding for the final decision and a representation for the next step’s attention , where is the decision embedding dimension.
For large-batch training, TabNet applies ghost batch normalization, splitting the batch into virtual mini-batches of size for normalization [59]:
where the vectors denote the mean and variance computed over each virtual mini-batch, and is a small scalar for numerical stability. The overall decision embedding is aggregated from all steps and mapped to the final prediction via a linear layer :
The model is trained by minimizing a total loss , defined as , with the scalar acting as the regularization coefficient. The task-specific loss for regression is typically the Mean Squared Error (MSE):
while the sparsity regularization term encourages the model to focus on fewer features:
In summary, the full TabNet processing pipeline is illustrated in Figure 6.
Next, building on the stepwise masks from the TabNet model, we obtain a unified feature relevance map through convex aggregation:
The resulting matrix, , contains the aggregated relevance scores for each feature and reduces to a uniform average when . These scores are then mapped directly to a probability distribution over the features for each sample using a temperature-controlled softmax [60]:
Let be the matrix of localized relevance scores. To derive a feature importance ranking for any subset of data, we define an aggregation function . Given a set of sample indices of interest, , this function is defined as:
The resulting vector, , represents the final feature importance profile for the specified data subset. This unified formulation provides importance rankings at any desired scale. For a local analysis of a single sample n, we set , yielding the original localized profile. For a global analysis, we set , yielding the dataset-level feature ranking. Furthermore, the sharpness of the underlying individual explanations can be quantified via the Shannon entropy of each relevance vector , given by:
where low entropy indicates a sharp and highly focused attribution of importance.
3.4. Fundamentals of Retrieval-Augmented Generation and Agentic Systems
Large Language Models (LLMs) exhibit two core limitations: their knowledge is static, fixed at the time of their last training, and they are prone to generating incorrect information, or “hallucinations,” when operating outside their knowledge domain [61]. To mitigate these challenges and engineer more reliable, evidence-based systems, architectures have been developed to integrate external knowledge in real-time [62]. The foundational approach is Retrieval-Augmented Generation (RAG), which operates in two primary stages (Figure 7) [63]. First, during the retrieval phase, the system queries an external knowledge base to locate relevant information fragments pertinent to the query [64]. Subsequently, in the generation phase, these fragments are supplied to the LLM as context alongside the original question, thereby grounding the response in verifiable evidence and reducing hallucinations [65].
Classical RAG operates in a linear, single-step fashion. While this framework is suitable for direct questions, its utility is limited when the task demands multi-step reasoning or the integration of heterogeneous sources [66]. To address these scenarios, the Agentic RAG paradigm has been proposed (see Figure 8) [67]. This approach redefines the LLM’s role: it transitions from a context-conditioned generator to an agent capable of reasoning, planning, and acting [68]. Instead of adhering to a fixed workflow, an agentic system dynamically determines which actions to execute in order to holistically resolve complex tasks.
The transition to an agentic system is predicated on reassigning the LLM’s role from a response generator to a reasoning engine [69]. The agent functions as a cognitive core, designed to decompose complex tasks into logical, executable steps [70]. When presented with a problem, it formulates a dynamic plan that determines what information is required, from which sources it should be obtained, and in what sequence it must be processed to construct a well-founded solution.
To execute this plan, the agent is equipped with tools that enable it to interact with its environment and overcome the limitations of its pretrained knowledge. Beyond the textual search characteristic of classical RAG, the agent can invoke specialized functions: database connectors for SQL queries on structured data, code interpreters for quantitative analysis, or APIs for integration with external software systems. This allows it to orchestrate the retrieval and processing of heterogeneous information—both qualitative and quantitative—in a coordinated manner [71]. Lastly, the value of the agentic approach lies in its iterative operation—the reason-act-observe loop. Unlike a linear workflow, the agent executes an action, observes the outcome, and uses that evidence to inform its next step, adjusting its strategy as necessary [72]. This process is repeated to explore alternatives, corroborate findings, and accumulate evidence until sufficient inputs are gathered to synthesize a coherent final response. Then, the method generates an auditable trail of reasoning, reflected in the sequence of actions that led to the conclusion [70].
3.5. Criticality Analysis through Interpretable AI using Agentic RAG and LLM’s
To leverage the comprehensive dataset, we developed an integrated diagnostic framework grounded in the Model–View–Controller (MVC) architectural pattern [73]. The system transitions from event selection to predictive analysis, culminating in an explainable, regulation-grounded recommendation for fault diagnosis. The framework comprises two main stages: an interactive analysis interface and a predictive recommendation engine.
The view and controller components provide a user-centric interface for spatiotemporal analysis, as illustrated in Figure 9. The workflow begins when the user specifies a geographic area of interest (department and municipality) and a time window (year and month) via interactive filters. In response, the system renders the corresponding MV-L2 network and lists all recorded interruption events within the selected period. The user then selects an event for detailed analysis. Upon selection, the controller invokes a downstream-tracing algorithm to identify all network assets—including poles, transformers, switches (sectionalizers), and line segments—that are electrically connected beyond the operated protective device. This initial stage delineates a focused set of candidate components pertinent to the fault, which proceeds directly to predictive analysis.
From this focused set, the information is structured according to the granular root-cause database schema and ingested into a TabNet-based predictive model. This model has two simultaneous objectives: (i) to estimate a quality index associated with each asset, thereby quantifying their expected contribution to service degradation—after which the three assets with the largest contributions are selected as the most likely candidates responsible for the interruption; and (ii) to derive post hoc feature relevance from TabNet’s masks without introducing an auxiliary interpretability loss to compute aggregate relevancies. For each selected asset, an importance ranking is obtained, and the five most influential structural and exogenous variables are retained. This refined information becomes the primary input to an LLM-based recommendation agent.
The agent initiates an Agentic RAG process. Leveraging a specialized document corpus, it autonomously formulates queries over the embedded knowledge base comprising RETIE, NTC, and CHEC’s internal specifications. This corpus is augmented with a set of asset-specific, structured transition documents that map structural and exogenous variables to specific sections of each unstructured source. This mapping layer enables precise retrieval and anchoring of normative evidence conditioned on the prioritized assets and variables. The workflow issues targeted queries, filters by clause and numeral identifiers, expands terminology when gaps are detected (synonyms and cross-references), and promotes only evidence corroborated across independent sources with consistent wording and scope, anchoring each conclusion to explicit citations. This ensures that the analysis is not solely driven by predictive signals but is firmly contextualized within established regulatory and engineering standards. The agent imposes scope limits by restricting conclusions to the retrieved standards and activates an insufficient-evidence mode when corroboration thresholds are not met. The output is a set of technical conclusions explicitly supported by cited clauses and the specific technical context corresponding to the high-likelihood assets and their influential variables.
To ensure full transparency and auditability, the entire decision path is synthesized into a structured and interpretable reasoning graph. This graph serves as a formal record of the diagnostic process, mapping the initial predictive outputs from the TabNet model, the retrieved regulatory evidence, and the intermediate inferential steps taken by the LLM agent. Each node represents a unit of information—such as a prioritized asset, an influential variable, or a specific regulatory clause—while edges encode the logical relations among them. Each node and edge stores the source identifier, document version, and section anchor, providing end-to-end evidence attribution. As a final output, the system issues a coherent and traceable natural-language recommendation, accompanied by the reasoning graph and the corresponding regulatory citations.
The integrated process—combining the user interface, predictive modeling, and regulation-based reasoning—is summarized in Figure 10.
4. Experimental Setup
4.1. Assessment and Method Comparison
The evaluation of our dual-component framework is systematically structured into two distinct parts, addressing the predictive accuracy of the failure indicator estimation and the qualitative performance of the generative recommendation system, respectively.
Assessment of failure indicator prediction to assess the efficacy of our TabNet-based prediction model and its supervised relevance analysis, its outcomes are benchmarked against a suite of well-established techniques:
- –
- Linear Machine Learning: ElasticNet, which utilizes a combination of L1 and L2 regularization to improve generalization and facilitate variable selection in high-dimensional contexts [74].
- –
- Nonlinear Machine Learning: RF and XGBoost are included as benchmarks. RF is known for its ability to capture intricate interactions and nonlinearities through ensemble learning, while XGBoost is regarded for its state-of-the-art performance on structured tabular data via an optimized gradient boosting framework [75,76].
The performance of these supervised models is evaluated using standard regression metrics, contrasting the reference values with the predictions . Let denote the mean reference vector, where and is the all-ones vector in . These metrics are defined as follows:
For the second stage of our framework, this study evaluates a range of only–decoder LLMs on a specialized question–answering task designed to support CHEC’s operational and normative queries [77]. The selection includes both proprietary, API-based models and open-source, locally deployable models to provide a comparison between cloud and on-premise inference capabilities [78]. The evaluated set was deliberately constructed to span diverse computational scales—ranging from lightweight models with one billion parameters to large-scale systems with tens of billions of parameters —enabling the analysis of trade-offs between inference efficiency, reasoning depth, and domain adaptation [79]. Given the computational capacity available for local deployment, the configuration emphasizes models that balance representational complexity with efficient quantized implementations, thereby enabling meaningful contrasts between more compact on-premise systems and high-capacity cloud counterparts [80]. In selecting the models, we included prominent transformers from a variety of leading developers to capture a representative snapshot of the current landscape. Table 2 summarizes the configuration of all evaluated LLMs.
To benchmark the selected models, we constructed an expert-curated Q&A corpus comprising 53 challenges that reflect operational information-retrieval and decision-support needs in MV-L2 distribution. Tasks are organized into three groups: (i) 19 structured queries over tabular assets and event logs; (ii) 19 unstructured normative queries requiring comprehension and grounding in technical standards and internal specifications; and (iii) a recommendation task instantiated on three real-world assets, each parameterized by five critical variables, yielding 15 recommendation outputs. This taxonomy separates modality (structured vs. unstructured) and decision focus, enabling consistent comparison across models. Table 3 illustrates the taxonomy with one representative example from each group and states the expected outputs.
To quantify the performance of the generative models, two metrics were employed. Primarily, BERTScore was utilized to assess semantic quality by computing the similarity between contextual embeddings of the generated and reference responses. To ensure linguistic consistency with the bilingual domain of the CHEC dataset, the multilingual case-sensitive BERT model was adopted [91]. Let the reference response be denoted by the token sequence and the candidate response by , where represents the aligned length of both sequences. Furthermore, let be the WordPiece subword vocabulary of the tokenizer; consequently, for all , it holds that . A contextual embedding mapping is defined as . Assuming the embeddings are pre-normalized to a unit norm, the cosine similarity is equivalent to their dot product. It is from this property that BERTScore is decomposed into three components-precision, recall, and -which are calculated from the cosine similarities between the vector representations of both sequences,as:
Complementing the assessment of semantic quality, the second metric, inference time, was used to measure computational efficiency. This is defined as the average time required to generate a complete answer and was evaluated exclusively on locally deployed models to ensure a fair comparison of computational overhead, independent of network latency.
4.2. Training and Implementation Details
The analysis was conducted on a comprehensive dataset of electrical-grid interruptions. As a preliminary quality-control step, records with durations exceeding 100 hours were discarded to reduce the influence of extreme outliers during model fitting. From an initial set of 314 candidate columns, we excluded the continuity index SAIFI from the predictor space, yielding a modeling matrix with 312 predictors (). For concrete testing, we considered SAIFI as output. Missing numerical entries were imputed using a distribution-aware sentinel defined as , which preserves scale while making imputed values explicitly distinguishable during learning. Categorical variables were label-encoded using scikit-learn v1.6.1. The targets were normalized to a fixed range with a MinMaxScaler to standardize the optimization objective across models. To ensure robust estimation and evaluation, we adopted a two-stage split: first, an 80/20 train–test partition; second, an 80/20 split of the training fold to obtain a validation subset. Both partitions used stratified sampling over target quartiles to preserve outcome distributions across folds.
All predictive models were tuned via Bayesian optimization with a Gaussian-process surrogate using Optuna v3.5.0, minimizing to align the search with maximization of . Each study executed 20 trials per model. The search spaces were specified as follows:
- –
- ElasticNet: The maximum number of iterations was set as an integer value within the range , while the -ratio was defined as a continuous value over . The regularization coefficient and the stopping criterion tolerance were drawn from a log-uniform distribution over the ranges and , respectively.
- –
- Random Forest: The following hyperparameters were configured with integer values: the number of estimators in , the maximum tree depth in , the minimum samples per leaf in , and the minimum samples required for a split in . Additionally, the fraction of features considered at each split was set as a continuous value over the interval .
- –
- XGBoost: The maximum depth and the number of boosting rounds were set as integer values within the ranges and , respectively. The subsample ratio and the per-tree column subsampling ratio were defined as continuous values within and . Finally, the learning rate , the penalty, and the penalty were drawn from a log-uniform distribution over , , and , respectively.
- –
- TabNet: Architectural hyperparameters for feature dimensionality (), attention output dimensionality (), and the number of steps were set as integer values within the ranges , , and , respectively. Regularization parameters (the coefficient and the sparsity coefficient ) and optimizer settings (learning rate and weight decay) were drawn from log-uniform distributions over the ranges , , , and , respectively. Categorical hyperparameters were selected from fixed sets: the masking function from ; batch size from ; virtual batch size from ; and the optimizer from . To enforce non-negativity on the SAIDI/SAIFI predictions, a ReLU activation function was applied to the final output layer. During the TabNet search, each configuration was trained for up to 40 epochs with an early-stopping patience of 40. Following model selection, the best-performing configuration was retrained on the pooled training and validation data; specifically for TabNet, this final training phase ran for 200 epochs with a patience of 70. The test performance for all models was subsequently evaluated on the hold-out set.
For the RAG-based generative agent, the evaluation methodology was specifically designed to ensure reproducibility and consistent behavior across all tested systems. To this end, a deterministic output is enforced by setting the temperature parameter to 0, while other generative hyperparameters, such as top_p, top_k, and any repetition penalties, remain at their default values as specified by their respective APIs.
Furthermore, a standardized zero-shot prompt template is employed for all queries. Context is injected using the stuff chain type, which concatenates the five most relevant document chunks retrieved from the vector database and inserts them directly into the prompt. The retrieval process is underpinned by vector embeddings generated using OpenAI’s text-embedding-ada-002 model, with all vectors stored and queried from a persistent Chroma vector database [92].
The agent’s operational workflow unfolds in a structured sequence. Upon receiving a user query, a primary dispatching agent, powered by gpt-3.5-turbo, first analyzes the input and selects the most appropriate tool from a predefined set based on its semantic description. Upon invocation, the selected tool executes the RAG pipeline: it queries its dedicated, domain-specific vector store to retrieve the five most relevant document chunks. These chunks are subsequently compiled into a context that is passed to the designated generative model under evaluation, which then synthesizes the final textual response. This entire sequence is performed for each question in the evaluation corpus to generate the final results.
Experiments were executed in two complementary environments. The predictive pipeline ran on Google Colab with an NVIDIA (Santa Clara, CA, USA) A100 (40.0GB VRAM) and 83.5GB RAM. The generative evaluation was conducted on a local workstation running Ubuntu22.04, equipped with an Intel Core i9-11900 CPU, 64GB of RAM, and an NVIDIA (Santa Clara, CA, USA) RTX 3070 Ti GPU (8GB VRAM). All experiments used Python 3.12 with a global random seed of 42, NumPy v2.0.2, and PyTorch v2.8.0. For deterministic reproducibility, we enabled cuDNN v91002 deterministic kernels where applicable and disabled non-deterministic algorithms in PyTorch. Core libraries for the predictive pipeline included cuML v25.06.00, cuPy v13.3.0, XGBoost v3.1.1, and pytorch-tabnet v4.1.0. The generative stack was orchestrated using the LangChain v0.3.3 framework and its associated libraries, including langchain-openai v0.2.2, langchain-google-genai v2.0.0, and chromadb v0.5.12. Open-source models locally executed via the Ollama v0.5.3 runtime. Source code and datasets are available at https://github.com/UN-GCPDS/CRITAIR (accessed on October 30, 2025).
5. Results and Discussion
5.1. Predictive Performance for Reliability Indicator Estimation
The predictive capabilities of the proposed framework were benchmarked at three distinct granularities—global, municipal, and feeder-level—to ascertain both aggregate accuracy and model stability within operational contexts pertinent to network management.
At the global scale, the metrics derived from the complete test set (see Table 4) underscore the efficacy of TabNet, which yields the highest coefficient of determination () and the lowest prediction errors (MSE = , MAE = ). Its performance surpasses that of XGBoost () and accentuates the constraints of linear models like ElasticNet () in capturing the nonlinear dynamics of the SAIFI. This advantage is qualitatively depicted in Figure 11, where TabNet’s forecasts more closely track observed values, particularly during abrupt fluctuations corresponding to periods of heightened network stress.
This aggregate performance is corroborated at finer resolutions. When disaggregated to the five municipalities with the highest SAIFI contribution (see Table 5), TabNet consistently outperforms or matches the benchmarks. For instance, in "La Dorada" and "Manizales," it secures superior values and minimal errors, underscoring that its high accuracy is not merely an artifact of aggregation but is sustained in high-priority operational zones. This robustness extends to the most granular scale—the distribution feeder level (Table 6), where the model accounts for nearly all the variance in critical circuits such as "ROS23L15" (). This level of precision validates its use for prioritizing maintenance and planning localized capital investments.
The stability of the models was further confirmed through Bayesian hyperparameter optimization. The optimization landscapes in Figure 12 reveal that the selected configurations (marked with ’X’) occupy broad, high-performance regions. This suggests that the reported performance is robust and not contingent on hypersensitive parameter tuning.
5.2. Global and Instance-Level Feature Attribution Analysis
Beyond predictive accuracy, a central aim of CRITAIR is to elucidate the factors contributing to network interruptions. This inquiry is structured at two scales: global, to identify systemic trends, and local, to diagnose specific events.
The global feature-importance analysis (Figure 13) reveals a consensus among the evaluated models. They converge in identifying load density (CNT_TRAFOS_AFEC) and various meteorological conditions (e.g., h7-pres, h1-slp) as determinant factors. Although informative, this high-level perspective inherently obscures the unique characteristics of individual interruption events.
To transcend this limitation, CRITAIR leverages TabNet’s architecture, whose sequential attention mechanism assigns distinct feature importance values for each prediction. Figure 14 depicts these instance-wise attributions across the test set, where each row corresponds to an event and color intensity denotes the contribution of each feature. This granular perspective facilitates a transition from aggregate analysis to specific diagnostics.
The utility of this capability is exemplified in Figure 15, which contrasts the most influential variables in two high-impact scenarios. For the municipality with the highest SAIFI contribution (left panel), the prevailing contributors are meteorological, implying that interruptions are largely driven by environmental conditions affecting a high-density network. Conversely, for the highest-impact feeder (right panel), structural attributes such as circuit length (LENGTH) and conductor gauge (CALIBRECONDUCTOR) assume primary importance. This differentiation enables CRITAIR to formulate specific operational hypotheses: while mitigation strategies in the first case might focus on climate resilience, in the second, they can be directed toward infrastructure upgrades on specific line segments.
5.3. Performance of the Regulation-Aware Agentic RAG System
The framework’s final component is a reasoning engine that translates predictive outputs into actionable recommendations grounded in technical regulations. The selection of a Large Language Model (LLM) for this engine must present an optimal balance between semantic quality and computational efficiency to be viable in an operational support environment. The comparative assessment (Figure 16) reveals that local models like Llama 3.2:1B and Qwen 2.5:1.5B achieve this balance. Although API-based models attain slightly higher semantic quality, their increased latency renders them less practical for direct integration into operational workflows, thereby validating the selection of lightweight models for local deployment.
The end-to-end workflow is demonstrated in a practical use case (Figure 17). Upon selecting an interruption event via the user interface, the TabNet model assesses the involved assets and visually highlights those with the highest estimated SAIFI contribution. This data-driven prioritization then informs the Agentic RAG system, which generates a specific diagnostic recommendation.
A representative recommendation exemplifies how the system bridges predictive insights with regulatory standards. For instance, an ambient temperature of 14.1°C associated with sectionalizer N43189 is contextualized against operational ranges defined in RETIE and IEC 62271-1. Analogously, recorded precipitation prompts a recommendation for a specific IP protection rating, citing IEC 60529. This process yields a concrete, verifiable directive that links a field condition to a technical requirement.
The system’s integrity and auditability are anchored by an interpretable reasoning graph (Figure 18). This graph acts as a transparent, auditable trail documenting each diagnostic step: from the prioritized asset and its critical variables to the retrieved regulatory clauses and the final recommendation. Each node and link are verifiable, facilitating subsequent regulatory audits or technical reviews. In this manner, CRITAIR completes the diagnostic cycle: commencing with quantitative risk estimation, advancing to the elucidation of probable causes, and culminating in an operational recommendation that is both auditable and compliant with governing regulations.
5.4. Limitations
Although the CRITAIR framework represents a significant advancement in integrating predictive analytics and regulatory reasoning, several inherent limitations must be acknowledged, which in turn open future research avenues.
First, the performance of both the predictive model (TabNet) and the reasoning system (Agentic RAG) is fundamentally contingent upon the quality and completeness of the input data [93]. Despite comprehensive data enrichment, the absence or imprecision of asset records, unrecorded climatic events, or missing construction metadata can introduce biases, thereby affecting both the precision of SAIDI/SAIFI predictions and the relevance of the normative recommendations.
Second, the failure and severity prediction model — based on TabNet — was trained under a single, shared hyperparameter configuration across all evaluated settings [94]. This design choice promotes reproducibility and facilitates direct comparison against classical linear and nonlinear regressors (ElasticNet, Random Forest, XGBoost), but it restricts domain-specific optimization at the level of circuit topology, climatic region, or operational period. An adaptive hyperparameter search tailored to each zone or temporal window could in principle improve SAIDI/SAIFI estimation and increase the stability of the attention masks. However, such specialization would come at the cost of higher computational complexity and an increased risk of localized overfitting.
Finally, the system’s evaluation was conducted on the operational environment and data from a single distribution network. While this ensures contextual relevance, the framework’s generalizability to networks with different topologies, voltage levels, asset densities, and climatic profiles has not been tested [95]. Transferring the model to new operational contexts would likely necessitate significant hyperparameter retuning for the predictive model and adaptation of the agent’s document corpus, posing a challenge for its immediate deployment in operational contexts beyond the one evaluated.
6. Conclusions
This paper has introduced CRITAIR, a hybrid and interpretable framework designed to support decision-making in the reliability management of medium-voltage (MV-L2) distribution networks by aligning predictive analytics with regulatory governance requirements. CRITAIR integrates three key components: a TabNet-based predictive module for SAIDI/SAIFI estimation, an Agentic Retrieval-Augmented Generation (RAG) layer for normative grounding, and interpretable reasoning graphs to ensure end-to-end auditability.
The predictive module has demonstrated competitive performance against robust baselines such as Random Forest and XGBoost, achieving high accuracy in estimating reliability indicators. Crucially, through its sequential and sparse attention mechanism, it provides both global and local feature attributions, enabling the identification of the structural and meteorological factors that contribute most to interruptions without sacrificing transparency.
Concurrently, the Agentic RAG reasoning module has proven its capacity to effectively connect predictive insights with regulatory evidence extracted from technical documents like RETIE and NTC 2050. The generated recommendations are not only coherent and verifiable, as evidenced by high semantic alignment scores (BERTScore), but also interpretable by domain experts. The final transformation of the decision pathway into an explicit reasoning graph ensures complete traceability, an indispensable requirement in highly regulated environments.
Collectively, CRITAIR bridges the existing gap between predictive analytics, which often operate as “black boxes,” and the imperative for transparent and auditable governance in the power sector. By offering an integrated solution that is predictively accurate, explainable-by-design, and regulation-aware, this framework represents a valuable tool for the digital transformation of electric distribution utilities.
Future work will focus on expanding the framework to include resilience analysis by incorporating variables related to high-impact and low-probability events [96]. Furthermore, we plan to enrich the analytical framework by integrating economic variables, such as operational (OPEX) and capital (CAPEX) expenditures [97]. This extension would enable CRITAIR not only to diagnose faults and recommend technical actions but also to assess their economic viability and prioritize interventions based on their impact on budgets and long-term asset management planning. Additionally, the integration of more advanced multi-agent architectures will be explored to collaboratively resolve more complex queries [98]. Finally, the implementation of continuous learning mechanisms will be investigated to allow the system to dynamically adapt to network changes and regulatory updates [99].
Author Contributions
Conceptualization, D.A.P.-R.,S.P.-Q., J.C.Á.-B.,A.M.Á.-M., and G.C.-D.; data curation, J.C.Á.-B., D.A.P.-R.; methodology, D.A.P.-R.,S.P.-Q., A.M.Á.-M.,J.C.Á.-B., and G.C.-D.; project administration, A.M.Á.-M.; supervision, A.M.Á.-M. and G.C.-D.; resources, D.A.P.-R.,S.P.-Q. and A.M.Á.-M. All authors have read and agreed to the published version of this manuscript.
Funding
This study was funded under grants provided for the research project `Sistema de visión artificial para el monitoreo y seguimiento de efectos analgésicos y anestésicos administrados vía neuroaxial epidural en población obstétrica durante labores de parto para el fortalecimiento de servicios de salud materna del Hospital Universitario de Caldas—SES HUC’, Hermes 57661, funded by Universidad Nacional de Colombia.
Data Availability Statement
Data available upon reasonable request via email.
Conflicts of Interest
The authors declare no conflicts of interest.
References
- Krstivojević, J.; Stojković Terzić, J. Enhancing Reliability Performance in Distribution Networks Using Monte Carlo Simulation for Optimal Investment Option Selection. Applied Sciences 2025, 15. [Google Scholar] [CrossRef]
- Seppälä, J.; Järventausta, P. Analyzing Supply Reliability Incentive in Pricing Regulation of Electricity Distribution Operators. Energies 2024, 17. [Google Scholar] [CrossRef]
- Han, D.; Cho, I. Interactive visualization for smart power grid efficiency and outage exploration. In Proceedings of the 2023 IEEE International Conference on Big Data (BigData). IEEE; 2023; pp. 656–661. [Google Scholar]
- U.S. Energy Information Administration. U.S. electricity customers averaged five and one-half hours of power interruptions in 2022, 2024. Explains use of SAIDI/SAIFI and Major Event Days in U.S. reporting.
- Weiss, M.; et al. Impact of Regulation on the Quality of Electric Power Distribution Services in Latin America and the Caribbean. Technical report, Inter-American Development Bank, 2021.
- North American Electric Reliability Corporation. 2024 State of Reliability Overview. Technical report, 2024. Includes resilience framing for extreme events.
- Comisión de Regulación de Energía y Gas, CREG. Circular CREG 053 de 2024: Metas de calidad media (SAIDI/SAIFI) para Operadores de Red, 2024.
- XM Compañía de Expertos en Mercados. Publicación de indicadores de calidad (Resolución CREG 015 de 2018), 2025.
- Ministerio de Minas y Energía de Colombia. Resolución 40117 de 2024: Modificación del Reglamento Técnico de Instalaciones Eléctricas (RETIE), 2024.
- ICONTEC. Código Eléctrico Colombiano – NTC 2050 (versión vigente 2024), 2024. Referencia informativa; verificar edición oficial de ICONTEC.
- Central Hidroeléctrica de Caldas S.A., E.S.P. (CHEC). Informe de ejecución 2024 — Plan de Inversión CHEC 2023–2027 (Actividad Distribución). Technical report, 2024.
- Central Hidroeléctrica de Caldas S.A., E.S.P. (CHEC). Informe de ejecución del Plan de Inversiones 2023 — Distribución. Technical report, 2024.
- Troncia, M.; Ruggeri, S.; Soma, G.G.; Pilo, F.; Ávila, J.P.C.; Muntoni, D.; Gianinoni, I.M. Strategic decision-making support for distribution system planning with flexibility alternatives. Sustainable Energy, Grids and Networks 2023, 35, 101138. [Google Scholar] [CrossRef]
- Ghasemkhani, B.; Kut, R.A.; Yilmaz, R.; Birant, D.; Arıkök, Y.A.; Güzelyol, T.E.; Kut, T. Machine Learning Model Development to Predict Power Outage Duration (POD): A Case Study for Electric Utilities. Sensors 2024, 24. [Google Scholar] [CrossRef]
- Saeed, W.; Omlin, C. Explainable AI (XAI): A systematic meta-survey of current challenges and future opportunities. Knowledge-Based Systems 2023, 263, 110273. [Google Scholar] [CrossRef]
- Zhan, J.; Wu, C.; Yang, C.; Miao, Q.; Ma, X. HFN: Heterogeneous feature network for multivariate time series anomaly detection. Information Sciences 2024, 670, 120626. [Google Scholar] [CrossRef]
- Shadi, M.R.; Mirshekali, H.; Shaker, H.R. Explainable artificial intelligence for energy systems maintenance: A review on concepts, current techniques, challenges, and prospects. Renewable and Sustainable Energy Reviews 2025, 216, 115668. [Google Scholar] [CrossRef]
- Ghasemkhani, B.; Kut, R.A.; Yilmaz, R.; Birant, D.; Arıkök, Y.A.; Güzelyol, T.E.; Kut, T. Machine Learning Model Development to Predict Power Outage Duration (POD): A Case Study for Electric Utilities. Sensors (Basel, Switzerland) 2024, 24, 4313. [Google Scholar] [CrossRef]
- Willems, N.; Kar, B.; Levinson, S.; Turner, B.; Brewer, J.; Prica, M. Probabilistic Restoration Modeling of Wide-Area Power Outage. IEEE Access 2024. [Google Scholar] [CrossRef]
- Alsaigh, R.; Mehmood, R.; Katib, I. AI explainability and governance in smart energy systems: a review. Frontiers in Energy Research 2023, 11, 1071291. [Google Scholar] [CrossRef]
- Wang, D.; Maharjan, S.; Zheng, J.; Liu, L.; Wang, Z. Data-driven quantification and visualization of resilience metrics of power distribution system. arXiv preprint arXiv:2508.12408, arXiv:2508.12408 2025.
- Lin, J.; Xie, R.; Lin, H.; Guo, X.; Mao, Y.; Fang, Z. A Study on the Key Factors Influencing Power Grid Outage Restoration Times: A Case Study of the Jiexi Area. Processes 2025, 13. [Google Scholar] [CrossRef]
- Aldhubaib, H.A.; Hassan Ahmed, M.; Salama, M.M. A weather-based power distribution system reliability assessment. Alexandria Engineering Journal 2023, 78, 256–264. [Google Scholar] [CrossRef]
- Zhou, Z.; Li, Y.; Guo, Z.; Yan, Z.; Chow, M.Y. A White-Box Deep-Learning Method for Electrical Energy System Modeling Based on Kolmogorov-Arnold Network. arXiv preprint arXiv:2409.08044, arXiv:2409.08044 2024.
- Kostopoulos, G.; Davrazos, G.; Kotsiantis, S. Explainable Artificial Intelligence-Based Decision Support Systems: A Recent Review. Electronics 2024, 13. [Google Scholar] [CrossRef]
- Shadi, M.R.; Mirshekali, H.; Shaker, H.R. Explainable artificial intelligence for energy systems maintenance: A review on concepts, current techniques, challenges, and prospects. Renewable and Sustainable Energy Reviews 2025, 216, 115668. [Google Scholar] [CrossRef]
- Chatterjee, J.; Dethlefs, N. XAI4Wind: A multimodal knowledge graph database for explainable decision support in operations & maintenance of wind turbines. arXiv preprint arXiv:2012.10489, arXiv:2012.10489 2020.
- Shalev-Shwartz, S.; Ben-David, S. Understanding Machine Learning: From Theory to Algorithms; Cambridge University Press, 2014.
- Arik, S.Ö.; Pfister, T. Tabnet: Attentive interpretable tabular learning. In Proceedings of the Proceedings of the AAAI conference on artificial intelligence, 2021, Vol. 35, pp. 6679–6687.
- Rudin, C. Stop explaining black box machine learning models for high stakes decisions and use interpretable models instead. Nature machine intelligence 2019, 1, 206–215. [Google Scholar] [CrossRef]
- Karpukhin, V.; Oguz, B.; Min, S.; Lewis, P.S.; Wu, L.; Edunov, S.; Chen, D.; Yih, W.t. Dense Passage Retrieval for Open-Domain Question Answering. In Proceedings of the EMNLP (1); 2020; pp. 6769–6781. [Google Scholar]
- Trangcasanchai, S. Improving Question Answering Systems with Retrieval Augmented Generation. PhD thesis, University of Helsinki, 2024.
- Bockling, S.; et al. Walk the chain: Multi-agent reasoning for retrieval-augmented generation. In Proceedings of the ICLR; 2025. [Google Scholar]
- Alotaibi, I.; Abido, M.A.; Khalid, M.; Savkin, A.V. A comprehensive review of recent advances in smart grids: A sustainable future with renewable energy resources. Energies 2020, 13, 6269. [Google Scholar] [CrossRef]
- Devlin, J.; Chang, M.W.; Lee, K.; Toutanova, K. BERT: Pre-training of Deep Bidirectional Transformers for Language Understanding. arXiv preprint arXiv:1810.04805, arXiv:1810.04805 2018.
- Liu, Y.; Ott, M.; Goyal, N.; Du, J.; Joshi, M.; Chen, D.; Levy, O.; Lewis, M.; Zettlemoyer, L.; Stoyanov, V. RoBERTa: A Robustly Optimized BERT Pretraining Approach. arXiv preprint arXiv:1907.11692, arXiv:1907.11692 2019.
- Brown, T.B.; Mann, B.; Ryder, N.; Subbiah, M.; Kaplan, J.D.; Dhariwal, P.; Neelakantan, A.; Shyam, P.; Sastry, G.; Askell, A.; et al. Language Models are Few-Shot Learners. In Proceedings of the Advances in Neural Information Processing Systems (NeurIPS); 2020. [Google Scholar]
- Touvron, H.; Lavril, T.; Izacard, G.; Martinet, X.; Lachaux, M.A.; Lacroix, T.; Rozière, B.; Goyal, N.; Hambro, E.; Azhar, F.; et al. LLaMA: Open and Efficient Foundation Language Models. arXiv preprint arXiv:2302.13971, arXiv:2302.13971 2023.
- Bai, Y.; Zhao, Y.; Wu, H.; Lin, Z.; Sun, C.; Li, Y.; Xu, H.; Duan, N.; Zhou, M.; et al. DeepSeek-R1: Incentivizing Reasoning Capability in LLMs via Reinforcement Learning. arXiv preprint arXiv:2501.05675, arXiv:2501.05675 2025.
- Raffel, C.; Shazeer, N.; Roberts, A.; Lee, K.; Narang, S.; Matena, M.; Zhou, Y.; Li, W.; Liu, P.J. Exploring the Limits of Transfer Learning with a Unified Text-to-Text Transformer. Journal of Machine Learning Research 2020, 21, 1–67. [Google Scholar]
- Lewis, M.; Liu, Y.; Goyal, N.; Ghazvininejad, M.; Mohamed, A.; Levy, O.; Stoyanov, V.; Zettlemoyer, L. Comprehension. In Proceedings of the Proceedings of the 58th Annual Meeting of the Association for Computational Linguistics (ACL), 2020, pp.
- Lowenmark, P.; et al. Agent-based QA for technical documents in energy systems. AI for Energy 2025. [Google Scholar]
- Chen, Y.; et al. Multi-agent orchestration in RAG systems: A survey. ACM Computing Surveys 2025. [Google Scholar]
- Chen, X.; Wang, Y.; Liu, H. Application of Knowledge Graph Technology in Fault Diagnosis of Power Systems. Frontiers in Energy Research 2022, 10, 988280. [Google Scholar] [CrossRef]
- Li, J.; Zhang, L.; Zhou, P. Knowledge Graph Construction for Fault Diagnosis in Power Systems. Electronics 2023, 12, 4808. [Google Scholar] [CrossRef]
- Zhang, K.; et al. Rule-enhanced cognitive graphs for explainable reasoning in power grids. Knowledge-Based Systems 2023, 275, 110925. [Google Scholar]
- Tang, J.; et al. Knowledge graph-based approaches for asset management in smart grids. Renewable and Sustainable Energy Reviews 2019, 107, 573–586. [Google Scholar]
- Team, N.R. GraphRAG: Enhancing Retrieval-Augmented Generation with Knowledge Graphs. https://neo4j.com/blog/developer/graphrag-and-agentic-architecture-with-neoconverse/, 2024.
- Liu, C.; et al. KG-SMILE: Knowledge graph-supported interpretable recommendations. Expert Systems with Applications 2025, 240, 122556. [Google Scholar]
- Ranstam, J.; Cook, J.A. LASSO regression. Journal of British Surgery 2018, 105, 1348–1348. [Google Scholar] [CrossRef]
- Murphy, K.P. Probabilistic machine learning: an introduction; MIT press, 2022.
- Nachouki, M.; Mohamed, E.A.; Mehdi, R.; Abou Naaj, M. Student course grade prediction using the random forest algorithm: Analysis of predictors’ importance. Trends in Neuroscience and Education 2023, 33, 100214. [Google Scholar] [CrossRef]
- Du, K.L.; Zhang, R.; Jiang, B.; Zeng, J.; Lu, J. Foundations and innovations in data fusion and ensemble learning for effective consensus. Mathematics 2025, 13, 587. [Google Scholar] [CrossRef]
- Kumar, A.; Sinha, S.; Saurav, S. Random forest, CART, and MLR-based predictive model for unconfined compressive strength of cement reinforced clayey soil: A comparative analysis. Asian Journal of Civil Engineering 2024, 25, 2307–2323. [Google Scholar] [CrossRef]
- Uyar, S.G.K.; Ozbay, B.K.; Dal, B. Interpretable building energy performance prediction using XGBoost Quantile Regression. Energy and Buildings 2025, 340, 115815. [Google Scholar] [CrossRef]
- Wiens, M.; Verone-Boyle, A.; Henscheid, N.; Podichetty, J.T.; Burton, J. A tutorial and use case example of the eXtreme gradient boosting (XGBoost) artificial intelligence algorithm for drug development applications. Clinical and Translational Science 2025, 18, e70172. [Google Scholar] [CrossRef]
- Martins, A.; Astudillo, R. From softmax to sparsemax: A sparse model of attention and multi-label classification. In Proceedings of the International conference on machine learning. PMLR; 2016; pp. 1614–1623. [Google Scholar]
- Dauphin, Y.N.; Fan, A.; Auli, M.; Grangier, D. Language modeling with gated convolutional networks. In Proceedings of the International conference on machine learning. PMLR; 2017; pp. 933–941. [Google Scholar]
- Dimitriou, N.; Arandjelovic, O. A new look at ghost normalization. arXiv preprint arXiv:2007.08554, 2020; arXiv:2007.08554 2020. [Google Scholar]
- Xuan, H.; Yang, B.; Li, X. Exploring the impact of temperature scaling in softmax for classification and adversarial robustness. arXiv preprint arXiv:2502.20604, arXiv:2502.20604 2025.
- Khanda, R. Agentic ai-driven technical troubleshooting for enterprise systems: A novel weighted retrieval-augmented generation paradigm. arXiv preprint arXiv:2412.12006, arXiv:2412.12006 2024.
- Low, Y.S.; Jackson, M.L.; Hyde, R.J.; Brown, R.E.; Sanghavi, N.M.; Baldwin, J.D.; Pike, C.W.; Muralidharan, J.; Hui, G.; Alexander, N.; et al. Answering real-world clinical questions using large language model, retrieval-augmented generation, and agentic systems. Digital Health 2025, 11, 20552076251348850. [Google Scholar] [CrossRef]
- Zhao, P.; Zhang, H.; Yu, Q.; Wang, Z.; Geng, Y.; Fu, F.; Yang, L.; Zhang, W.; Jiang, J.; Cui, B. Retrieval-augmented generation for ai-generated content: A survey. arXiv preprint arXiv:2402.19473, 2024; arXiv:2402.19473 2024. [Google Scholar]
- Singh, A.; Ehtesham, A.; Kumar, S.; Khoei, T.T. Agentic retrieval-augmented generation: A survey on agentic rag. arXiv preprint arXiv:2501.09136, 2025; arXiv:2501.09136 2025. [Google Scholar]
- Pandey, V. Agentic AI with retrieval-augmented generation for automated compliance assistance in finance. International Journal of Science and Research Archive 2025, 15, 1620–1631. [Google Scholar] [CrossRef]
- Liang, J.; Su, G.; Lin, H.; Wu, Y.; Zhao, R.; Li, Z. Reasoning RAG via System 1 or System 2: A Survey on Reasoning Agentic Retrieval-Augmented Generation for Industry Challenges. arXiv preprint arXiv:2506.10408, 2025; arXiv:2506.10408 2025. [Google Scholar]
- Kukreja, S.; Kumar, T.; Bharate, V.; Gadwe, S.; Dasgupta, A.; Guha, D. Performance Enhancement of Agentic Retrieval Augmented Generation Using Relevance Generative Answering. In Proceedings of the 2025 5th International Conference on Artificial Intelligence and Education (ICAIE). IEEE; 2025; pp. 465–469. [Google Scholar]
- Maragheh, R.Y.; Vadla, P.; Gupta, P.; Zhao, K.; Inan, A.; Yao, K.; Xu, J.; Kanumala, P.; Cho, J.; Kumar, S. ARAG: Agentic Retrieval Augmented Generation for Personalized Recommendation. arXiv preprint arXiv:2506.21931, 2025; arXiv:2506.21931 2025. [Google Scholar]
- Wei, J.; Wang, X.; Schuurmans, D.; Bosma, M.; Xia, F.; Chi, E.; Le, Q.V.; Zhou, D.; et al. Chain-of-thought prompting elicits reasoning in large language models. Advances in neural information processing systems 2022, 35, 24824–24837. [Google Scholar]
- Yao, S.; Zhao, J.; Yu, D.; Du, N.; Shafran, I.; Narasimhan, K.; Cao, Y. React: Synergizing reasoning and acting in language models. In Proceedings of the International Conference on Learning Representations (ICLR); 2023. [Google Scholar]
- Guo, T.; Chen, X.; Wang, Y.; Chang, R.; Pei, S.; Chawla, N.V.; Wiest, O.; Zhang, X. Large language model based multi-agents: A survey of progress and challenges. arXiv preprint arXiv:2402.01680, 2024; arXiv:2402.01680 2024. [Google Scholar]
- Lee, M.C.; Zhu, Q.; Mavromatis, C.; Han, Z.; Adeshina, S.; Ioannidis, V.N.; Rangwala, H.; Faloutsos, C. HybGrag: Hybrid retrieval-augmented generation on textual and relational knowledge bases. arXiv preprint arXiv:2412.16311, 2024; arXiv:2412.16311 2024. [Google Scholar]
- Necula, S. Exploring the model-view-controller (mvc) architecture: A broad analysis of market and technological applications 2024.
- Elkhidir, E.; Patel, T.; Rotimi, J.O.B. Predictive modelling for residential construction demands using ElasticNet Regression. Buildings 2025, 15, 1649. [Google Scholar] [CrossRef]
- Wekalao, J.; Njoroge, S.M.; Elamri, O. Enhanced malaria detection using a hybrid borophene-based terahertz biosensor with random forest regression analysis. Brazilian Journal of Physics 2025, 55, 1–18. [Google Scholar] [CrossRef]
- Qi, Z.; Feng, Y.; Wang, S.; Li, C. Enhancing hydropower generation Predictions: A comprehensive study of XGBoost and Support Vector Regression models with advanced optimization techniques. Ain Shams Engineering Journal 2025, 16, 103206. [Google Scholar] [CrossRef]
- Roberts, J. How powerful are decoder-only transformer neural models? In Proceedings of the 2024 International Joint Conference on Neural Networks (IJCNN). IEEE; 2024; pp. 1–8. [Google Scholar]
- Machado, J. Toward a Public and Secure Generative AI: A Comparative Analysis of Open and Closed LLMs. arXiv preprint arXiv:2505.10603, arXiv:2505.10603 2025.
- Kaplan, J.; McCandlish, S.; Henighan, T.; Brown, T.B.; Chess, B.; Child, R.; Gray, S.; Radford, A.; Wu, J.; Amodei, D. Scaling laws for neural language models. arXiv preprint arXiv:2001.08361, arXiv:2001.08361 2020.
- Dettmers, T.; Pagnoni, A.; Holtzman, A.; Zettlemoyer, L. Qlora: Efficient finetuning of quantized llms. Advances in neural information processing systems 2023, 36, 10088–10115. [Google Scholar]
- Zhao, Z.R.; Chou, P.C.; Mir, T.H. A Comparative Study of GPT3. 5 Fine Tuning and Rule-Based Approaches. In Proceedings of the Large Language Models for Automatic Deidentification of Electronic Health Record Notes: International Workshop, IW-DMRN 2024, Kaohsiung, Taiwan, January 15, 2024, Revised Selected Papers. Springer Nature, 2025, Vol. 2148, p. 30.
- Aryal, S.; Agyemang-Prempeh, J. Howard university-ai4pc at semeval-2025 task 2: Improving machine translation with context-aware entity-only pre-translations with gpt4o. In Proceedings of the Proceedings of the 19th International Workshop on Semantic Evaluation (SemEval-2025), 2025, pp.; 4p.
- Balestri, R. Gender and content bias in Large Language Models: a case study on Google Gemini 2.0 Flash Experimental. Frontiers in Artificial Intelligence 2025, 8, 1558696. [Google Scholar] [CrossRef]
- Comanici, G.; Bieber, E.; Schaekermann, M.; Pasupat, I.; Sachdeva, N.; Dhillon, I.; Blistein, M.; Ram, O.; Zhang, D.; Rosen, E.; et al. Gemini 2.5: Pushing the frontier with advanced reasoning, multimodality, long context, and next generation agentic capabilities. arXiv preprint arXiv:2507.06261, 2025; arXiv:2507.06261 2025. [Google Scholar]
- Kassianik, P.; Saglam, B.; Chen, A.; Nelson, B.; Vellore, A.; Aufiero, M.; Burch, F.; Kedia, D.; Zohary, A.; Weerawardhena, S.; et al. Llama-3.1-foundationai-securityllm-base-8b technical report. arXiv preprint arXiv:2504.21039, 2025; arXiv:2504.21039 2025. [Google Scholar]
- Azaiz, I.; Kiesler, N.; Strickroth, S.; Zhang, A. Open, Small, Rigmarole–Evaluating Llama 3.2 3B’s Feedback for Programming Exercises. arXiv preprint arXiv:2504.01054, 2025; arXiv:2504.01054 2025. [Google Scholar]
- Yang, W.; Yue, X.; Chaudhary, V.; Han, X. Speculative thinking: Enhancing small-model reasoning with large model guidance at inference time. arXiv preprint arXiv:2504.12329, 2025; arXiv:2504.12329 2025. [Google Scholar]
- Wu, Y.; Mei, J.; Yan, M.; Li, C.; Lai, S.; Ren, Y.; Wang, Z.; Zhang, J.; Wu, M.; Jin, Q.; et al. Writingbench: A comprehensive benchmark for generative writing. arXiv preprint arXiv:2503.05244, arXiv:2503.05244 2025.
- Aksyonov, K.A.; Sun, L.; Kalinin, I.A.; Aksyonova, O.P.; Aksyonova, E.K. Deploying a Local Language Learning Assistant Using a Small Large Language Model. In Proceedings of the 2025 IEEE Ural-Siberian Conference on Biomedical Engineering, Radioelectronics and Information Technology (USBEREIT). IEEE; 2025; pp. 372–375. [Google Scholar]
- Sonawane, V.; Sambare, G.B.; Ambala, S.; Kadam, G. Implementation of an Interactive Query System Using Nomic Text Embed, DeepSeek R1 1.5 B, and Cosine Similarity rankers. In Proceedings of the 2025 International Conference on Computing Technologies (ICOCT). IEEE, 2025, pp. 1–6.
- Zhang, T.; Kishore, V.; Wu, F.; Weinberger, K.Q.; Artzi, Y. BERTScore: Evaluating Text Generation with BERT. In Proceedings of the International Conference on Learning Representations (ICLR), 2020.
- Goel, R. Using text embedding models as text classifiers with medical data. arXiv preprint arXiv:2402.16886, 2024; arXiv:2402.16886 2024. [Google Scholar]
- Hector, I.; Panjanathan, R. Predictive maintenance in Industry 4.0: a survey of planning models and machine learning techniques. PeerJ Computer Science 2024, 10, e2016. [Google Scholar] [CrossRef]
- Baratchi, M.; Wang, C.; Limmer, S.; Van Rijn, J.N.; Hoos, H.; Bäck, T.; Olhofer, M. Automated machine learning: past, present and future. Artificial intelligence review 2024, 57, 122. [Google Scholar] [CrossRef]
- Wang, Y.; Zhao, H.; Lin, H.; Xu, E.; He, L.; Shao, H. A Generalizable Physics-Enhanced State Space Model for Long-Term Dynamics Forecasting in Complex Environments. arXiv preprint arXiv:2507.10792, 2025; arXiv:2507.10792 2025. [Google Scholar]
- Shen, J.; Bao, X.; Chen, X.; Wu, X.; Qiu, T.; Cui, H. Seismic resilience assessment method for tunnels based on cloud model considering multiple damage evaluation indices. Tunnelling and Underground Space Technology 2025, 157, 106360. [Google Scholar] [CrossRef]
- Bovera, F.; Schiavo, L.L.; Vailati, R. Combining Forward-Looking Expenditure Targets and Fixed OPEX-CAPEX Shares for a Future-Proof Infrastructure Regulation: the ROSS Approach in Italy. Current Sustainable/Renewable Energy Reports 2024, 11, 105–115. [Google Scholar] [CrossRef]
- Icarte-Ahumada, G.; He, Z.; Godoy, V.; García, F.; Oyarzún, M. A Multi-Agent System for Parking Allocation: An Approach to Allocate Parking Spaces. Electronics 2025, 14, 840. [Google Scholar] [CrossRef]
- Findik, Y.; Hasenfus, H.; Azadeh, R. Collaborative Adaptation for Recovery from Unforeseen Malfunctions in Discrete and Continuous MARL Domains. In Proceedings of the 2024 IEEE 63rd Conference on Decision and Control (CDC). IEEE; 2024; pp. 394–400. [Google Scholar]
Figure 1.
An example of a climatic variable time series extracted during the 24 hours preceding a reported event.
Figure 1.
An example of a climatic variable time series extracted during the 24 hours preceding a reported event.
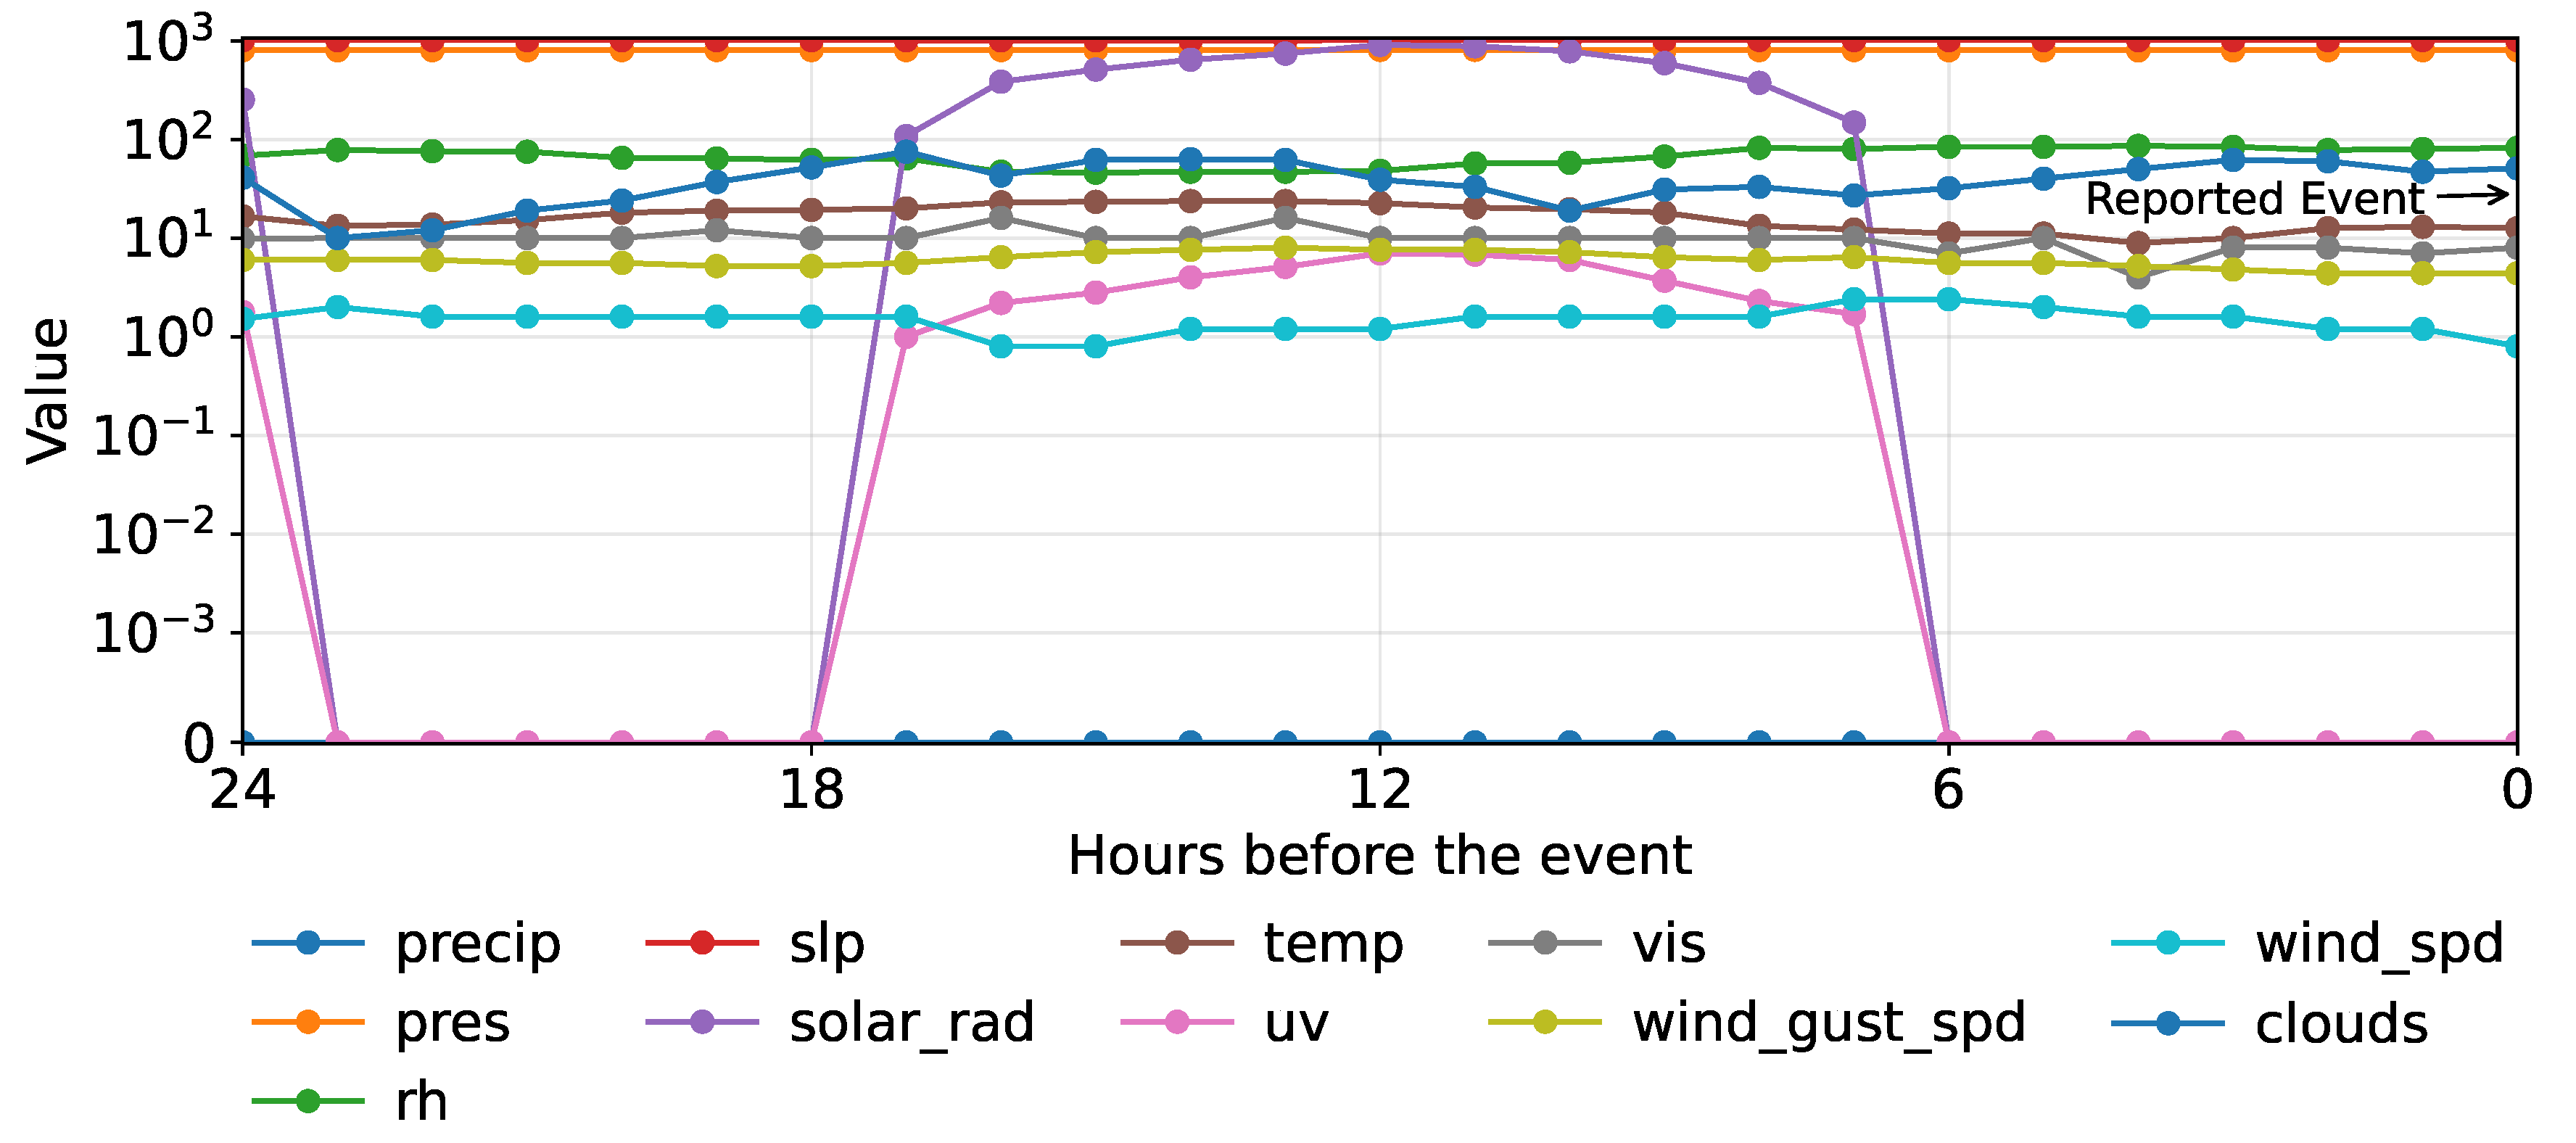
Figure 2.
A visualization of the spatial data enrichment process. The figure displays network assets along with the query radii for lightning strikes and vegetation surrounding the network components.
Figure 2.
A visualization of the spatial data enrichment process. The figure displays network assets along with the query radii for lightning strikes and vegetation surrounding the network components.
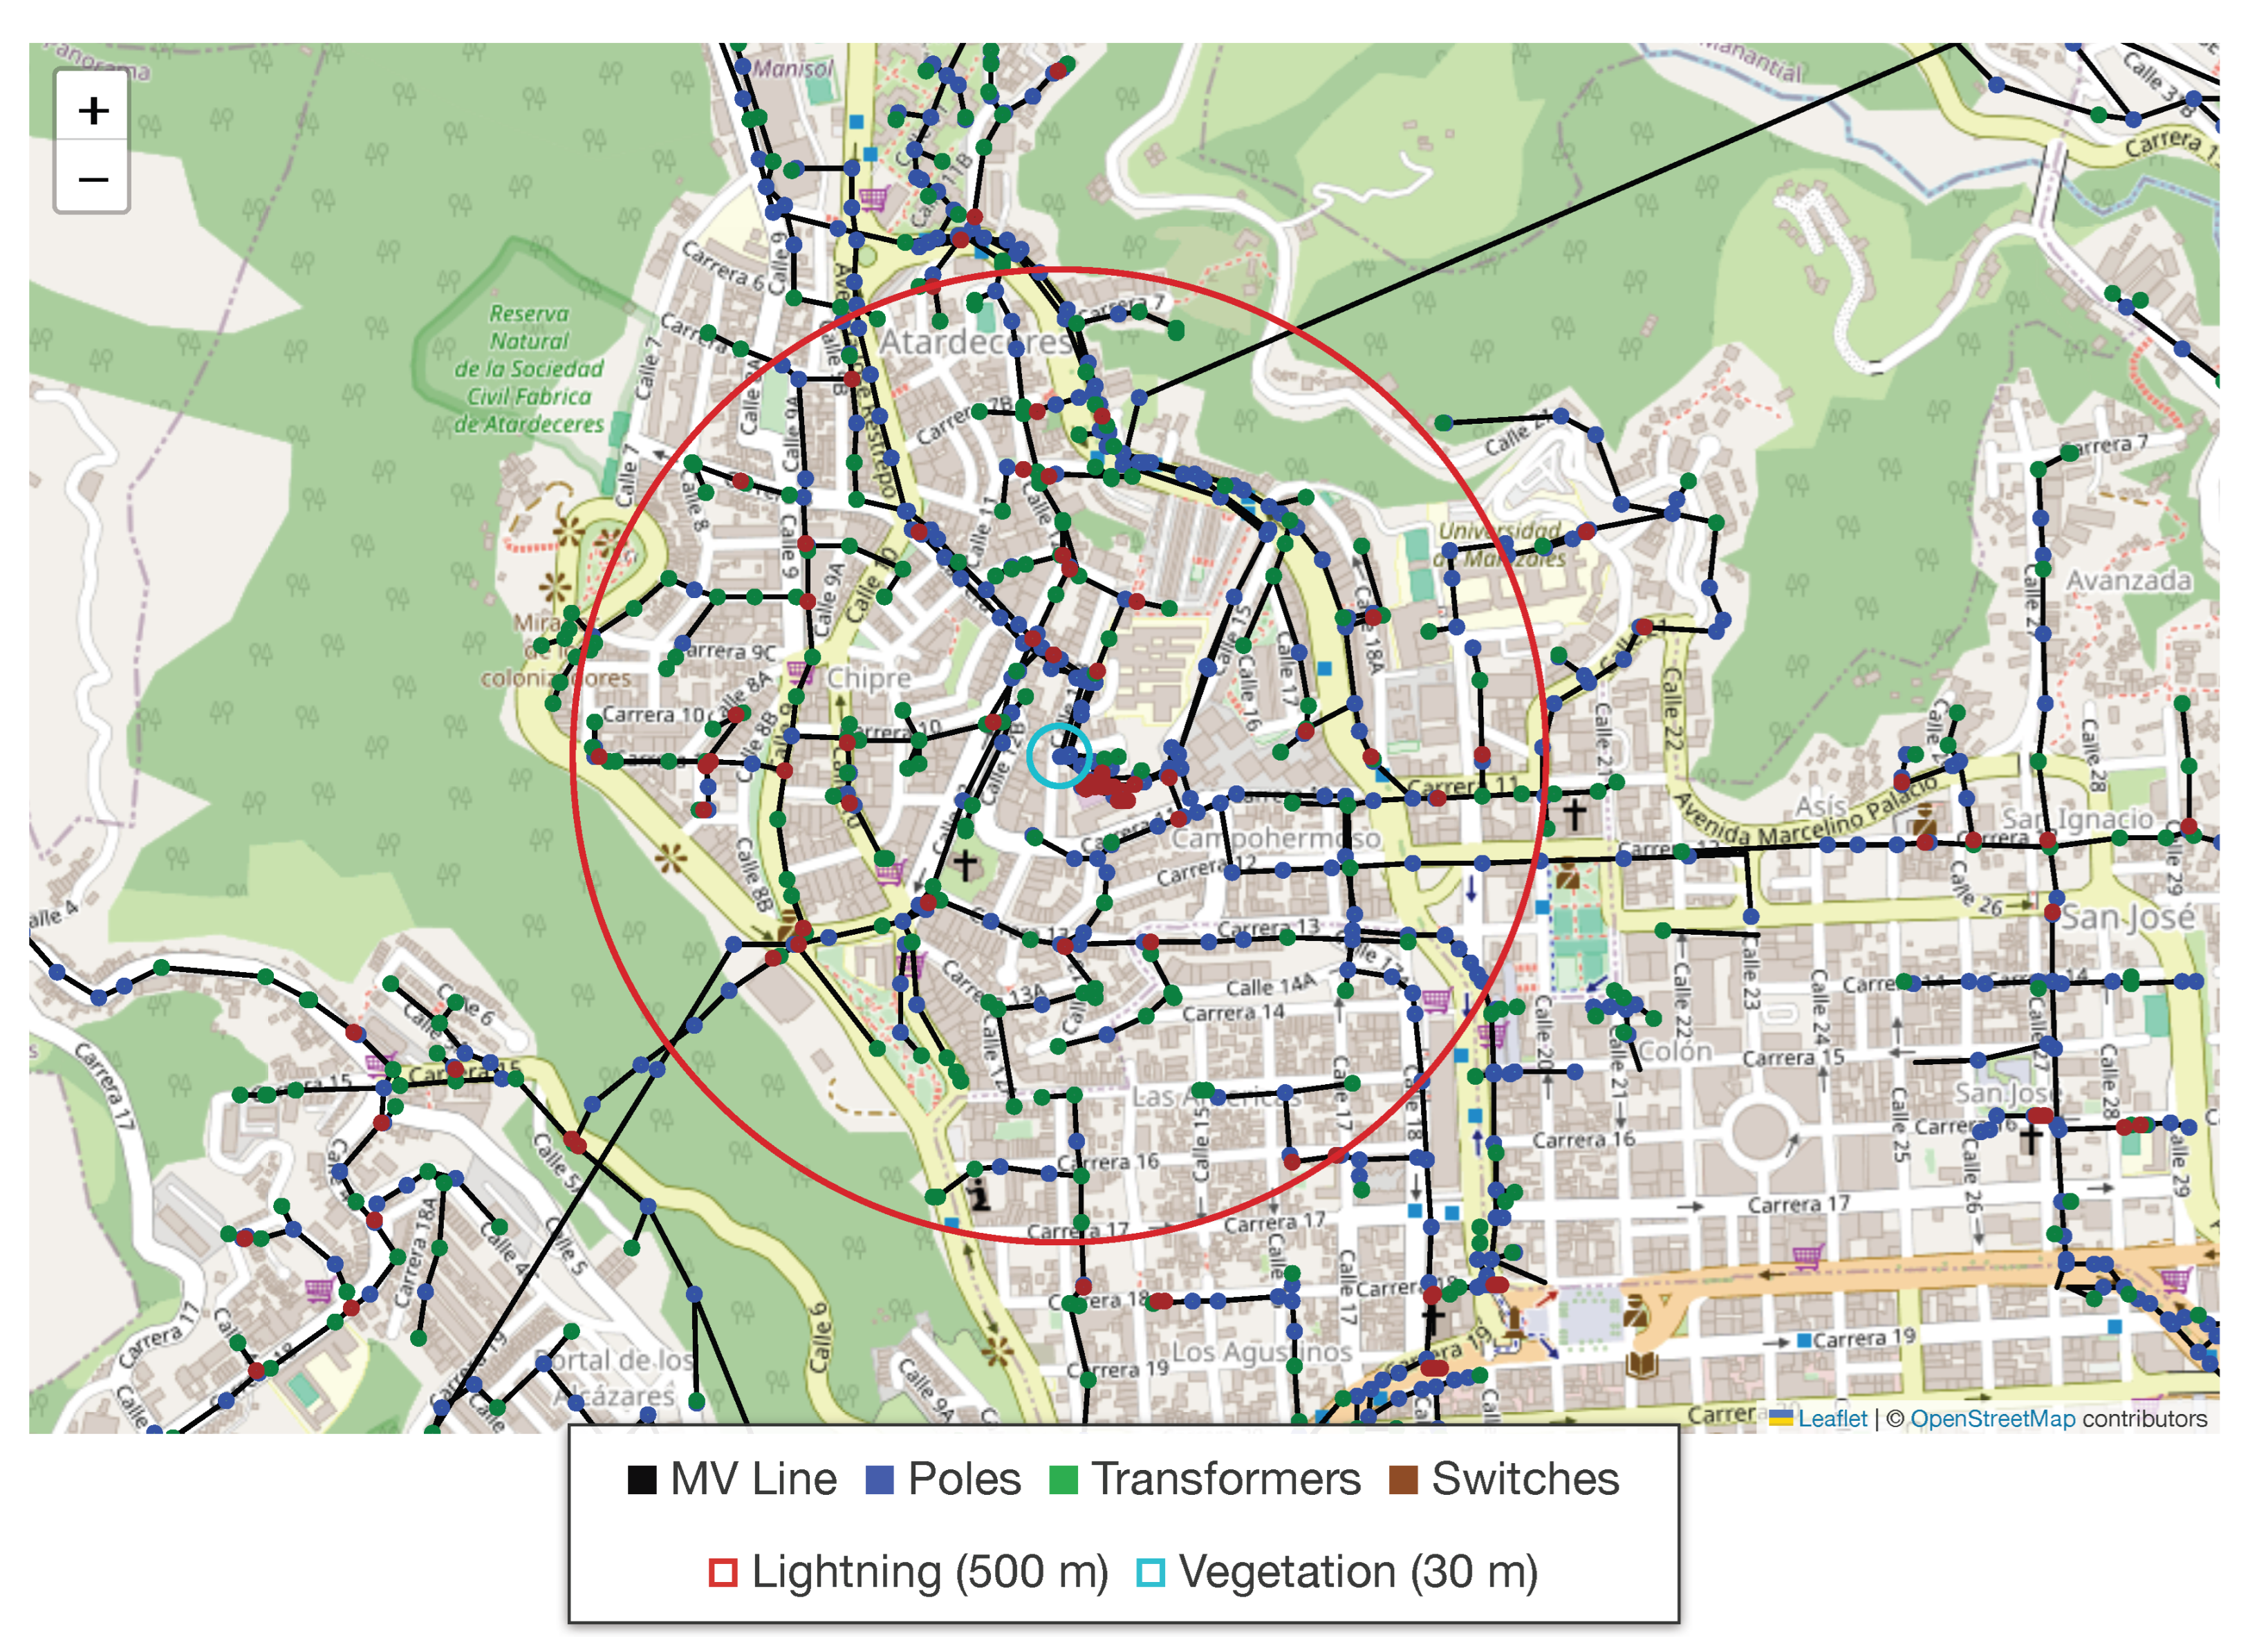
Figure 3.
Schematic representation of a linear modeling workflow, summarizing inputs, parameter estimation, predictions, and global feature relevance.
Figure 3.
Schematic representation of a linear modeling workflow, summarizing inputs, parameter estimation, predictions, and global feature relevance.
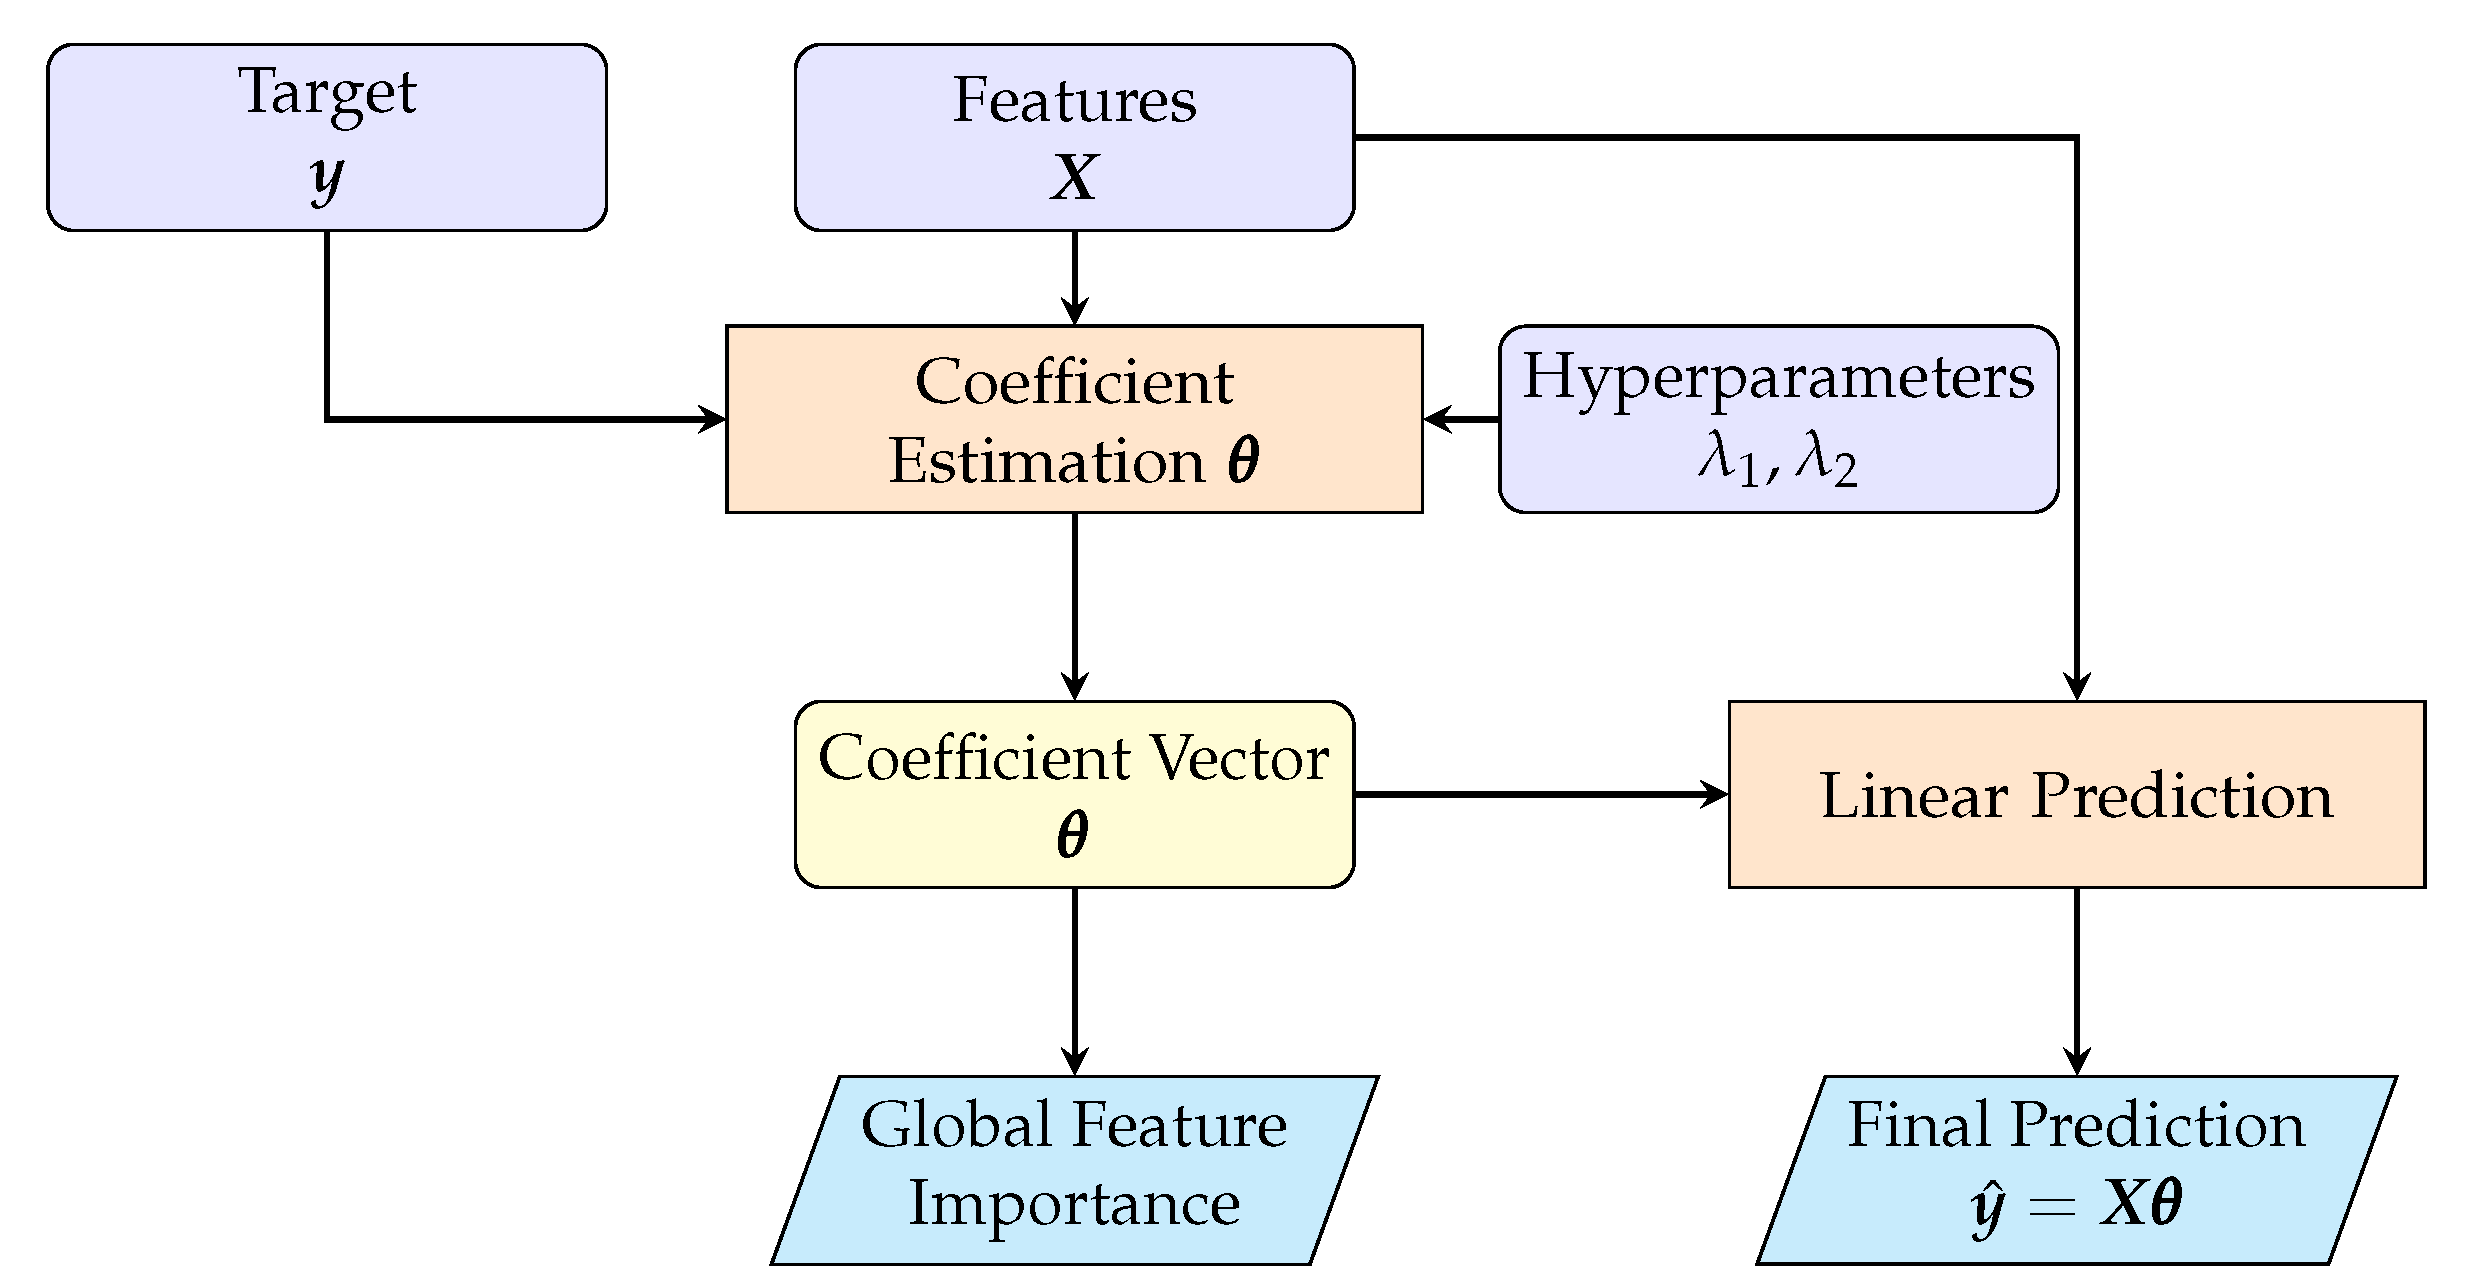
Figure 4.
Conceptual pipeline for Random Forest regression: input data, bagging-based tree training, ensemble averaging for predictions, and derivation of global feature relevance
Figure 4.
Conceptual pipeline for Random Forest regression: input data, bagging-based tree training, ensemble averaging for predictions, and derivation of global feature relevance
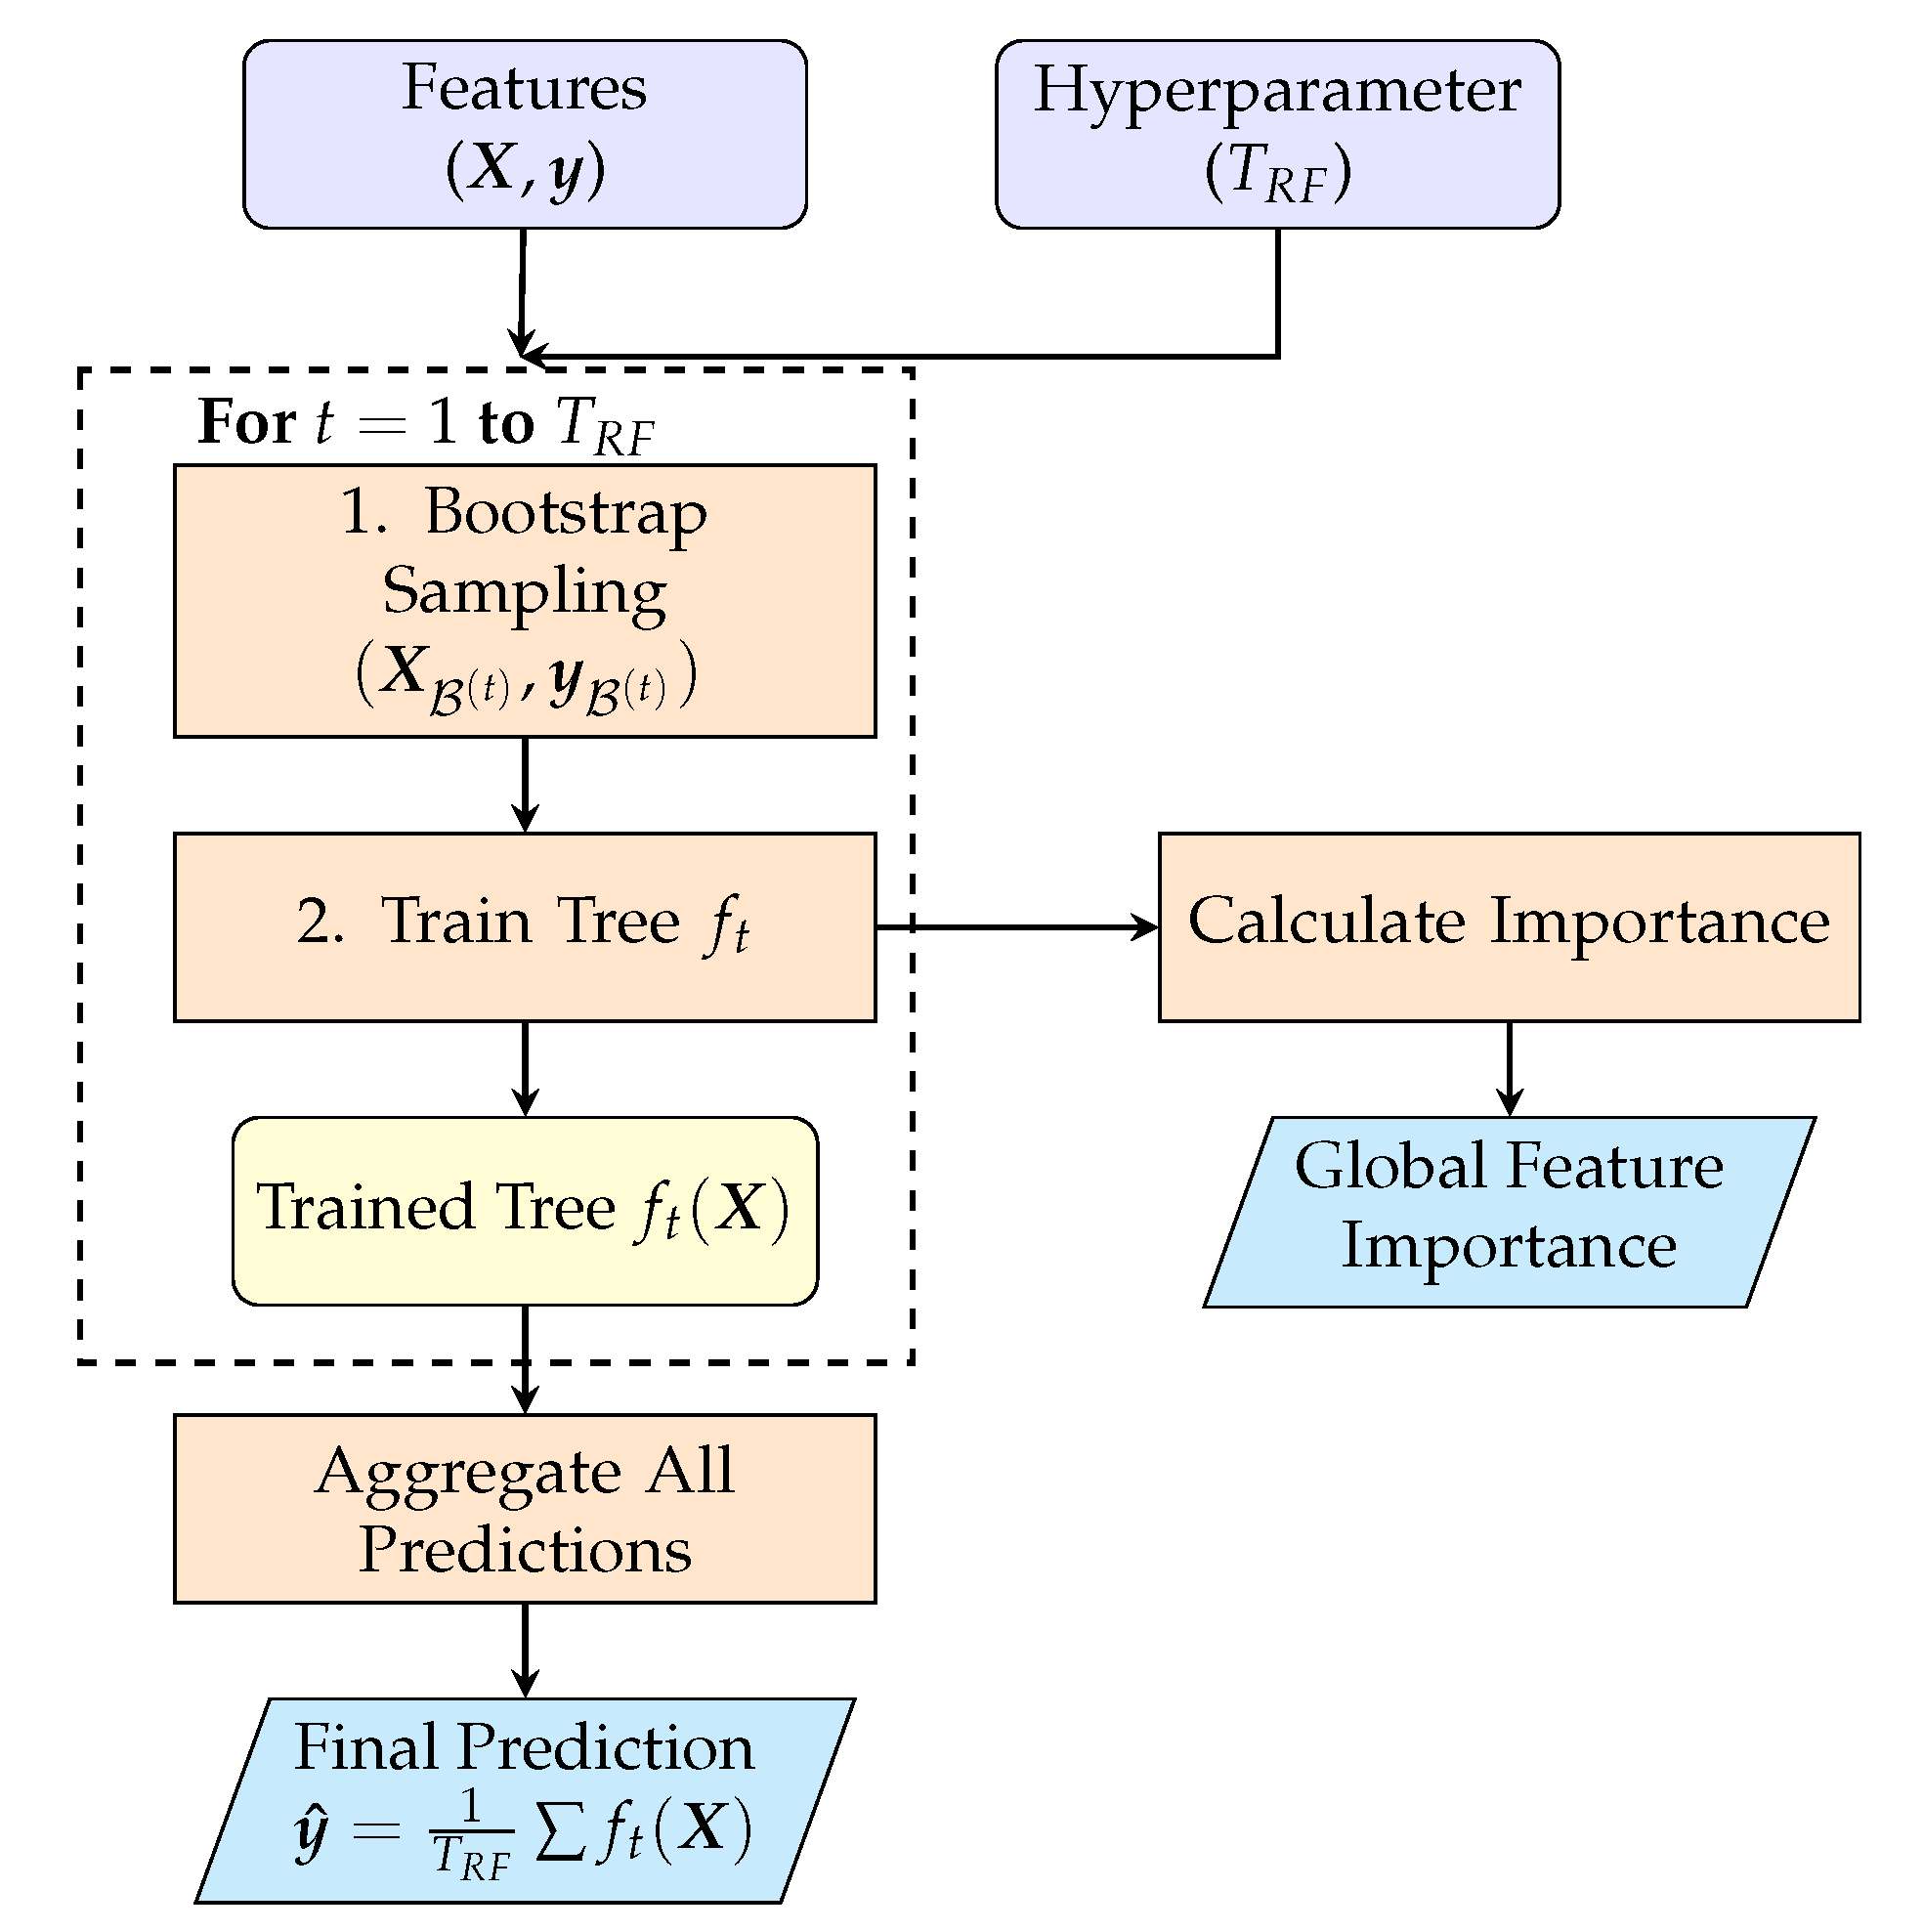
Figure 5.
Stage-wise gradient boosting overview: initialization, per-iteration gradient computation, weak-learner fitting, additive model updates, and feature-wise gain aggregation.
Figure 5.
Stage-wise gradient boosting overview: initialization, per-iteration gradient computation, weak-learner fitting, additive model updates, and feature-wise gain aggregation.
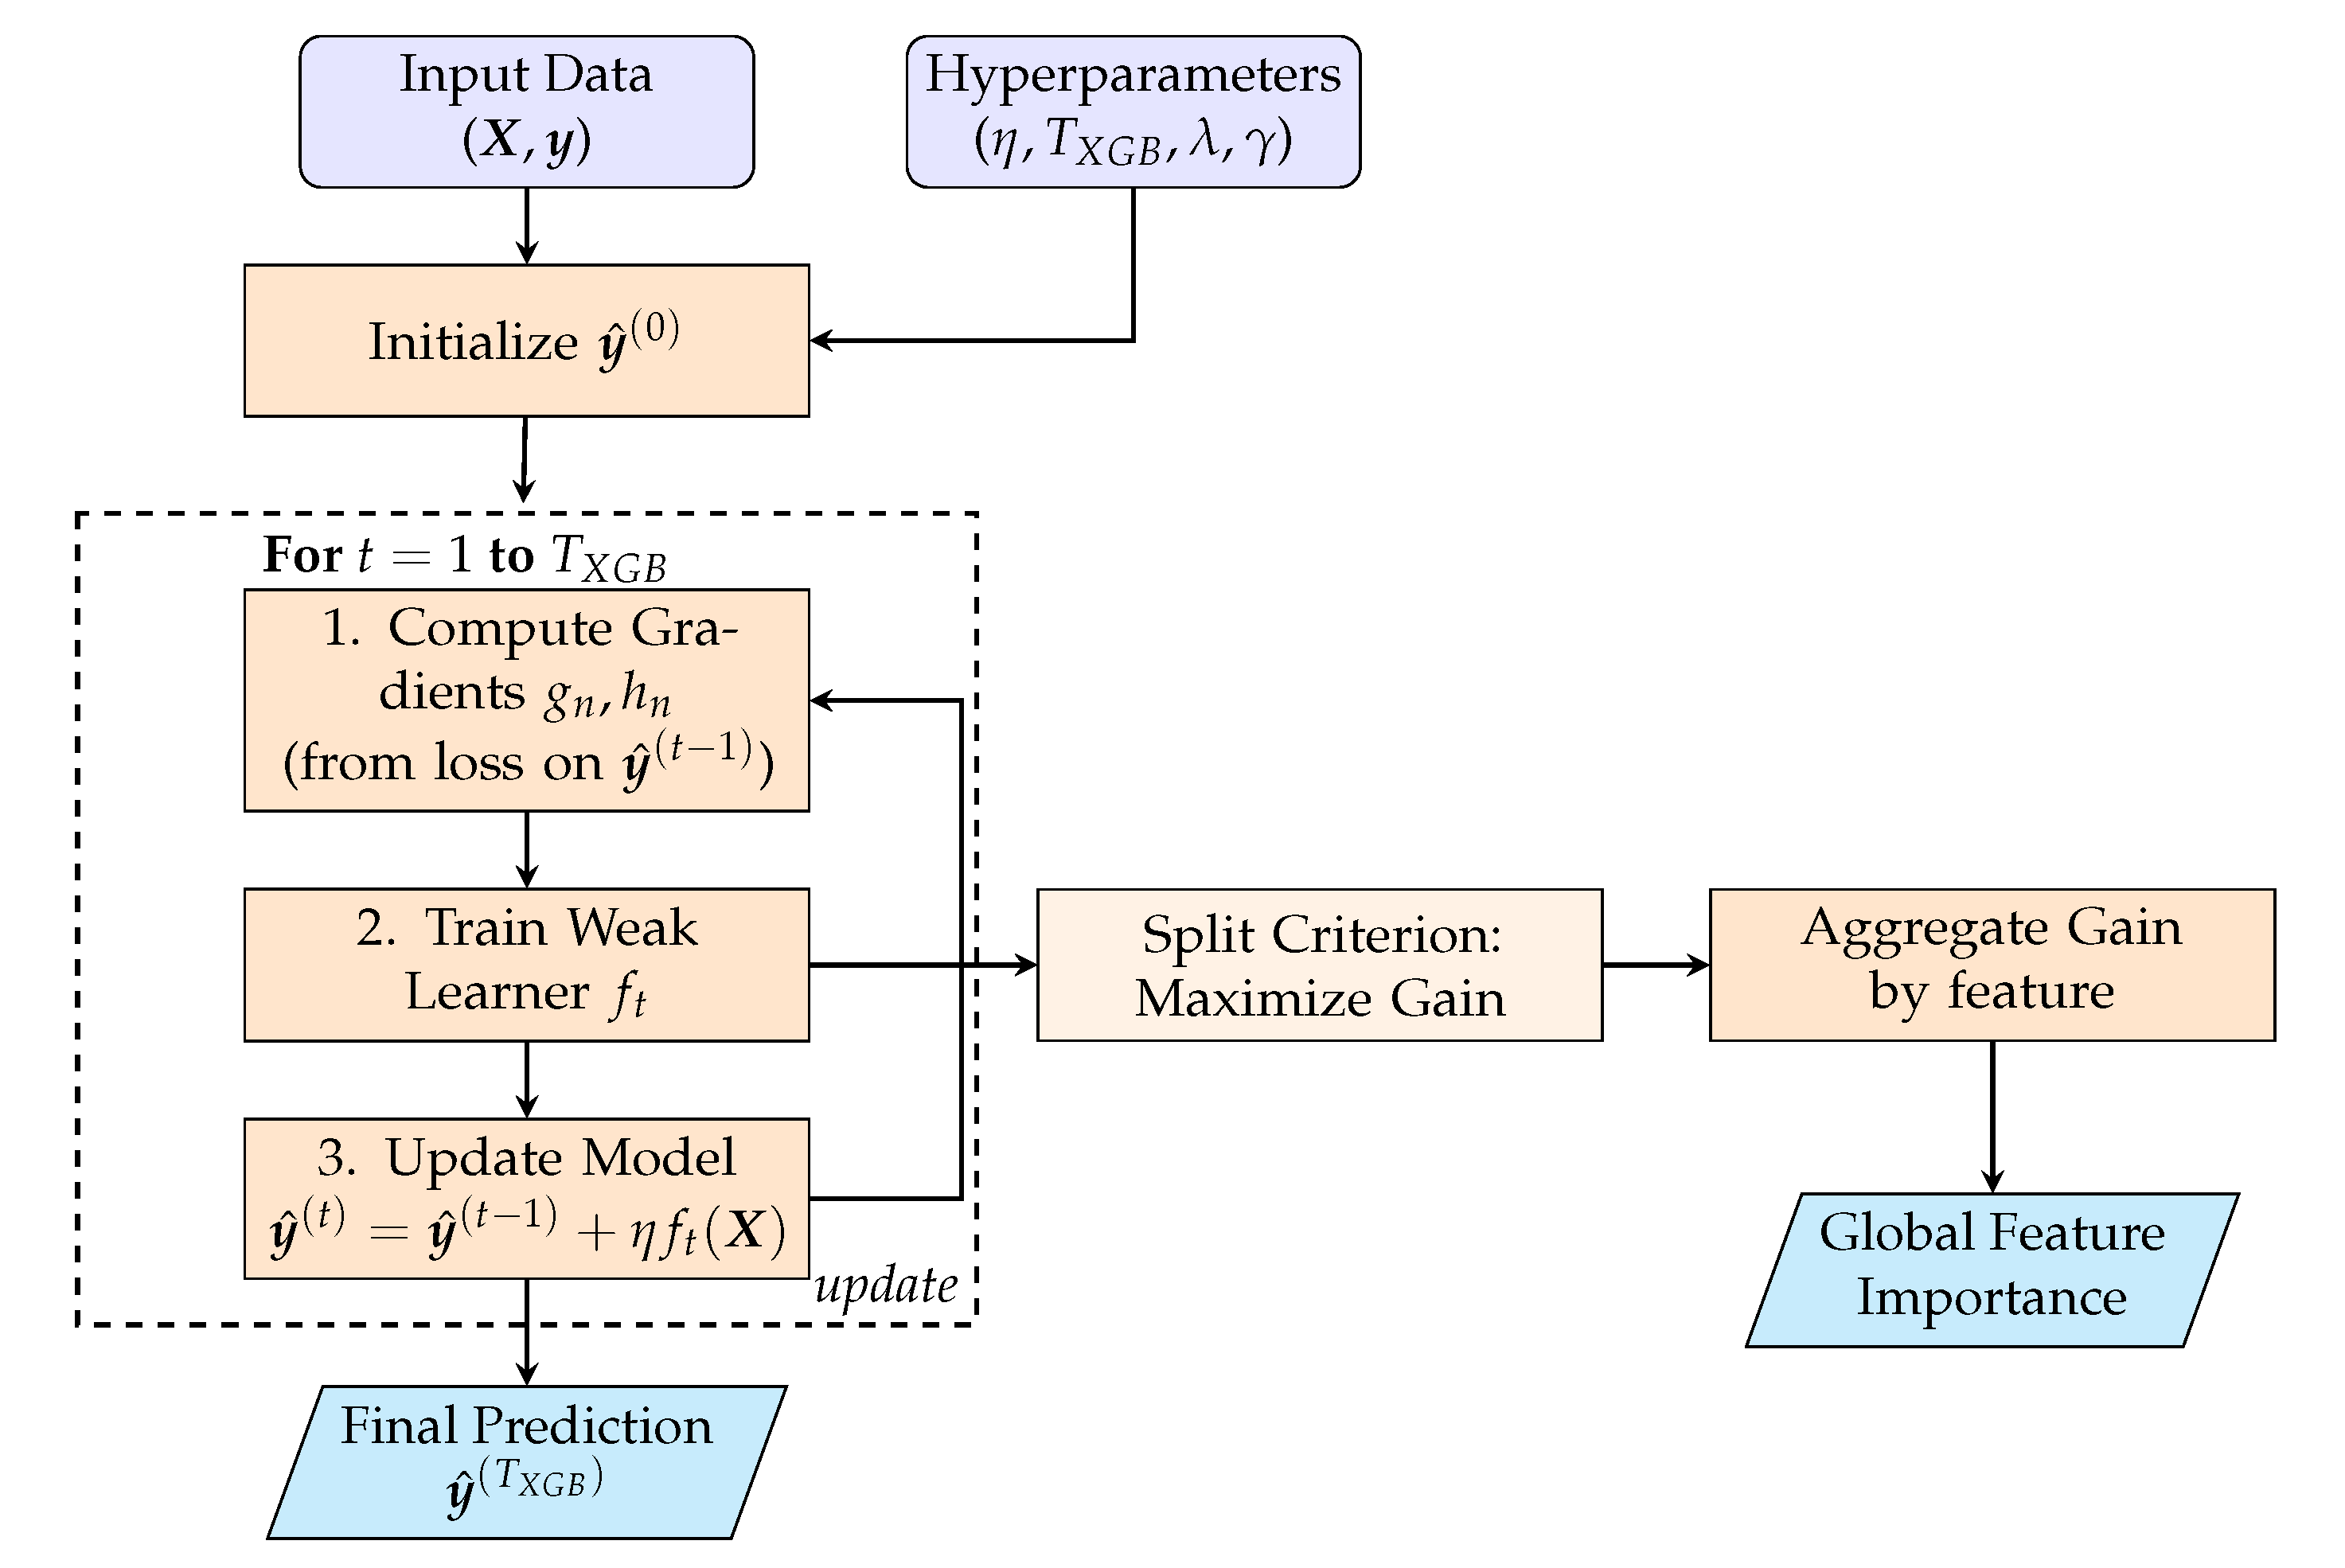
Figure 6.
TabNet step-wise architecture with batch normalization, attentive masks, feature transformers, and residual aggregation; predictions are computed from aggregated features, while feature attributions derive from stepwise masks.
Figure 6.
TabNet step-wise architecture with batch normalization, attentive masks, feature transformers, and residual aggregation; predictions are computed from aggregated features, while feature attributions derive from stepwise masks.
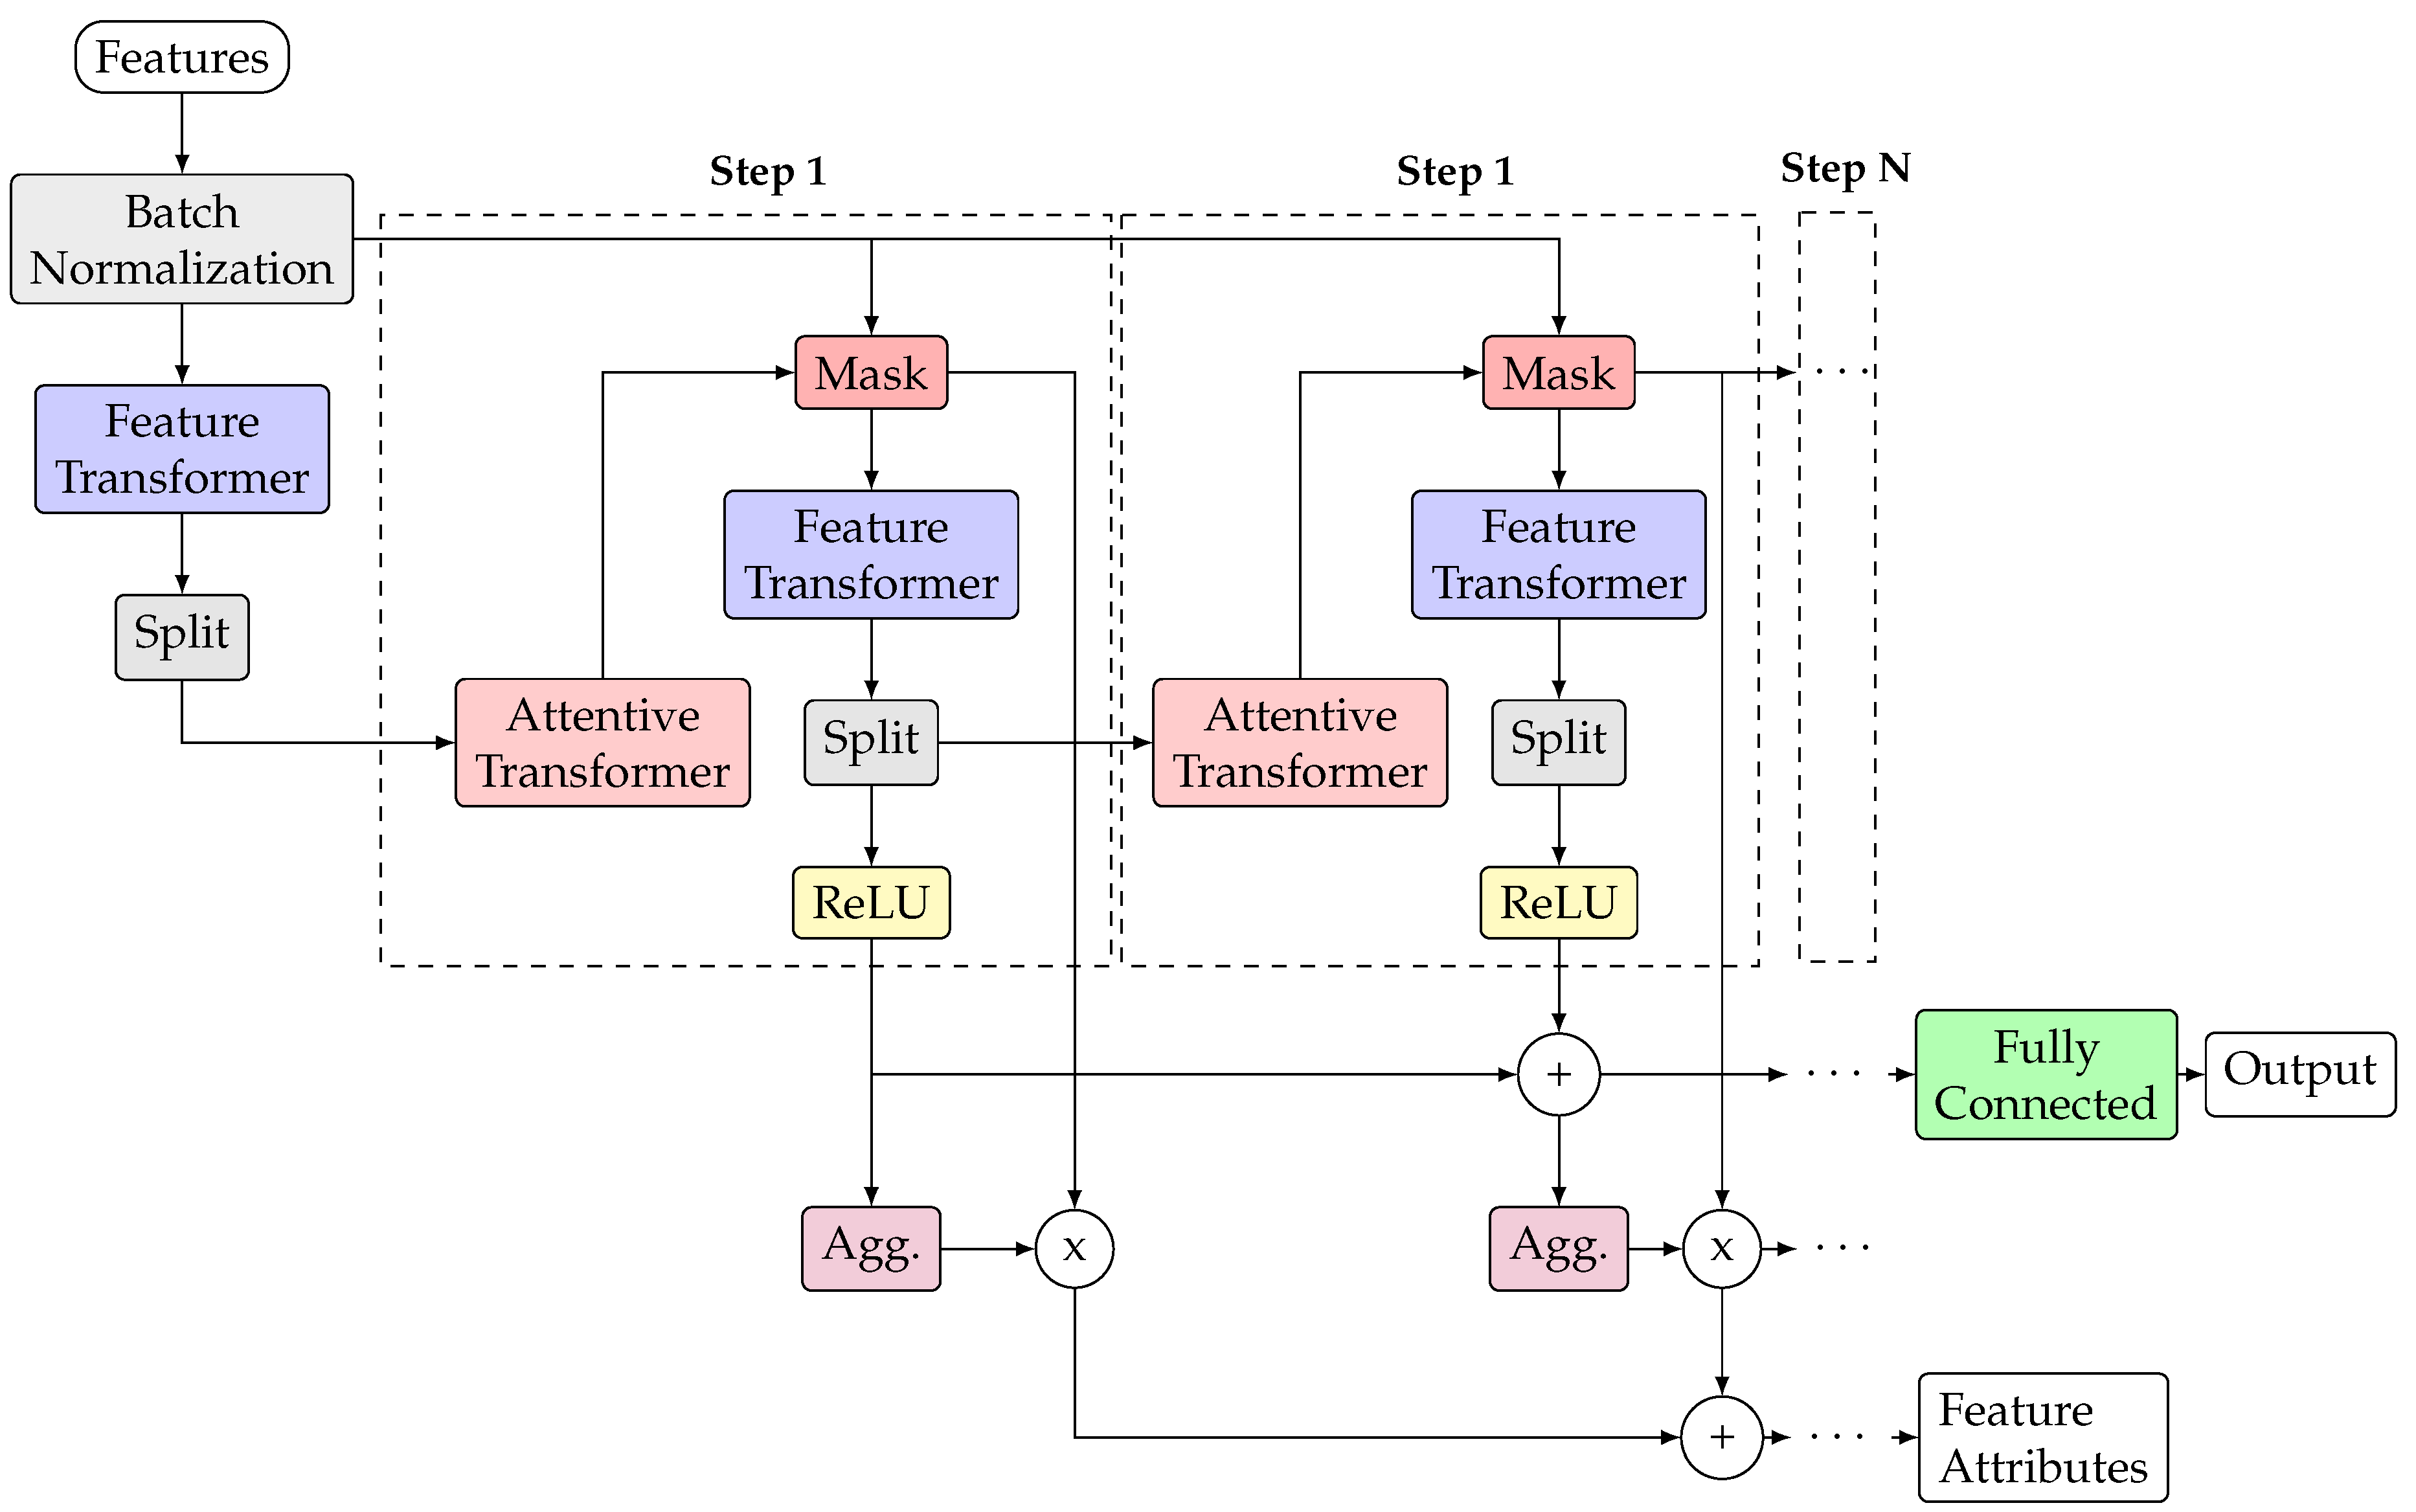
Figure 7.
Linear workflow of a traditional RAG system.
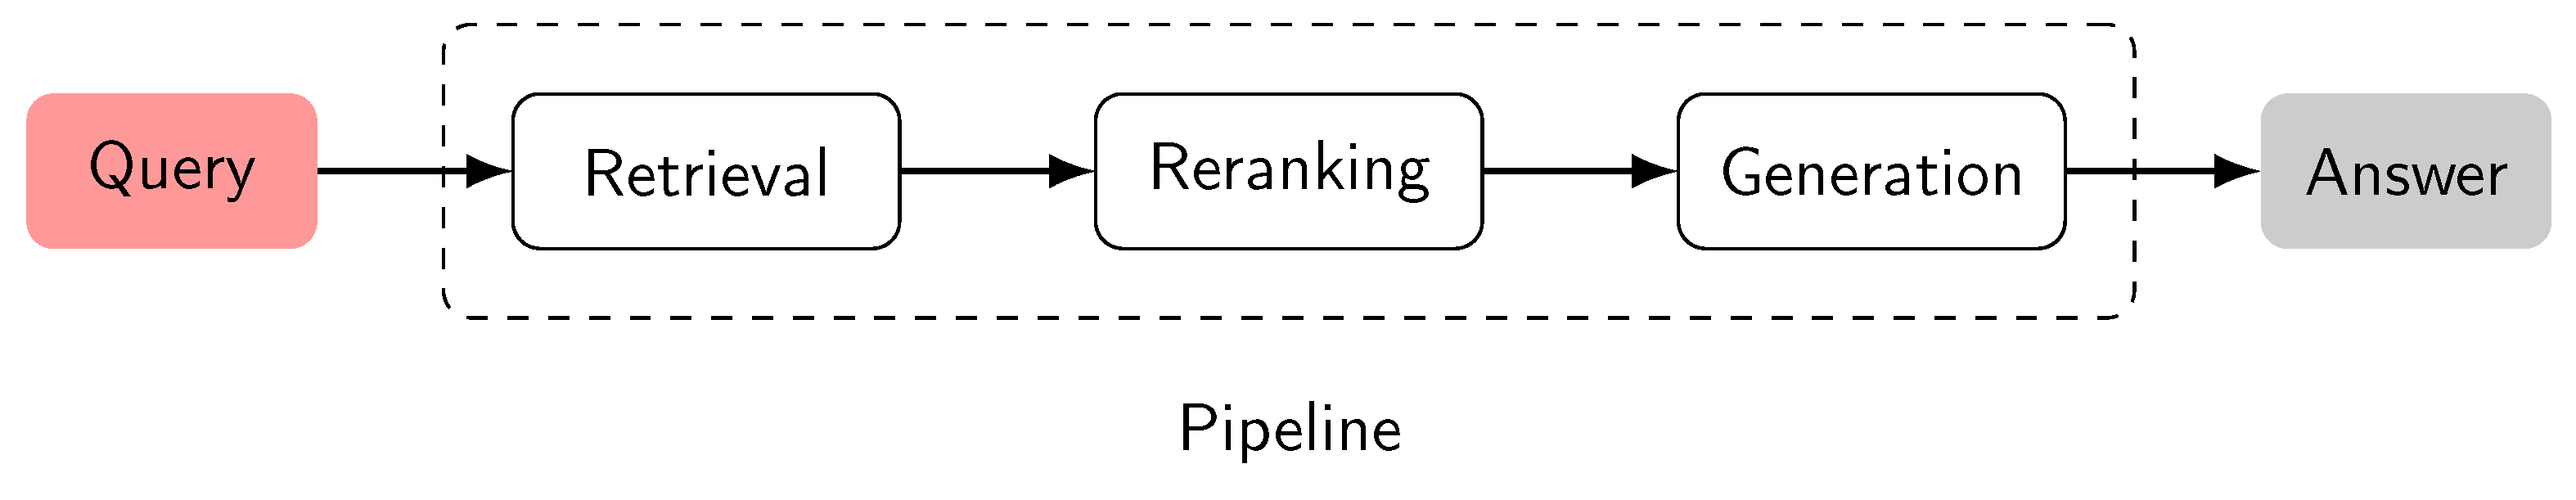
Figure 8.
Cyclical and adaptive workflow of an Agentic RAG system.

Figure 9.
The user interface of the diagnostic framework. The top panel allows users to filter events by date and municipality.
Figure 9.
The user interface of the diagnostic framework. The top panel allows users to filter events by date and municipality.
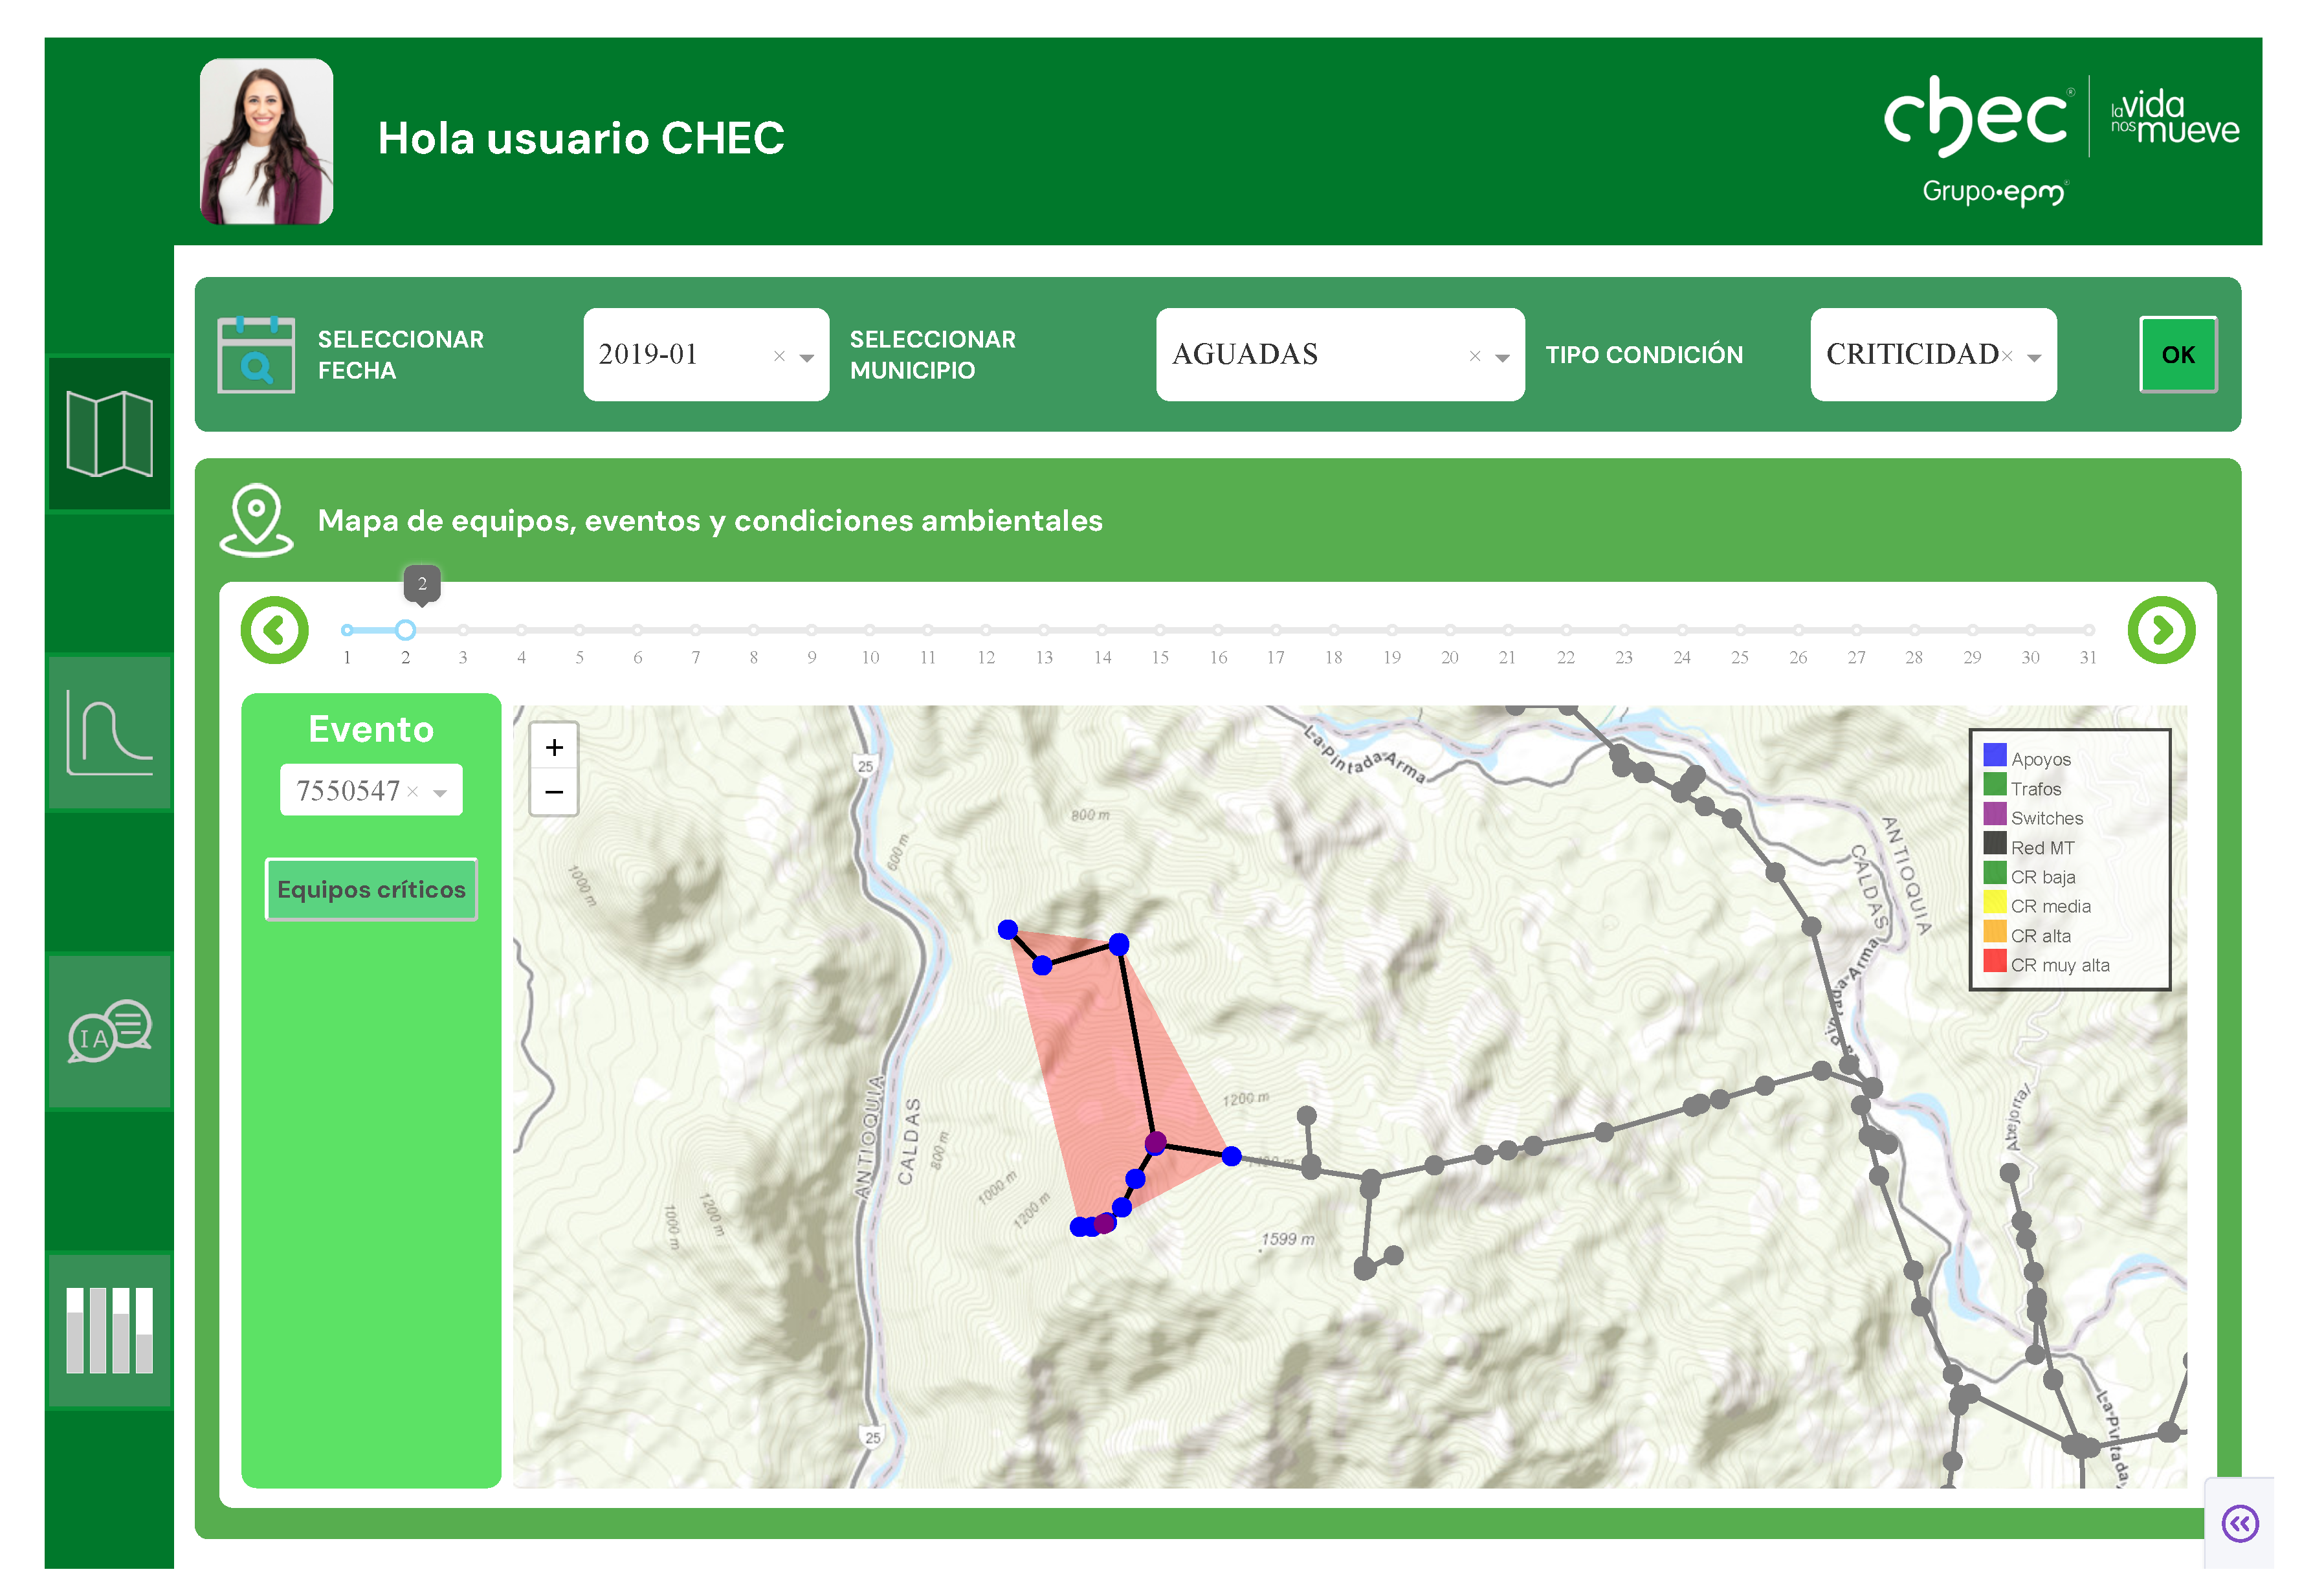
Figure 10.
Architectural diagram of the integrated diagnostic framework based on interpretable AI for reliability and regulation-aware decision support.
Figure 10.
Architectural diagram of the integrated diagnostic framework based on interpretable AI for reliability and regulation-aware decision support.
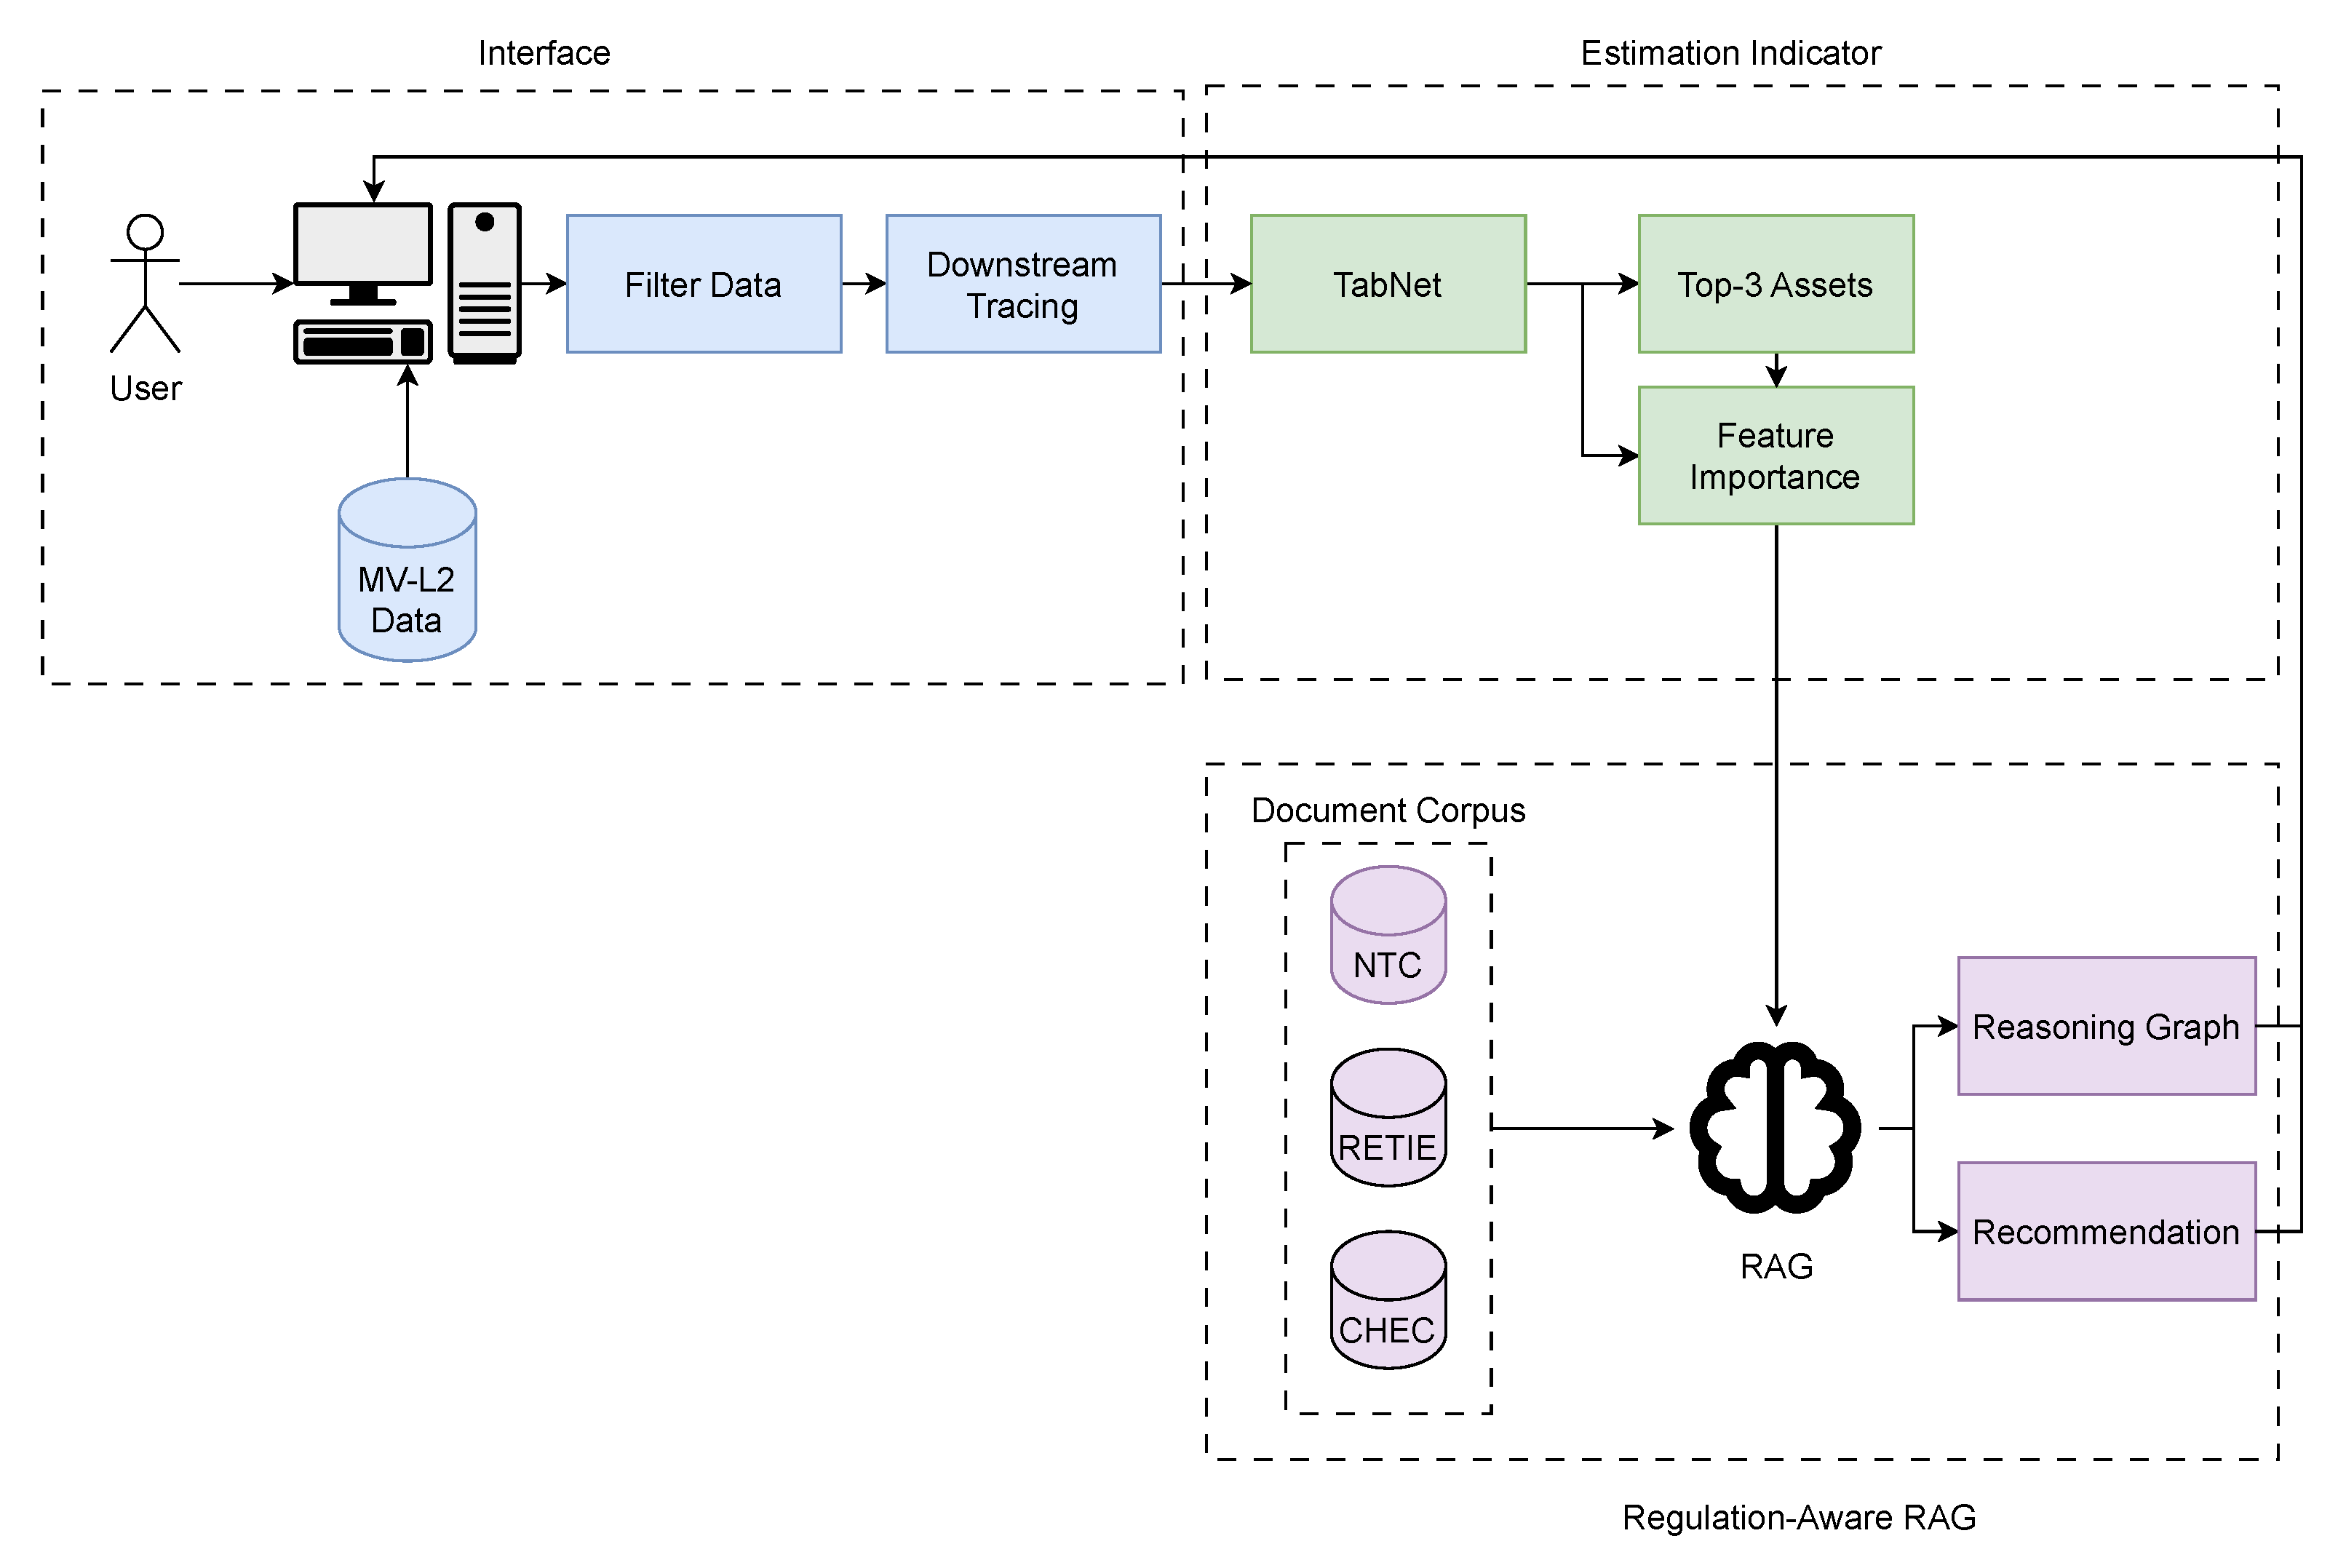
Figure 11.
Time-series comparison of SAIFI forecasts from evaluated models against observed values on the test set.
Figure 11.
Time-series comparison of SAIFI forecasts from evaluated models against observed values on the test set.
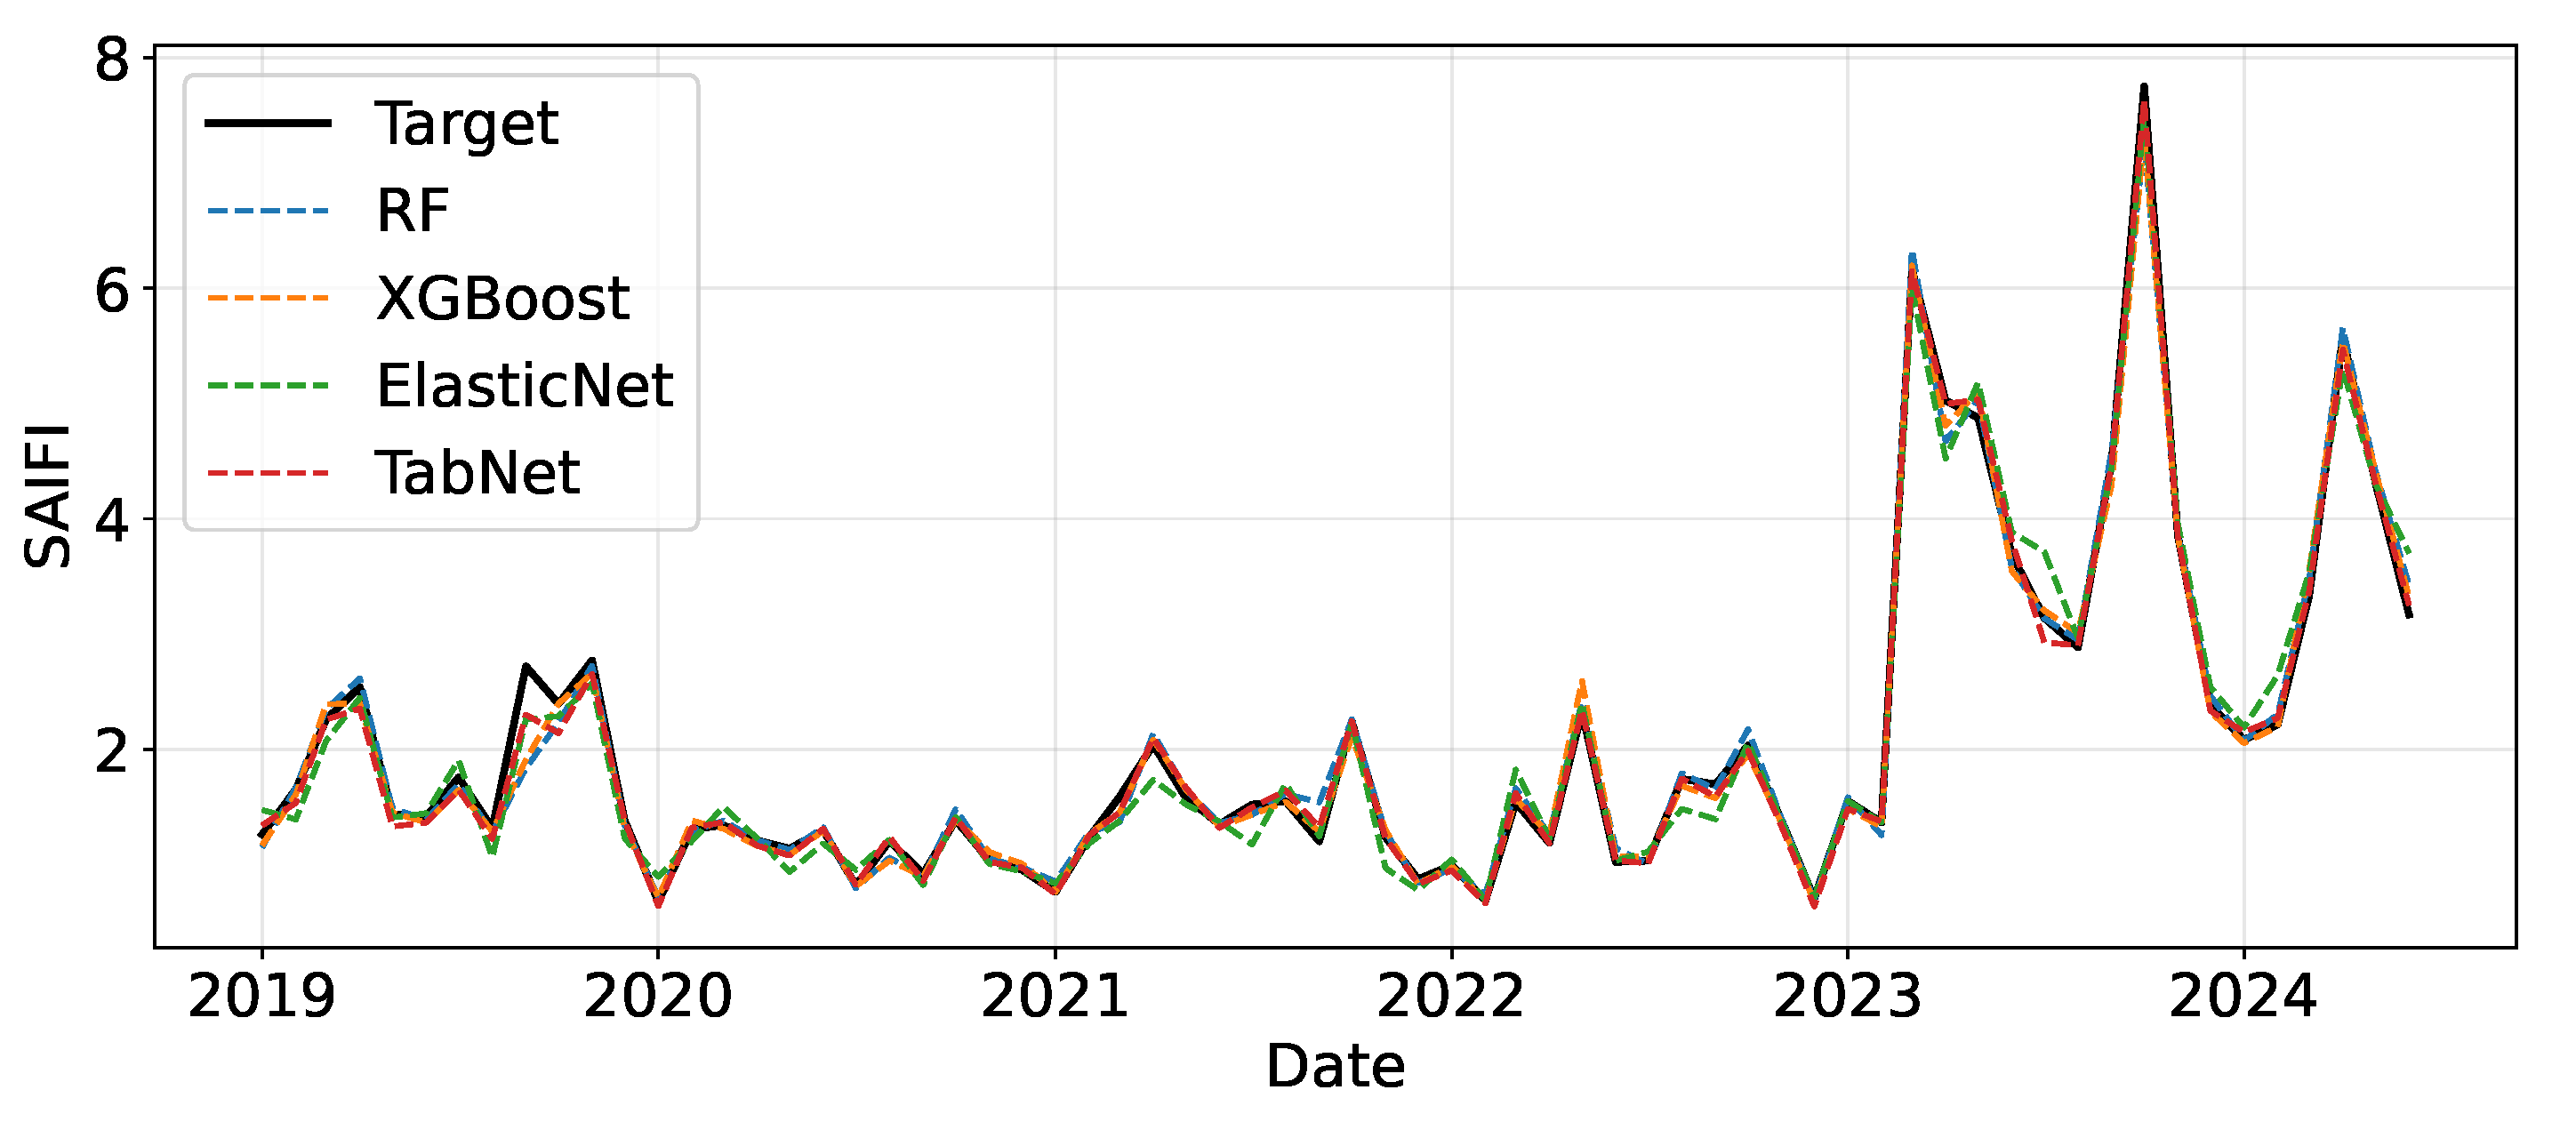
Figure 12.
Hyperparameter optimization landscapes for each predictive model. The contours represent the performance metric as a function of two key hyperparameters, where darker regions indicate superior performance. Circles denote evaluated points during the Bayesian search, and the ’X’ marks the final selected configuration.
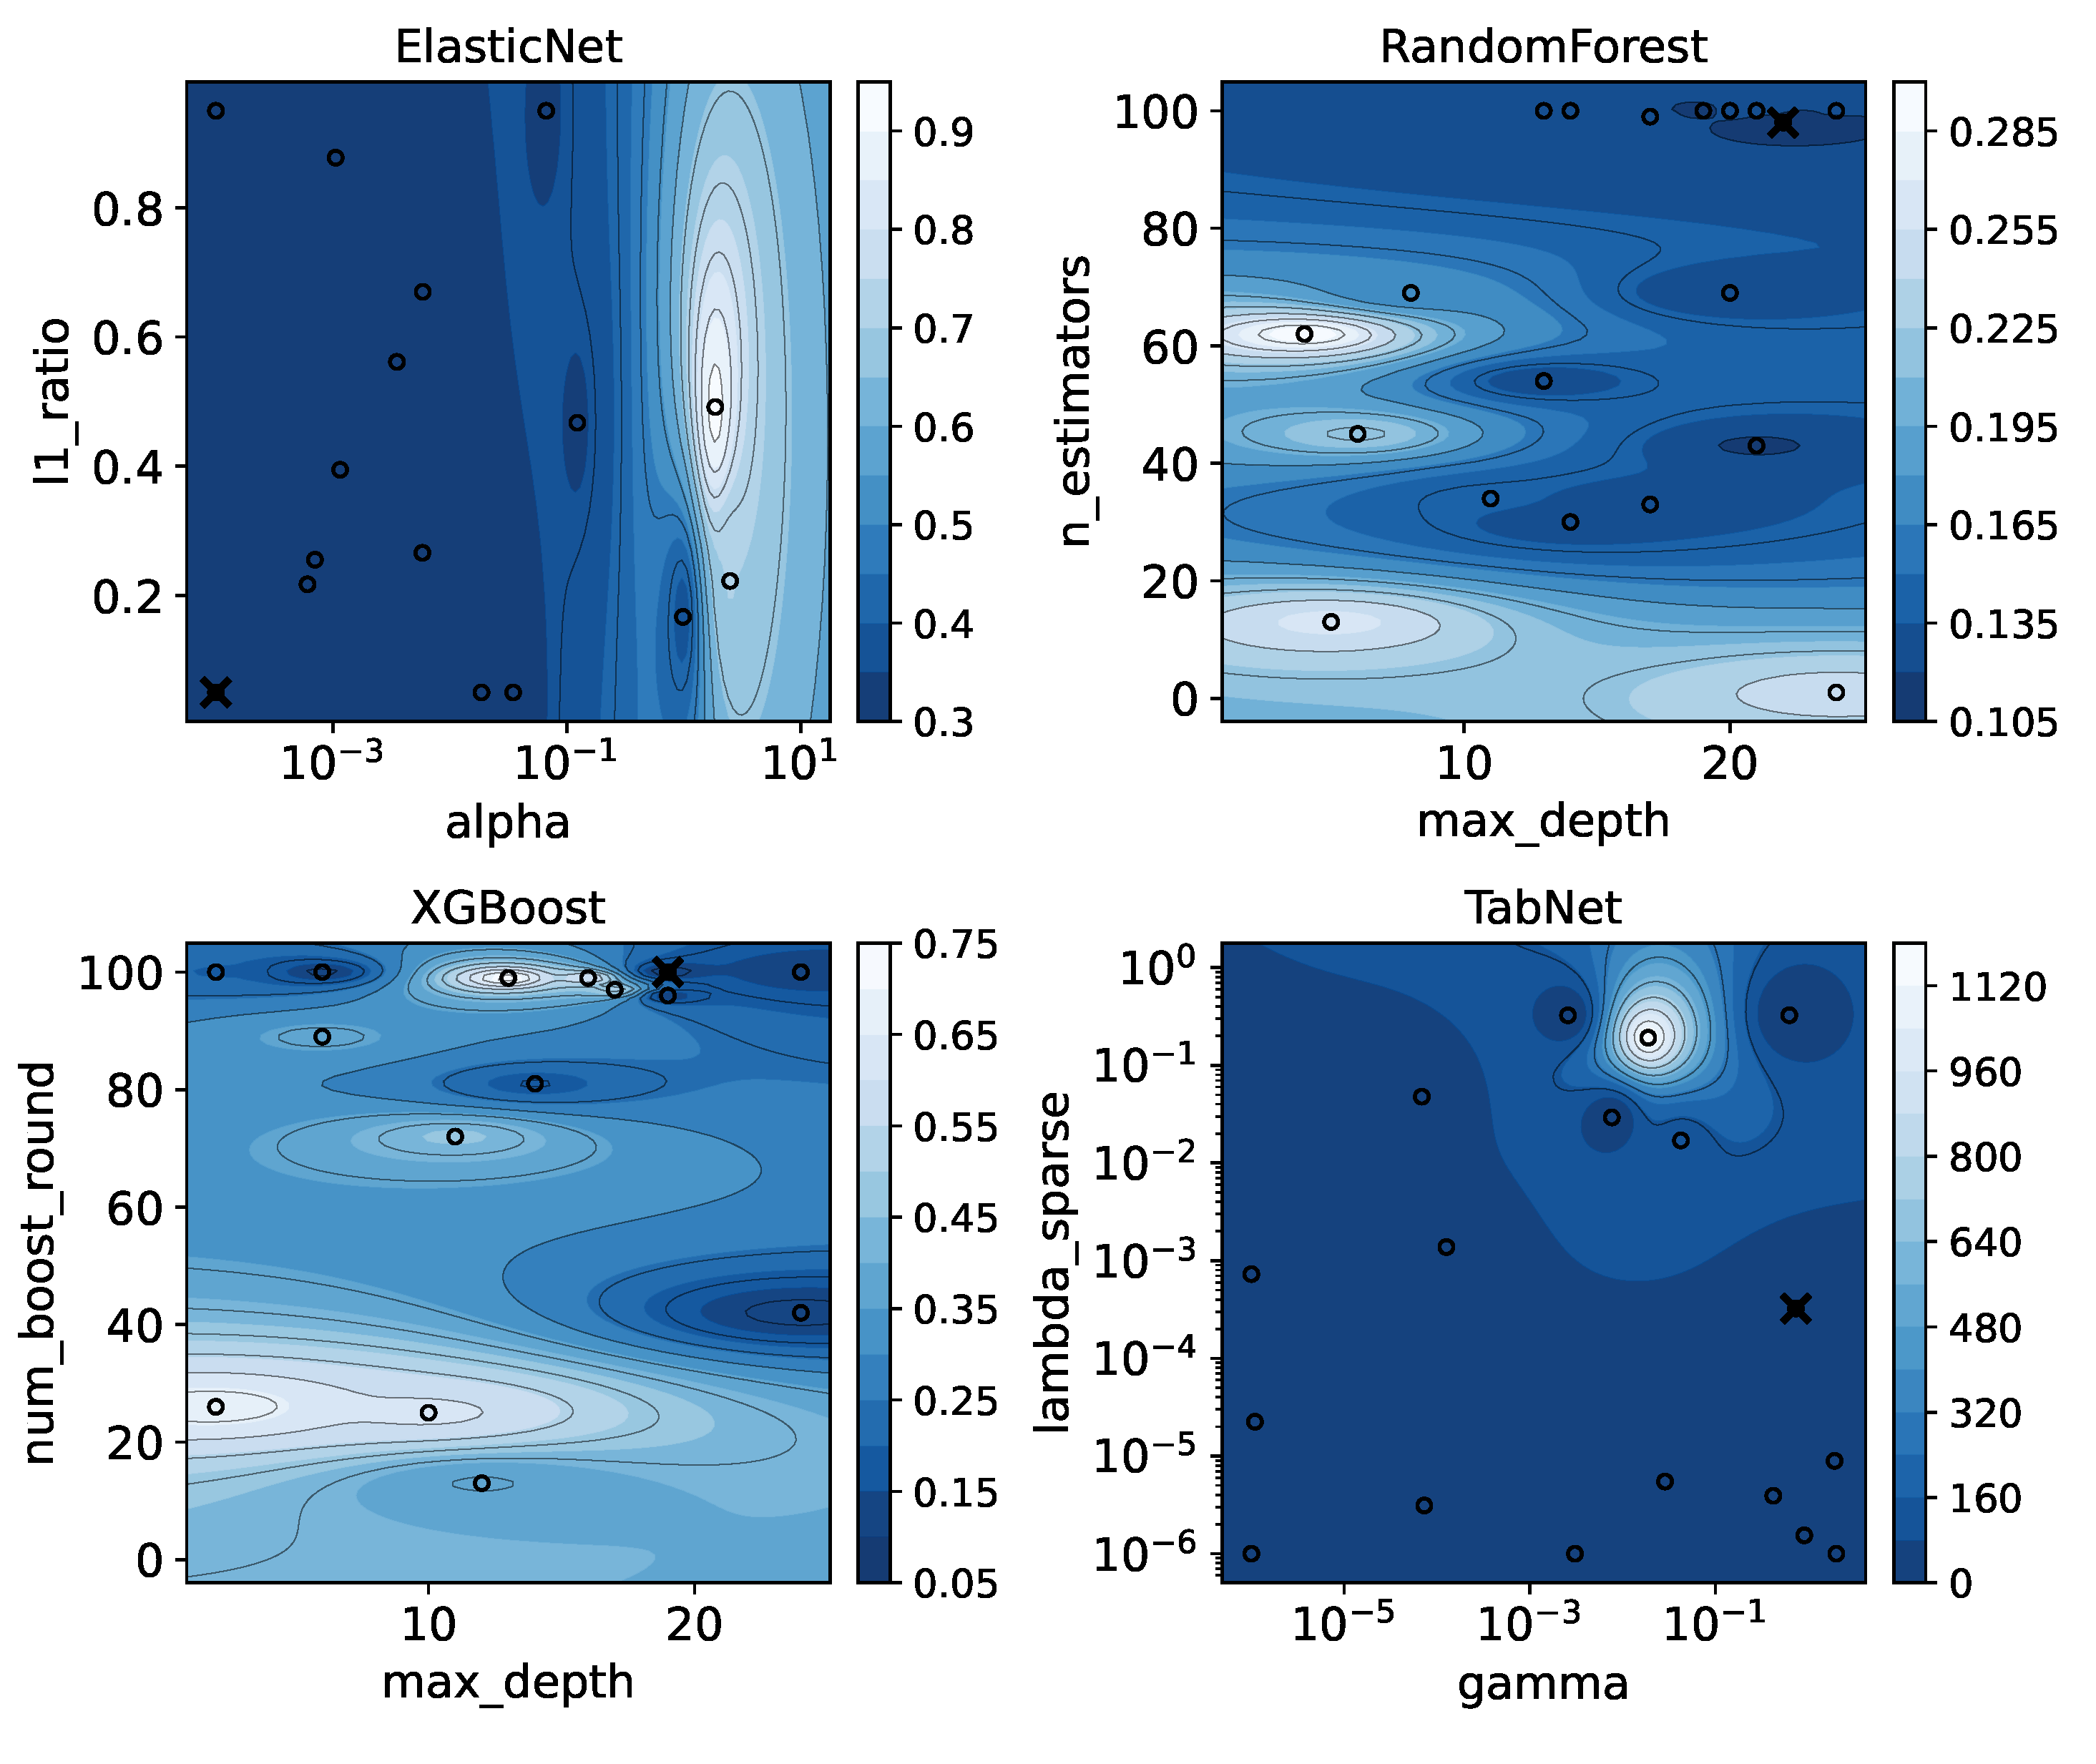
Figure 13.
Global feature importance rankings derived from the training data for each model. The plots show the normalized relevance of the top 10 most influential features.
Figure 13.
Global feature importance rankings derived from the training data for each model. The plots show the normalized relevance of the top 10 most influential features.

Figure 14.
Visualization of TabNet’s instance-wise feature importance (test set). Each row corresponds to a sample and each column to a feature. The color intensity represents the relevance assigned by the model’s internal attention mechanism to a specific feature for a given sample
Figure 14.
Visualization of TabNet’s instance-wise feature importance (test set). Each row corresponds to a sample and each column to a feature. The color intensity represents the relevance assigned by the model’s internal attention mechanism to a specific feature for a given sample
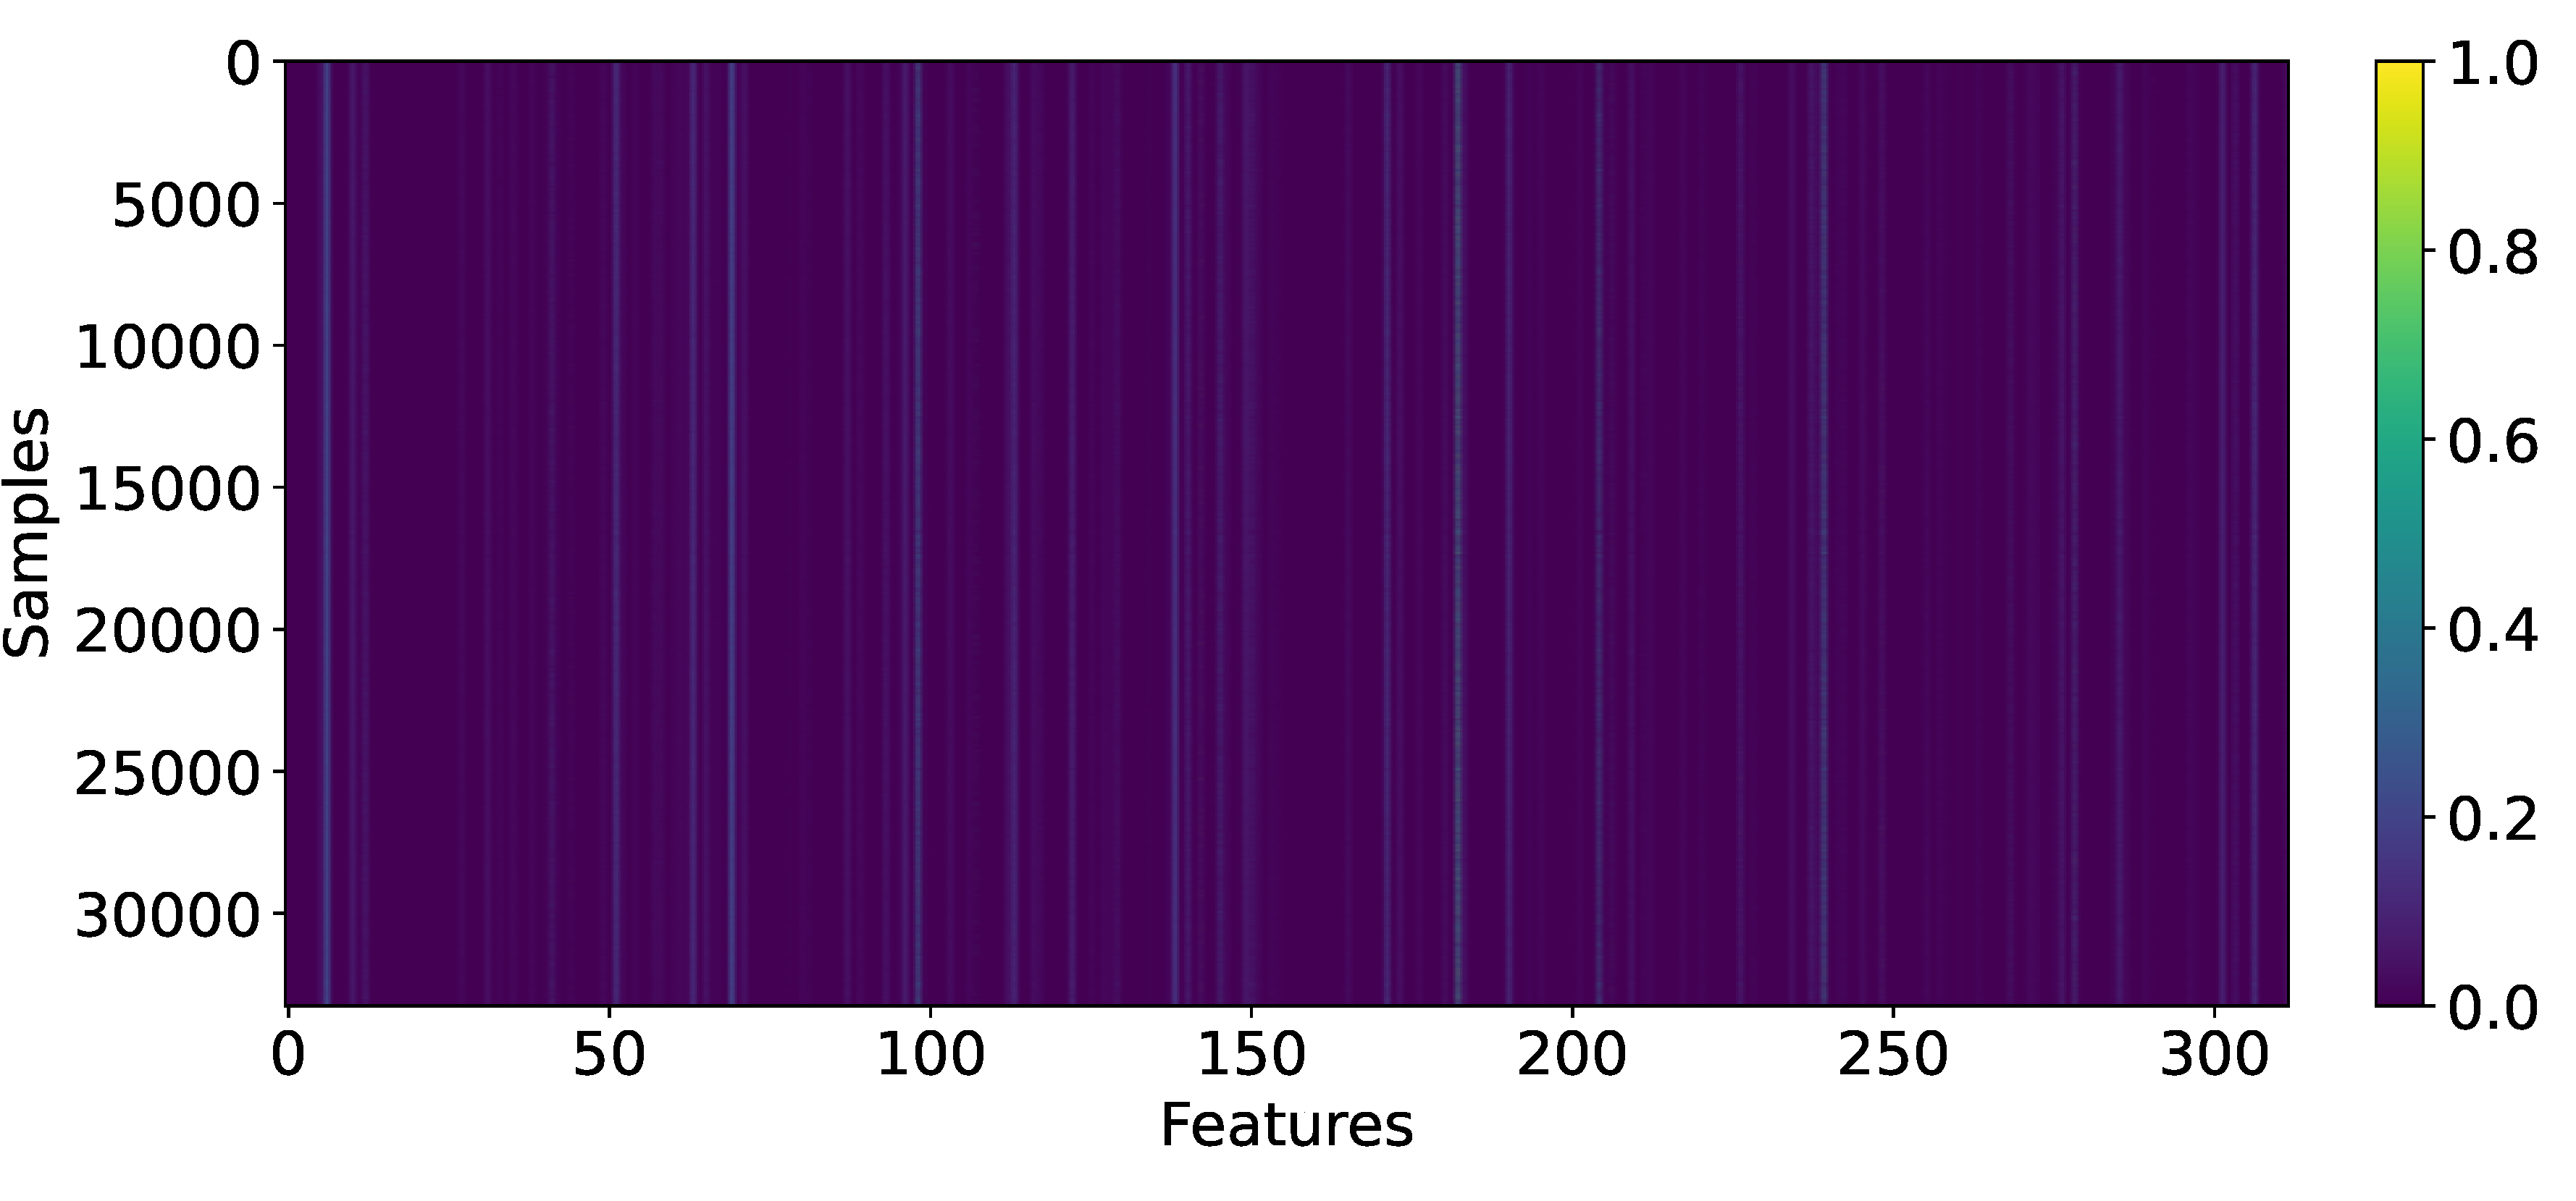
Figure 15.
Instance-level feature importance for two high-impact scenarios. (Left) Top features for the municipality with the highest aggregate SAIFI. (Right) Top features for the highest-impact distribution feeder.
Figure 15.
Instance-level feature importance for two high-impact scenarios. (Left) Top features for the municipality with the highest aggregate SAIFI. (Right) Top features for the highest-impact distribution feeder.
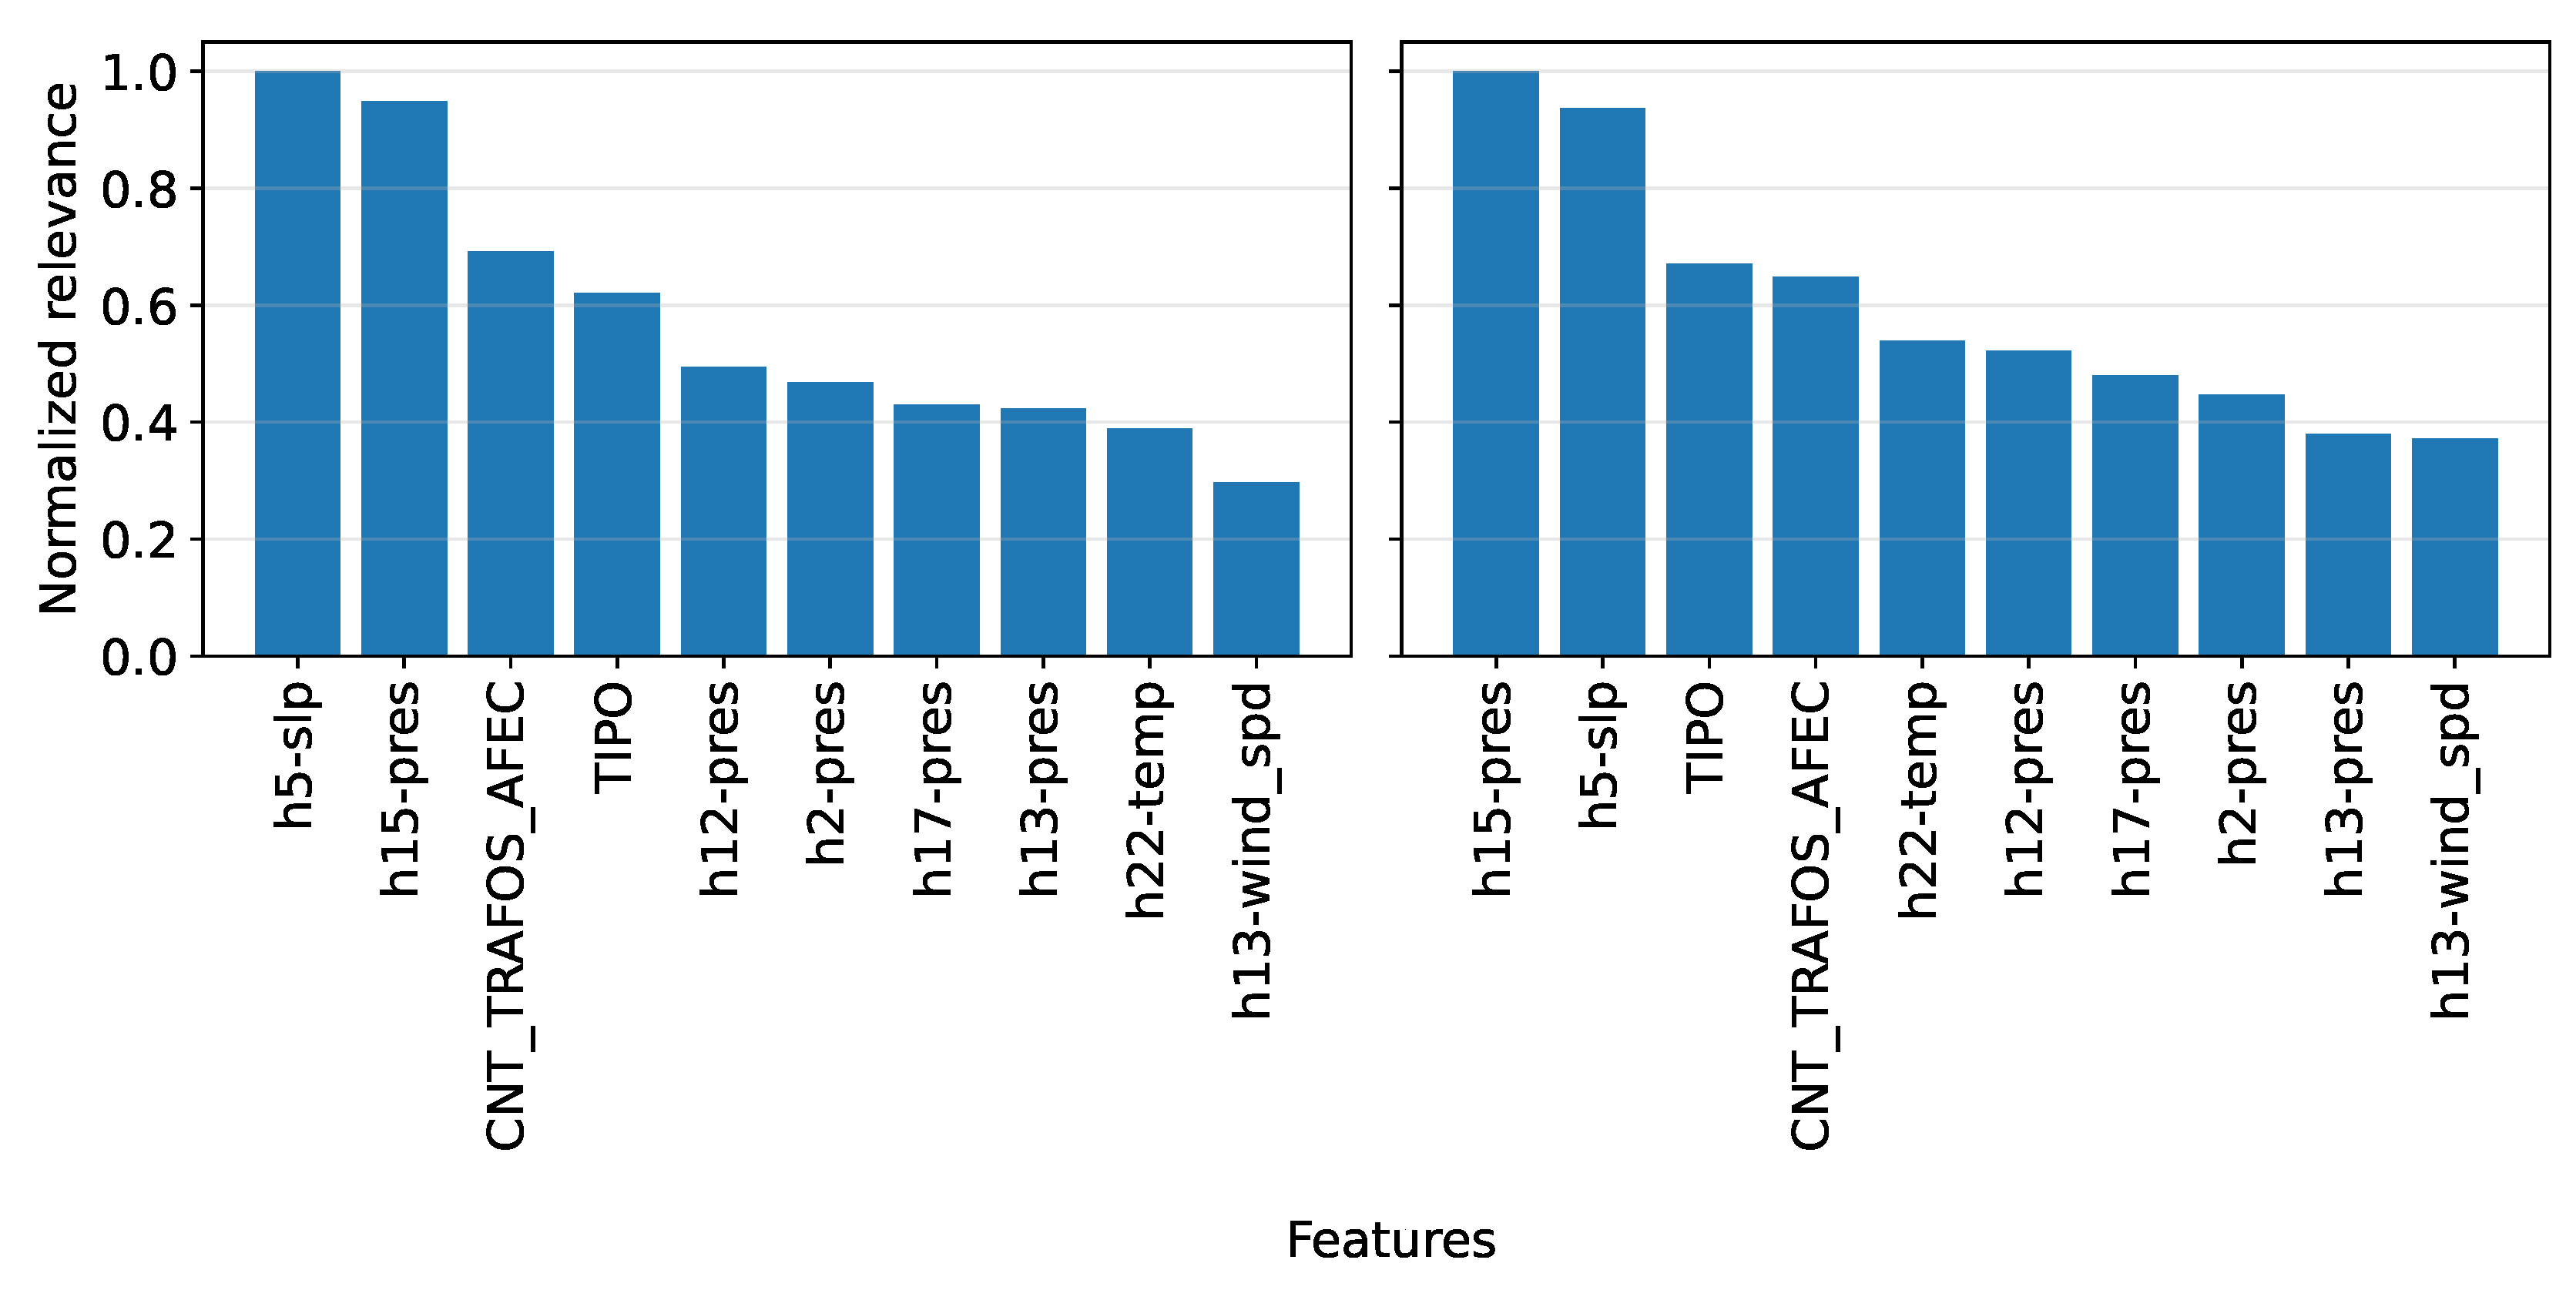
Figure 16.
Performance trade-off analysis for selected LLMs in the Agentic RAG system. The plots correlate semantic quality (F1 BERTScore) with inference time across three tasks: unstructured data processing, structured data interpretation, and recommendation synthesis. Each gray marker represents a model instance. The green point indicates the model achieving the highest semantic accuracy, while the blue point highlights the model with the best efficiency–performance balance.
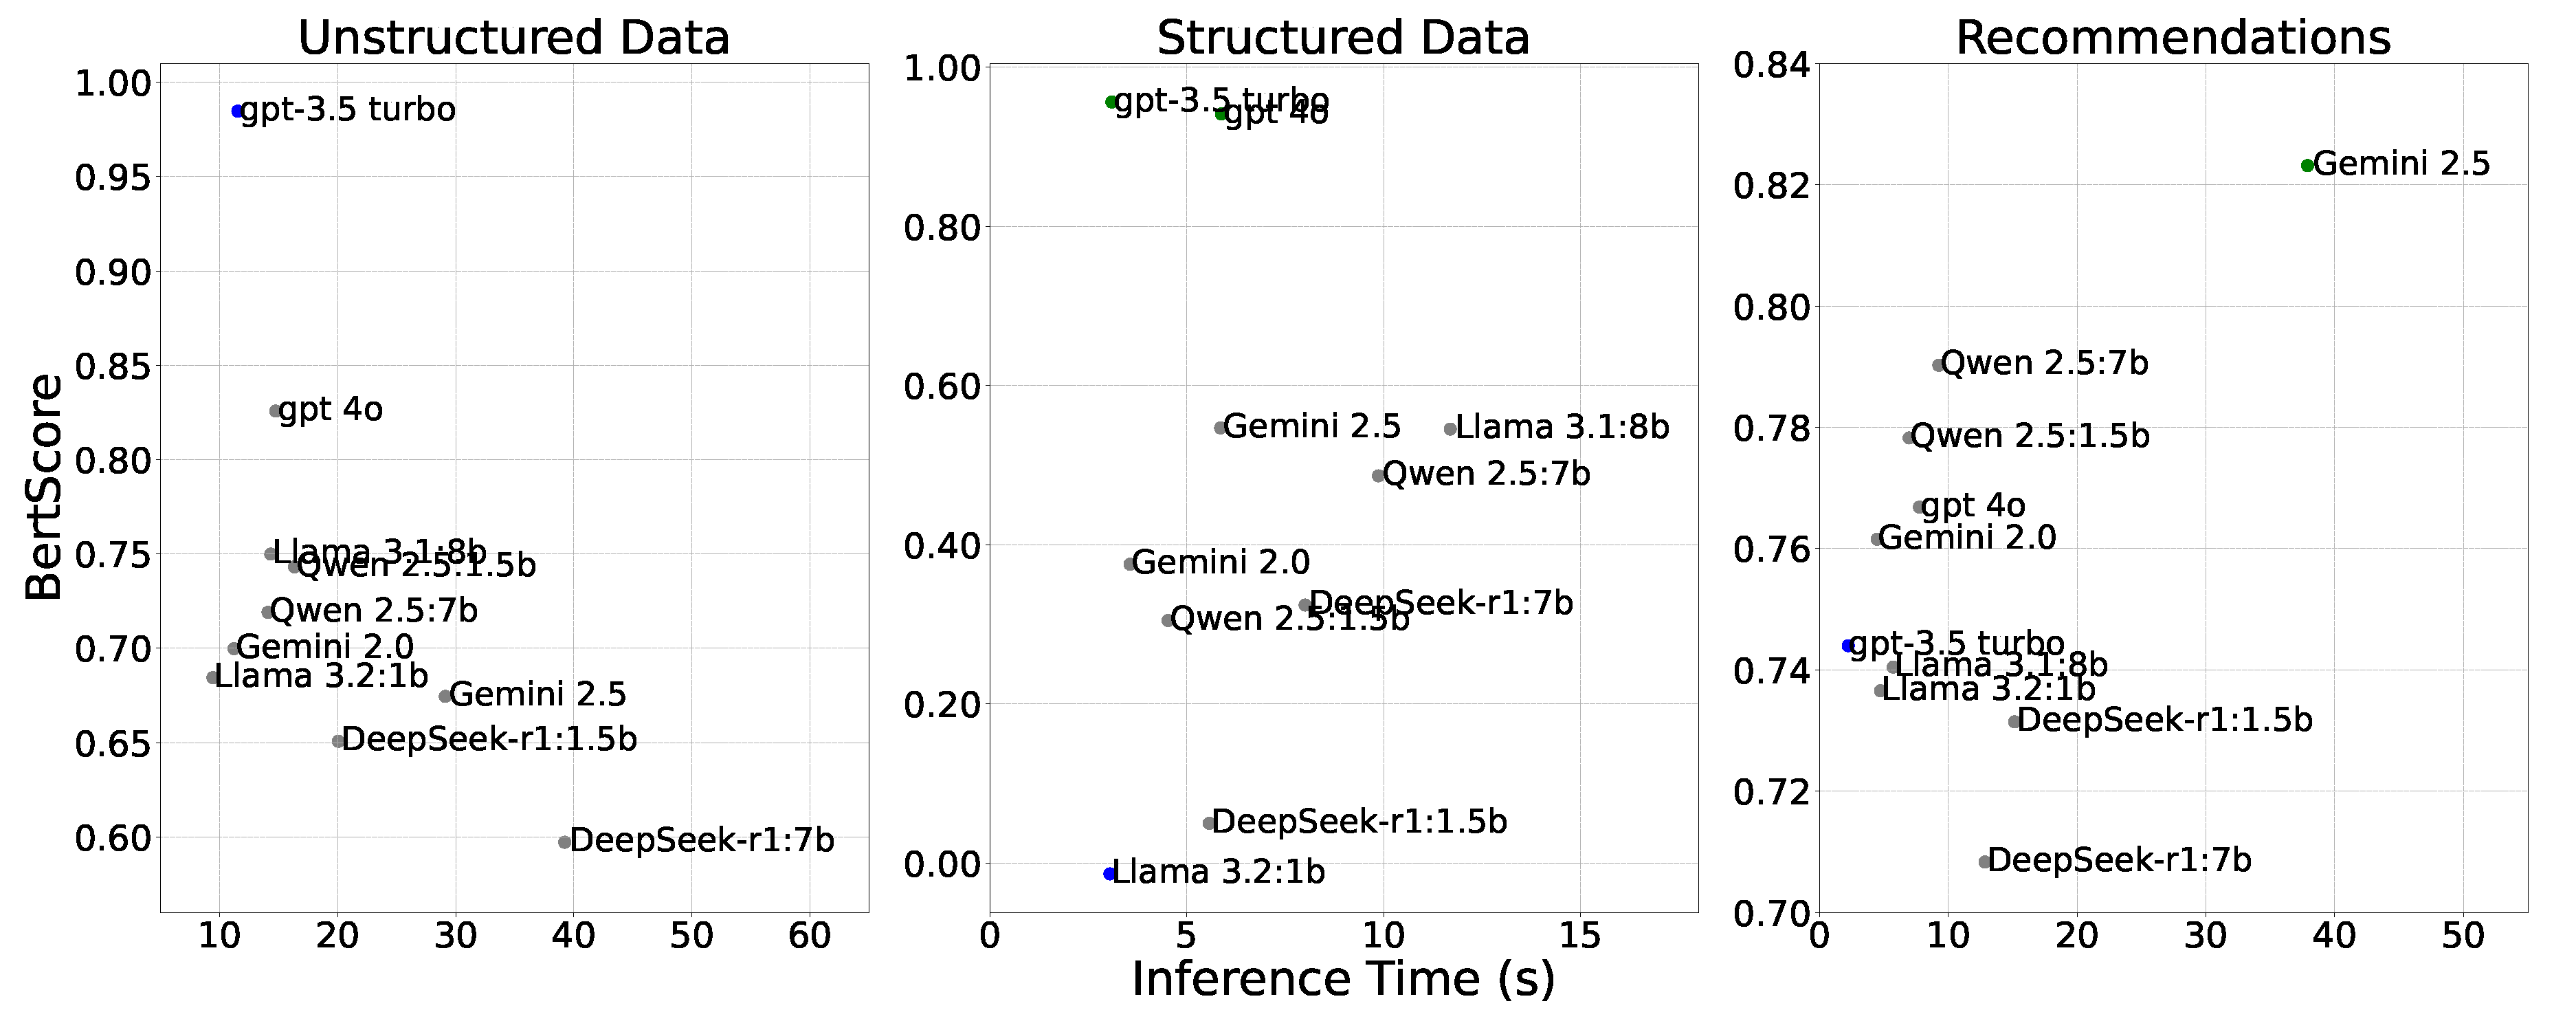
Figure 17.
The CRITAIR system’s user interface for a selected failure event. The map visualizes critical assets, with icon size proportional to their estimated SAIFI contribution as determined by the TabNet model.
Figure 17.
The CRITAIR system’s user interface for a selected failure event. The map visualizes critical assets, with icon size proportional to their estimated SAIFI contribution as determined by the TabNet model.
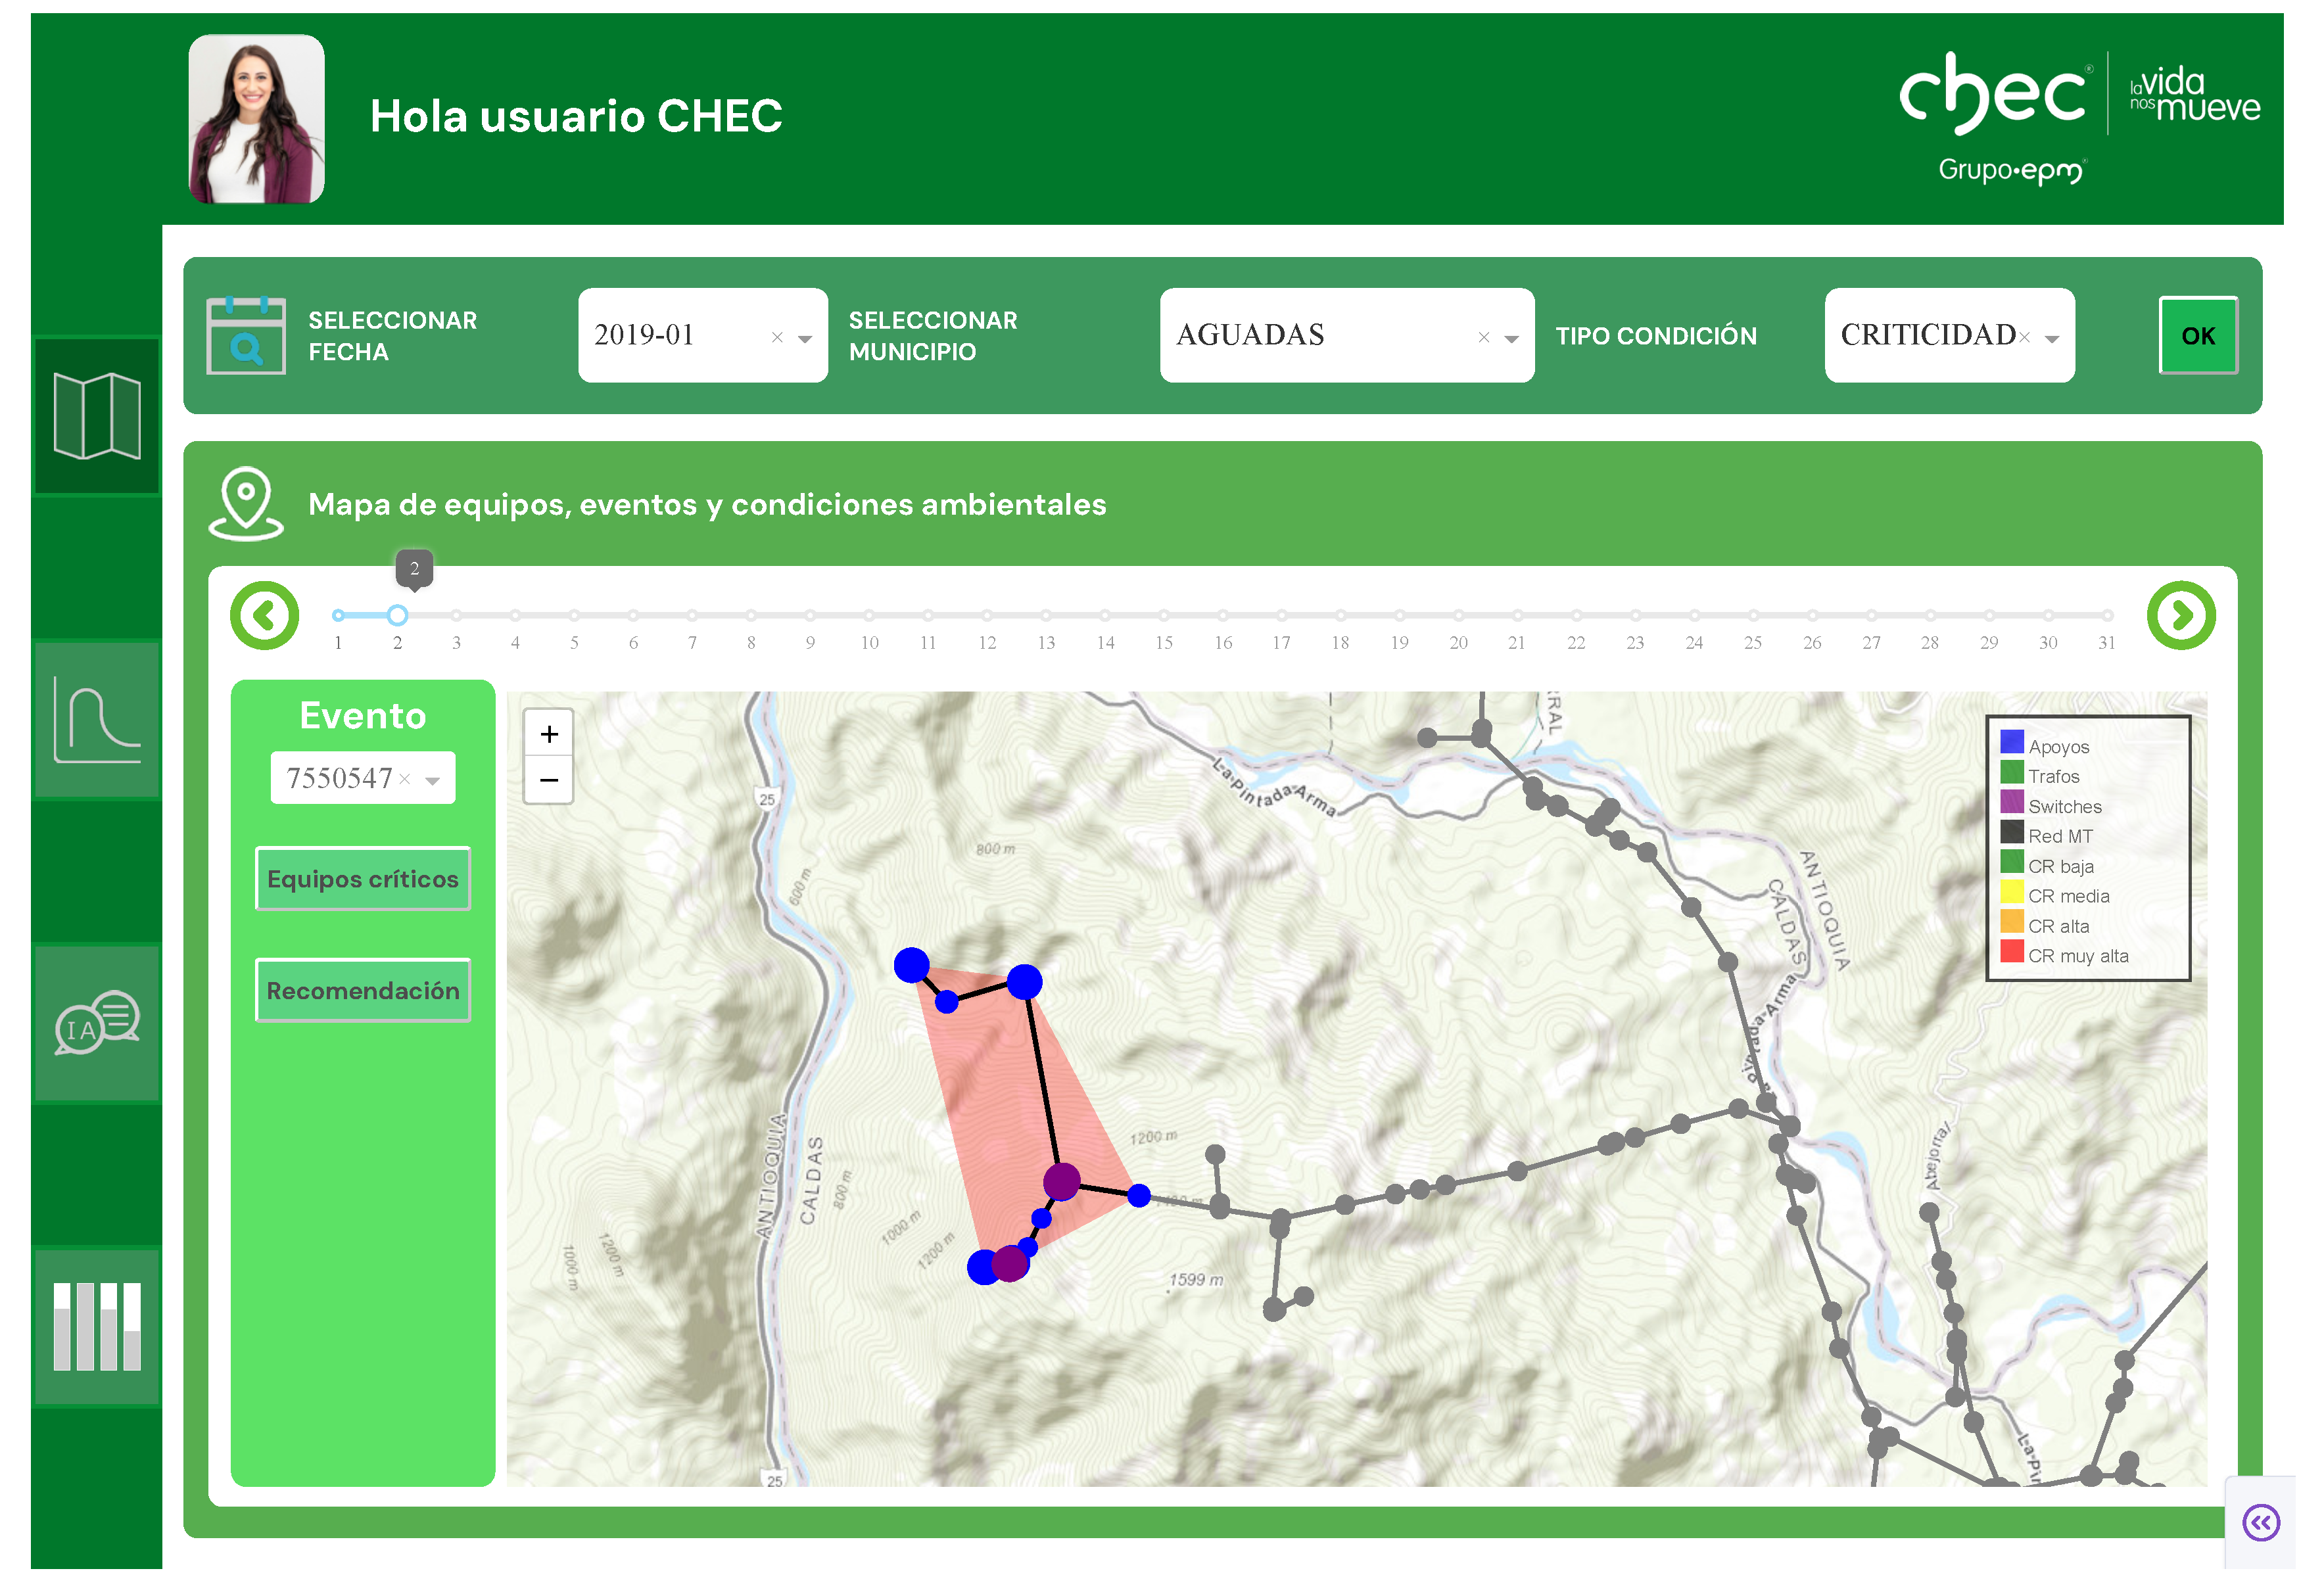
Figure 18.
The interpretable reasoning graph providing an auditable trail for a specific asset diagnosis. The graph explicitly maps the predictive model’s outputs (Critical Variables) to retrieved documentary evidence (Normativa).
Figure 18.
The interpretable reasoning graph providing an auditable trail for a specific asset diagnosis. The graph explicitly maps the predictive model’s outputs (Critical Variables) to retrieved documentary evidence (Normativa).
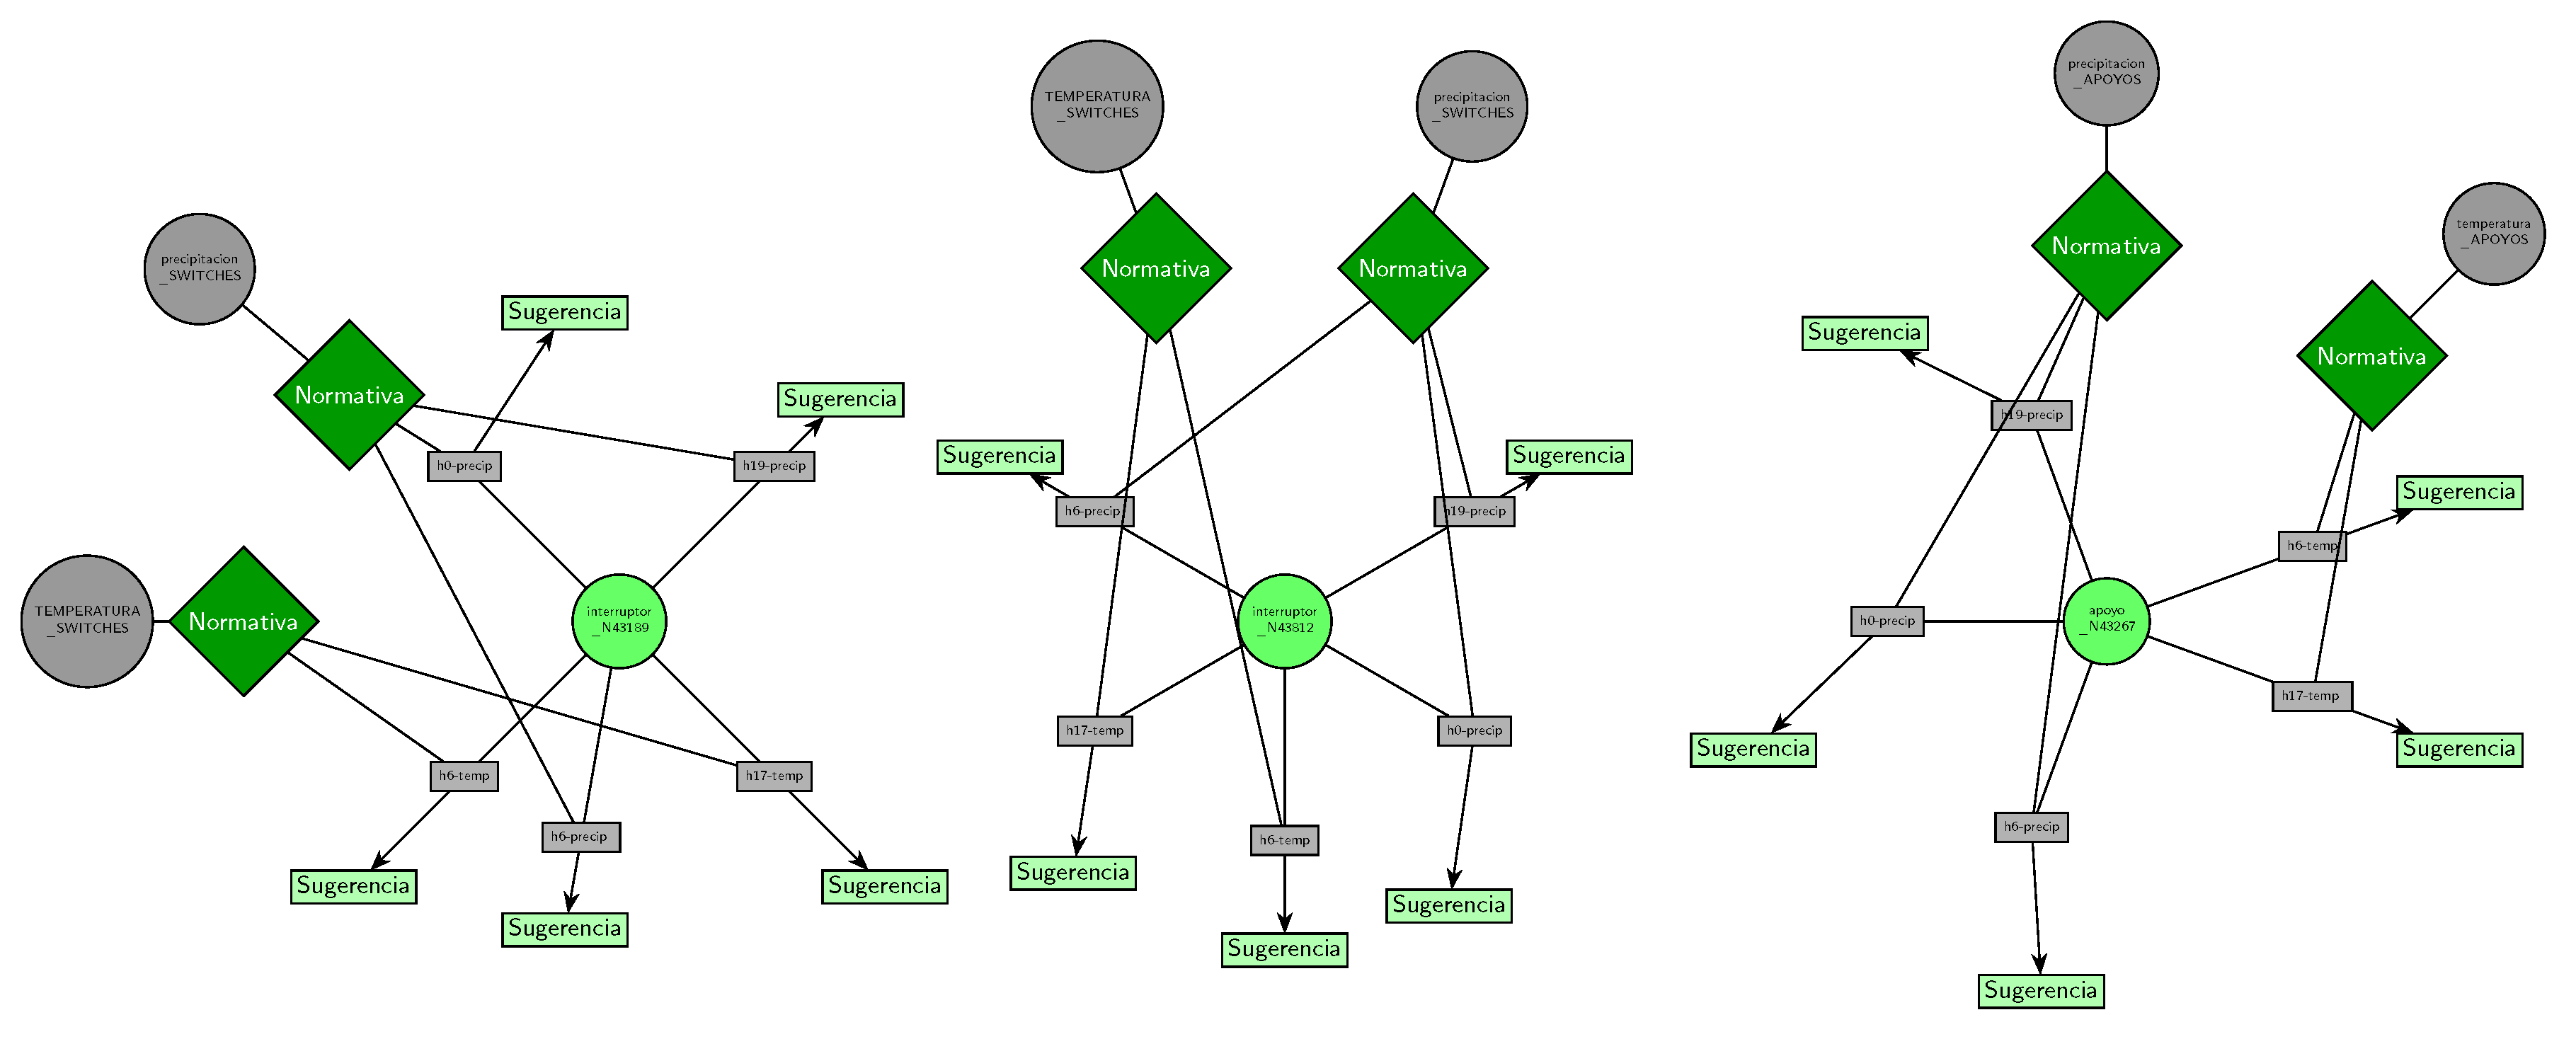

Table 1.
CHEC dataset structure by information block
| Classification | Data Block (Columns) | Description |
|---|---|---|
| Structural | Events Data [0–9) | Core interruption metadata for incident identification and context. |
| Structural | Switches Data [9–17) | Operational and typological attributes of switching devices. |
| Structural | Transformers Data [17–28) | Nameplate and lifecycle attributes of power transformers. |
| Structural | MV Network Data [28–51) | Physical and topological properties of medium-voltage line sections. |
| Exogenous | Climatic Data [51–293) | Short-horizon local weather indicators around network assets. |
| Exogenous | Lightning Data [293–305) | Proximity-based indicators of lightning activity near assets. |
| Exogenous | Vegetation Data [305–306) | Surrounding vegetation presence and dominant typology near the network. |
| Structural | Supports Data [306–314) | Structural attributes of poles and associated components. |
Table 2.
Overview of key characteristics for the LLMs selected for evaluation.
| LLM | #Params | Context Length | Max Tokens | Quantization |
|---|---|---|---|---|
| gpt-3.5-turbo[81] | Not disclosed | 16,385 | 16,385 | Not disclosed |
| gpt-4o [82] | Not disclosed | 128,000 | 128,000 | Not disclosed |
| gemini-2.0 [83] | 40B | 1,048,576 | 8,192 | Not disclosed |
| gemini-2.5 [84] | Not disclosed | 1–2M | 65,535 | Not disclosed |
| llama-3.1-8b [85] | 8B | 128,000 | Not specified | 4 bits |
| llama-3.2-1b [86] | 1B | 128,000 | 8,000 | 4 bits |
| qwen-2.5-1.5b [87] | 1.5B | 32,768 | 8,192 | 8 bits |
| qwen-2.5-7b[88] | 7B | 131,072 | 8,000 | 16 bits |
| deepseek-r1-7b [89] | 7B | 128,000 | 32,768 | 4 bits |
| deepseek-r1-1.5b [90] | 1.5B | 128,000 | 32,768 | 4 bits |
Table 3.
Representative examples from the question-answering (Q&A) dataset
| Query Type | Example Question | Reference Answer |
|---|---|---|
| Unstructured normative query | ¿Qué tipo de aislador se recomienda en zonas con alto nivel de contaminación? | Conforme a los lineamientos del RETIE (Título III, Capítulo 3) y la norma IEC 60815 sobre selección de aisladores para ambientes contaminados, se recomienda el uso de aisladores poliméricos o de silicona. Estos presentan una mejor hidrofobicidad y resistencia a la formación de corrientes de fuga en comparación con los de porcelana. Desde una perspectiva técnica, el especialista sugiere priorizar materiales con alta resistencia al tracking, realizar limpieza periódica y, en casos severos, implementar cubiertas anticontaminantes o recubrimientos RTV. |
| Structured query | ¿Cuántas interrupciones hubo entre el año 2019 y el año 2023? | Entre el año 2019 y el año 2023 se registró un total de 148,041 interrupciones, según los registros históricos de la base de datos de eventos de red. |
| Recommendation query | transformador_h6-rh — Humedad Relativa: 81% | Recomendación técnica integral conforme a RETIE, NTC 2050, IEC 60076 y lineamientos de mantenimiento CHEC. En ambientes con humedad relativa superior al 80%, se recomienda instalar deshumidificadores o deshidratadores de aire (gel de sílice), utilizar envolventes con protección IP55 o superior, aplicar recubrimientos anticorrosivos, incorporar sistemas de calefacción interna o ventilación forzada con filtros antihumedad, y verificar periódicamente la hermeticidad del tanque y las conexiones. Las pruebas de aislamiento y estanqueidad deben realizarse conforme a IEC 60076-1, IEEE C57.152 y ASTM D877. |
Table 4.
Comparative evaluation of predictive models for SAIFI estimation on the complete test set.
| Model | MSE | MAE | MAPE [%] | |
|---|---|---|---|---|
| ElasticNet | ||||
| RandomForest | ||||
| XGBoost | ||||
| TabNet |
Table 5.
Disaggregated predictive performance across the five municipalities contributing most significantly to SAIFI.
Table 5.
Disaggregated predictive performance across the five municipalities contributing most significantly to SAIFI.
| Municipality | Model | MSE | MAE | MAPE [%] | |
|---|---|---|---|---|---|
| DOSQUEBRADAS | RandomForest | ||||
| XGBoost | |||||
| ElasticNet | |||||
| TabNet | |||||
| MANIZALES | RandomForest | ||||
| XGBoost | |||||
| ElasticNet | |||||
| TabNet | |||||
| LA DORADA | RandomForest | ||||
| XGBoost | |||||
| ElasticNet | |||||
| TabNet | |||||
| CHINCHINÁ | RandomForest | ||||
| XGBoost | |||||
| ElasticNet | |||||
| TabNet | |||||
| VILLAMARÍA | RandomForest | ||||
| XGBoost | |||||
| ElasticNet | |||||
| TabNet |
Table 6.
Feeder-level predictive performance for the five distribution circuits with the highest SAIFI impact.
Table 6.
Feeder-level predictive performance for the five distribution circuits with the highest SAIFI impact.
| Feeder | Model | MSE | MAE | MAPE [%] | |
|---|---|---|---|---|---|
| ROS23L15 | RandomForest | ||||
| XGBoost | |||||
| ElasticNet | |||||
| TabNet | |||||
| BQE23L12 | RandomForest | ||||
| XGBoost | |||||
| ElasticNet | |||||
| TabNet | |||||
| ROS23L16 | RandomForest | ||||
| XGBoost | |||||
| ElasticNet | |||||
| TabNet | |||||
| ROS23L14 | RandomForest | ||||
| XGBoost | |||||
| ElasticNet | |||||
| TabNet | |||||
| DOR23L14 | RandomForest | ||||
| XGBoost | |||||
| ElasticNet | |||||
| TabNet |
Disclaimer/Publisher’s Note: The statements, opinions and data contained in all publications are solely those of the individual author(s) and contributor(s) and not of MDPI and/or the editor(s). MDPI and/or the editor(s) disclaim responsibility for any injury to people or property resulting from any ideas, methods, instructions or products referred to in the content. |
© 2025 by the authors. Licensee MDPI, Basel, Switzerland. This article is an open access article distributed under the terms and conditions of the Creative Commons Attribution (CC BY) license (http://creativecommons.org/licenses/by/4.0/).
Copyright: This open access article is published under a Creative Commons CC BY 4.0 license, which permit the free download, distribution, and reuse, provided that the author and preprint are cited in any reuse.


