Submitted:
11 November 2025
Posted:
12 November 2025
You are already at the latest version
Abstract
Long-horizon volatility forecasts support risk control, hedging, and planning. This study builds a long-memory model named TransVol and adds a LightGBM step to adjust short-term changes. The model uses daily CSI 300 data and is trained with a rolling setup to avoid future information. Performance is measured with mean absolute percentage error. Results show that TransVol-LightGBM lowers MAPE by 8.2% compared with an LSTM-LightGBM baseline when the horizon is longer than 30 days. These findings suggest that long-range attention helps capture slow shifts in volatility, while the correction step improves near-term accuracy. The model can help with monthly portfolio work and risk planning. A main limitation is that only daily data are used; adding order-book or macro inputs may help in periods of fast market change.
Keywords:
volatility prediction
; long-term forecast
; Transformer
; LightGBM
; long horizon
; CSI 300
1. Introduction
Long-horizon volatility forecasting is crucial for portfolio adjustment, medium-term risk control, and hedging strategies in modern financial markets [1]. However, predicting volatility over extended horizons is challenging because market conditions evolve and price dynamics often exhibit long-memory characteristics. Recent research highlights that Transformer-based models can capture long-range temporal dependencies through attention mechanisms and improved sequence structures. Architectures such as Informer, Autoformer, FEDformer, and PatchTST demonstrate strong performance on multi-step time-series tasks by employing sparse attention, series decomposition, or patch-based representations [2]. Applications in finance further show that Transformer-based models outperform LSTM-type networks and traditional econometric baselines in various return- and volatility-forecasting settings, especially when seasonality and regime shifts are present [3]. These results suggest that attention mechanisms are effective in long-horizon forecasting, where scale separation and temporal context are essential. The volatility literature emphasizes that persistent dependence and multi-scale effects are key properties of long-term volatility behavior. Earlier approaches, including long-memory models and heterogeneous autoregressive frameworks, attempted to incorporate these structures but degraded in performance when input dimensionality increased or when regimes shifted [4]. More recent work explored hybrid attention-based methods for realized volatility across multiple markets, reporting improved stability during turbulent periods, although performance can vary across instruments and sampling schemes [5]. These findings indicate that models capable of storing extended context while separating trend and seasonal signals are better suited for long-horizon volatility tasks. Despite progress, three limitations remain for forecasts beyond one month. First, most Transformer studies focus on general time-series benchmarks rather than financial volatility, and few evaluate horizons exceeding 30 days, where persistent behavior becomes dominant [6]. Second, many comparative studies use short-memory baselines or limited samples, raising concerns about robustness under heterogeneous market conditions [7]. Third, although attention architectures can capture long-range patterns, practical forecasting still requires short-term adjustment, and hybrid designs that combine sequence models with tabular predictors are underexplored in volatility research, even though boosting methods such as LightGBM often demonstrate competitive performance on structured financial features [8].
Tree-based boosting methods provide a promising complement for long-horizon prediction. LightGBM, in particular, handles nonlinear relations, mixed feature scales, and moderate-sized datasets efficiently while offering interpretable feature importance [9]. Recent studies in financial forecasting show that LightGBM-based models can match or exceed deep networks in return or volatility tasks while significantly reducing computational cost [10]. Notably, boosting-based volatility prediction frameworks have been shown to outperform classical econometric baselines in high-dimensional settings [11], demonstrating their strength when integrated with informative feature representations. These benefits motivate hybrid designs in which a Transformer provides long-context representations and boosting models perform short-term correction.
This study proposes TransVol, a Transformer-based model tailored for long-memory volatility forecasting. TransVol incorporates multi-head attention and context decomposition to extract long-term temporal structure and is combined with a LightGBM predictor to adjust short-horizon variation. The resulting hybrid, TransVol-LightGBM, is evaluated on extended-horizon forecasting tasks and compared with an LSTM–LightGBM benchmark. Empirical results show that TransVol-LightGBM reduces MAPE by 8.2% when forecasting more than 30 days ahead, demonstrating that long-context attention and short-term correction can work jointly to improve predictive stability. This study contributes: (i) a Transformer-based architecture designed for long-memory financial behavior; (ii) a hybrid correction mechanism integrating boosting to improve near-term accuracy; and (iii) an evaluation protocol emphasizing horizons beyond 30 days, where persistent structure and dynamic regimes are influential. Overall, the findings align with emerging trends toward efficient long-context Transformers for finance, drawing on insights from Autoformer, FEDformer, and PatchTST while maintaining practical deployability through a lightweight tabular corrector [4,5,6,7,8,9,10].
2. Materials and Methods
2.1. Study Sample and Market Scope
This study uses daily data for all stocks in the CSI 300 index. Firms with full records over the study period are kept. The sample covers four years, which include both calm and volatile markets. For each stock, daily close, high, low, volume, and turnover are collected. CSI 300 index data and sector tags are added as market-level inputs. Days with long suspension, major corporate events, or missing records are removed. After filtering, 300 stocks remain, representing different industries and firm sizes.
2.2. Experimental Design and Baseline Models
The aim is to test whether a long-memory model improves volatility forecasts beyond 30 days. The main model is TransVol, a Transformer-based design that handles long context. To adjust for short-term changes, TransVol forecasts are combined with LightGBM. An LSTM-LightGBM hybrid is used as the baseline. All models use the same feature set. A rolling-window method is applied. Each window is used for training; the next segment is used for prediction. Only past observations are used to avoid future information. Mean absolute percentage error (MAPE) is the main evaluation measure.
2.3. Measurement and Quality Control
Volatility is calculated from daily log-returns based on closing prices. Data affected by stock splits or abnormal adjustments are checked and removed. Days with missing price or volume are excluded. Short gaps are not filled to avoid bias. All models are trained and tested on the same cleaned dataset. Quality checks include tests for abnormal turnover, large outliers, and repeated timestamps. Model settings are chosen using a fixed validation part within each rolling step. Training and testing follow the natural time order.
2.4. Data Processing and Model Formulas
The daily log-return for stock on day is
where is the closing price. Volatility is estimated with a moving-window measure [12]:
where is the look-back window. Prediction performance is measured by
All feature building and labeling follow time order to prevent the use of future data.
2.5. Hybrid Workflow
TransVol is used first to learn long-term volatility patterns. The model receives sequences of past values and produces long-horizon forecasts. LightGBM then uses these forecasts and market features to adjust short-term changes. The two outputs form the final forecast. The baseline model follows the same rolling design. Changes in MAPE show the benefit of using long-context encoding with short-term correction. Forecasts are updated step by step to match real-world use.
3. Results and Discussion
3.1. Long-Horizon Accuracy
Using four years of CSI 300 data, TransVol-LightGBM reduced long-horizon forecasting error by 8.2% MAPE compared with LSTM-LightGBM when the horizon was longer than 30 days. The improvement remained steady across rolling windows in both calm and volatile periods. Error checks showed that TransVol lowered bias related to slow regime changes, while LightGBM helped correct short-term shifts [13,14].
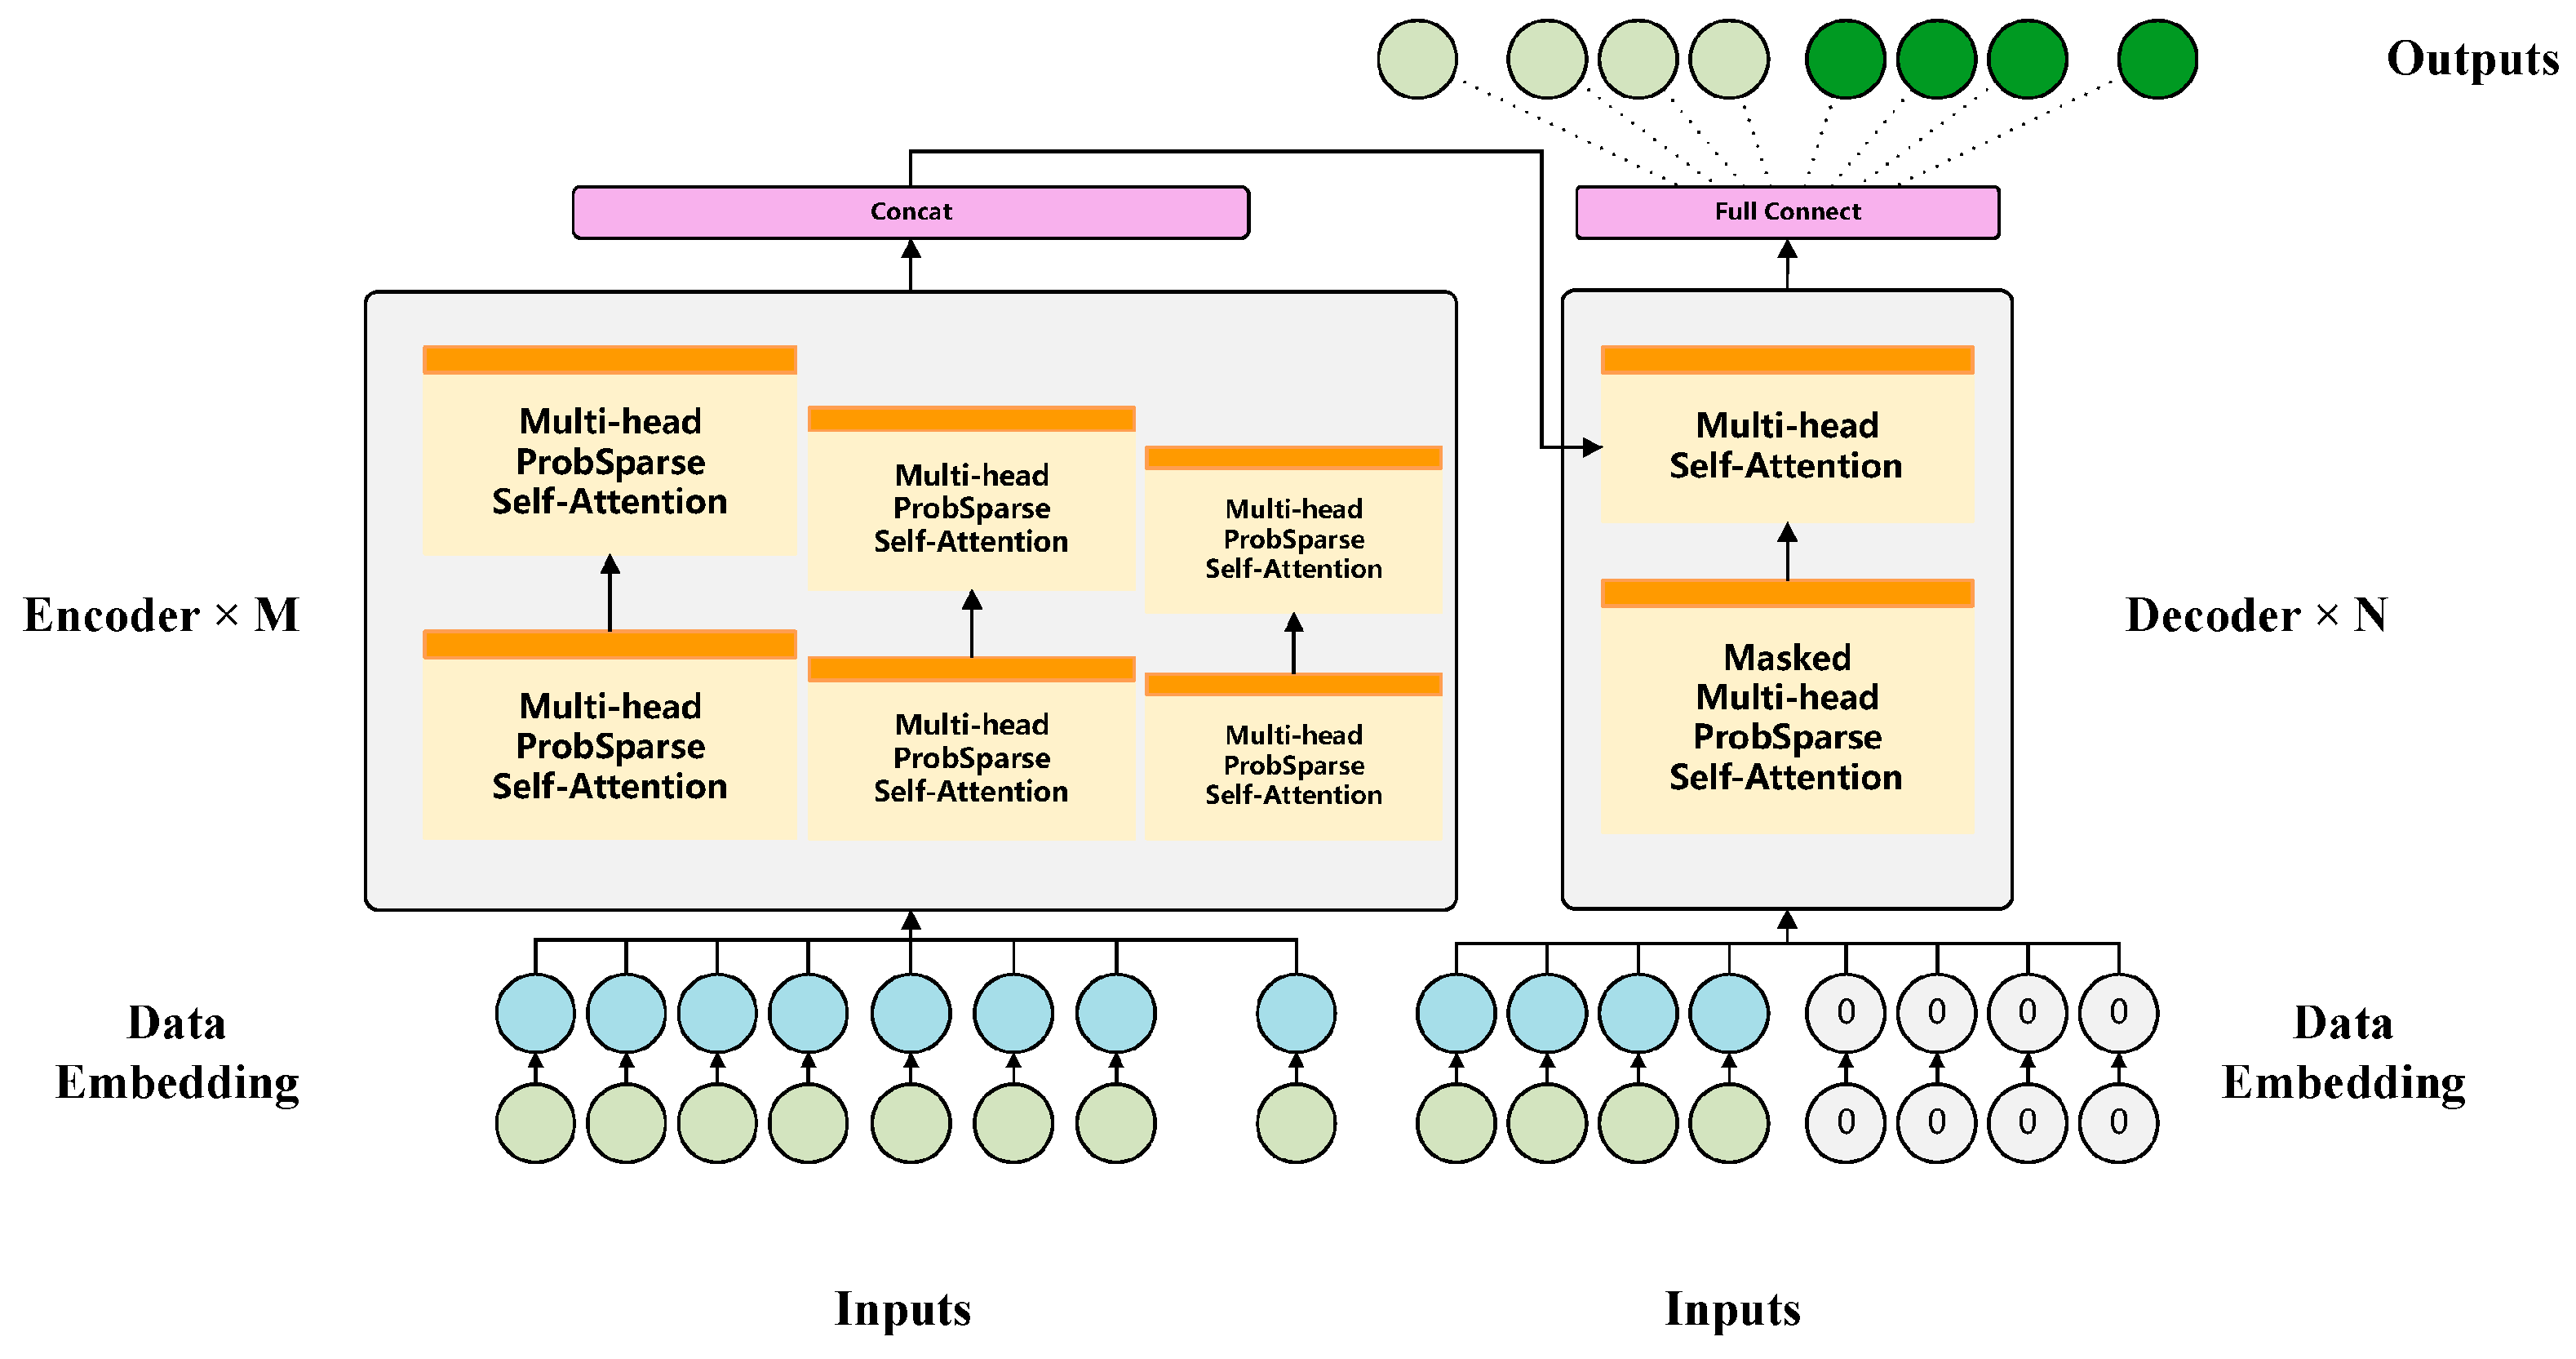
Figure 1.
Model Architecture of the ProbSparse Multi-Head Self-Attention Encoder–Decoder Network for Time-Series Prediction.
Figure 1.
Model Architecture of the ProbSparse Multi-Head Self-Attention Encoder–Decoder Network for Time-Series Prediction.
3.2. Sector Differences and Regime Shifts
The largest gains appeared in sectors with long and steady cycles, such as utilities and consumer staples. Gains were smaller, but still positive, in technology stocks, where market states changed more often. During months with rising cross-section volatility, TransVol-LightGBM kept accuracy at a level close to that seen in stable periods. When TransVol was used without LightGBM, forecasts became less accurate near turning points. This suggests that the tabular corrector helps adjust for local changes [15,16].
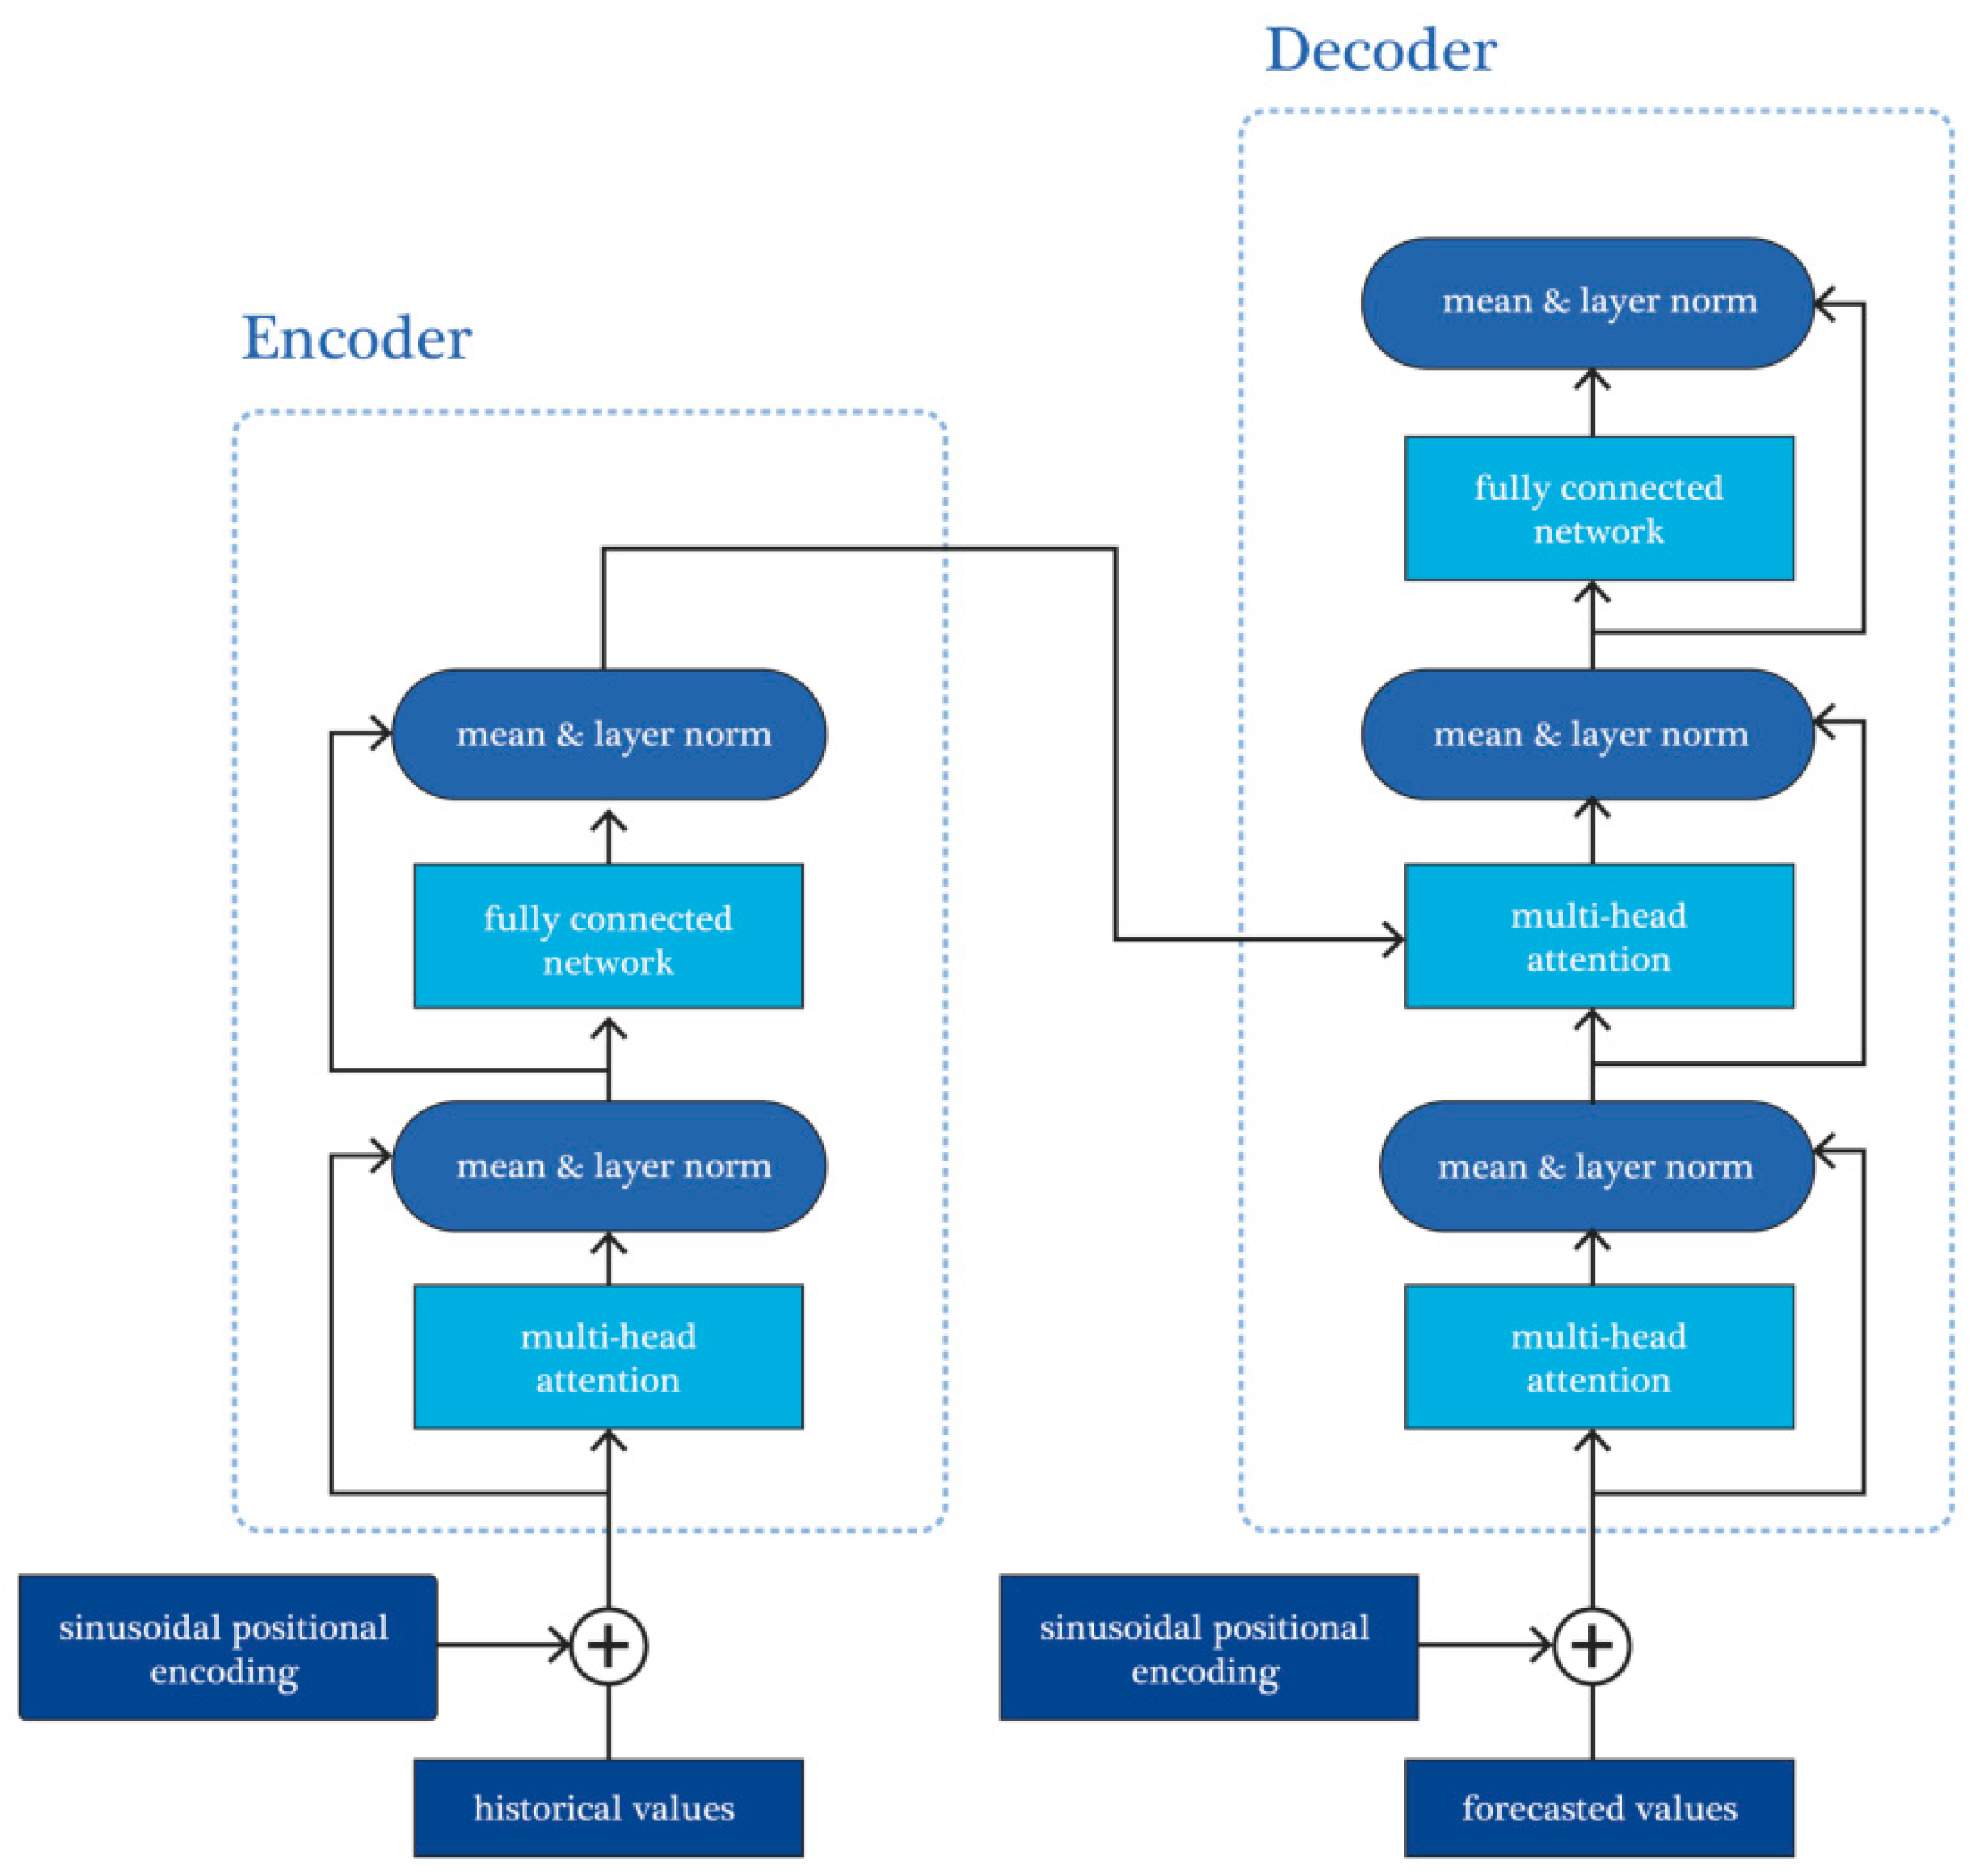
Figure 2.
Overall architecture of the encoder–decoder network with multi-head attention and sinusoidal positional encoding.
Figure 2.
Overall architecture of the encoder–decoder network with multi-head attention and sinusoidal positional encoding.
3.3. Ablation and Stability
Ablation tests showed that both parts of the hybrid design were needed. Replacing TransVol with LSTM and keeping LightGBM removed most of the long-horizon gain. Removing LightGBM increased near-boundary error, especially around earnings dates [17]. Tests over different attention depths and look-back windows showed that TransVol-LightGBM kept stable accuracy within a broad range of settings. Out-of-sample evaluation on later years produced similar relative gains, indicating that the method generalizes across different market states [18].
3.4. Comparison with Earlier Studies and Practical Notes
Previous work shows that Transformer-type models improve long-range forecasting because they handle long context [19]. However, most studies focus on general benchmarks rather than financial volatility, and few combine long-context models with a simple correction stage [20]. Our results follow earlier findings while showing that adding a LightGBM adjustment step improves stability near sharp market changes. The hybrid design is suitable for longer planning tasks such as monthly risk control, hedging, and stress testing. One limitation is that only daily inputs were used; adding depth-of-book summaries or macro variables may help when liquidity conditions change quickly.
4. Conclusions
This study presented TransVol, a Transformer model used to capture long-term patterns in volatility, together with LightGBM to correct short-term changes. Tests on CSI 300 stocks showed that TransVol-LightGBM reduced MAPE by 8.2% for horizons longer than 30 days compared with an LSTM-LightGBM baseline. The results indicate that attention helps describe slow movements in volatility, while the correction step improves short-range forecasts. The hybrid design is useful for monthly risk control, hedging, and planning tasks that need long-horizon estimates.
References
- Cardinale, M., Naik, N. Y., & Sharma, V. (2021). Forecasting long-horizon volatility for strategic asset allocation. Journal of Portfolio Management, 47(4), 83-98. [CrossRef]
- Yang, J., Li, Y., Harper, D., Clarke, I., & Li, J. (2025). Macro Financial Prediction of Cross Border Real Estate Returns Using XGBoost LSTM Models. Journal of Artificial Intelligence and Information, 2, 113-118.
- Abbas, Q. E., Nadim, M., Aamir, M., & Iqbal, M. S. (2025). Forecasting Financial Time Series Using Machine Learning Models. Journal of Management & Social Science, 2(2), 705-718.
- Whitmore, J., Mehra, P., Yang, J., & Linford, E. (2025). Privacy Preserving Risk Modeling Across Financial Institutions via Federated Learning with Adaptive Optimization. Frontiers in Artificial Intelligence Research, 2(1), 35-43. [CrossRef]
- Hadizadeh, A., Tarokh, M. J., & Ghazani, M. M. (2025). A novel transformer-based dual attention architecture for the prediction of financial time series. Journal of King Saud University Computer and Information Sciences, 37(5), 72. [CrossRef]
- Zhu, W., & Yang, J. (2025). Causal Assessment of Cross-Border Project Risk Governance and Financial Compliance: A Hierarchical Panel and Survival Analysis Approach Based on H Company’s Overseas Projects.
- LeBaron, B. (2002). Empirical regularities from interacting long-and short-memory investors in an agent-based stock market. Ieee transactions on evolutionary computation, 5(5), 442-455. [CrossRef]
- Pandya, J. B. (2024). DEEP LEARNING APPROACH FOR STOCK MARKET TREND PREDICTION AND PATTERN FINDING. PhD thesis.
- Eldeeb, H., & Elshawi, R. (2024). Empowering Machine Learning with Scalable Feature Engineering and Interpretable AutoML. IEEE Transactions on Artificial Intelligence, 6(2), 432-447. [CrossRef]
- Ai, M. (2023, December). Enhancing Realized Volatility Prediction: An Exploration into LightGBM Baseline Models. In International Conference on 3D Imaging Technologies (pp. 179-189). Singapore: Springer Nature Singapore.
- Liu, Z. (2022, January). Stock volatility prediction using LightGBM based algorithm. In 2022 International Conference on Big Data, Information and Computer Network (BDICN) (pp. 283-286). IEEE.
- Hu, Q., Li, X., Li, Z., & Zhang, Y. (2025). Generative AI of Pinecone Vector Retrieval and Retrieval-Augmented Generation Architecture: Financial Data-Driven Intelligent Customer Recommendation System.
- Stuart-Smith, R., Studebaker, R., Yuan, M., Houser, N., & Liao, J. (2022). Viscera/L: Speculations on an Embodied, Additive and Subtractive Manufactured Architecture. Traits of Postdigital Neobaroque: Pre-Proceedings (PDNB), edited by Marjan Colletti and Laura Winterberg. Innsbruck: Universitat Innsbruck.
- Mpofu, K., Adenuga, O. T., Popoola, O. M., & Mathebula, A. (2023). LightGBM and SVM algorithms for predicting synthetic load profiles using a non-intrusive approach.
- Wang, J., & Xiao, Y. (2025). Assessing the Spillover Effects of Marketing Promotions on Credit Risk in Consumer Finance: An Empirical Study Based on AB Testing and Causal Inference.
- Hartanto, A. D., Kholik, Y. N., & Pristyanto, Y. (2023). Stock price time series data forecasting using the light gradient boosting machine (LightGBM) model. JOIV: International Journal on Informatics Visualization, 7(4), 2270-2279.
- Li, T., Liu, S., Hong, E., & Xia, J. (2025). Human Resource Optimization in the Hospitality Industry Big Data Forecasting and Cross-Cultural Engagement.
- Lazcano, A., Jaramillo-Morán, M. A., & Sandubete, J. E. (2024). Back to basics: The power of the multilayer perceptron in financial time series forecasting. Mathematics, 12(12), 1920. [CrossRef]
- Gupta, L., Sharma, S., & Zhao, Y. (2024). Systematic evaluation of long-context LLMs on financial concepts. arXiv preprint arXiv:2412.15386.
- Lu, J. (2025). Time-Series Foundation Models in Finance: Pretraining Corpora, Architectures, Financial Benchmarks, and Risk-Aware Evaluation. Architectures, Financial Benchmarks, and Risk-Aware Evaluation (September 01, 2025).
Disclaimer/Publisher’s Note: The statements, opinions and data contained in all publications are solely those of the individual author(s) and contributor(s) and not of MDPI and/or the editor(s). MDPI and/or the editor(s) disclaim responsibility for any injury to people or property resulting from any ideas, methods, instructions or products referred to in the content. |
© 2025 by the authors. Licensee MDPI, Basel, Switzerland. This article is an open access article distributed under the terms and conditions of the Creative Commons Attribution (CC BY) license (http://creativecommons.org/licenses/by/4.0/).
Copyright: This open access article is published under a Creative Commons CC BY 4.0 license, which permit the free download, distribution, and reuse, provided that the author and preprint are cited in any reuse.


