
Submitted:
11 November 2025
Posted:
12 November 2025
You are already at the latest version
Abstract
Piggery farming is the largest source of livestock manure in South Korea, generating about 40% of total livestock waste annually. Yet greenhouse gas (GHG) emission data from piggery wastewater treatment systems remain limited, with most studies focused on farm slurry storage rather than process-level emissions. This study quantified methane (CH₄) and nitrous oxide (N₂O) fluxes from a full-scale piggery wastewater treatment facility in, to develop process, season, specific and diurnal specific emission fluxes. Continuous monitoring with a laser-based gas analyzer and customized PVC air-pool chamber was conducted across raw, anaerobic, and aerobic wastewater treatment stages. Mean CH₄ fluxes ranged 1.1-15.6 mg s⁻¹ m⁻², peaking in summer, while N₂O fluxes ranged 0.01-17971 mg s⁻¹ m⁻², with maxima in fall. Aeration tank II and Anaerobic tank I were the dominant emission stages, with night and intra-day peaks. Statistical analysis identified treatment stage and temperature as the main controls on CH₄ variability (p = 0.006 to 0.014), whereas N₂O showed weaker climatic sensitivity. The results provide refined emission factors and emphasize that aeration optimization and denitrification control are key to reducing GHG emissions from livestock wastewater systems in warm, humid regions.
Keywords:
piggery wastewater
; methane
; nitrous oxide
; emission factors
; temperature
; aeration
; denitrification
; South Korea
1. Introduction
Greenhouse gas (GHG) emissions, particularly methane (CH₄) and nitrous oxide (N₂O), are critical drivers of global climate change. Agriculture contributes 9-18% of total anthropogenic GHG emissions, with livestock manure management recognized as a major contributor to CH₄ and N₂O emissions [1]The Paris Agreement (2015) and related climate policies have emphasized the need for accurate GHG quantification to guide mitigation strategies [2]. However, reliable estimation of emissions from livestock manure management remains challenging due to methodological inconsistencies, spatial and temporal variability, and gaps in emission factor databases [3,4].
South Korea has pledged carbon neutrality by 2050[5], identifying GHG mitigation in livestock production a priority. As of 2023, the total livestock population reached approximately 190million, with swine accounting for 11.09 million (5.8%)[6]. Recent national statistics indicate that piggery is the single largest source of livestock manure in Korea, contributing roughly 39% (≈19.7 million tons yr⁻¹) of the total 50.9 million tons produced annually [7]. Despite this significance, comprehensive emission factor data for CH₄ and N₂O from piggery farm wastewater treatment systems remain scarce, as most previous research have focused on emissions slurry pits and barns. This has hindered accurate and more specific emission quantification needed for national inventory refinement and climate policy planning [8,9].
Accurate quantification of CH₄ and N₂O emissions from piggery manure systems remains technically demanding because emission rates vary widely depending on measurement methods and site conditions. Variability in chamber configuration, sampling frequency, temperature, and manure characteristics leads to inconsistencies across studies [8,10,11,12]. Especially, micrometeorological and flux-gradient methods often show large uncertainties when applied to complex waste treatment environments such as lagoons and aeration basins [13,14]. Moreover, environmental variability plays a dominant role, where temperature, oxygen availability, and microbial activity strongly influence emission dynamics. CH₄ emissions typically increase by 150 to 200% during summer, while N₂O peaks in cooler seasons when denitrification becomes more favorable [13,14]. A few of the recent empirical models explicitly capture these seasonal and operational variations, leading to large discrepancies in current inventories [15,16].
Recent technological advances have improved the precision of GHG flux monitoring in agricultural systems. Laser-based gas analyzers (e.g., Los Gatos Research, LGR) enable real-time CH₄ and N₂O measurements with high sensitivity and minimal interference [17,18]. Fourier Transform Infrared (FTIR) spectroscopy allows multi-gas quantification in variable humidity and temperature conditions [19], while Automated Gas Sampling Chambers (AGSCs) facilitate continuous monitoring over diurnal and seasonal scales[20]. Despite these advances, few studies have applied such high-resolution approaches to Korean piggery wastewater systems, limiting the development of localized EFs essential for national GHG inventories [21]
This study aims to measure CH₄ and N₂O emissions from wastewater treatment facility for a commercial pig barn, and analysis of seasonal and treatment condition-specific emission characteristics. By integrating the results of this study with statistical modeling, this research will contribute to the refinement of data-driven manure management strategies, providing empirical evidence for integrating emission monitoring into national carbon-neutral livestock framework. The findings also will enhance global understanding of GHG dynamics in warm, humid agricultural environments, where aeration, temperature, and redox processes exert dominant control over CH₄ and N₂O formation.
2. Materials and Methods
2.1. Waste Water Treatment Plant and Weather Conditions
The study was conducted at a commercial pig farm located in Baeksan-myeon, Jojong-ri, Kimje City, South Korea (35°52'1.31"N, 126°52'41.31"E). Figure 1 Korea’s four-season system used in this study for seasonal flux analysis, and Table 1 show the average weather monthly characteristics of the study area during the experiment period. The experimental site geographical location and layout of the swine wastewater treatment system used for GHG monitoring are represented in Figure 2. The pig farm houses approximately 9,000 pigs, generating an average 16.47 of solid waste and 25.65of effluent. The treatment plant is a self-purification wastewater treatment system designed based on aerobic and anaerobic processes to degrade organic content at multiple treatment stages (Figure 2b).
From Figure 2, the treatment process begins at Tank (a), where raw waste is received before undergoing a separation process at (b) to divide solid and liquid waste fractions. The liquid waste is then stored in liquid waste tanks (c) and (d) before being pumped into the treatment unit. The wastewater first accumulates in an underground storage tank (Stage 1) and then moved to the anaerobic treatment stage (Stage 2), where microorganisms break down organic matter under oxygen-deficient conditions, releasing GHG as a byproduct. Following this, the waste undergoes aerobic treatment (Stages 3 to 7), where organic matter is further degraded in aeration tanks (Aerobic 1–5) under oxygen-rich conditions. Secondary anaerobic treatment occurs in Anaerobic Tank 2 (Stage 8), followed by secondary aerobic treatment in Aerobic Tank 2 (Stage 9) before final discharge.
Figure 2c provides a detailed layout of the wastewater handling process, technical specifications of the treatment unit, and GHG monitoring points considered in this study. The CH₄ and N₂O emissions were monitored at three main stages: pre-treatment (raw waste storage), primary treatment (anaerobic and aerobic stages), and secondary treatment (anaerobic and aerobic stages).
2.2. GHGs Collection and Measurement
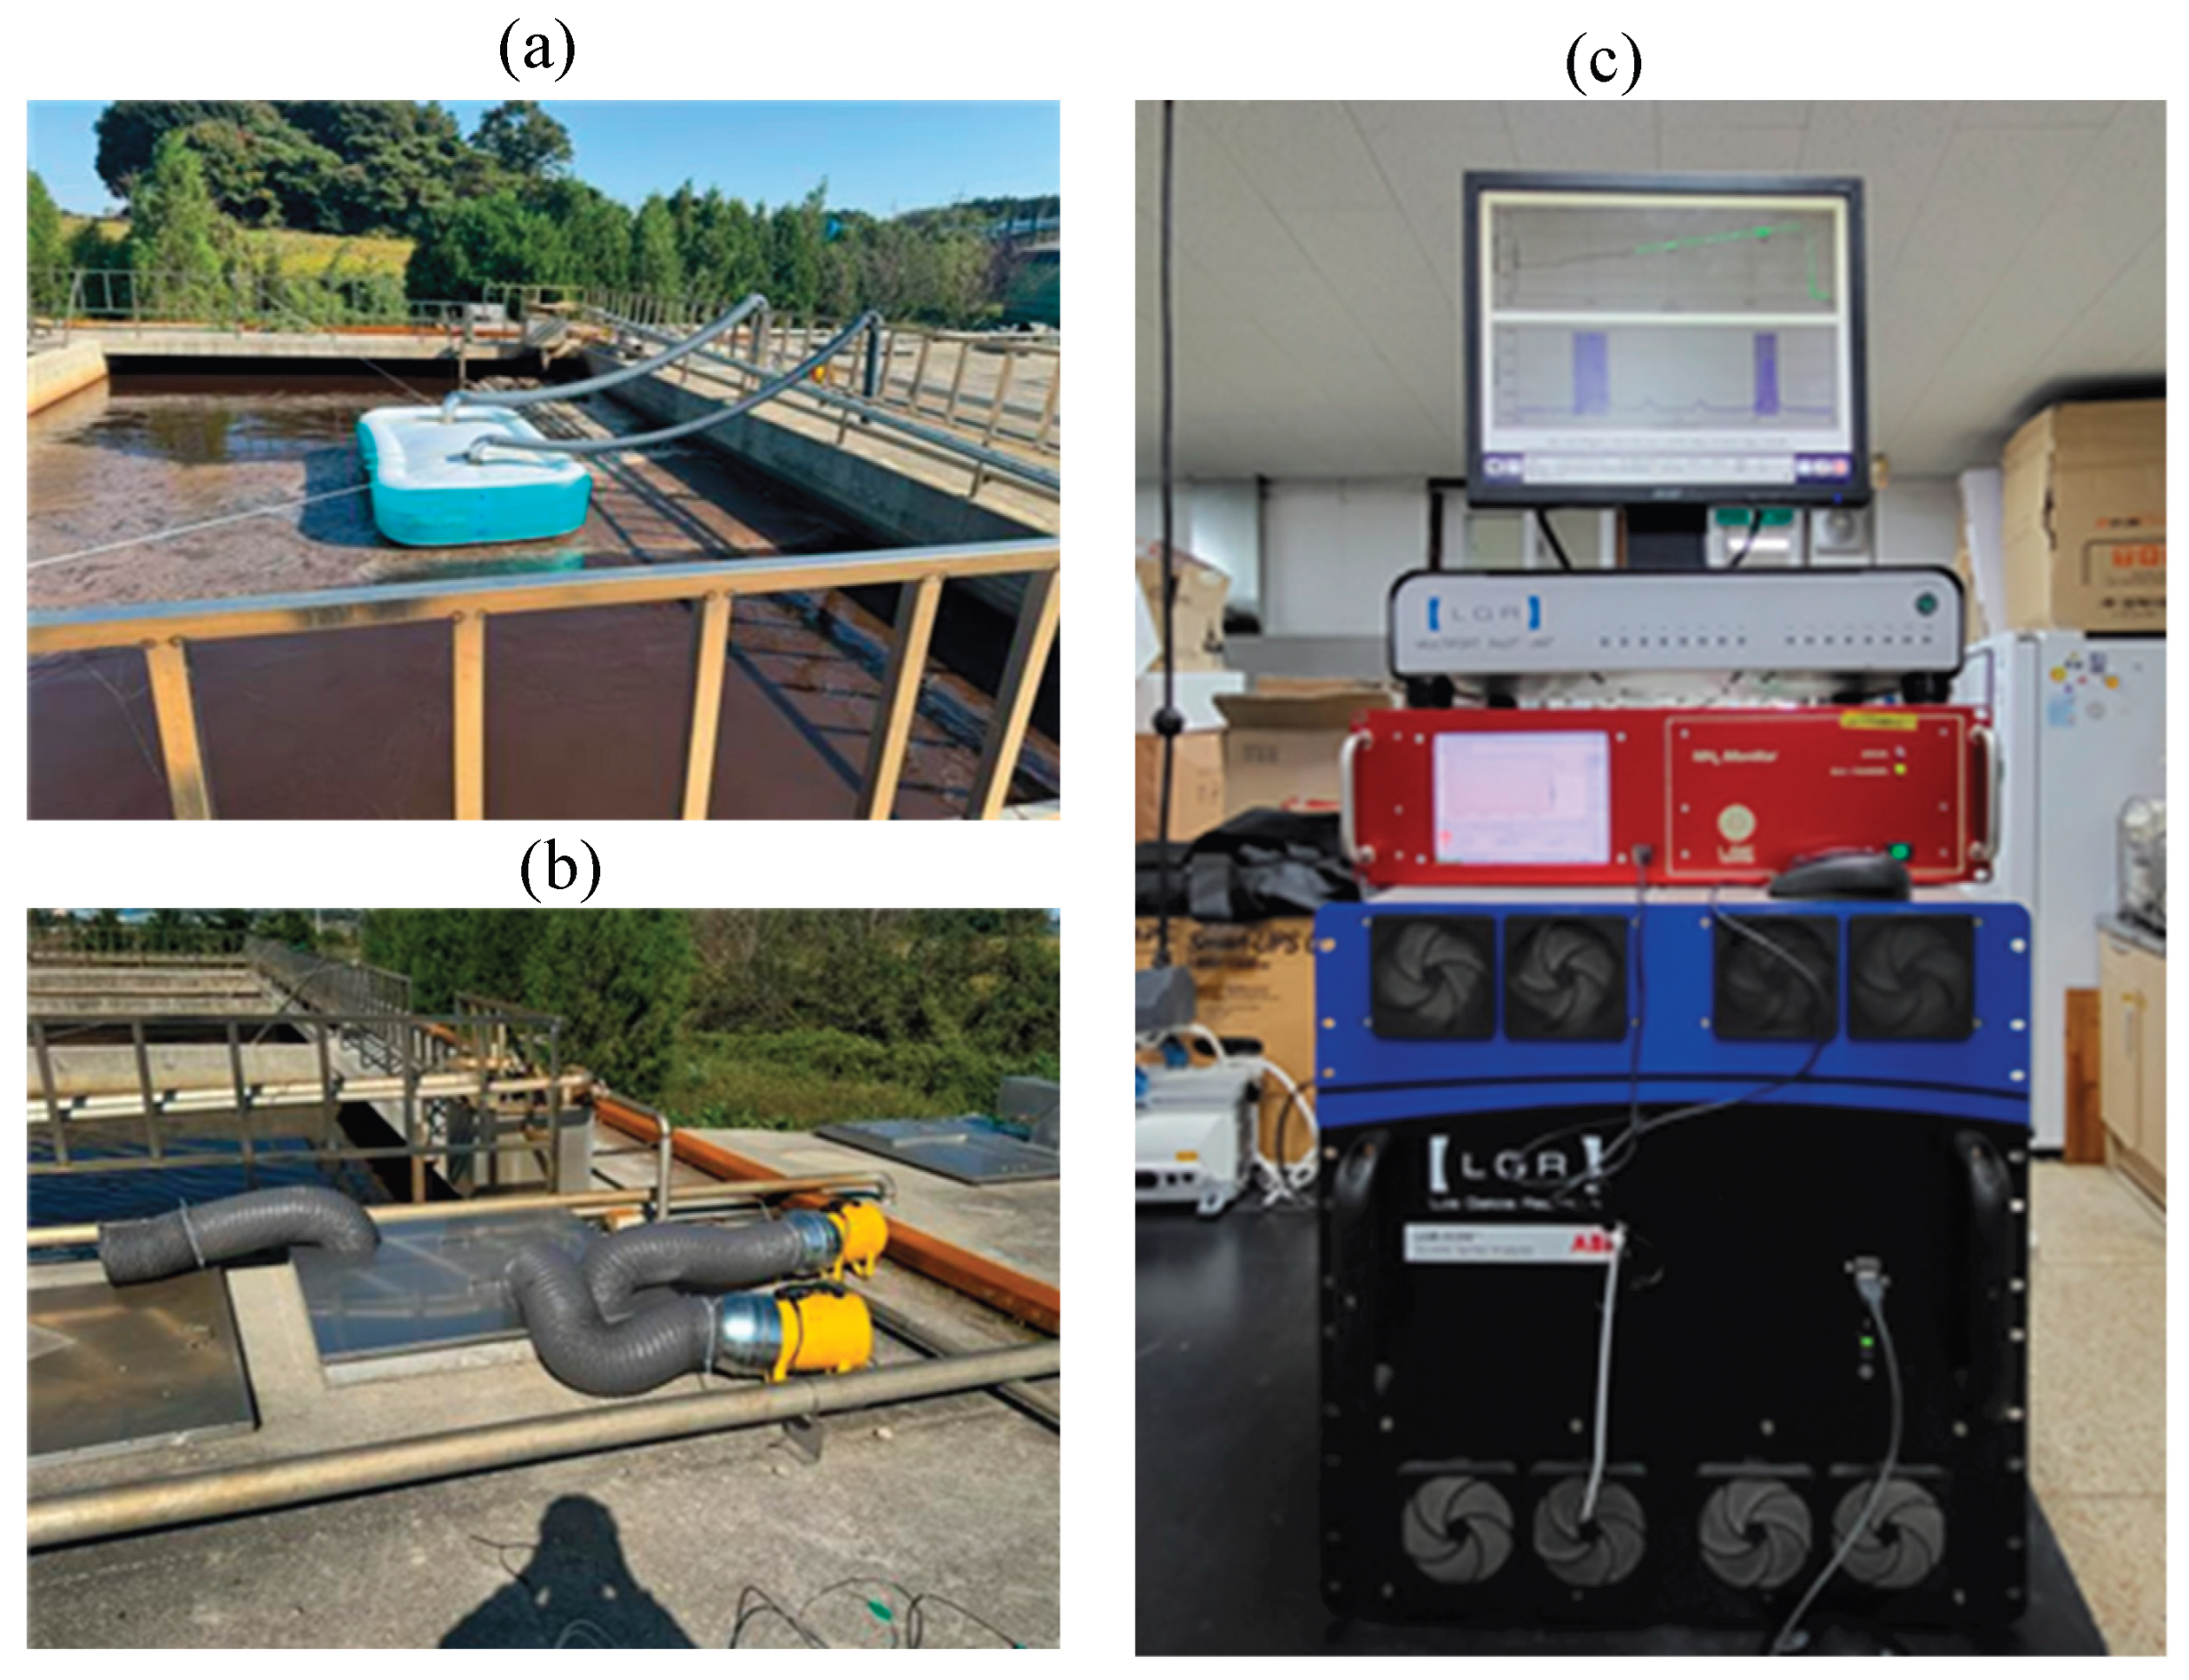
To facilitate continuous gas collection and prevent material corrosion from wastewater emissions, a custom floating PVC air pool system was designed and implemented at Stages 2, 3, 8, and 9 of the wastewater treatment process. The PVC air pool chamber measured 1.22 wide, 2.44 long, and 0.6 high, providing a gas collection area of 2.98 The air collection system is illustrated in Figure 3. It consisted of the floating PVC chamber, flexible air ducts, an air blower, and Teflon tubing for gas transport to the analyzer. Two air ducts were tightly attached to the top of the chamber to prevent leakage. An air blower was connected to the inlet duct, forcing air through the system at 67 , enabling gas sampling in both the inlet and outlet ducts (Figure 4a). Due to the underground location and narrow inlet opening of the raw wastewater storage tank (Stage 1), the PVC air pool system was unsuitable for this stage. Instead, a stainless-steel cover with two inlet holes and one outlet hole was installed over the tank inlet (Figure 4b). Air ducts were tightly fitted into the inlet holes, with each duct connected to a 117 air blower to extract gas emissions efficiently. The collected air was transported through the outlet duct for sampling and analysis.
GHG concentrations were measured using a Los Gatos Research (LGR) laser-based gas analyzer (Figure 4c. Teflon tube (0.25-inch inner diameter) was used to transport the collected gas samples, ensuring minimal contamination or adsorption losses. Real-time data acquisition was performed at 10 measurements per second, with continuous sampling from 16 locations covering both inlet and outlet emissions. Environmental parameters, including temperature, humidity, and wind speed were measured to analyses external influences on gas release. Additionally, flow rates and air temperature at outlet and inlets ducts were also measured. The collected data were analyzed to calculate CH₄ and N₂O flux rates across different treatment stages, contributing to an improved understanding of GHG emissions from livestock wastewater treatment systems.
2.3. Data Analysis and Emission Flux Calculation
Figure 3.
Schematic illustration of gas collection and monitoring setup, showing the isometric and cross-sectional views of the PVC air pool system. The setup includes an air blower airflow, Teflon sampling tubes for inlet and outlet gas collection, and a laser gas spectrometer (LGS) unit for real-time CH₄ and N₂O measurement.
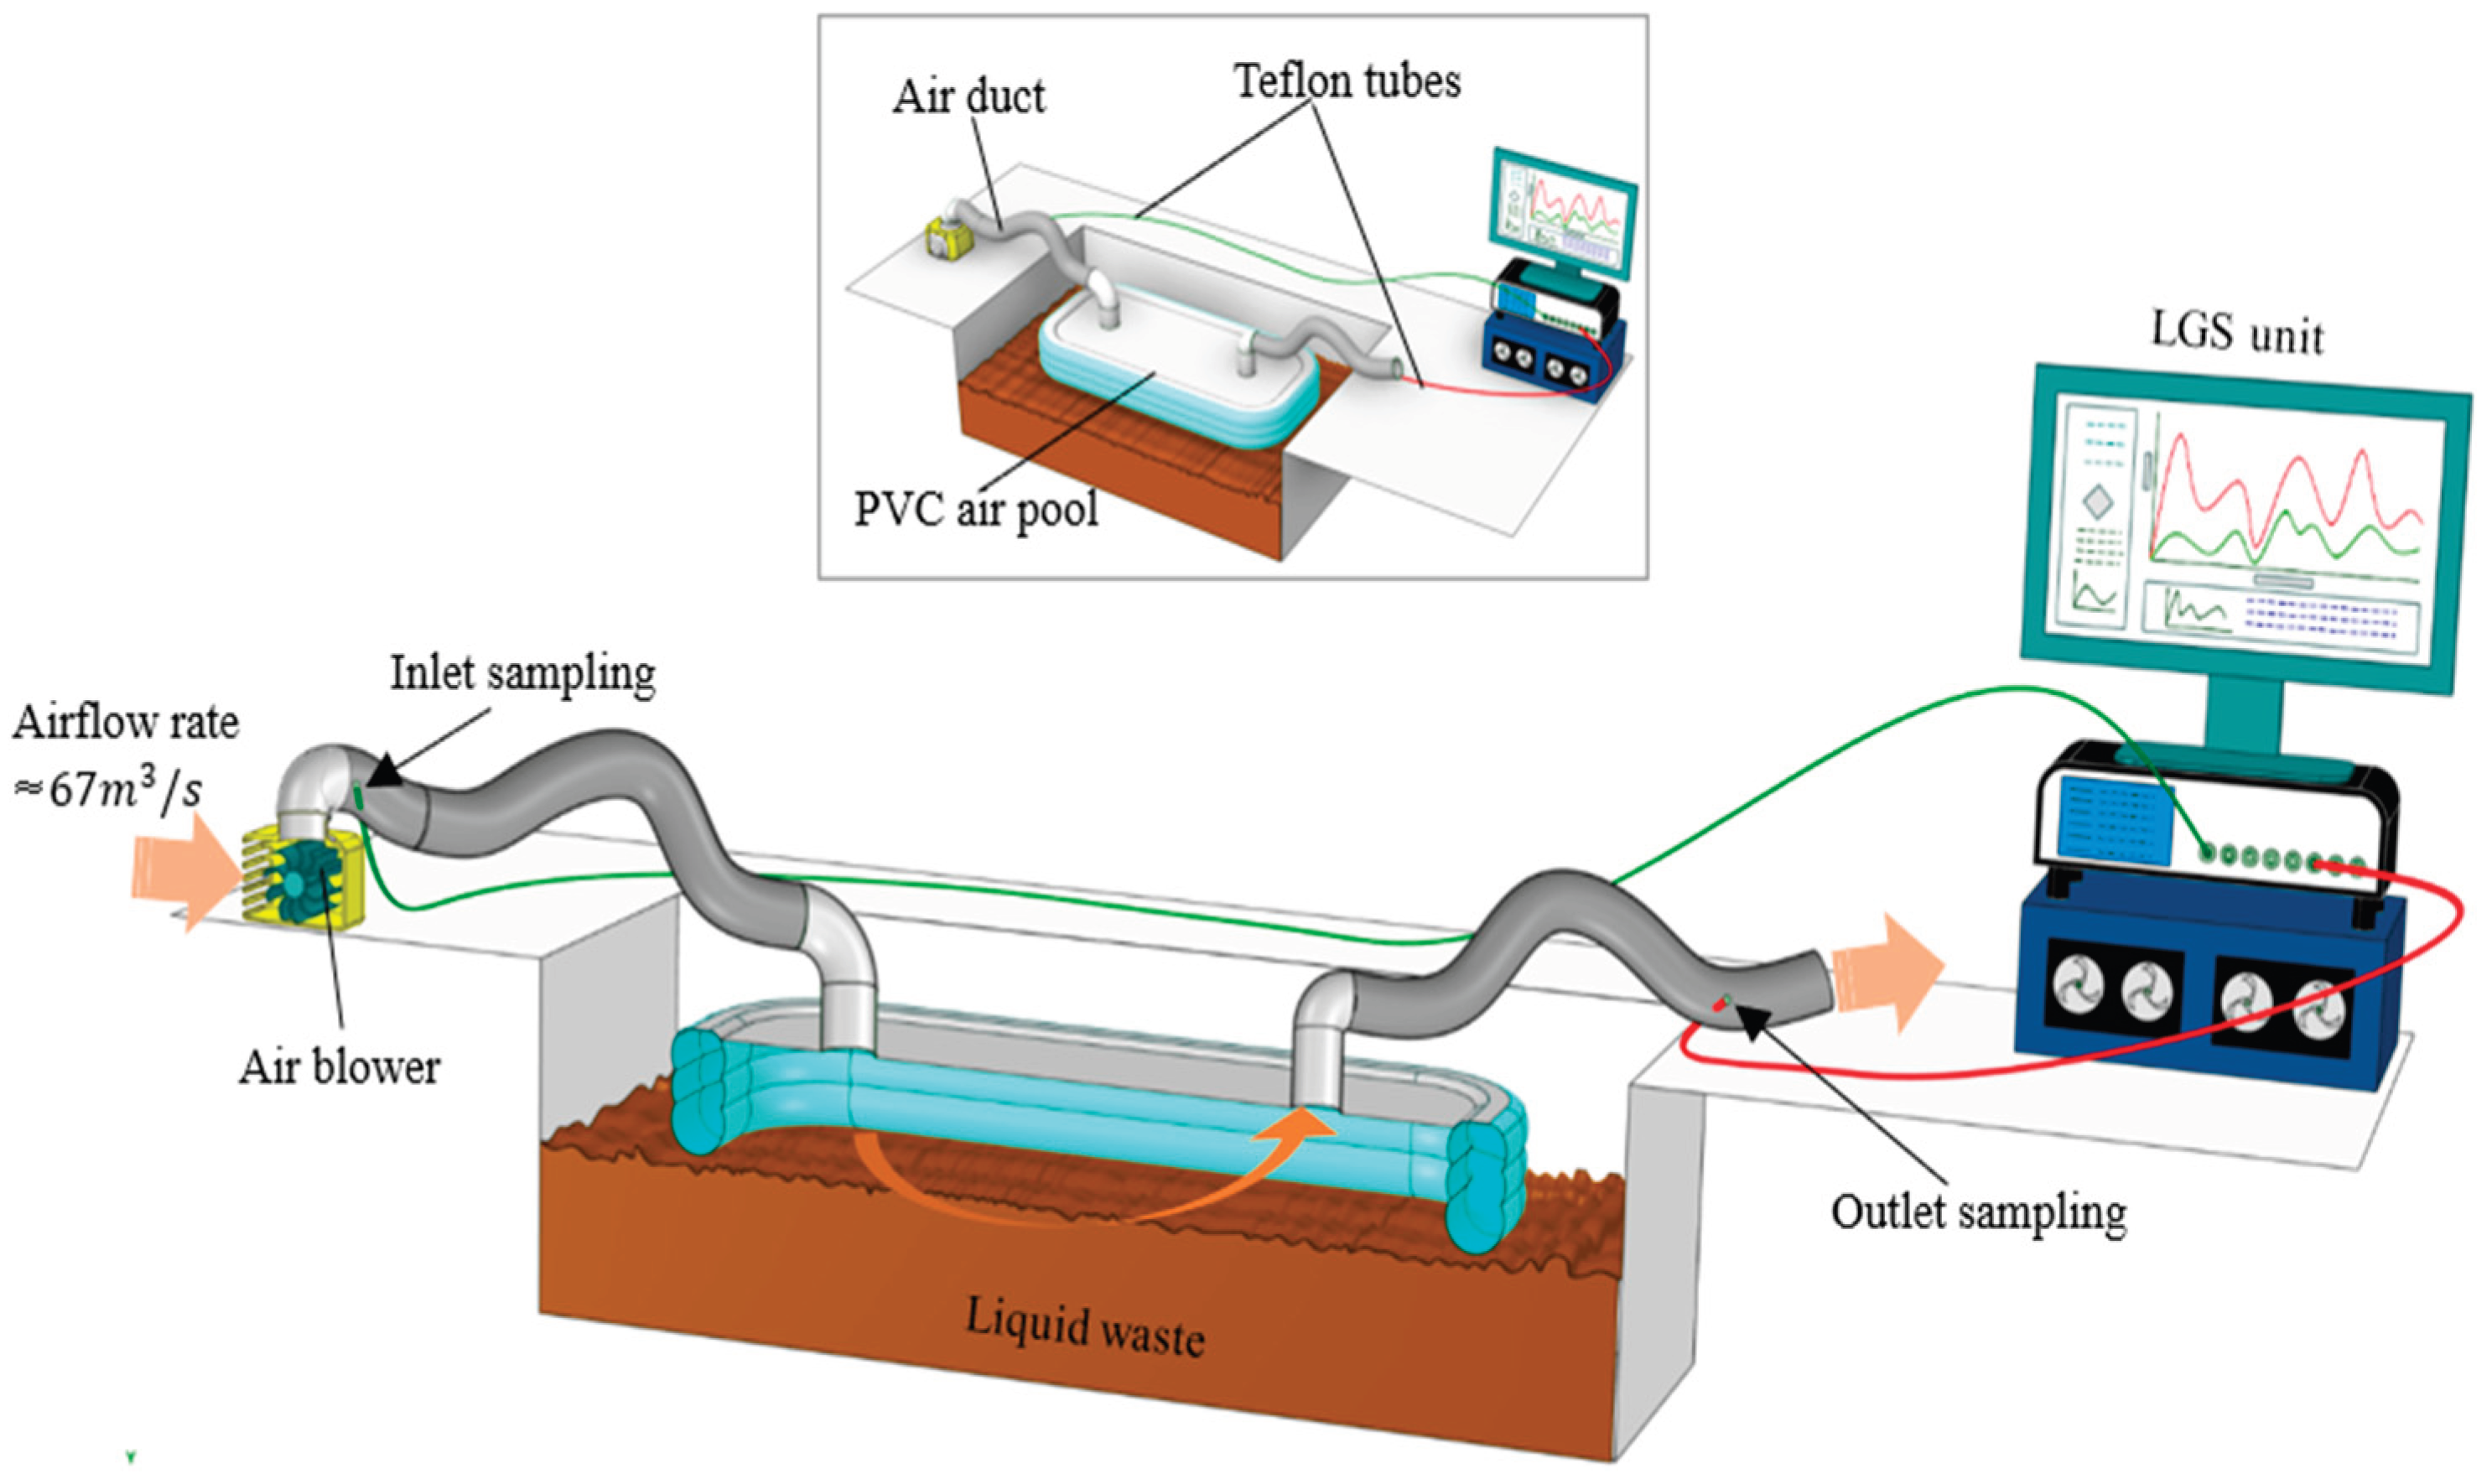
Figure 4.
Field installation and analytical system used for GHG flux monitoring. (a) Floating PVC air pool chamber deployed at monitoring stages 2, 3, 8, and 9; (b) gas collection and transfer setup at the raw-water storage tank (stage 1) and (c) Laser Gas Analyzer (LGR) unit.
Figure 4.
Field installation and analytical system used for GHG flux monitoring. (a) Floating PVC air pool chamber deployed at monitoring stages 2, 3, 8, and 9; (b) gas collection and transfer setup at the raw-water storage tank (stage 1) and (c) Laser Gas Analyzer (LGR) unit.
2.4. CH₄ and N₂O Analysis
The collected GHG emission data were analyzed to assess seasonal and treatment stage variations in CH₄ and N₂O fluxes. Seasonal classification was based on local meteorological records, and data were grouped into spring, summer, fall and winter to study environmental effects on emission trends. To characterize diurnal behavior, all hourly fluxes were assigned to four 6 hours periods including morning (06:00 to 12:00), afternoon (12:00 to 18:00), evening (18:00 to 00:00), and night (00:00 to 06:00). For treatment-stage characterization, emission data were categorized according to pre-treatment (raw waste storage), primary treatment (anaerobic tank I and aerobic I), and secondary treatment (anaerobic II and aerobic II) stages.
Descriptive statistics (mean, standard deviation, coefficient of variation) were used to characterize greenhouse gas. The differences among groups were evaluated using one-way ANOVA, followed by Tukey’s HSD multiple comparison test (p < 0.05) where appropriate. To quantify the influence of environmental factors, linear regression was applied with temperature and relative humidity as covariates based on the model as shown in Equation 1. All statistical analyses and graphical visualizations were performed using OriginPro 2025b SR1 (OriginLab Corporation, Northampton, MA, USA).
CH4 and N2O flux calculation
Flux rates were calculated using standard gas flux equations, integrating measured gas concentrations, air flow rates, and environmental parameters (Equation 2).
where is the greenhouse house gas flux, and are the outlet and inlet greenhouse gas concentrations (, is the atmospheric air pressure (pa), is the air flow rate through the chamber system (, is the ambient air temperature(K), is the molar gas constant ( and A is the effective area of the chamber (
3. Results and Discussion
3.1. Diurnal GHG Flux Characteristics
Diurnal CH₄ and N₂O fluxes exhibited visible temporal patterns across the 6-hours interval averaged data. CH₄ fluxes were highest during the evening and night hours with means of 7.2 and 7.0 respectively. A secondary peak in the morning hours (5.8 ) was also observed. CH₄ flux was lowest during the afternoon hours (3.2 minimum in the afternoon (3.2 ). Diurnal CH₄ fluxes are characteristic of a relatively narrow range, with maximum coefficient of variation (CV) in the morning hours (3.4) and minimum CV (1.7) during the night period.
N₂O fluxes on the other hand showed significant diurnal fluctuations with highest mean peak in the morning hours (3174.6 ), followed by a secondary maximum during night period at 2056.5 , while the afternoon emissions were minimal at 7.2 and 4.6 times lower than the morning and evening emissions respectively. Together with highest CVs, these fluctuation patterns reveal that N₂O production and release are more sensitive to daily operational or biochemical transitions like changes in oxygen availability, nitrification-denitrification balance hydraulic or feeding events occurring during early day management cycles. The large coefficients of variation for N₂O (CV = 2.6 to 4.8) further demonstrate its higher temporal instability compared with CH₄ (CV = 1.7 to 3.4), consistent with previous findings that N₂O emissions from livestock wastewater systems occur in short-lived peaks driven by rapid redox shifts and intermittent aeration rather than by microclimatic conditions [22,23]
3.2. Treatment Stage Specific GHG Flux Characteristics
CH₄ and N₂O emission flux variation according to treatment stages is shown in Figure 6a and b respectively, and Table 3 summarizes major flux statistic indices. CH₄ fluxes were highest in Aeration tank II (27.8 ), resulting from methanogenic substrate turnover and post-aeration CH₄ stripping. Other studies have also reported continued methanogenesis; attributing it to residual anaerobic micro-zones in sludge flocs allowing CH₄ generation even under aerobic conditions [24,25,26]). The sudden turbulence during mixing phases releases accumulated CH₄ in the sludge flocs, explaining the elevated peak (119.8 recorded. Similar floc-mediated storage and aeration-driven stripping of CH₄ have been observed in oxic tanks of municipal wastewater treatment plants [27]. In contrast, the Anaerobic Tank II and raw-water tank exhibited the lowest CH₄ fluxes (2.8 to 3.7 ), consistent with studies reporting that downstream units with higher redox potential and reduced organic substrate support lower methanogenic activity and thus lower emissions than upstream anaerobic zones[27,28]. These downstream units receive effluent with low biodegradable, chemical oxygen demand and volatile fatty acids, and their shorter retention times combined with potential ammonia inhibition further constrain methanogenesis [29,30,31]. Similar attenuation of CH₄ has been reported in post-treatment basins of swine manure systems, where reduced organic strength and minimal mixing restrict gas production and release [32]
On the other hand, N₂O emissions were highly dominated by Anaerobic Tank I (mean = 5,163.9 ; maximum = 90,162.9 mg ), revealing highly unstable nitrification–denitrification cycles in this zone. Such extreme fluxes are consistent with the findings of [33] and [34], who demonstrated that oxygen fluctuations, nitrite accumulation, and low C/N ratios promote nitrifier–denitrification and incomplete heterotrophic denitrification in piggery wastewater reactors. Particularly, [33] reported that under intermittent aeration, up to 18 % of the nitrogen load may be emitted as N₂O from pig-slurry sequencing batch reactors.
The elevated coefficient of variation in Anaerobic Tank I (CV = 3.7) reinforces that N₂O release is episodic, and not steady state, aligning with broader wastewater treatment studies showing substantial variability in N₂O yields across water treatment plants[26,35] (Law et al., 2012; Gruber et al., 2022). By comparison, Aeration Tank II and the raw-water storage released minimal N₂O (<300 ), likely due to more stable anoxic environments where nitrite does not accumulate and denitrification proceeds to N₂ rather than N₂O [23,36].
These contrasting emission patterns highlight that no single control measure can effectively reduce both gases simultaneously; instead, mitigation must be designed specifically for each gas and operational stage. CH₄ mitigation should target the physical mechanisms of gas production and release including improving mixing uniformity, minimizing turbulence during aeration, or using surface covers to limit direct CH₄ stripping. In contrast, N₂O reduction requires biochemical stabilization through consistent redox control, adequate carbon supply to complete denitrification, and prevention of nitrite accumulation that can trigger N₂O formation.
3.3. Seasonal GHG Flux Characteristics
Seasonal variation in CH₄ and N₂O fluxes reflected the combined influence of temperature, microbial activity, and system operation within the swine wastewater treatment process (Figure 7 and Table 4). CH₄ fluxes showed moderate but distinct seasonal differences, with the lowest emissions in summer (3.2 ) and the highest in late fall and winter (7.0 to 7.2 ). The comparable magnitudes in fall and winter suggest a transition phase in which cooling temperatures, reduced microbial oxidation, and diminished gas-liquid exchange collectively enhance CH₄ accumulation before full seasonal dormancy. Even during colder periods, methanogenic activity likely persists within the deeper sludge layers that remain thermally buffered from ambient air, allowing continued CH₄ generation (Husted, 1994; Petersen et al., 2016). Meanwhile, the lower summer flux corresponds to higher aeration efficiency and elevated dissolved oxygen levels, which suppress methanogenesis and enhance CH₄ oxidation (Sommer et al., 2004; Hao et al., 2021)
On the other hand, N₂O emissions were highly dominated by Anaerobic Tank I (mean = 5,163.9 , maximum = 90,162.9 ), revealing highly unstable nitrification–denitrification cycles in this zone. Such extreme emissions are consistent with conditions where oxygen fluctuations, nitrite accumulation, and low C/N ratios trigger nitrifier denitrification and incomplete denitrification by heterotrophs [33]. Pig-slurry systems with intermittent aeration report N₂O emission factors up to 18% of nitrogen load under high anoxic switching [33]. The elevated coefficient of variation in Anaerobic Tank I (CV = 3.7) reinforces that N₂O release is episodic, and not steady state, aligning with broader wastewater treatment studies showing substantial variability in N₂O yields across plants[37].
By comparison, aeration tank II and the raw-water storage released minimal N₂O (<300 ), likely due to more stable oxicam or anoxic environments where nitrite does not accumulate and denitrification proceeds to N₂ rather than N₂O [23]. These contrasting emission patterns highlight that no single control measure can effectively reduce both gases simultaneously; instead, mitigation must be designed specifically for each gas and operational stage.
CH₄ mitigation should target the physical mechanisms of gas production and release including improving mixing uniformity, minimizing turbulence during aeration, or using surface covers to limit direct CH₄ stripping. In contrast, N₂O reduction requires biochemical stabilization through consistent redox control, adequate carbon supply to complete denitrification, and prevention of nitrite accumulation that can trigger N₂O formation.
3.4. Effect of Environmental Factors on GHG Emission Fluxes
3.4.1. Seasonal Scale
The seasonal relationships between GHG fluxes and environmental variables are shown in Figure 8 and Figure 9. CH₄ fluxes exhibited a strong positive correlation with temperature (R² = 0.95) and a moderate negative one with RH (R² = 0.39), confirming that methanogenesis intensifies during warmer periods while high humidity suppresses gas exchange[38,39] . ANOVA results (Table 5) supported these trends, showing that temperature significantly influenced CH₄ fluxes (F = 6.2, p = 0.014), along with a strong treatment stage effect (F = 3.8, p = 0.006; η² = 0.09). RH also made a secondary but significant contribution (F = 5.0, p = 0.027). The negative association with RH suggests that drier, ventilated conditions enhance gas transfer from emission surfaces, complementing reports that environmental drivers such as temperature and microclimate strongly modulate CH₄ release from stored pig manure[40]
For N₂O, the seasonal correlation with temperature was weak (R² = 0.03), while RH showed a moderate positive relationship (R² = 0.56), suggesting higher N₂O accumulation under humid, low-oxygen conditions. The ANOVA confirmed only a mild temperature effect (F ≈ 4.4, p = 0.038; η² = 0.03), with RH and stage effects remaining non-significant (p > 0.1), consistent with the view that N₂O release is primarily process-driven rather than thermally regulated [36,37,41].
3.4.2. Diurnal Scale
The diurnal relationships between GHG fluxes and environmental parameters are shown in Figure 9, based on mean fluxes across the four daily periods. CH₄ fluxes showed a moderate positive correlation with temperature (R² = 0.60) and weak dependence on RH (R² = 0.16), indicating that emissions rise with daytime warming while humidity exerts a minor influence. This pattern is consistent with studies on liquid manure and slurry storage, which report that short-term CH₄ variability is mainly controlled by slurry temperature and internal microbial activity rather than ambient humidity [26,39,42]. ANOVA confirmed no significant period effect for CH₄ (F = 0.6, p = 0.62) or N₂O (F = 0.8, p = 0.51), implying that short-term climatic fluctuations have minimal impact compared with temperature and treatment stage.
5. Conclusions
This study quantified methane (CH₄) and nitrous oxide (N₂O) emissions from a full-scale piggery wastewater treatment system to support the development of treatment stage and time-resolved emission factors. Methane fluxes were strongly influenced by temperature and gas transfer conditions, showing higher emissions during warm periods and in aeration units. Diurnal monitoring also revealed morning and night peaks associated with daily temperature cycles and mixing intensity. In contrast, N₂O emissions were primarily affected by redox instability and oxygen fluctuations within the treatment sequence, exhibiting irregular peaks during transitions between aerated and anoxic phases.
These findings indicate that CH₄ and N₂O arise from distinct mechanisms, requiring separate control approaches: temperature and aeration management for CH₄, and stabilization of carbon–nitrogen balance and redox conditions for N₂O. The emission derived factors improve the accuracy of livestock greenhouse-gas inventories and provide practical data for the design of low-emission wastewater management systems. Future work will include chemical and nutrient analyses of wastewater to clarify how PH, ammonia, nitrate, nitrite, and volatile fatty acids influence emission behavior and to refine process-based mitigation models for climate-smart livestock facilities.
Future research should focus on incorporating microbial community analysis and isotopic tracing to further understand the underlying biogeochemical pathways. Developing dynamic emission factor models that integrate stage-specific operational data and real-time climatic variables is also an important aspect that needs to be addressed in future research.
Data Availability Statement
Research data available upon request.
Acknowledgments
During the preparation of this manuscript the author(s) used ChatGPT 5 for the purposes of language grammar and readability enhancement.
Conflicts of Interest
The authors declare no conflicts of interest.
Abbreviations
The following abbreviations are used in this manuscript:
| GHG | Greenhouse Gas |
| CH₄ | Methane |
| N₂O | Nitrous Oxide |
| EF | Emission Factor |
| RH | Relative Humidity |
| FTIR | Fourier Transform Infrared Spectroscopy |
| LGR | Los Gatos Research (laser-based gas analyzer) |
| AGSC | Automated Gas Sampling Chamber |
| ANOVA | Analysis of Variance |
| ANCOVA | Analysis of Covariance |
| SD | Standard Deviation |
| SE | Standard Error |
| CV | Coefficient of Variation |
| R² | Coefficient of Determination |
| p | Probability Value (Significance Level) |
| η² | Partial Eta Squared (Effect Size) |
| PVC | Polyvinyl Chloride |
| COD | Chemical oxygen demand |
References
- Grasty, S. ; FAO Reducing Enteric Methane and Livelihoods Win - Win Opportunities for Farmers; 2013; Vol. 14; ISBN 9789251079201.
- Delbeke, J.; Runge-Metzger, A.; Slingenberg, Y.; Werksman, J. The Paris Agreement. Towards a Climate-Neutral Europe: Curbing the Trend 2015, 24–45. [Google Scholar] [CrossRef]
- Rivera Moncada, A.; Dupas, M.C.; Tempio, G.; Lanzoni, L.; Li, Y.; Rakotovao, N.; Wisser, D.; Gilbert, M. Sensitivity Analysis of Parameters, Emission Factors, and Coefficients for Estimating Animal Emissions of Ruminant Species in the Global Livestock Environmental Assessment Model (GLEAM). International Journal of Life Cycle Assessment 2025. [Google Scholar] [CrossRef]
- Graham, M.W.; Butterbach-Bahl, K.; du Toit, C.J.L.; Korir, D.; Leitner, S.; Merbold, L.; Mwape, A.; Ndung’u, P.W.; Pelster, D.E.; Rufino, M.C.; et al. Research Progress on Greenhouse Gas Emissions From Livestock in Sub-Saharan Africa Falls Short of National Inventory Ambitions. Frontiers in Soil Science 2022, 2, 1–18. [Google Scholar] [CrossRef]
- The Government of the Republic of Korea 2050 Carbon Neutral Strategy of the Republic of Korea: Towards a Sustainable and Green Society. Republic of Korea 2020, 1–131.
- Statistics Korea Livestock Statistics in the Fourth Quarter of 2013. 2013, 2024, 11–12.
- of Agriculture, F.; (MAFRA), R.A. 2023 Livestock Manure Generation and Management Statistics Report 2024.
- Symeon, G.K.; Akamati, K.; Dotas, V.; Karatosidi, D.; Bizelis, I.; Laliotis, G.P. Manure Management as a Potential Mitigation Tool to Eliminate Greenhouse Gas Emissions in Livestock Systems. Sustainability (Switzerland) 2025, 17, 1–27. [Google Scholar] [CrossRef]
- Eska, N.; Lee, J.S.; Park, K.H. Greenhouse Gas Emissions from Livestock: Sources, Estimation, and Mitigation. J Anim Sci Technol 2024, 66, 1083–1098. [Google Scholar] [CrossRef]
- Al Zahra, W.; Ikhsan Shiddieqy, M.; Anisa, R.; Yani, A.; Priyo Purwanto, B. The Dynamics of Nitrous Oxide and Methane Emissions from Various Types of Dairy Manure at Smallholder Dairy Farms as Affected by Storage Periods. Waste Management 2024, 183, 10–20. [Google Scholar] [CrossRef] [PubMed]
- Philippe, F.X.; Nicks, B. Review on Greenhouse Gas Emissions from Pig Houses: Production of Carbon Dioxide, Methane and Nitrous Oxide by Animals and Manure. Agric Ecosyst Environ 2015, 199, 10–25. [Google Scholar] [CrossRef]
- Montes, F.; Meinen, R.; Dell, C.; Rotz, A.; Hristov, A.N.; Oh, J.; Waghorn, G.; Gerber, P.J.; Henderson, B.; Makkar, H.P.S.; et al. SPECIAL TOPICS-Mitigation of Methane and Nitrous Oxide Emissions from Animal Operations: II. A Review of Manure Management Mitigation Options. J Anim Sci 2013, 91, 5070–5094. [Google Scholar] [CrossRef]
- Ro, K.S.; Johnson, M.H.; Stone, K.C.; Hunt, P.G.; Flesch, T.; Todd, R.W. Measuring Gas Emissions from Animal Waste Lagoons with an Inverse-Dispersion Technique. Atmos Environ 2013, 66, 101–106. [Google Scholar] [CrossRef]
- Gu, D.; Liu, Y.; Zhao, W.; Qiu, S.; Cui, N.; Hu, X.; Zhao, P. Status of Research on Greenhouse Gas Emissions from Wastewater Collection Systems. Water (Switzerland) 2023, 15. [Google Scholar] [CrossRef]
- Jensen, S.A.; Webb, J.R.; Simpson, G.L.; Baulch, H.M.; Leavitt, P.R.; Finlay, K. Seasonal Variability of CO2, CH4, and N2O Content and Fluxes in Small Agricultural Reservoirs of the Northern Great Plains. Front Environ Sci 2022, 10, 1–20. [Google Scholar] [CrossRef]
- Vechi, N.T.; Falk, J.M.; Fredenslund, A.M.; Edjabou, M.E.; Scheutz, C. Methane Emission Rates Averaged over a Year from Ten Farm-Scale Manure Storage Tanks. Science of the Total Environment 2023, 904, 166610. [Google Scholar] [CrossRef]
- Wilkinson, J.; Bors, C.; Burgis, F.; Lorke, A.; Bodmer, P. Measuring CO2 and CH4 with a Portable Gas Analyzer: Closed-Loop Operation, Optimization and Assessment (PLoS ONE (2018) 13: 4 (E0193973). https://doi.org/10.1371/Journal.Pone.0193973). PLoS One 2019, 14, 1–16. [Google Scholar] [CrossRef]
- Stiefvater, G.; Hespos, Y.; Wiedenmann, D.; Lambrecht, A.; Brunner, R.; Wöllenstein, J. A Portable Laser Spectroscopic System for Measuring Nitrous Oxide Emissions on Fertilized Cropland. Sensors 2023, 23. [Google Scholar] [CrossRef]
- Briz, S.; Barrancos, J.; Nolasco, D.; Melián, G.; Padrón, E.; Pérez, N. New Method for Estimating Greenhouse Gas Emissions from Livestock Buildings Using Open-Path FTIR Spectroscopy. Remote Sensing of Clouds and the Atmosphere XIV 2009, 7475, 747510. [Google Scholar] [CrossRef]
- Cattaneo, M.; Tayà, C.; Burgos, L.; Morey, L.; Noguerol, J.; Provolo, G.; Cerrillo, M.; Bonmatí, A. Assessing Ammonia and Greenhouse Gas Emissions from Livestock Manure Storage: Comparison of Measurements with Dynamic and Static Chambers. Sustainability (Switzerland) 2023, 15. [Google Scholar] [CrossRef]
- Hassouna, M.; van der Weerden, T.J.; Beltran, I.; Amon, B.; Alfaro, M.A.; Anestis, V.; Cinar, G.; Dragoni, F.; Hutchings, N.J.; Leytem, A.; et al. DATAMAN: A Global Database of Methane, Nitrous Oxide, and Ammonia Emission Factors for Livestock Housing and Outdoor Storage of Manure. J Environ Qual 2023, 52, 207–223. [Google Scholar] [CrossRef] [PubMed]
- Su, J.J.; Chen, Y.J. Monitoring of Greenhouse Gas Emissions from Farm-Scale Anaerobic Piggery Waste-Water Digesters. Journal of Agricultural Science 2018, 156, 739–747. [Google Scholar] [CrossRef]
- Yamashita, T.; Shiraishi, M.; Yokoyama, H.; Ogino, A.; Yamamoto-Ikemoto, R.; Osada, T. Evaluation of the Nitrous Oxide Emission Reduction Potential of an Aerobic Bioreactor Packed with Carbon Fibres for Swine Wastewater Treatment. Energies (Basel) 2019, 12. [Google Scholar] [CrossRef]
- Lens, P.N.; De Poorter, M.P.; Cronenberg, C.C.; Verstraete, W.H. Sulfate Reducing and Methane Producing Bacteria in Aerobic Wastewater Treatment Systems. Water Res 1995, 29, 871–880. [Google Scholar] [CrossRef]
- Litti, Y. V.; Nekrasova, V.K.; Kulikov, N.I.; Siman’kova, M. V.; Nozhevnikova, A.N. Detection of Anaerobic Processes and Microorganisms in Immobilized Activated Sludge of a Wastewater Treatment Plant with Intense Aeration. Microbiology (Russian Federation) 2013, 82, 690–697. [Google Scholar] [CrossRef]
- Osada, T.; Shiraishi, M.; Hasegawa, T.; Kawahara, H. Methane, Nitrous Oxide and Ammonia Generation in Full-Scale Swine Wastewater Purification Facilities. Front Environ Sci Eng 2017, 11. [Google Scholar] [CrossRef]
- Zhang, D.; Li, H.; Li, X.; Ao, D.; Wang, N. Source of Methanogens and Characteristics of Methane Emission in Two Wastewater Treatment Plants in Xi’an. Water (Switzerland) 2024, 16. [Google Scholar] [CrossRef]
- Wang, J.; Zhang, J.; Xie, H.; Qi, P.; Ren, Y.; Hu, Z. Methane Emissions from a Full-Scale A/A/O Wastewater Treatment Plant. Bioresour Technol 2011, 102, 5479–5485. [Google Scholar] [CrossRef]
- Belmonte, M.; Hsieh, C.F.; Figueroa, C.; Campos, J.L.; Vidal, G. Effect of Free Ammonia Nitrogen on the Methanogenic Activity of Swine Wastewater. Electronic Journal of Biotechnology 2011, 14. [Google Scholar] [CrossRef]
- Pu, Y.; Tang, J.; Zeng, T.; Hu, Y.; Yang, J.; Wang, X.; Huang, J.; Abomohra, A. Pollutant Removal and Energy Recovery from Swine Wastewater Using Anaerobic Membrane Bioreactor: A Comparative Study with Up-Flow Anaerobic Sludge Blanket. Water (Switzerland) 2022, 14. [Google Scholar] [CrossRef]
- Riaño, B.; García-González, M.C. Greenhouse Gas Emissions of an On-Farm Swine Manure Treatment Plant - Comparison with Conventional Storage in Anaerobic Tanks. J Clean Prod 2015, 103, 542–548. [Google Scholar] [CrossRef]
- Riaño, B.; García-González, M.C. Greenhouse Gas Emissions of an On-Farm Swine Manure Treatment Plant - Comparison with Conventional Storage in Anaerobic Tanks. J Clean Prod 2015, 103, 542–548. [Google Scholar] [CrossRef]
- Béline, F.; Martinez, J. Nitrogen Transformations during Biological Aerobic Treatment of Pig Slurry: Effect of Intermittent Aeration on Nitrous Oxide Emissions. Bioresour Technol 2002, 83, 225–228. [Google Scholar] [CrossRef] [PubMed]
- Kishida, N.; Kim, J.H.; Kimochi, Y.; Nishimura, O.; Sasaki, H.; Sudo, R. Effect of C/N Ratio on Nitrous Oxide Emission from Swine Wastewater Treatment Process. Water Science and Technology 2004, 49, 359–365. [Google Scholar] [CrossRef]
- Law, Y.; Ye, L.; Pan, Y.; Yuan, Z. Nitrous Oxide Emissions from Wastewater Treatment Processes. Philosophical Transactions of the Royal Society B: Biological Sciences 2012, 367, 1265–1277. [Google Scholar] [CrossRef] [PubMed]
- Xie, Y.; Jiang, C.; Kuai, B.; Xu, S.; Zhuang, X. N2O Emission Reduction in the Biological Nitrogen Removal Process for Wastewater with Low C/N Ratios: Mechanisms and Strategies. Front Bioeng Biotechnol 2023, 11, 1–20. [Google Scholar] [CrossRef] [PubMed]
- Law, Y.; Ye, L.; Pan, Y.; Yuan, Z. Nitrous Oxide Emissions from Wastewater Treatment Processes. Philosophical Transactions of the Royal Society B: Biological Sciences 2012, 367, 1265–1277. [Google Scholar] [CrossRef]
- Sommer, S.G.; Petersen, S.O.; Møller, H.B. Algorithms for Calculating Methane and Nitrous Oxide Emissions from Manure Management. Nutr Cycl Agroecosyst 2004, 69, 143–154. [Google Scholar] [CrossRef]
- Hilgert, J.E.; Amon, B.; Amon, T.; Belik, V.; Dragoni, F.; Ammon, C.; Cárdenas, A.; Petersen, S.O.; Herrmann, C. Methane Emissions from Livestock Slurry: Effects of Storage Temperature and Changes in Chemical Composition. Sustainability (Switzerland) 2022, 14. [Google Scholar] [CrossRef]
- Park, K.H.; Thompson, A.G.; Marinier, M.; Clark, K.; Wagner-Riddle, C. Greenhouse Gas Emissions from Stored Liquid Swine Manure in a Cold Climate. Atmos Environ 2006, 40, 618–627. [Google Scholar] [CrossRef]
- Massara, T.M.; Malamis, S.; Guisasola, A.; Baeza, J.A.; Noutsopoulos, C.; Katsou, E. A Review on Nitrous Oxide (N2O) Emissions during Biological Nutrient Removal from Municipal Wastewater and Sludge Reject Water. Science of the Total Environment 2017, 596–597, 106–123. [Google Scholar] [CrossRef]
- Park, K.H.; Wagner-Riddle, C. Methane Emission Patterns from Stored Liquid Swine Manure. Asian-Australas J Anim Sci 2010, 23, 1229–1235. [Google Scholar] [CrossRef]
- Daelman, M.R.J.; van Voorthuizen, E.M.; van Dongen, U.G.J.M.; Volcke, E.I.P.; van Loosdrecht, M.C.M. Seasonal and Diurnal Variability of N2O Emissions from a Full-Scale Municipal Wastewater Treatment Plant. Science of the Total Environment 2015, 536, 1–11. [Google Scholar] [CrossRef]
- Kemmou, L.; Amanatidou, E. Factors Affecting Nitrous Oxide Emissions from Activated Sludge Wastewater Treatment Plants—A Review. Resources 2023, 12. [Google Scholar] [CrossRef]
Figure 1.
Monthly mean air temperature, relative humidity, and wind speed recorded at the study site. Shaded areas represent Korea’s seasonal classification applied in this study.
Figure 1.
Monthly mean air temperature, relative humidity, and wind speed recorded at the study site. Shaded areas represent Korea’s seasonal classification applied in this study.
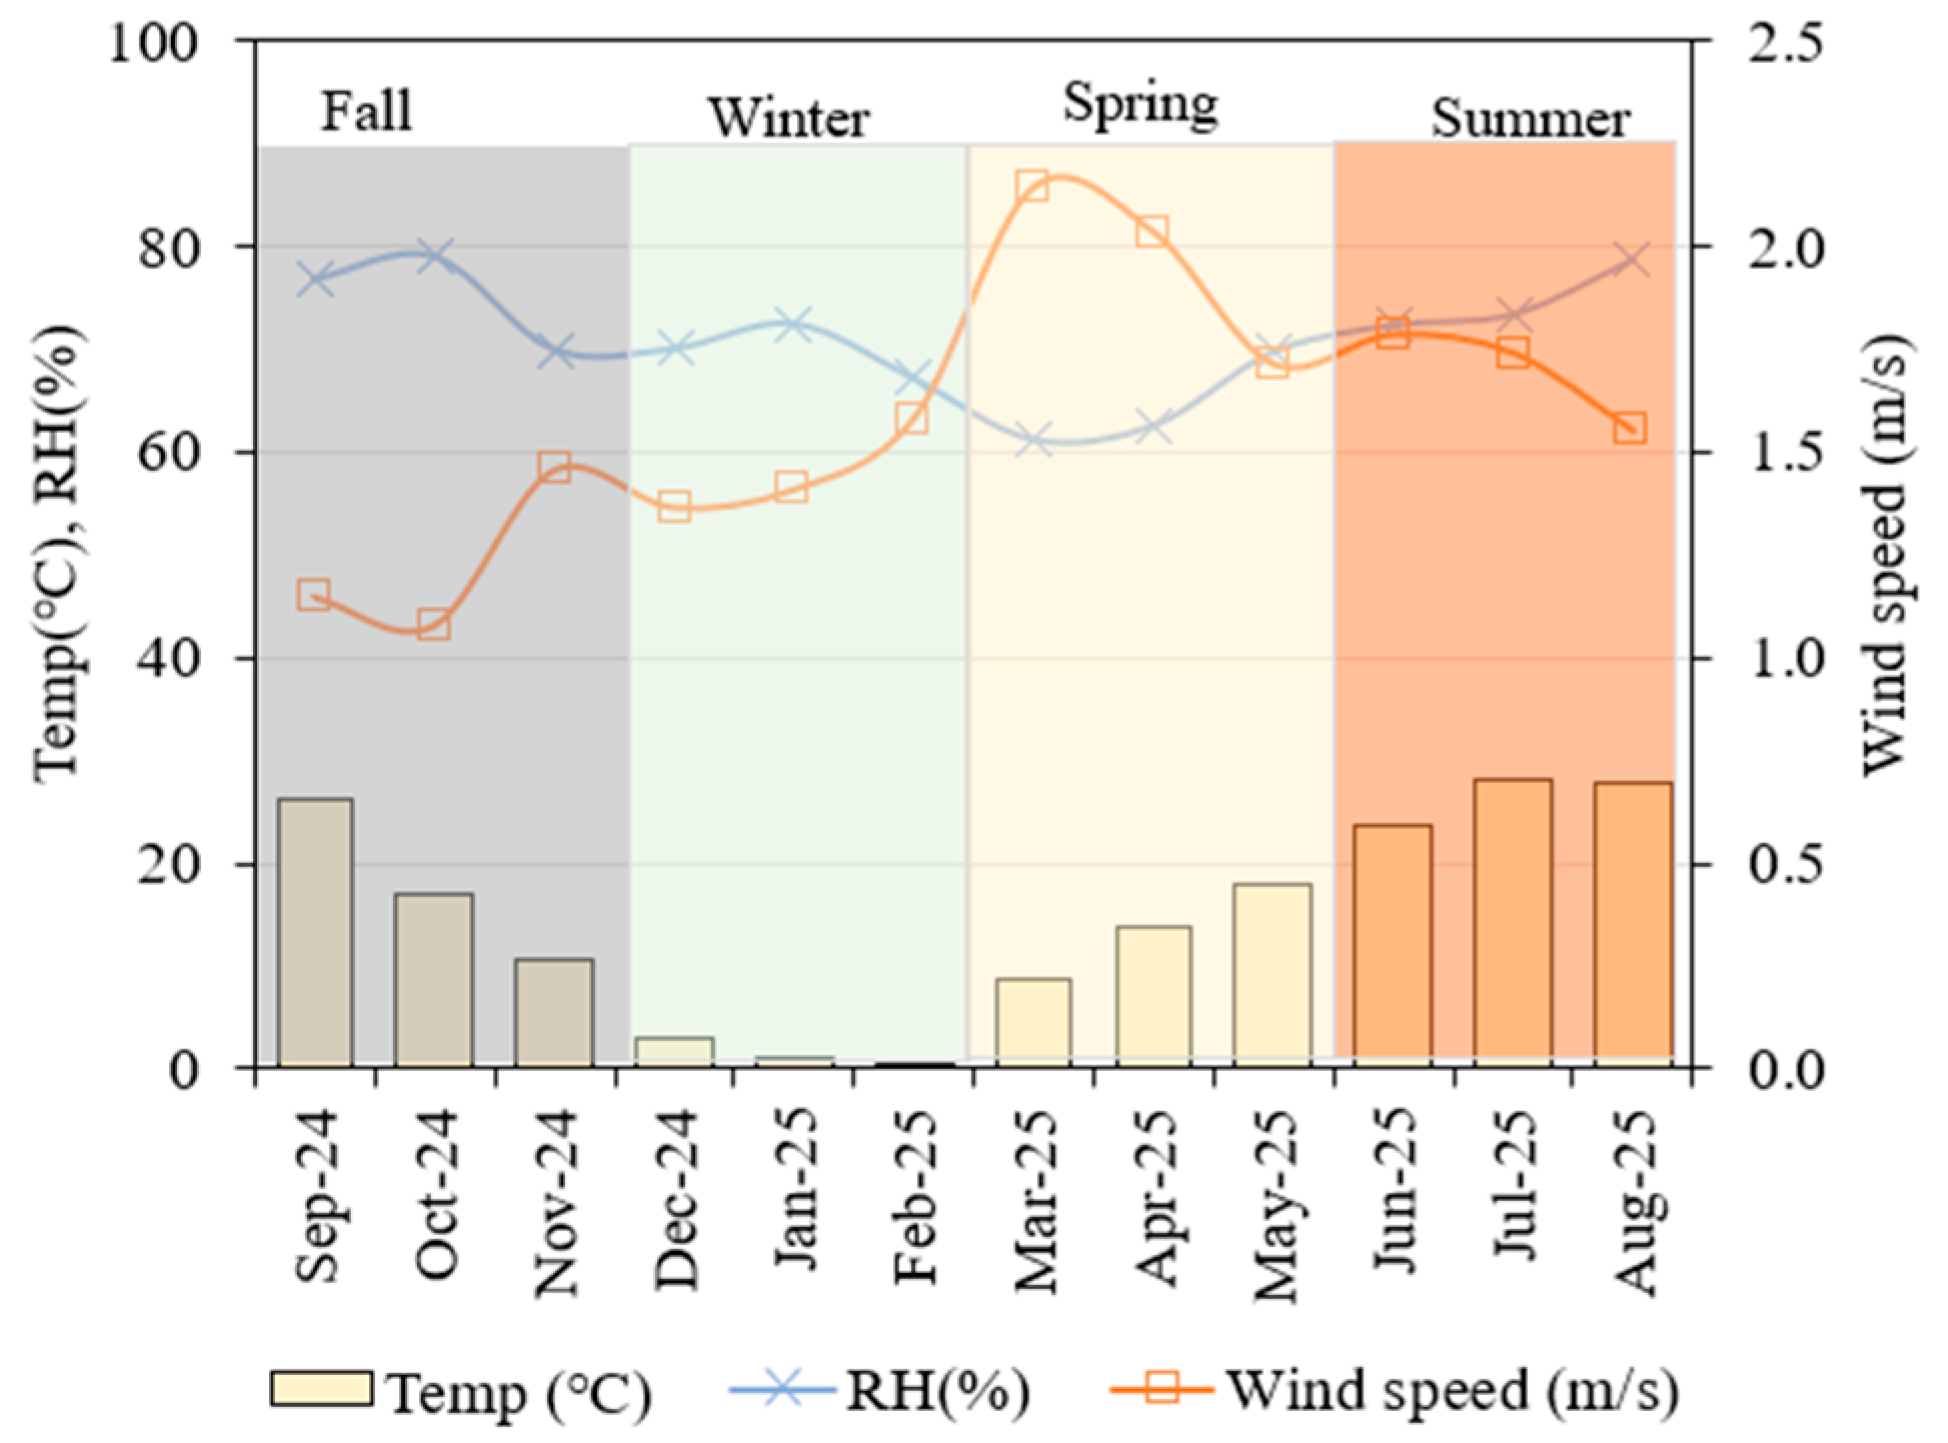
Figure 2.
Experimental site location and layout of the wastewater treatment system used for GHG monitoring. (a) Geographical location of the study site in Korea. (b) Aerial view of the farm and waste treatment facility showing sampling points (1to10) and key units (a to d). (c) Illustration of the treatment sequence, tank dimensions, and sampling stages.
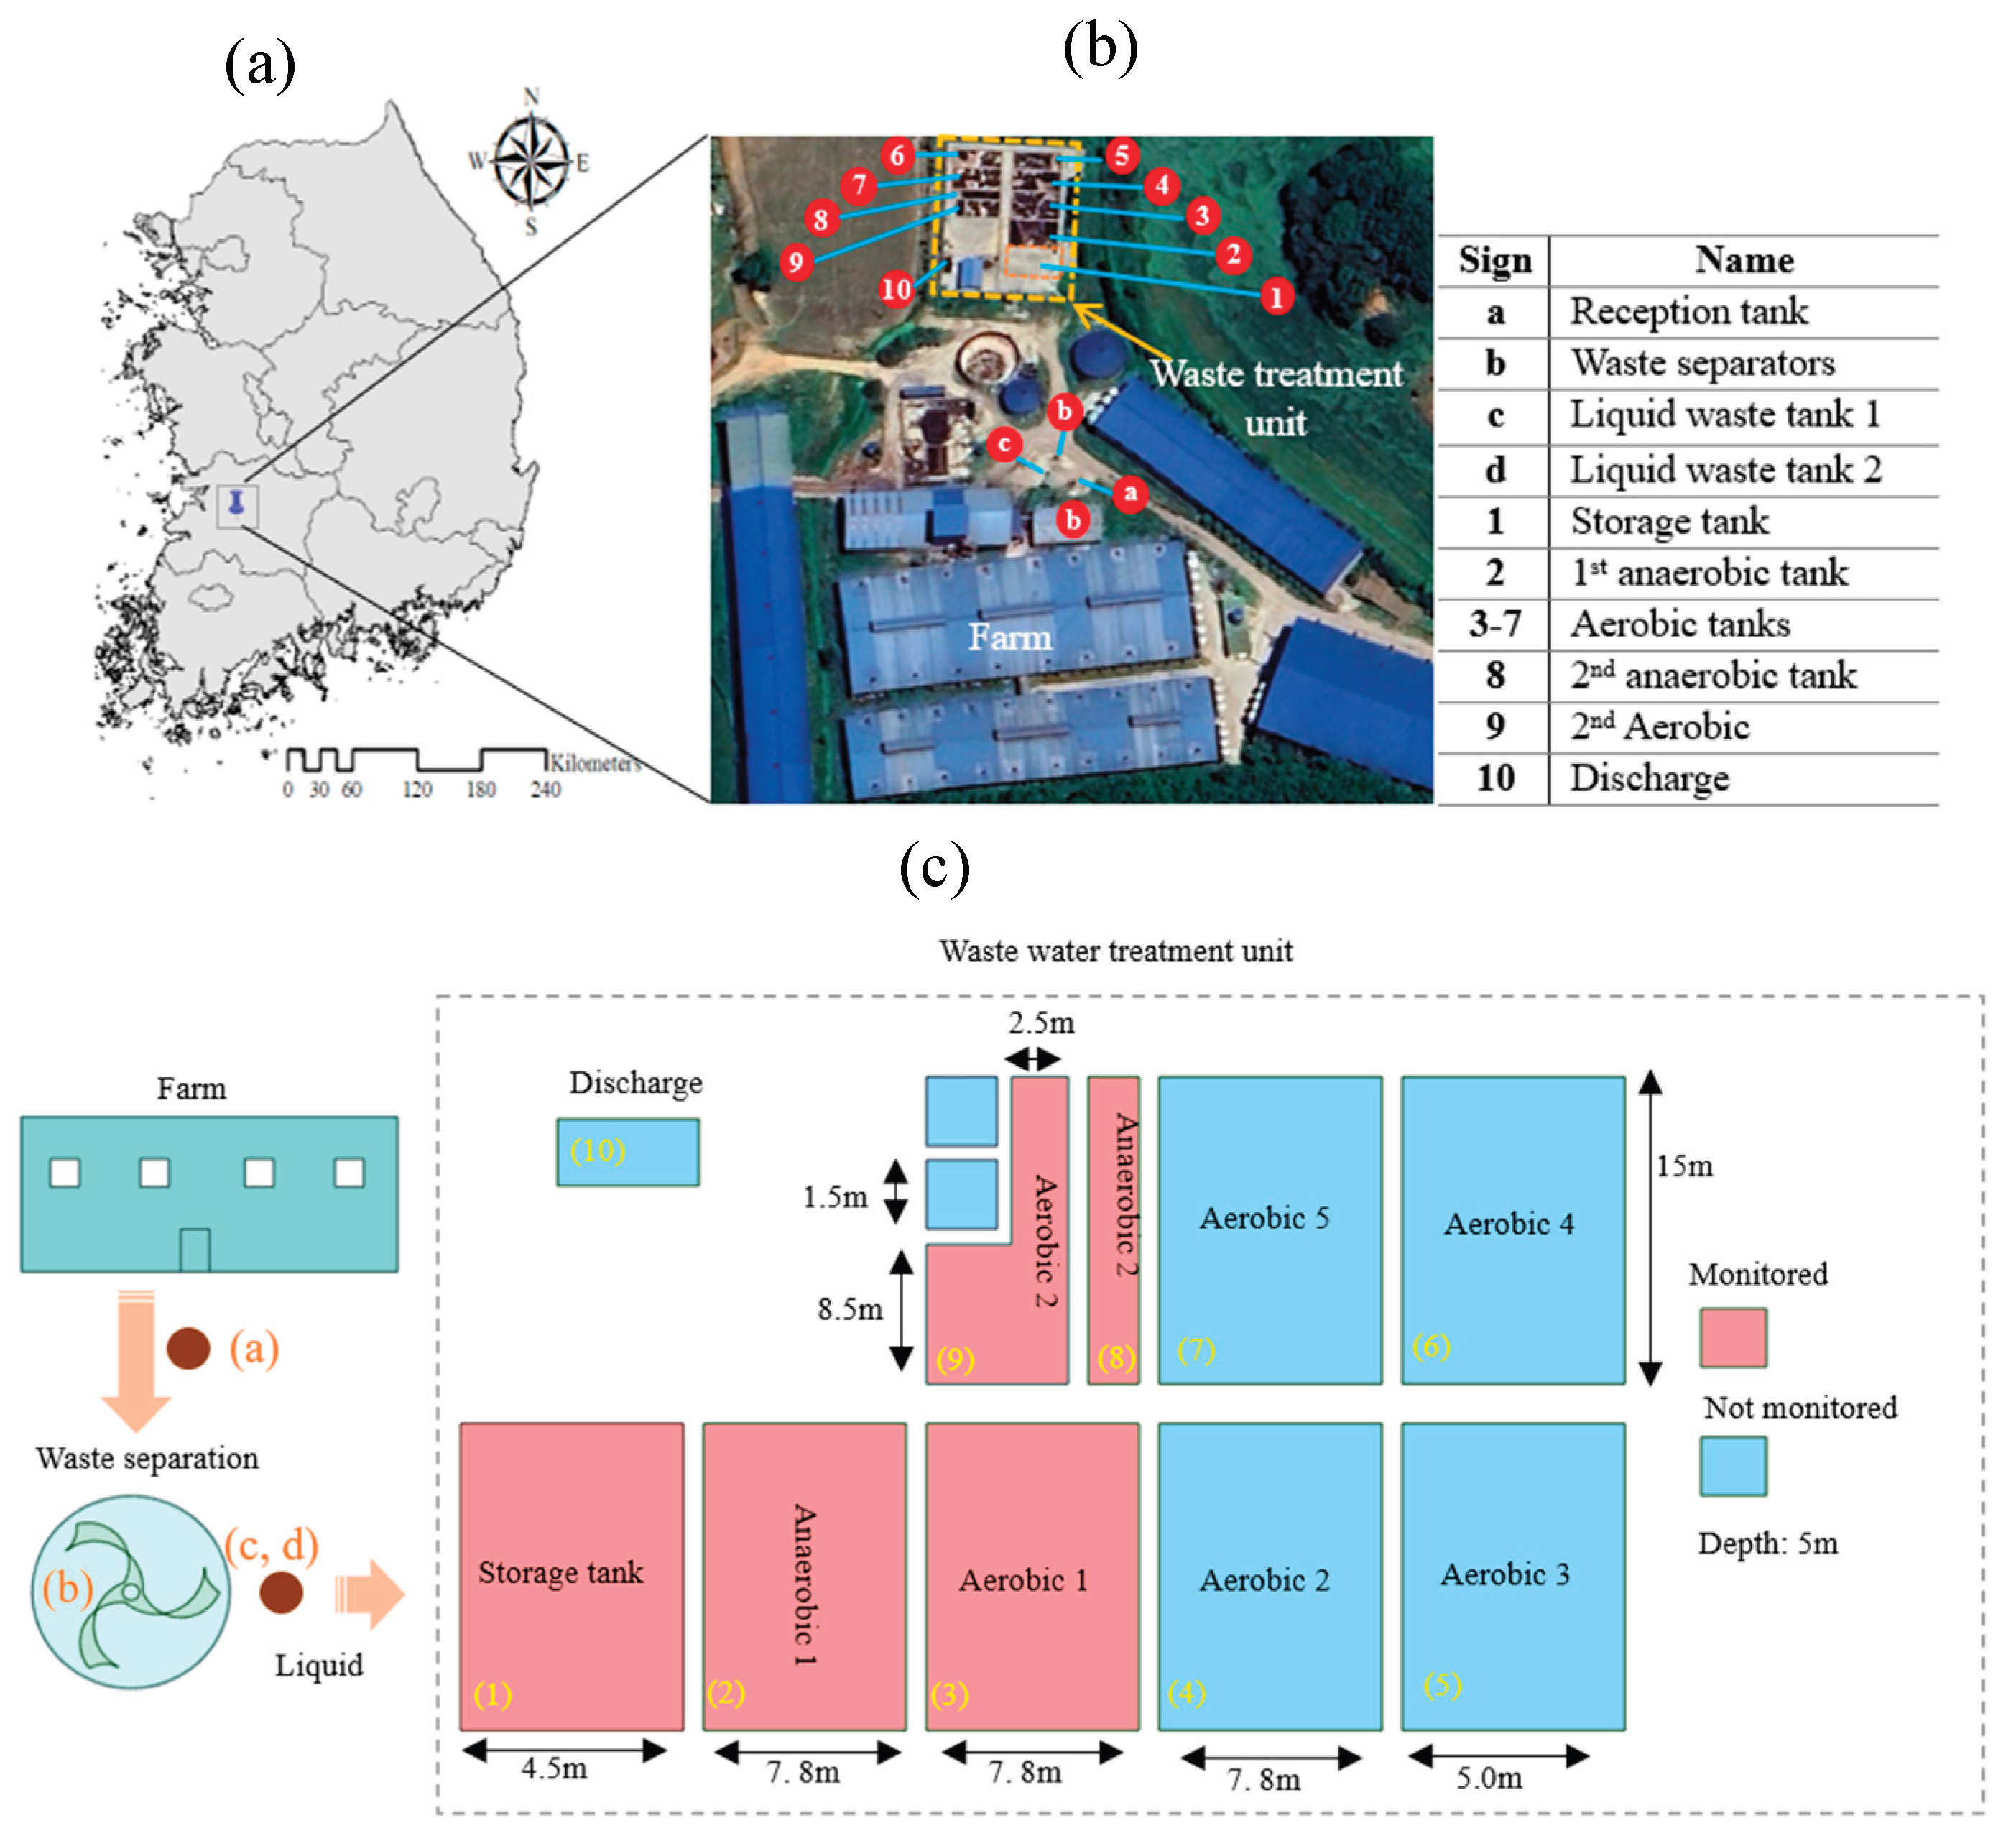
Figure 5.
(a) CH₄ and (b) N₂O diurnal flux distributions for Morning, Afternoon, Evening, and Night periods.
Figure 5.
(a) CH₄ and (b) N₂O diurnal flux distributions for Morning, Afternoon, Evening, and Night periods.
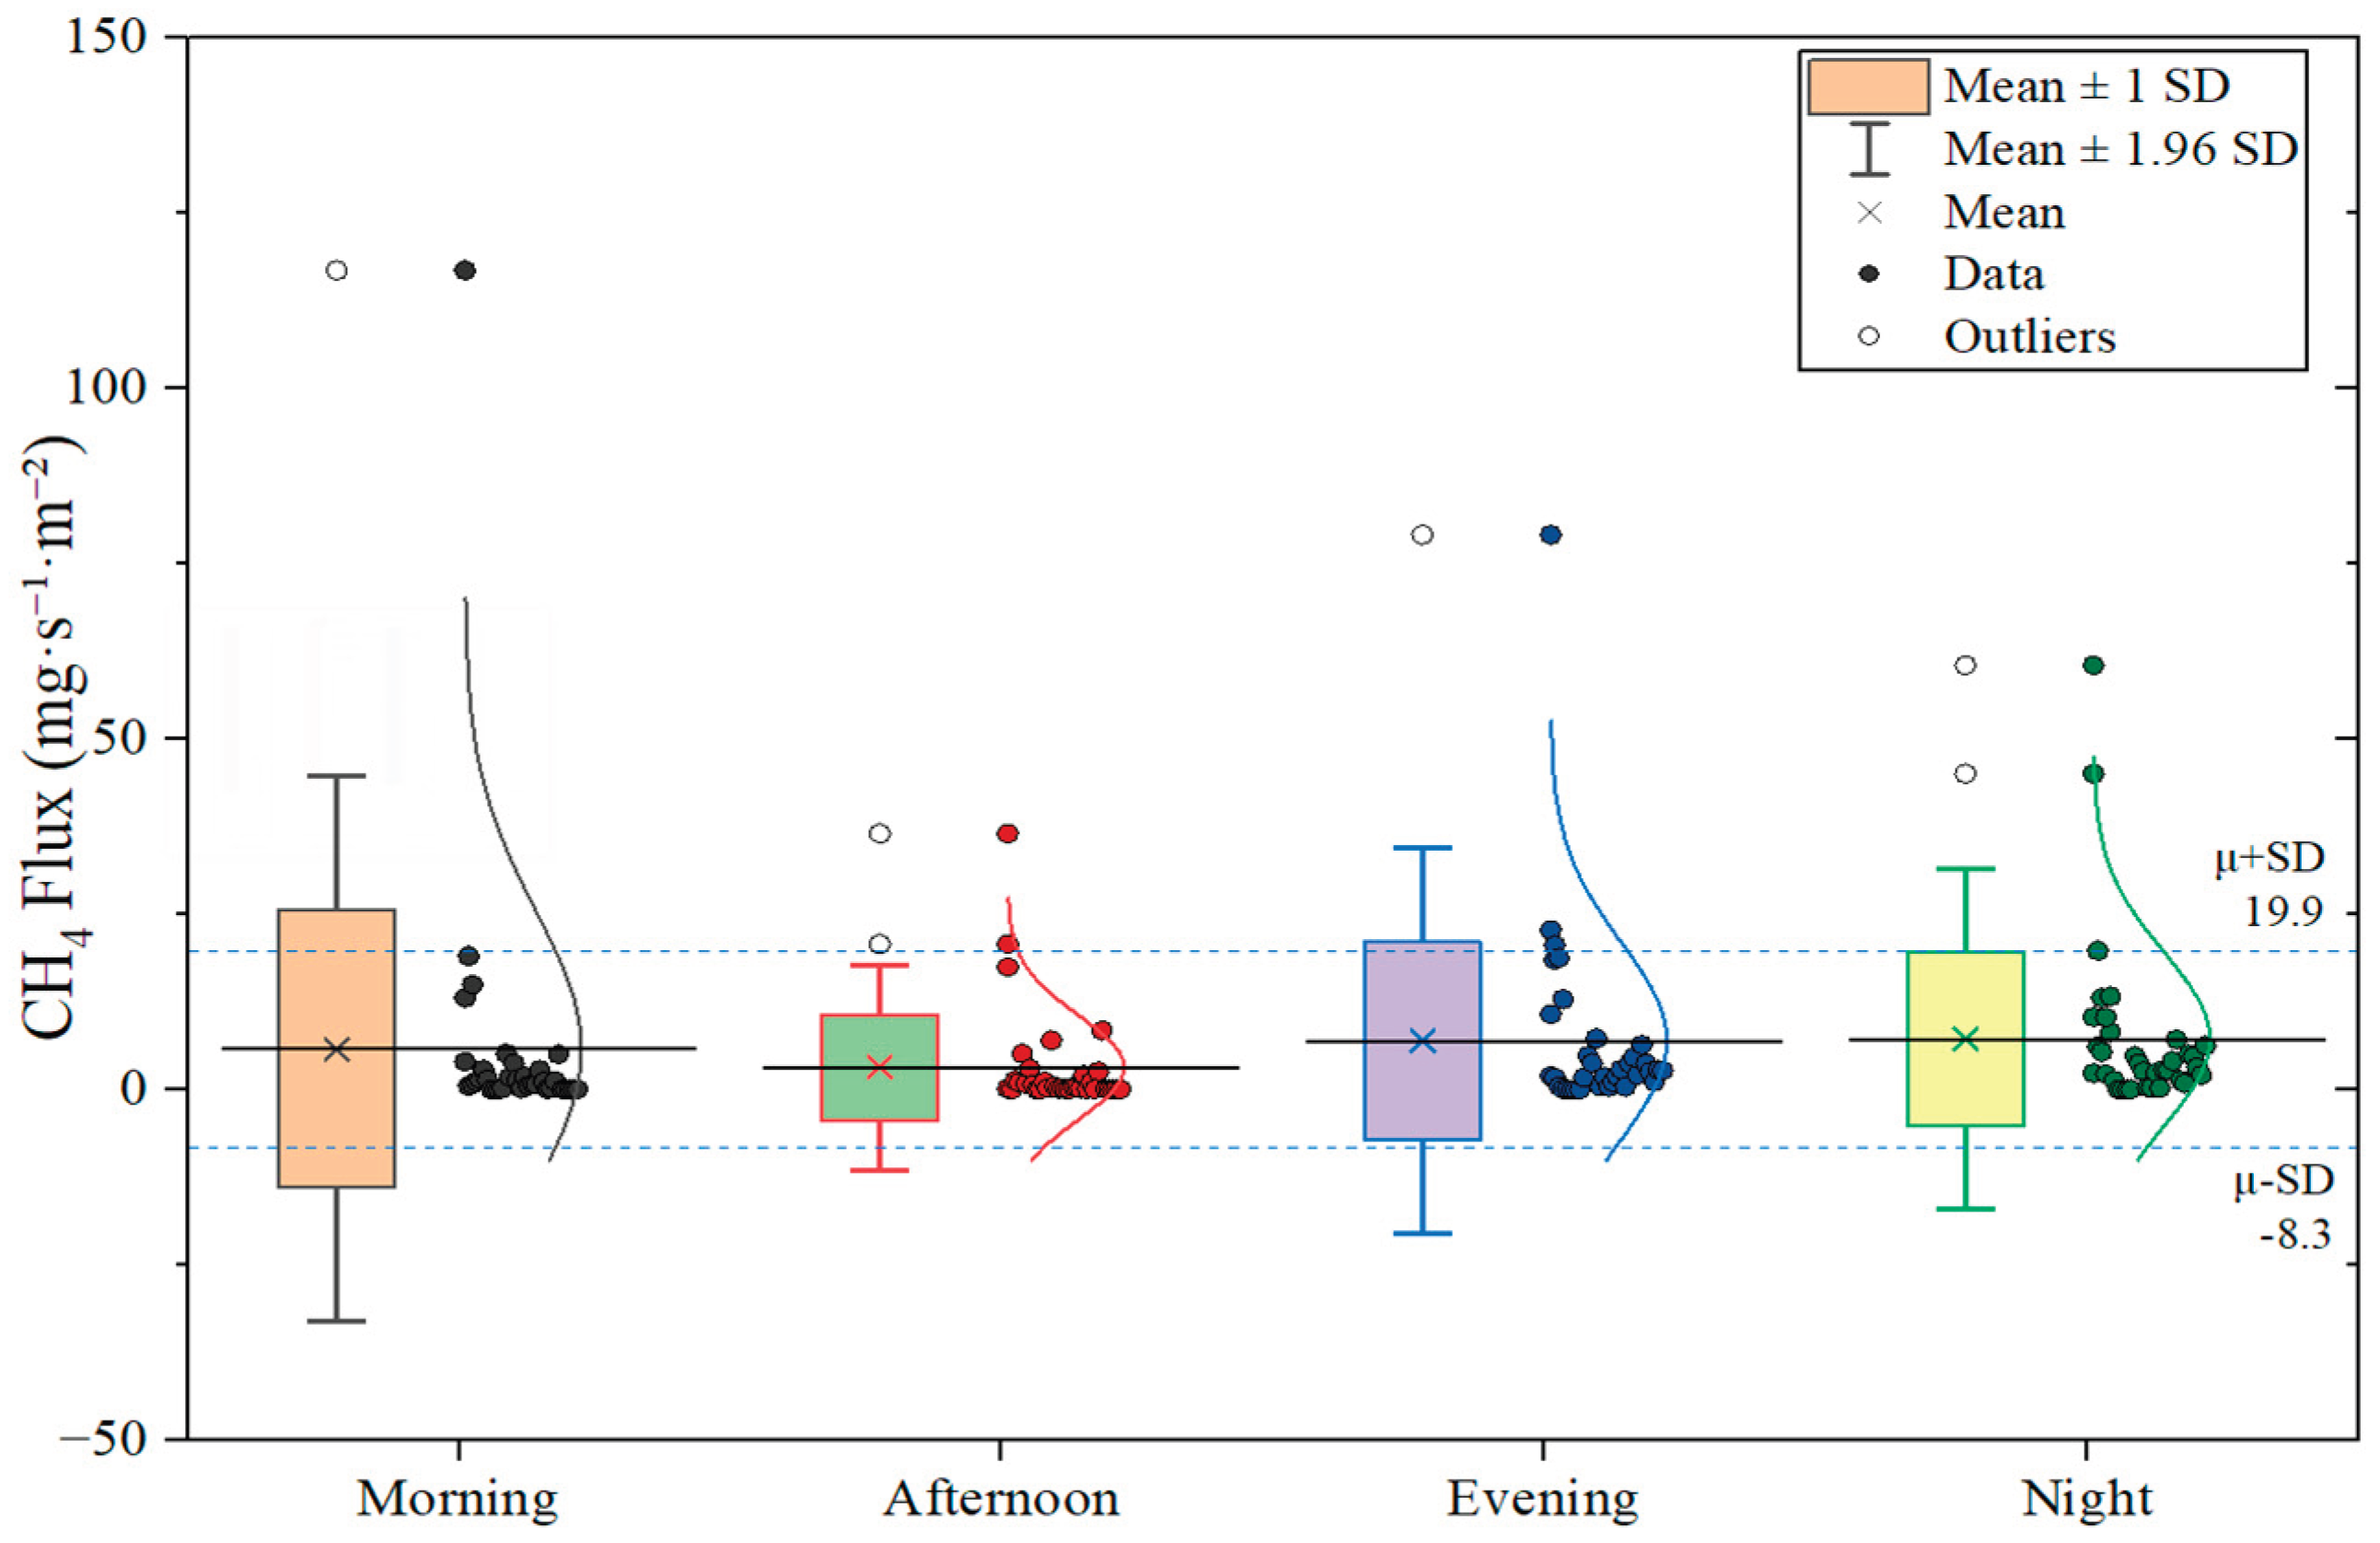
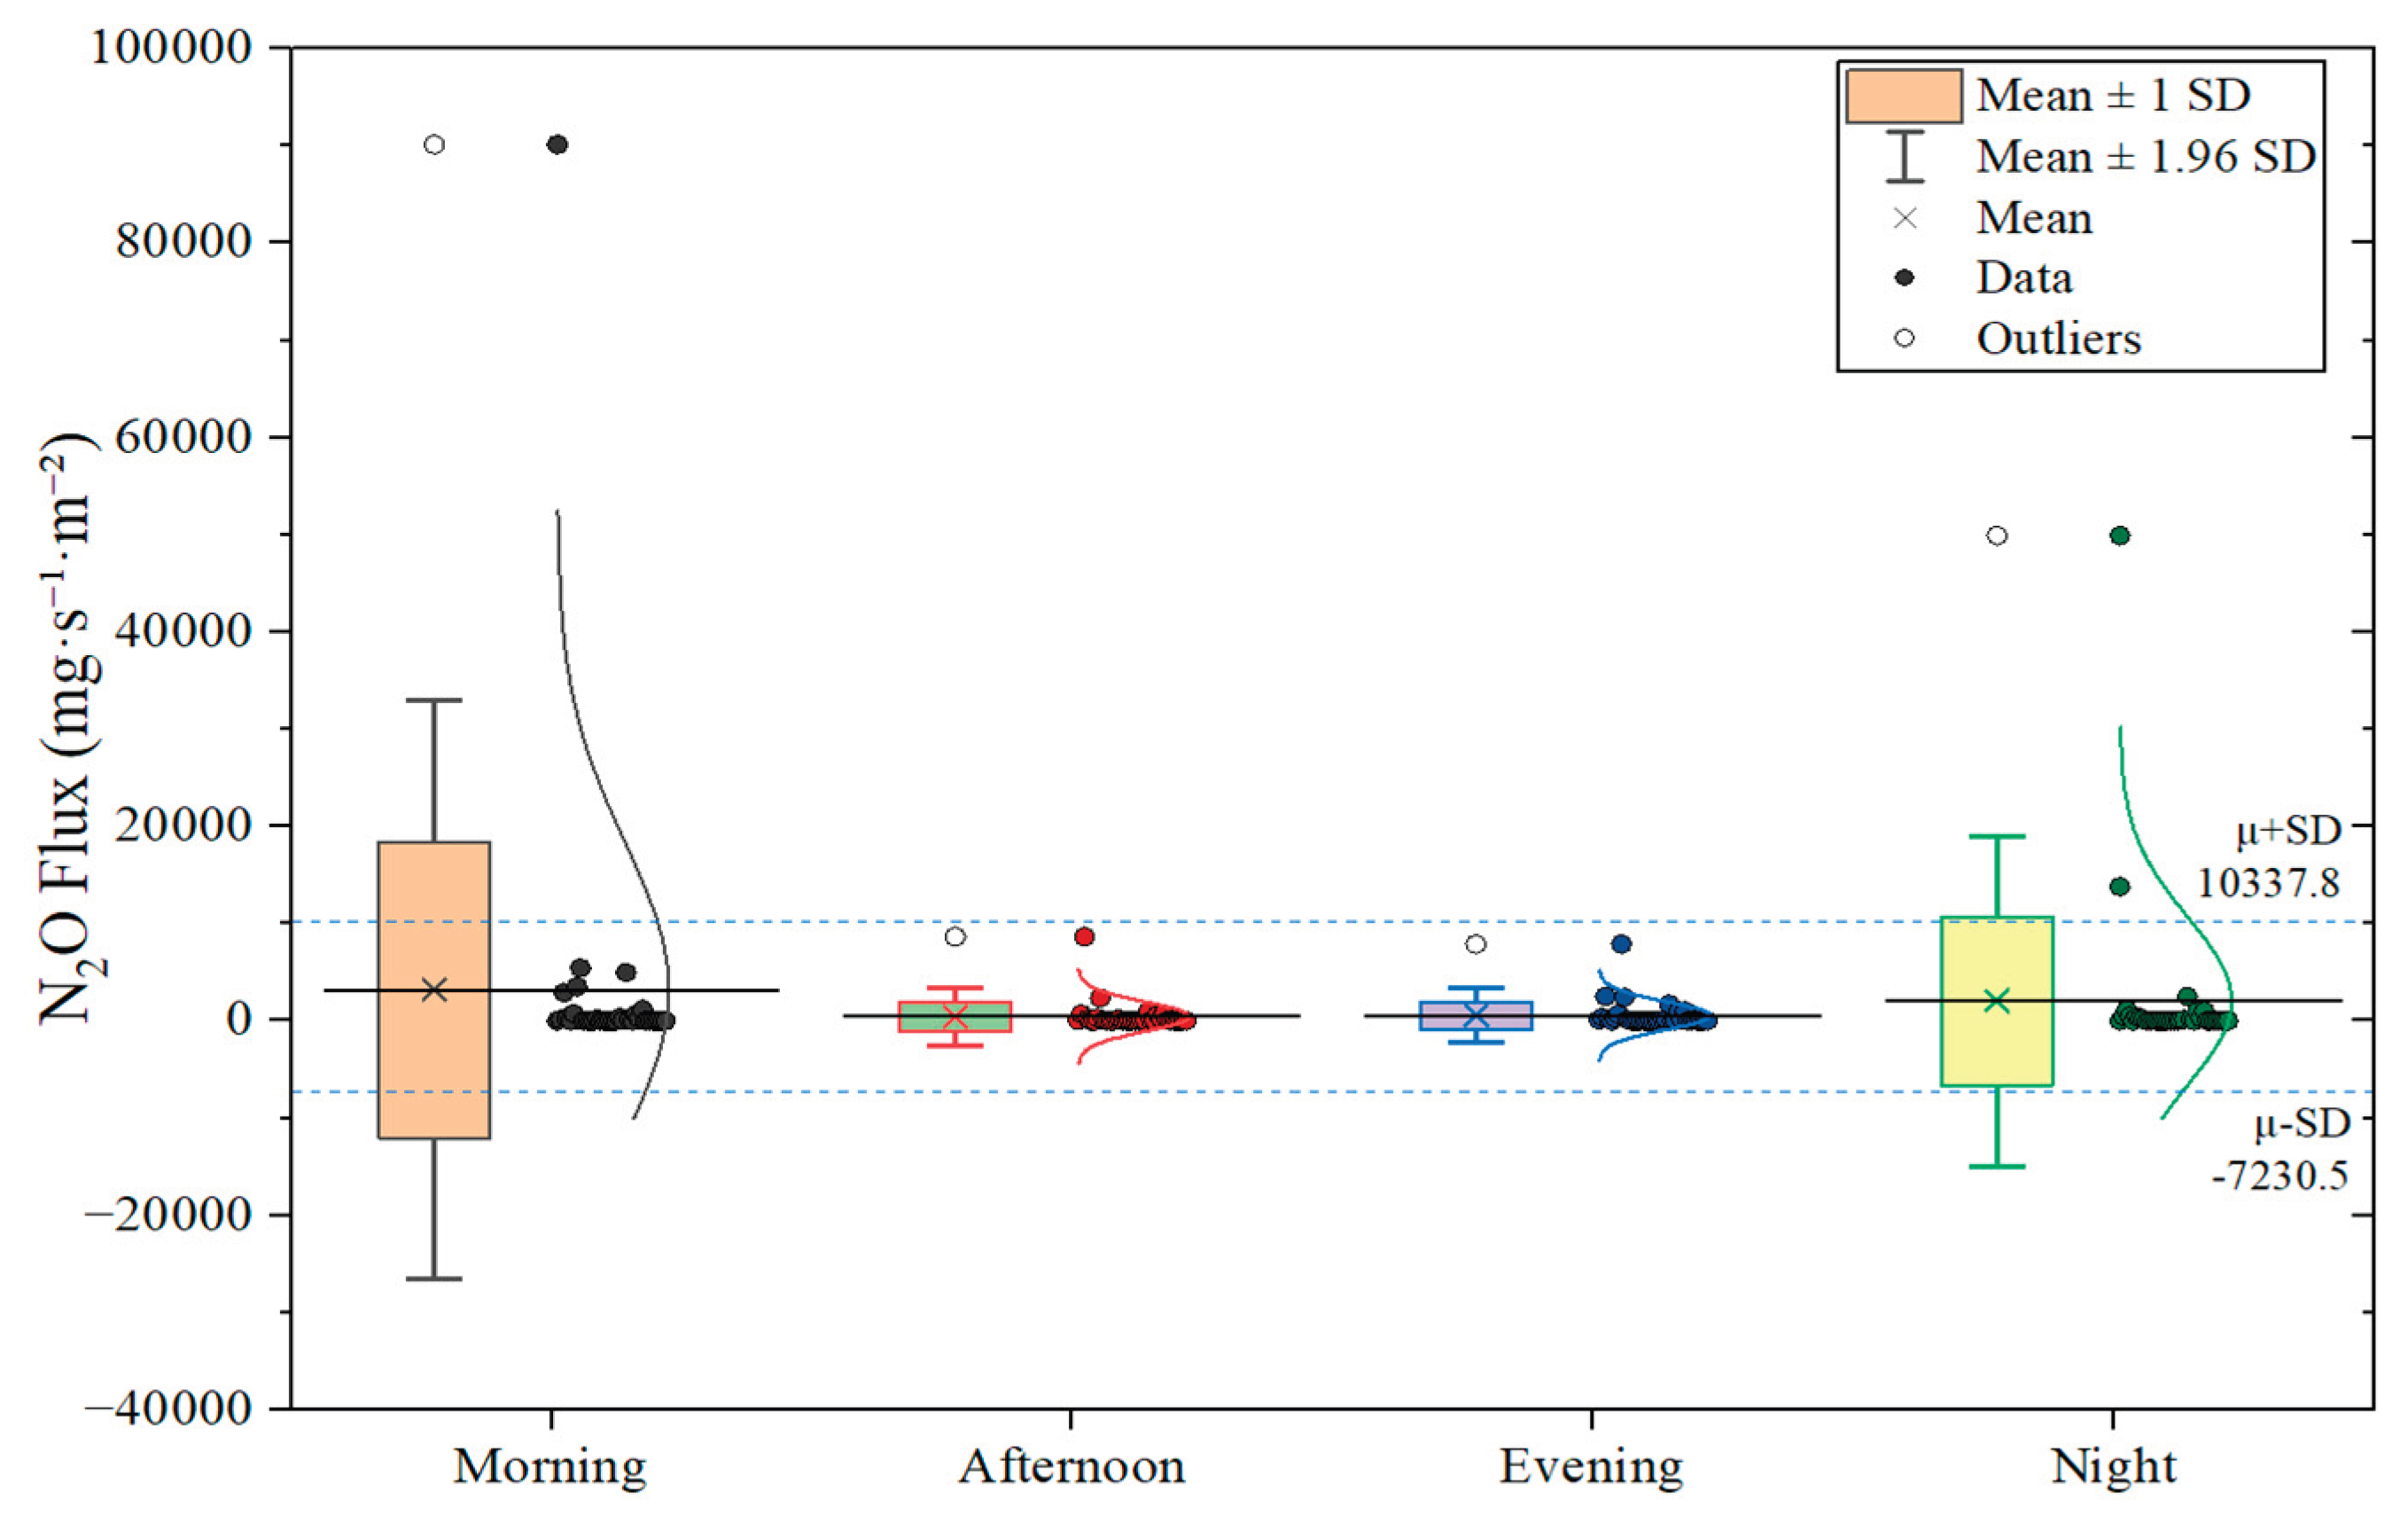
Figure 6.
Treatment stage variability in CH₄ and N₂O fluxes measured across the swine wastewater process.
Figure 6.
Treatment stage variability in CH₄ and N₂O fluxes measured across the swine wastewater process.
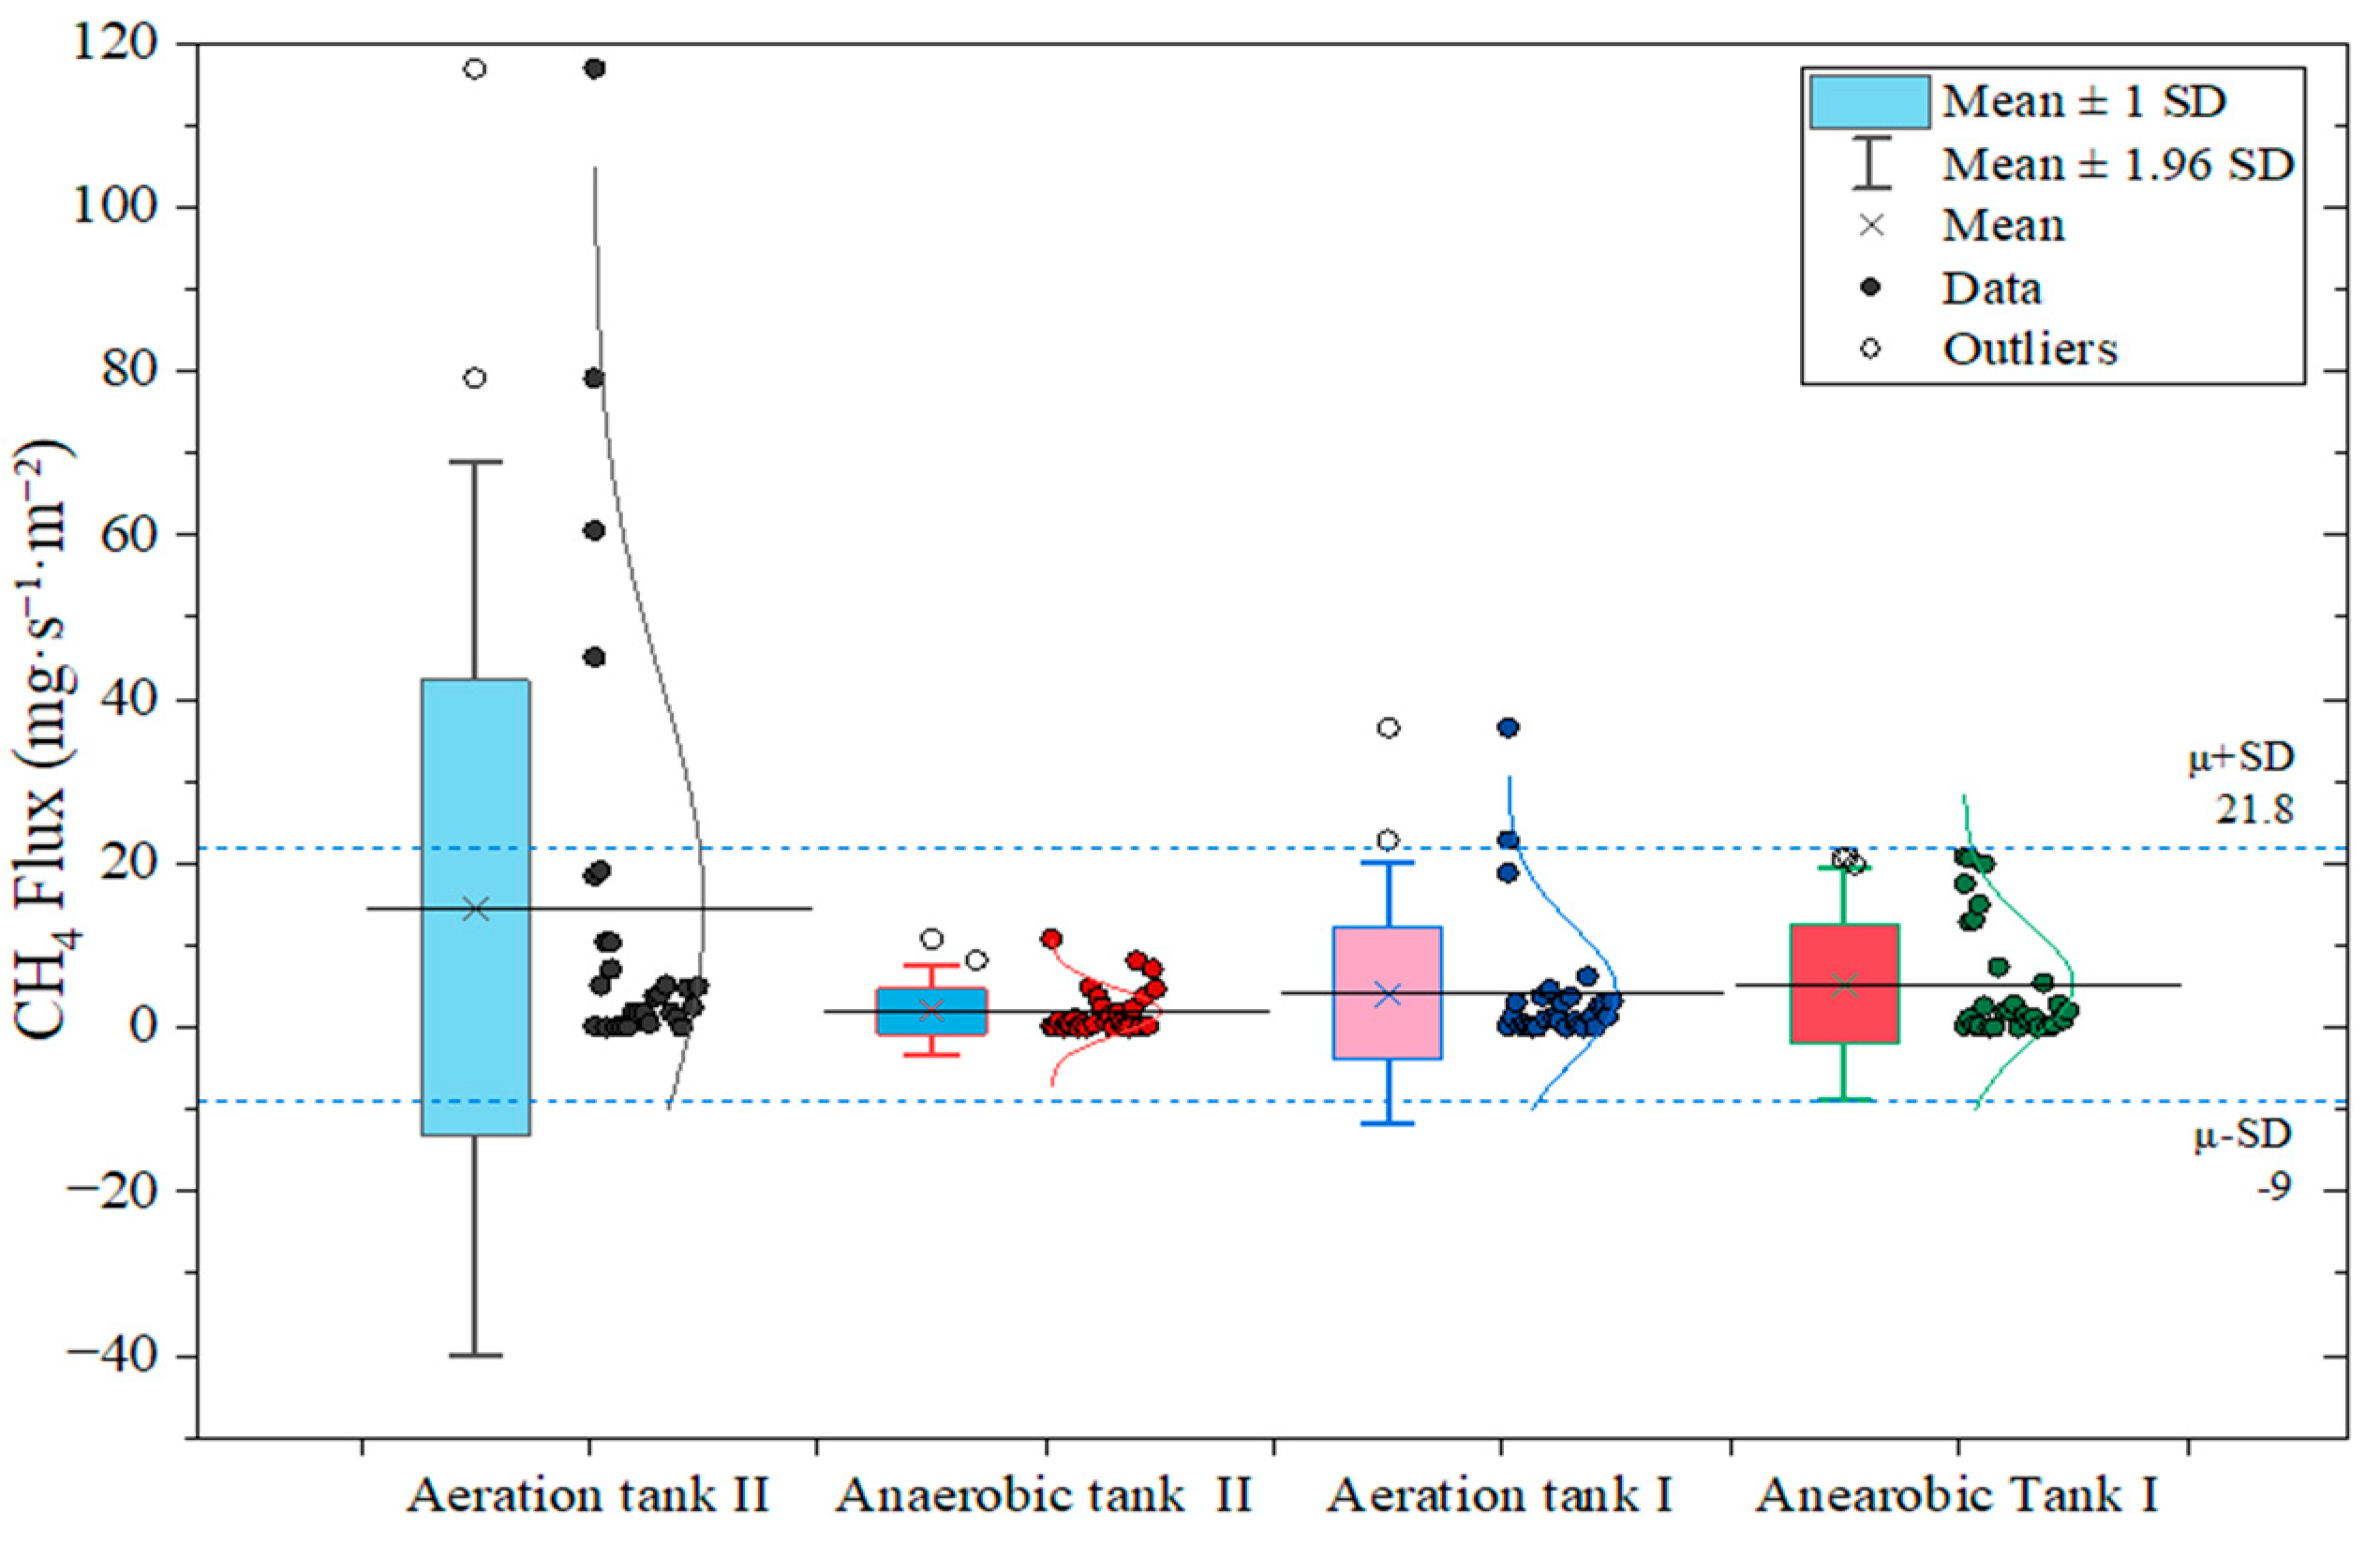
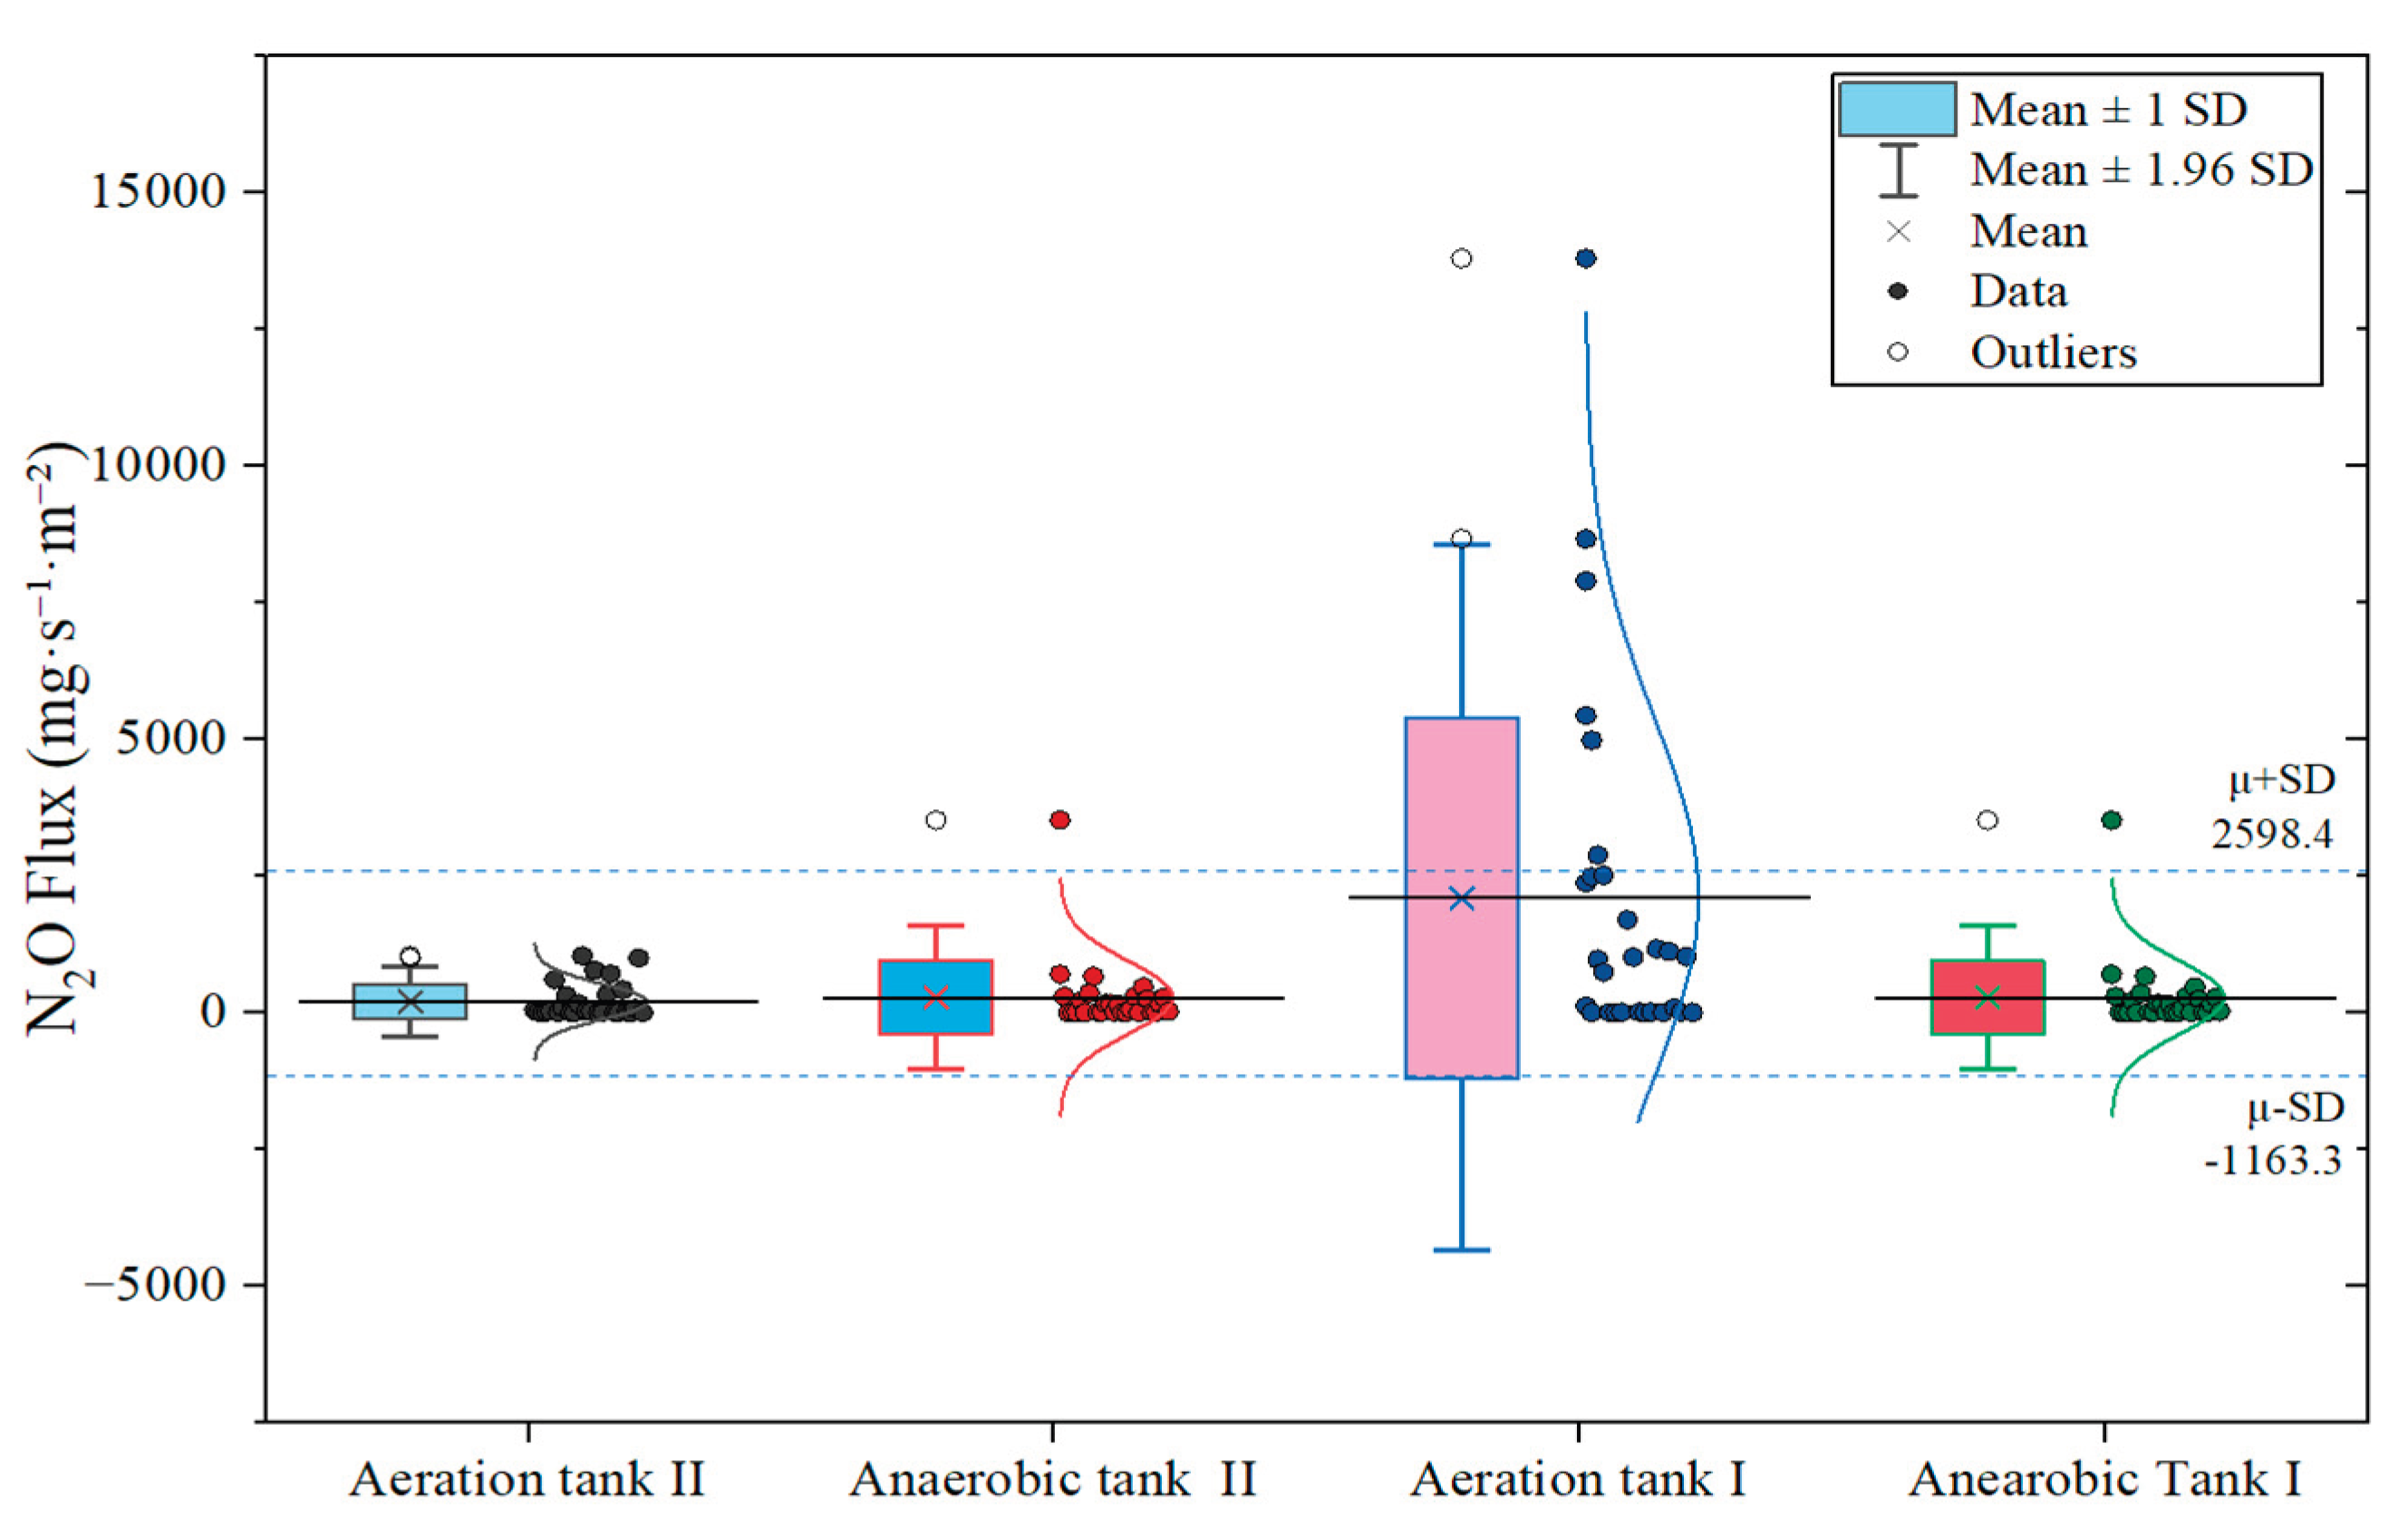
Figure 7.
Seasonal variations in CH₄ (top) and N₂O (bottom) fluxes across the monitoring period.
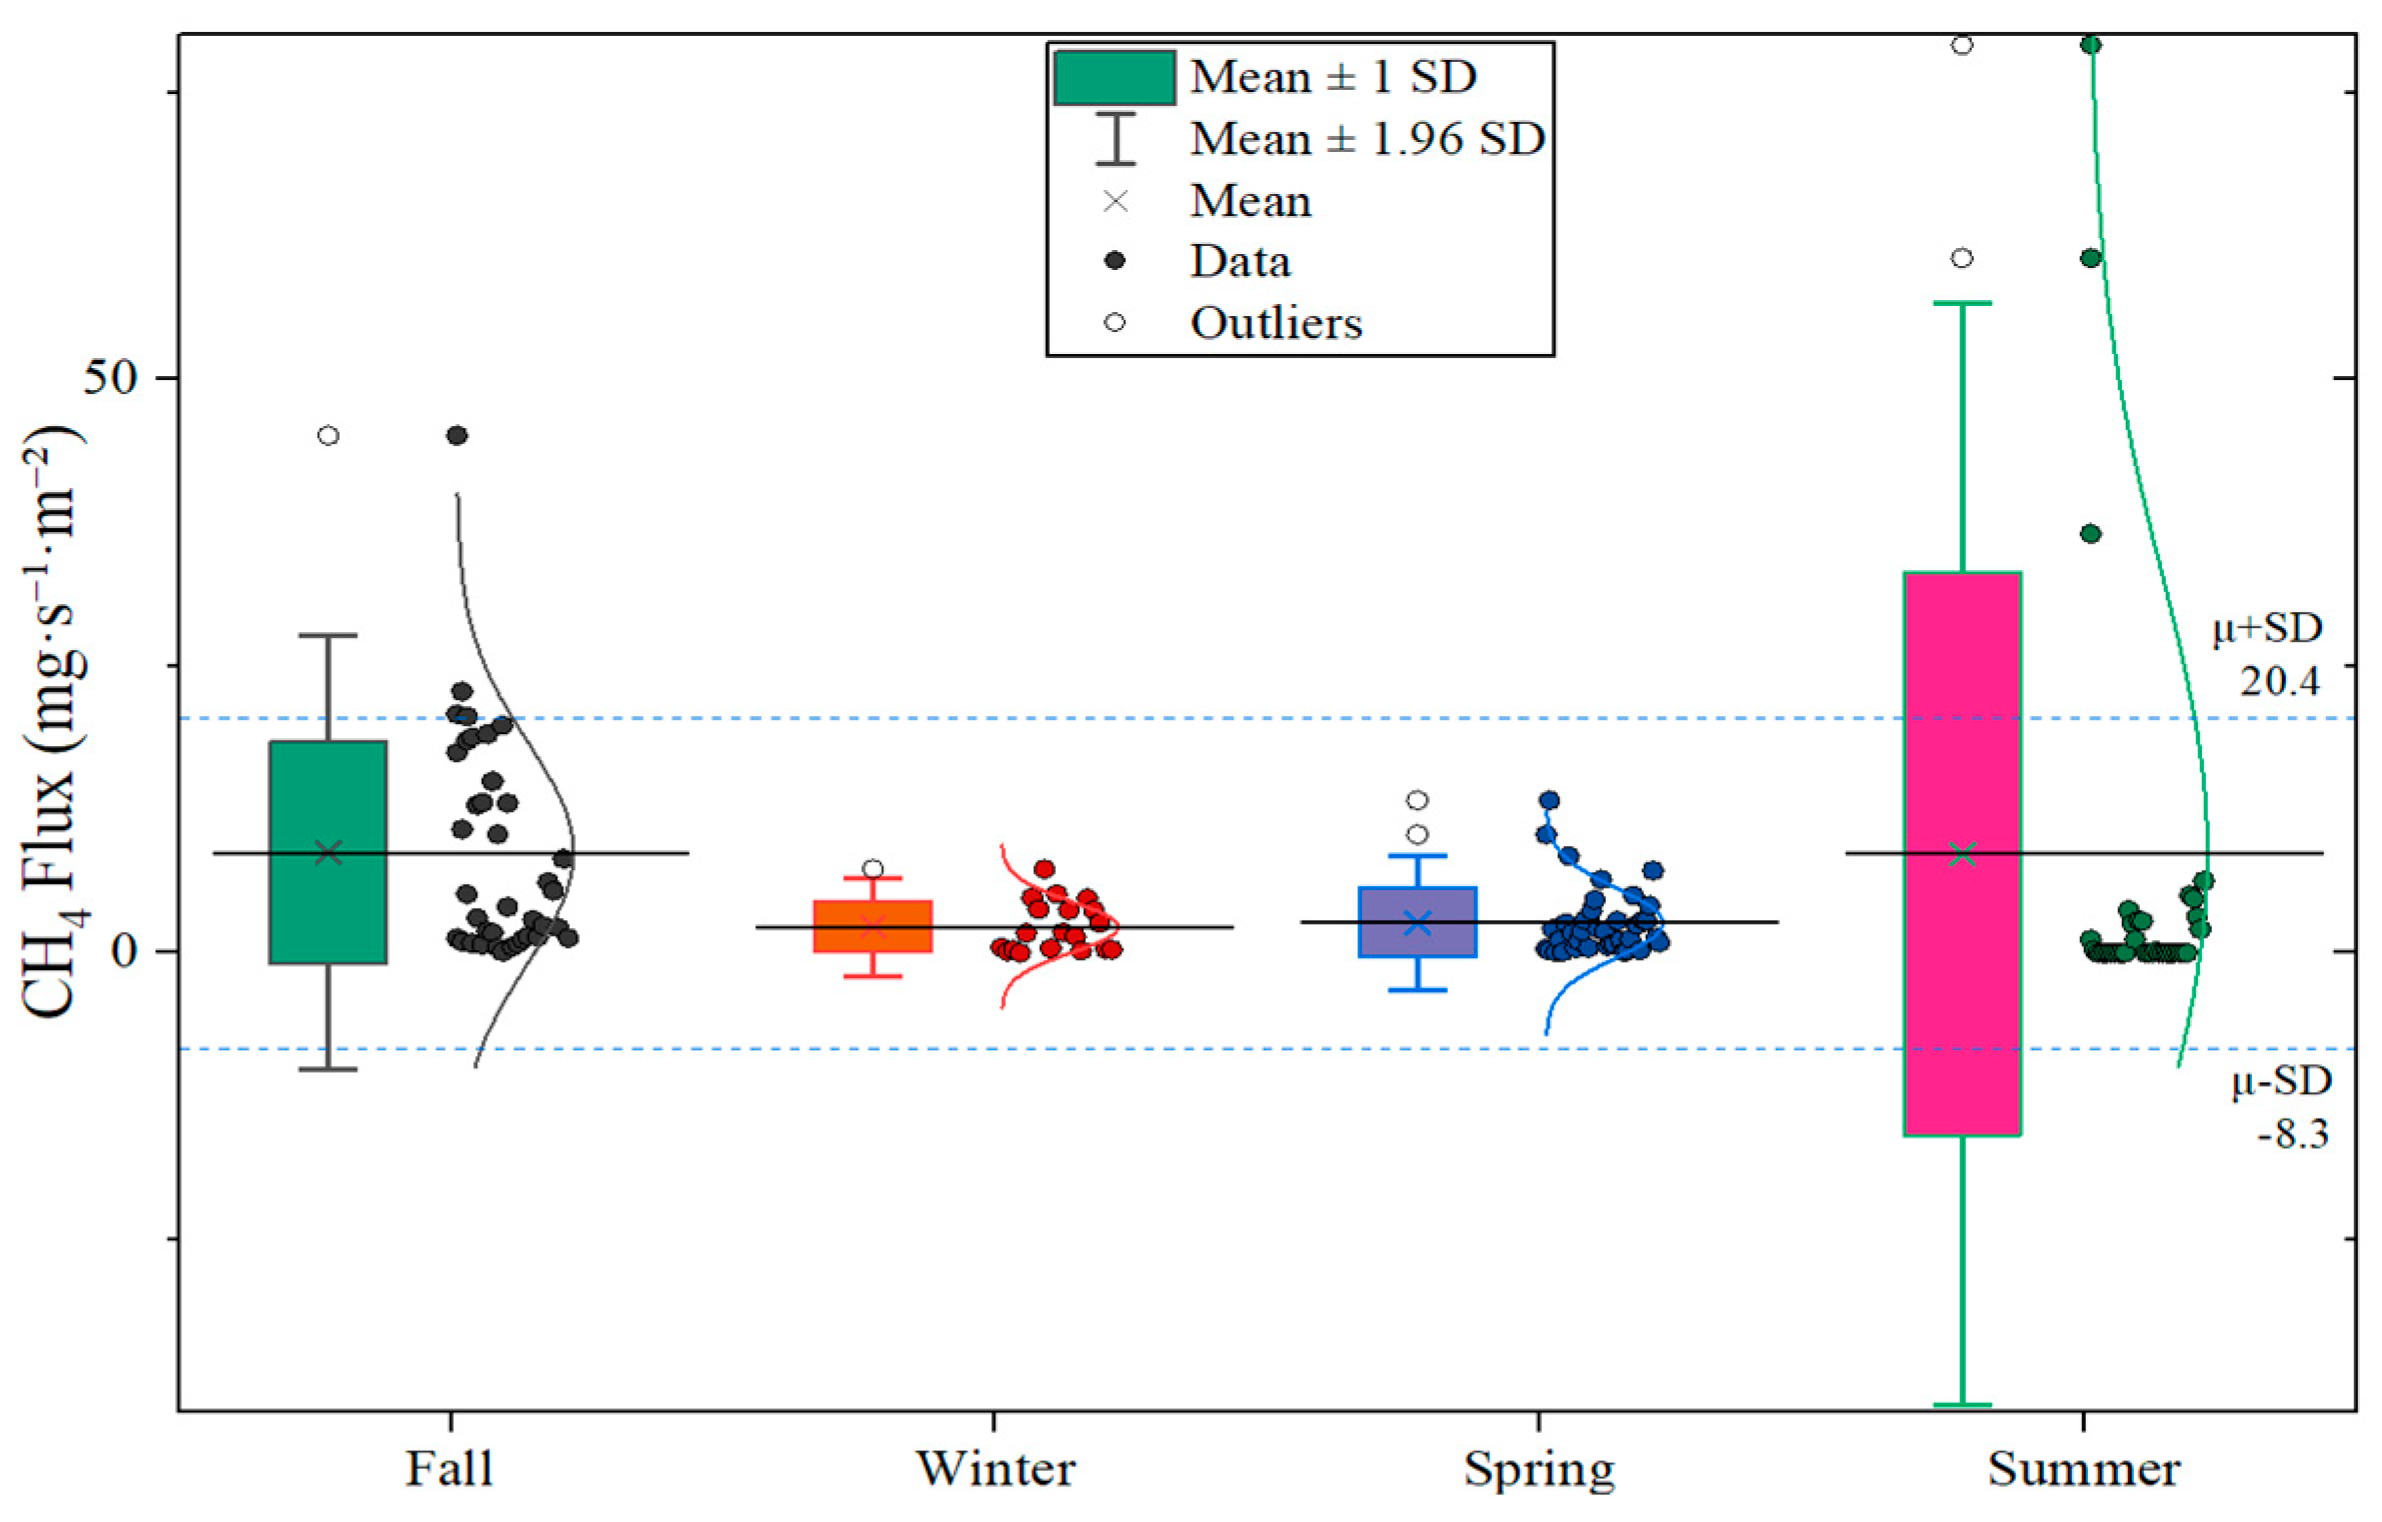
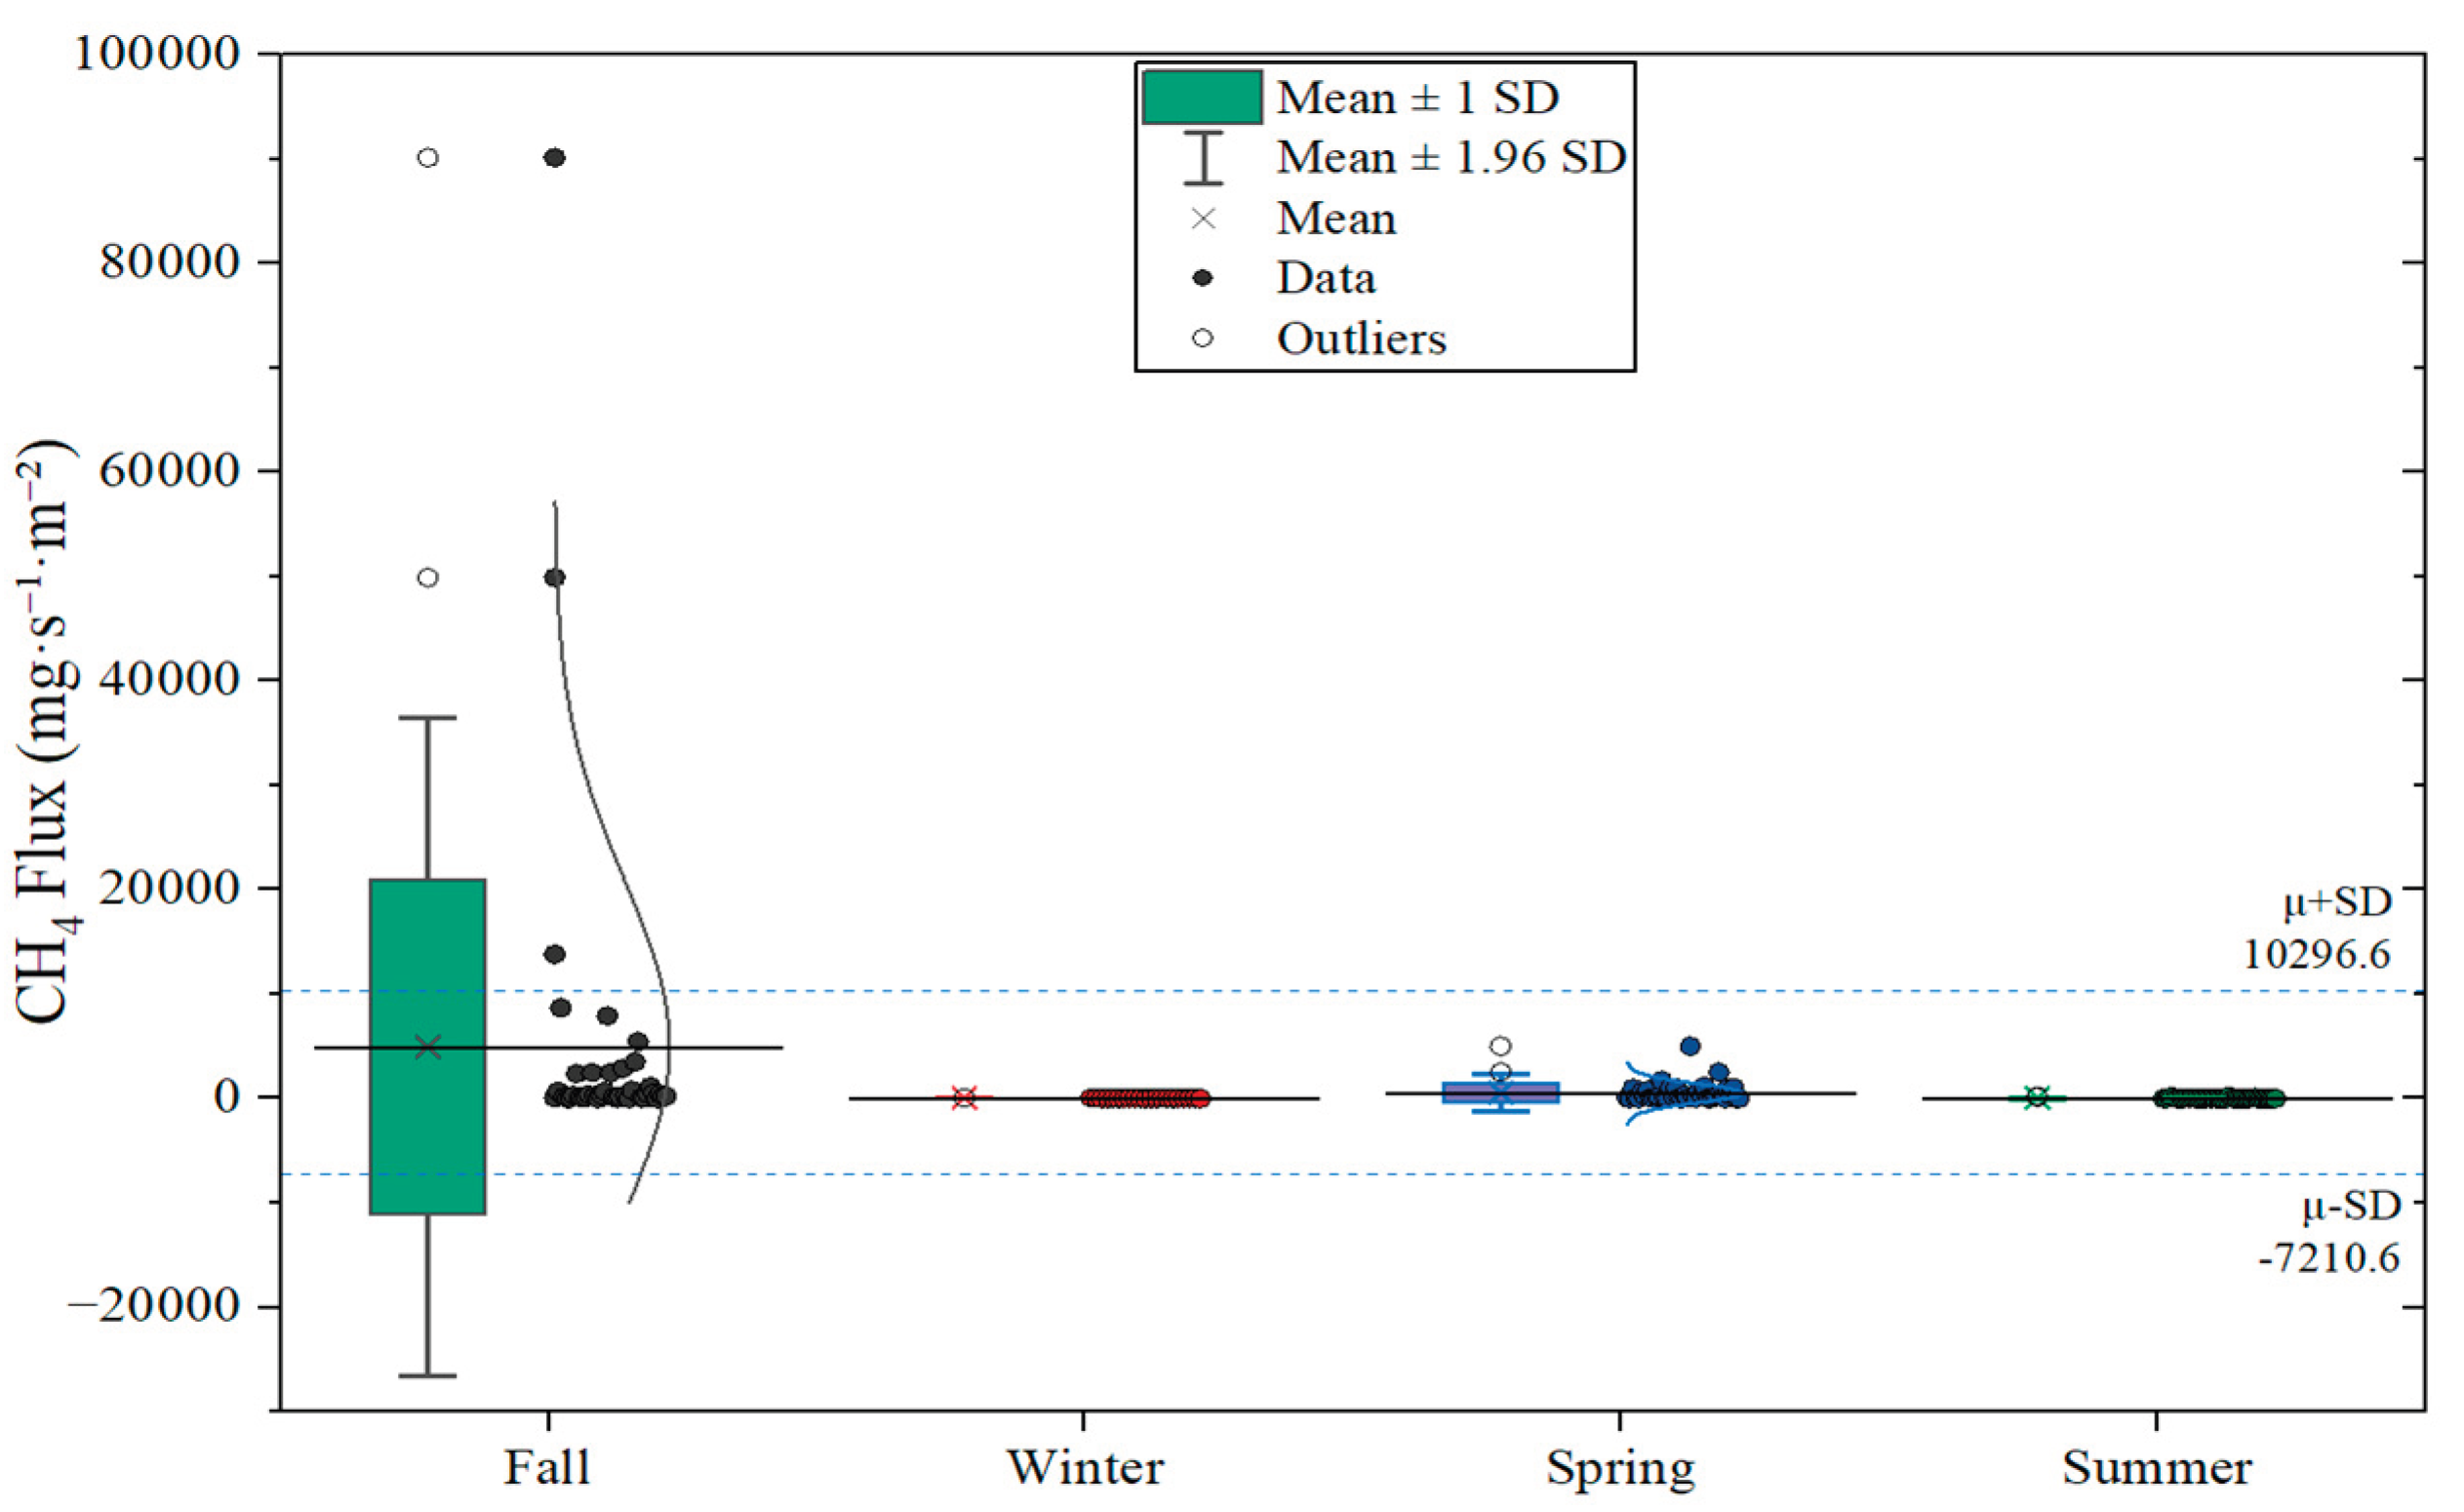
Figure 8.
Seasonal scale linear regressions between GHG flux and temperature (○), and relative humidity (◇). Each color represents a seasonal mean: Spring, Summer, Fall, and Winter.
Figure 8.
Seasonal scale linear regressions between GHG flux and temperature (○), and relative humidity (◇). Each color represents a seasonal mean: Spring, Summer, Fall, and Winter.
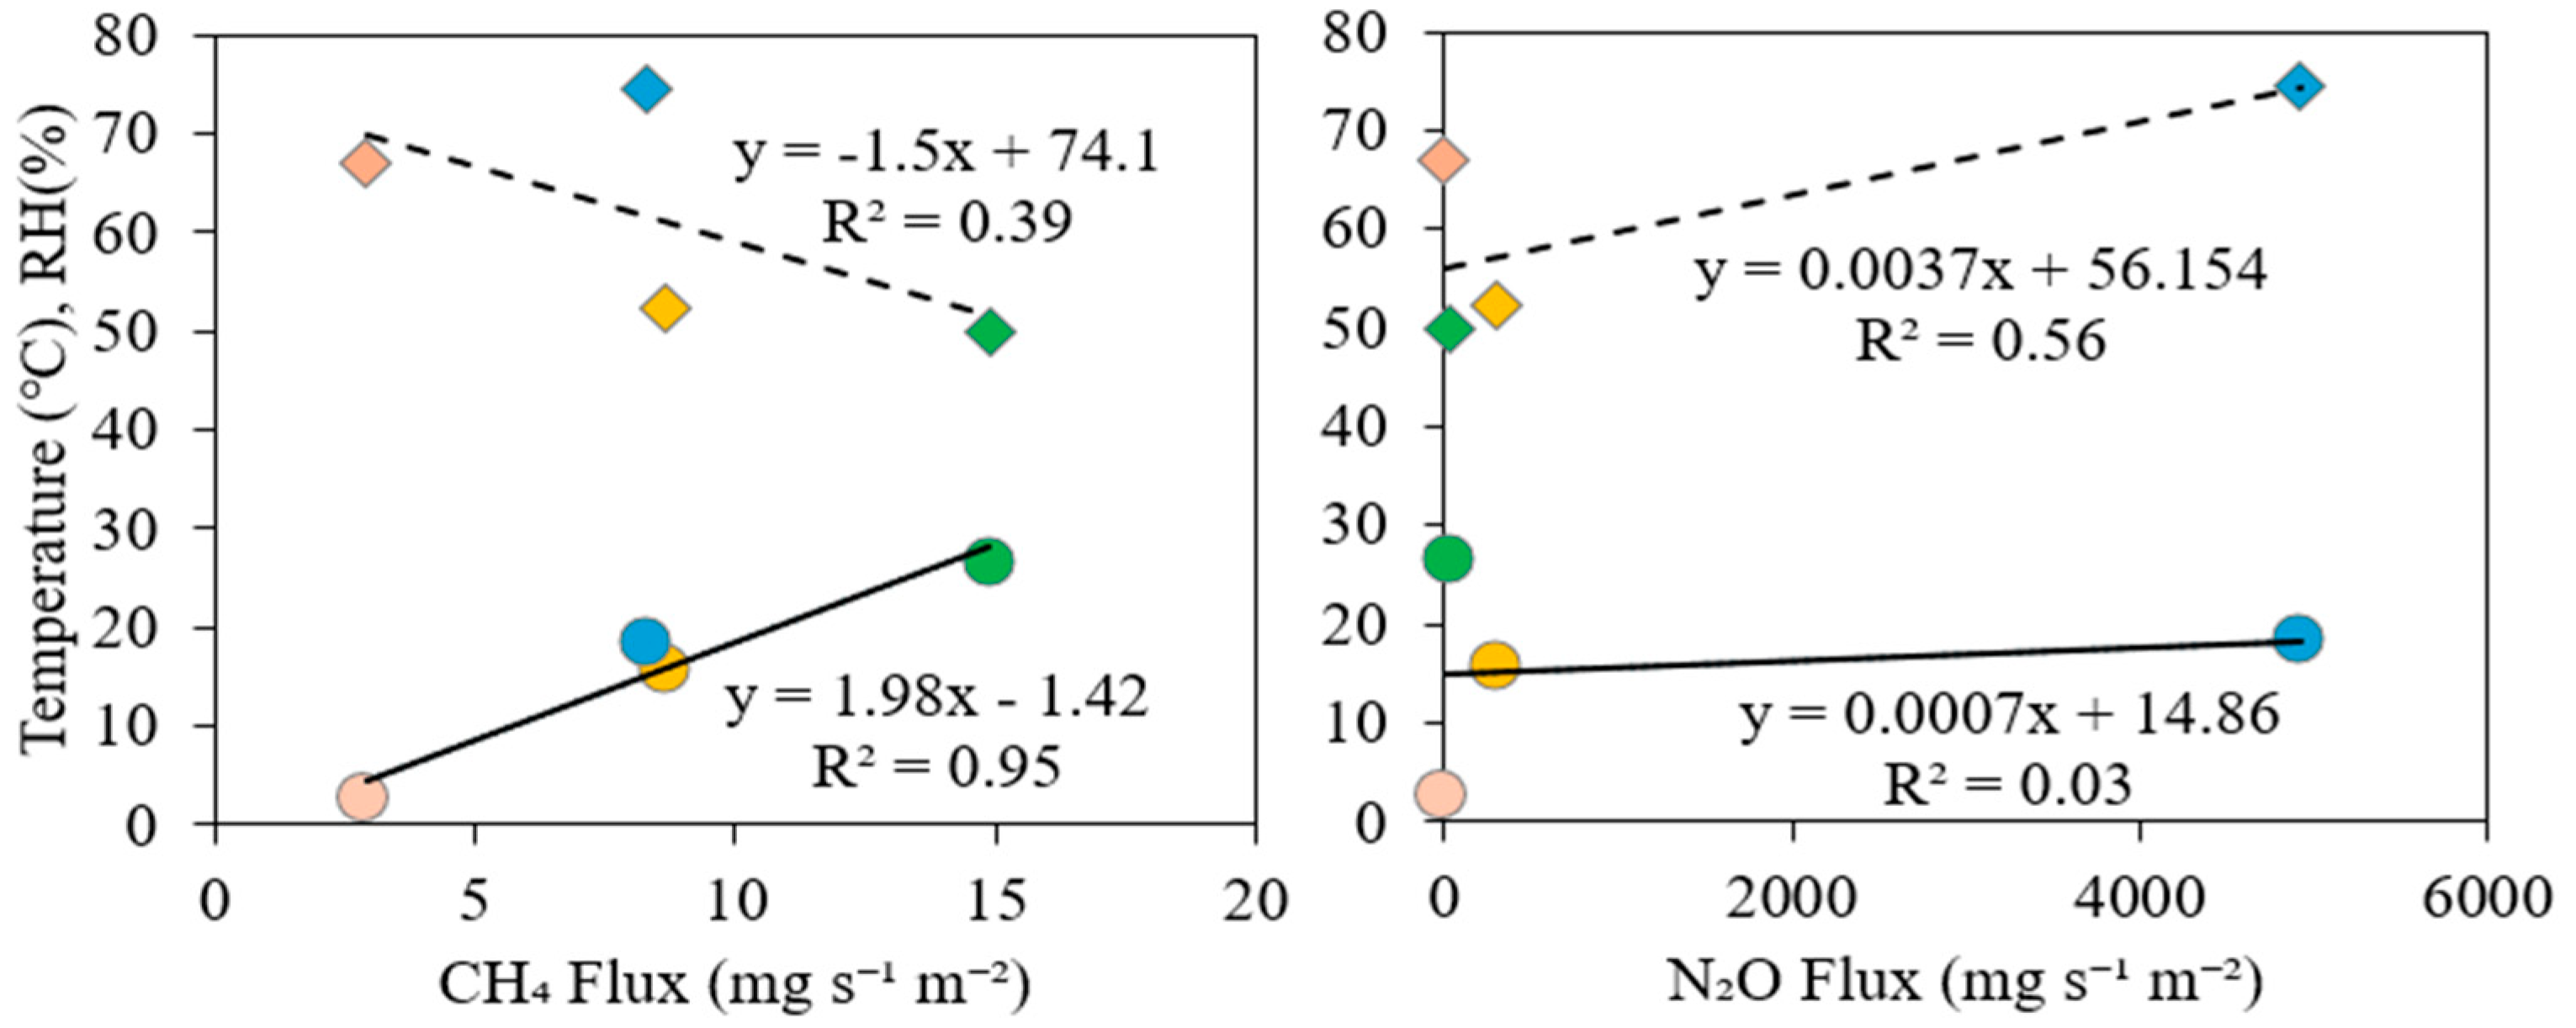
Figure 9.
Linear regressions between GHG and temperature (□) and relative humidity (△). Each color represents the corresponding diurnal period: Afternoon, Evening, andNight, Morning.
Figure 9.
Linear regressions between GHG and temperature (□) and relative humidity (△). Each color represents the corresponding diurnal period: Afternoon, Evening, andNight, Morning.
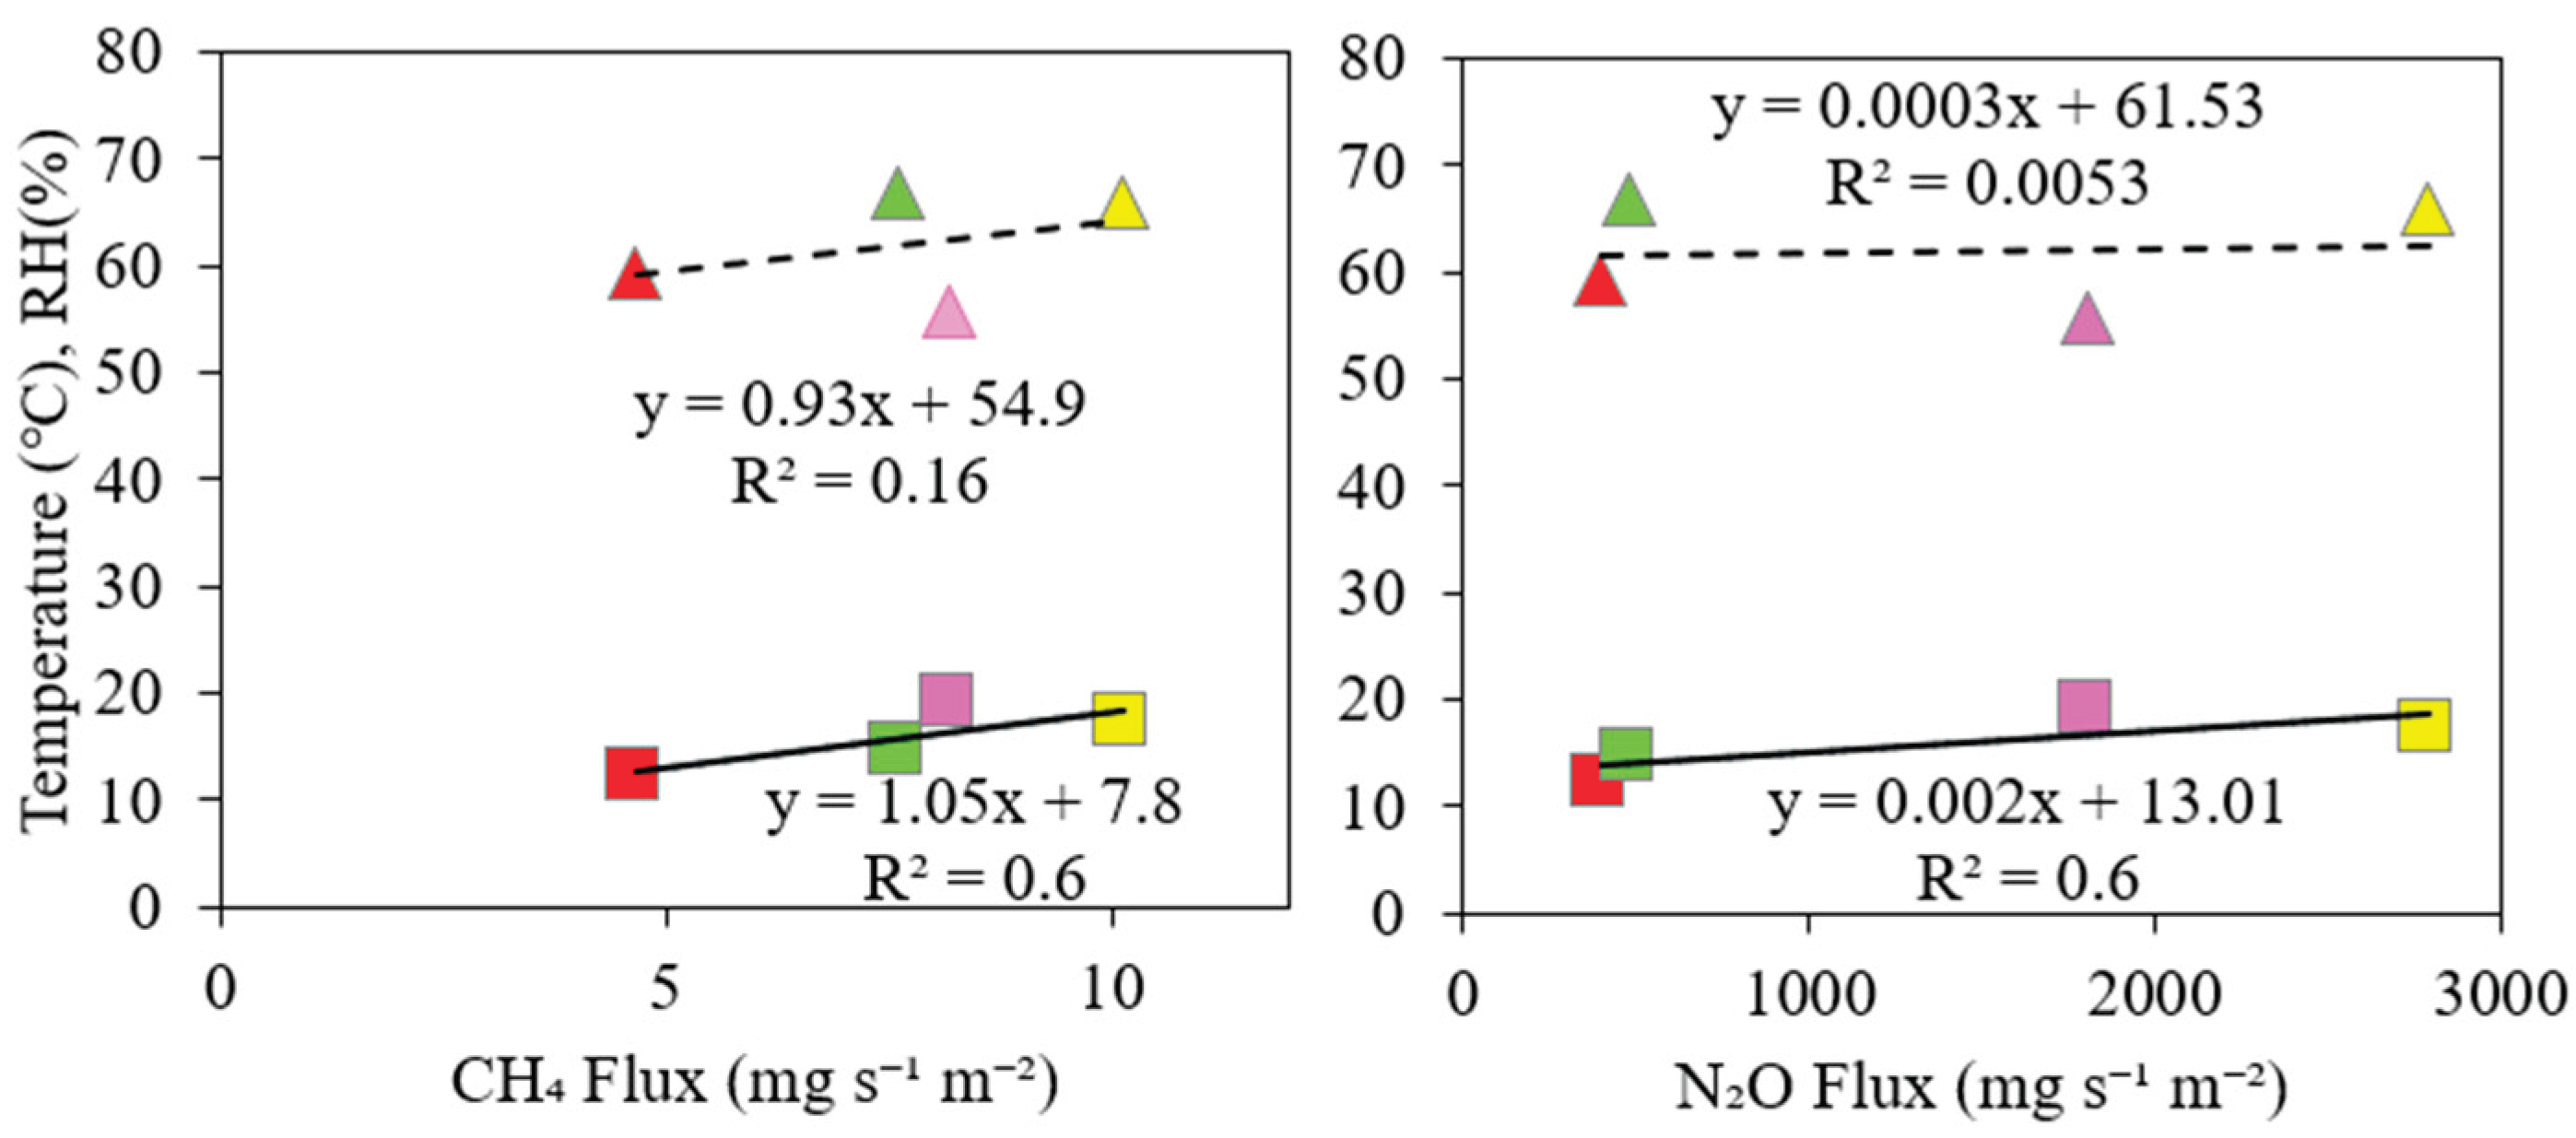

Table 1.
Average annual weather conditions of the study area during the experiment period.
| Index | Fall | Winter | spring | summer |
| Wind speed (m/s) | 1.2 | 1.5 | 2.0 | 1.7 |
| Temperature (℃) | 18.0 | 1.5 | 13.4 | 26.5 |
| Relative humidity (%) | 75.3 | 69.9 | 64.5 | 74.9 |
Table 2.
Summary of diurnal CH₄ and N₂O flux statistics from pig wastewater treatment system. Values represent the Mean, standard deviation (SD), standard error (SE), coefficient of variation (CV), and maximum observed flux (n =35 per period).
Table 2.
Summary of diurnal CH₄ and N₂O flux statistics from pig wastewater treatment system. Values represent the Mean, standard deviation (SD), standard error (SE), coefficient of variation (CV), and maximum observed flux (n =35 per period).
| Period | GHG | Mean | SD | SE of mean | CV | Max |
| Morning | CH4 | 5.8 | 19.8 | 3.3 | 3.4 | 116.8 |
| N2O | 3174.6 | 15199.2 | 2569.1 | 4.8 | 90162.9 | |
| Afternoon | CH4 | 3.2 | 7.5 | 1.3 | 2.3 | 36.5 |
| N2O | 439.9 | 1501.4 | 253.8 | 3.4 | 8671.8 | |
| Evening | CH4 | 7.0 | 14.1 | 2.4 | 2.0 | 79.1 |
| N2O | 543.6 | 1434.7 | 242.5 | 2.6 | 7900.4 | |
| Night | CH4 | 7.2 | 12.4 | 2.1 | 1.7 | 60.5 |
| N2O | 2056.5 | 8650.5 | 1462.2 | 4.2 | 49913.1 |
Table 3.
Summary of treatment stage specific CH₄ and N₂O flux statistics from pig wastewater treatment system. Values represent the Mean, standard deviation (SD), standard error (SE), coefficient of variation (CV), and maximum observed flux (n=35 per period).
Table 3.
Summary of treatment stage specific CH₄ and N₂O flux statistics from pig wastewater treatment system. Values represent the Mean, standard deviation (SD), standard error (SE), coefficient of variation (CV), and maximum observed flux (n=35 per period).
| Period | GHG | Mean | SD | SE of mean | CV | Max |
| Aeration tank I | CH4 | 4.3 | 8.3 | 1.6 | 1.9 | 36.5 |
| N2O | 2108.4 | 3297.3 | 623.1 | 1.6 | 13803.1 | |
| Aeration tank II | CH4 | 14.5 | 27.8 | 5.3 | 1.9 | 116.8 |
| N2O | 202.9 | 323.2 | 61.1 | 1.6 | 1039.3 | |
| Anaerobic tank II | CH4 | 2.0 | 2.8 | 0.5 | 1.4 | 10.8 |
| N2O | 279.5 | 666.0 | 125.9 | 2.4 | 3522.4 | |
| Anaerobic Tank I | CH4 | 5.5 | 7.2 | 1.4 | 1.3 | 20.8 |
| N2O | 5163.9 | 19129.6 | 3615.2 | 3.7 | 90162.9 | |
| Raw water storage tank | CH4 | 2.7 | 3.7 | 0.7 | 1.4 | 13.3 |
| N2O | 13.5 | 39.9 | 7.5 | 2.9 | 181.8 |
Table 4.
Summary of seasonal CH₄ and N₂O flux statistics from the swine wastewater treatment system. Values represent the Mean, standard deviation (SD), standard error (SE), coefficient of variation (CV), and maximum observed flux for each 6-hour monitoring interval (n = 35 per period).
Table 4.
Summary of seasonal CH₄ and N₂O flux statistics from the swine wastewater treatment system. Values represent the Mean, standard deviation (SD), standard error (SE), coefficient of variation (CV), and maximum observed flux for each 6-hour monitoring interval (n = 35 per period).
| Seasons | GHG | Mean | SD | SE | CV | Max |
| Spring | CH4 | 5.8 | 19.8 | 3.3 | 3.4 | 116.8 |
| N2O | 3174.6 | 15199.2 | 2569.1 | 4.8 | 90162.9 | |
| Summer | CH4 | 3.2 | 7.5 | 1.3 | 2.3 | 36.5 |
| N2O | 439.9 | 1501.4 | 253.8 | 3.4 | 8671.8 | |
| Fall | CH4 | 7.0 | 14.1 | 2.4 | 2.0 | 79.1 |
| N2O | 543.6 | 1434.7 | 242.5 | 2.6 | 7900.4 | |
| Winter | CH4 | 7.2 | 12.4 | 2.1 | 1.7 | 60.5 |
| N2O | 2056.5 | 8650.5 | 1462.2 | 4.2 | 49913.1 |
Table 5.
ANOVA and ANCOVA results for CH₄ and N₂O fluxes across environmental and process factors (Significant effects at p < are in bold italic.).
Table 5.
ANOVA and ANCOVA results for CH₄ and N₂O fluxes across environmental and process factors (Significant effects at p < are in bold italic.).
| Factor | Gas | df | F | p | η² | Sig. | Key interpretation |
| Treatment stage | CH₄ | 4 | 3.8 | 0.006 | 0.09 | ** | Major driver of CH₄ variability |
| N₂O | 4 | 1.7 | 0.15 | 0.02 | n.s. | No stage dependence | |
| Temperature | CH₄ | 1 | 6.2 | 0.014 | 0.04 | * | CH₄ increases with temp. |
| N₂O | 1 | 4.4 | 0.038 | 0.03 | * | Weak positive temp. effect | |
| RH | CH₄ | 1 | 5.0 | 0.027 | 0.03 | * | Moderate positive effect |
| N₂O | 1 | 1.2 | 0.27 | 0.01 | n.s. | No significant RH influence | |
| Season | CH₄ | 3 | 1.9 | 0.12 | 0.02 | n.s. | Minor climatic influence |
| N₂O | 3 | 1.2 | 0.30 | 0.02 | n.s. | Minimal seasonal variation | |
| Period | CH₄ | 3 | 0.6 | 0.62 | 0.01 | n.s. | No significant period effect |
| N₂O | 3 | 0.8 | 0.51 | 0.01 | n.s. | No diurnal variation detected |
Notes: df = degrees of freedom; F = F-statistic; p = probability value; η² = partial eta-squared (effect size); Sig. = significance indicator; n.s. = not significant; * = p < 0.05. Tests include one-way ANOVA and ANCOVA using temperature and RH as covariates.
Disclaimer/Publisher’s Note: The statements, opinions and data contained in all publications are solely those of the individual author(s) and contributor(s) and not of MDPI and/or the editor(s). MDPI and/or the editor(s) disclaim responsibility for any injury to people or property resulting from any ideas, methods, instructions or products referred to in the content. |
© 2025 by the authors. Licensee MDPI, Basel, Switzerland. This article is an open access article distributed under the terms and conditions of the Creative Commons Attribution (CC BY) license (http://creativecommons.org/licenses/by/4.0/).
Copyright: This open access article is published under a Creative Commons CC BY 4.0 license, which permit the free download, distribution, and reuse, provided that the author and preprint are cited in any reuse.


