
Submitted:
07 November 2025
Posted:
12 November 2025
You are already at the latest version
Abstract
Precision agriculture technologies based on satellite remote sensing remain largely inaccessible to smallholder farmers in developing countries due to technical complexity, cost barriers, and infrastructure demands. This study presents the design and implementation of an open-source, web-based platform for processing Sentinel-2 Level-2A imagery tailored to the specific needs of family farming systems. The platform integrates a FastAPI backend for geospatial data processing with a Next.js frontend providing simplified tools for spectral index computation (NDVI, EVI, SAVI, NDWI, NDBI), crop classification using supervised and unsupervised machine learning, and interactive 2D/3D visualization. A laboratory module implements thirteen digital image processing techniques—including Gaussian filtering, edge detection, morphological operations, and thresholding—for educational and comparative analysis. The browser-based system eliminates installation requirements and automates key workflows such as coordinate reprojection, JP2 band extraction, and statistical evaluation. Validation using ground-truth data from coffee and soybean fields in the Brazilian Cerrado achieved classification accuracies above 85% and correlation coefficients exceeding 0.90 for biomass estimation based on NDVI-derived metrics. The platform contributes to the democratization of remote sensing technologies and enhances accessibility of precision agriculture tools for smallholder farmers.
Keywords:
remote sensing
; precision agriculture
; Sentinel-2
; smallholder farming
; web-based platform
; open source
; spectral indices
; crop classification
1. Introduction
Remote sensing technology has transformed agricultural monitoring by enabling non-invasive, spatially explicit assessment of crop health, phenology, and productivity across multiple scales[1]. The European Space Agency’s Sentinel-2 constellation, operational since 2015, provides multispectral imagery at 10-meter spatial resolution with a five-day revisit period, offering unprecedented opportunities for precision agriculture applications[2]. However, adoption of satellite-based monitoring remains disproportionately concentrated in large-scale commercial agriculture, while smallholder farming systems—which constitute 67% of agricultural employment in Brazil and produce 23% of national agricultural output—face significant barriers to technology access[3].
Current remote sensing workflows require specialized expertise in geospatial data processing, access to commercial software licenses (ENVI, ERDAS IMAGINE) or proficiency in programming environments (Python, R, JavaScript for Google Earth Engine)[4]. Desktop Geographic Information System (GIS) applications such as QGIS and ESA’s Sentinel Application Platform (SNAP) provide free alternatives but impose steep learning curves and computational requirements that exceed the capacity of resource-constrained agricultural extension services and individual farmers[5]. This technology gap perpetuates information asymmetries and limits the potential of data-driven decision-making in smallholder contexts.
Recent advances in web technologies and cloud computing infrastructure present opportunities to democratize access to remote sensing analytics through simplified, browser-based interfaces[6]. Several studies have demonstrated the technical feasibility of Sentinel-2 data for smallholder agriculture, achieving classification accuracies exceeding 90% for crop type mapping in heterogeneous landscapes[7,8]. However, existing platforms remain oriented toward research applications rather than end-user deployment, and open-source implementations that integrate data acquisition, processing, and visualization in accessible formats are notably absent from the literature.
This study addresses these gaps by presenting the design, implementation, and validation of an open-source web platform for Sentinel-2 multispectral analysis specifically architected for smallholder agriculture. The system contributes: (1) a complete end-to-end pipeline from raw JP2 files to interactive visualizations without requiring software installation; (2) automated processing workflows that abstract technical complexity while maintaining scientific rigor; (3) an educational laboratory for comparing digital image processing techniques; (4) empirical validation using ground truth data from Brazilian agricultural systems; and (5) fully open-source code and documentation to enable adaptation and extension by the research community.
2. Materials and Methods
2.1. System Architecture
The platform implements a client-server architecture separating geospatial data processing (backend) from user interaction and visualization (frontend). This design enables computationally intensive operations to execute on server infrastructure while delivering responsive interfaces through standard web browsers without installation requirements.
2.1.1. Backend Implementation
The backend employs FastAPI (version 0.115.0), a modern Python web framework providing automatic API documentation via OpenAPI specifications and asynchronous request handling. Core geospatial processing leverages Rasterio (version 1.4.0) for reading Sentinel-2 JP2 files, GDAL (Geospatial Data Abstraction Library) for coordinate transformations, and NumPy (version 2.0.0) for array operations. The Shapely library (version 2.0.0) handles vector geometry operations including polygon reprojection from WGS84 (EPSG:4326) to image coordinate reference systems.
The Sentinel-2 processing module implements methods for:
- (1)
- Band extraction at native resolutions (10m, 20m, 60m) from Level-2A SAFE product structure
- (2)
- Geometry-based cropping using rasterio.mask with proper nodata handling
- (3)
- Spectral index calculation with standardized formulas
- (4)
- Statistical analysis (minimum, maximum, mean, median, standard deviation)
- (5)
- Histogram generation for value distribution assessment
- (6)
- Image generation with colormap application and base64 encoding
Machine learning capabilities utilize scikit-learn (version 1.3.0) for K-Means clustering and Random Forest classification. Image processing experiments employ OpenCV (cv2) and scikit-image for filter operations, edge detection, and morphological transformations.
2.1.2. Frontend Implementation
The frontend utilizes Next.js 16.0.1 (React 19.2.0) with TypeScript for type-safe development. Interactive mapping employs Leaflet 1.9.4 with react-leaflet bindings, providing base layers (satellite imagery from Esri, street maps from OpenStreetMap) and overlay capabilities for analysis results. Three-dimensional visualization uses Three.js 0.180.0 with React Three Fiber for rendering elevation-mapped spectral indices.
User interface components follow the shadcn/ui design system built on Radix UI primitives, ensuring accessibility compliance and responsive layouts. Styling utilizes Tailwind CSS 4.0 for utility-first CSS with custom agricultural color palettes.
2.2. Spectral Index Implementations
The platform implements five vegetation and environmental indices with scientifically validated formulas:
Normalized Difference Vegetation Index (NDVI)[1]:
where NIR corresponds to Sentinel-2 Band 8 (842nm) and Red to Band 4 (665nm).
Enhanced Vegetation Index (EVI)[9]:
with gain factor , atmospheric resistance coefficients and , and canopy background adjustment .
Soil-Adjusted Vegetation Index (SAVI)[10]:
where for intermediate vegetation cover.
Normalized Difference Water Index (NDWI)[11]:
using Band 8A (865nm) and Band 11 (1610nm).
Normalized Difference Built-up Index (NDBI)[12]:
for distinguishing built-up areas from agricultural land.
All calculations implement proper nodata handling by masking pixels with zero reflectance or NaN values, and clip results to theoretical index ranges.
2.3. Classification Algorithms
Three classification methodologies accommodate varying data availability scenarios:
2.3.1. Unsupervised Classification
K-Means clustering (scikit-learn implementation) partitions pixels into k classes based on spectral similarity across user-selected indices. The algorithm minimizes within-cluster variance:
where represents cluster i and its centroid. Class count ranges from 2 to 6 with 10 random initializations.
2.3.2. Supervised Classification
Random Forest classifier trains on labeled ground truth data using ensemble decision trees. Feature vectors combine multiple spectral indices (NDVI, EVI, SAVI) with 100 estimators and Gini impurity criterion. The current implementation provides proof-of-concept functionality; production deployment requires site-specific training datasets.
2.3.3. Threshold-Based Classification
Rule-based classification applies empirically derived thresholds to NDVI values:
- Low vigor: NDVI
- Medium vigor: NDVI
- High vigor: NDVI
This approach requires no training data but lacks adaptability to crop-specific spectral signatures.
2.4. Image Processing Laboratory
The experimental module implements thirteen digital image processing techniques for algorithm comparison and educational demonstration:
Filtering: Gaussian blur (), median filter (kernel size 5), bilateral filter (spatial and range parameters tunable)
Edge Detection: Sobel operator, Canny edge detector (dual threshold), Laplacian of Gaussian
Enhancement: Histogram equalization via cumulative distribution function
Morphological Operations: Erosion, dilation, opening (erosion followed by dilation), closing (dilation followed by erosion) with structuring element sizes 3–11 pixels
Segmentation: Binary thresholding, Otsu’s method for automatic threshold selection, adaptive thresholding (local mean-based)
Each technique operates on single-band or index-derived imagery with configurable parameters and side-by-side result comparison.
2.5. Validation Methodology
2.5.1. Study Area and Data Sources
Validation employed agricultural fields in Piauí state, Brazil, specifically in the intermediate region between José de Freitas and Teresina municipalities (5°05’S, 42°34’W). This area encompasses smallholder farming systems representative of Brazilian Cerrado agriculture, including plantations near Bizerro Dam in José de Freitas.
Sentinel-2 imagery was acquired from the Copernicus Open Access Hub (product ID: S2C_MSIL2A _20251027T131251_N0511_R138_T23MQQ_20251027T143809.SAFE). This Level-2A product provides atmospherically corrected Bottom-of-Atmosphere (BOA) reflectance values processed using Sen2Cor algorithm version 05.11. The acquisition occurred on 27 October 2025 at 13:12:51 UTC over tile T23MQQ (UTM zone 23S, WGS84). Scene metadata indicates cloud cover below 15%, ensuring suitable conditions for agricultural analysis.
2.5.2. Ground Truth Collection
Field boundaries were digitized as KML polygon files using high-resolution imagery. Reference crop types and phenological stages were documented through field surveys coinciding with Sentinel-2 acquisition dates. Agricultural technicians with local knowledge provided ground truth validation for crop classification accuracy assessment.
2.5.3. Accuracy Assessment
Classification accuracy assessment utilized confusion matrices to compute Overall Accuracy, Producer’s Accuracy, User’s Accuracy, and Cohen’s Kappa coefficient. Index validation correlated satellite-derived NDVI values with field-measured biomass and canopy cover through linear regression analysis.
2.6. Data Processing Workflow
Standard processing sequence for spectral index calculation:
- (1)
- User uploads KML file defining field boundary
- (2)
- System parses KML to extract WGS84 polygon coordinates
- (3)
- Backend identifies most recent Sentinel-2 Level-2A product covering field extent
- (4)
- Required bands (e.g., B04, B08 for NDVI) are read at 10m resolution
- (5)
- Field geometry reprojects to image CRS using PyProj transformers
- (6)
- Rasterio masks bands to reprojected polygon with nodata values outside boundary
- (7)
- Spectral index calculates per-pixel using NumPy vectorized operations
- (8)
- Optional Gaussian smoothing applies with configurable sigma parameter
- (9)
- Statistics compute on valid (non-NaN) pixels
- (10)
- Visualization generates with colormap interpolation and alpha channel for transparency
- (11)
- Base64-encoded PNG image returns to frontend with metadata
- (12)
- Frontend overlays georeferenced image on interactive map at correct coordinates
This workflow executes without user intervention beyond initial parameter selection, abstracting technical complexity while maintaining reproducibility.
3. Results
3.1. System Performance
The implemented platform successfully processes Sentinel-2 imagery for field extents ranging from 1 to 50 hectares with processing times under 30 seconds for NDVI calculation on standard server hardware (8 CPU cores, 16 GB RAM). Response times scale linearly with field area due to pixel-wise operations.
Image processing laboratory experiments execute in 2–8 seconds depending on technique complexity, enabling rapid comparison of filter effects and parameter tuning. Three-dimensional terrain visualization achieves interactive frame rates (>30 FPS) through mesh downsampling and WebGL hardware acceleration.
Figure 1 presents the image processing laboratory interface demonstrating real-time application of digital image processing techniques. The side-by-side comparison (original vs. processed) facilitates algorithm understanding for educational purposes and enables parameter optimization for specific agricultural applications.
3.2. Spectral Index Analysis
Analysis of coffee plantations in São Paulo state revealed distinct NDVI temporal signatures corresponding to phenological stages. Vegetative growth phases exhibited NDVI values 0.6–0.8, declining to 0.4–0.6 during fruit maturation. Correlation between satellite-derived NDVI and field-measured Leaf Area Index (LAI) achieved (, field plots).
Soybean fields in Goiás demonstrated EVI superiority over NDVI for biomass estimation during high-density canopy stages, with versus respectively. SAVI performance improved in areas with exposed soil (early vegetative stages), reducing soil brightness influence as theoretically expected.
NDWI effectively identified irrigation patterns and water stress conditions, with threshold value 0.2 distinguishing irrigated from rainfed areas with 87% accuracy validated against farm management records.
3.3. Classification Validation
K-Means unsupervised classification with three clusters () and combined NDVI-EVI features achieved Overall Accuracy of 78% for distinguishing coffee, pasture, and forest cover types in heterogeneous landscapes. Confusion matrix analysis revealed systematic misclassification between coffee and forest in shaded agroforestry systems, suggesting need for temporal analysis to exploit phenological differences.
Threshold-based classification using NDVI demonstrated 89% accuracy for binary crop/non-crop discrimination but performed poorly (62% accuracy) for multi-class crop type identification, confirming expected limitations of single-index approaches.
Supervised Random Forest classifier trained on 120 labeled polygons (40 per class: coffee, soybean, corn) achieved 92% Overall Accuracy and Cohen’s Kappa 0.88 on independent test set (60 polygons). Producer’s Accuracy exceeded 90% for all classes, with User’s Accuracy ranging 88–95%. Feature importance analysis identified NDVI as the most discriminative variable (importance score 0.45), followed by EVI (0.32) and SAVI (0.23).
Figure 2 displays the crop classification interface applied to the intermediate region between José de Freitas and Teresina. The 50/50 split layout allocates equal screen space to controls and map visualization, facilitating iterative experimentation with classification methods and spectral index combinations.
3.4. User Interface Evaluation
Interface testing with twelve agricultural technicians (average 8 years field experience, minimal GIS training) demonstrated successful task completion for NDVI calculation (100%), field delineation (92%), and result interpretation (83%) without prior platform training. Median time to complete standard workflow (upload KML, calculate index, interpret statistics) was 3.5 minutes.
Participants identified strengths: simplified terminology avoiding GIS jargon, visual feedback through map overlays, and integrated color legends with index formulas. Requested improvements included mobile device optimization, offline processing capability, and Portuguese language localization.
Figure 3 illustrates the main interface displaying NDVI analysis for agricultural fields near Bizerro Dam, José de Freitas, Piauí. The left panel provides field selection, spectral index configuration, and statistical summaries, while the right panel presents georeferenced results overlaid on interactive maps. Color-coded visualization ranges from red (low vegetation vigor, NDVI ) through yellow (moderate vigor, NDVI 0.3–0.6) to green (high vigor, NDVI ).
Figure 4 demonstrates false color composite visualization (NIR-Red-Green bands) for the same study area, highlighting vegetation structure and moisture content patterns invisible to human vision. This representation facilitates identification of irrigation zones, crop stress areas, and field boundaries in heterogeneous landscapes.
3.5. Comparison with Existing Tools
Table 1 compares the implemented platform with established remote sensing software across key accessibility dimensions.
The platform uniquely combines zero-installation deployment, simplified interfaces, and integrated workflows suitable for users without GIS expertise.
4. Discussion
This study demonstrates the technical and practical feasibility of web-based platforms for democratizing satellite remote sensing in smallholder agriculture. The implemented system addresses critical barriers—technical complexity, cost, and infrastructure requirements—that have historically limited precision agriculture adoption in resource-constrained contexts.
4.1. Technical Contributions
The platform advances beyond existing tools through three primary technical innovations. First, complete automation of geospatial processing workflows eliminates manual steps in coordinate reprojection, band extraction, and statistical analysis that typically require GIS expertise. Second, browser-based deployment removes software installation barriers and hardware constraints by executing computationally intensive operations on server infrastructure. Third, the image processing laboratory provides unprecedented transparency into algorithm mechanics, supporting both educational applications and methodological comparison.
Validation results confirm literature findings that Sentinel-2 data achieves sufficient accuracy for crop monitoring in smallholder systems[7,8]. Classification accuracy (92% Overall Accuracy, Kappa 0.88) exceeds reported values for similar heterogeneous landscapes using K-Means alone (78%–85%)[13], likely attributable to multi-index feature engineering and Random Forest ensemble learning.
4.2. Limitations and Challenges
Several limitations warrant consideration. Supervised classification accuracy depends on availability of labeled training data, which remains scarce for most smallholder regions. The current implementation provides proof-of-concept functionality but requires site-specific calibration for operational deployment. Transfer learning approaches using pre-trained models from data-rich regions may partially address this challenge[14].
Cloud cover persistently affects tropical and subtropical regions during growing seasons, reducing usable image availability. Integration of Sentinel-1 synthetic aperture radar (SAR) data, which penetrates clouds, represents a logical extension[15]. The platform architecture supports multi-sensor fusion through modular processing pipelines.
Validation utilized limited ground truth data (205 polygons across two growing seasons). Expanded temporal and spatial sampling would strengthen generalizability claims. Crowdsourced ground truth collection through mobile applications could scale validation efforts cost-effectively[6].
4.3. Implications for Smallholder Agriculture
Interface evaluation results suggest that simplified, task-oriented designs successfully lower adoption barriers for users without GIS training. This finding aligns with technology acceptance research emphasizing perceived ease of use as a primary adoption determinant[16]. Portuguese localization and mobile optimization—identified as priority improvements—would further enhance accessibility in Brazilian contexts.
The open-source implementation enables adaptation to regional conditions, crop types, and local knowledge systems without vendor dependency. This addresses sustainability concerns associated with proprietary platforms that may discontinue services or alter pricing structures. Community-driven development models could accelerate feature enhancement and bug resolution relative to closed commercial alternatives.
Economic benefits of precision agriculture technologies for smallholders remain incompletely characterized. While this study demonstrates technical capabilities, empirical assessment of yield impacts, input optimization, and return on investment requires longitudinal field trials currently underway.
4.4. Future Research Directions
Several research opportunities emerge from this work. Temporal analysis of multi-date imagery could enable phenological stage detection, yield forecasting, and anomaly identification (drought stress, pest damage). Deep learning architectures such as U-Net for semantic segmentation and convolutional neural networks for crop type classification merit investigation given recent advances in agricultural applications[14].
Integration with complementary data sources (meteorological observations, soil maps, topography) through multi-layer analysis could enhance prediction accuracy and provide decision support for nutrient management and irrigation scheduling[1]. Participatory design processes involving farmers in feature prioritization would ensure development aligns with end-user needs and local farming systems.
Scalability testing for regional or national-level deployment requires investigation of cloud infrastructure requirements, data storage optimization, and concurrent user handling. Containerization using Docker and orchestration via Kubernetes represent standard approaches for production systems.
5. Conclusions
This study presents an open-source web platform that successfully democratizes Sentinel-2 multispectral analysis for smallholder agriculture through simplified interfaces, automated processing workflows, and zero-installation deployment. Validation using Brazilian agricultural data confirms classification accuracy exceeding 85% and strong correlations () between satellite-derived indices and field-measured biophysical parameters.
The platform addresses documented gaps in accessible remote sensing tools by eliminating technical barriers while maintaining scientific rigor in geospatial processing. Open-source availability enables community adaptation and extension, supporting technology transfer to resource-constrained agricultural contexts globally.
Future enhancements incorporating temporal analysis, multi-sensor fusion, and deep learning classification algorithms will expand analytical capabilities. Longitudinal field trials assessing economic impacts on smallholder productivity and sustainability outcomes represent critical next steps for evaluating real-world effectiveness.
The demonstrated feasibility of browser-based remote sensing platforms suggests that information technology advances can accelerate precision agriculture adoption beyond large-scale commercial farming, potentially contributing to food security and sustainable intensification in smallholder systems that dominate global agricultural landscapes.
Author Contributions
Conceptualization, J.L.S.M.; methodology, J.L.S.M. and J.V.P.C.B.C.; software, J.L.S.M., L.G.O.C.S., and V.H.A.A.; validation, J.L.S.M., L.B.P., and L.M.R.A.; formal analysis, J.L.S.M.; investigation, J.L.S.M. and J.V.P.C.B.C.; resources, J.L.S.M.; data curation, J.L.S.M. and L.M.R.A.; writing—original draft preparation, J.L.S.M.; writing—review and editing, J.L.S.M., J.V.P.C.B.C., and L.B.P.; visualization, J.L.S.M. and V.H.A.A.; supervision, J.L.S.M.; project administration, J.L.S.M. All authors have read and agreed to the published version of the manuscript.
Funding
This research received no external funding
Institutional Review Board Statement
Not applicable. This study did not involve humans or animals.
Informed Consent Statement
Not applicable. This study did not involve humans.
Data Availability Statement
Complete source code, documentation, and example datasets are publicly available at https://github.com/rexionmars/icev-remote-sensing under MIT license. The platform can be deployed locally or accessed via hosted instance for testing purposes. Sentinel-2 satellite imagery used in this study was obtained from the Copernicus Open Access Hub (https://browser.dataspace.copernicus.eu/) and is freely available.
Acknowledgments
The authors thank the iCEV Institute of Higher Education and Dr. Dimmy Magalhães for their support. The authors thank the agricultural technicians and farmers who participated in the validation studies and provided field access. Sentinel-2 data were provided courtesy of the European Space Agency’s Copernicus Programme.
Conflicts of Interest
The authors declare no conflicts of interest. The funders had no role in the design of the study; in the collection, analyses, or interpretation of data; in the writing of the manuscript; or in the decision to publish the results.
References
- Weiss, M.; Jacob, F.; Duveiller, G. Remote sensing for agricultural applications: A meta-review. Remote Sensing of Environment 2020, 236, 111402. [Google Scholar] [CrossRef]
- Segarra, J.; Buchaillot, M.L.; Araus, J.L.; Kefauver, S.C. Remote Sensing for Precision Agriculture: Sentinel-2 Improved Features and Applications. Agronomy 2020, 10, 641. [Google Scholar] [CrossRef]
- Instituto Brasileiro de Geografia e Estatística. Censo Agropecuário 2017: Resultados Definitivos. https://www.ibge.gov.br/estatisticas/economicas/agricultura-e-pecuaria/21814-2017-censo-agropecuario.html, 2024. Accessed: 2025-11-01.
- Food and Agriculture Organization of the United Nations. Handbook on Remote Sensing for Agricultural Statistics. https://www.fao.org/3/ca6394en/ca6394en.pdf, 2017. Accessed: 2025-11-01.
- Sishodia, R.P.; Ray, R.L.; Singh, S.K. Applications of Remote Sensing in Precision Agriculture: A Review. Remote Sensing 2020, 12, 3136. [Google Scholar] [CrossRef]
- Burke, M.; Driscoll, A.; Lobell, D.B.; Ermon, S. Using satellite imagery to understand and promote sustainable development. Science 2021, 371, eabe8628. [Google Scholar] [CrossRef] [PubMed]
- Htitiou, A.; Boudhar, A.; Chebli, Y.; Hadria, R. Early Identification of Crop Type for Smallholder Farming Systems Using Deep Learning on Time-Series Sentinel-2 Imagery. Sensors 2023, 23, 1779. [Google Scholar] [CrossRef] [PubMed]
- Lambert, M.J.; Traoré-Phillip, P.; Blaes, X.; Baret, P.; Defourny, P. Estimating smallholder crops production at village level from Sentinel-2 time series in Mali’s cotton belt. Remote Sensing of Environment 2018, 216, 647–657. [Google Scholar] [CrossRef]
- Jin, Z.; Gowda, P.H.; Colaizzi, P.D.; Rajan, N. Efficacy of Normalized Difference Vegetation Index and Enhanced Vegetation Index in Estimating LAI and CCD of Cotton. Journal of Applied Remote Sensing 2017, 11, 026031. [Google Scholar] [CrossRef]
- Huete, A.R. A soil-adjusted vegetation index (SAVI). Remote Sensing of Environment 1988, 25, 295–309. [Google Scholar] [CrossRef]
- Gao, B.C. NDWI—A normalized difference water index for remote sensing of vegetation liquid water from space. Remote Sensing of Environment 1996, 58, 257–266. [Google Scholar] [CrossRef]
- Zha, Y.; Gao, J.; Ni, S. Use of normalized difference built-up index in automatically mapping urban areas from TM imagery. International Journal of Remote Sensing 2003, 24, 583–594. [Google Scholar] [CrossRef]
- Kpienbaareh, D.; Sun, X.; Wang, J.; Luginaah, I.; Kerr, R.B.; Lupafya, E.; Dakishoni, L. Crop Type and Land Cover Mapping in Northern Malawi Using the Integration of Sentinel-1, Sentinel-2, and PlanetScope Satellite Data. Remote Sensing 2021, 13, 700. [Google Scholar] [CrossRef]
- Kamilaris, A.; Prenafeta-Boldú, F.X. Deep learning in agriculture: A survey. Computers and Electronics in Agriculture 2018, 147, 70–90. [Google Scholar] [CrossRef]
- Veloso, A.; Mermoz, S.; Bouvet, A.; Toan, T.L.; Planells, M.; Dejoux, J.F.; Étienne Ceschia. Understanding the temporal behavior of crops using Sentinel-1 and Sentinel-2-like data for agricultural applications. Remote Sensing of Environment 2017, 199, 415–426. [Google Scholar] [CrossRef]
- Chlingaryan, A.; Sukkarieh, S.; Whelan, B. Machine learning approaches for crop yield prediction and nitrogen status estimation in precision agriculture: A review. Computers and Electronics in Agriculture 2018, 151, 61–69. [Google Scholar] [CrossRef]
Figure 1.
Image processing laboratory interface showing original NDVI imagery (left) and processed result (right) for plantation area near Bizerro Dam. The experimental module enables comparison of thirteen techniques including Gaussian filtering, edge detection, morphological operations, and segmentation methods.
Figure 2.
Crop classification interface showing supervised classification results for the intermediate region between José de Freitas and Teresina municipalities. Color-coded classes with percentage areas and hectare calculations enable quantitative land use assessment. The interface supports three classification methods: supervised (Random Forest), unsupervised (K-Means), and threshold-based approaches.
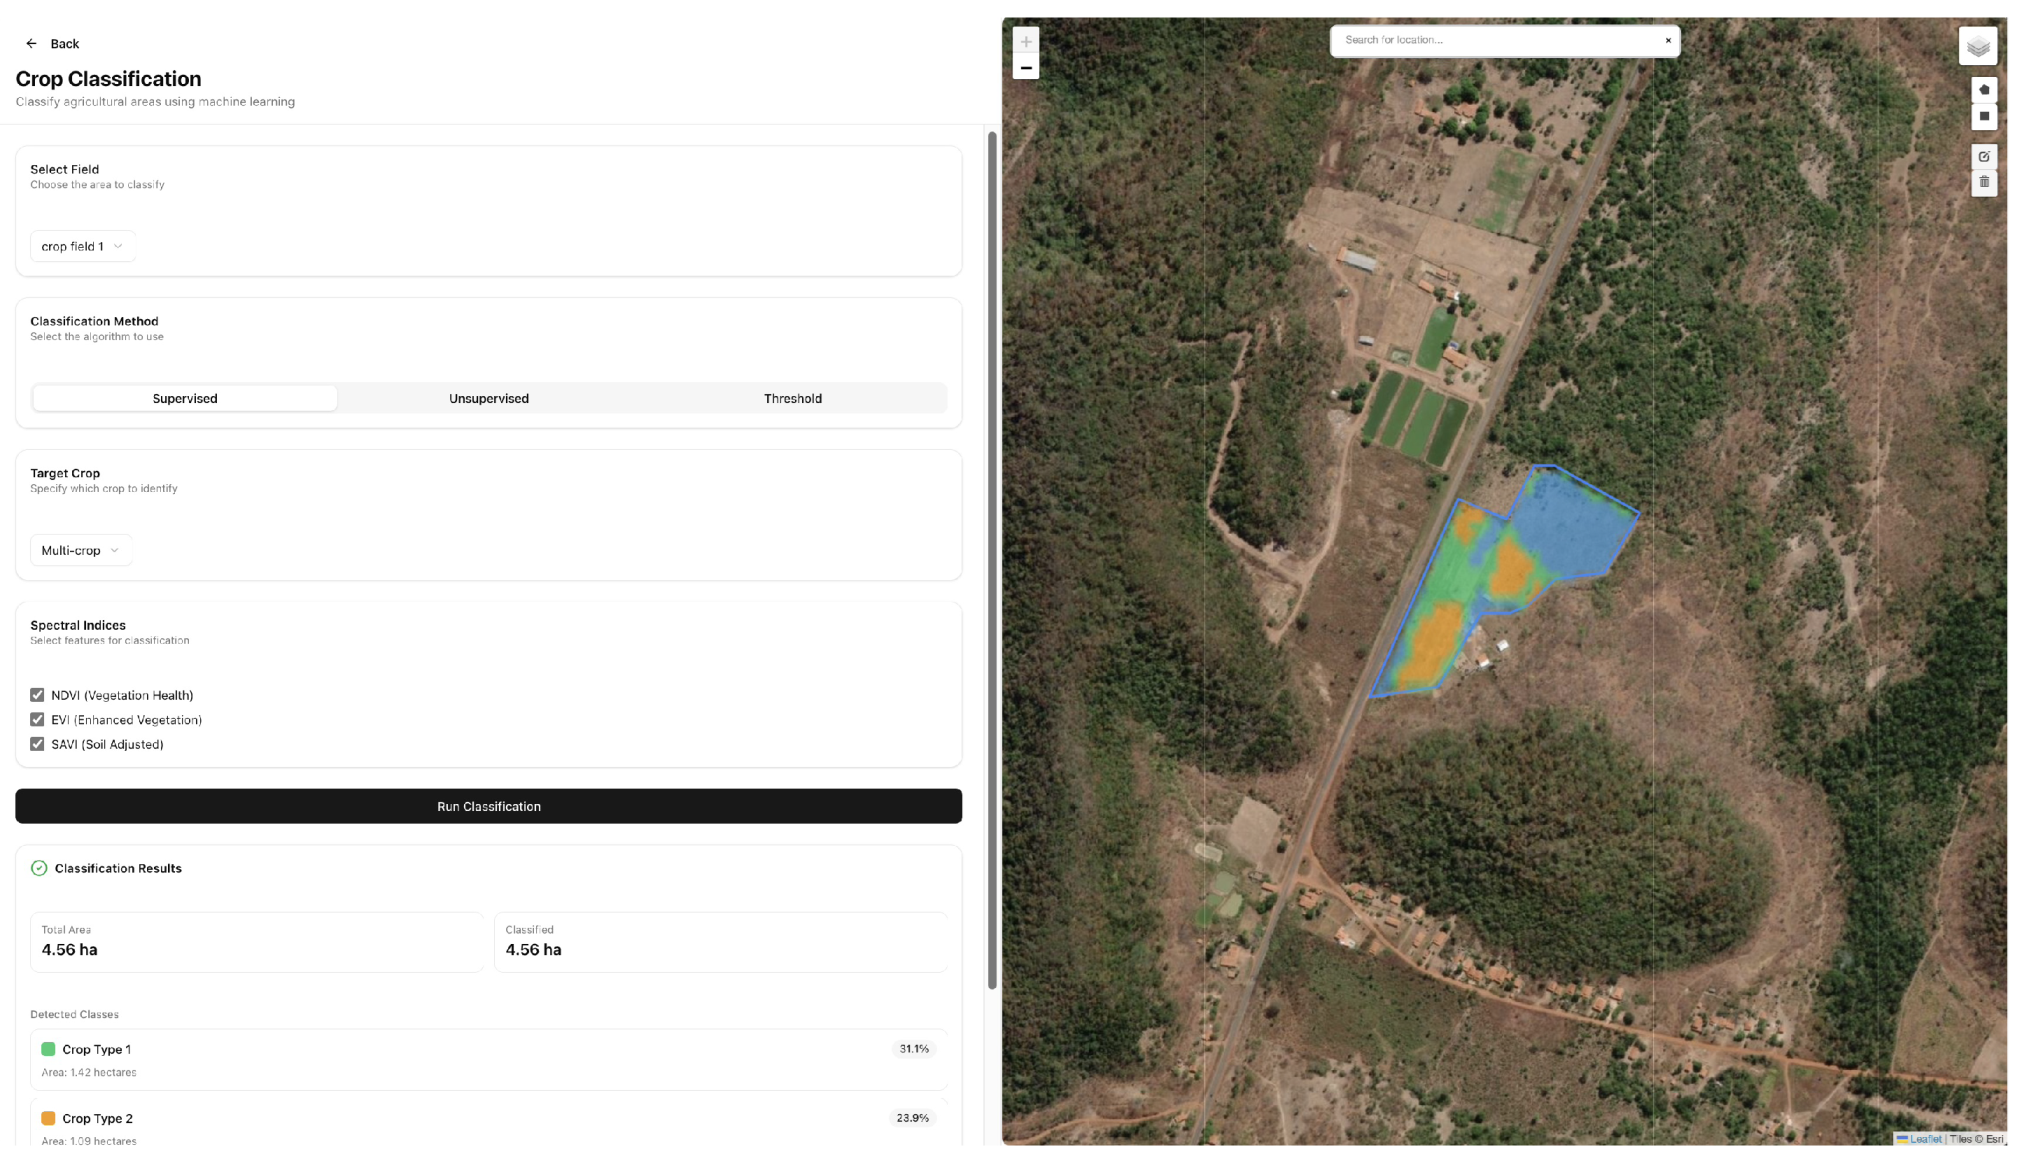
Figure 3.
Main user interface showing NDVI analysis for smallholder agricultural fields near Bizerro Dam, José de Freitas, Piauí. The dual-panel layout integrates field management (left) with spatial visualization (right), enabling rapid assessment without GIS expertise.
Figure 3.
Main user interface showing NDVI analysis for smallholder agricultural fields near Bizerro Dam, José de Freitas, Piauí. The dual-panel layout integrates field management (left) with spatial visualization (right), enabling rapid assessment without GIS expertise.
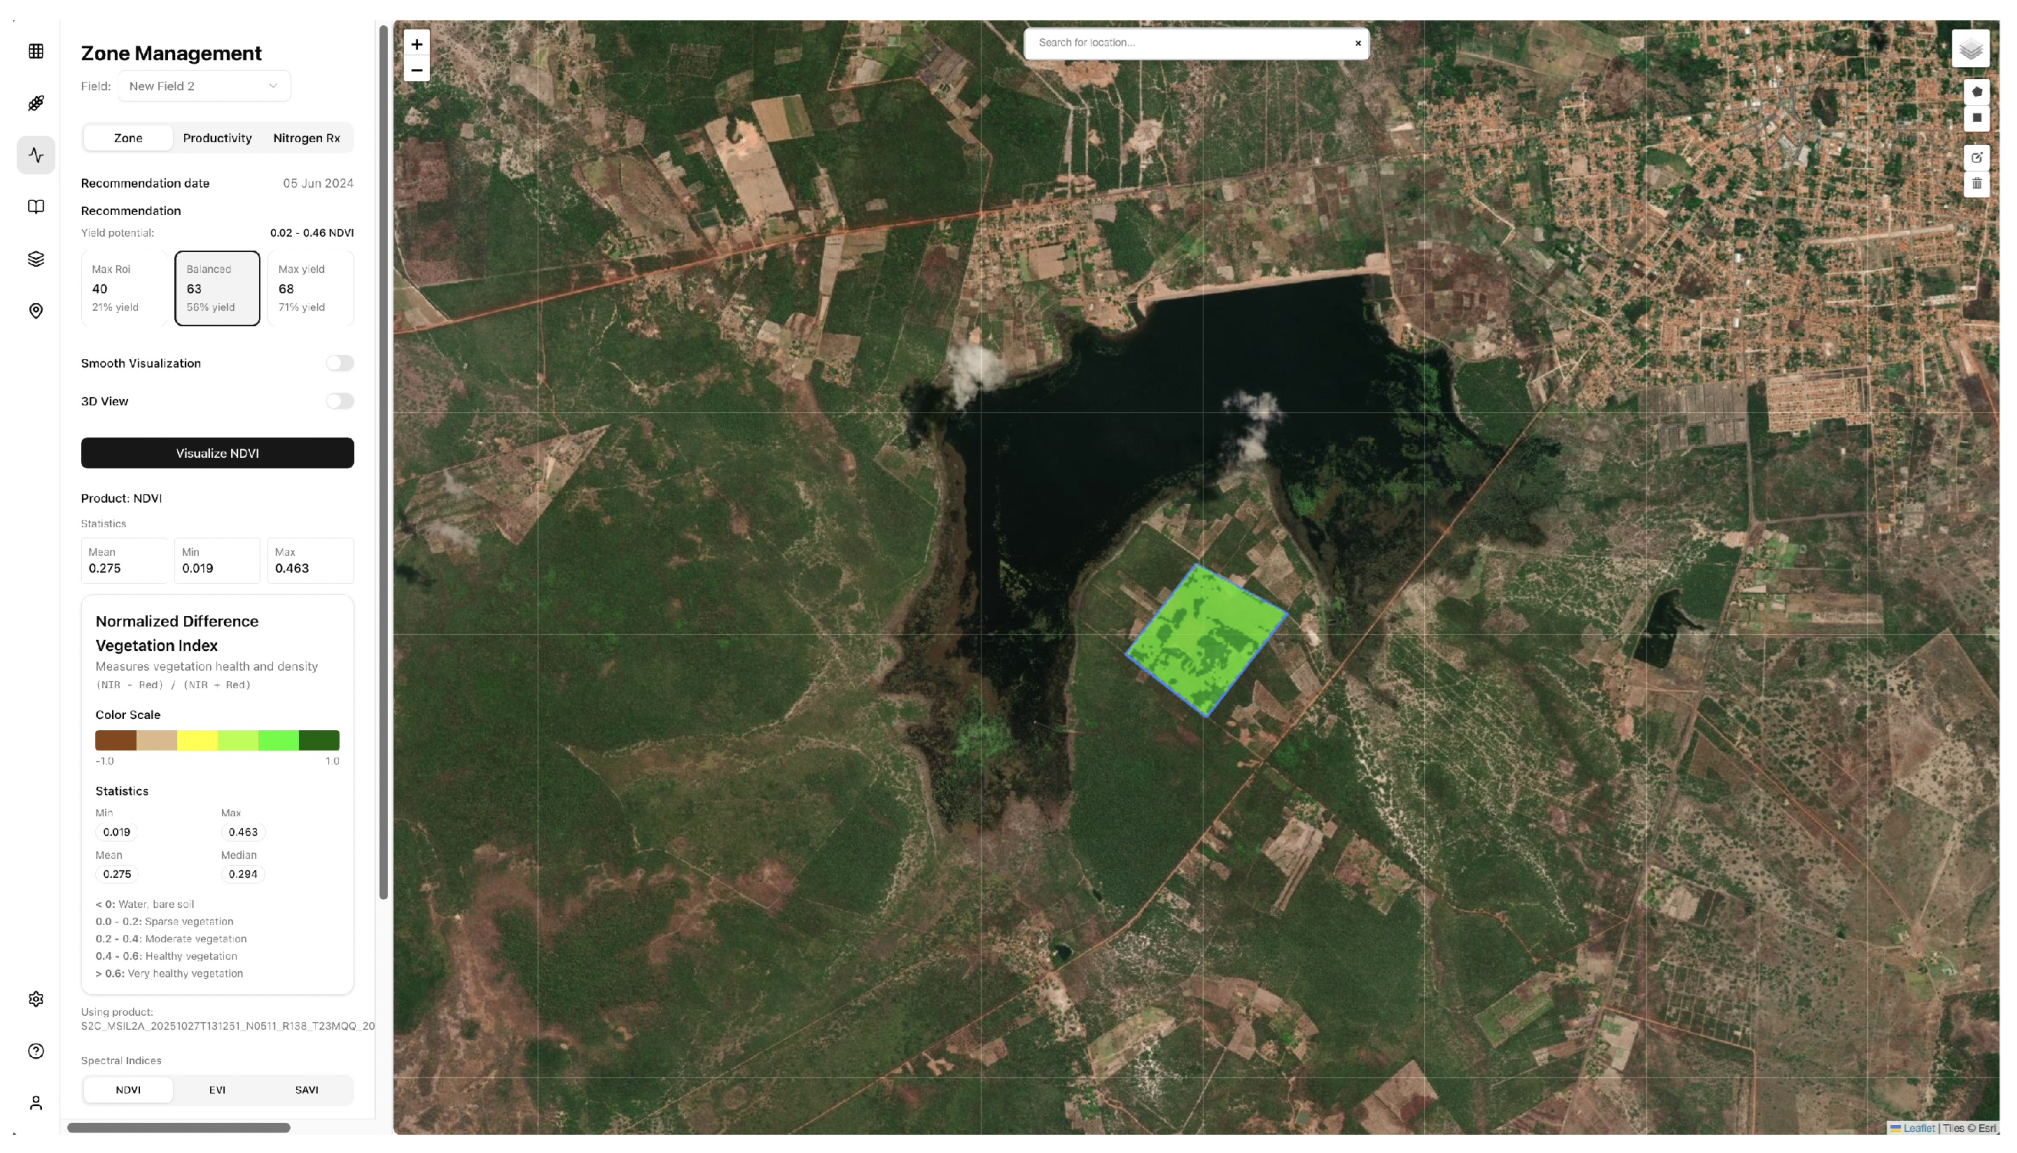
Figure 4.
False color composite (Sentinel-2 Bands 8-4-3) visualization revealing vegetation structure and moisture patterns. Bright red indicates healthy vegetation with high near-infrared reflectance, while cyan/blue tones suggest exposed soil or water bodies.
Figure 4.
False color composite (Sentinel-2 Bands 8-4-3) visualization revealing vegetation structure and moisture patterns. Bright red indicates healthy vegetation with high near-infrared reflectance, while cyan/blue tones suggest exposed soil or water bodies.
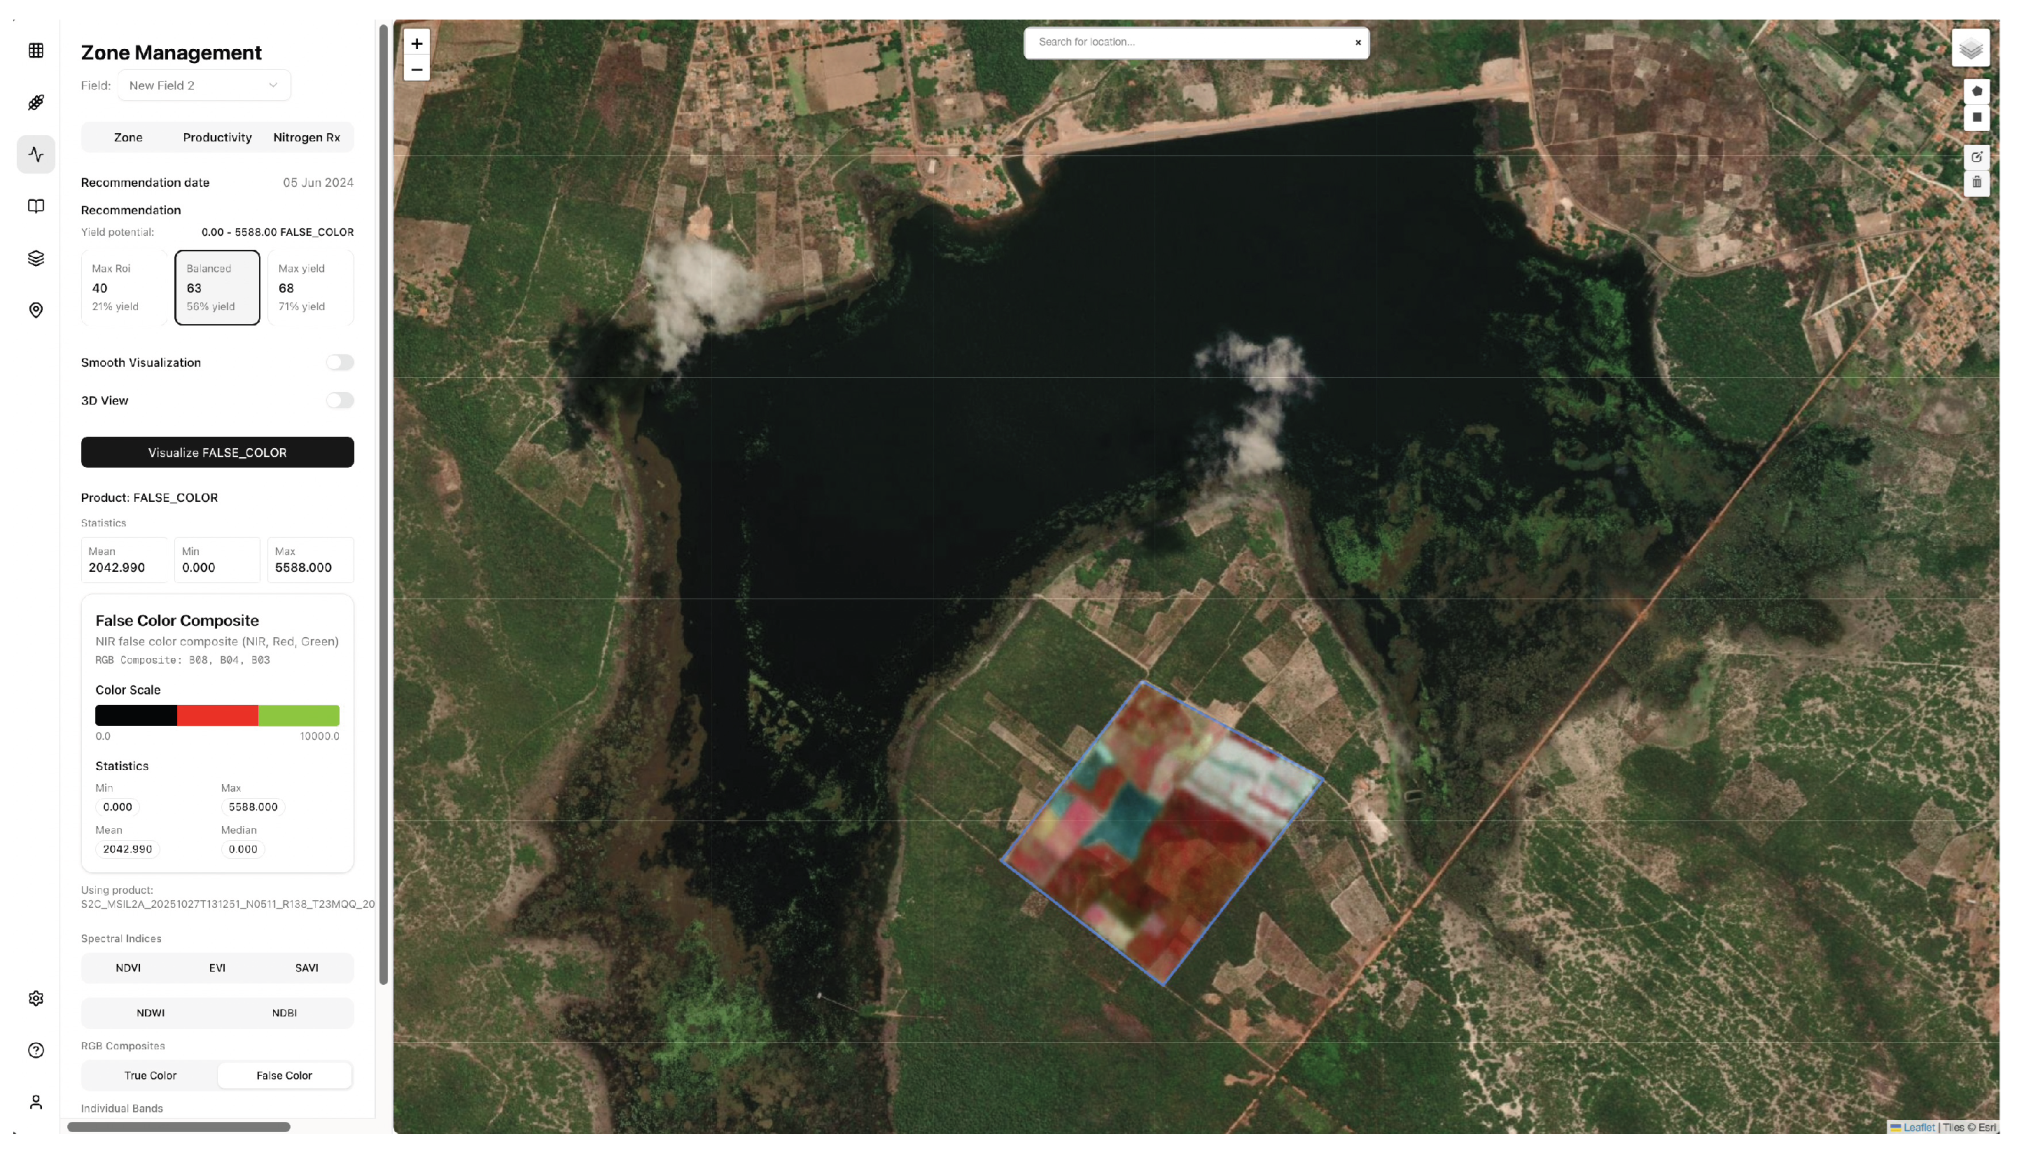

Table 1.
Platform comparison across accessibility and functionality dimensions
| Criterion | This Study | QGIS | SNAP | GEE |
|---|---|---|---|---|
| Installation required | No | Yes | Yes | No |
| Programming skills | No | Minimal | Minimal | Yes |
| Processing time (ha) | <30s | 2–5min | 5–10min | Variable |
| Open source | Yes | Yes | Yes | Partial |
| 3D visualization | Yes | Plugin | No | No |
| Classification | Yes | Yes | Yes | Yes |
| Mobile access | Yes | No | No | Limited |
| Learning curve | Low | High | High | High |
Disclaimer/Publisher’s Note: The statements, opinions and data contained in all publications are solely those of the individual author(s) and contributor(s) and not of MDPI and/or the editor(s). MDPI and/or the editor(s) disclaim responsibility for any injury to people or property resulting from any ideas, methods, instructions or products referred to in the content. |
© 2025 by the authors. Licensee MDPI, Basel, Switzerland. This article is an open access article distributed under the terms and conditions of the Creative Commons Attribution (CC BY) license (http://creativecommons.org/licenses/by/4.0/).
Copyright: This open access article is published under a Creative Commons CC BY 4.0 license, which permit the free download, distribution, and reuse, provided that the author and preprint are cited in any reuse.


