Preprint
Review

This version is not peer-reviewed.

On the Application of 238U, 235U, and 232Th Decay Series Disequilibria to Understanding the Processes and Timescales of Oceanic Basalt Petrogenesis

Submitted:

10 November 2025

Posted:

11 November 2025

You are already at the latest version

Abstract

Understanding how processes of magma genesis and magma differentiation control and modify the chemical composition of erupted lavas from the geochemical measurements of the latter is an under-constrained inverse problem as there is only one known parameter – the measured composition of the erupted lava – but two unknown parameters – the chemical composition and lithology of the source before melting and how melting, crystallization, and melt-rock interactions act to alter the lava en route to the surface. In this invited contribution, we review nearly seven decades of scientific research that demonstrate the potential of U and Th decay series measurements for unraveling the complexities of oceanic magmatism. We review the underlying nuclear theory, geochemical principles, and application of the 238U, 235U, and 232Th decay series for (i) defining the timescales of magma genesis during decompression mantle melting, (ii) establishing the timescales of magma recharge and magma degassing, and (iii) determining the eruption ages of oceanic Quaternary volcanism.

Keywords: 
;  ;  ;  ;  ;  ;  

1. Introduction

Understanding basalt petrogenesis from geochemical measurements of erupted lavas is an under-constrained inverse problem because there is one known and two unknown parameters. The known parameter is the measured composition of the erupted lava. The two unknown parameters are 1) the chemical composition and lithology of the source before melting and 2) how processes of magma genesis and magma differentiation (i.e., melting, crystallization, and melt-rock interactions) control and modify the chemical composition of the erupted lava during the transformation from solid source rock to lava.
Fortunately, the U and Th decay series nuclides are ideally suited to the study of magma genesis (Figure 1). The unique efficacy of the 238U, 235U, and 232Th decay series is that radioactive principles constrain the ratios of parent-to-daughter nuclides to be in secular equilibrium before melting, thereby eliminating one of the two typical unknowns in geochemical analysis, namely the initial chemical composition of the unmelted source in terms of some critical elemental ratios (e.g., U/Th, Th/Ra, Ra/Pb, U/Pa, etc.). Additionally, each decay chain (Figure 2) has multiple parent-daughter ratio pairs whose chemical behaviors are starkly different during magmatic processes, and whose half-lives range from days to hundreds of thousands of years and are thus comparable to the timescales over which magmatic processes occur.
The application of U and Th decay series disequilibria to studies of magma genesis was thoroughly reviewed in the Reviews in Mineralogy and Geochemistry volume on U-series in 2003 [1]. Over the past two decades, however, there has been enough significant advances in our understanding of this topic to warrant an updated review. The goal of the present review thus is to bring the community up to the current state-of-the-art on U and Th decay series disequilibria with specific focus on 238U, 235U, and 232Th decay series systematics as a chronometer of igneous processes (Figure 1). To make the overview as complete and clear as possible, the sections to follow this Introductory section have been organized as follows:
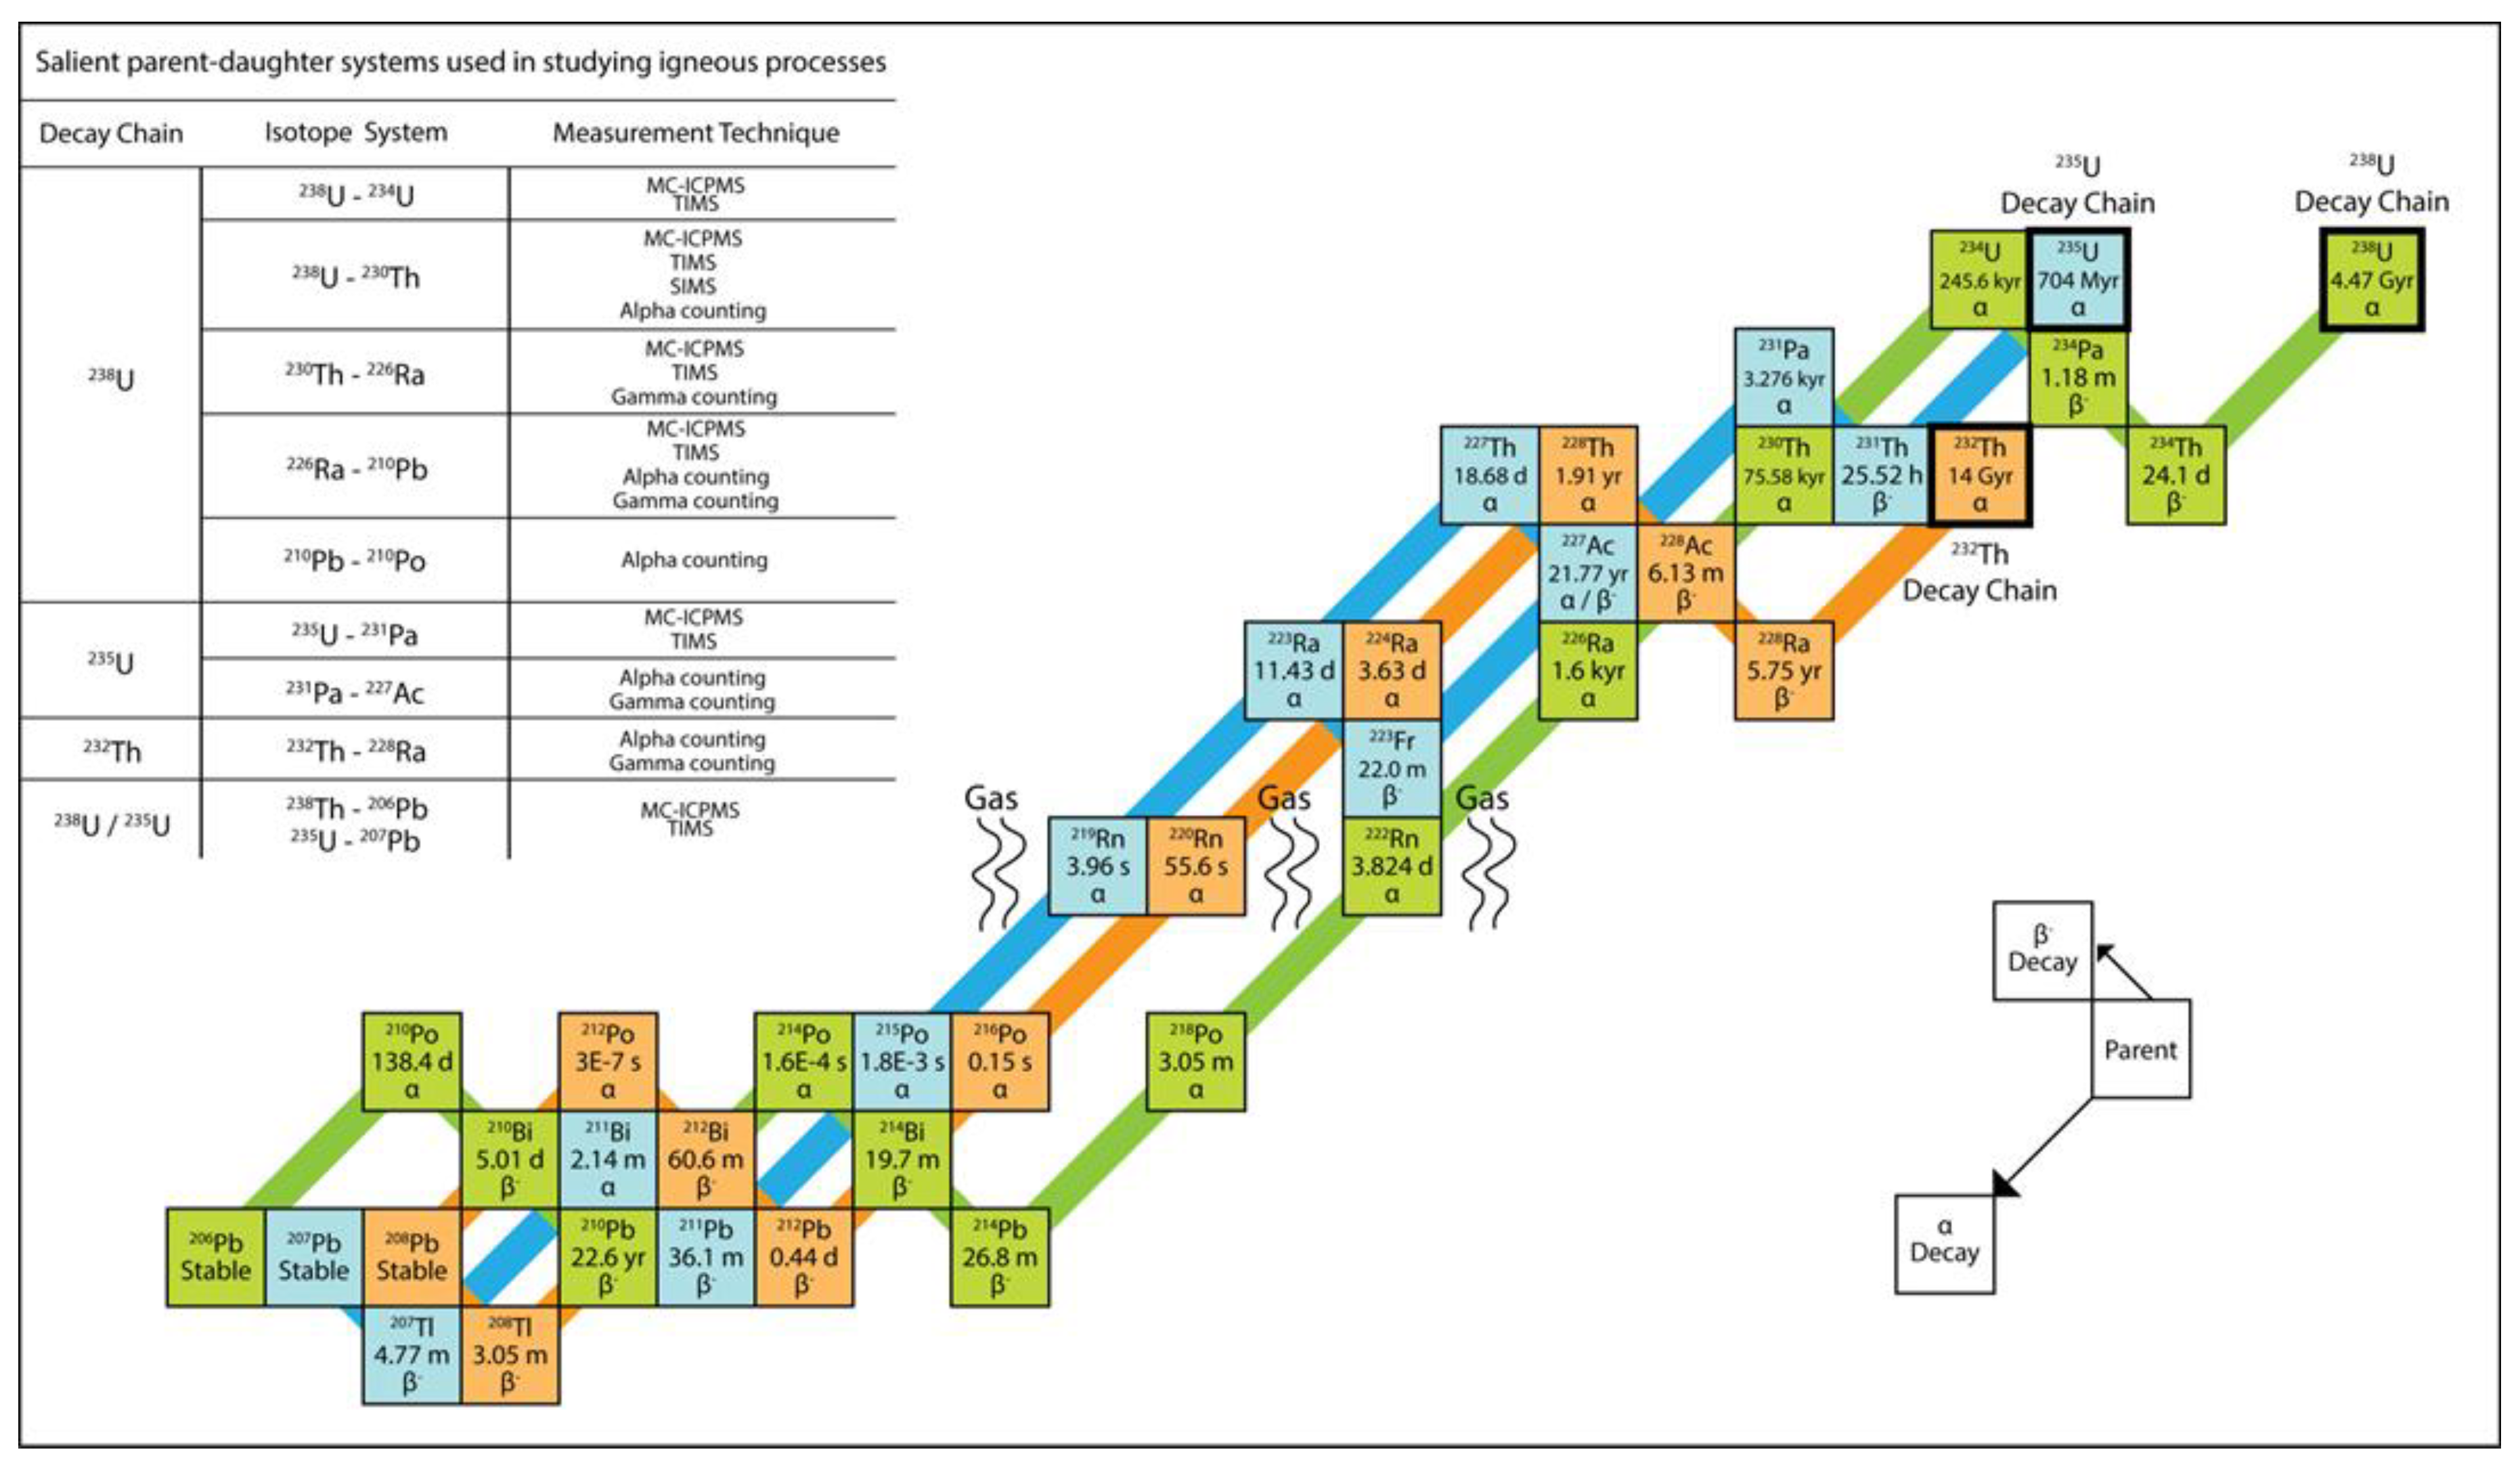
  • Section 2 presents an overview of the theoretical formalism of the U and Th decay series' unique isotope systematics, using 238U-234U-230Th within the 238U decay series as an explicit example.
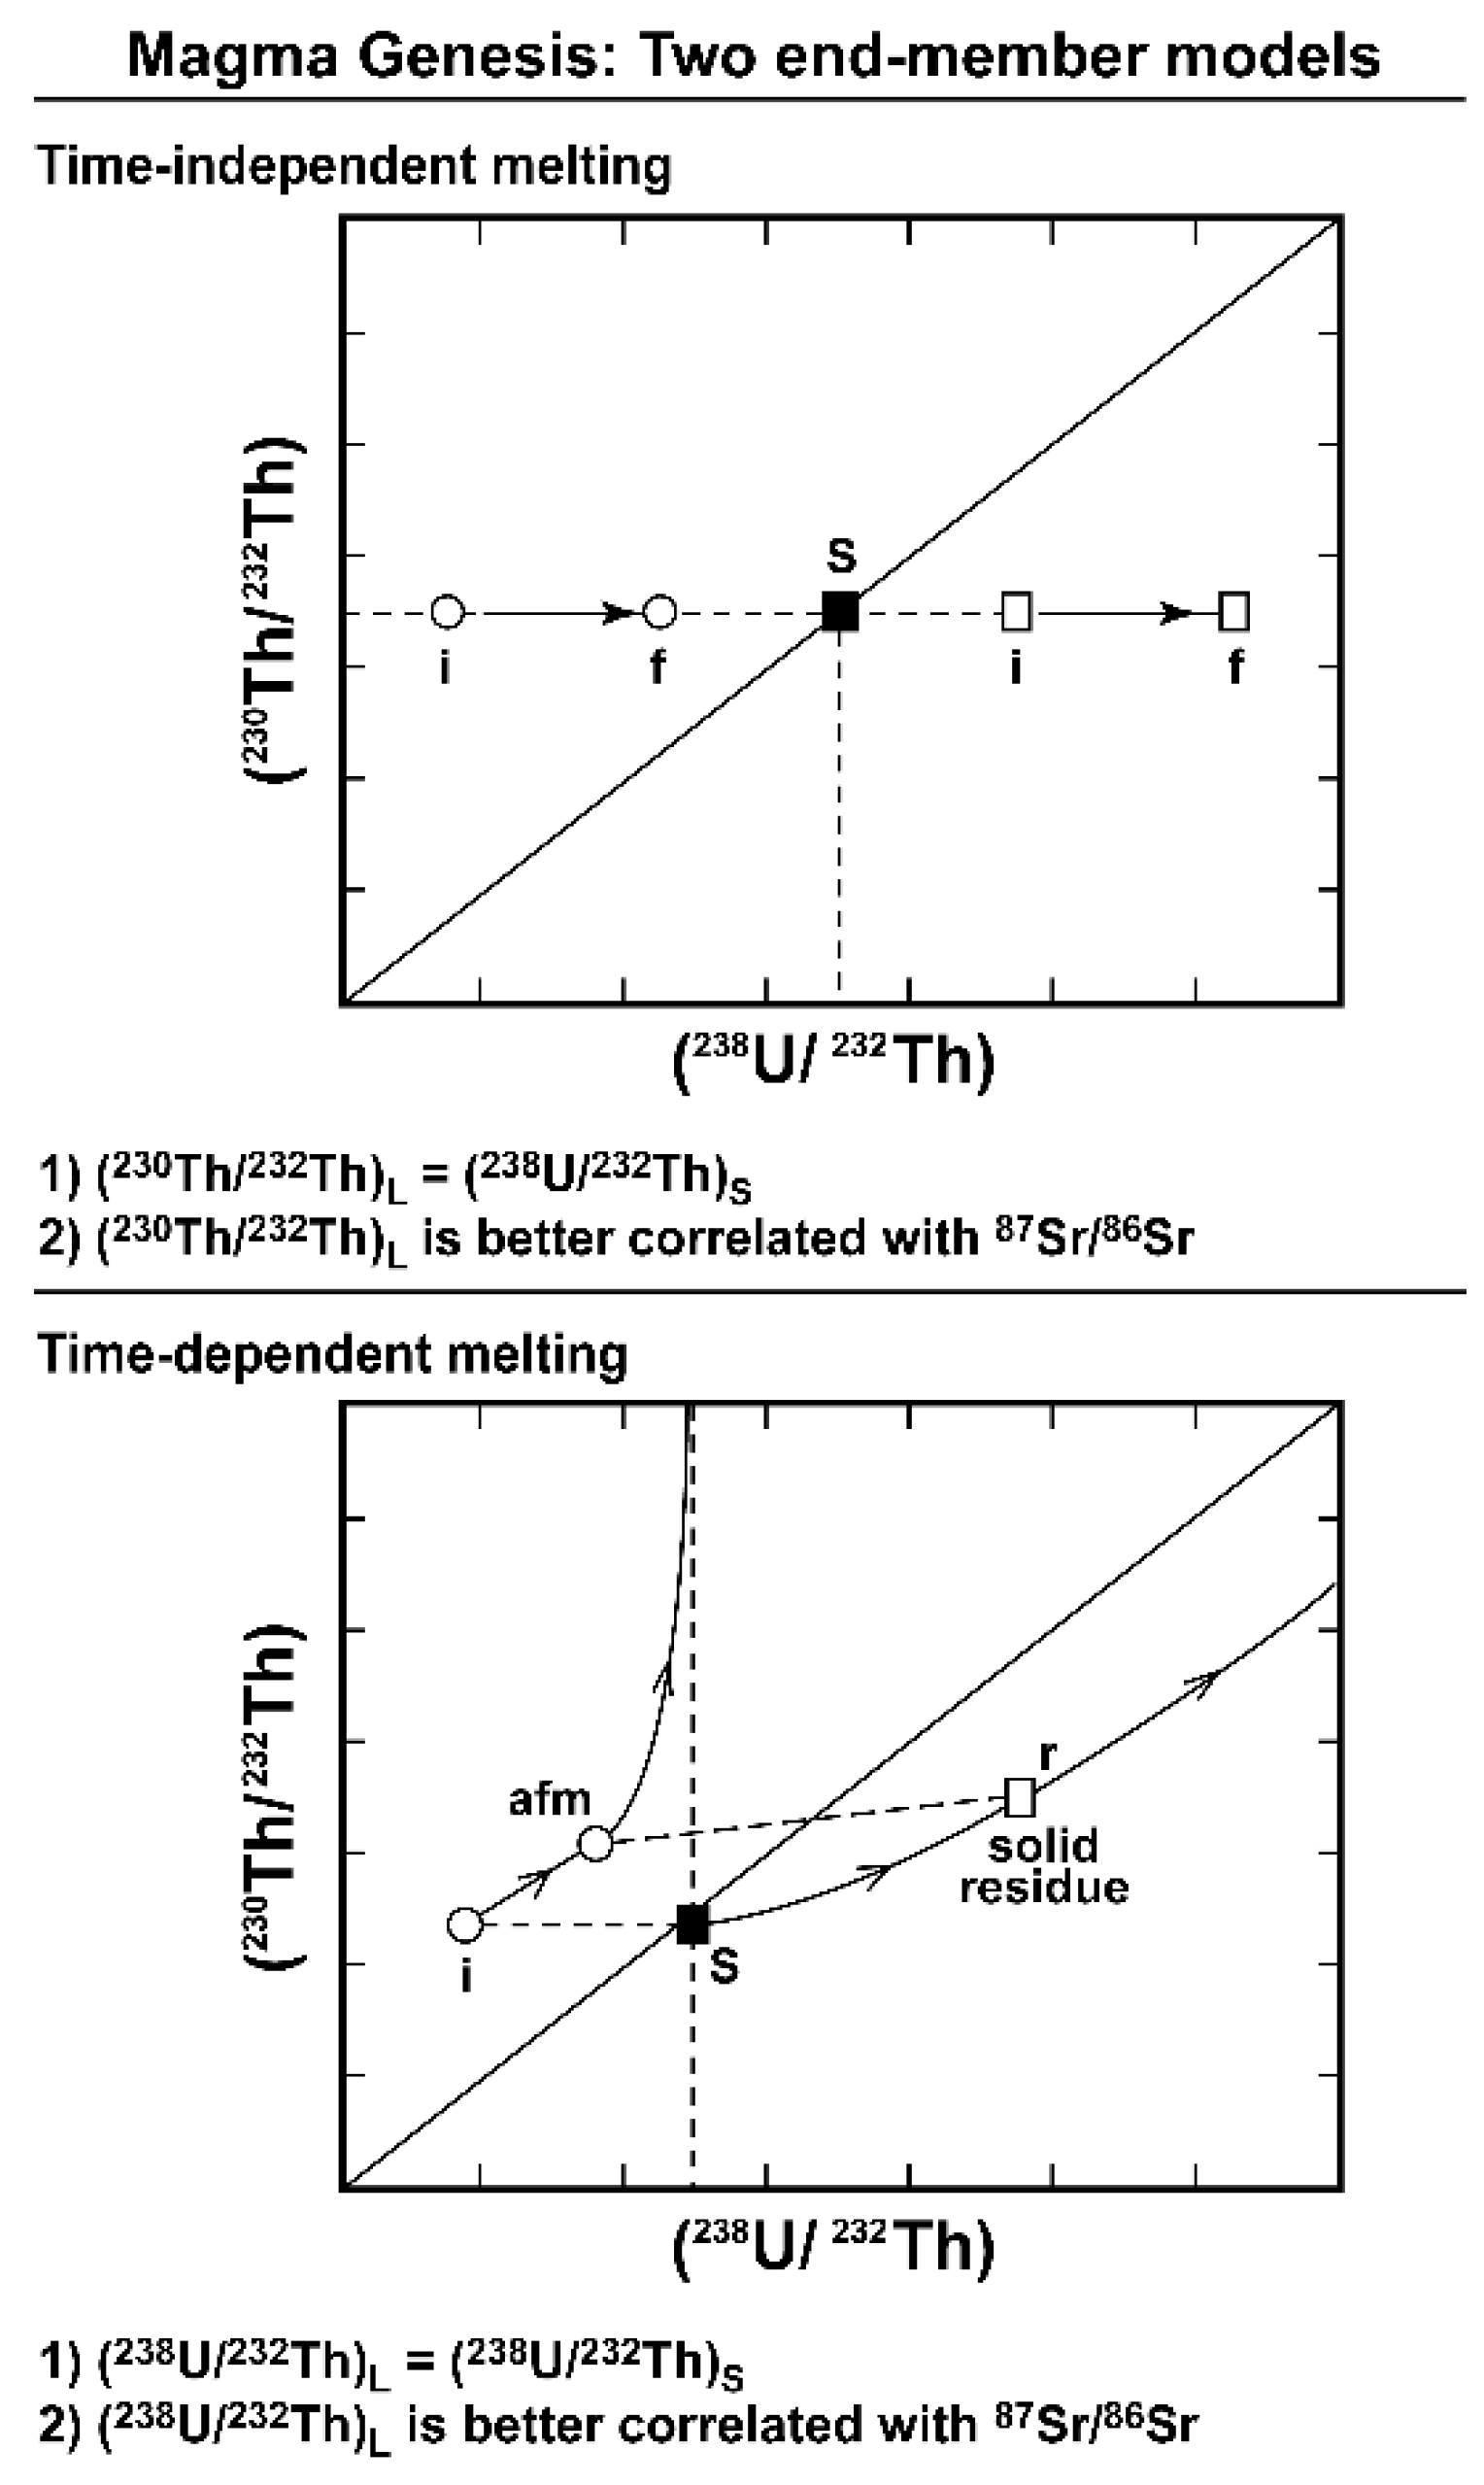
  • Section 3 examines the geochemical principles and assumptions particular to the application of the 238U, 235U, and 232Th decay series to decompression mantle melting in oceanic settings. It focuses on the differences between time-independent melting models such as batch and tractional melting, which rely solely on elemental fractionation and time-dependent melting models that in turn take into consideration the timescales of melting and incorporate daughter ingrowth during melting. Specific examples of how different melting models and different lithologies produce divergent results, as well as the reasoning behind interpreting and selecting any model over another, are then considered. Melt generation at both divergent plate boundaries (MORB) and intraplate hotspots (OIB) are assessed.
  • Section 4 presents the application of the 238U, 235U, and 232Th decay series for dating eruption ages of volcanic rocks using three different approaches: 1) age limits, whereby the presence of disequilibria can place bounds on the eruption age of a lava; 2) internal mineral isochron methods, which establish the crystallization age of a volcanic rock; and 3) U-Th-Ra 'model' ages, which couple measurements of U and Th disequilibria with geological, geochemical, and isotopic constraints to establish eruption ages for a lava or a lava sequence.
  • Section 5 presents the application of 226Ra-210Pb-210Po disequilibria to establishing the timescales of magma recharge and degassing, which is directly linked to a volcano’s activity and fundamental to our understanding of physical eruption dynamics and hazard assessment. We look at three specific examples: Kilauea in the Hawaiian Archipelago, Tristan de Cunha in the South Atlantic Ocean, and Mount Erebus Volcano in Antarctica.
  • Section 6 provides a historical overview of current and past analytical methodologies used to measure 238U, 235U, and 232Th decay series isotopes. We highlight recent improvements in mass spectrometry that have greatly influenced this field of study, as well as the alpha counting methods used for 210Pb-210Po measurements.

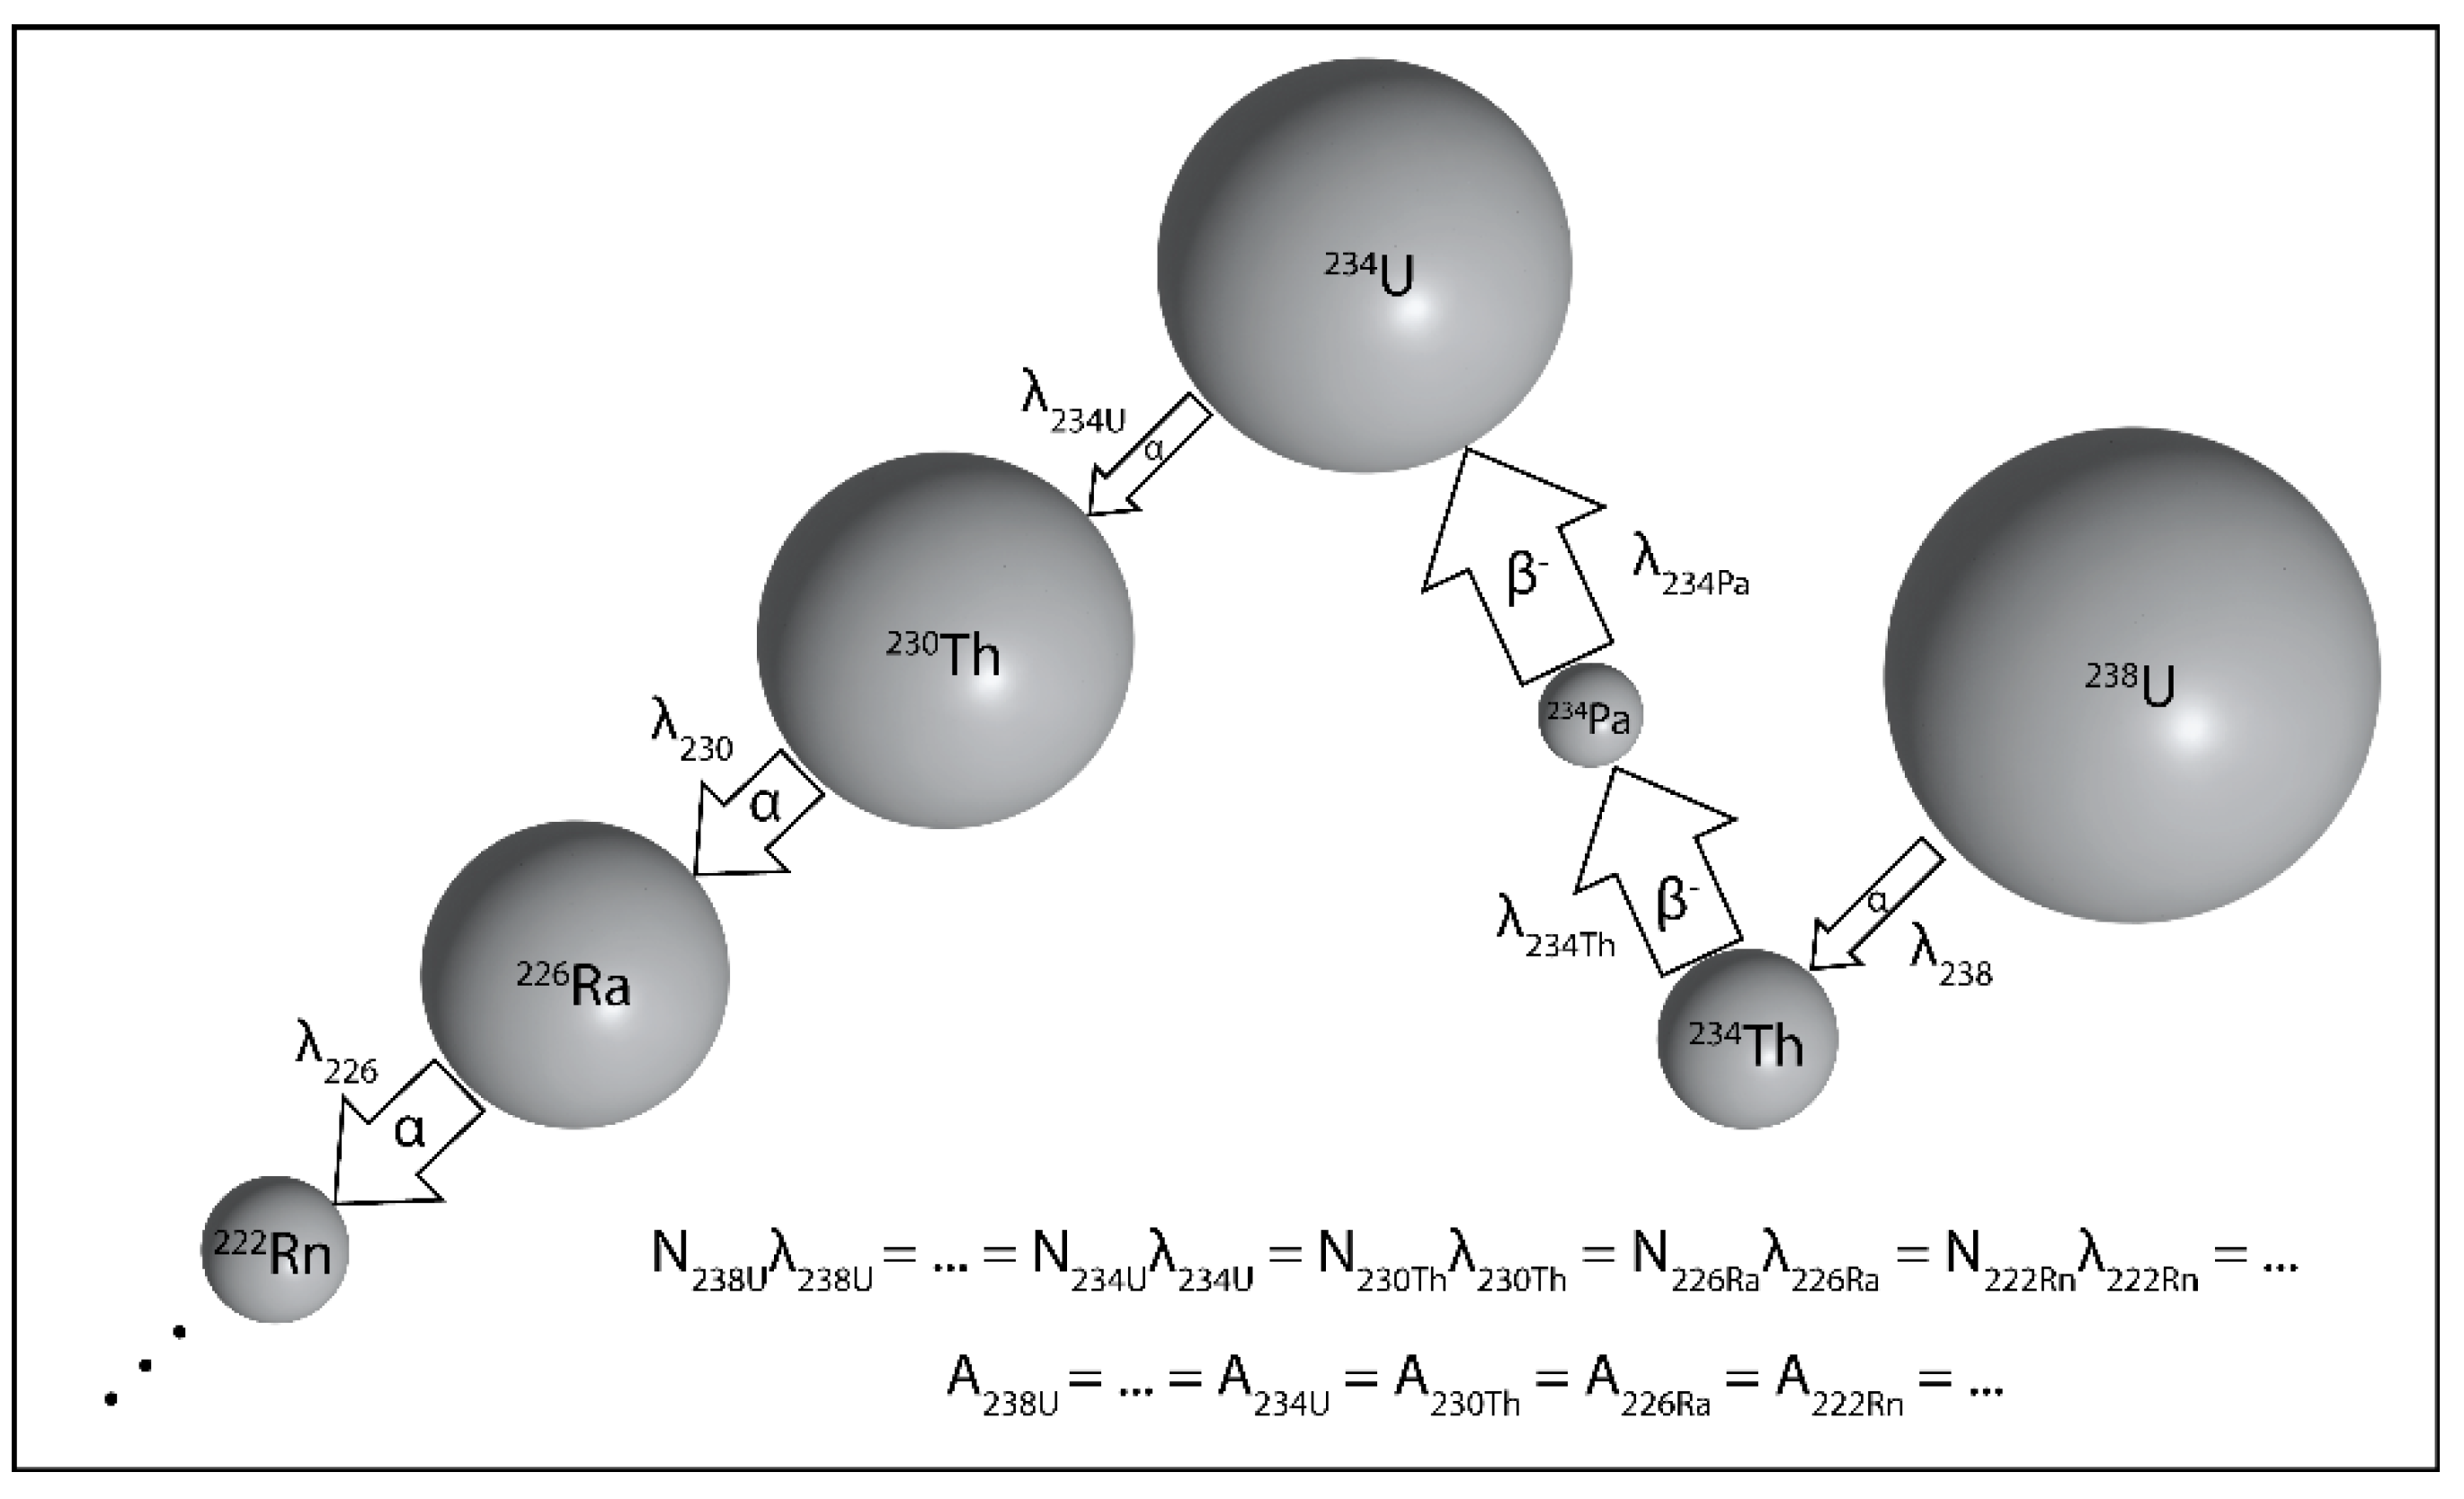
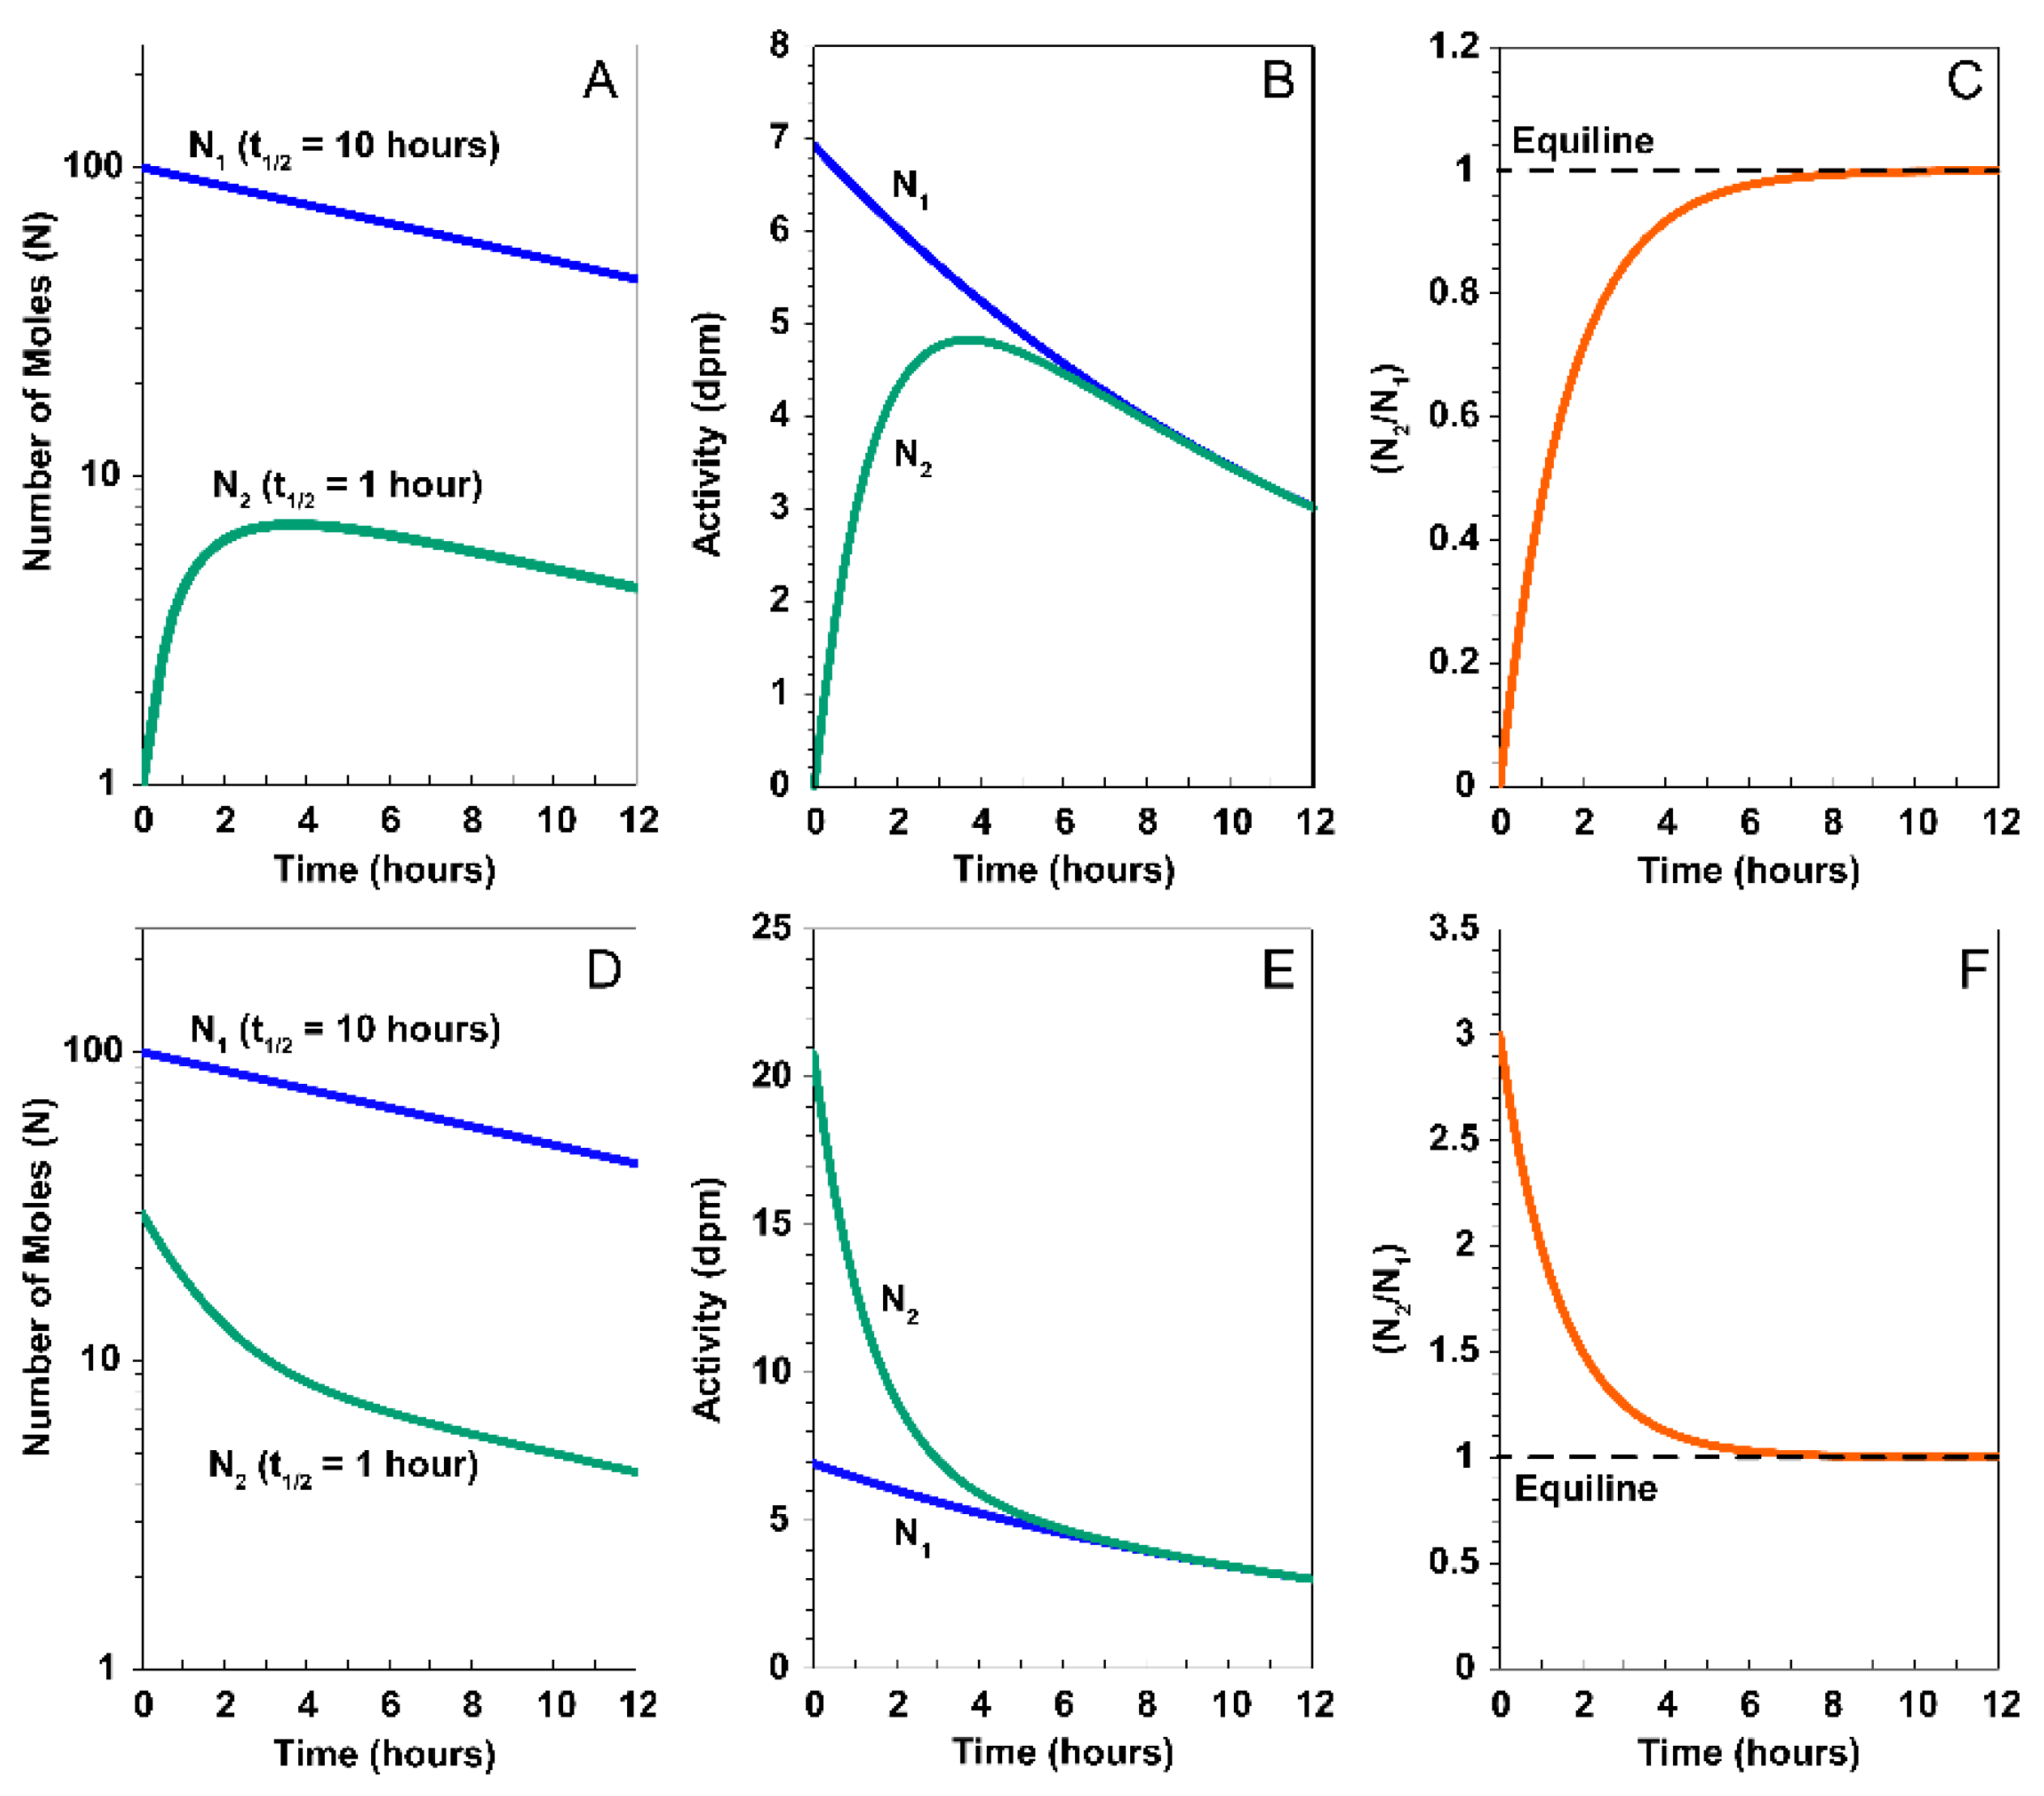
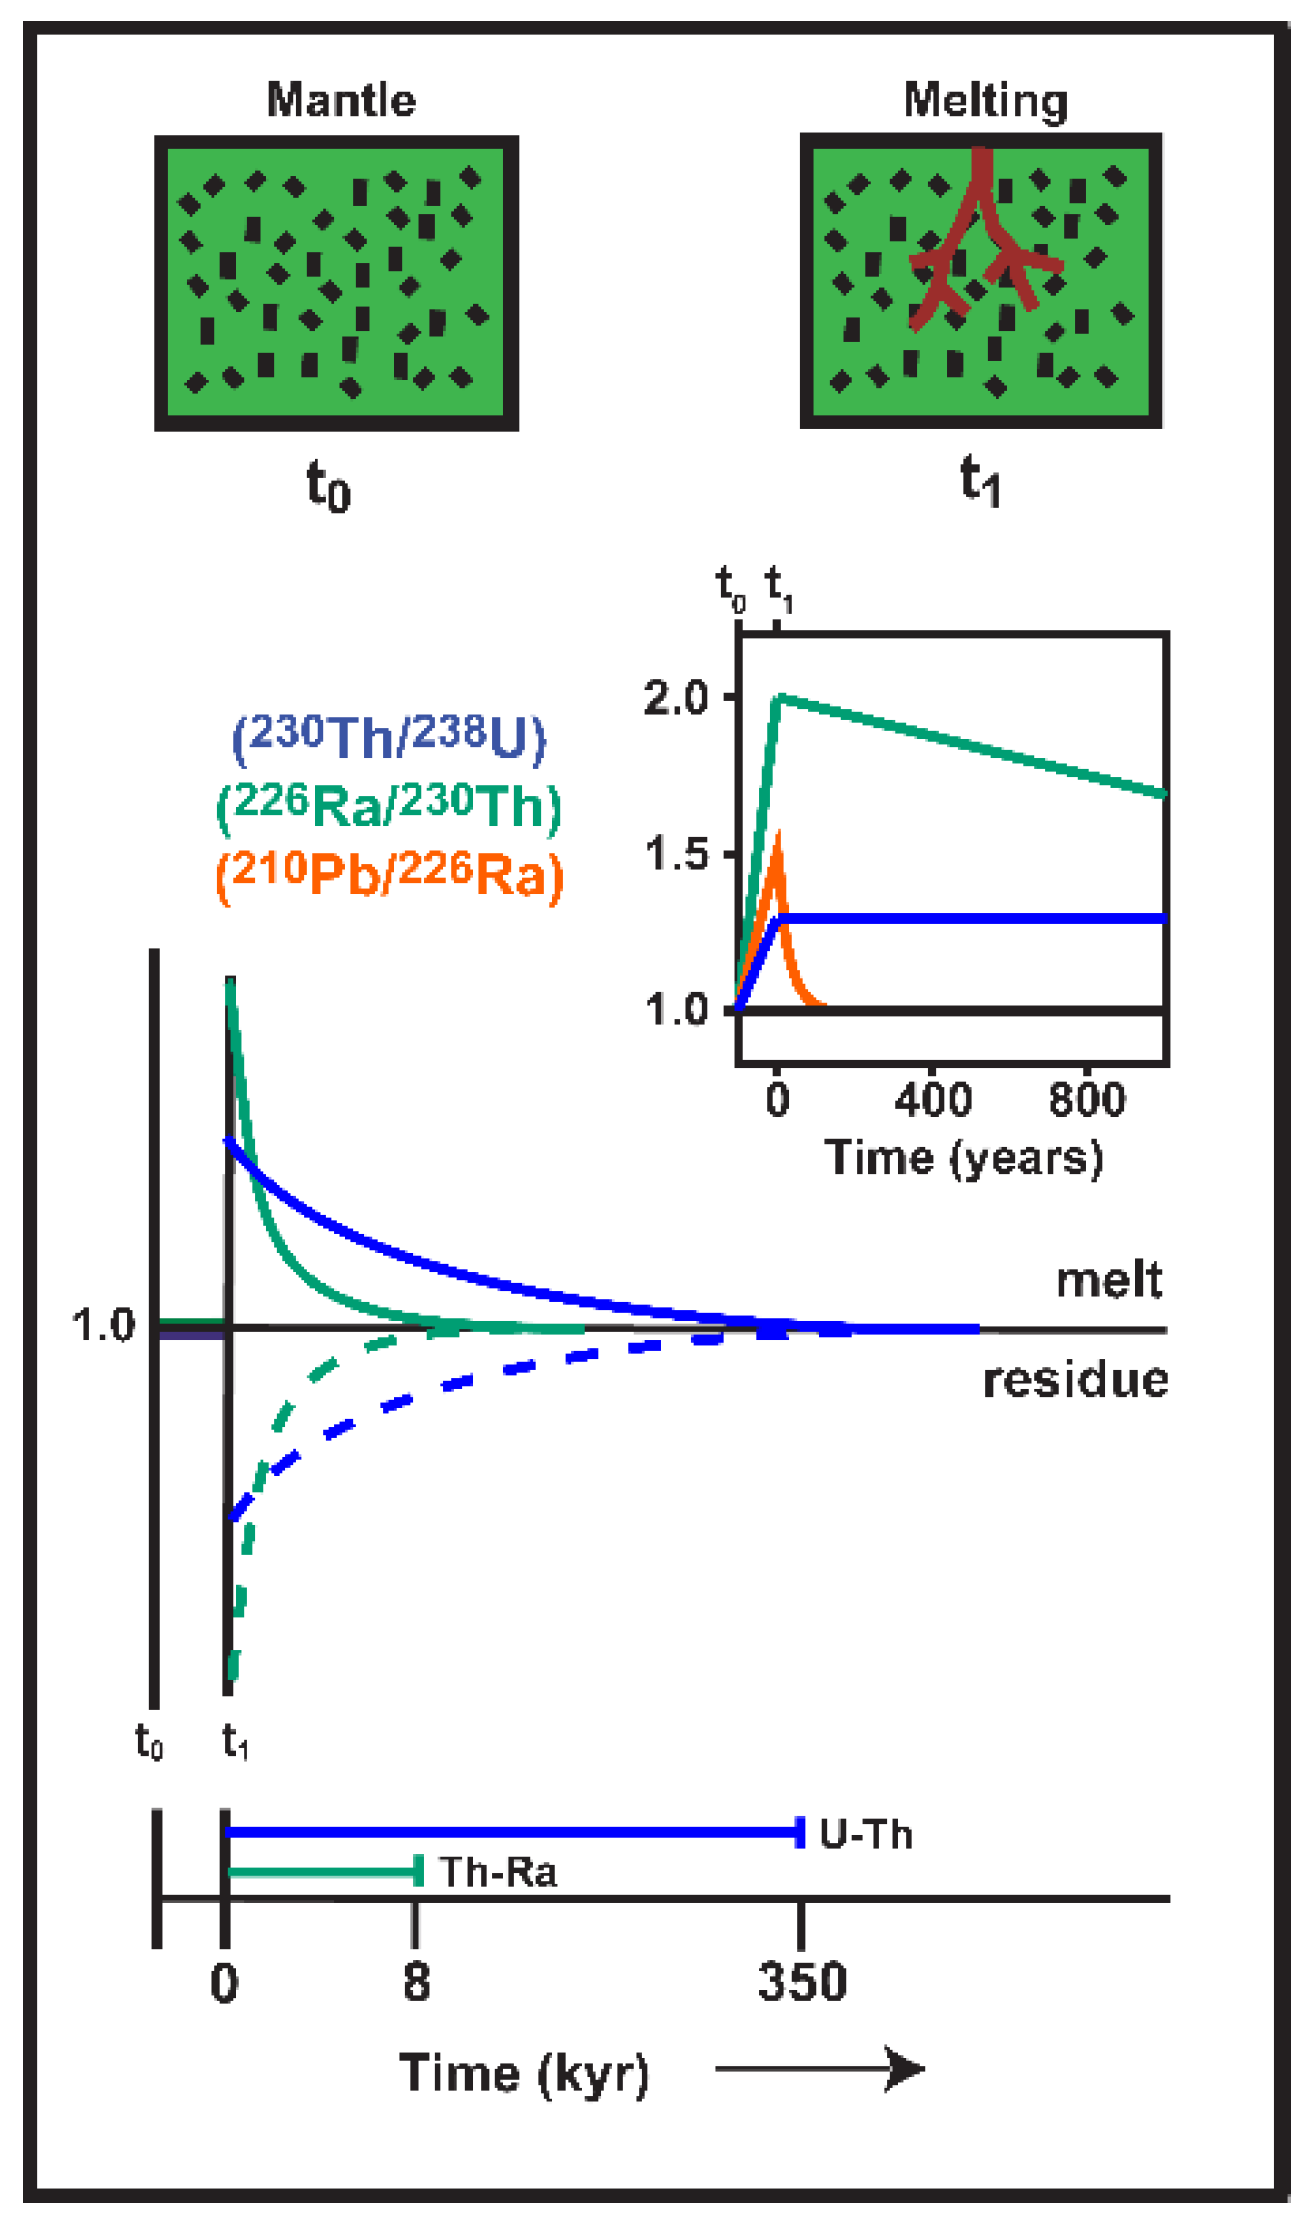
2. The Theoretical Construct of Multiple Nuclides Decaying in a Series

The U and Th decay series chains (Figure 2) comprise three naturally occurring decay series: the 238U series (referred to as the uranium series, but historically referred to as the radium series), the 235U series (referred to as the actinium series), and the 232Th series (referred to as the thorium series). There is also a 237Np series that is no longer extant because of the relatively short half-life of parental 237Np (2.2 x 10⁶ years) relative to the age of the elements in the solar system and the age of the Earth. However, this chain is regularly produced artificially in the nuclear industry, and 233Pa, which is the progeny of 237Np, is often used as a standard (‘spike’) for 231Pa isotope dilution measurements.
Bateman [2] first formalized the symmetrical form of multiple nuclides decaying in a series that is the central premise of the 238U, 235U, and 232Th decay series. Several review texts have presented the theoretical basis of the decay series (e.g., [3]).
Here, we present the simplest case in which two nuclides in a decay series, a parent-daughter pair, are linked by principles of radioactive decay and ingrowth (Figure 3 and Figure 4). Consider, for example, the 238U series: U 92 238 U 92 234 T h 90 230 R a 88 226 P b 82 206 . As will be shown in the following derivation, radioactive secular equilibrium within a decay series is defined as: λ 1 N 1 = λ 2 N 2 = λ 3 N 3 or (A1) = (A2) = (A3), where λ i   is the decay constant of isotope i , N i is the number of atoms of isotope i , and ( A i ) is the activity of isotope i (parenthesis around an isotope denote activity), and is defined as:
( A ) =   d N d t = λ N
Activity typically has units of decays per second per gram (dps/g or Becquerels/g), decays per minute per gram (dpm/g), or decays per year per gram (dpy/g) depending on which time unit (seconds, minutes, years) is used for the decay constant. So, in a decay series, where N 1 N 2 N 3 :
d N 1 d t = λ 1 N 1
d N 2 d t = λ 1 N 1 λ 2 N 2
Figure 2. Schematic of the 238U, 235U, and 232Th decay series. Boxes for each radioisotope include approximate half-lives and type of decay (α and/or β-). Table includes common parent-daughter pairs utilized in studying igneous processes and their associated measurement techniques. Modified from [4].
Preprints 184447 g002
Since N1 undergoes radioactive decay, its abundance at time t is given by:
N 1 = N 1 0 e λ 1 t
where the term N 1 0   is the number of atoms at t = 0. Substituting Equation 4 into Equation 3 yields:
d N 2 d t = λ 1 N 1 0 e λ 1 t λ 2 N 2
and
d N 2 d t + λ 2 N 2 λ 1 N 1 0 e λ 1 t = Ø
Solving for N 2 :
N 2 = λ 1 λ 2 λ 1 N 1 0 e λ 1 t e λ 2 t + N 2 0 e λ 2 t
The first term gives the number of atoms N 2 that formed from decay of N 1 , but have not yet decayed to N3. The second term gives the number of atoms N 2 that remain from initial N 2 0 . If there are no atoms of the original daughter N 2 0 , then this reduces to:
N 2 = λ 1 λ 2 λ 1 N 1 0 e λ 1 t e λ 2 t
Figure 3. A portion of the 238U decay series, extending to 222Rn. Sphere sizes represent the relative natural abundances (i.e. larger spheres represent more atoms; actual sizes would vary by many orders of magnitude). Arrow widths correspond to the magnitude of the decay constant (λ). Equations reflect radioactive secular equilibrium within the decay series, in which the activities (defined as A = λN) of parent and daughter nuclides are equal. λ = decay constant; N = number of atoms; A = activity. Modified from [4].
Preprints 184447 g003
The attainment of secular equilibrium amongst a parent-daughter pair is a function of half-life, and can be estimated, by exploring the limits of Equation 8, to be in place after six or more half-lives have passed. After six half-lives of daughter N 2 :   e λ 2 t Ø ,   s o :
N 2 λ 1 λ 2 λ 1 N 1 0 e λ 1 t λ 1 λ 2 λ 1 N 1
If the parent has a significantly longer half-life than the daughter, then:
λ 2 λ 1 λ 2 , N 2 λ 1 λ 2 N 1 ,   and   N 2 λ 2 N 1 λ 1
The attainment of secular equilibrium after an initial parent-daughter fractionation is graphically illustrated in Figure 4. In this hypothetical parent-daughter system, the parent isotope (N1; t1/2 = 10 hours) has a half-life ten times longer than its shorter-lived daughter (N2; t1/2 = 1 hour). Two scenarios are illustrated. In the first example, the daughter isotope has been entirely removed from the parent (Figure 4A-C), so N 2 0 = 0. For this situation, the number of daughter atoms (N2) increases over time until equilibrium is established, after which the ratio of parent to daughter is a constant value of ( λ 2 λ 1 )/ λ 1 , which, as shown above, is reasonably approximated as λ 2 / λ 1 since λ 2 λ 1 λ 2 or in this case, N1/N2 = 10. In the second example, the activity of the daughter is enriched by a factor of 300% over the parent nuclide (Figure 4D-F). Although the activity of N2 initially is greater than that of N1 by a factor of three, then because of the factor of ten difference in half-lives and the definition of activity (Nλ), the number of atoms of N2 is still less than the number of atoms of N1 by a factor of five. In this scenario, the activity of the daughter atoms (N2) decreases over time until equilibrium and ( λ 2 λ 1 )/ λ 1 .
Now consider the actual 238U-230Th system U 92 238 U 92 234 T h 90 230 R a 88 226 P b 82 206 . The 238U-234U-230Th example is ideal for illustration, as (i) it is the most commonly used decay series chronometer and, in general terms, (ii) these parent-daughter pairs are commonly used for most geochronological applications.
( T h ) A 230 = ( T h ) A X 230 + ( T h ) A S 230
where ( T h ) A 230 is the total activity, ( T h ) A X 230 is the unsupported excess activity ( λ N , where parentheses denote activity) and ( T h ) A S 230 is the 230Th supported by the decay of 238U. In a system in which geochemical fractionation of Th from U ceases, the unsupported excess, ( T h ) A X 230 , decays according to simple radioactive principles, such that at time t:
( T h ) A X 230 = ( T h ) A X 0 230 e λ 230 t
where ( T h ) A X 0 230  is the initial unsupported excess. Normalized to (232Th), the total (230Th/232Th) excess is:
T h 230 T h 232 A X = T h 230 T h 232 A X 0 e λ 230 t
Figure 4. Attainment of radioactive secular equilibrium after an initial fractionation between hypothetical long-lived parent (N1; t1/2 = 10 hours) and short-lived daughter (N2; t1/2 = 1 hour) isotopes. Two scenarios are shown: zero initial daughter isotope (a-c) and initial daughter excess (d-f). (A) In the zero initial daughter scenario, the number of moles of the daughter isotope increases until it is in secular equilibrium with the parent isotope, which occurs after about five half-lives of the daughter. After secular equilibrium is reached, the ratio of parent to daughter is a constant value of (λ2 – λ1) / λ1. (B) In terms of activity, the daughter isotope activity increases from zero until it comes into secular equilibrium with the parent, after which the activities of the parent and daughter isotope remain equal. (C) A plot showing the activity ratio (parentheses denote activity) of N2/N1. The activity ratio increases from zero until secular equilibrium is reached. The trend in the number of moles and, hence, the activity of N2 is non-linear due to the decay of N2. The daughter excess scenario in (D-F) exhibits an inverse relationship to the zero initial daughter scenario. (D) The initial number of moles of the daughter isotope decreases until secular equilibrium with the parent isotope is reached, after which the ratio of parent to daughter is again a constant value of (λ2 – λ1) / λ1. e) The activity of the daughter isotope decreases from its initial excess until it comes into secular equilibrium with the parent, after which the activities of parent and daughter are equal. (F) The activity ratio of N2/N1 decreases from an initial daughter excess until secular equilibrium is reached after about five half-lives of the daughter isotope. Modified from [4].
Preprints 184447 g004
Now let us look at the second component in the total activity, which is the supported T h 230 from the decay of U 238 ( 4 ) . From Equation 8:
N 2 = λ 1 λ 2 λ 1 N 1 0 e λ 1 t e λ 2 t
In terms of T h 230 :
T h 230 A S = λ 234 λ 230 λ 234 U 234 0 e λ 234 t e λ 230 t
Given that U 238 U 234 T h 230 , if 234U is in secular equilibrium with 238U, then
U 234 = U 238 and thus U 0 234 λ 234 = U 238 A , λ 230 λ 234 λ 230 , and e λ 234 t 1 . From this follows that
λ 230 T h 230 A S = λ 234 U 234 0 1 e λ 230 t
T h 230 A S = U 238 1 e λ 230 t
From Equation 12:
( T h ) A X 230 = ( T h ) A X 0 230 e λ 230 t
and Equation 11:
T h 230 A = T h 230 A X + T h 230 A S
so that:
T h 230 A = T h 230 A X e λ 230 t + U 238 1 e λ 230 t
When normalized to T h : 232
T h 230 T h 232 A = T h 230 T h 232 A X e λ 230 t + U 238 T h 232 1 e λ 230 t
This is a linear equation in the space of (230Th/232Th) versus (238U/232Th) and is the underlying equation used for the 238U-230Th chronometer [5]. Similar variants exist for the other U-series chronometers. It should be noted that 234Th and 234Pa, while being important tracers in chemical oceanography [6], are essentially disregarded for dating purposes, as they are assumed to be in secular equilibrium due to their very short half-lives (234Th t1/2 = 24.1 d, 234Pa t1/2 = 1.18 m).

3. U-Th-Ra and U-Pa Series Constraints on Decompression Melting at Divergent Plate Boundaries and Intraplate Hotspots

Beneath both mid-ocean ridge spreading centers and intraplate hotspot settings, the dominant mode of melt production is adiabatic decompression of solid upwelling mantle material. This melting process induces chemical fraction between parent-daughter nuclides that results in U-series disequilibria. The timescale over which this U-series disequilibrium can be used to understand the timescale of melting is highly dependent on the half-life of the daughter nuclide in the parent-daughter pair (Figure 2; Table 1) In the following, we examine the U-series models that have been proposed to constrain the timescales of adiabatic decompression melting of solid upwelling mantle.
Two end-member processes (Figure 5 and Figure 6) have been proposed to account for the 238U-230Th disequilibria measured in oceanic basalts: 1) time-independent melting in which net elemental fractionation of Th from U at low melt fractions (and porosities) is the driving mechanism creating disequilibria [7,8,9]; and 2) and time-dependent melting, where 230Th grows in over the timescale of melt generation [10,11,12,13]. If net elemental fractionation of U/Th during partial melting is the dominant effect, then the U/Th of the mantle source is best determined from the 230Th/232Th activity ratio of the lavas. On the other hand, if 230Th ingrowth is the fundamental mechanism generating 238U-230Th disequilibria, then the U/Th source ratio is best determined from the 238U/232Th activity ratio of the lavas.
In time-dependent adiabatic decompression melting models (Figure 5 and Figure 6), ingrowth of 230Th produces elevated (230Th/232Th) leading to higher (230Th/238U). Therefore, when upwelling is fast (e.g., beneath Kilauea volcano, which is the central locus of the Hawaiian plume) ingrowth is minimal and net elemental fractionation of Th/U during partial melting is the dominant effect [8,9]; whereas, when upwelling is slow (e.g., at mid-ocean ridges), 230Th ingrowth is the fundamental mechanism producing U-Th disequilibria.
Figure 6. Schematic illustrating the differences in the dynamic melting modeling of McKenzie [14] and the chromatographic melting model of Spiegelman and Elliott [12]. (A) In dynamic melting, melts (red spheres) produced in the upwelling mantle are retained in pore spaces and remain in chemical equilibrium with the solid matrix (green spheres) until a critical threshold porosity (φ) is reached. Any melts produced in excess of this critical threshold value will be instantaneously extracted into a melt channel, where they quickly move to the surface. As a result, melts do not react with the solid matrix as they travel upwards. In contrast to chromatographic melting, disequilibria are primarily created at the base of the melt column where parental uranium is extracted and is a function of the timescale of melting. (B) In chromatographic melting, chemical equilibrium is maintained through continuous interaction between melt and solid during melt transport. Different elements travel at different velocities through the melt column according to their mineral/melt partition coefficients. In this scenario, the daughter is less compatible than the parent, so it travels faster through the melt column. This difference in melt column residence times is represented by the vertical distance between parent and daughter decays (denoted by short curved arrows). Because the daughter is extracted at the surface before it decays, the daughter becomes enriched relative to the parent, which has a longer residence time in the melt column. Parent and daughter activities are denoted by Cp and Cd, respectively. In the subsolidus mantle, parent and daughter travel at the same velocity (the mantle upwelling rate) and maintain secular equilibrium.
Preprints 184447 g006

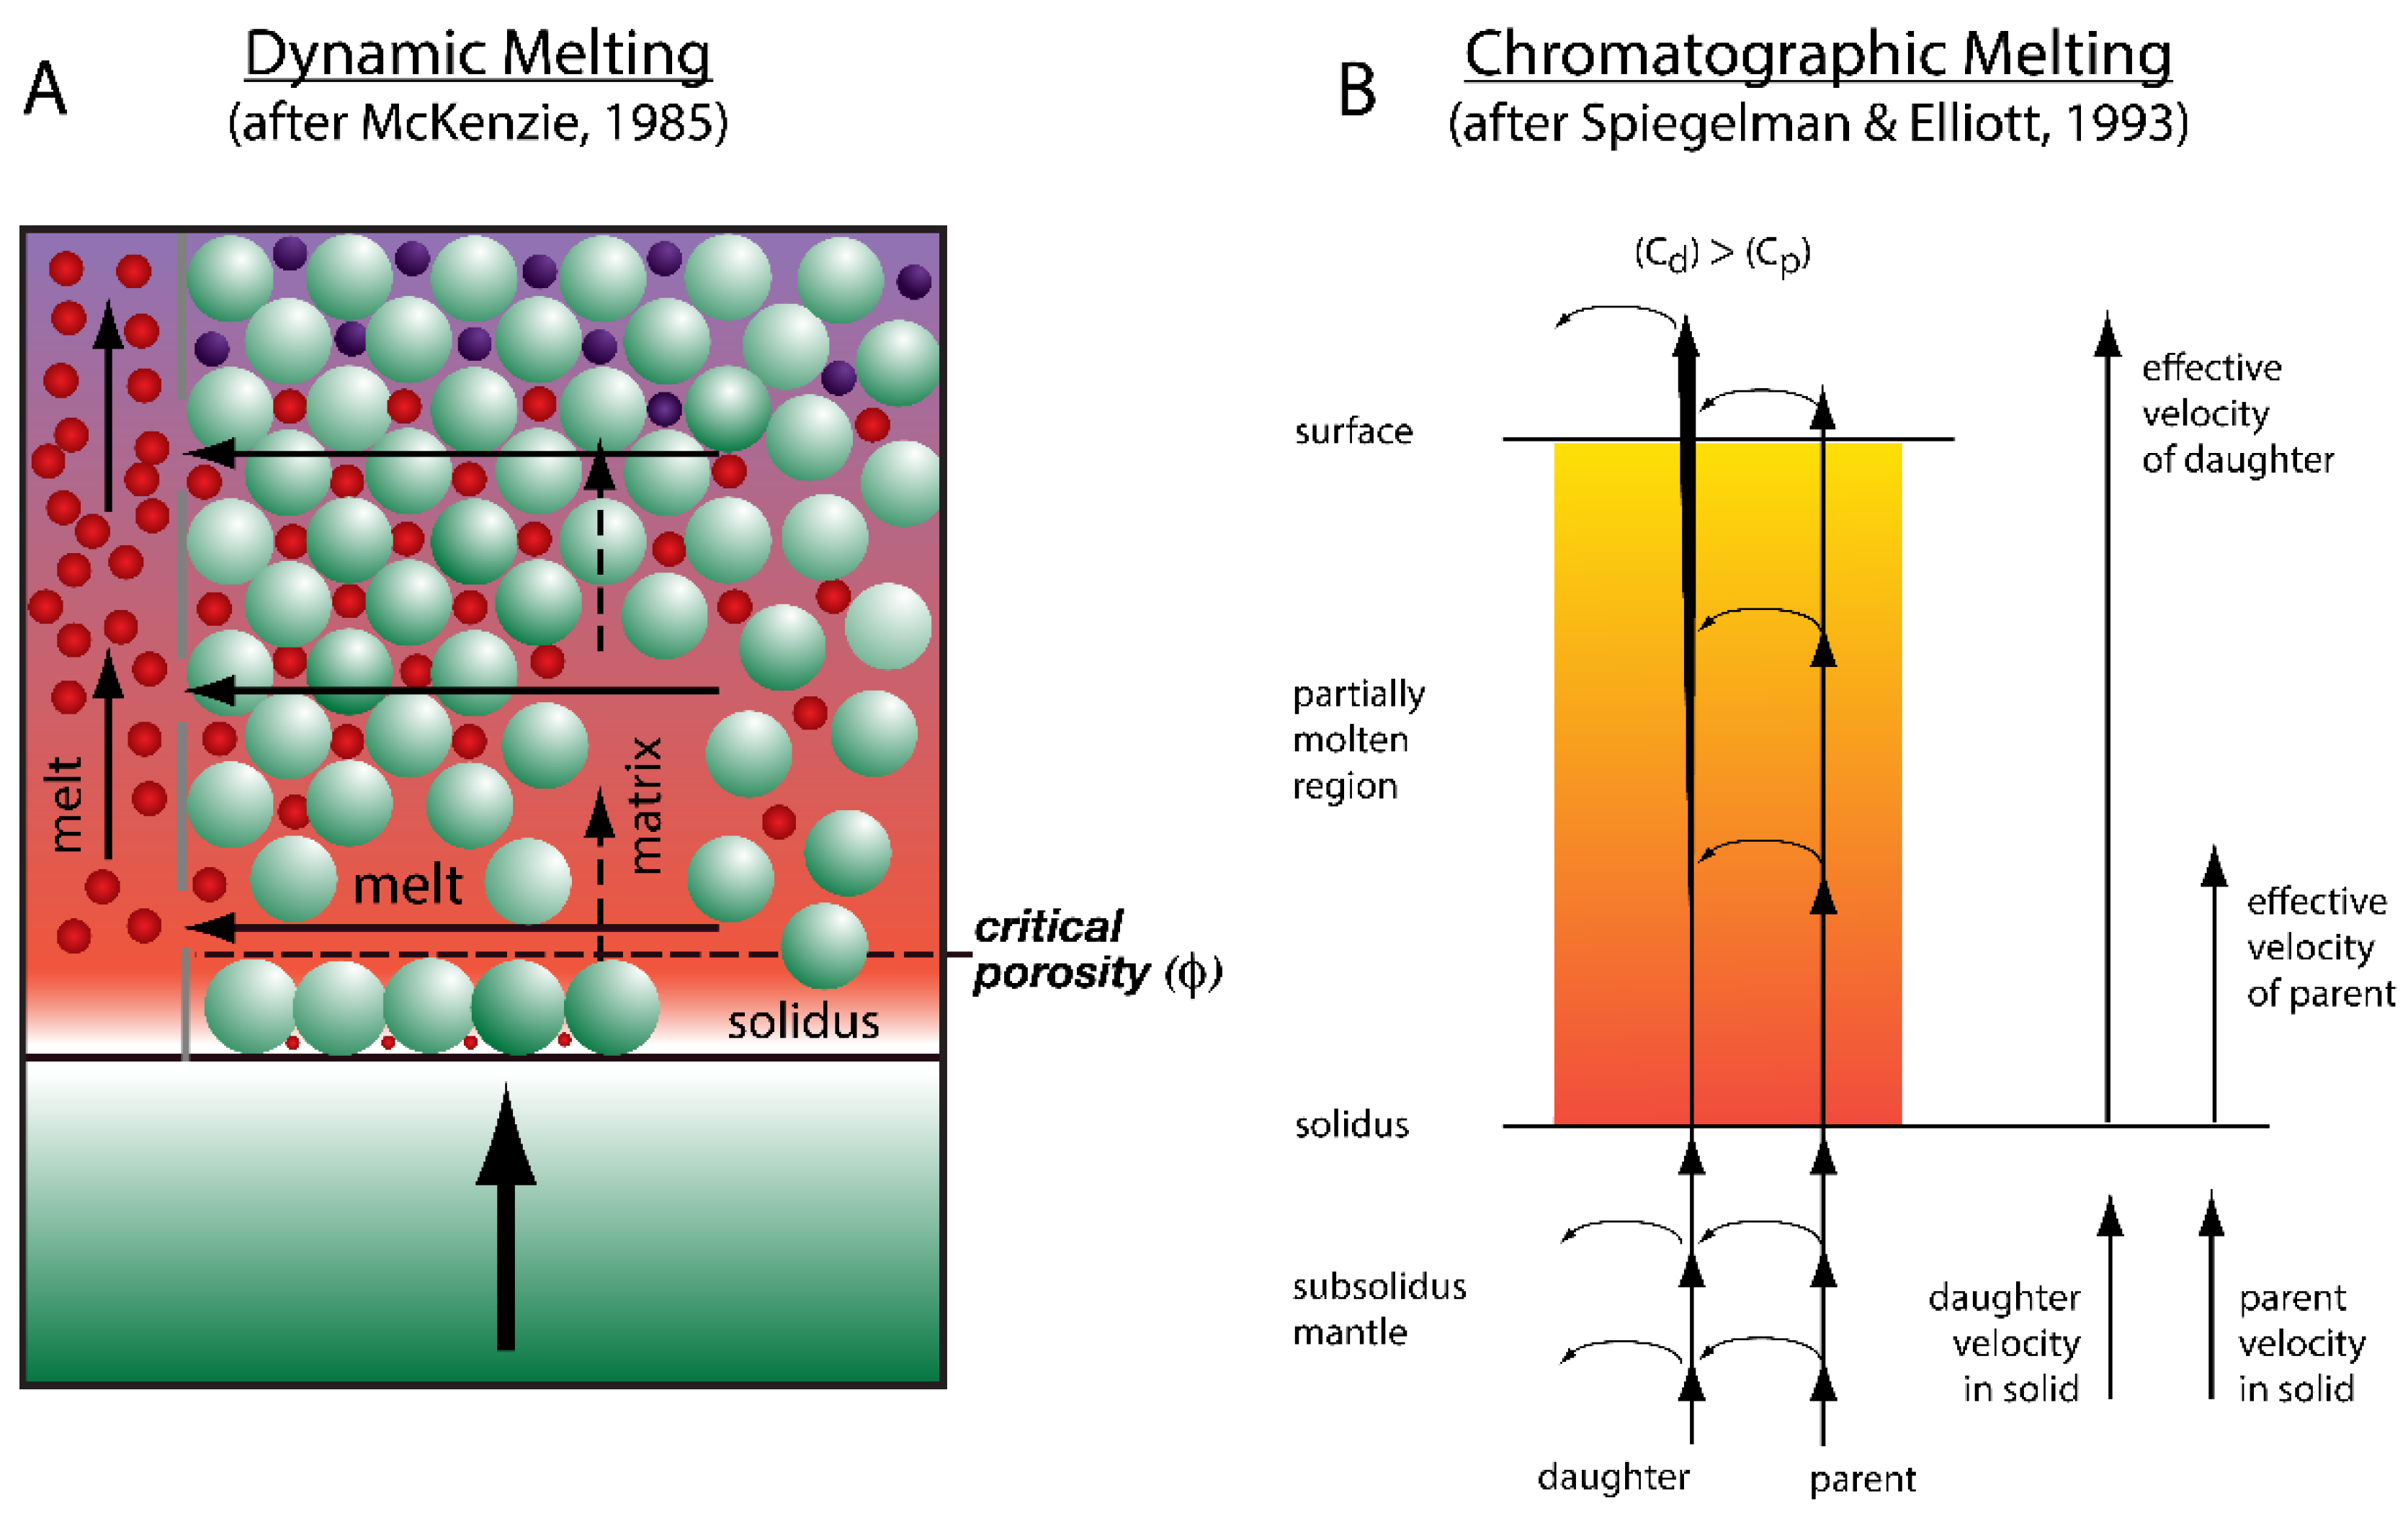
3.1. Time-Dependent Melting Models

Several models relating the isotopic effects of nuclide ingrowth in U-series disequilibria to the timescales of the melting process have been proposed (e.g. [8,11,12,13,14,15,16,17,18,19,20,21,22]; however, credit for the time-dependent models (Figure 5 and Figure 6) should be given to (a) McKenzie [14] for dynamic melting and (b) Spiegelman and Elliott [12] for reactive porous flow melting, also called chromatographic melting.
While these two end-member models, dynamic (a) versus chromatographic (b) melting, differ mainly in their treatment of the melt extraction process (i.e. (a) equilibrium in the trapped pore space plus fractional melting for the extracted portion, versus (b) porous flow of a migrating liquid that continuously reacts and equilibrates with the surrounding solid matrix), they both incorporate the effect of radioactive ingrowth and decay of the daughter isotopes (e.g. 230Th, 226Ra, 231Pa) during melt production. As such, these models predict mantle melting and melt transport rates based on U-Th-Ra and U-Pa disequilibria. These U-series mantle melting rates can, in turn, be combined with theoretical predictions of melt productivity (e.g., [23,24]) to calculate solid mantle upwelling rates.
In the following, we briefly review the two different end-member melting models incorporating the timescales of the melting process and compare these models with a global MORB database (Figure 7, Figure 8, Figure 9, Figure 10 and Figure 11). We then show, through examples, how the U-series data measured in lavas can be compared with these models to place unique temporal constraints on many of the magmatic processes associated with adiabatic decompression and time-dependent melting.

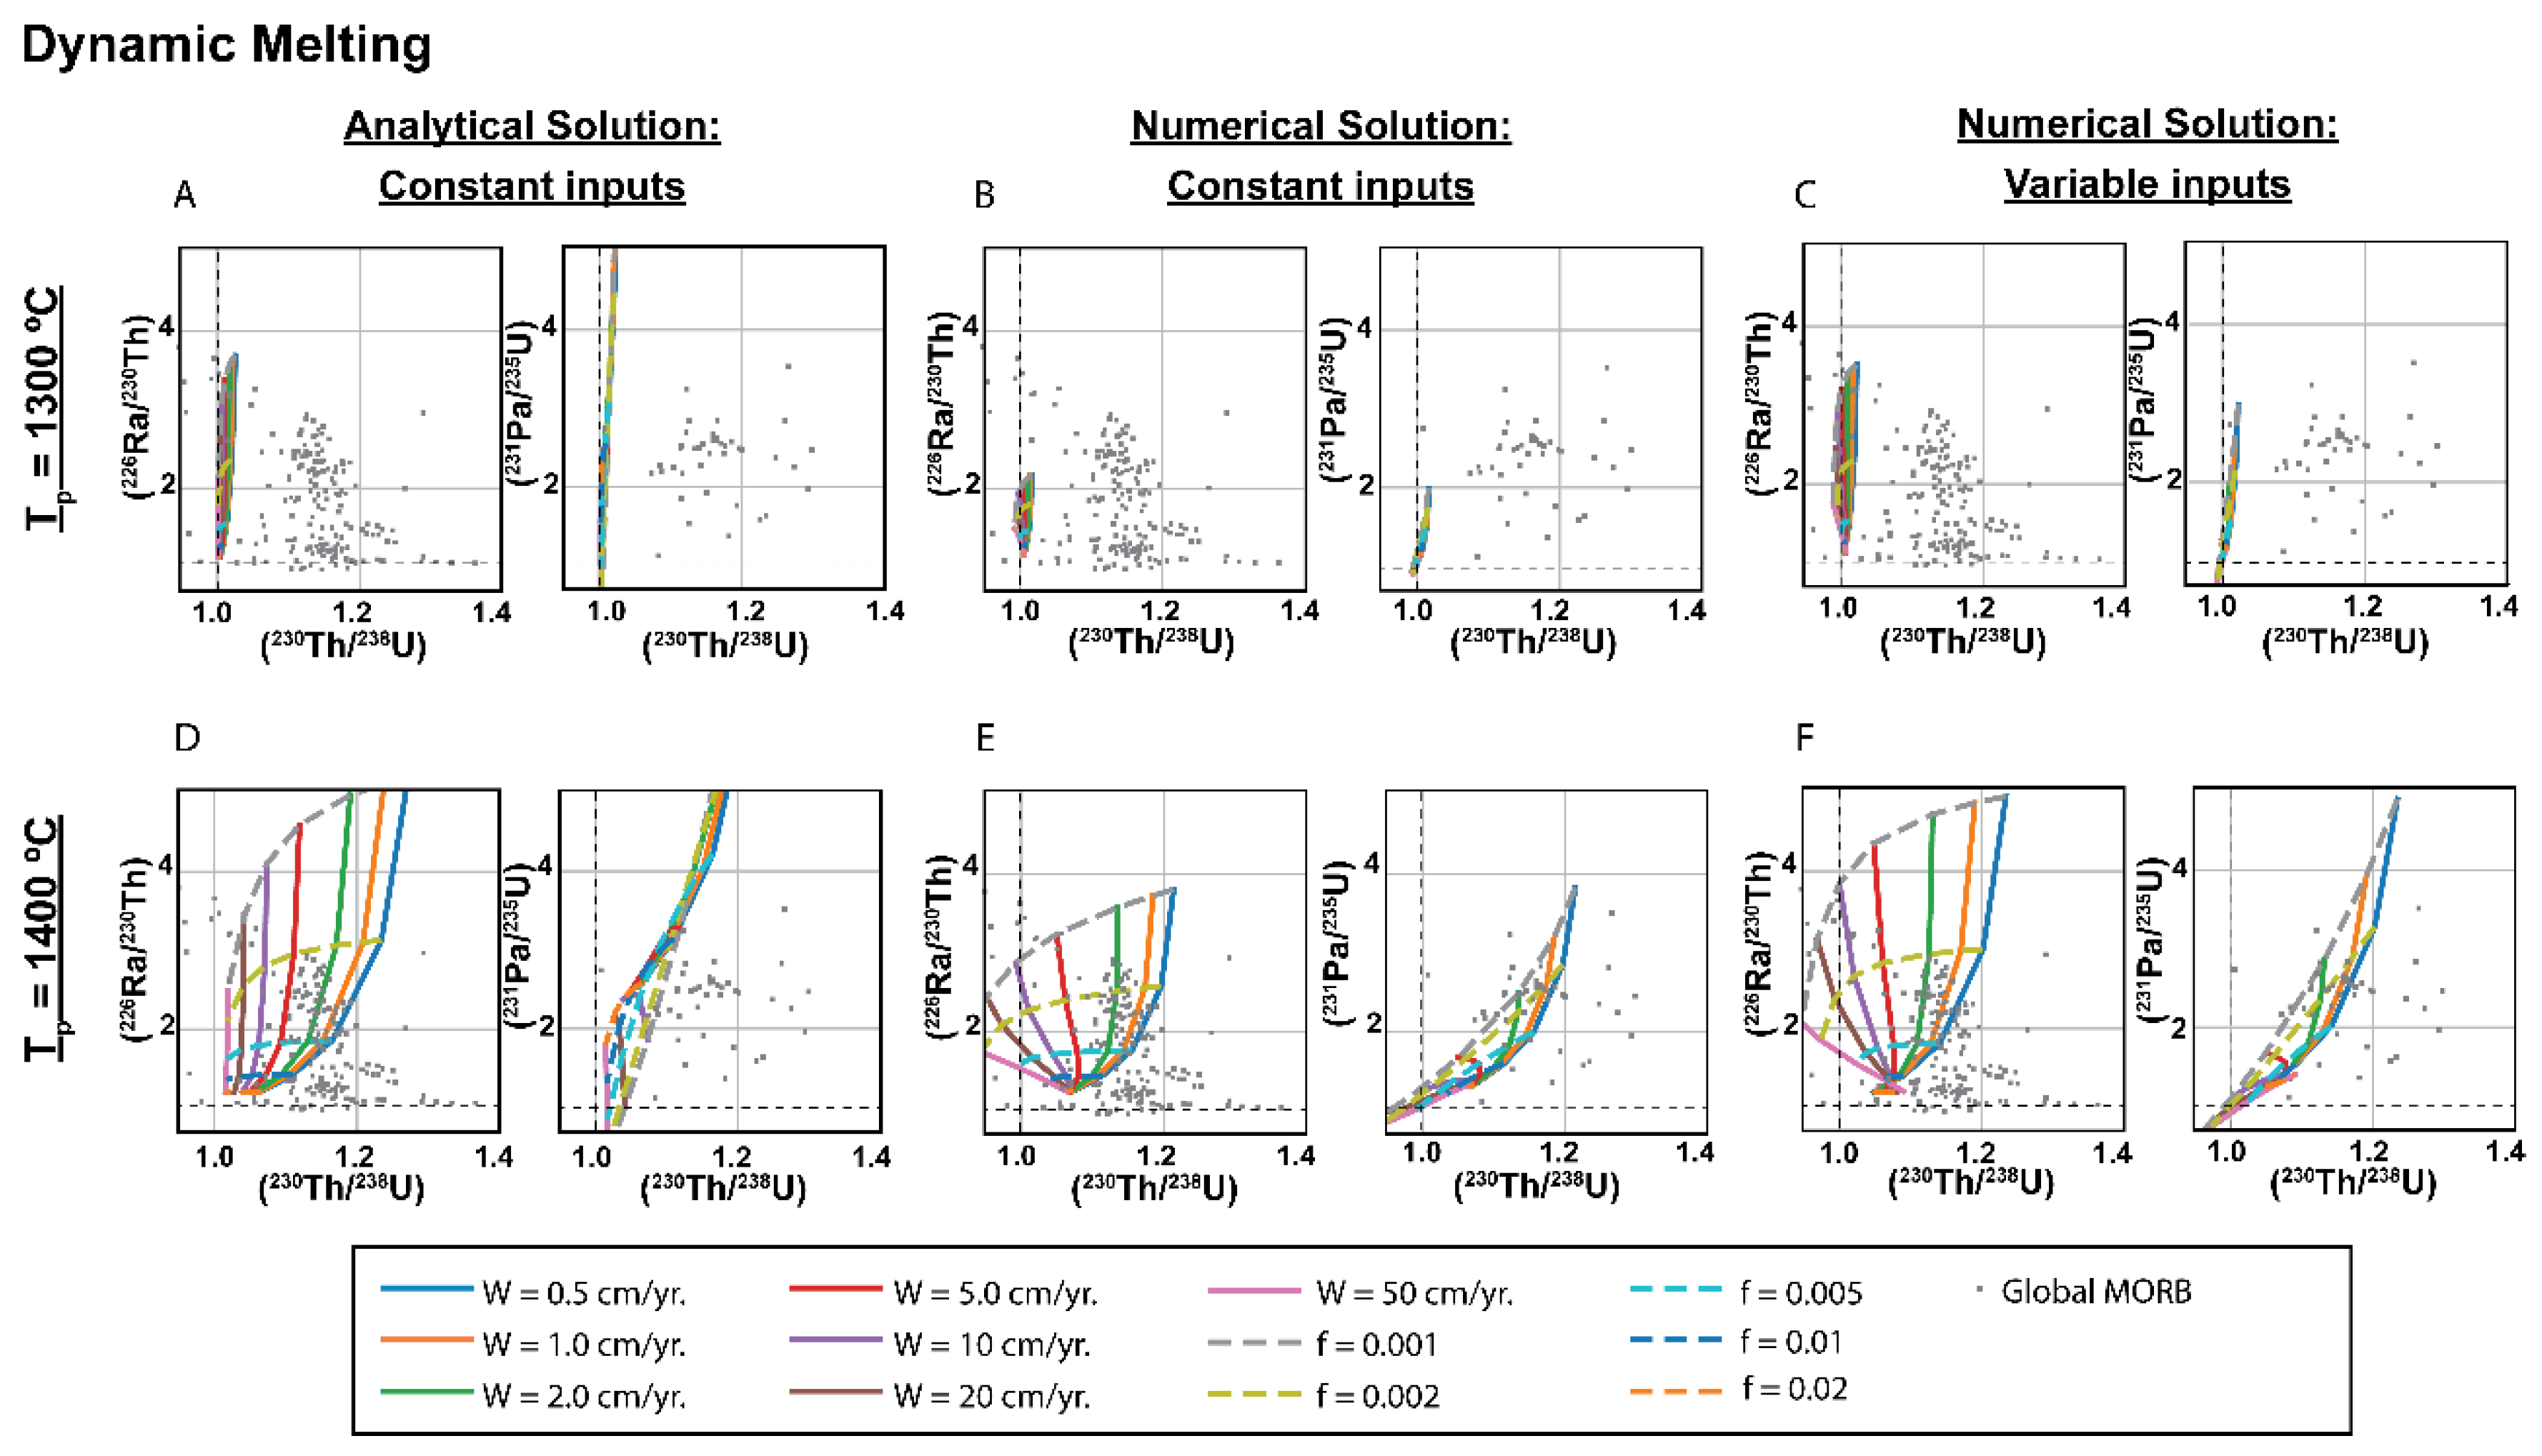
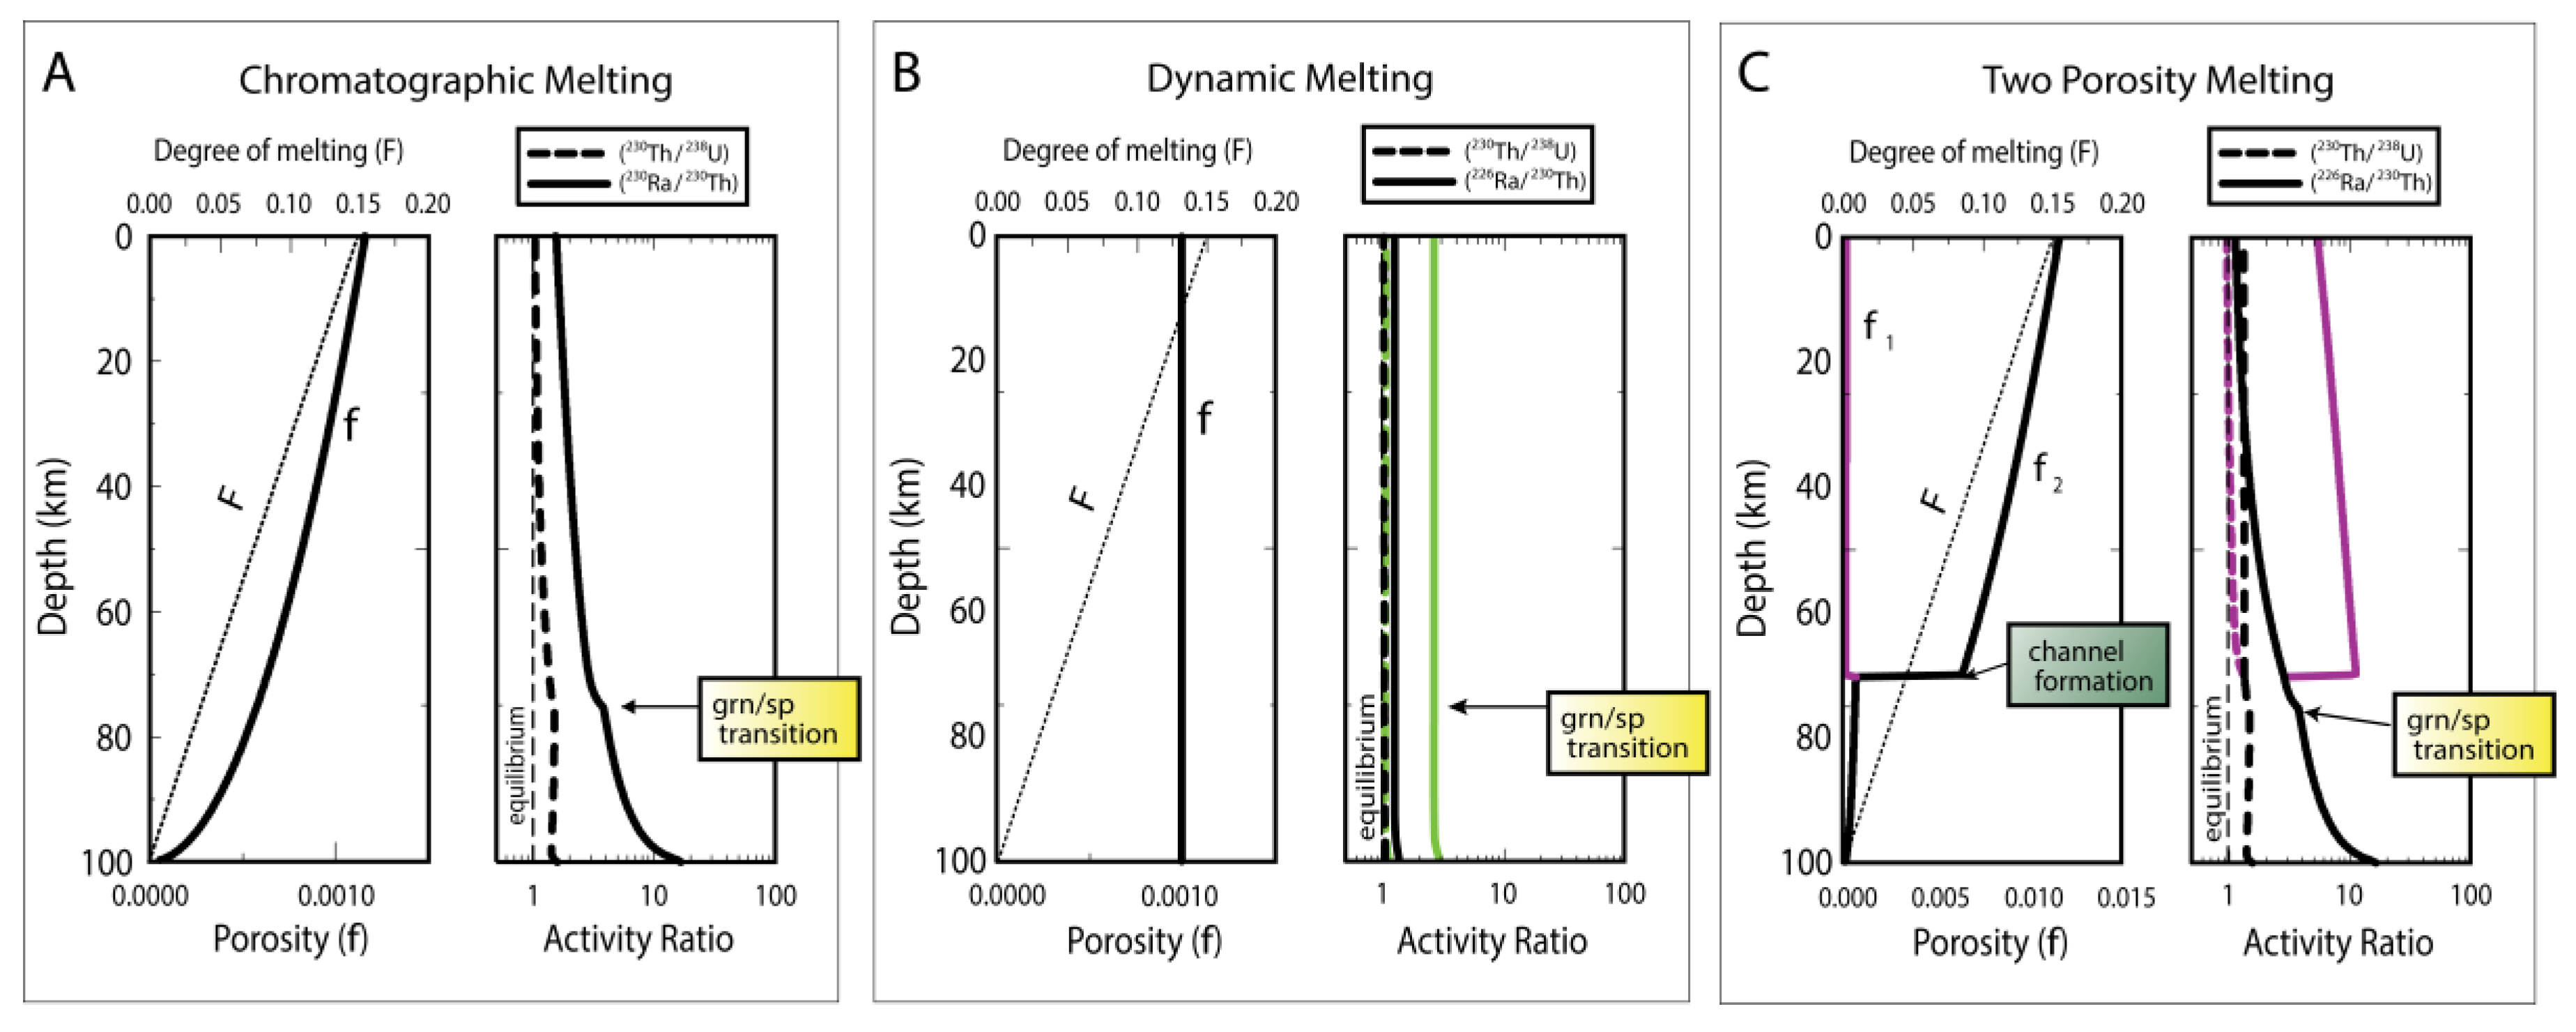
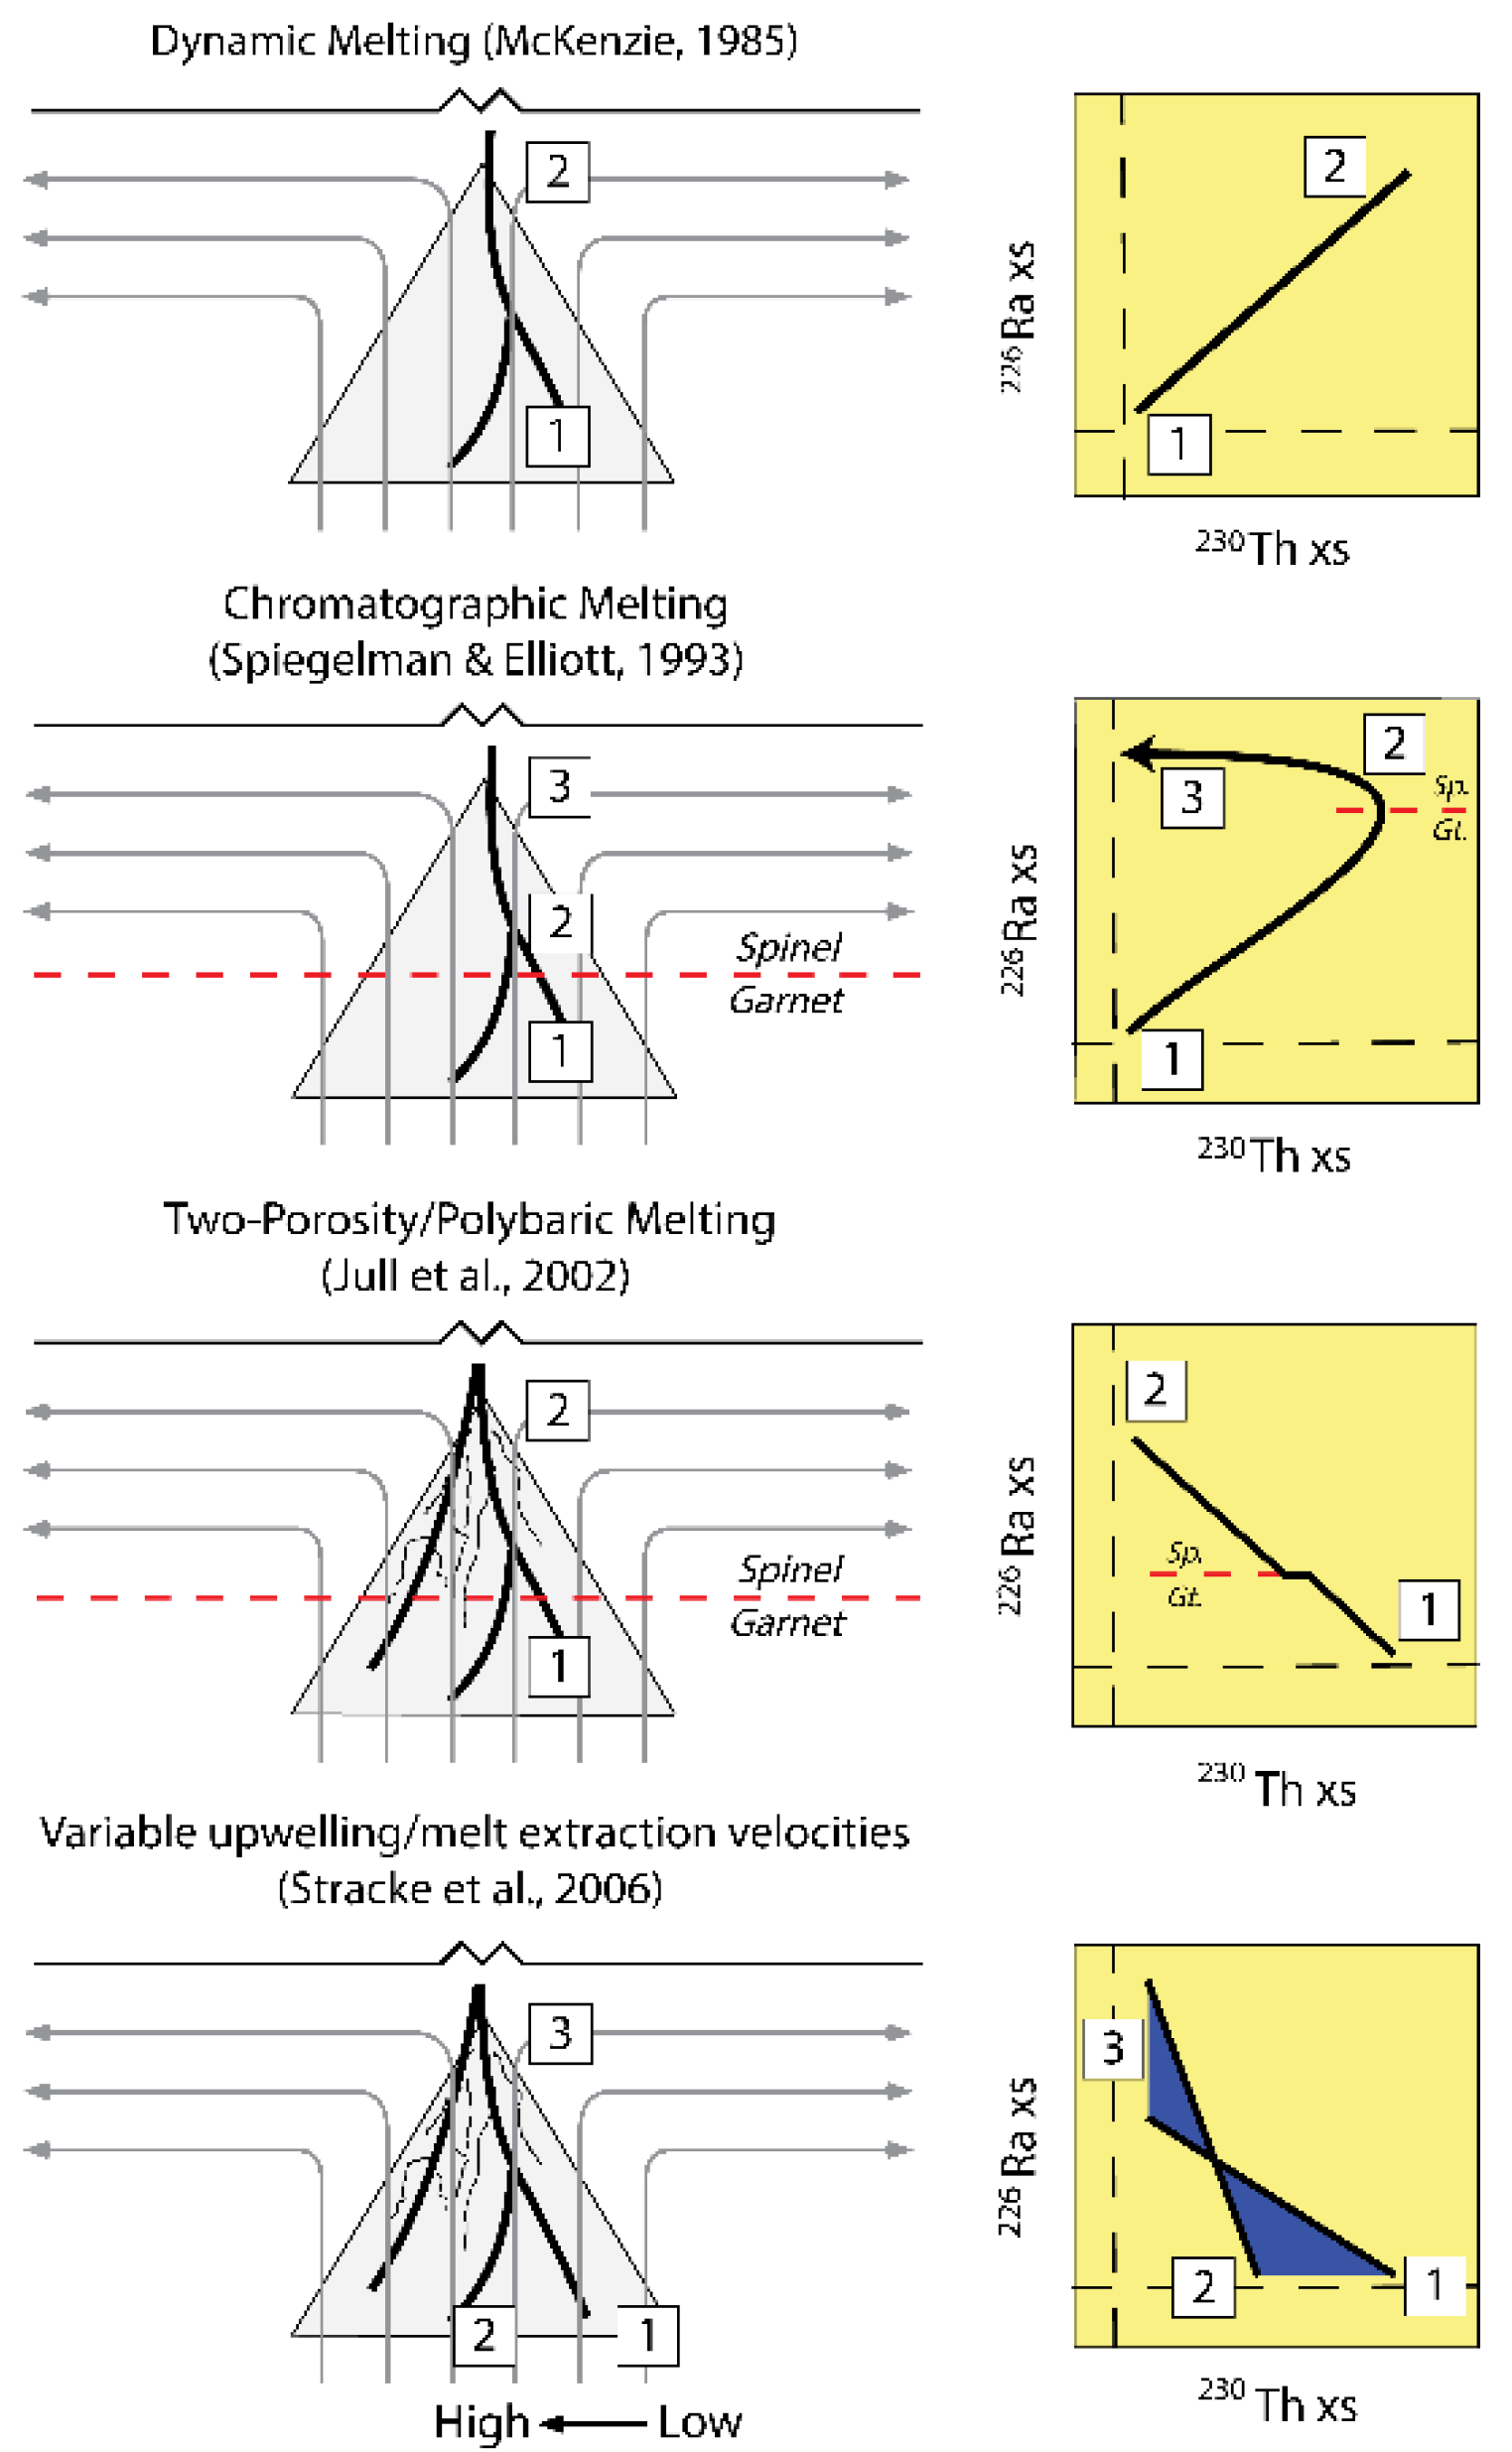
3.2. Dynamic Melting

Solutions for 238U-230Th-236Ra disequilibria during dynamic melting were first derived by McKenzie [14] and have subsequently been presented in several papers pertaining to the production of U-series disequilibria in basaltic melts [11,18,19,21,22,47]. By assuming a constant melt rate (Γ, mass fraction per time), and a constant porosity (φ, volume fraction of melt), the (230Th/238U) and (226Ra/230Th) can be solved analytically and expressed as a function of ϕ and Γ (see McKenzie [14] or Williams and Gill [11] for the full derivation):
T h 230 U 238 = F T h ( K U + λ T h ) F U ( K T h + λ T h )
and
R a 226 T h 230 = F T h K U + λ R a F U K T h + λ R a 1 + λ T h K U + K U K T h + λ R a K U + λ T h
where
F i = ϕ ρ f D i ρ s 1 + ϕ f
and
K i = F T h 1 D i ϕ ρ f Γ 0
and Di is the bulk mineral/melt partition coefficient and ρf and ρs are the densities of the melt and peridotite source (2800 and 3300 kg·m−3), respectively. Note that an expression similar to Equation (19) can be derived for (231Pa/235U).
Figure 8. Results of dynamic melting calculations for an adiabatically decompressing peridotitic mantle showing (226Ra/230Th) and (231Pa/235U) versus (230Th/238U) gridded melting model results for the solid mantle upwelling rates (W) and residual threshold porosity values (f) listed. Model results are shown for (A) the analytical solution to dynamic melting, (B) the numerical solution assuming constant bulk solid/liquid partitioning and melting rates, (C) the full numerical solution with variable elemental partitioning and melting rates, all with Tp = 1300 ºC; (D) the analytical solution to dynamic melting, (E) the numerical solution assuming constant bulk solid/liquid partitioning and melting rates, and (F) the full numerical solution with variable elemental partitioning and melting rates, all with Tp = 1400 ºC. Global MORB data are shown for comparison. After Figure 7.
Preprints 184447 g008
In the dynamic melting model, as formulated by McKenzie [14], melts produced in the upwelling mantle are retained in the pore space and are in equilibrium with the solid residue until a critical threshold porosity is achieved, after which any produced melt in excess of this critical threshold value is extracted instantaneously such that the porosity remains constant at the threshold value (Figure 6A). Dynamic melting takes into consideration the timescale of the melting process and, hence, ingrowth produces enhanced excesses of short-lived daughter nuclides such as 226Ra and to a lesser extent 230Th (Figure 8). In dynamic melting, the produced melts are also assumed to move rapidly to the surface as they form, without reacting with surrounding rocks during transport. Because most of the parental uranium is extracted near the base of the melting column, disequilibria are created primarily at the bottom of the melt column instead of throughout its entire length. (This contrasts with the outcomes of chromatographic melting presented in the next section). With dynamic melting, melt velocities can thus be constrained by the shortest half-life of the daughter nuclide in radioactive disequilibrium with its immediate parent.
Once the critical threshold porosity is reached, the porosity of the melt zone is constant (Figure 6 and Figure 8). Trace element enrichments in the melts are intermediate between batch melting and accumulated fractional melting, depending on the value of the threshold porosity relative to the distribution coefficients of the element(s) considered [11,47]. Thus, the retained melt porosity plays an important role in slowing the extraction of an incompatible element from the solid. With a small critical porosity, dynamic melting is closer to fractional melting, in which incompatible elements are efficiently stripped from the residue, whereas with a large critical porosity, dynamic melting is more similar to batch melting, in which incompatible elements reside in chemical equilibrium with the solid.
Table 1. Summary of important U-series radionuclides.
Isotope Abundance Half-life Decay Constant Reference
238U 99.2742% 4.4683 ± 0.0024 x 10⁹ yr 1.5513 x 10⁻¹⁰ yr–1 [48]
234U 0.0054% 245,620 ± 260 yr 2.82206 x 10⁻⁶ yr–1 [49]
230Th 0.02% 75,584 ± 110 yr 9.1706 × 10⁻⁶ yr–1 [49]
226Ra Trace 1,600 ± 7 yr 4.332 x 10⁻⁴ yr–1 [50]
222Rn Trace 3.8235 ± 0.0004 d 1.8 x 10⁻¹ d–1 [50]
210Pb Trace 22.6 ± 0.1 yr 3.07 x 10⁻² yr–1 [51]
210Po Trace 138.4 ± 0.1 d 5.008 x 10⁻³ d–1 [51]
235U 0.7204% 7.0381 ± 0.0048 x 10⁸ yr 9.8485 x 10⁻¹⁰ yr–1 [48]
231Pa 100% 32,760 ± 220 yr 2.1158 x 10⁻⁵ yr–1 [52]
227Ac Trace 21.77 ± 0.02 yr 3.184 x 10⁻² yr–1 [51]
232Th 99.98% 1.401 ± 0.007 x 10¹⁰ yr 4.948 x 10⁻¹¹ yr–1 [53]
228Ra Trace 5.75 ± 0.03 yr 1.21 x 10⁻¹ yr–1 [50]
224Ra Trace 3.6319 ± 0.0023 d 1.9085 x 10⁻¹ d–1 [51]

3.3. Chromatographic Porous Flow Melting

The steady-state chromatographic porous flow melting model of Spiegelman and Elliot [12], in its main form, assumes that chemical equilibrium is maintained between migrating liquid and the solid matrix. The essential characteristic of chromatographic melting is that continuous melt-solid interaction between the ascending melt and mantle source results in different elements traveling through the melting column at different velocities according to their relative melt/solid partition coefficients (i.e. Di values) (Figure 6B). For non-radioactive elements, the equilibrium porous flow melting model produces trace-element enrichments that are identical to those of equilibrium batch melting [12]. However, for the U-series isotopes that have half-lives that are comparable to melt migration timescales, chromatographic effects can have a significant influence on resulting isotopic concentrations and activity ratios in the partial melt. If the daughter isotope is more incompatible than the parent isotope, which is largely true for the typical mantle lithologies considered here (e.g., [54], and references therein), the residence time of the daughter isotope in the melting column is shorter relative to the parent nuclide, as the more incompatible daughter nuclide travels preferentially with the melt while the more compatible element travels more slowly. This residence time effect enhances the production of daughter nuclides relative to their rates of decay in the melting column, which produces relatively large excesses in daughter isotopes in the resultant liquids. The extent of this daughter nuclide enhancement depends on the half-life of the daughter nuclide, and, consequently, is relatively large for 226Ra and much smaller for 230Th and 231Pa. The extent of ingrowth is also dependent on the length of the melting column, such that longer melt columns generate greater enhancements of the daughter nuclides due to longer nuclide residence times.
Table 2. Main parameters used in melting models.
Parameters Notation Units Range
Degree of melting F --- 0-0.2
Solid upwelling rate (1D) W m·yr-1 0-1
Melting rate Γ kg·m-3·yr-1 10−3 to 10−5
Solidus temperature T K 1000-1400
Length of melting column Z km 0-150
Plate velocity --- m·yr-1 0.01-0.1
Matrix porosity φ --- 0-0.05
Solid density ρs kg·m−3 3300
Melt density ρf or ρm kg·m−3 2800
Melt velocity (1D) ω m·yr-1
Lithosphere thickness h km 0-100
Decay Constants λ yr-1 >10-1 to 10-11
Bulk Partition Coefficient Di --- 0.00001 to 0.1
Buoyancy flux B Mg·s-1 0.5-9
The one-dimensional (1D) chromatographic porous flow model of Spiegelman and Elliott [12] has seven variable parameters (which are not all independent): the solid 1D velocity (W), the liquid 1D velocity ( ω ), the porosity (ϕ), the height of the melting column (∆z), the melt fraction (F), the melting rate (Γ) and the bulk mineral/melt partition coefficients (Di) for the trace-elements being considered. In the fully expanded form of the model, most of these variables may vary with depth and therefore, with time, though the full melt column height is fixed, and the solid velocity is typically treated as an externally imposed constant controlled by regional mantle convection and migration rates (W0).
Based on the formulations of Spiegelman and Elliott [12], Spiegelman [55] developed a numerical solution for 238U-230Th-226Ra disequilibria generated during chromatographic equilibrium porous flow melting. While Spiegelman and Elliott [12] pointed out that the system of equations to produce U-series disequilibria during chromatographic melting could be simplified sufficiently to be solved analytically, a set of analytically solvable expressions was not developed until Sims et al. [19]. (As discussed in Sims et al. [19], however, determining this solution required correcting an error in equation 15 from Spiegelman and Elliott [12].) We present the analytical approximation solution below for completeness and then compare outcomes of the analytical approach to those of full numerical solutions (Figure 9).
As originally derived in Spiegelman and Elliott [12], the effects of transport of melt through a melting column on the chemistry of radiogenic isotopes can be separated from melting by expressing the concentration of an element as:
c i = α i c b i
where c i is the concentration of an element measured at the surface, c b i is the concentration of a stable element due to batch melting, and α i is the enrichment factor due to transport. For equilibrium porous flow, because re-equilibration of solid and liquid is assumed to occur continuously, stable element concentrations in the melt are given by the batch melting equation. Spiegelman and Elliott [12] developed an alternative approach that assumes true fractional melting, i.e., where the solid does not re-equilibrate with the melt that passes through it (see Appendix of Spiegelman and Elliot [12]). This approach, along with additional methods, have recently been implemented by Elkins and Spiegelman [56] and will be addressed in further detail below.
Figure 9. Results of chromatographic/equilibrium porous flow melting calculations for an adiabatically decompressing peridotitic mantle showing (A, C) (226Ra/230Th) and (B, D) (231Pa/235U) versus (230Th/238U) gridded melting model results for the solid mantle upwelling rates (W) and residual threshold porosity values (f) listed, all at Tp = 1400 ºC. (A) and (B) show results for the analytical solution after Sims et al. (1999) assuming constant bulk solid/melt partitioning and melting rates, while (C) and (D) show outcomes for variable mineralogy and bulk partitioning and variable melting rates, as described in the text. Global MORB data are shown for comparison. After Figure 7.
Preprints 184447 g009
For the decay chain 238U-230Th-226Ra, the change in α i with position in a 1D melt column for each isotope can be expressed by the following equations:
d α 0 d ζ = λ 0 τ 0 α 0
d α 1 d ζ = λ 1 ( τ 0 α 0 τ 1 α 1 )
d α 2 d ζ = λ 2 ( τ 1 α 1 τ 2 α 2 )
where ζ is the dimensionless distance (z/d) along a column of length d, λ i are the decay constants, and τ i = d / ω e f f i is the effective transport time of an element along a column of length d where the effective velocity ω e f f   i   is:
ω e f f i = ρ f ω + ρ s 1 D i W ρ f + ρ s 1 D i
where ρ f and ρ s are the melt and solid densities, respectively, ϕ is the porosity, ω is the melt velocity, W is the solid mantle upwelling velocity, and D i is the bulk mineral/melt partition coefficient of element i .
For a one-dimensional steady-state melting column, the average melt velocity is:
ω = Γ d ρ f
where Γ is the melting rate, which is assumed to be constant in the analytical approximation of Sims et al. (1999), and can be determined using the equation:
Γ = W ρ s F m a x d
where F m a x is the maximum degree of melting at the top of the melt column. Note that if element i is highly incompatible ( D i << 1), the effective velocity ( ω e f f   i ) approaches the melt velocity ( ω ). Furthermore, the difference in effective velocities between elements with different bulk partition coefficients decreases as the porosity increases.
Equations 24-26 comprise a coupled system of differential equations, where the decay of the parent isotope increases the concentration of its daughter isotope as the melt migrates through the column chromatographically, resulting in an enrichment ( α i ) of that daughter isotope. If both the melt velocity ( ω ) and porosity () are constant throughout the melt column, this system of equations (24-26) can be solved analytically to determine the enrichment factor α i (Equation 23) of the daughter isotopes due to chromatographic porous flow [19]. In this approach, the constant porosity is a local liquid-filled fraction defined with reference to melt migration and not by the overall melt fraction, which starts at zero at the solidus and increases linearly along the melt column.
Solving Equations 24-26, Sims et al. [19] obtained the following (where the subscripts 0, 1, and 2 refer to 238U, 230Th, and 226Ra, respectively):
α 0 ζ = α 0 0 e λ 0 τ 0 ζ
α 1 ζ = λ 1 τ 0 α 0 0 λ 1 τ 1 λ 0 τ 0 e λ 0 τ 0 ζ + α 1 0 λ 1 τ 0 α 0 0 λ 1 τ 1 λ 0 τ 0 e λ 1 τ 1 ζ
α 2 ζ = λ 2 λ 1 τ 1 τ 0 α 0 0 ( λ 1 τ 1 λ 0 τ 0 ) ( λ 2 τ 2 λ 0 τ 0 ) e λ 0 τ 0 ζ + λ 2 τ 1 λ 2 τ 2 λ 1 τ 1 α 1 0 λ 1 τ 0 α 0 0 λ 1 τ 1 λ 0 τ 0 e λ 1 τ 1 ζ + α 2 0 λ 2 λ 1 τ 1 τ 0 α 0 0 ( λ 1 τ 1 λ 0 τ 0 ) ( λ 2 τ 2 λ 0 τ 0 ) λ 2 τ 1 λ 2 τ 2 λ 1 τ 1 α 1 0 λ 1 τ 0 α 0 0 λ 1 τ 1 λ 0 τ 0 e λ 2 τ 2 ζ
where α 0 0 , α 1 0 , and α 2 0 are constants of integration. For an initial state of secular equilibrium at the base of the melting column, all α i 0 = 1.
As shown in Sims et al. [19], this analytical solution can be further simplified by realizing that the parent isotopes generally are more compatible than the daughter isotopes (i.e. DU > DTh >> DRa and DU >> DPa) and, thus, over the length of the melt column, the change in the daughter nuclide’s activity, α , is large compared to the change in the parental α (i.e., α U   < α T h   << α R a and α U   << α P a ). As such, one can hold the parental α i  values constant, further reducing Equations 31-32 to:
α 1 ζ = α 1 0 e λ 1 τ 1 ζ + τ 0 τ 1 α 0 1 e λ 1 τ 1 ζ
α 2 ζ = α 2 0 e λ 2 τ 2 ζ + τ 1 τ 2 α 1 1 e λ 2 τ 2 ζ
For fixed bulk partition coefficients, total melt fractions, and melt column lengths, the two analytical solutions above (that is, the full solution in Equations 30-32 versus the approximate analytical solution in Equations 33-34) provide nearly identical results (Figure 9). The reason for this similarity is that the half-lives of 230Th and 226Ra are very different, resulting in λ1τ1 << λ2τ2 (where λτ represents the ratio of the effective transport time with the time required for the concentration of the isotope to decrease by half), thus allowing the 238U-230Th and 230Th-226Ra systems to be treated as if they are decoupled.
The simplest way to use the chromatographic porous flow model with U-series disequilibria to obtain estimates of time-dependent parameters of melting is to use observational constraints to estimate the height of the melt column, the melt production rate, and the mineral/melt partition coefficients, and then to compare empirically measured U-series data with a forward model which calculates the porosity and melting rate. Both numerical and analytical solutions can be used to calculate the U-series activity ratios for the 1D chromatographic porous flow model of Spiegelman and Elliott [12]. These solutions show that (226Ra/230Th) disequilibrium is controlled mostly by the porosity of the melt region (which controls the velocity of the melt relative to the solid) for melting rates under 2x10⁻² kg·m-3·yr-1. In contrast, (230Th/238U) and (231Pa/235U) disequilibria are controlled more strongly by the melting rate, which in turn is related primarily to the solid mantle upwelling rate (Figure 9, Figure 10 and Figure 11) and secondarily to the behavior of the melting lithology (see further discussion below).

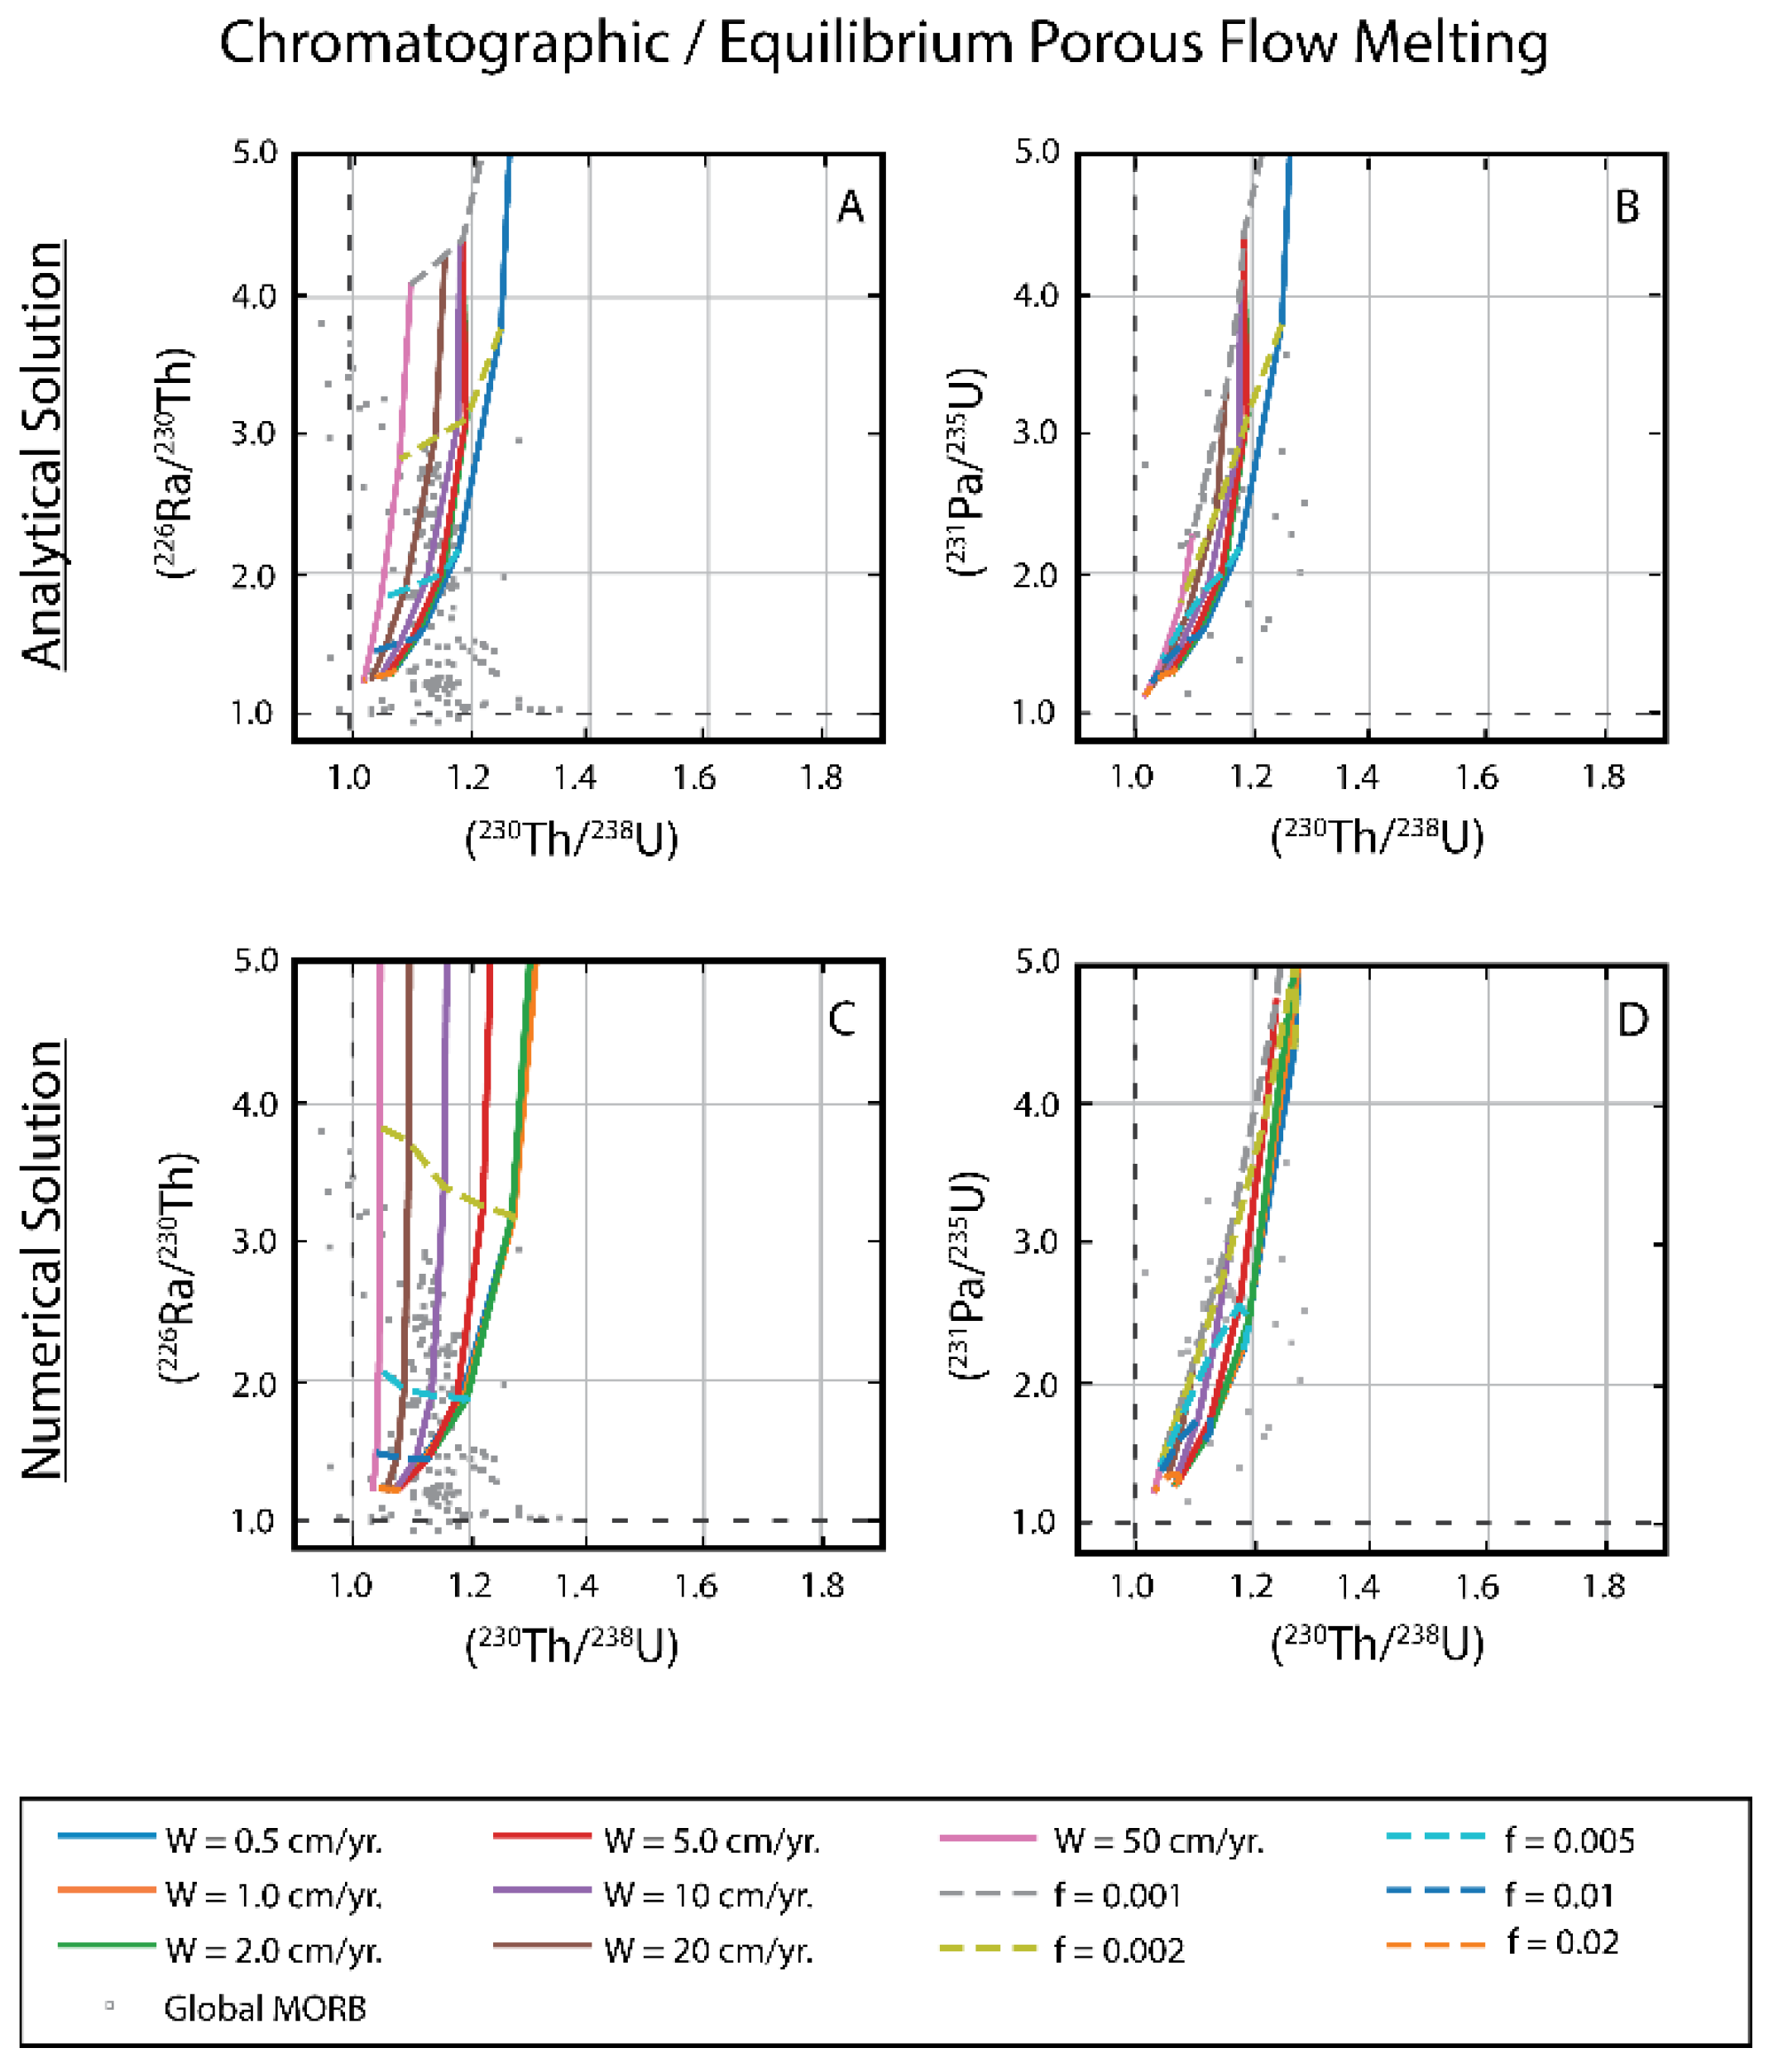
3.1.1. Comparison of Analytical Solutions with the Full Numerical Solution for Chromatographic Porous Flow Melting

Because the full equations for porous flow melting consider a depth-dependent porosity structure using a simplified form of Darcy’s Law [12,55], whereas the analytical solutions assume a constant porosity over the length of the melting column [19], the absolute values of the calculated rate-determinant parameters can be significantly different, contingent on the initial assumptions of the porosity structure of the mantle. By assuming a constant porosity, the analytical solution may overestimate the true porosity, which most strongly influences (226Ra/230Th), while underestimating the solid mantle upwelling velocity, which more significantly influences (230Th/238U). This difference occurs because the full equations take into consideration the details of the porosity distribution and melt velocity along the melt column, whereas the analytical approach treats these as constants (Figure 9).
An alternative approach to analytical solutions that can be computed using relatively simple scripts or spreadsheets is incremental or discretized calculations, which can approximate non-linear solutions to calculate aggregated melt compositions along a melt column. However, incremental calculations introduce compounding errors that can only be avoided by using extremely small step sizes, which rapidly become computationally expensive. To date, some incremental approaches (e.g., [21,22]) have been used to calculate nuclide concentrations directly, but the method can be unwieldy; even small step sizes can sometimes fail to accurately track particularly rapid changes in nuclide concentration.
When variables such as porosity, melting rate, and mineralogically-controlled trace element partitioning are expected to vary dramatically during the melting process, non-linear solutions to porous flow are needed to account for the expected variations in input parameters, and may produce significantly different outcomes in the melt composition (for examples of non-linear changes in input variables, consider for Darcy’s Law flow with compaction [12]; for melt productivity variations predicted by the MELTS family of models for decompressing peridotites, see Asimow [57]; for the partitioning effects from the sudden disappearance of a critical mineral such as garnet, which can significantly fractionate U from Th, see [54,58,59,60,61,62,63]). Hence, the solutions for melt composition by chromatographic porous flow melting in such scenarios are better approximated using iterative numerical routines, rather than simple progressive (Eulerian) time stepping methods that may amplify or compound small errors (e.g., [64]). Because highly incompatible trace element concentrations change very rapidly in some parts of the domain but are more stable in others in response to changes in melt fraction, partial melting models also tend to be very “stiff,” meaning that the dependent variable(s) change(s) extremely rapidly in response to small changes in the independent variable(s) (e.g., [65]). The method for accurately solving stiff equations numerically is to use extremely small step sizes to avoid overshooting the true solution, but this is computationally very expensive and is sometimes so extreme that it is not practical. Adaptive time-stepping routines, which use small step sizes only where changes are large, and implicit methods that solve for the entire melting regime as a continuous solution thus tend to be the most successful computational approaches (e.g., [66]).
Figure 10. Results of reactive porous flow partial melting calculations for an adiabatically decompressing peridotitic mantle at Tp = 1300 ºC showing (226Ra/230Th) and (231Pa/235U) versus (230Th/238U) gridded melting model results for the solid mantle upwelling rates (W) and residual threshold porosity values (f) listed. Model results are shown for (A) equilibrium transport, (B) scaled transport with Da = 0.1, (C) disequilibrium transport with constant bulk solid/melt partition coefficients and melting rates, (D) equilibrium transport, (E) scaled transport with Da = 0.1, and (F) disequilibrium transport with variable bulk solid/melt partition coefficients and melting rates, as described in the text. Global MORB data are shown for comparison. After Figure 7.
Preprints 184447 g010
Spiegelman [55] developed a numerical solution to the equilibrium porous flow melting formulations by Spiegelman & Elliott [12] and produced UserCalc, an open-source, publicly accessible computational tool for conducting calculations from user input parameters. Elkins and Spiegelman [56] built on this prior work by developing an updated, open-source computational tool (pyUserCalc) that reproduces the functionality of UserCalc with added computational methods based on the Appendix of Spiegelman and Elliott [12] to calculate U-series disequilibria produced in partial melts by disequilibrium (fractional) porous flow. Their method also permits near-fractional melting using a scaled reactivity rate, expressed as a Damköhler number (where the Damköhler number is the ratio of a chemical reaction rate – in this case, the mass chemical exchange rate between solid and liquid – to a physical transport rate, here the solid mantle upwelling rate).
Figure 11. Results of reactive porous flow partial melting calculations for an adiabatically decompressing peridotitic mantle at Tp = 1400 ºC showing (226Ra/230Th) and (231Pa/235U) versus (230Th/238U) gridded melting model results for the solid mantle upwelling rates (W) and residual threshold porosity values (f) listed. Model results are shown for a. equilibrium transport, b. scaled transport with Da = 0.1, c. disequilibrium transport with constant bulk solid/melt partition coefficients and melting rates, d. equilibrium transport, e. scaled transport with Da = 0.1, and f. disequilibrium transport with variable bulk solid/melt partition coefficients and melting rates, as described in the text. Global MORB data are shown for comparison. After Figure 7.
Preprints 184447 g011
Recent results for chromatographic melting by equilibrium, disequilibrium, and partial equilibrium reactive porous flow, using a chemical equilibration rate scaled by a Damköhler number, illustrate that partial melting scenarios for an average or depleted mantle peridotite, using experimentally expected mineralogy, thermodynamically predicted melt productivity, and changes in porosity with depth, are unable to generate as large a range in (230Th/238U) as the analytical solution predicts for mid-ocean ridge environments [19,67,68], even for a sufficiently hot mantle to place the peridotite solidus and thus the onset of melting within the garnet peridotite stability field (e.g., a mantle potential temperature (Tp) ≥ 1400 ºC). Specifically, predicted final melt compositions have low (230Th/238U) close to 1.0 for most peridotite melting scenarios. This is partly due to the low initial melt productivities predicted by thermodynamic modeling, such that most or all melting occurs in the spinel stability field at typical mid-ocean ridge mantle temperatures. In chemical equilibrium transport scenarios, signatures from small amounts of melting in the garnet stability field may then be overprinted by subsequent progressive melting that is garnet-free. Higher temperatures hypothesized for hotspot locations produce a broader range of outcomes because of enhanced melting in the presence of residual garnet, but the overall mismatch with analytical solutions is noteworthy, and suggests that minor amounts of other garnet-bearing lithologies may play a role on a global scale (see further discussion of heterogeneous melting effects below) [67,68].
Alternatively, Krein et al. [69] considered partial melting of relatively cold (Tp = 1200 ºC) lherzolitic mantle with stable plagioclase in the shallow melting regime and suggested that it is in fact possible to generate relatively high (230Th/238U) in partial melts, without requiring deep melting in the presence of garnet. While these outcomes are reproducible by multiple melting models, plagioclase is unlikely to be stable in adiabatic regimes except at mid-ocean ridges with rapid spreading rates, where the lithosphere is very thin, suggesting such a scenario cannot fully explain all global basalt compositions, and non-peridotitic source lithologies are still likely necessary in some settings [68].
To better illustrate the model differences explored above, Figure 10 and Figure 11 show a series of outcomes comparing model results for two adiabatic melting scenarios, each considering a lherzolitic mantle undergoing solid decompression along a moderately warm adiabat that crosses the lherzolite solidus. The first scenario considers a moderate Tp of 1300 ºC, for which melting initiates in the spinel peridotite stability field, while the other uses a higher Tp of 1400ºC with a solidus depth and onset of melting within the garnet peridotite stability field. At each potential temperature, the outcomes for constant elemental partition coefficients and a constant melting rate were computed first, to directly compare the simplified analytical approach with more complex numerical solutions that permit changes to porosities with depth and thus variable liquid flow rates. A second set of calculations for variable elemental partitioning and melting rates with depth using only numerical models was then considered, using the methods of Lambart [70], Elkins et al. [67], and Elkins and Lambart [68], where melt fractions with depth are determined using the Melt-PX parameterization developed from high-pressure melting experiments [71] and accompanying solid mineral proportions are computed using the thermodynamic pMELTS model at a given pressure and liquid fraction [72]. The fixed mineral/melt partition coefficients used to determine bulk elemental partitioning for these examples are provided in Table 3.
At Tp = 1300 ºC, the model results in Figure 10 illustrate that regardless of whether input variables are simplified or held constant, very little variation in (230Th/238U) can be achieved by peridotitic melting. For chemical disequilibrium transport (i.e., fractional melting), constant porosity, partitioning, and melting rates overall generate lower (226Ra/230Th) and (231Pa/235U) than full numerical solutions to porous flow melting, but for equilibrium porous flow scenarios there is little difference between the two outcomes at relatively low mantle temperatures. As explained above, more significant differences in outcomes are observed at higher temperatures where Tp = 1400 ºC, with particularly broad ranges in (230Th/238U) for equilibrium melting with constant input parameters, and again particularly low (226Ra/230Th) and (231Pa/235U) during disequilibrium transport with constant inputs (Figure 11).

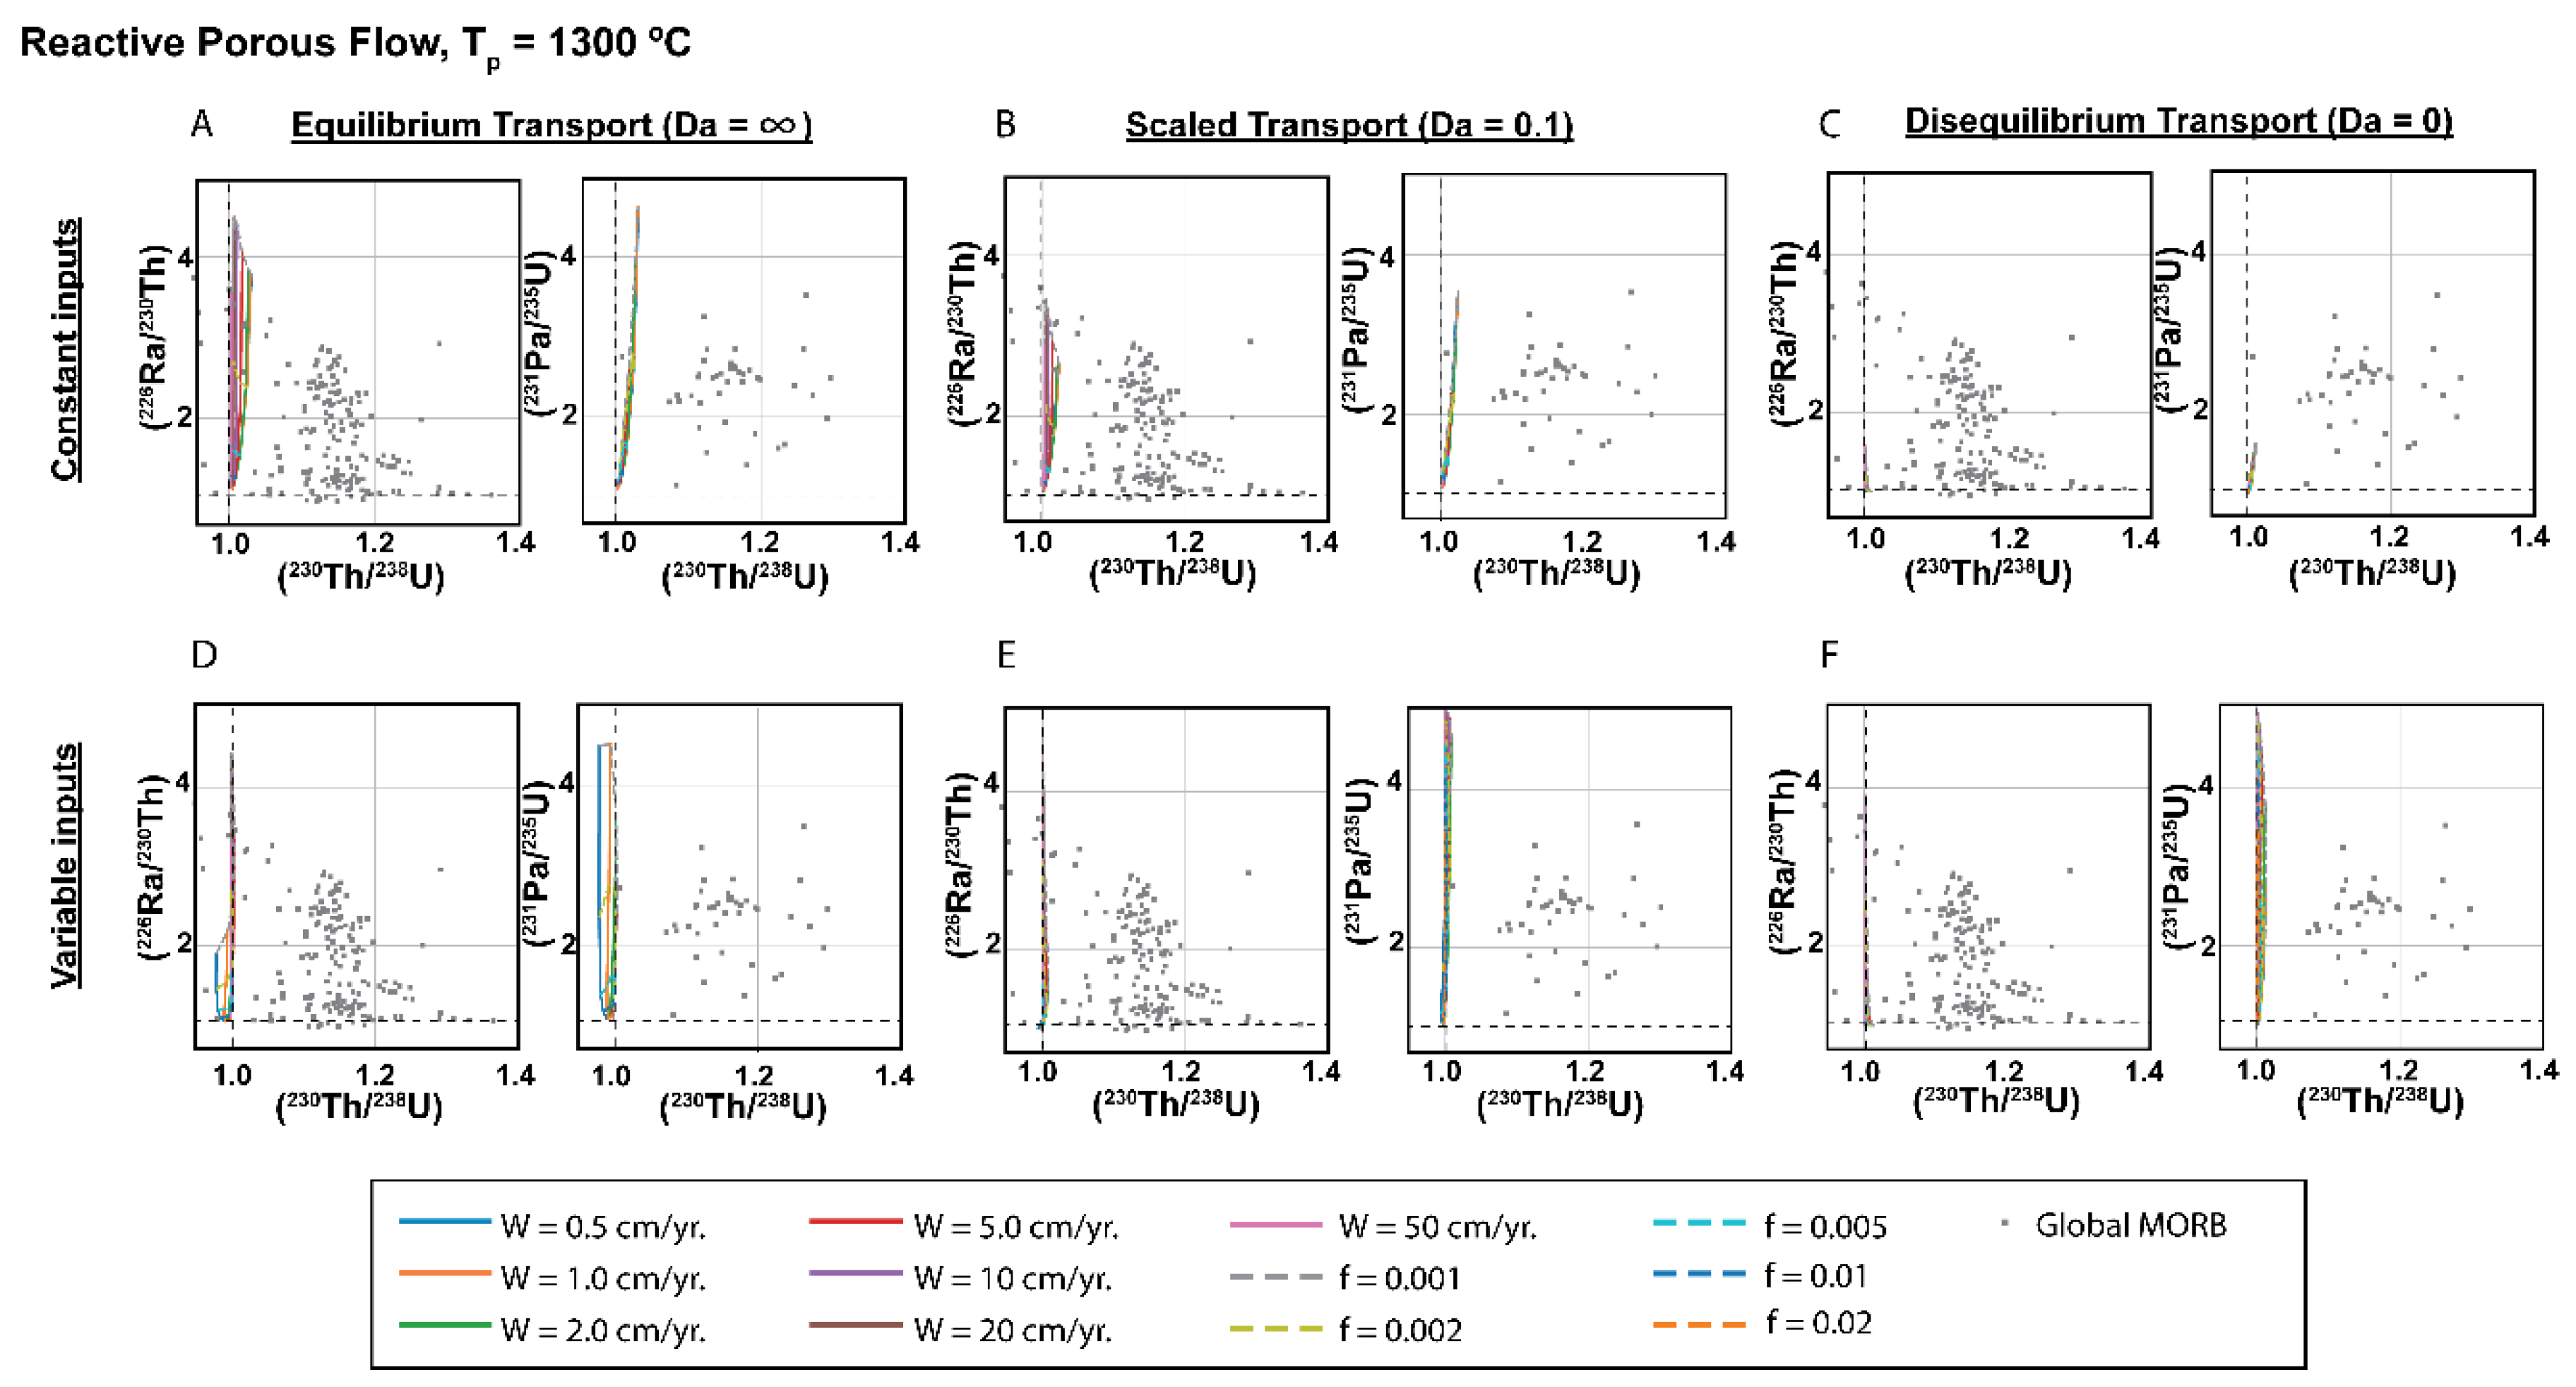
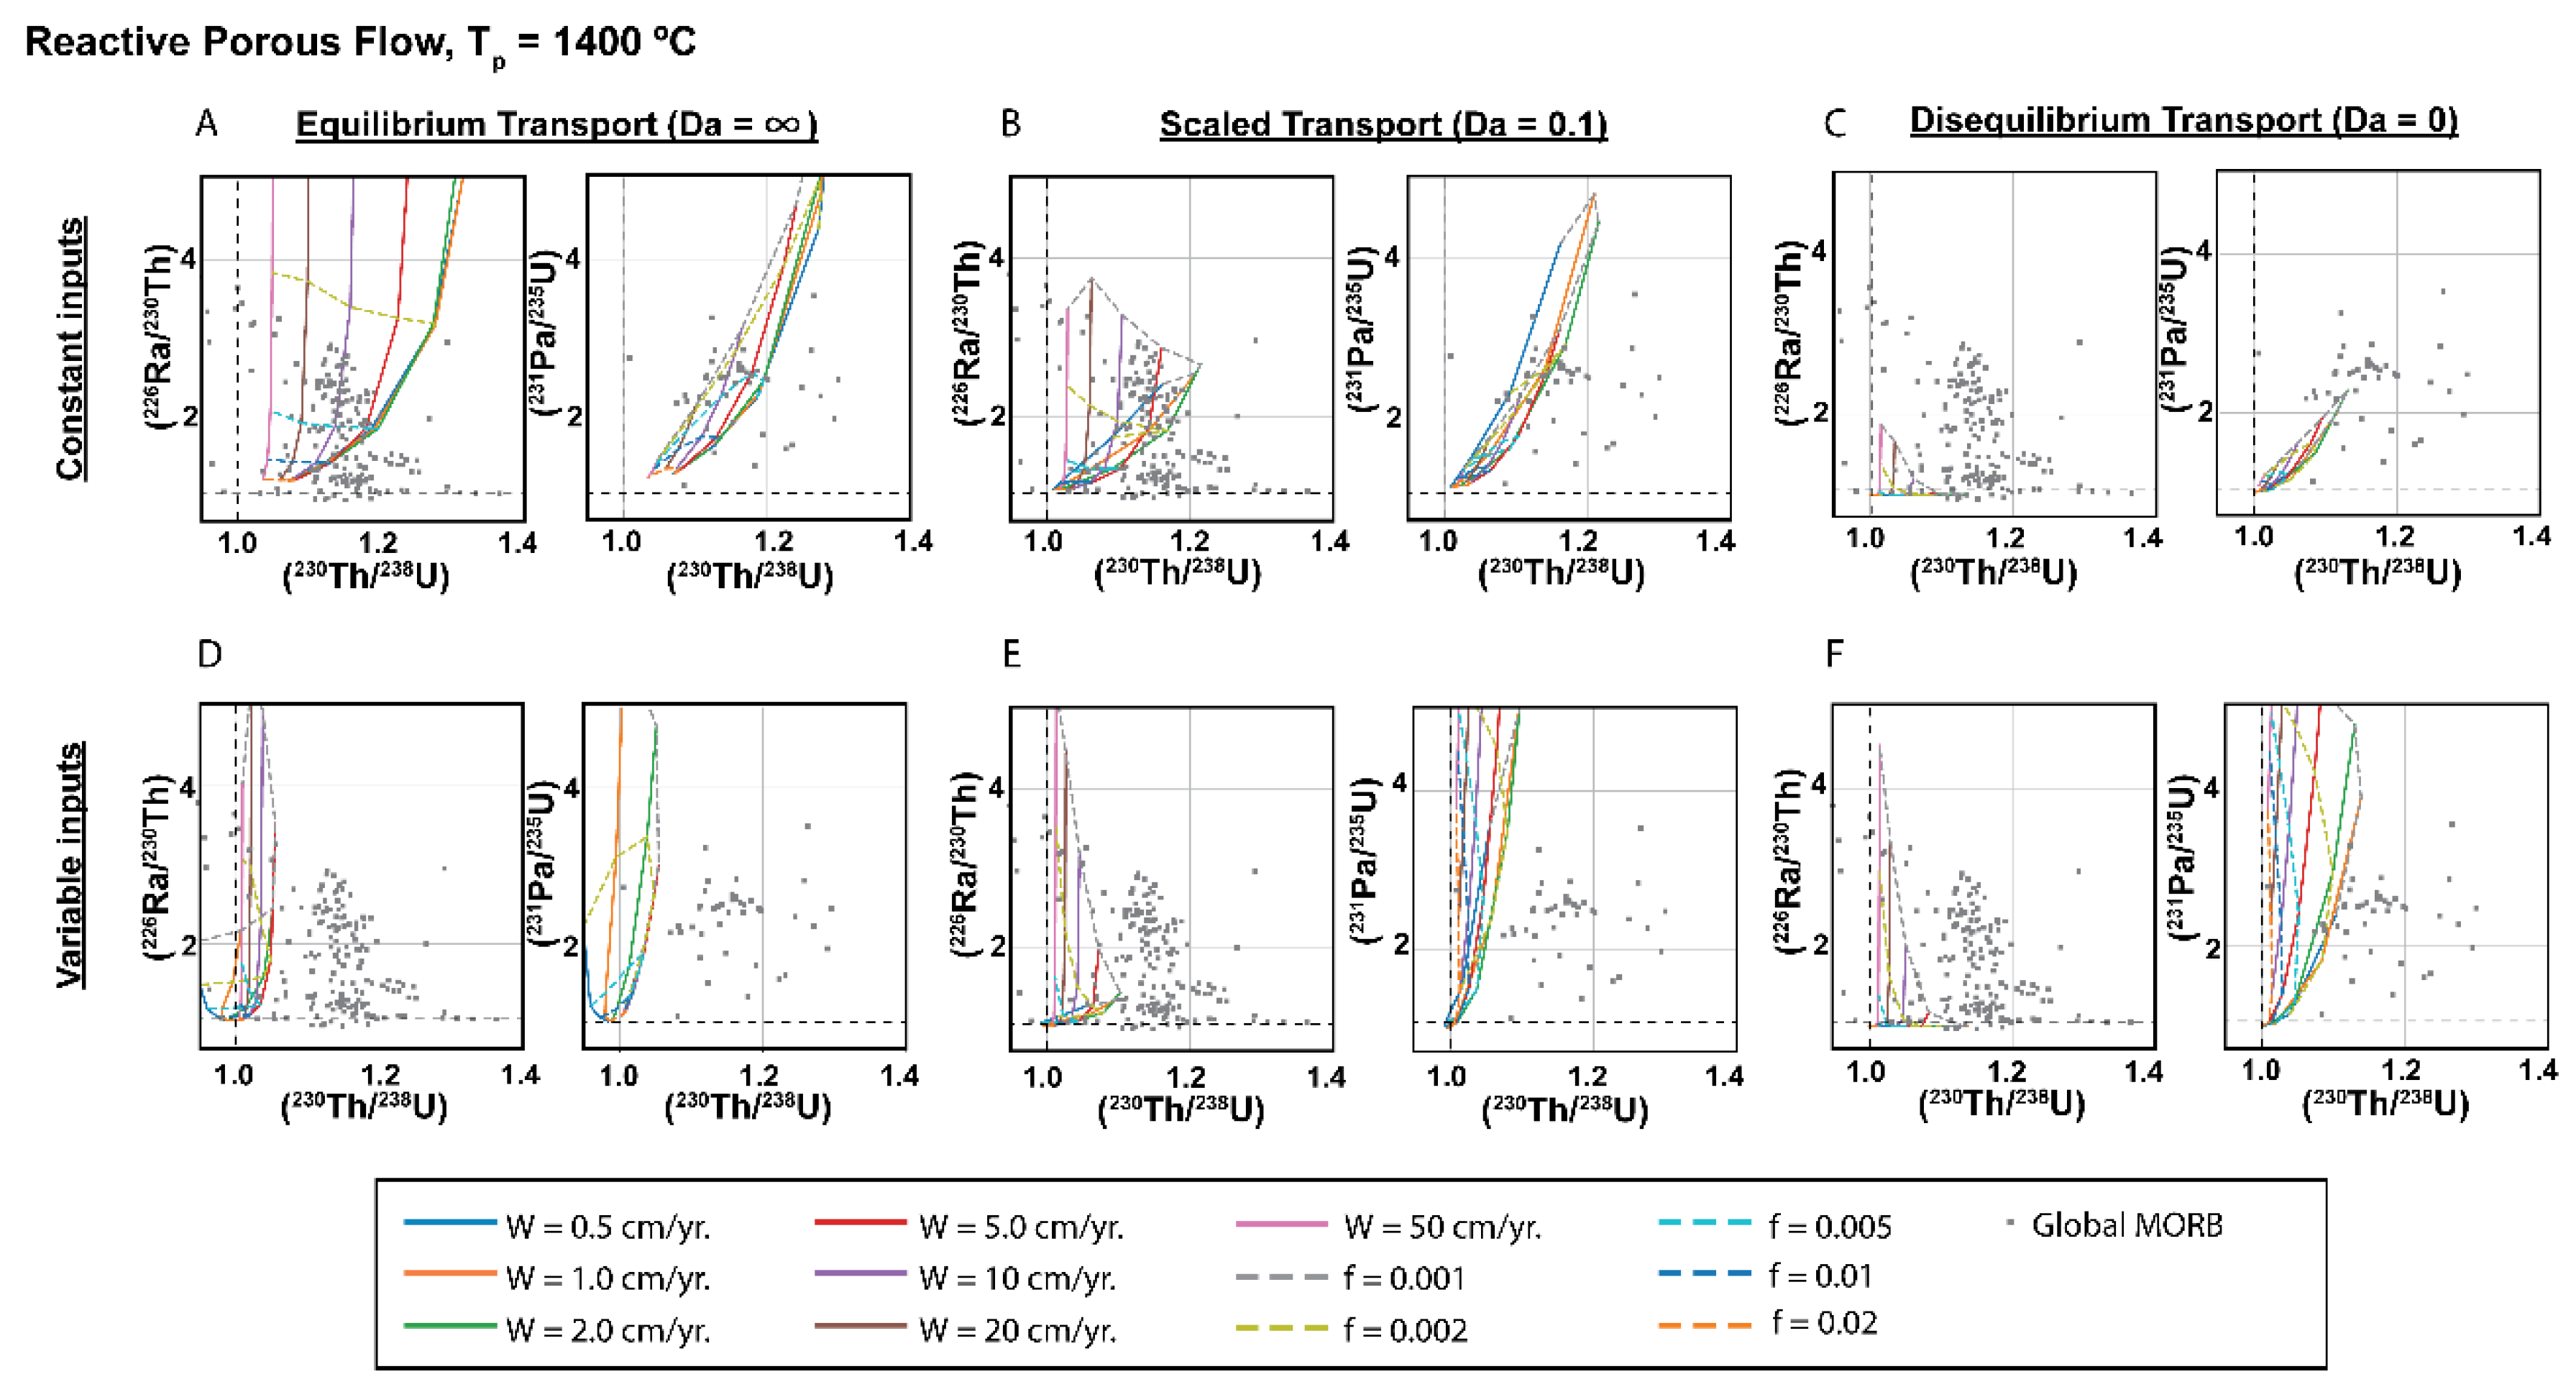
3.4. Dynamic versus Chromatographic Melting: Comparison of the Two Types of Time-Dependent Models

Dynamic melting models provide results that are similar in some ways to those obtained from the chromatographic porous flow melting model in that the extent of (226Ra/230Th) disequilibrium is controlled mainly by the porosity of the melt region, and (230Th/238U) and (231Pa/235U) disequilibria are controlled mainly by the melting rate (Figure 8). In all cases, the values of these parameters are controlled by the bulk partition coefficients (Di) used for the elements U, Th, Ra, and Pa, which in turn depend on residual mineralogy, which changes with pressure in the mantle.
In the traditional formulation of McKenzie [14], dynamic melting differs from chromatographic melting in that the produced melts are assumed to move instantly to the surface as they form and, consequently, they do not react with the solid during transport or experience further radioactive decay after extraction. Because most of the incompatible trace elements, including uranium, are extracted in the earliest stages of partial melting, disequilibria are dominantly created at the base of the melt column instead of throughout the entire length of the melt column, as occurs during chromatographic melting. Unlike chromatographic porous flow, where melt velocities are determined explicitly, with dynamic melting, melt velocities are only constrained by the need to preserve the shortest half-life of the nuclide in radioactive disequilibrium with its immediate parent. Generally, the half-life of 226Ra is used in this context. A few studies have argued that observed 210Pb excesses place even shorter limits on the timescale of melt extraction, requiring more rapid melt ascent velocities. However, as discussed below (210Pb/226Ra) fractionation is probably produced by 222Rn accumulation or depletion (e.g. [46,81]).
Table 3. Default mineral/melt partition coefficients (Di) used to calculate bulk rock partition coefficients in model calculations for this study. Modified from Elkins and Lambart [68].
Lithology Phase DU DTh DPa * DRa * Reference
Garnet Peridotite Garnet 0.038 0.017 0.00001 0.00001 RD 1097-5 experiment, [73]
KG1 Pyroxenite Clinopyroxene 0.0030 0.0040 0.00001 0.00001 RD 1097-5 experiment, [73]
Olivine 0.00005 0.00047 0.00001 0.00001 RD 1097-5 experiment, [73]
Orthopyroxene 0.0078 0.0086 0.00001 0.00001 TM0500-3 experiment, [73]
Pigeonite 0.00050 0.00018 0.00001 0.00001 W&P 122-1 experiment, [74]
Spinel 0.012 0.0024 0.00001 0.00001 Lunar basalt, [75]
Spinel Peridotite Cpx 0.0080 0.0070 0.00001 0.00001 TM 1094-9 experiment, [76]
Olivine 0.00005 0.00047 0.00001 0.00001 RD 1097-5 experiment, [73]
Orthopyroxene 0.0024 0.0027 0.00001 0.00001 RD 1097-2 experiment, [73]
Plagioclase 0.0006 0.0034 0.00001 0.02000 DU, DTh calculated after [54]; DRa from [77]
Pigeonite 0.0005 0.00018 0.00001 0.00001 W&P 122-1 experiment, [74]
Spinel 0.012 0.0024 0.00001 0.00001 Lunar basalt, [75]
G2 Pyroxenite Garnet 0.02405 0.00415 0.00001 0.00001 A343 experiment, [78]
Clinopyroxene 0.0041 0.0032 0.00001 0.00001 A343 experiment, [78]
Olivine 0.00005 0.00047 0.00001 0.00001 RD 1097-5 experiment, [73]
Orthopyroxene 0.0078 0.0086 0.00001 0.00001 TM0500-3 experiment, [73]
Plagioclase 0.0006 0.0034 0.00001 0.02000 DU, DTh calculated after [54]; DRa from [77]
Pigeonite 0.0096 0.010 0.00001 0.00001 Experiment 18, [79]
Spinel 0.046 0.016 0.00001 0.00001 Maximum measured, [80]
MIX1G, m7-16 Garnet 0.013 0.0032 0.00001 0.00001 Experimental results, [80]
Pyroxenite Clinopyroxene 0.017 0.015 0.00001 0.00001 Experimental results, [80]
Olivine 0.00005 0.00047 0.00001 0.00001 RD 1097-5 experiment, [73]
Spinel 0.046 0.016 0.00001 0.00001 Maximum measured, [80]
Orthopyroxene 0.0078 0.0086 0.00001 0.00001 TM0500-3 experiment, [73]
Plagioclase 0.0006 0.0034 0.00001 0.02000 DU, DTh calculated after [54]; DRa from [77]
Pigeonite 0.0096 0.010 0.00001 0.00001 Experiment 18, [79]
* By convention, DPa and DRa are set equal to very small values (1 x 10⁻⁵) for most mantle minerals, except DRa in plagioclase.
In other words, in traditional dynamic melting [14], the timescale of melt migration is not explicitly determined or considered. Therefore, for a given set of partition coefficients, the dynamic melting model requires threshold or escape porosities that are lower than the maximum porosity at the top of the melt zone predicted by a chromatographic melting model. With dynamic melting, the inferred melting rates are also slightly lower. This stems from the shorter residence time of the parent nuclide in the melting column obtained with dynamic melting for a given melting rate. To achieve the same residence time for the parent nuclide (i.e. same time for in-growth of the daughter nuclide), the melting rate must be slower. To place quantitative constraints on magma extraction rates, later formulations for dynamic melting, such as the incremental model of Stracke et al. [22], explicitly calculated the outcomes of different ascent velocities for extracted magmas and then compared the model predictions to actual data.
In the dynamic melting formulations of McKenzie [14], the liquid trapped in pore spaces below the critical or threshold porosity is also assumed to reach chemical equilibrium with the solid residue, regardless of the time elapsed, while any melt fraction beyond the threshold porosity is extracted instantaneously and does not react with solids in the rest of the melting column. Beyond the critical threshold porosity, the porosity is assumed to be constant throughout the melting zone. The model thus makes two simultaneous but opposing assumptions about melt-rock chemical equilibration and magma extraction, while neglecting compaction effects on fluid velocity. While this formulation produces partial melts with incompatible element enrichments that are intermediate between equilibrium and accumulated fractional melts [11,47], and the extraction rates of incompatible elements are partly controlled by the porosity, mechanistically the underlying assumptions about chemical equilibration and transport do not effectively simulate significant aspects of the chemical behavior of a system experiencing coupled two-phase (solid and liquid) flow.
In comparison, porous flow models [12] may range from equilibrium porous flow, which has an infinite Damköhler number (i.e., melt-solid reaction is very fast relative to melt migration velocities) to scaled porous flow with a moderate Damköhler number (which calculate a continuous rate-limited or incomplete chemical exchange between solid and liquid) to a “zero-Damköhler number” model, i.e. truly time-dependent fractional melting where no chemical exchange beyond initial melting occurs because of the comparatively rapid magma transport rate [56]. The dynamic melting formulations with threshold equilibrium porosities are closest to the moderate Damköhler number scenario, but computed outcomes between the two are distinct [68].
For a full comparison with the chromatographic modeling results explored above, we here present equivalent results for adiabatic decompression partial melting of a mantle lherzolite, using both a simplified analytical solution (after [47]) and numerical modeling outcomes for dynamic melting (after [18,68,82,83]; Figure 8). The outcomes of the numerical approach are comparable to those for incremental models with very small step sizes [21,22,68]. Consistent with prior results, it is observed that dynamic melting outcomes in Figure 8 generally produce higher (230Th/238U) in partial melts for a given garnet peridotite melting scenario than the disequilibrium or scaled equilibrium porous flow models in Figure 8, particularly for higher Tp = 1400 ºC with stable residual garnet. This outcome likely occurs because 1) the initial dynamic melting fraction below the critical threshold reaches perfect chemical equilibrium, 2) progressive melting in the spinel stability field has even less of an overprinting effect during dynamic melting, and 3) the porosity is fixed throughout the melt regime, which affects magma transport rates [67,68,83]. Because of the simplified mechanisms assumed for chemical equilibration in the dynamic melting formulation, however, we suggest that the disequilibrium porous flow transport model results shown in Figure 10 and Figure 11 are more realistic in simulating the outcomes of magma generation with rapid magma transport and restricted or limited chemical exchange, even though the more restricted range of 238U-230Th outcomes produced by the porous flow models place more stringent constraints on the process of mantle peridotite melting.
Finally, despite the observed differences in melting outcomes between the analytical and numerical approaches to both chromatographic and dynamic melting, differences which may be important in some geologic settings, the simplified approaches that permit analytical solutions may also be particularly useful for placing additional constraints on the melting regime. This is because analytical formulas are amenable to inverse modeling methods, where observed lava compositions are used to directly calculate the required starting conditions, rather than comparing systematic sets of model predictions to data sets using sensitivity analyses for specific variables such as mantle upwelling rate (W), residual porosity (ϕ), or degree of melting (F). The inverse method is similar to approaches such as those of Sims et al. [20] who estimated bulk mineral/melt partition coefficients for U-series nuclides by inverting simplified model formulas that assume constant melting rates and partitioning behavior. Because the chromatographic model considers the timescale of melt migration and the analytical solution assumes a constant porosity, the velocity of the melt can in fact be determined explicitly (Equation 28). With a numerical approach to chromatographic melting, on the other hand, melt velocity varies as a function of the porosity distribution of the melt column and thus cannot be directly determined from the final melt compositions. In the latter case, it is instead more useful to calculate melt transport times by integrating the melt velocity over the length of the melt column.

3.5. Sources of Uncertainty in Melting Models

There are four main sources of uncertainty in the interpretation of U-series measurements for modeling melting processes, namely: 1) modification of lava compositions by post-eruptive contamination; 2) uncertainties in sample ages and magma storage times; 3) uncertainties in measured U, Th, Pa, and Ra partition coefficients; and 4) unknown modification of magma compositions by assimilation, particularly lithospheric melt-rock-brine reactions.

3.5.1. Uncertainties Introduced by the Modification of Lava Compositions by Post-eruptive Contamination

Secondary alteration or post-eruptive contamination has the potential to significantly fractionate parent-daughter nuclide pairs and perturb U-series. Contamination can be particularly problematic in submarine lavas as ocean waters contain relatively high concentrations of U [6] due to uranium’s high solubility as a hexavalent cation in ocean waters. However, seawater alteration of submarine basalts is reasonably easy to discern because the (234U/238U) in ocean waters ubiquitously is 1.14 owing to uranium’s long residence time [84,85,86,87]. Thus, any basalt that has been altered by seawater will have (234U/238U) greater than unity (Figure 12). The threshold of what the petrological community considers a tolerable excess of 234U as an indication of the absence of alteration has changed considerably over time with the improved ability to measure abundance sensitivity given that down mass tailing of 235U on 234U can increase the measured (234U/238U). Hence, it remains uncertain whether (a) many of the studies showing 234U excesses in Figure 12 are an indication of imprecise (234U/238U) measurements and are viably interpretable in terms of petrological processes, or (b) if those samples have been altered and should be excluded from petrological modeling. A classic example of how even minor 234U excesses can indicate perturbation of (230Th/238U) in depleted basalts via alteration is the Kolbeinsey ridge (Figure 13) where there is a clear correlation between (230Th/238U) and (234U/238U) [43].
Because of the long half-life of 234U (t1/2 = 245 kyr), for young subaerial samples, (234U/238U) of one is a necessary but insufficient condition for ruling out secondary alteration. In this case, other indices such as K2O/P2O5 >1 can be used to indicate the presence or absence of chemical alteration.

3.5.2. Uncertainties in Sample Ages and Magma Storage Times

Because of the relatively short half-lives of the U-series daughter isotopes, as samples age either on the surface or during magma storage, the parent/daughter activity ratios will decay toward their equilibrium values. If the sample age is old and unknown, or if the magma storage interval is significant and not accounted for, one would infer parent/daughter fractionations during the melting process that are too small. Therefore, it is important to explicitly know a sample’s age, and to have some geologic constraints on magma storage time when evaluating melting processes using U-series disequilibria. This issue is especially significant for 226Ra, which has a short half-life (1,600 ± 7 yr) relative to the expected timescales of melting, melt migration, and magma storage processes; and, since 226Ra in partial melts is largely controlled by the porosity of the melt zone, uncertainties in sample ages and magma storage times translate into large uncertainties in the calculated porosity. However, because of the differences in 226Ra, 230Th, and 231Pa half-lives, if a lava sample has a primary (that is, melting-derived) 226Ra excess relative to 230Th, any age effects are small enough to be inconsequential for measured 238U-230Th or 235U-231Pa disequilibria. Similarly, if a sample has a 210Pb (t½ = 22.6 ± 0.1 yr) excess or deficit relative to 226Ra, then age affects are not likely to be an issue for 230Th, 231Pa, or 226Ra.
Figure 12. 234U/238U and 230Th/238U for the global MORB data set (Figure 7) showing the range of uncertainty. Note that many samples show 234U/238U indicative of seawater contamination.
Preprints 184447 g012
An important nuclide that could be used to address uncertainties associated with sample age is 227Ac, a daughter product of 231Pa with a half-life of 21.77 yr, similar to 210Pb. Unlike 210Pb, which has intermediate volatile species such as 222Rn in the 226Ra-210Pb decay scheme, which could be affected by gas exsolution and either loss or accumulation in the magma (Figure 2), 227Ac is a direct decay product of 231Pa and is not volatile. However, because of the difficult analytical methods required to measure 227Ac [88], only a few studies [37,89,90] have reported 231Pa-227Ac disequilibria in erupted magmas that were age-constrained (i.e., zero age at the time of collection), and, so far, all analyzed magmas have (227Ac/231Pa) of unity, suggesting that either i) the timescale of magma transport and storage is at least 100 years or ii) there was no initial fractionation of (227Ac/231Pa).

3.5.3. Uncertainties in Measured U, Th, Ra Partition Coefficients

Porosities and melting rates inferred from partial melting predictions using both chromatographic and dynamic melting models are highly dependent on the absolute and relative values chosen for the bulk mineral/melt U, Th, Pa, and Ra partition coefficients (Supplemental Table 1). The period of time during which the parent element resides in the melt column is critical to the outcomes of time-dependent ingrowth models; therefore, these models are especially sensitive to the Di values chosen for the parent elements U and Th. For the combined 238U-230Th-226Ra disequilibria, the value chosen for DTh is also particularly important, as 230Th is both a parent and daughter isotope and therefore its D value affects both (230Th/238U) and (226Ra/230Th) disequilibria. For example, with the chromatographic equilibrium porous flow model, decreasing the value of DTh by a factor of 3 (while holding DU and DRa constant) changes the reference porosity required to achieve a given combination of (230Th/238U) and (226Ra/230Th) by up to a factor of 3 for low melting rates, and by an order of magnitude for high melting rates (e.g., [19]).
Figure 13. Uranium isotope calculated mixing line between seawater [(234U/238U) = 1.14] and unaltered local Kolbeinsey melt composition. This correlation based on high-precision mass spectrometric analyses demonstrates the need to have (234U/238U) in equilibrium within the uncertainty of modern mass spectrometric measurements.
Preprints 184447 g013
The bulk melt-rock partitioning behavior of U, Th, Ra, and Pa during melting may primarily be controlled by the presence and modes of some of the major mantle mineral phases (i.e., olivine, pyroxene, and garnet), and thus by both the lithology and bulk composition of the source rock and by the pressure and temperature of melting (e.g., [54], and references therein). Clinopyroxene and garnet typically host the highest concentrations of U and Th in peridotitic rocks (e.g., [54], and references therein), and specific mineral/melt partition coefficients in turn depend on the chemical compositions of these minerals, particularly their octahedral site radii, which are controlled by bulk rock composition and temperature and pressure conditions (e.g., [80]). A compilation of experimentally determined DU and DTh values in typical mantle minerals illustrates that estimated partition coefficients can vary by an order of magnitude due to experimental methods, measurement uncertainty, and differences in mineral composition and pressure (see Table 3 and references therein). Such large variations in clinopyroxene and garnet DU and DTh in turn can produce large variations in model outcomes (e.g., [19,43]), and, therefore, also in the calculated or inferred porosities and melting rates for both chromatographic and dynamic melting models (Figure 8, Figure 9, Figure 10 and Figure 11).
An additional uncertainty is the role of grain boundaries as an important repository for highly incompatible elements (e.g., [91,92,93]). These could play a role similar to that of retained melt, increasing bulk distribution coefficients and thus influencing estimates of porosity and transport rates required to produce a given set of disequilibria. At equilibrium, grain boundaries in mantle peridotites could contain on the order of 10,000 times higher concentrations of Th, and 50,000 times more U, than the crystalline minerals ([93], Figure 2 and accompanying text). For typical peridotites with a grain size of 1 to 0.1 mm and grain boundary widths ~ 1 nm, assuming cubic grains, grain boundaries could comprise ~ 0.6 to 6 ppmv (perhaps 0.5 to 5 ppmw) of the rock, with a melt/(grain boundary) distribution coefficient ~ 104 higher than distribution coefficients for the crystalline minerals, increasing bulk distribution coefficient values by ~ 0.005 to 0.05.
As a result of the relatively high sensitivity of model outcomes to comparatively small changes in partitioning behavior, solid mantle upwelling rates and porosities can only be estimated from measured (230Th/238U), (226Ra/230Th), and (231Pa/235U) disequilibria (e.g., [19]). That said, while the implied uncertainty in model outcomes means that precise upwelling rates and reference porosities cannot be inferred quantitatively from time-dependent melting models, sensitivity analyses of the impacts of varying the upwelling rate and reference porosity on (230Th/238U), (226Ra/230Th), and (231Pa/235U) consistently produce qualitatively and even quantitatively different outcomes for distinct melting scenarios, making it possible nevertheless to reliably interpret the results of melting models (e.g., [68]).

3.5.4. Modification of Magma Compositions by Assimilation

Magmas that pool in or flow through a partially crystalline reservoir with continuous or episodic recharge may also assimilate or undergo chemical exchange and reaction with crystallized material from prior magma injection episodes (e.g., [94,95]). Continuous mineral precipitation and dissolution, as well as chemical or diffusive exchange are very complex to model accurately due to the open nature of the system and lack of necessary constraints on the minerals present or the timing of magma recharge; however, such scenarios could potentially impact or modify quite significantly U-series disequilibria (e.g., [96,97]). For example, continuous and ongoing chemical exchange between a specific group of minerals and a surrounding magma could modify or buffer the disequilibrium between a parent-daughter isotope pair, making it more difficult to draw unique conclusions about magmatic age and storage times or mineralogy, and potentially obscuring the underlying melting signal (e.g., [97]). However, other evidence for melt-rock interactions and mineral-liquid exchange can help to constrain potential model scenarios. For example, while (226Ra/230Th) and (230Th/238U) can be modelled in isolation, constraints derived from other evidence for cumulate mineral-liquid exchange limit potential model scenarios when other trace elements are considered. Similarly, 210Pb excesses could be modelled by preferential melt-cumulate rock exchange by diffusive processes involving plagioclase or sulfide minerals, as Pb is expected to behave more compatibly than Ra in both plagioclase and sulfide minerals, but again this particular scenario would be expected to result in correlations between geochemical indices of plagioclase or sulfide melting and (210Pb/226Ra) disequilibria and are generally not observed [46].

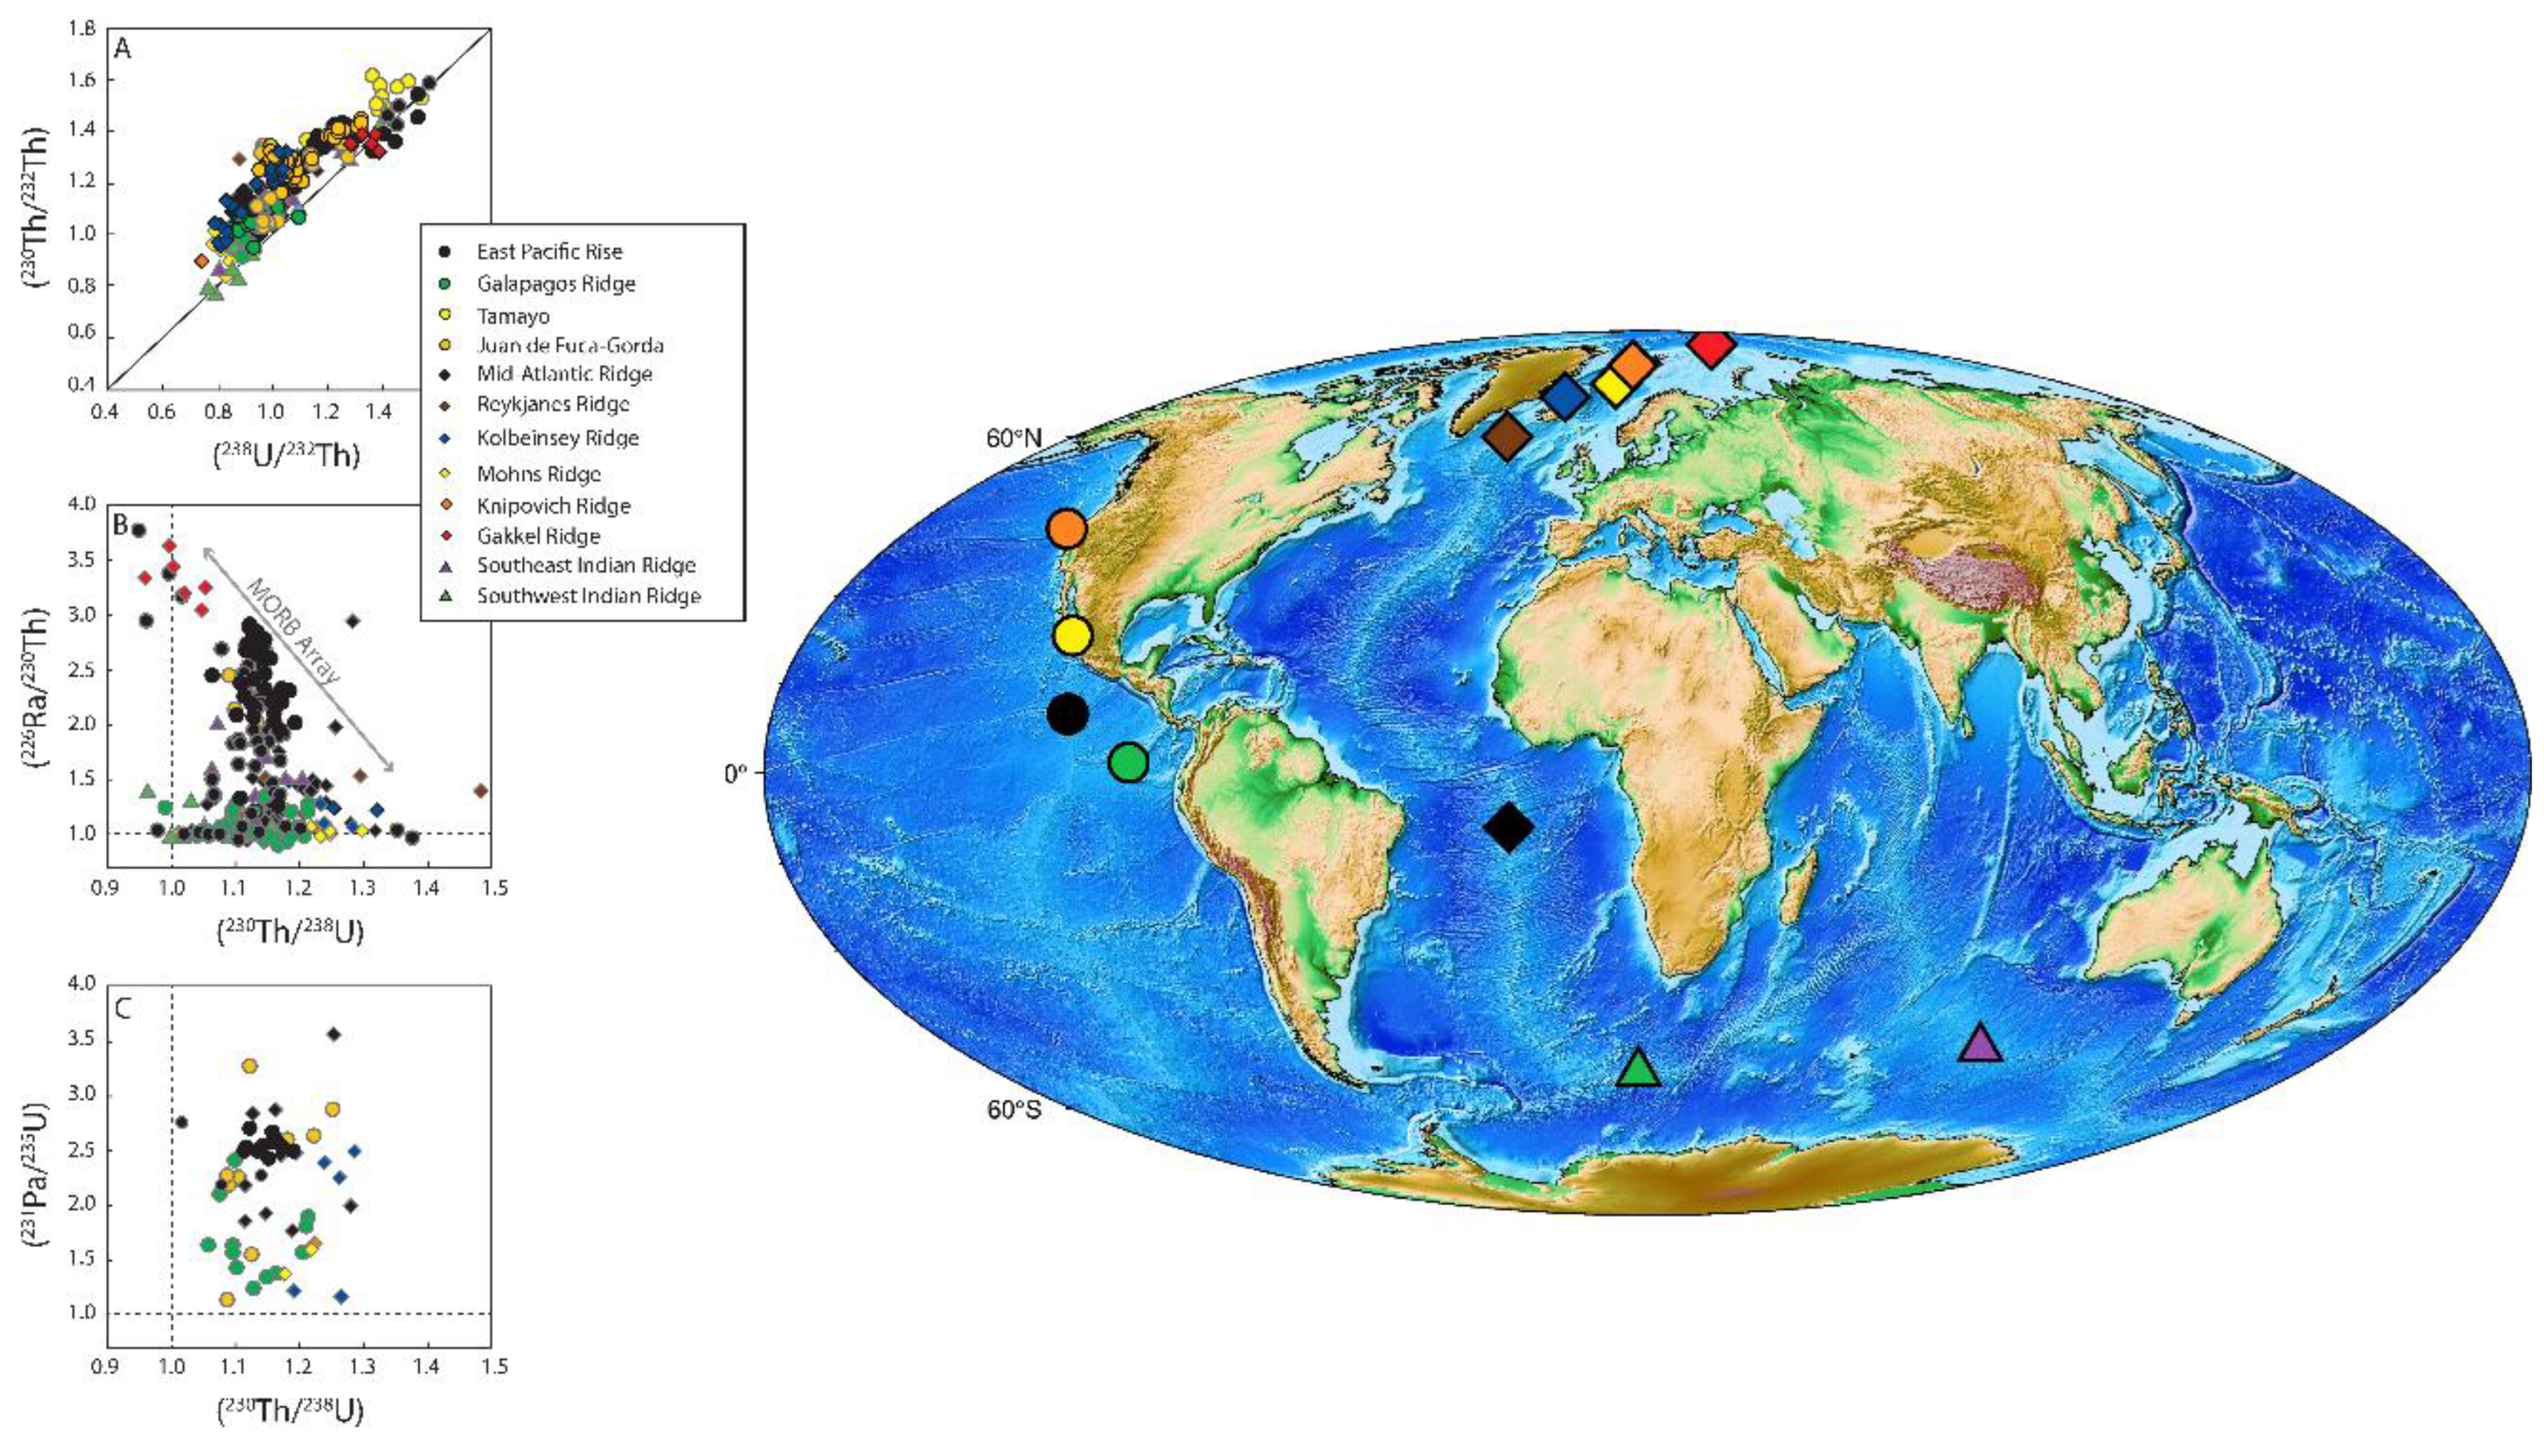
3.6. Mid-Ocean Ridge Basalts (MORB)

238U-230Th-226Ra and 235U-231Pa disequilibria have been measured in MORB sample suites by high-precision mass spectrometric methods across the full range of ocean ridge spreading rates from fast to ultraslow (Figure 7), radically transforming our understanding of MORB petrogenesis. The following discusses a few important observations drawn from individual regional and case studies for mid-ocean ridge settings and presents an updated model for global MORB genesis with broader implications for the dynamics of mantle melt generation and oceanic crustal construction.

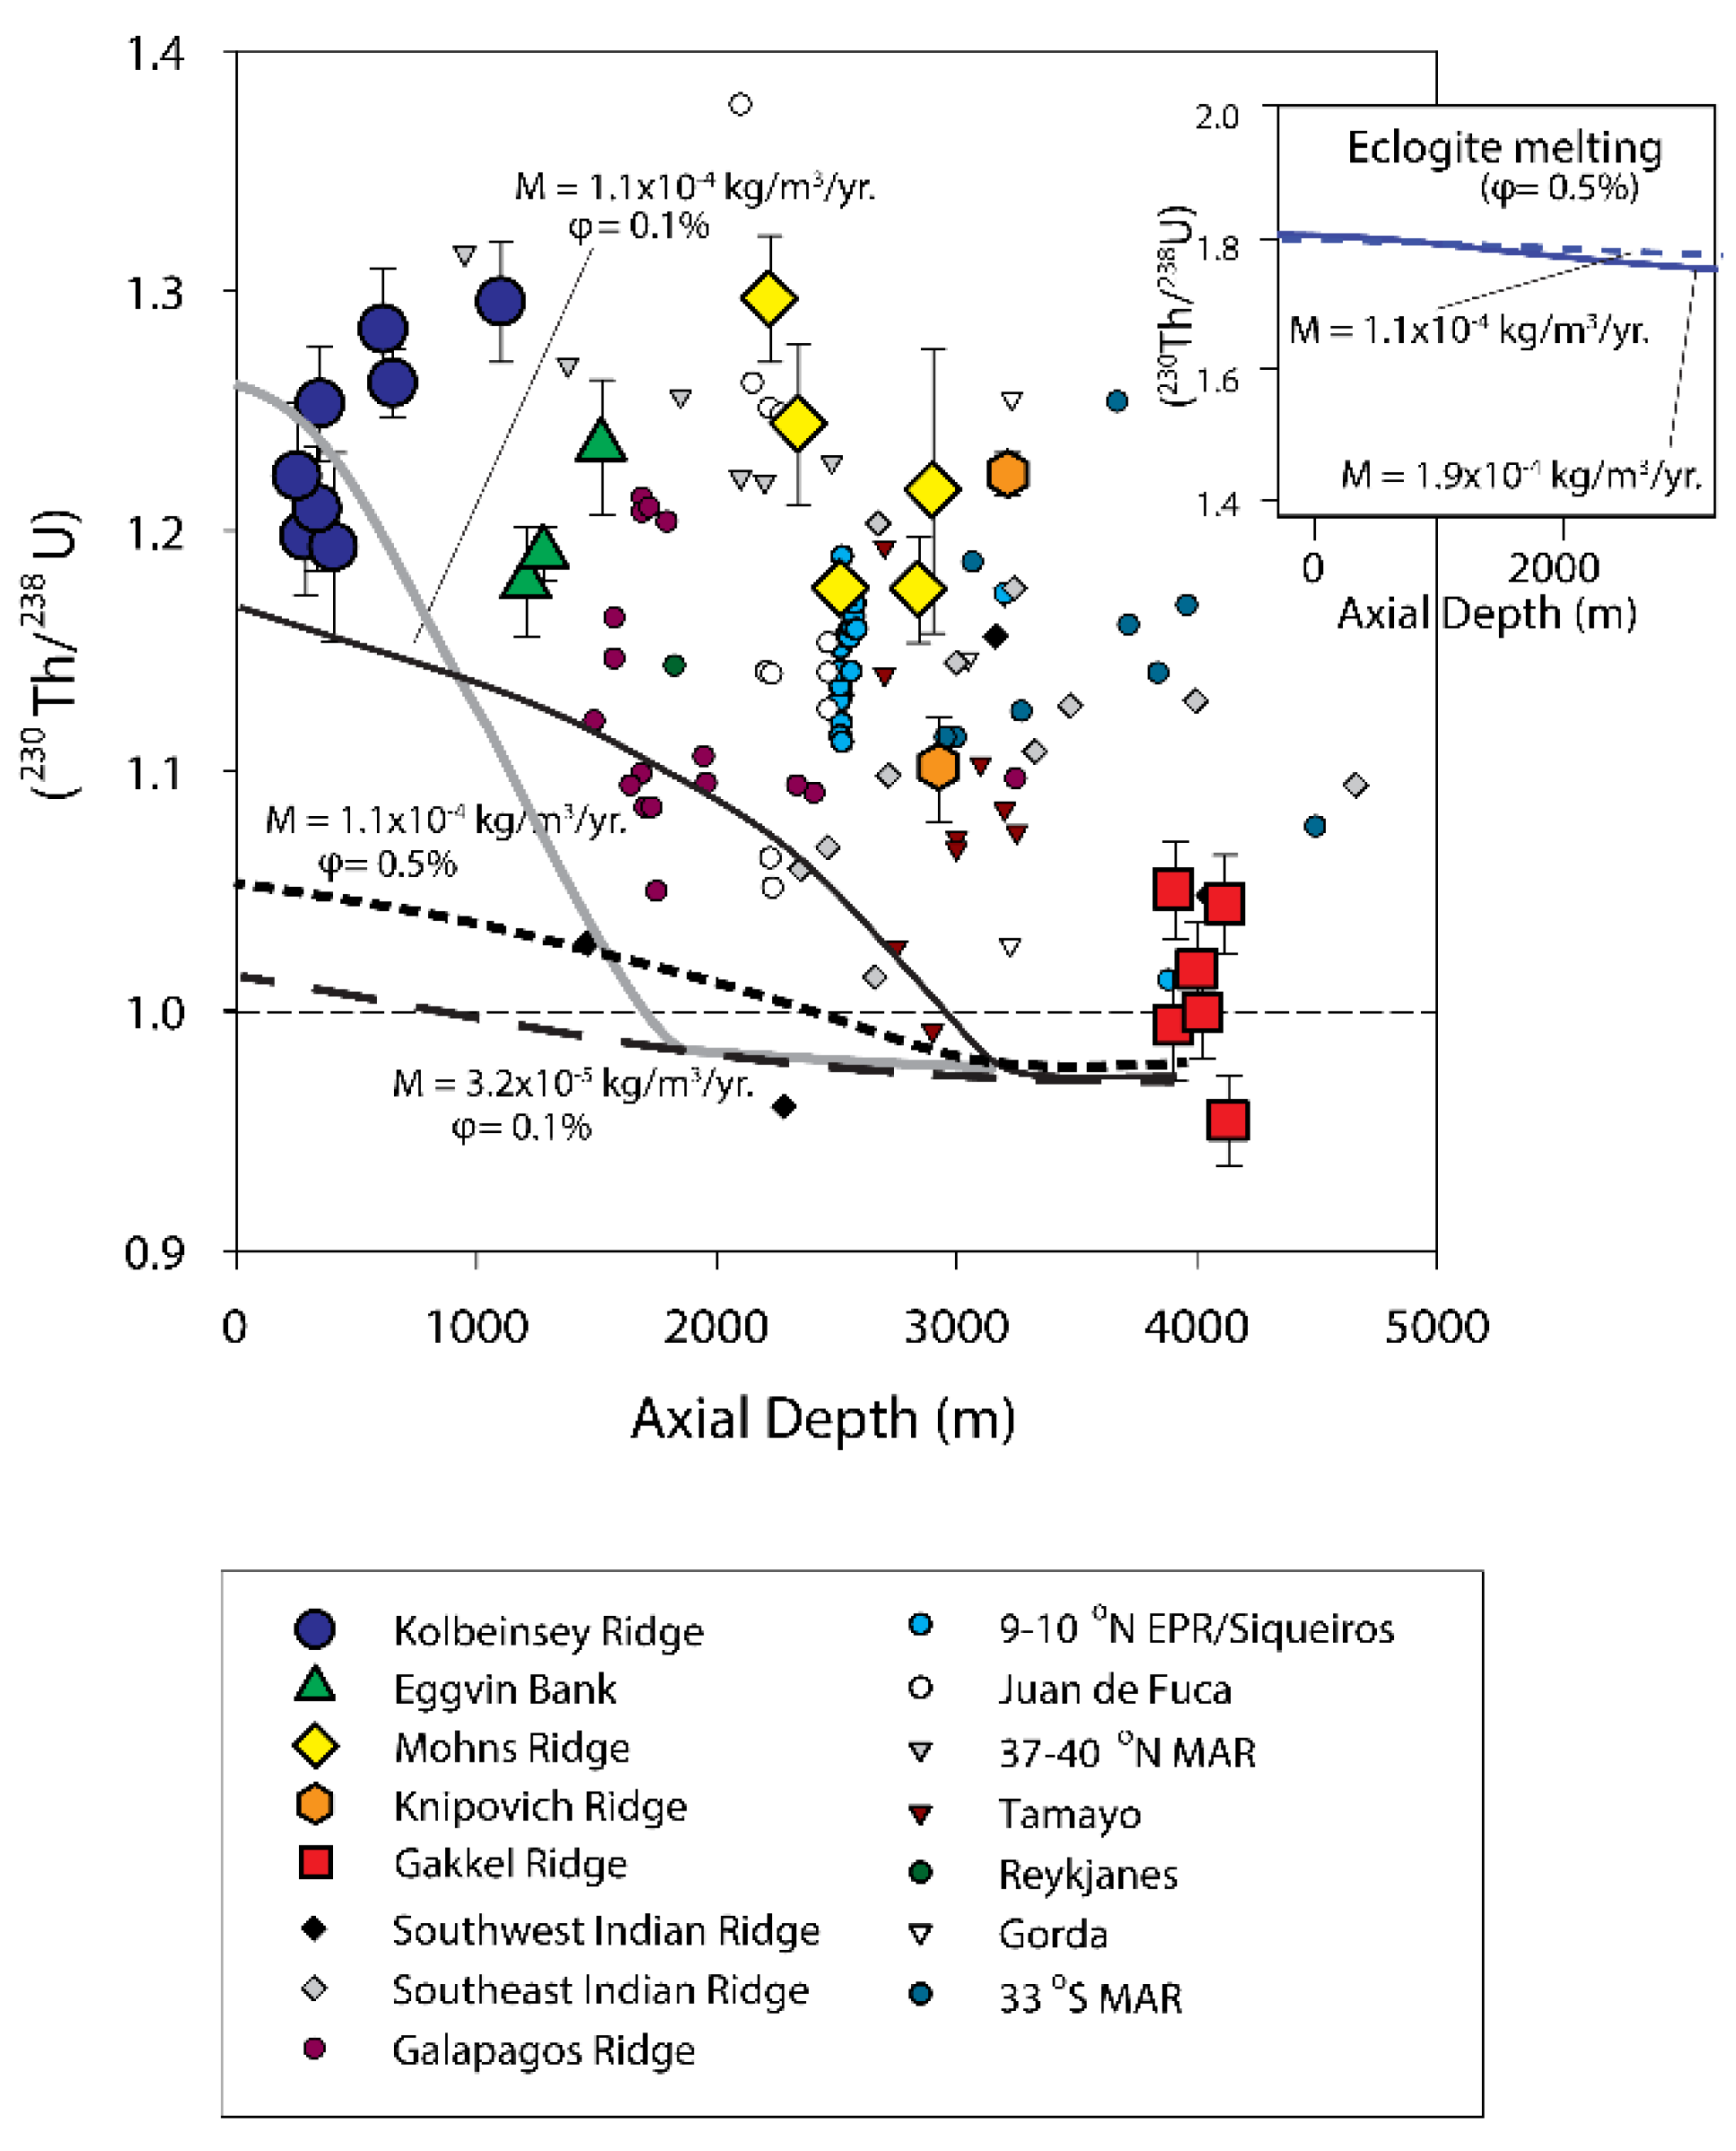
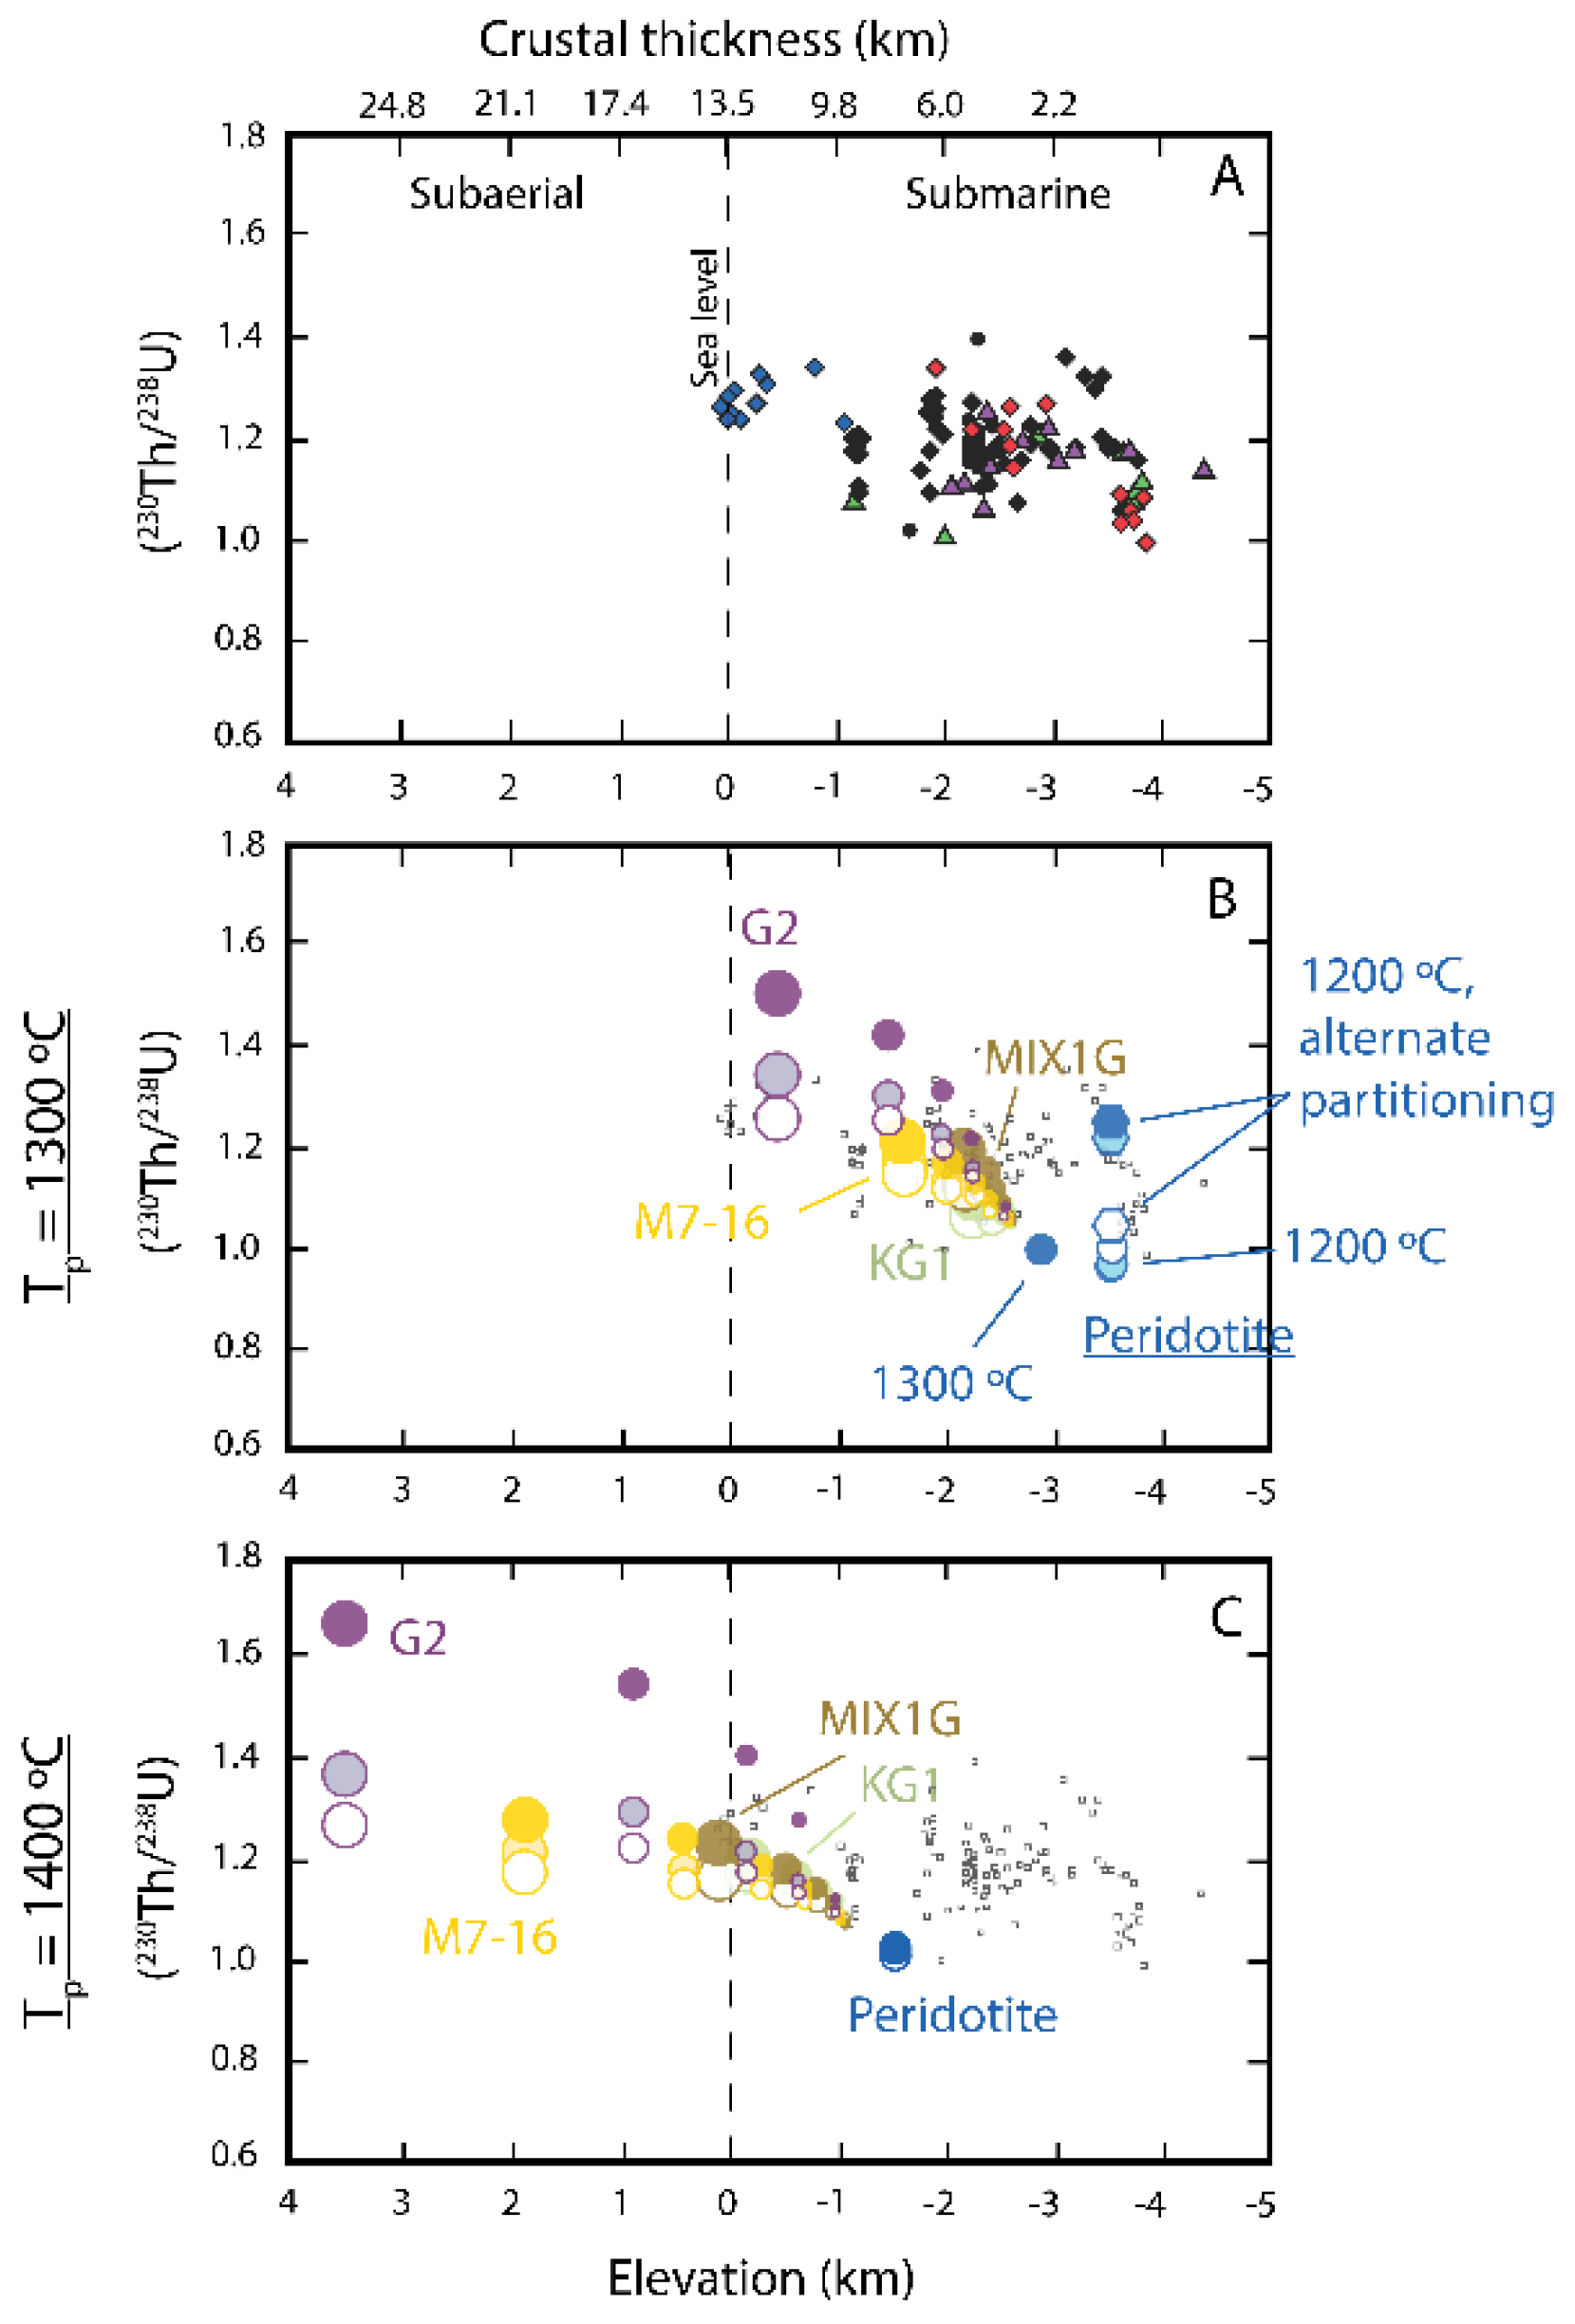
3.6.1. Global Correlation of (230Th/238U) with Ridge Axial Depth

An early first-order, seminal observation of U-series fractionation in MORB was that (230Th/238U) disequilibria vary systematically with ridge axial seafloor depth [27], which, in turn, principally is controlled by oceanic crustal thickness [98]. This correlation with (230Th/238U) was attributed to the fact that the depth of the peridotite solidus is controlled by mantle potential temperature, which has been predicted as a controlling factor in producing varying crustal thicknesses and, by inference, basaltic geochemical compositions [98]. Using time-dependent melting models, Bourdon et al. [27] explained the broad global negative correlation between axial ridge depth and (230Th/238U) by inferring mantle temperature control over melt column depth (i.e., the depth to the peridotite solidus). Because the solidus depth controls the length of the melt column, this depth (whether inferred or an explicit model parameter) influences both the duration of melting during upwelling and the overall degree and quantity of melt produced in the garnet peridotite stability field, where DU > DTh, producing (230Th/238U) > 1 in the magma [58,59,60,61,63,73,76,99,100].
An important location to see this systematic relationship between (230Th/238U) and seafloor axial depth is the Arctic or North Atlantic mid-ocean ridge system [43,101] (Figure 14). The North Atlantic data set nearly spans the complete range of both axial depth (250–4131 m) and (230Th/238U) (0.955–1.296) for MORB globally. The high (230Th/238U) values measured in MORB from the Kolbeinsey [43], Mohns, and Knipovich Ridges [101] reflect melting in the presence of residual garnet. In contrast, basalts from the Eastern Volcanic Zone (EVZ) of the Gakkel Ridge erupt through very thin crust [102], and major element data (e.g., high MgO and Na8) suggest that they are the result of smaller degrees of melting [103,104]. The overall low (230Th/238U) measured in EVZ Gakkel MORB suggests a relatively shallow melt regime dominated by spinel peridotite [101]. The negative trend of axial depth versus (230Th/238U) initially observed and modeled by Bourdon et al. [27] is also considerably stronger for Arctic MORB than for the global data set. Elliott and Spiegelman [105] measured a weakly correlated r2 coefficient of 0.58 for all global ridge data, while the Arctic ridges when taken alone [43,101] have (230Th/238U) values that are more strongly correlated with axial depth (r2 = 0.72).
The scatter observed in the global data set likely represents the influence and importance of several additional variables on melting, such as solidus depth, source heterogeneity, spreading rate, and the efficiency of melt extraction. The Kolbeinsey Ridge is compositionally more uniform and likely representative of elevated mantle temperature effects. The Kolbeinsey Ridge has MORB with notably high (230Th/238U) and shallow depths that are related to elevated crustal thickness adjacent to the Iceland hotspot. These data may indicate enhanced melting in the garnet peridotite stability field due to higher local mantle temperatures [43]. Basalts from ridges farther to the north (e.g., the Mohns and Knipovich Ridges), on the other hand, exhibit radiogenic isotope and trace element compositions indicative of greater source heterogeneity, suggesting that other lithologic sources of garnet such as pyroxenite may have increased their (230Th/238U) compositions and also the crustal thickness [101,106] (see below for further discussion of heterogeneity effects).
Figure 14. Global (230Th/238U) versus Axial Depth. Diagram of measured (230Th/238U) versus axial ridge depth showing data from this study (Mohns, Knipovich, and Gakkel Ridges) and the global ridge system [20,26,34,40,43,44,107,108,109,110]. This data set is restricted to age-constrained unaltered (234U/238U = 1) oceanic samples with (226Ra/230Th) and/or (231Pa/235U) out of equilibrium or stratigraphic age constraints. The curves show results of peridotite reactive porous flow melting from UserCalc [55] after calculations by Bourdon et al. [27] for various representative melting rates (M) and residual porosities (/) as labeled. See Elkins et al. [101] for full details.
Preprints 184447 g014

3.6.2. Two-Porosity Modeling

Two important observations indicate that MORB requires melt transport under heterogeneous conditions, including at least two porosities that generate distinct magma flow rates under equilibrium porous flow conditions: 1) trace element ratios indicate that MORB are mixtures of small-degree and large-degree melts as demonstrated by the relationship between (238U/230Th) versus αSm/Nd (Figure 15; [8]); and, even more definitively, 2) a well-defined negative correlation exists between (230Th/238U) and (226Ra/230Th) for demonstrably young basalts (<375 years based on the width of the axial spreading trough (AST) and spreading rate) derived from an isotopically homogenous source at 9-10°N East Pacific Rise (Figure 16; [20]). This interpretation, that the magma source and transport regime is polybaric, was first proposed by Kelemen et al. [111] based on observations from ophiolite complexes that show melt channels and evidence for melt-rock reactions plus the observed inverse correlation between (226Ra/230Th) and (230Th/238U) in basalts of unknown age from Juan de Fuca and Gorda ridges.
Early multiple-porosity interpretations (Figure 17 and Figure 18) invoked 1D chromatographic melting with two distinct fluid porosity regimes and suggested a modeling approach to calculate the outcomes of partial melting in such a scenario [17,113,114]. In the Jull et al. [114] model, which was developed to explain the negatively correlated (230Th/238U) versus (226Ra/230Th) in age-constrained lavas from the 9-10°N East Pacific Rise, the end-member lavas (enriched MORB [E-MORB]) with high (230Th/238U) and low (226Ra/230Th) derived from deep in the garnet stability field and were transported to the surface on a timescale that allowed the (226Ra/230Th) to decay back to equilibrium. Lavas (depleted MORB [D-MORB]) with low (230Th/238U) and high (226Ra/230Th), on the other hand, derived from the shallow part of the melt column, where the youngest melt component formed via continued decompression melting in the spinel peridotite stability field, thus preserving the short-lived 226Ra signal.
Figure 15. 230Th excess versus alpha Sm/Nd for Hawaiian samples and axial 9-10°N and Siqueiros transform samples. Modified from Sims et al. [112]. Alpha Sm/Nd is a measure of the Sm/Nd fractionation during MORB petrogenesis and is the Sm/Nd concentration ratio measured in the lava normalized to a model Sm/Nd source ratio inferred from the measured 143Nd/144Nd of the lavas (for details see [8,20]).
Preprints 184447 g015
Because the lavas from this correlated sample suite preserve relatively uniform radiogenic isotope signatures (143Nd/144Nd varies from 0.512378 ± 11 to 0.512400 ± 10, 87Sr/86Sr varies from 0.70244 ± 5 to 0.70257± 6, and 176Hf/177Hf varies from 0.283169 ± 5 to 0.283197 ± 5), source heterogeneity cannot be the only factor influencing 238U-230Th-226Ra systematics in mid-ocean ridge settings, and magma transport from a progressive melting regime must also be a major control. As is typical of models with multiple variable parameters, both chromatographic and dynamic melting (Figure 18) can be used to successfully predict the inverse correlation at the 9-10°N East Pacific Rise for a homogeneous initial source [22,114], provided that the former models include channels of focused melt flow, and the latter models include efficient melt extraction throughout a 2D, “triangular” melting region. Evidence from ophiolites demonstrates the presence of focused flow of MORB-like melt in dunite dissolution channels, surrounded by highly depleted harzburgites that are very far from equilibrium with MORB-like melts (e.g., [111,115], providing observational support for chromatographic models that include conduits for focused melt transport.
Recent outcomes of systematic modeling of global MORB by porous flow melting by Elkins and Lambart [68] have also demonstrated that no single melting scenario developed to date can generate all the observed global data, even accounting for lithologic heterogeneity (see below), and that a range of transport mechanisms and degrees of melt-rock equilibration are necessary on a global scale. Other studies (e.g., [116,117]) likewise have predicted from fluid dynamics and two-phase flow constraints that magma flow through a porous network must be spatially heterogeneous, with varying extents of flow in localized, high-flux “channels” surrounded by diffuse, low-flux matrices.
Figure 16. 230Th/238U versus 226Ra/230Th for axial 9-10°N samples showing inverse correlation. Modified from Sims et al. [20].
Preprints 184447 g016

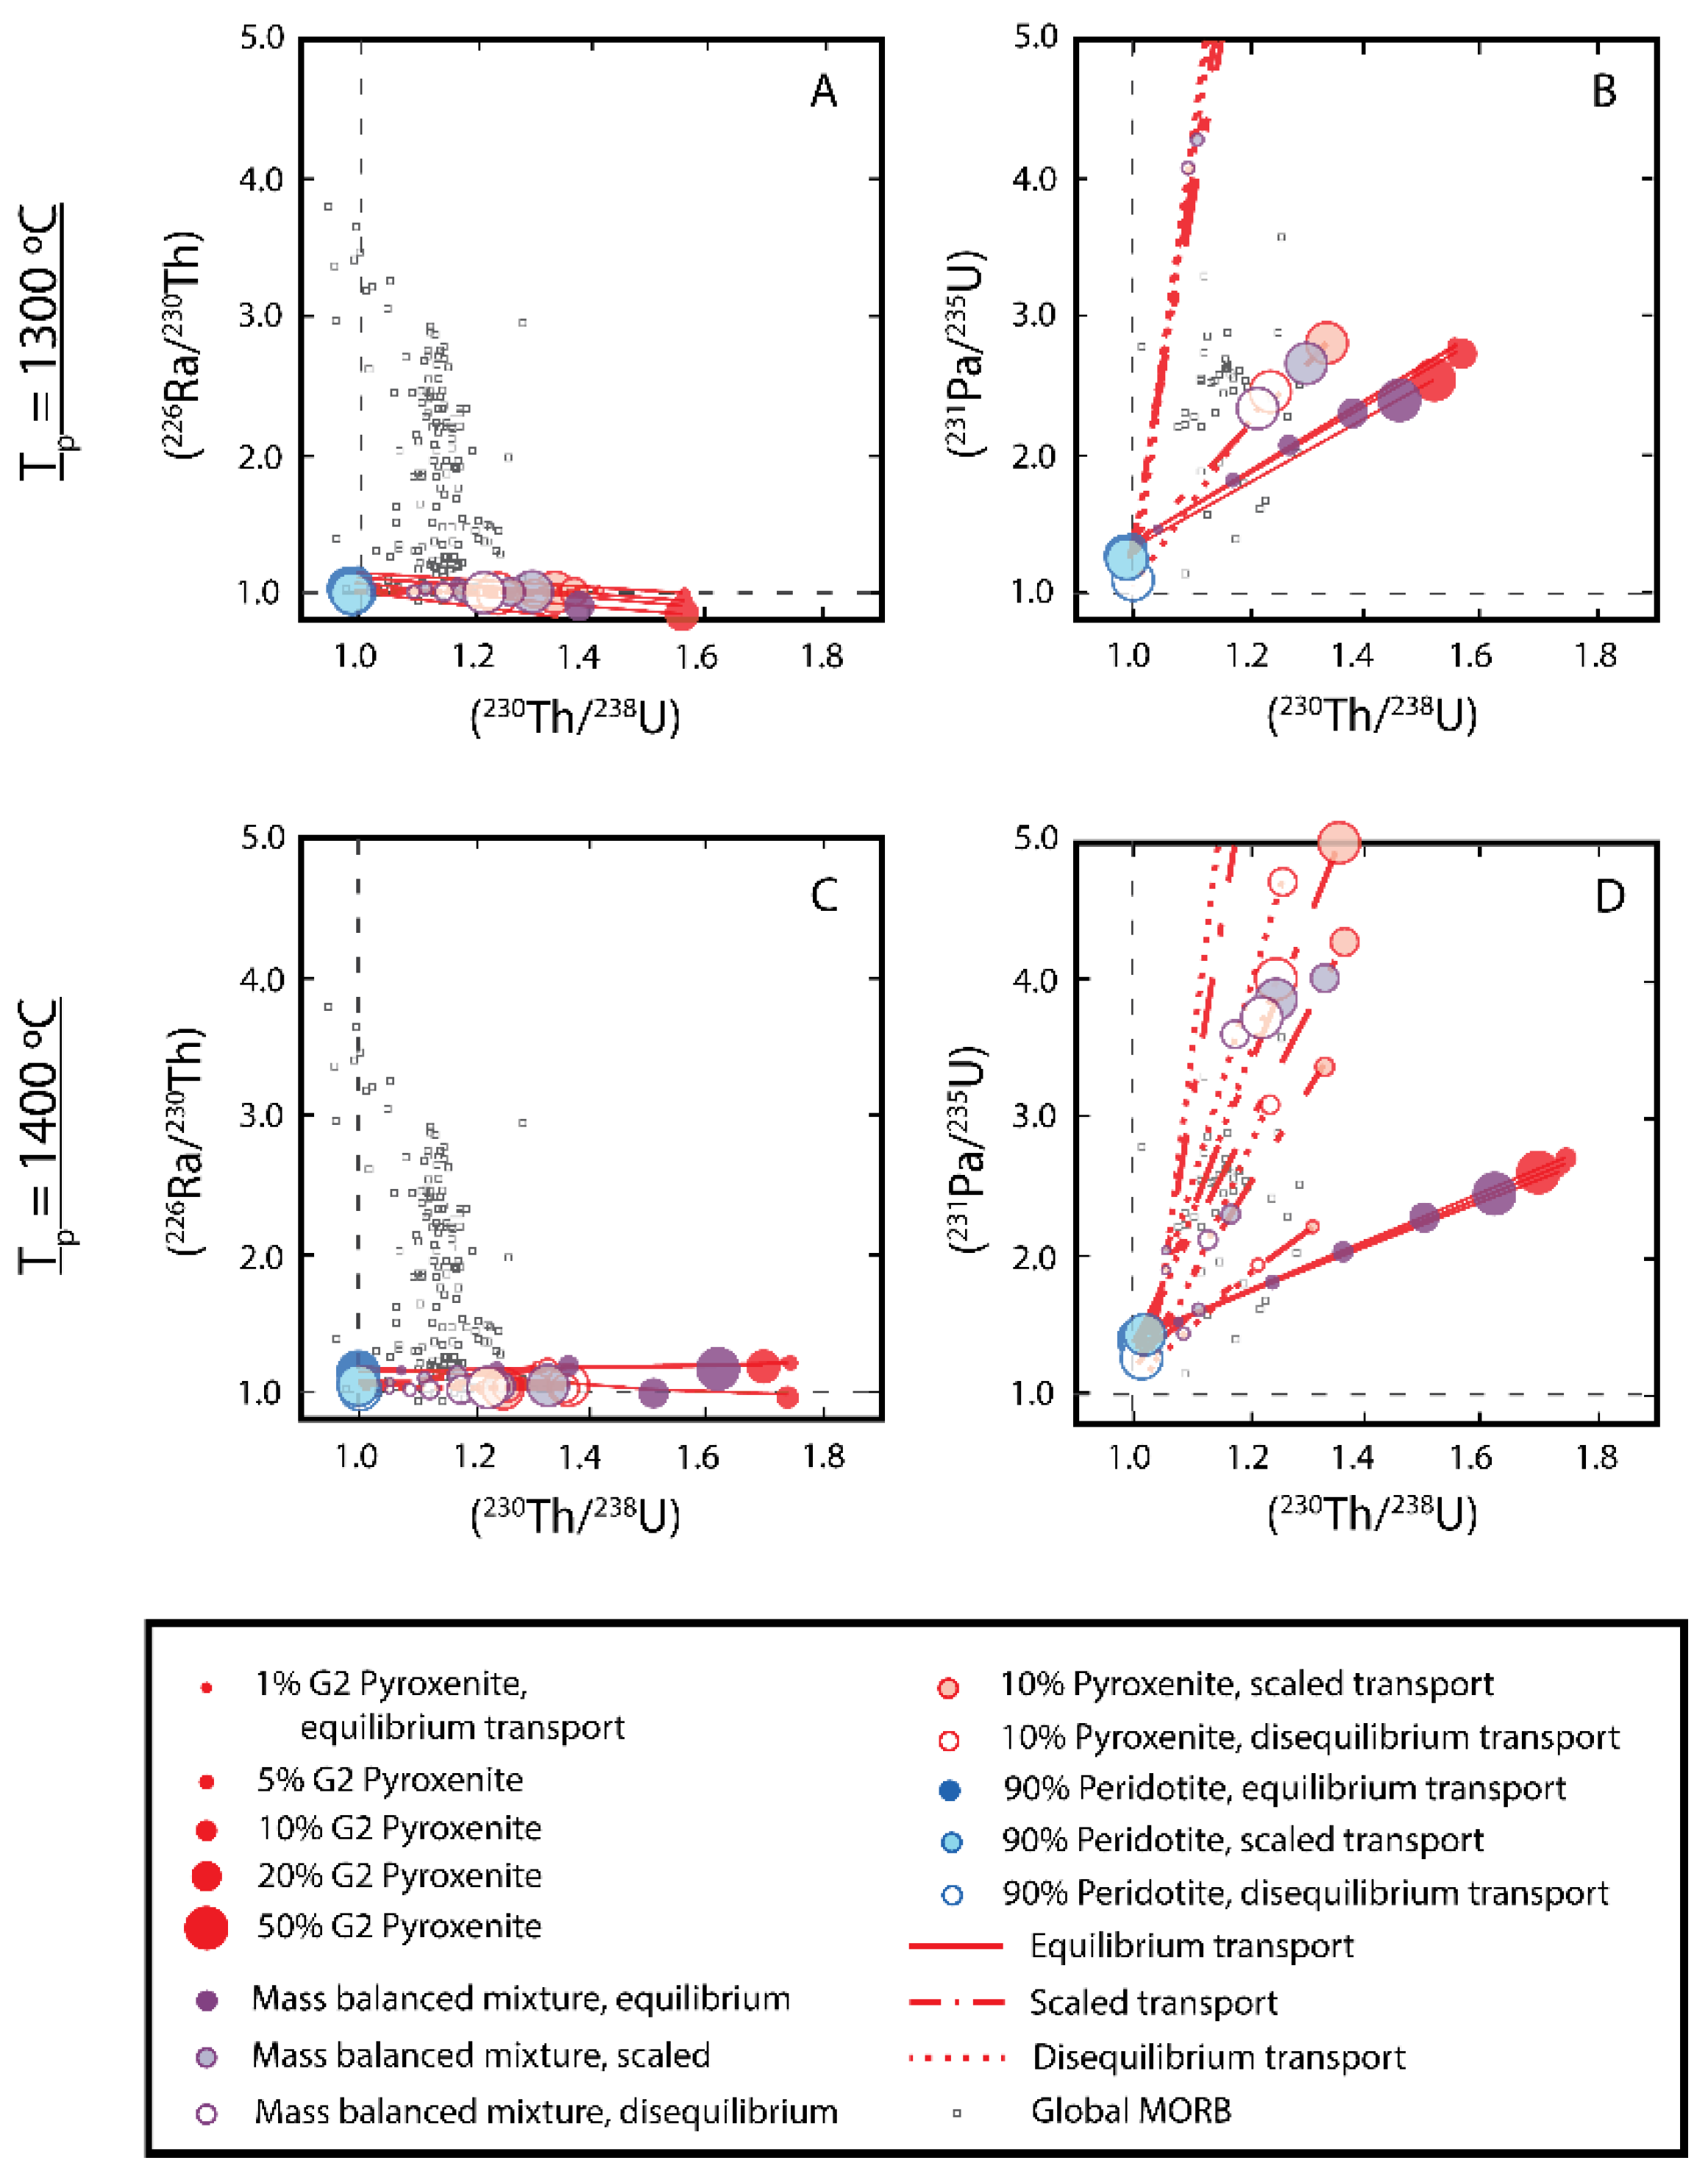
3.6.3. Effects of Source Heterogeneity on U-series Disequilibria in MORB

Because 230Th excesses in MORB support melting in the presence of residual garnet, and because there is a continuum of radiogenic isotopic compositions and trace element abundances that are often correlated with 238U-230Th, decompression melting of a heterogeneous mantle can explain much of the short-range and global compositional variability observed in MORB (e.g., [43,44,80,101,118]).
A key petrologic characteristic of decompression melting of a heterogeneous mantle is that different lithologies have distinct melting behavior, including different solidus depths and different melt productivities (e.g., [36,71,119,120,121,122,123,124,125,126,127,128]). Recycled crustal material, which may be the principal carrier of isotopically enriched signatures in the mantle (e.g., [119]), likely originates as gabbroic and basaltic oceanic crust that metamorphoses to become eclogite under upper mantle conditions. In addition to the preservation of these eclogites during mantle convection, processes such as physical or mechanical stirring of blobs and veins, and deep partial melting followed by melt-rock reaction with ambient peridotites, can produce a range of broadly pyroxenitic compositions with melting behavior distinct from that of peridotites (e.g., [71,119]). In general, pyroxenites have deeper solidi and narrower melting intervals than peridotite rocks along the same mantle adiabat, making them more fertile and magmatically productive than the dominant mantle peridotites (e.g., [71,119]). Due to their deeper solidi, partial melts of pyroxenite may also be extracted from a physically larger source region than partial melts of peridotite alone. Current estimates suggest that, overall, the convecting mantle contains approximately 5% of such recycled and/or hybrid, pyroxenite lithologies on average, but locally the quantity of pyroxenite in a zone of partially melting mantle may be significantly higher (e.g., [119]).
Because of their overall higher melt productivity, pyroxenite veins in peridotite are also expected to contribute disproportionately to an aggregated total melt relative to their absolute abundance, though the degree to which this is the case depends significantly on the type of pyroxenite (e.g., [36,44,118,119,120,121,122,129], and references therein). The disproportionate contribution of partial melts from pyroxenites to the overall magma is also mitigated by latent heat exchange as the two lithologies melt at different depths and in distinct proportions, though the difference in quantity from each lithology is still significant (e.g., [68,70,119,123,124]). For example, for a decompressing mantle source region containing 5% of an eclogite-like (experimental mixture G2; [123,130]) pyroxenite and 95% average peridotite, estimates suggest that 14-24% of the total melt produced by mass will derive from the pyroxenite.
Figure 17. Results of one- and two-porosity partial melting calculations for (230Th/238U) and (226Ra/230Th) for progressive adiabatic decompression melting of a two-layer (spinel- and garnet-bearing) peridotitic mantle as a function of melting depth. After Jull et al. [114] using a constant melting rate and threshold or reference porosity of 0.001, a solid mantle upwelling rate of 1 cm/yr., and bulk solid/melt partition coefficients, all after Jull et al. [114] except where otherwise indicated. (A) Results for chromatographic/equilibrium porous flow melting with a single porous network for liquid transport using the numerical solution to porous flow with variable porosity with depth; after Spiegelman & Elliott [12] and Spiegelman [55]. (B) Results for dynamic melting, considering a solid mantle upwelling rate of 1 cm/yr. and extracted liquid transport rate of 500 cm/yr., as well as a second scenario for upwelling rates of 10 cm/yr. and instantaneous liquid transport (green lines), which replicates dynamic melting conditions; after Stracke et al. [22]. (C) Results for an example two-porosity melting with a high-porosity channel that forms at a depth of 70 km, as described in the text of Jull et al. [114], where f1 indicates the porosities with depth for the low-porosity region, f2 shows the porosities with depth for the high-porosity region, and resulting liquid activity ratios are shown for both liquid zones (high-porosity results are in purple). The model scenario shown assumes that 1% of the total melt flux (S) remains in the low-porosity zone, with 99% entering the high-porosity channel, and a horizontal extent of channelization (C) of 1%.
Preprints 184447 g017
Beyond the overall liquid mass proportion, because pyroxenite lithologies, perhaps ultimately derived from recycled crustal material, are relatively enriched in incompatible elements, whereas much of the ambient peridotitic rock are trace element-depleted residues of prior partial melting (the depleted MORB mantle source, “DMM”), the pyroxenite partial melts are further expected to contribute an outsized proportion of incompatible elements to resulting mixtures (e.g., [36,121,122,131].
A systematic treatment of bi-lithologic mantle melting beneath mid-ocean ridges (Figure 19 and Figure 20) shows that, consequently, if a mixed pyroxenite-peridotite source partially melts, then the radiogenic isotopic and trace element composition of a lava formed by melting of that source will be highly biased from that of the average mantle or the dominant peridotite, and is instead a combined, unevenly weighted function of 1) the pyroxenite type and its melting behavior, 2) the proportion of pyroxenite in the initial un-melted solid, and 3) the combined degrees of melting of both lithologies. Uranium-series disequilibria are further influenced by both the magma transport regime and the effects of mantle temperature on mineralogy in each lithology [68]. Essentially, the isotopic compositions of the erupted basalts thus track differences in the relative proportions of mafic lithologies (i.e., pyroxenite and/or eclogite) and ambient peridotite in their melting mantle source, where lavas with more radiogenic 87Sr/86Sr and 206Pb/204Pb, less radiogenic 143Nd/144Nd and 176Hf/177Hf, and lower U/Th ratios record a melt source containing higher quantities of pyroxenite rocks.
Figure 18. Effects of end-member melting models – dynamic melting [10], chromatographic melting [12], two-porosity/polybaric porous flow [114], and dynamic melting using variable upwelling and melt extraction velocities [22]. The last two models both successfully explain the (226Ra/230Th) and 230Th/238U) observed in the 9-10°N EPR data [20]. However, only the two-porosity/polybaric porous flow model [114] explains all of the major and trace element data observed in the 9-10°N EPR data and also the melt channels as well as evidence for melt-rock reactions observed in ophiolite complexes by Kelemen et al. [111].
Preprints 184447 g018
Several studies (e.g., [44,101,106,109]) have found that MORB with relatively enriched isotopic compositions (i.e., relatively radiogenic 87Sr/86Sr, 206Pb/204Pb, 207Pb/204Pb, and 208Pb/204Pb, and unradiogenic 143Nd/144Nd and 176Hf/177Hf) exhibit both (a) elevated (230Th/238U) and (b) low, age-constrained (231Pa/235U) and (226Ra/230Th), when compared to the overall global data set. These are properties that isotopically enriched MORB share with some highly enriched ocean island basalts (e.g., [44,101,106,109]) despite the expected passive upwelling setting for mid-ocean ridges, and in some cases (e.g., the North Atlantic) far lower solid mantle upwelling rates than expected for hotspots. Studies of enriched MORB, as well as systematic modeling of heterogeneous mantle melting using time-dependent melting models [67,68], have demonstrated that the high (230Th/238U) accompanied by low (226Ra/230Th) and (231Pa/235U) observed in some MORB cannot be produced by peridotite melting, whereas lithologies with higher fusilibility and a greater stability range for garnet (i.e., garnet-bearing pyroxenites; e.g., [71,119], and references therein) can produce the observed patterns. Essentially, rapid melting of peridotite alone cannot achieve the same signatures, even with accelerated solid upwelling rates and elevated mantle temperatures, thereby necessitating the presence of at least moderate quantities of mafic (pyroxenite) rocks that melt more rapidly in these settings.
Figure 19. Partial melting calculation results after Elkins & Lambart [68], showing (A) (226Ra/230Th) and (B) (231Pa/235U) vs. (230Th/238U) in computed partial melts where mantle Tp = 1300 ºC, (C) (226Ra/230Th), and (D) (231Pa/235U) vs. (230Th/238U) compositions for Tp = 1400 ºC. Partial melts of G2 pyroxenite are shown in red, and those of coexisting peridotite in blue for a final melting pressure of 5 kbar. Calculated results are shown for G2 pyroxenite abundances in the solid source of 1 to 50% and a range of magma transport models (equilibrium, disequilibrium, and scaled disequilibrium transport with a Dahmköhler number of 0.1), all for a representative set of results using a solid mantle upwelling of 3 cm/yr. and a residual maximum porosity of 0.8%. Mass-balanced binary melt mixtures (purple symbols) have been computed assuming that all coexisting partial melts are extracted and homogenized for each melting scenario. Global MORB data are shown for comparison. After Figure 13.
Preprints 184447 g019

3.6.4. U-series Techniques for Deciphering the Origins of MORB

Below, we outline how U-series disequilibria are a useful tool for deciphering the heterogeneous mantle and melting origins of MORB by exploring a series of case studies in greater detail.
Uranium-series disequilibria in normal MORB (N-MORB) and E-MORB from the East Pacific Rise have helped to assess the likely origins of E-MORB overall. Waters et al. [44] observed that E-MORB and N-MORB from the 9-10 °N EPR region form a continuum of compositions that are best explained by mixing of melts derived from a heterogeneous mantle source with at least two major components that are both elementally and isotopically distinct. All young N-MORB and E-MORB collected from within ~5 km of the AST along 9-10 °N EPR have significant 230Th excesses [20,107], most probably indicating the presence of garnet in the mantle source residue and recent fractionation of U from Th compared to the half-life of 230Th. These observations are at odds with studies of E-MORB that have called upon a two-stage process involving (1) ancient cryptic metasomatism and (2) melting of that cryptically metasomatized spinel peridotite beneath the ridge axis to generate E-MORB compositions [134]. However, it is important to note that metasomatism, recycling of oceanic crust (MORB), and recycling of ocean island basalts (OIB) that produce fertile, garnet-rich lithologies in the resulting source rocks are possible candidates for the origin of the mantle source enrichment of E-MORB. However, the large 230Th excesses observed in EPR E-MORB are difficult to reconcile with a model that involves large degrees of melting of ancient cryptically metasomatized spinel peridotite as tested by Donnelly et al. [134].
Figure 20. Calculated porous flow partial melting results after Elkins & Lambart [68] for pure peridotite and peridotite-pyroxenite weighted melt mixtures and computed axial depths, along with global MORB data (Figure 7) and peridotite melt modeling results for (230Th/238U) and axial depth after Bourdon et al. [27] for comparison. The melting modeling results from Elkins & Lambart [68] were computed assuming a solid mantle upwelling rate of 3 cm/yr., a residual maximum porosity of 0.8%, and a mantle potential temperatures of (B) 1300 ºC and (C) 1400 ºC. Symbol colors indicate mass-balanced mixing compositions of the partial melts of a peridotite coexisting with a series of pyroxenite compositions, as well as a pure peridotite source, as labeled. Results are shown for equilibrium porous flow (filled symbols), disequilibrium porous flow (open symbols), and disequilibrium porous flow scaled with a Damköhler number of 0.1 (shaded symbols). Additional results for pure peridotite melting at Tp = 1200 ºC are included in panel (B) for comparison with outcomes using alternative U and Th partition coefficients [69,132] illustrated with hexagon symbols. Crustal thicknesses were determined given the total quantity of melt produced over a 1D melting column for the two melting lithologies, assuming a 15% density contrast between mantle and oceanic crust and full melt extraction to form the crust. The seafloor depth was then computed for a given crustal thickness using a simple isostatic model with 200 km compensation depth, dynamic support of the surrounding plate, and a typical ocean density profile as a reference column, with 7 km crustal thickness, 3 km of ocean water, and underlying layers and densities after Lin et al. [133].
Preprints 184447 g020
Waters et al. [44] used time-dependent melt modeling to show that mixing of deeply generated garnet pyroxenite partial melts with shallowly-generated, accumulated pyroxenite-peridotite melt mixtures in a two-porosity melting and melt transport regime results in excellent matches to both the incompatible element abundances and ratios of E-MORB and the trajectory of the EPR mixing array. In particular, the models produce both elevated highly incompatible element abundances and a shallow MREE/HREE slope, a common feature of E-MORB previously attributed to melting of spinel peridotite [134]. Waters et al. [44] thus proposed that inferred mixing trends among trace elements and long-lived radiogenic isotopes observed in Pacific MORB reflect mixing of melts during melt extraction and crustal storage, rather than large-degree melting of cryptically metasomatized spinel peridotite as proposed by Donnelly et al. [134]. Waters et al. [44] further suggested a model for the genesis of E-MORB by low-degree melting of an enriched, garnet-bearing source that is melting deep and in the deep corners and base of a triangular MORB melting regime.
Taken together, the results of the two-porosity melting mixing model and the non-systematic U-series ages of E-MORB and N-MORB also suggest that E-MORB and N-MORB may be produced concurrently and occupy axial melt chambers (AMC) at the same time. However, along-axis variations in the aspect ratios of axial melt lenses may inhibit along-axis mixing (e.g. [135]) and hence the ability of N-MORB and E-MORB melts to mix. Because even small increases in the proportion of garnet pyroxenite versus peridotite partial melt contributions can result in the eruption of E-MORB and not N-MORB, the less robust nature of magmatism at 9°30’ N EPR and the western limb of the small overlapping spreading center at 9°37’ N compared with 9°50’ N EPR may decrease melt sill thickness and inhibit along-axis mixing of geochemically variable melts. Thus, along-axis differences in the physical properties of the AMC owing to variations in magma supply may be directly related to the greater abundance of E-MORB erupted near 9°30’ N and 9°37’ N compared with 9°50’ N EPR [44].
At intermediate spreading rates, the compositions of basalts from the Southeast Indian Ridge (SEIR) vary along the ridge axis in both (230Th/238U) and (226Ra/230Th) [109]. The data exhibit an inverse correlation between (226Ra/230Th) and (230Th/238U) similar to that of the global array [20], but (230Th/238U) does not correlate in a straightforward way with axial depth or inferred crustal thickness, suggesting additional controls over melt composition and magma generation beyond mantle temperature variations. According to Russo et al. [109], time-dependent modeling suggests that the observed systematics in (226Ra/230Th) and (230Th/238U), axial depth, crustal thickness, and Th/U ratios are best explained by an along-axis temperature gradient accompanied by variations in lithologic composition along the axis (e.g., the presence of pyroxenite veins). Specifically, Russo et al. [109] determined that melt supply and crustal thickness decrease systematically from west to east along the ridge axis, but the melting rate required by U-series disequilibria only correlates with the melt supply in the western and central parts of the study area. In the east, the melting rate required to explain the observed data must be high despite the lower overall melt supply to the ridge axis, which suggests the increased presence of fusible pyroxenite veins in an overall cooler regime.
Uranium-series disequilibria have been useful for exploring the role of heterogeneous melting not only at fast and intermediate spreading rates, but also at slow spreading rates, as explored above for the slow- to ultraslow-spreading Arctic ridge system. Along the Kolbeinsey, Mohns, Knipovich, and Gakkel Ridges, slow spreading is distinct from underlying mantle temperature, which is elevated near Iceland, such that spreading and inferred passive upwelling rates can be isolated from mantle temperature effects on the peridotite solidus depth [43,101]. Radiogenic isotopes and trace element compositions also indicate that basalts from the Mohns and Knipovich Ridges are products of melting a heterogeneous source mantle with compositional characteristics significantly different from the mantle beneath the Kolbeinsey Ridge (e.g., [101,136,137]). For U-series disequilibria, the high-temperature but likely peridotite-dominated system beneath the Kolbeinsey Ridge produces elevated (230Th/238U) and (231Pa/235U), while lavas from the Mohns and Knipovich Ridges have relatively high (230Th/238U) but low age-constrained (231Pa/235U) and (226Ra/230Th), best explained by melting a pyroxenite-bearing mantle source [43,101].
In another slow-spreading ridge example, MORB from five second-order segments between 5-11º S along the southern Mid-Atlantic Ridge (MAR) exhibit a wide range of 230Th excesses from 0 to 32%, as well as heterogeneous trace element and radiogenic isotope compositions [138] and axial depths. Notably, however, (230Th/238U) does not correlate with axial depth, indicating that it is not controlled by regional changes in mantle temperature, much like observations along the SEIR [109]. As seen elsewhere, mixing of partial melts from a heterogeneous mantle source is necessary to explain the combination of distinct source compositions and melting rates required to generate U-series disequilibria.
A follow-up study of basalt compositions along the Northern Kolbeinsey Ridge (NKR) and nearby Jan Mayen Island hotspot provides an additional, useful example of the method for exploring magma origins at slow spreading but anomalously high magma production rates. Elkins et al. [106,139] evaluated 238U-230Th-226Ra disequilibria, radiogenic isotope variations, and trace element compositions for this volcanically active region adjacent to the Jan Mayen Fracture Zone and observed high (230Th/238U) accompanied by low (226Ra/230Th) in age-constrained basalts from both the NKR and Jan Mayen Island, similar to Mohns and Knipovich Ridge lavas farther to the north. The U-series compositions of lavas for the region correlate with radiogenic isotopes, indicating a source heterogeneity effect. Trace element compositions of Jan Mayen Island and NKR lavas are distinct, however, suggesting slightly different underlying mantle compositions that contain different types or quantities of enriched, pyroxenitic material [139]. In particular, the combination of high (230Th/238U) with low (226Ra/230Th) and (231Pa/235U) observed in NKR, Jan Mayen, Mohns, and Knipovich Ridge basalts requires faster melting in the presence of residual garnet than would occur in peridotite. To achieve the observed disequilibria, the presence of a garnet-bearing and highly fusible rock type is necessary, supporting the presence of fertile, isotopically enriched lithologies in the underlying mantle regime [101,106].
The case studies described here demonstrate that the combination of 1) U-series disequilibrium measurements in fresh, age-constrained oceanic lavas and 2) thoughtful use of time-dependent melt models can help to distinguish between unique scenarios for mantle melt generation, such as variations in solid mantle upwelling rate, diverse sampling of melt components from a multiple porosity decompressing regime, and the presence of heterogeneous source lithologies with distinct melting behavior and melt productivities. Specifically, time-dependent modeling of partial melt generation for a range of lithologic types and upwelling rates illustrates distinct differences between the outcomes of rapid melting due to fast mantle upwelling and rapid melting due to the presence of highly fusible material, making it possible to differentiate between those two scenarios [67,68,101,106]. This technique has successfully been applied to investigations of MORB generation in a variety of settings and across all spreading rates.
Lastly it is important to note that the efficiency of focused versus diffuse flow is also a critical consideration [114,140,141].

3.7. Ocean Island Basalts (OIB)

On a global basis, ocean island basalts (OIB), like MORB, are characterized by (230Th/238U) activity ratios greater than one [8,9,19,142,143,144,145]. These 230Th excesses indicate that the magmas were likely generated by partial melting in the presence of garnet, which is not surprising given the thickness of the lithosphere in intraplate settings. Also, like MORB, decompression melting due to adiabatic mantle upwelling generates OIB; as such, the preferred melting models for investigating magma origins are similar. The main difference is that hotspot settings have higher mantle potential temperatures, buoyancy fluxes, and melting rates, and are argued to be the surface manifestation of deep mantle plumes [19,99,146,147,148,149,150,151,152]. Because those buoyancy fluxes and melting rates also vary systematically from the center to the edges of upwelling mantle plumes, one of the most important outcomes from U-series measurements in OIB has been the use of 238U-230Th-226Ra and 235U-231Pa disequilibria to affirm the existence of mantle plumes, to determine the melt productivity of a lava’s underlying mantle source, and to understand and map the upwelling structure of individual mantle plumes [19,142,143,145,153].

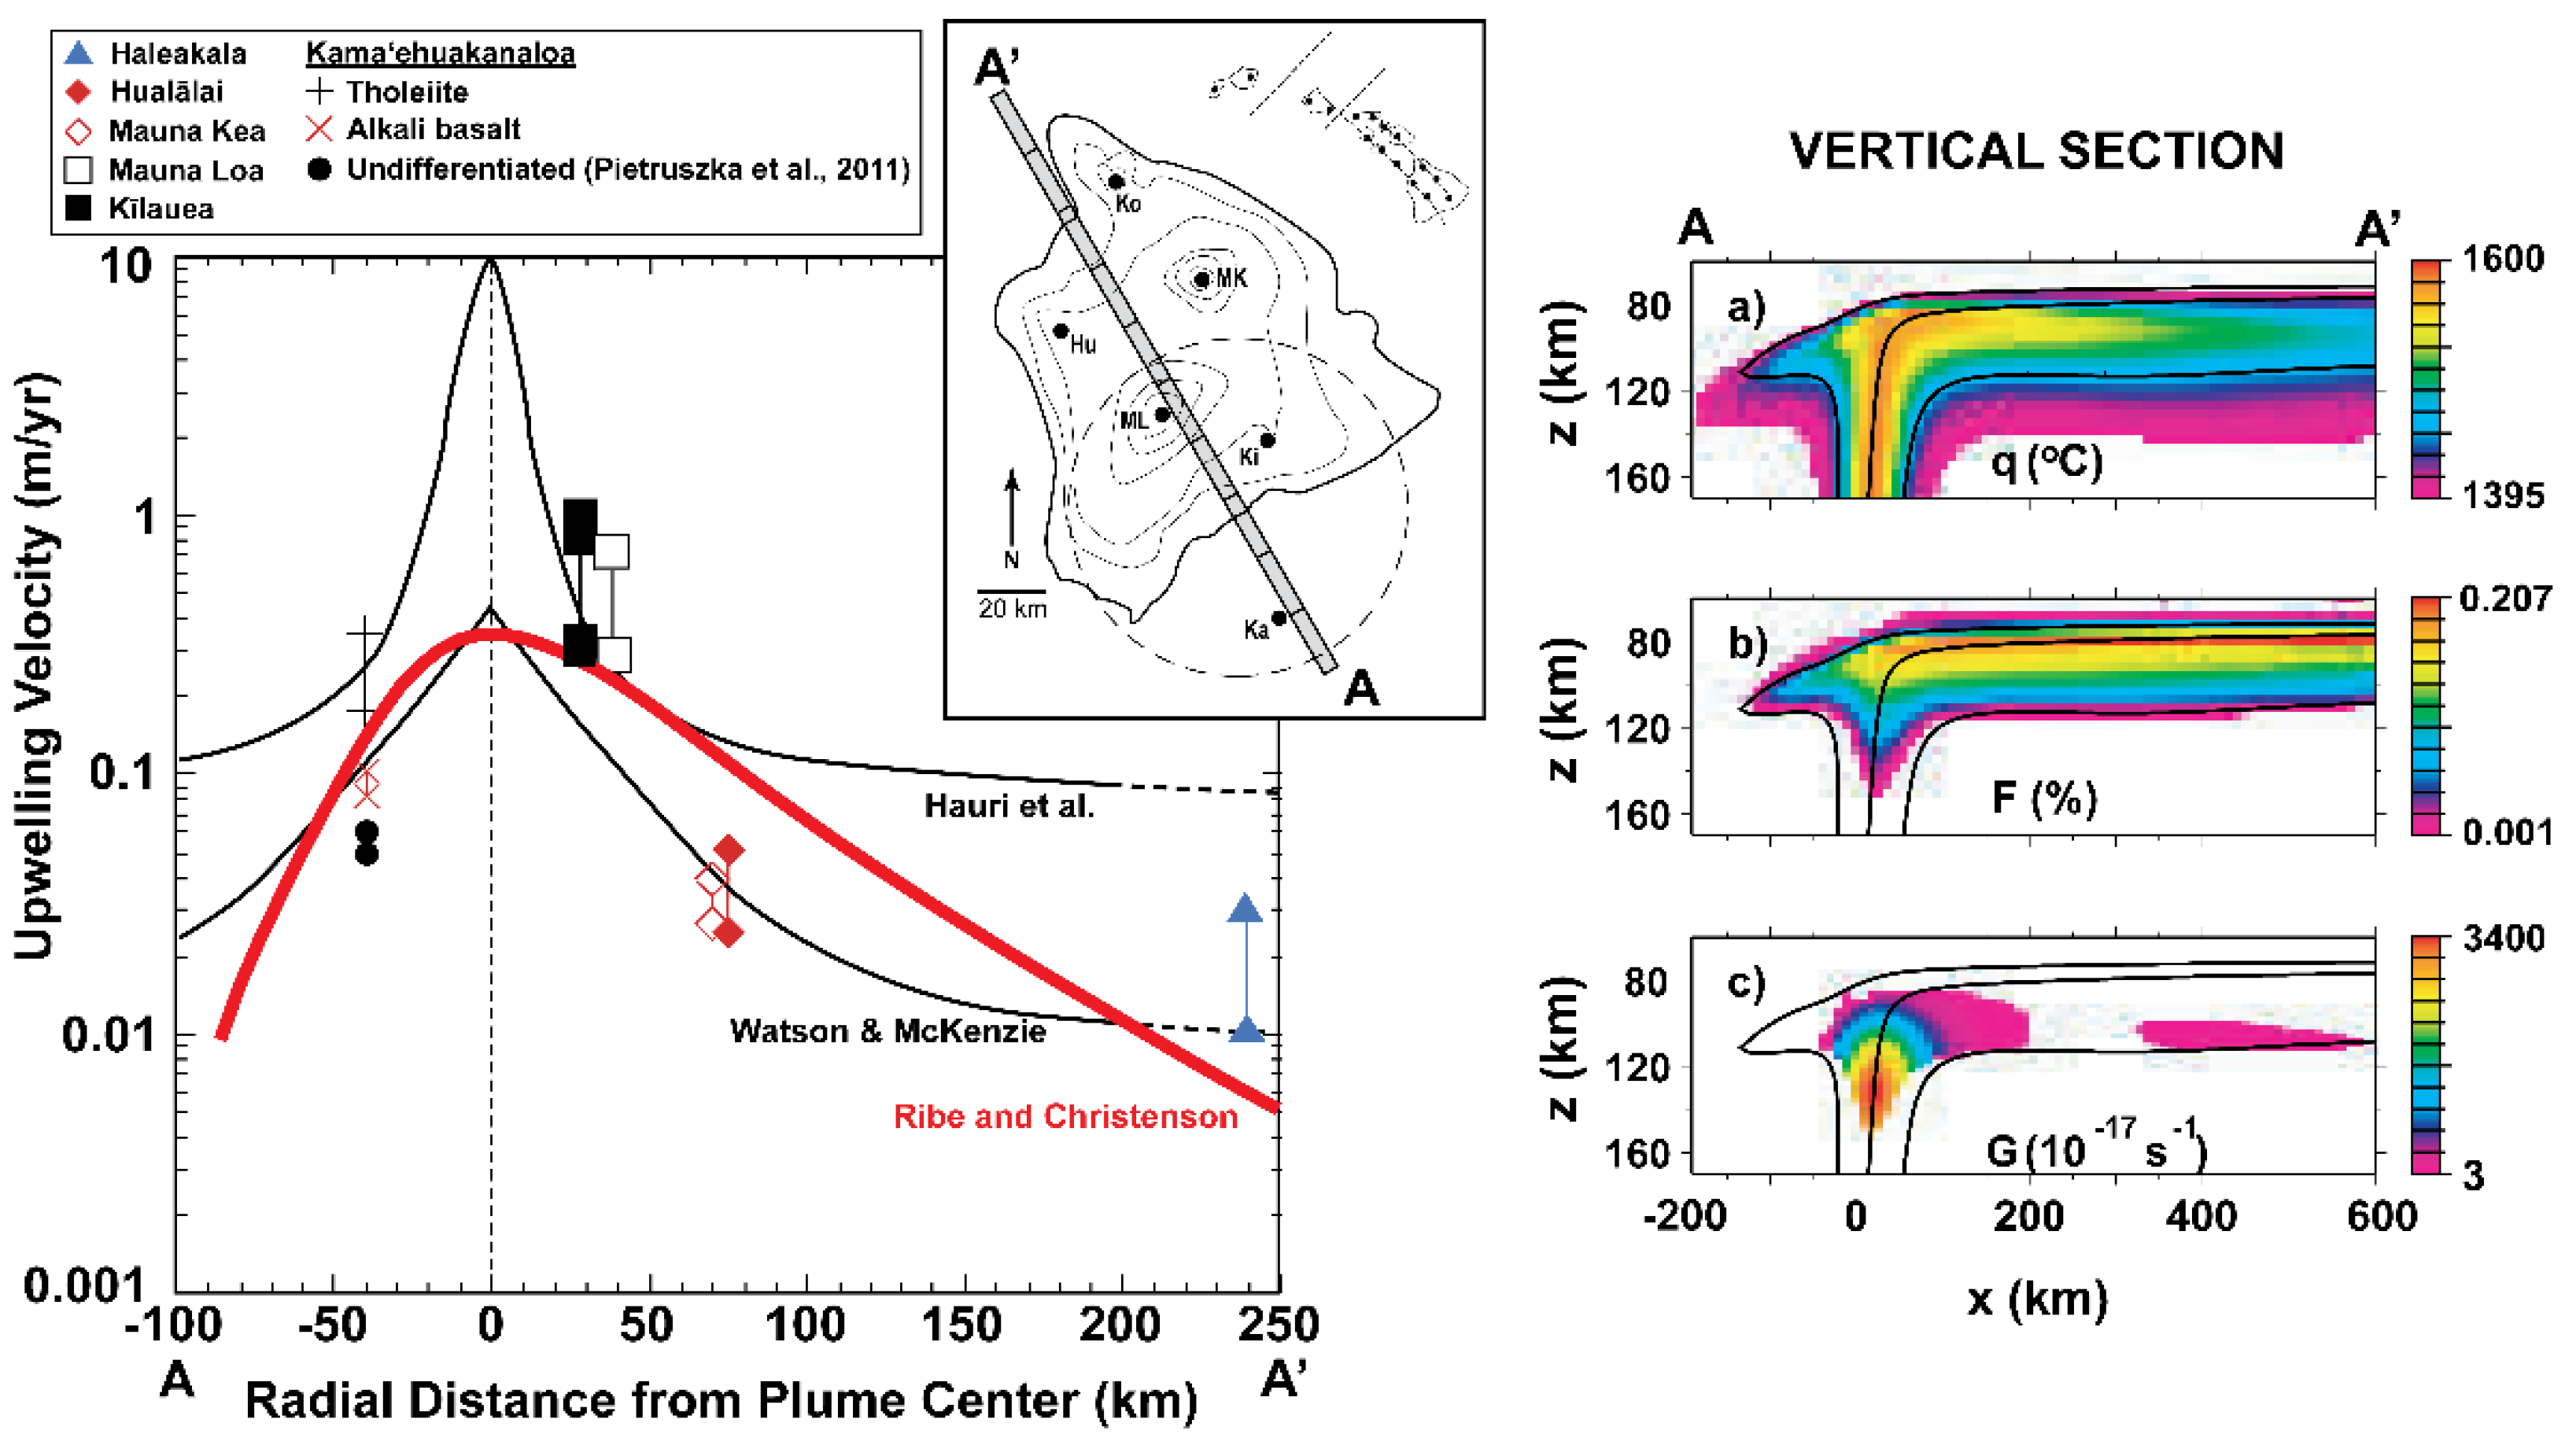
3.7.1. Using U-series Disequilibria to Evaluate Upwelling in Mantle Plumes

Hawaiian Lava Origins: Evidence for a fast-upwelling plume with structure
The Hawaiian Archipelago is one of the most widely studied (and perhaps the best understood) examples of ocean island volcanism. The islands of Hawaii are at the southeastern end of a linear chain of volcanic islands, the 6000 km long Hawaiian-Emperor ridge. These islands are inferred to be the surface expression of a mantle plume having sat beneath the westward-moving Pacific plate for about 75 Myr. Based on the volume and composition of these basalts, as well as geophysical observations such as the geoid height and bathymetric swell, it is generally thought that the northwest motion of the Pacific plate is moving the main island of Hawaii off the hotspot center and that the new submarine volcano Kamaʻehuakanaloa seamount (formerly known as Loihi) to the southeast represents the initial stages of melting produced at the leading edge of the plume [8,19,154].
Numerous studies on lavas from the Hawaiian Islands have shown that over the lifespan of a single volcano, the major and trace element chemistry of the erupted basalts vary significantly and systematically (e.g., [155,156]). This variation is believed to be the result of movement of the Pacific plate over a stationary mantle plume, and is typified by four distinct phases of volcano evolution: (1) a pre-shield stage, during which both tholeiitic and alkaline lavas are erupted; (2) a tholeiitic shield-building stage, which represents about 98% of the volcano’s total volume; (3) a post-caldera or post-shield stage during which the lavas become more alkalic in composition and erupt as small parasitic cones, forming a thin veneer over the shield-stage tholeiites; and (4) a late or rejuvenated alkalic volcanism stage, which occurs after an ill-defined period of quiescence. While the time required for the entire evolution of one volcano (ca. 2-5 Ma) is much longer than the time-span that can be investigated using 238U-230Th disequilibria, it is possible to obtain from several different volcanoes a suite of historic or young radiocarbon dated lavas that range in composition from primitive tholeiite to primitive alkali basalt and collectively encompass all four stages of Hawaiian volcano evolution.
Past U-series work on Hawaii has included both early alpha counting studies [157,158,159,160] and more recent mass spectrometric studies using TIMS, SIMS, and MC-ICPMS [8,19,37,154,161,162]. Most U-series studies have focused on the active shield-stage tholeiitic volcanoes, Kilauea and Mauna Loa [8,19,154,157,158,159,160,161,162,163,164]. However, 238U-230Th-226Ra and 235U-231Pa disequilibria have also been measured in young tholeiitic and alkaline lavas from the preshield-stage submarine volcano Kamaʻehuakanaloa [8,19,154] and in alkaline lavas from the post-shield stage volcanoes, Hualalai, and Mauna Kea, and the rejuvenated stage volcano Haleakala [8,19,37]. 238U-230Th disequilibria further have been measured in young alkaline submarine flows from the South Arch [8].
Early U- and Th-series measurements that used radioactive counting techniques demonstrated the existence of significant radioactive disequilibria in lavas from Kilauea, suggesting that chemical fractionation between 238U-230Th and 230Th-226Ra occurred during the formation of Kilauea magmas on timescales less than 375 ka and 8 ka, respectively. However, the origin of this fractionation, whether melting or secondary processes such as assimilation of altered oceanic crust, was highly uncertain [157]. Subsequent mass spectrometric studies with higher-precision measurements have consistently demonstrated that the 230Th excesses in tholeiitic lavas from Kamaʻehuakanaloa, Kilauea, and Mauna Loa are small (2 to 6%) [8,19,165] and constant [162] compared to, e.g., the large 230Th excesses seen in MORB (up to 25%), even though MORB are also mostly tholeiites. Note that Cohen et al. [161] showed much larger extents of 230Th excesses for Mauna Loa, but as shown by Sims et al. [19], U-series systematics in these Mauna Loa lavas have been changed by secondary alteration.
In contrast, young alkalic lavas from the post-shield stage volcanoes, Hualalai and Mauna Kea, and the active rejuvenated stage volcano, Haleakala, have much larger 230Th excesses than Hawaiian tholeiites, ranging from 15 to 30% [8,19,37]. The observation that these 230Th excesses vary systematically across the range of compositions observed for Hawaiian lavas, with the smallest excesses observed in the tholeiites and the largest excesses seen in basanitic lavas from Haleakala, demonstrates that (230Th/238U) in Hawaiian lavas is correlated with the overall extent of melting in the mantle source inferred from the major and trace element chemistry of the lavas [8]. This correlation provided definitive evidence that U-Th fractionation is related to the melting process, at a time when the origins of (230Th/238U) disequilibria in magmatic systems, particularly in MORB, were debated. Additionally, this conclusion was contemporaneous with early partitioning studies [58,59,61] showing that (230Th/238U) excesses can be produced by melting in the presence of garnet. And, unlike MORB, whose initial depth of melting has been debated (e.g., [166]), the conclusion that OIB are generated by melting of garnet-bearing mantle source rocks makes sense because the thickness of the oceanic lithosphere beneath ocean islands and the likely higher mantle temperature both require higher average depths of melting.
In contrast to (230Th/238U), (226Ra/230Th) disequilibria in Hawaiian shield stage tholeiites are much larger, with 226Ra excesses ranging from 7 to 15% [19,160,161,164,165]. For alkalic lavas from Hualalai and Haleakala, 226Ra excesses are even greater, up to 30% [19,37]. In Hawaiian lavas, (231Pa/235U) suggests even greater extents of parent-daughter fractionation, with 231Pa excesses ranging from 10 to 15% for tholeiitic lavas from Kilauea, Mauna Loa, and Kamaʻehuakanaloa, and up to 78% for the basanitic lavas from Haleakalā [19,167]. Like (230Th/238U), the magnitude of the 235U-231Pa disequilibria correlates with the major and trace element chemistry of the lavas, and, by inference, the fraction of melting in their mantle source and/or the isotopic enrichment of the source.
While it can be shown that 238U-230Th and 235U-231Pa disequilibria in Hawaiian lavas are mainly sensitive to melt fraction because of the long half-lives of 230Th and 231Pa [8,9,19], interpretation of 226Ra, because of its much shorter half-life, requires dynamic and chromatographic melting models that consider the timescales of melt generation and melt extraction (e.g., [12,14]). Sims et al. [19] showed that 238U-230Th-226Ra and 235U-231Pa disequilibria in Hawaiian lavas coupled with forward time-dependent models (dynamic and porous flow) can provide model-constrained estimates of porosity, melt transport times, and solid mantle upwelling rate within the melting Hawaiian plume. As discussed earlier, during ingrowth melting processes 238U-230Th-226Ra and 235U-231Pa disequilibria are uniquely sensitive to melting rates and porosities.
This variability in the solid mantle upwelling structure of the Hawaiian plume from the center to its leading and trailing edges was critical to further solidify the existence of mantle plumes (Figure 21). While there had previously been considerable evidence for the existence of a deep-rooted mantle plume beneath Hawaii, few studies constrained the nature of the melting region and the dynamics of the plume from both geophysical and geochemical observations. Watson and McKenzie [150] used an axisymmetric plume model to calculate the melt production rate and bulk major and trace element chemistry of magmas, but they did not account for the spatial and compositional variability seen in the chemistry of erupted lavas, nor did they consider the possible effects of the overriding Pacific plate on underlying plume dynamics. Richardson and McKenzie [18] used the plume models developed by Watson and McKenzie [150] to calculate the effects of plume upwelling on U-series disequilibria in partial melts and infer the melting rate (which, in turn, is related to the solid mantle upwelling rate) and porosity of the melting region. However, because there was very little U-series data from volcanoes other than Kilauea and Mauna Loa, they could not correlate spatial variations in the U-series disequilibria along the plume track with the dynamics of the plume. With a larger data set available, Sims et al. [19] mapped the spatial variation of U-series data in young lavas from the center of the inferred Hawaiian plume to its fringes, demonstrating that solid mantle upwelling rates are highest in the plume center and lowest at its leading and trailing edges (Figure 21). The calculated U-series upwelling rates are comparable to upwelling velocities calculated from the axisymmetric plume models of Watson and McKenzie [150] and Hauri et al. [99], but the U-series upwelling rates also suggest an asymmetry not predicted by prior plume models. In particular, the interpretation that solid mantle upwelling is slightly greater beneath Kamaʻehuakanaloa (the leading edge) than Hualalai and Haleakala on the trailing side appears more consistent with the plume model of Ribe and Christensen [168], which considers the influence of the overriding Pacific Plate on the plume’s upwelling dynamics. Later studies [37,165,169] support the interpretations of Sims et al. [19] with further measurements of Kilauea, Kamaʻehuakanaloa, and Haleakala.
Subsequent work by Kokfelt et al. [143] and Bourdon et al. [153] showed similar variations in the activities of (230Th/238U) and (231Pa/235U) when plotted as a function of the distance from the centers of the Azores and Iceland hotspots. However, these later studies do not consider the type of variations in upwelling that result from plume-lithospheric interaction that has been suggested for Hawaii [19,144].
U-series disequilibria to understand global hotspot buoyancy flux
Chabaux and Allègre [170] showed a broad correlation between (230Th/238U) and (226Ra/230Th), which they argued was due to variations in the degree of mantle melting. However, this correlation can also be interpreted as a product of variations in hot spot buoyancy flux as estimated by Sleep [28,144,153,171].
Bourdon et al. [153] demonstrated an apparent link between the buoyancy flux (B) of a hotspot (defined as the product of the speed, the cross-sectional area, and the density anomaly of the upwelling) and the upwelling velocity determined from time-dependent melting models when compared with measured (230Th/238U) and (231Pa/235U). From the data and calculations of Bourdon et al. [153], the range of buoyancy fluxes (B) found in mantle plumes is 0.5 to 1 Mg s-1 for hotspots like Afar and Iceland and up to between 3.5 and 9 Mg s-1 for Hawaii, depending on how the buoyancy flux is calculated (Ribe [172] or Sleep [171], respectively). The range in (230Th/238U) varies from ~1.4 (Afar) to ~1.08 (Hawaii) and the range of 231Pa/235U varies from ~1.4 (Afar) to ~1.08 (Hawaii) [153].
Figure 21. Solid mantle upwelling rate calculated from 238U-230Th-226Ra and 235U-231Pa disequilibria versus the radial position of the volcanoes relative to the center of the Hawaiian plume. The center of the plume (inset) is located so that the active volcanoes Loihi, Kilauea, and Mauna Loa are positioned appropriately for their model ages and eruption rates [173]. Also shown are the model curves for solid mantle upwelling from Watson and McKenzie [150], Hauri et al. [99], and Jull and Ribe [174]. The model of Watson and McKenzie [150] assumes a constant viscosity across the plume, whereas the Hauri et al. model incorporates a temperature-dependent viscosity. The upwelling rates from the plume model of Jull and Ribe [174] take into account the effect of motion of the Pacific plate and depletion buoyancy on the dynamics of the plume, whereas the calculations of Hauri et al. [99] and Watson and McKenzie [150] do not. The 230Th and 231Pa data show a clear asymmetry in upwelling velocity, which is evident in the results of Jull and Ribe [174]. These estimates will need to be refined with more accurate values for distribution coefficients and better models for melt productivity, but they nevertheless illustrate that U-series disequilibrium isotopic data may provide a much-needed constraint on the dynamics of plumes.
Preprints 184447 g021
However, it should be noted that the Samoan data presented in Sims and Hart [175] and Sims et al. [35] show that for age-constrained samples with 226Ra excesses, (230Th/238U) = 1.02-1.13 and (231Pa/235U) = 1.05-1.33 are both low given the hotspot’s estimated buoyancy flux [171,172]. These Samoan data change the apparent form of the Bourdon et al. [153] correlation, making it much more hyberbolic than previously estimated and implying a higher excess potential temperature anomaly in the plume-generating boundary layer. Alternatively, the buoyancy flux for Samoa may be significantly underestimated, as Samoa sits adjacent to a complicated tectonic regime (the Tonga subduction) [35,175].
Two important shortcomings of this approach, namely making global comparisons of U-series disequilibria in hotspot lavas with calculated hotspot buoyancy flux, are 1) that because they do not integrate across the whole plume [171,172] the calculated buoyancy fluxes could be significantly biased; and 2) these generalized comparisons do not consider the local influence of the motion of the overriding plate [19,172]. For example, in hotspots like Hawaii where the motion of the overriding Pacific plate influences the upwelling rate [19,144,171], the extent of U-series disequilibria in young lavas varies from Kilauea to Haleakala, with (230Th/238U) ranging from 1.02 (Kilauea) to 1.3 (Haleakala) and (231Pa/235U) from 1.3 (Kilauea) to 2.2 (Haleakala). This spans the entire range of (230Th/238U) for all plumes across the entire global correlation shown in Bourdon et al. [153]. While it is important to note that this range in Hawaiian (230Th/238U) disequilibria is considered in the error bars shown for Hawaii, such simple 1D calculations are necessarily only first-order approximations and fraught with uncertainty. A full understanding of how U-series measurements are related to hotspot buoyancy flux requires integrating those measurements across a whole plume section and then incorporating the influence of the motion of the overriding plate on the underlying upwelling plume [168], and also accounting for complicating factors such as source heterogeneity and melt transport times.

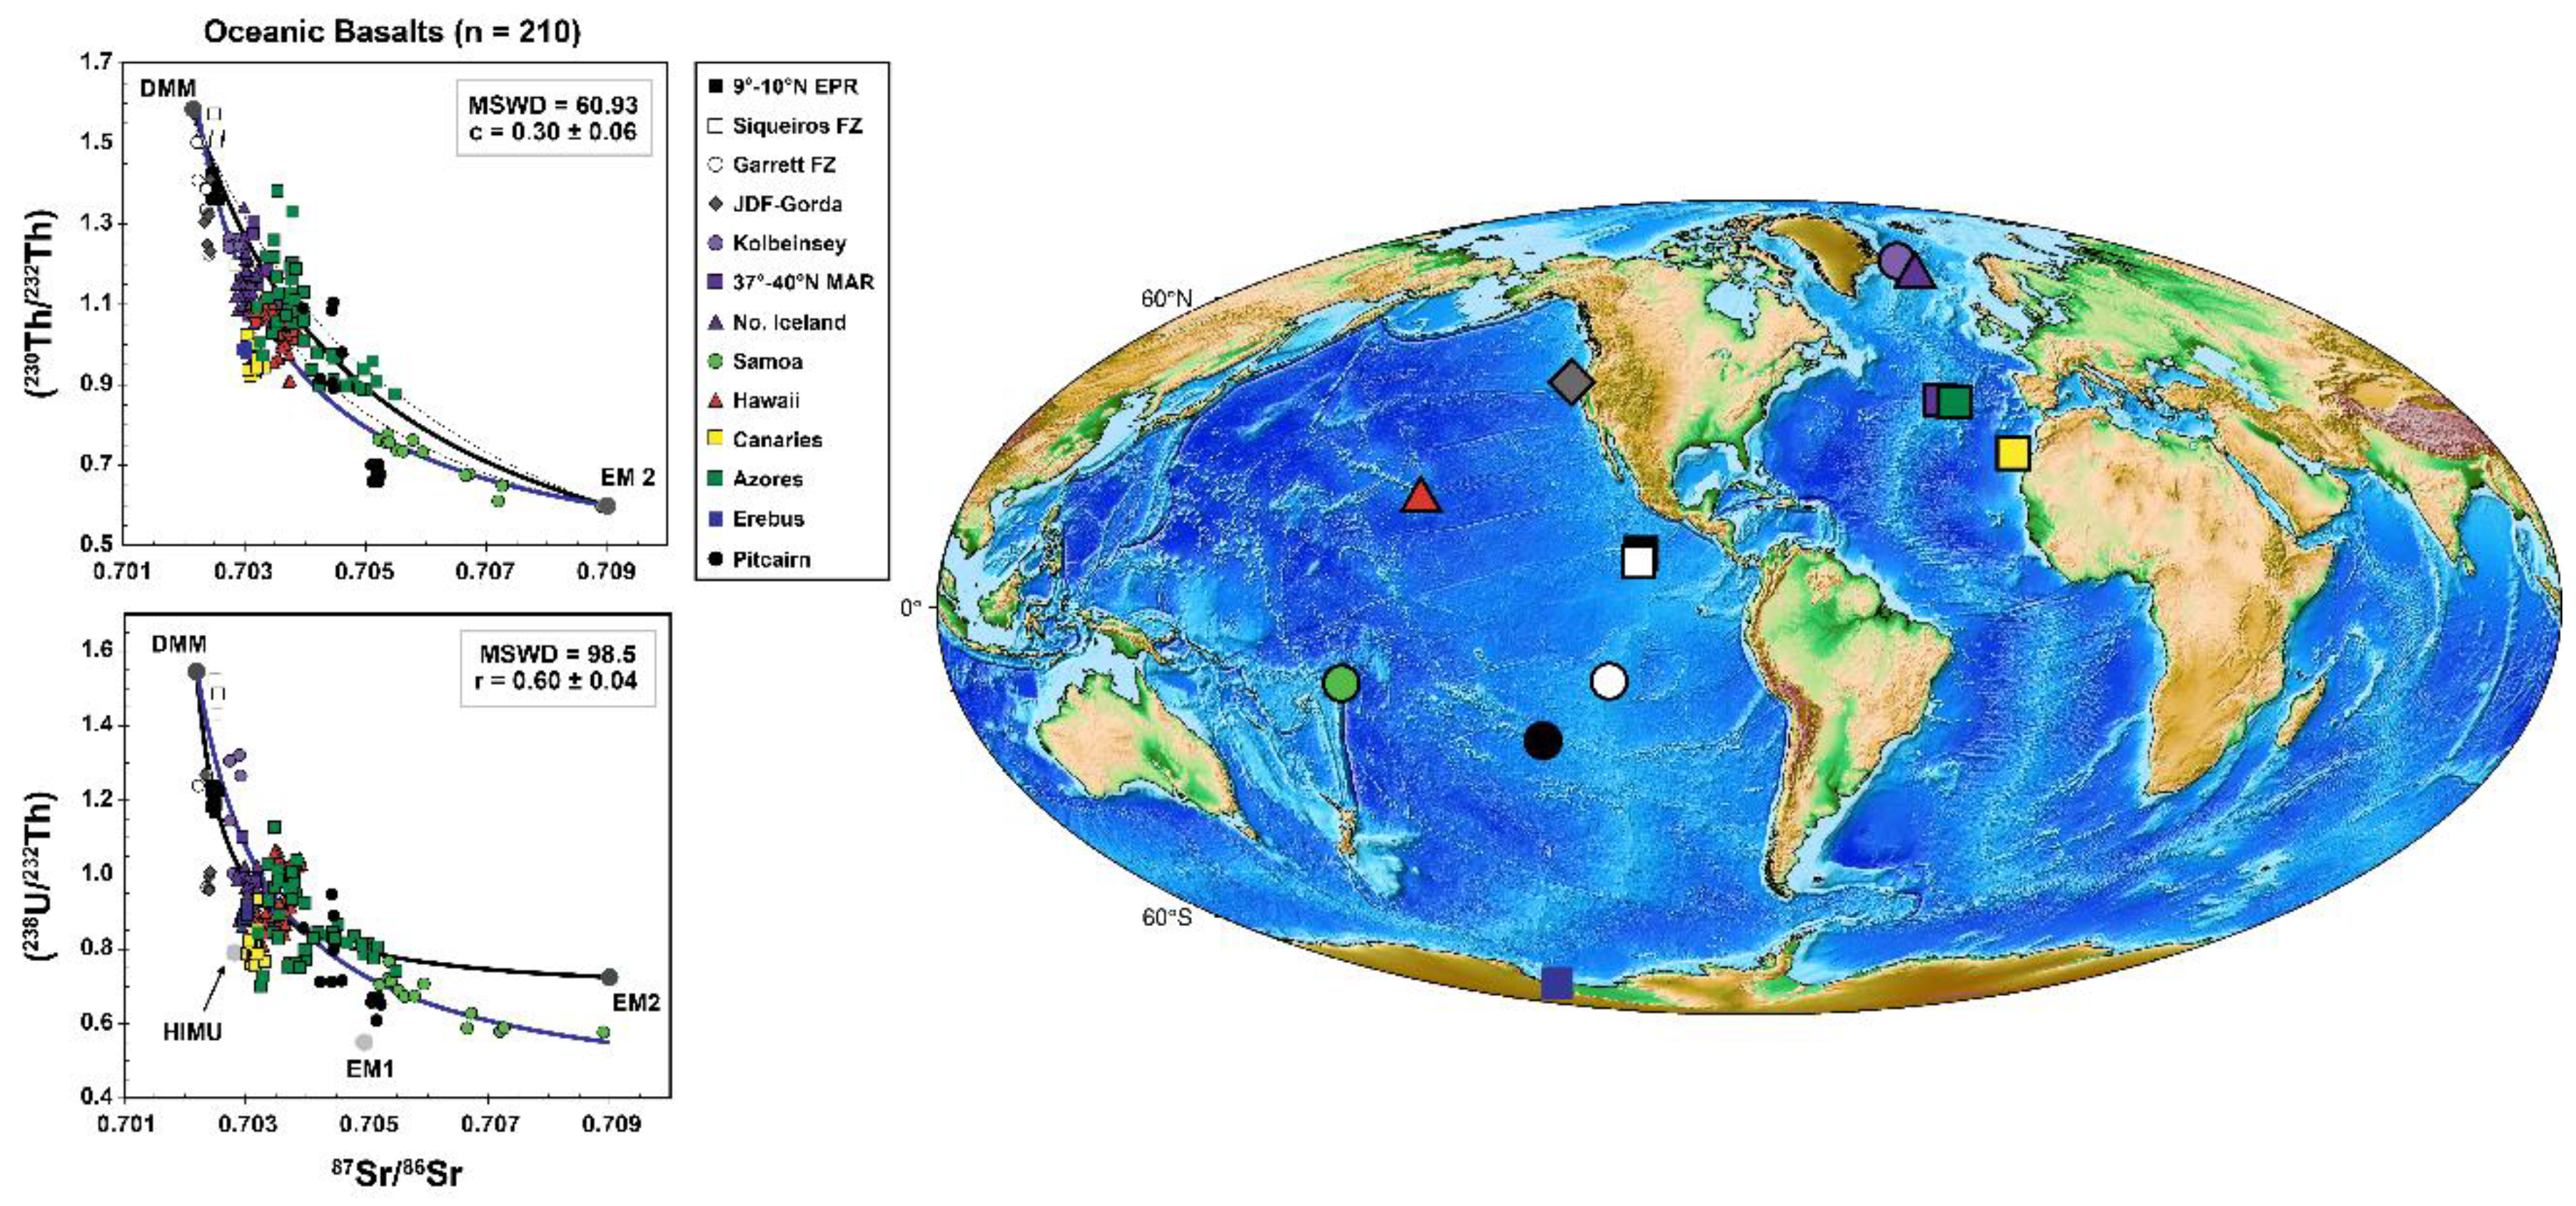
3.8. Global Correlations of U-Th Disequilibria with Radiogenic Isotopes in OIB and MORB

An important advance in our understanding of the Earth’s mantle was the recognition that mid-ocean ridge and ocean island basalts have distinct radiogenic isotopic ratios that result from partial melting of different mantle sources, which mix to form a mantle array, consisting of a depleted end-member and an enriched end-member [176]. As the science of mantle isotope dynamics developed, both through the addition of more isotope systems and the measurement of many more samples across the ocean basins, the number of required enriched end-members has increased significantly, leading to multiple proposed mixing end-members (DMM, HIMU, EM1 and EM2), primarily distinguished by differences in the three Pb isotope systems (206Pb/204Pb; 207Pb/204Pb and 208Pb/204Pb) and producing what is now known as the mantle tetrahedron (e.g. [177,178,179], and references therein). In the decades since, extensive measurements of radiogenic isotope and trace element compositions in hotspot lavas have led to a very large, multi-dimensional global data set, leading to an expanded determination of end-member compositions as greater statistical distributions have been achieved. Likewise, updated models for magma generation, transport, and mixing in a complex mantle regime have produced a more nuanced understanding of what information oceanic lavas record (e.g., [180,181]), and more sophisticated statistical treatments have explored what structures are contained in the multi-dimensional global data set [182].
While radiogenic isotope compositions in lavas have been pivotal in defining our understanding of global mantle heterogeneity, they only track ancient mantle processes. Radiogenic isotope tracers of Sr, Nd, Hf, and Pb have parent half-lives of 0.7–106 Gyr and respond to changes in parent/daughter ratios (Rb/Sr, Sm/Nd, Lu/Hf, U/Pb, Th/Pb) over timescales comparable to mantle convection times. In contrast, the 238U- 230Th isotopic system is intrinsically different in two important ways: first, the half-life of daughter isotope 230Th is only 75 ka; secondly, the abundance of 230Th relative to parent 238U is determined by the radioactive principles governing U decay-series systematics (Section 2 above). As a result, after about 375 ka, the Th isotopic composition of a mantle source for partial melts directly reflects its 238U/232Th source ratio. Thus, comparison of (230Th/232Th), (238U/232Th), and (230Th/238U) with longer-lived radiogenic isotopes (e.g., 87Sr/86Sr) and their record of longer-lived processes can provide fundamental insights into both the nature and evolution of Earth’s mantle sources and the modes of melt generation and magma transport.
Some of the earliest comparative studies of U-series disequilibria and radiogenic isotopes in oceanic settings were made by Allègre and Condomines [7], who compared a small number of U-series measurements to 87Sr/86Sr isotopes in lavas from a limited number of MORB and OIB, using counting techniques. They qualitatively argued that there is a much better inverse linear correlation between (230Th/232Th) and 87Sr/86Sr than between (238U/232Th) and 87Sr/86Sr. They concluded that (230Th/232Th) in a lava better represents the original mantle source (238U/232Th) composition compared to (238U/232Th), which they posited was fractionated by processes in which Th is more incompatible than U. As such, they suggested that (238U/230Th) fractionation was due to time-independent melting, and that all fractionation on a U-Th isochron diagram was due to a horizonal displacement without any change in (230Th/232Th).
Later, using non-linear statistical regression techniques and a much larger oceanic basalt database that included EM2 and HIMU (but not EM1), Sims and Hart [175] examined the relationship between (230Th/232Th), (238U/232Th), and the long-lived isotope ratios of Sr, Nd, and Pb, all measured by mass spectrometric methods (Figure 22). Sims and Hart [175] quantitively demonstrated that: 1) the relationships between (230Th/232Th), (238U/232Th), and the long-lived isotope ratios of 87Sr/86Sr and 143Nd/144Nd can be approximated by two-component mixing; 2) (230Th/232Th) is somewhat better correlated with 87Sr/86Sr and 143Nd/144Nd than 238U/232Th, and 3) the global basalt arrays of (230Th/232Th) and (238U/232Th) compared with Pb isotopic compositions require four mixing components, which correspond to the end-members that define the mantle tetrahedron (DMM, HIMU, EM1 and EM2).
Figure 22. 230Th/232Th versus 87Sr/86Sr diagram for mid-ocean ridge, ocean island, and continental basalts compiled from the literature [8,13,19,20,25,26,27,28,29,30,31,32,33,34,35,36,37,38,39,40,41,42,43,44,45,46,90]. This new data set based on mass spectrometry data shows a hyperbolic rather than a linear trend. If this is interpreted as reflecting a mixing line, it indicates that the Th/Sr ratio in the enriched components (low 230Th/232Th ratios) is greater than the Th/Sr ratio in the depleted component.
Preprints 184447 g022

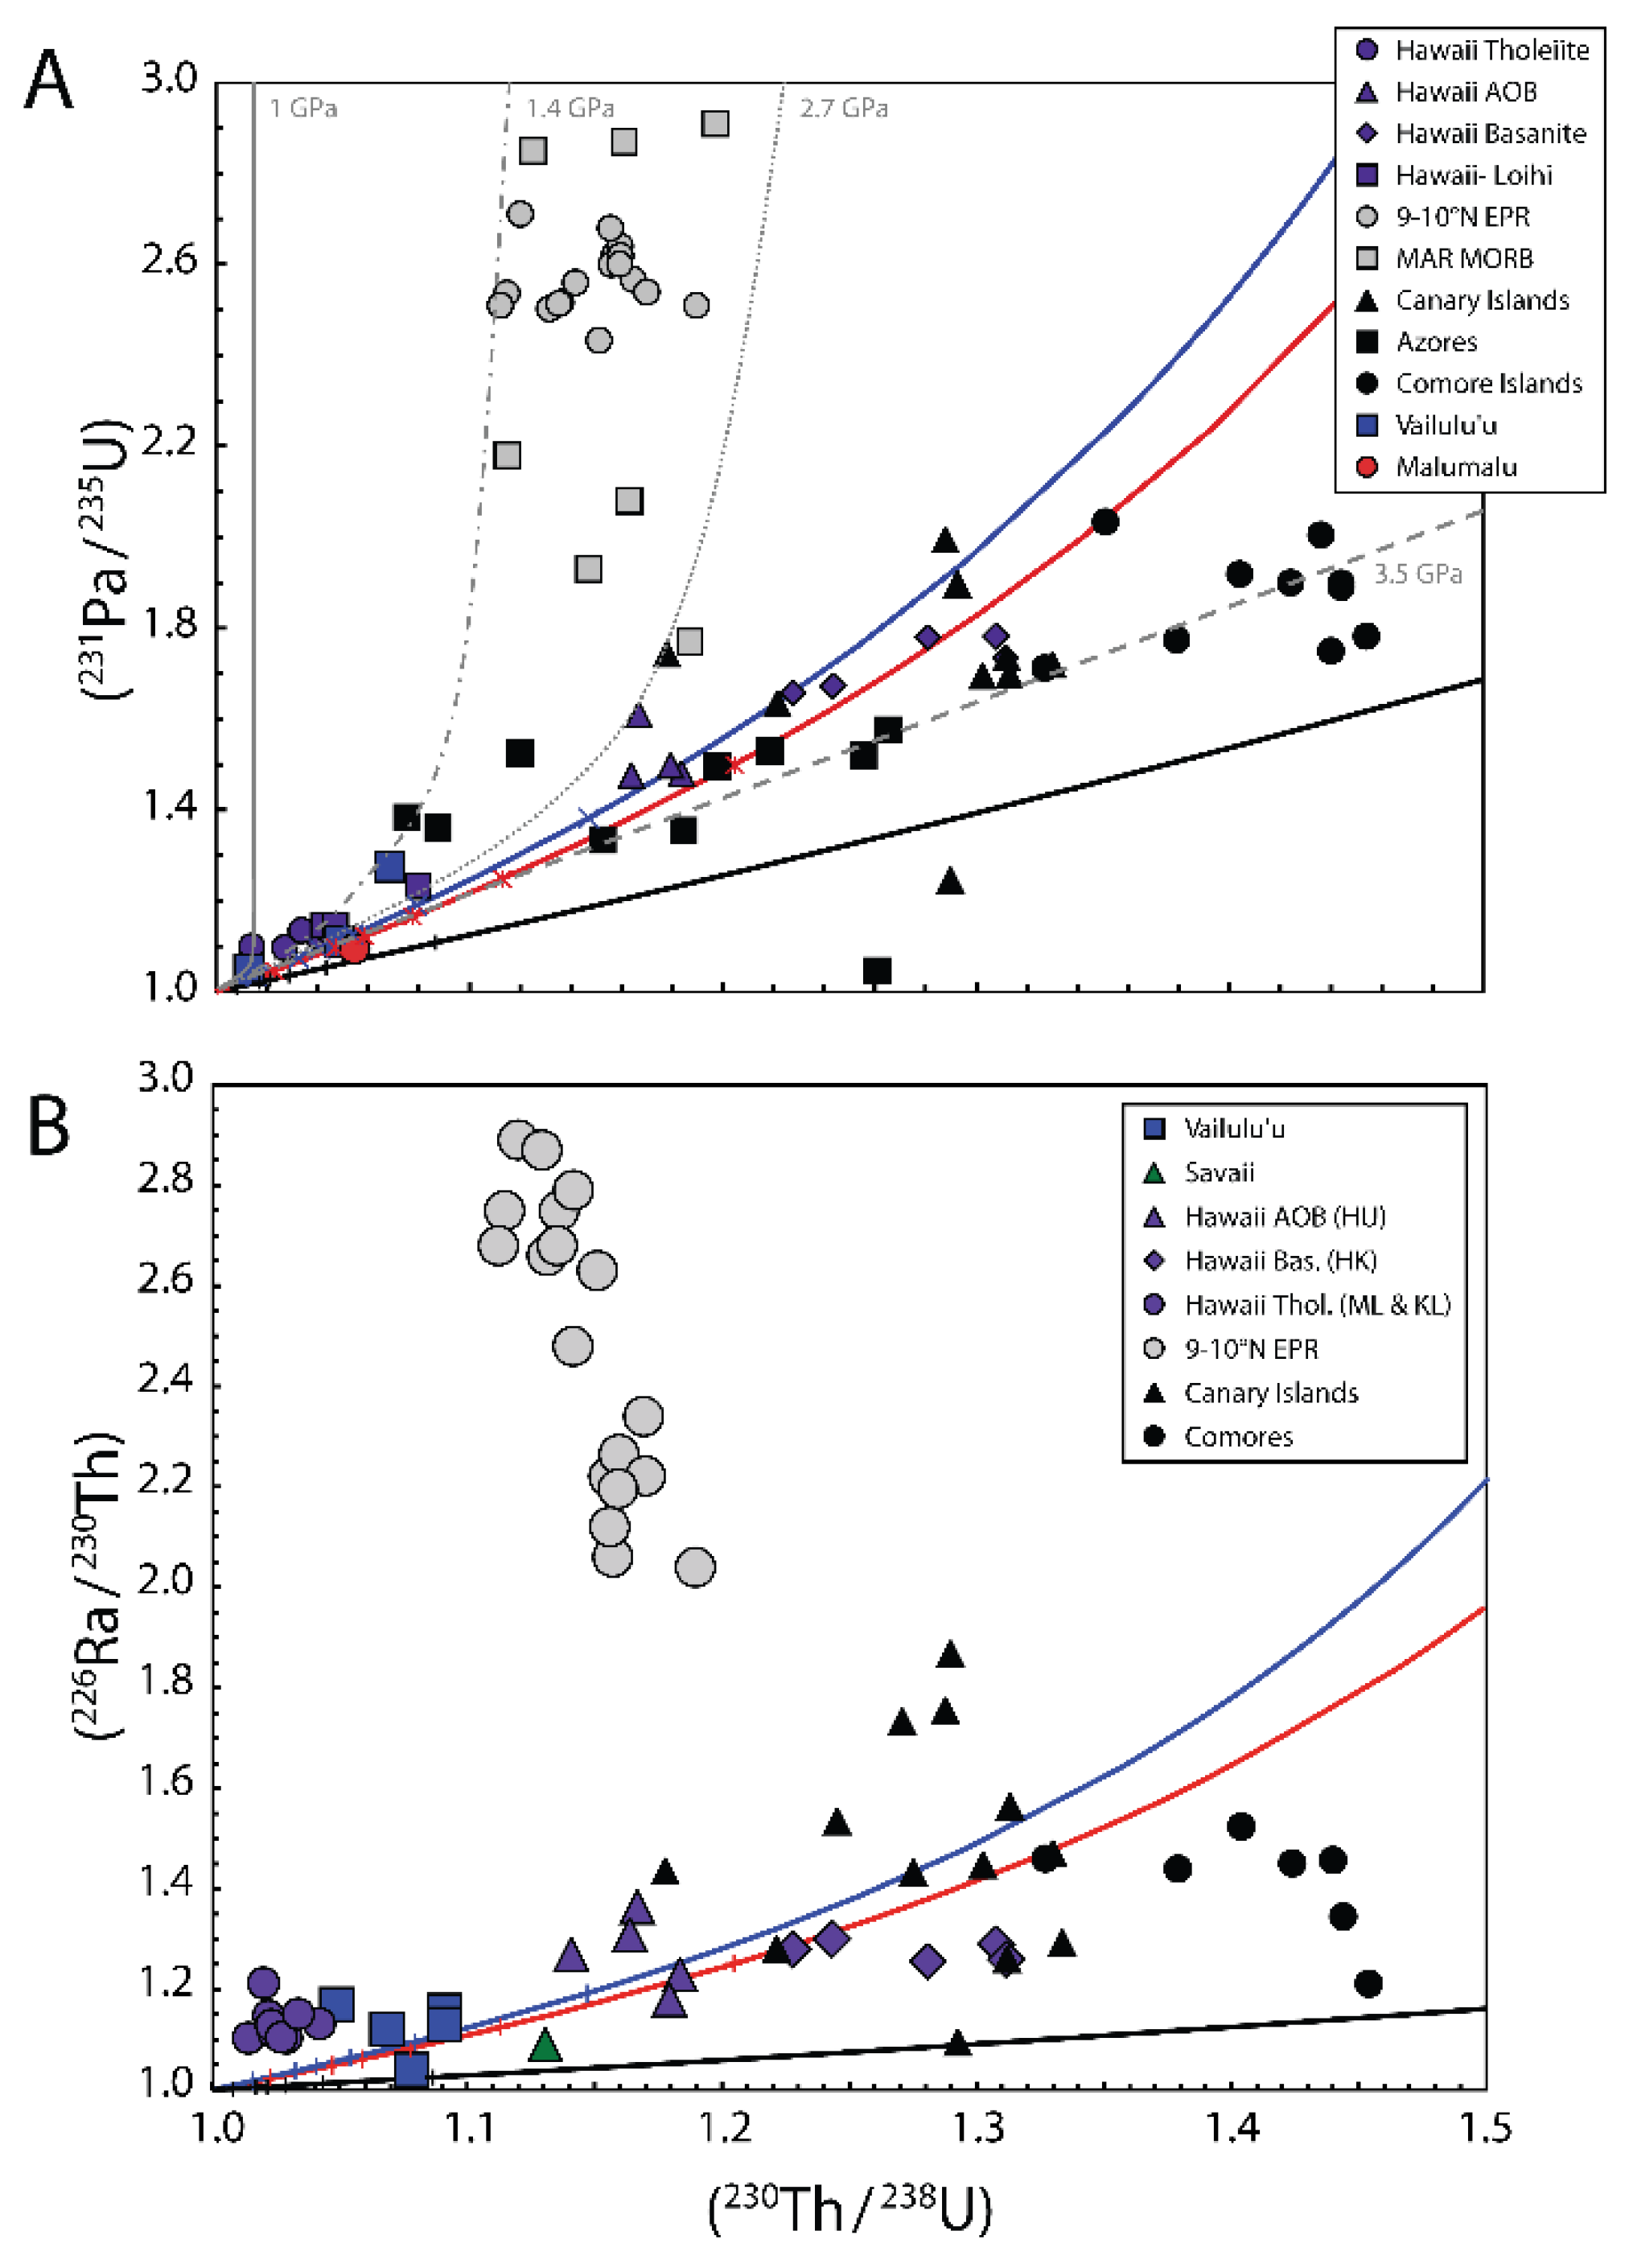
3.9. Average Depths of Mantle Melting from (231Pa/235U) and (230Th/238U) in MORB and OIB

Correlations between (231Pa/235U) and (230Th/238U) in MORB and OIB can provide important constraints on the mineralogy and melting behavior of the melting mantle source. While there have been relatively few U-series studies incorporating 235U-231Pa systematics, considerable information can be gained by incorporating measurements of 235U-231Pa [19,28,145,153,167,183]. Pickett and Murrell [167] observed that in plots of (231Pa/235U) versus (230Th/238U), ocean island basalts define a linear trend that is clearly distinct from the MORB trend. These two trends, which persist with a larger database, are best explained by variable clinopyroxene/garnet ratios in the mantle source, which, in turn, has been interpreted to reflect variation in the initial pressure of melting [19,28,145,153]. Using the partitioning data of Landwehr et al. [63] as a function of pressure with simple batch melting models, the distinction between MORB and OIB (Figure 23) can be explained by a variable clinopyroxene/garnet ratio in the mantle source, which for a peridotitic mantle is determined by the initial pressure of melting [28,35,144]. The OIB data lie along melting trends that are consistent with melting at greater pressures (well below the garnet-spinel transition) with a lower clinopyroxene/garnet ratio, while MORB can be produced by a shallower average depth of melting and are characterized by larger 231Pa excess at a given (230Th/238U).
In a follow-up assessment of the correlations observed in plots of (231Pa/235U) versus (230Th/238U) in OIB, and to assess the mechanisms that control 238U-230Th and 235U-231Pa in lavas, Prytulak and Elliot [145] measured 238U-230Th and 235U-231Pa in lavas from Pico volcano in the Azores. They argued that the young mafic lavas of Pico are products of smaller degrees of mantle melting than MORB, but that due to Pico’s proximity to the Mid-Atlantic Ridge and the thin overlying oceanic lithosphere, their degree of melting was large compared to many other OIB. Albeit tightly clustered, data from the basaltic Pico lavas have surprisingly high extents of disequilibria ((230Th/238U) = 1.18-1.27 and (231Pa/235U) = 1.477-1.504) compared to both young Hawaiian lavas, which as described above include tholeiitic basalts, alkali olivine basalts, and basanites (with (230Th/238U) = 1.02-1.31 and (231Pa/235U) = 1.10-1.78; [19]), and Samoa alkaline basalts ((230Th/238U) = 1.03-1.16 and (231Pa/235U) = 1.05-1.33; [35]). Thus, from these plots it was reasonable to conclude that Pico lavas originate from a mantle source with a low clinopyroxene/garnet ratio and an overall deeper pressure of melting [145]. However, simple batch melting models predict an extent of melting that is unreasonably small (~0.3%). Prytulak and Elliott [145] instead argued that only a fraction of the disequilibria observed in Pico lavas can be produced by net elemental fractionation, and that ingrowth of the daughter nuclides during melting is required to produce the observed 238U-230Th and 235U-231Pa disequilibria.

3.10. A Final Comment on Time-Independent Melting versus Time-Dependent Melting in MORB and OIB

As discussed above, there are two major competing mechanisms for explaining an excess of daughter over parent isotope in a U-series decay chain: 1) time-independent melting models, which rely entirely on elemental fractionation of a parent-daughter nuclide pair; and 2) time-dependent melting models in which ‘ingrowth’ of daughter nuclides provides an alternative method to producing U-series excesses [12,14]. In all cases, MORB, because of their low upwelling rates during melting, require daughter nuclide ingrowth to produce 238U-230Th, 235U-231Pa, and 230Th-226Ra disequilibria. However, in OIB, there are cases, such as the main stage of Hawaii, where the inferred upwelling rate is very fast compared to daughter nuclide ingrowth of 230Th and 231Pa and where it is highly likely that elemental fraction of Th/U and Pa/U is the dominant mechanism for 238U-230Th and 235U-231Pa disequilibria. In contrast, there are also hotspots, such as Pico in the Azores, where rates of upwelling are small enough that ingrowth of daughter nuclides is required to produce the observed 238U-230Th and 235U-231Pa disequilibria [145]. In yet other places, such as Samoa, the Galapagos, and Pitcairn, the generation of disequilibria appears to lie along a continuum, where both ingrowth and elemental fractionation of U/Th and U/Pa contribute to measured (238U/230Th) and (235U/231Pa) in lavas. As such, it is critical that, before interpreting any U-series disequilibria in lavas, one examines the data in the context of other major and trace element information, as well as the geological and tectonic setting [9]. In contrast, because of the much shorter half-life of 226Ra, ingrowth is necessary to produce 230Th-226Ra disequilibria in all cases.
Figure 23. (230Th/238U) versus (A) (231Pa/235U) and (B) (226Ra/230Th) for a compilation of OIB and MORB data compared with simple batch melting models. The DU, DTh, and DPa values and respective color schemes for the different lines are the same as given in Figure 20, except for DRa, which is held constant and assumed to be 4E-5 in all cases. Also shown in (A), are the recent partitioning data of Landwehr et al. [63] as a function of pressure (light grey curves). As discussed in Bourdon and Sims [144], the distinction between MORB and OIB can be explained by a variable cpx/garnet ratio in the mantle source, determined by the initial pressure of melting. The OIB data lie along melting trends that are consistent with melting at a pressure above the garnet-spinel transition and having a low cpx/garnet ratio. In contrast, MORB can be produced by a shallower average depth of melting and are characterized by larger 231Pa excesses at a given 230Th/238U. In (B), the 226Ra excesses for all OIB are smaller than MORB and also tend to be positively correlated. For MORB, the only data set whose age are known to be young relative to the half-life of 226Ra are from 9-10°N EPR [20]. These MORB samples show an inverse correlation between 230Th excess, 226Ra excess (as well as major and trace element compositions) which was interpreted as mixing of two types of melt: one having a high-230Th component equilibrated with deep, undepleted garnet peridotites (> 70 kms); the other having a high-226Ra component preserving characteristics indicative of equilibration with highly depleted, residual harzburgite in the uppermost spinel-facies mantle (< 70 kms) [114].
Preprints 184447 g023

4. Principles and Applications of U and Th Decay Series for Dating Eruptions of Unknown Age Lavas

Because of their wide-ranging half-lives, U and Th decay series nuclides offer an important set of tools for dating volcanic activity on timescales from weeks up to about three hundred and seventy-five thousand years. The fundamental premise of the U- and Th-series geochronometers is that chemical processes fractionate parent-daughter pairs within a decay series. This parent-daughter system returns to a state of ‘secular’ equilibrium (i.e. λ 1 N 1 = λ 2 N 2 ) over a period directly proportional to the daughter isotope’s half-life (Figure 24). The typical range of disequilibria depends on the half-life of the daughter isotope and is limited by measurement uncertainties, but in most cases the determinable age limit on these techniques is about five times the half-life of the daughter isotope.
The simplest geochemical scenario is when the chemical fractionation of the parent-daughter ratio is instantaneous. That is, the event occurs over a short timespan relative to the half-life of the parent-daughter isotope system being considered. Other, more complex situations include continuous or episodic fractionation; deconvolving these types of multifaceted scenarios introduces additional variables and uncertainty. In many geological circumstances, the elemental fractionation creating the disequilibrium between parent-daughter pairs can reasonably be considered to be instantaneous relative to the half-life of the daughter isotope (e.g. 230Th, t1/2 = ~75 kyr). In contrast, in shorter-lived parent-daughter systems, the chemical fractionation process might be occurring over a timeframe that is either similar to (e.g., 226Ra, t1/2 = 1.6 kyr), or even longer than, five times the isotope’s half-life (e.g., 228Ra, t1/2 = 5.77 a, or 222Rn, t1/2 = 3.85 d).
Figure 24. Schematic of decay of 230Th, 226Ra, and 210Pb in the melt and ingrowth in the mantle residue after a fractionation event occurring at t1. Inset shows the short-lived excess of 210Pb. Approximate valid range of U-Th and Th-Ra dating methods are given at the bottom in kyr.
Preprints 184447 g024
Elemental fractionation between a parent-daughter activity ratio is required to start a chronometer. Then, once elemental fractionation for the parent-daughter system ceases, that chronometer/activity ratio returns to equilibrium at a rate proportional to the various progenies’ half-lives. The half-life of the longest-lived daughter of a decay chain is the ultimate determinant of when full equilibrium is attained throughout the decay chain. Thus, this final state of equilibrium occurs after ~1.5 Ma for the 238U-series, (based on five times the half-life of 234U); ~200 ka for the 235U-series (based on five times the half-life of 231Pa); and ~35 a for the 232Th-series (based on five times the half-life of 228Ra). Once in equilibrium, the decay series chronometers cease to provide temporal information. In this regard, it is important to note that once the whole decay chain is in radioactive equilibrium, the final daughter Pb isotope in-grows at a rate proportional to the half-life of its ultimate U or Th parent. As such, the initial fractionations that occurred among the decay chain nuclides have no subsequent effect on the results of 238U-206Pb, 235U-207Pb, and 232Th-208Pb chronometers when applied to timescales on the orders of millions to billions of years (i.e. deep time). Note, however, that significant initial disequilibrium between 238U, 234U, and 230Th or 235U and 231Pa can measurably affect ages for geochronometers involving 206Pb or 207Pb near the lower limit of their useful age ranges (e.g., [184]).
Igneous processes efficiently fractionate daughter nuclides from longer-lived parents in the U and Th decay series. This elemental fractionation, coupled with the U and Th decay series systematics, provides a wide array of U and Th decay series chronometers with meaningful age resolution for igneous systems (Figure 2 and Figure 24).
Because of the short half-lives of the daughter isotopes, it is reasonable to assume that, prior to partial melting, U-series isotopes in a lava’s mantle or crustal source were in secular equilibrium (i.e., the activities of the parent and daughter isotopes were equal). Partial melting chemically fractionates parent-daughter elements, creating isotopic disequilibria. These disequilibria subsequently decay back to equilibrium at a rate proportional to the half-lives of the daughter isotopes. Later magmatic processes such as crystallization, assimilation, and magma degassing can also induce parent-daughter elemental fractionation, which can augment or overprint the melting-induced disequilibria.
Importantly, regardless of how the parent-daughter disequilibrium is created during a lava’s genesis and evolution, and in the absence of ongoing secondary chemical alteration, once the lava has erupted and solidified, fractionation of the parent-daughter nuclides ceases (Figure 24).
The most common parent-daughter pairs used for determining the ages of volcanic rocks are within the 238U decay chain, namely 238U-230Th, 230Th-226Ra, 226Ra-210Pb, and 210Po-210Pb. A few studies have used 235U-231Pa, and even fewer have used 232Th-228Ra or 231Pa-227Ac (see Sims et al. [89] as the only study that considers all of these parent-daughter nuclide pairs in igneous systems). A summary of pertinent U-series nuclides, including relative atomic abundances, half-lives, and decay constants, is provided in Table 1.
Dating of crystallization or eruption of igneous rocks using measurements of disequilibria among parent-daughter pairs in the U and Th decay series utilizes four different methods: (i) the presence or absence of U-series disequilibria to establish age limits based on the half-lives of the daughter isotopes; (ii) an internal isochron method, commonly obtained on mineral separates; (iii) an external isochron method, or U- and Th- series model ages, which measure the change in the excesses or deficits of the daughter isotopes relative to an assumed or known initial value; and iv) in the case of continuously recharging and degassing magma systems, modeling the parent-daughter disequilibrium using multiple U and Th decay series progeny.
It is important to note that U-series dating provides the best age constraints for dating young submarine basalts. Accurate dating of young (<375 kyr) ocean floor volcanism is an important but problematic issue, with numerous implications for topics ranging from understanding crustal construction at mid-ocean ridges to understanding how the various geological, hydrothermal, and biological aspects of the ridge system relate to one another. However, the dating of young oceanic basalts is not trivial; the half-lives of isotopic systems traditionally used for dating basalts, such as 147Sm-143Nd, 87Rb-87Sr, 238U-206Pb, and 176Lu-176Hf, are much too long; K(Ar)-Ar methods suffer from the low abundance of K in most basalts, K uptake from seawater, and/or open system behavior of Ar [185]; and cosmogenic nuclides are not applicable because of cosmic ray attenuation in the water column. Because of the importance of dating young mid-ocean ridge volcanism to the understanding of oceanic crustal construction and a lack of other viable chronometric options, there was considerable early use of U-series measurements to date oceanic basalts (e.g., [186]). Most notable and transformative was the development of mass spectrometric methods for measuring Th isotopes in basalts [187,188,189]. Because of these concerted efforts, U-series dating of ocean floor volcanism is now well established thanks to an important body of work that includes [20,33,35,41,44,45,46,81,90,107,108,110,186,187,189,190,191,192,193,194,195,196].

4.1. Establishing Lava Eruption Age Limits Based on the Presence or Absence of U-Series Disequilibria

The presence or absence of U-series disequilibria can place ‘first-order’ limits on the age of a lava sample, assuming that the disequilibrium was magmatic in origin and not a result of secondary processes.
In the case of mantle melting such as MORB or OIB, the timescale of mantle circulation is on the order of hundreds of millions to billions of years and it can therefore safely be assumed that the mantle source starts with U-series nuclides in a state of radioactive equilibrium. During petrogenetic processes, most significantly during partial melting, U-series disequilibrium is created by fractionating parent-daughter nuclide pairs. In the absence of secondary processes (e.g., post-eruptive alteration), any disequilibria generated by magmatic processes are “locked in” once the lava has erupted and solidified. The activity ratio then acts as a “stop-watch”, with parent and daughter returning to secular equilibrium after about five half-lives of the daughter isotope in question. Consequently, disequilibria between a parent-daughter pair provides a maximum eruption age. Since 238U-230Th-226Ra-210Pb have half-lives ranging from ~20 years to 75 ka, these techniques are appropriate for dating MORB erupted from 0.1-375 ka (see Table 4 for list of age limits).
Most, but not all, young lavas of known age exhibit disequilibria amongst parent-daughter ratios. Thus, the absence of disequilibria can imply a lower age limit. However, caution with this approach is warranted, because a lava may never have had disequilibria when it erupted (e.g. [197]). Nonetheless, when multiple U-series age determinants are measured on numerous samples of similar composition from the same volcanic field, comparing the presence or absence of different disequilibria can be used to reasonably infer a sample’s age range. For example, suppose one lava sample from a volcano has significant 238U-230Th, 235U-231Pa, and 230Th-226Ra disequilibria; in that case, 230Th-226Ra isotopic systematics are most constraining, because 226Ra has the shortest half-life, and require the lava to be less than 8 ka, providing it has remained a closed system since eruption. Suppose another sample of similar composition from the same field has 238U-230Th and 235U-231Pa disequilibria, but no 230Th-226Ra disequilibrium; in that case, the sample is less than 160 ka and is ‘likely’ older than 8 ka. Finally, all samples with no 238U-230Th disequilibria are ‘likely’ >375ka, and so forth (Table 4). Examples where multiple nuclides are used in concert to constrain sample ages include Goldstien et al. [189], Sims et al. [35,81], and Waters et al. [45].
Table 4. Age limits of U-series radionuclides.
Nuclide Pair Age Constraint
210Po/210Pb ≠ 1 < 2 yr
210Pb/226Ra ≠ 1 < 100 yr
226Ra/230Th ≠ 1 < 8 kyr
231Pa/235U ≠ 1 < 160 kyr
230Th/238U ≠ 1 < 375 kyr
Additionally, an important and common usage of U-series age constraints is to apply age limits from short-lived nuclides to interpret longer-lived disequilibria in terms of magmatic processes. For example, when a lava of unknown age has significant 226Ra-230Th disequilibria, it is reasonable to assume that the 230Th-238U disequilibria has not been significantly changed by decay and can be interpreted in terms of melting and melt transport processes (e.g. [20,35,43,107,114,186,198]). Similarly, if a solidified lava has significant 210Pb-226Ra disequilibria, then measurements of 226Ra-230Th disequilibria in that lava can also be reasonably interpreted in terms of magmatic processes [35,45,81,101,190,199,200,201].

4.2. Internal Mineral Isochron Method

Internal isochrons make use of the differential retention of certain radionuclides by different minerals (e.g., Ra is preferentially incorporated into feldspar). This technique requires phenocryst-rich samples and is therefore not suitable for MORB glasses. Even when samples contain abundant phenocrysts, the resolution of this method is limited by uncertainties in the phenocryst ages (i.e., have all the phenocrysts resided in the crustal storage time for a significant period relative to the half-life of the daughter nuclide?).
Nonetheless, internal isochrons (typically mineral-mineral or mineral-glass) provide a powerful method to determine the age of crystallization in volcanic rocks (Figure 25). This technique was first applied to U-series dating by Allègre [5] and has since been applied to numerous volcanic settings [7,164,198,202,203,204,205,206,207,208].
Figure 25. Schematic of internal isochrons in (230Th/232Th) versus (238U/232Th) space. Isochrons shown for a zero-age lava and for lavas with ages of one and two half-lives of 230Th. Arrows show directions of Th and U enrichment and subsequent decay toward the equiline, where the activities of 230Th and 238U are in equilibrium.
Preprints 184447 g025
The U-series isochron method is akin to the isochron method applied to long-lived radiogenic systems such as 87Rb/86Sr-87Sr/86Sr (see geochronological chapters in this volume), with one crucial difference: the daughter isotope is radioactive. Nonetheless, and akin to other isotope systems such as 87Rb-87Sr, the U-series Bateman equation of ingrowth and decay (see Eq. 8) is linear when normalized to a stable element and plotted in the appropriate coordinates.
For the 238U-230Th system, 232Th, which has a half-life of 14.01 Gyr, is effectively stable over the half-life of 230Th (<375 Kyr) and is used as a normalizing isotope. For the 230Th-226Ra system, there is no stable, normalizing Ra isotope for 226Ra. Albeit imperfect, stable Ba is typically used as a Ra proxy. 235U-231Pa also lacks a stable, normalizing isotope for 231Pa, and an internal mineral isochron method to the 235U-231Pa system has yet to be used. Lead concentrations can be used as a normalizing factor for a 210Pb-226Ra geochronometer [209]. However, internal isochrons using this technique are commonly non-linear because the timescales of magma differentiation are long with respect to the half-life of 210Pb, and thus, this technique has not been widely applied to dating lavas. In the following subsections, we examine the application of the isochron method to determine the ages of crystallization for both (238U)/(232Th)-(230Th)/(232Th) and (230Th)/Ba-(226Ra)/Ba.

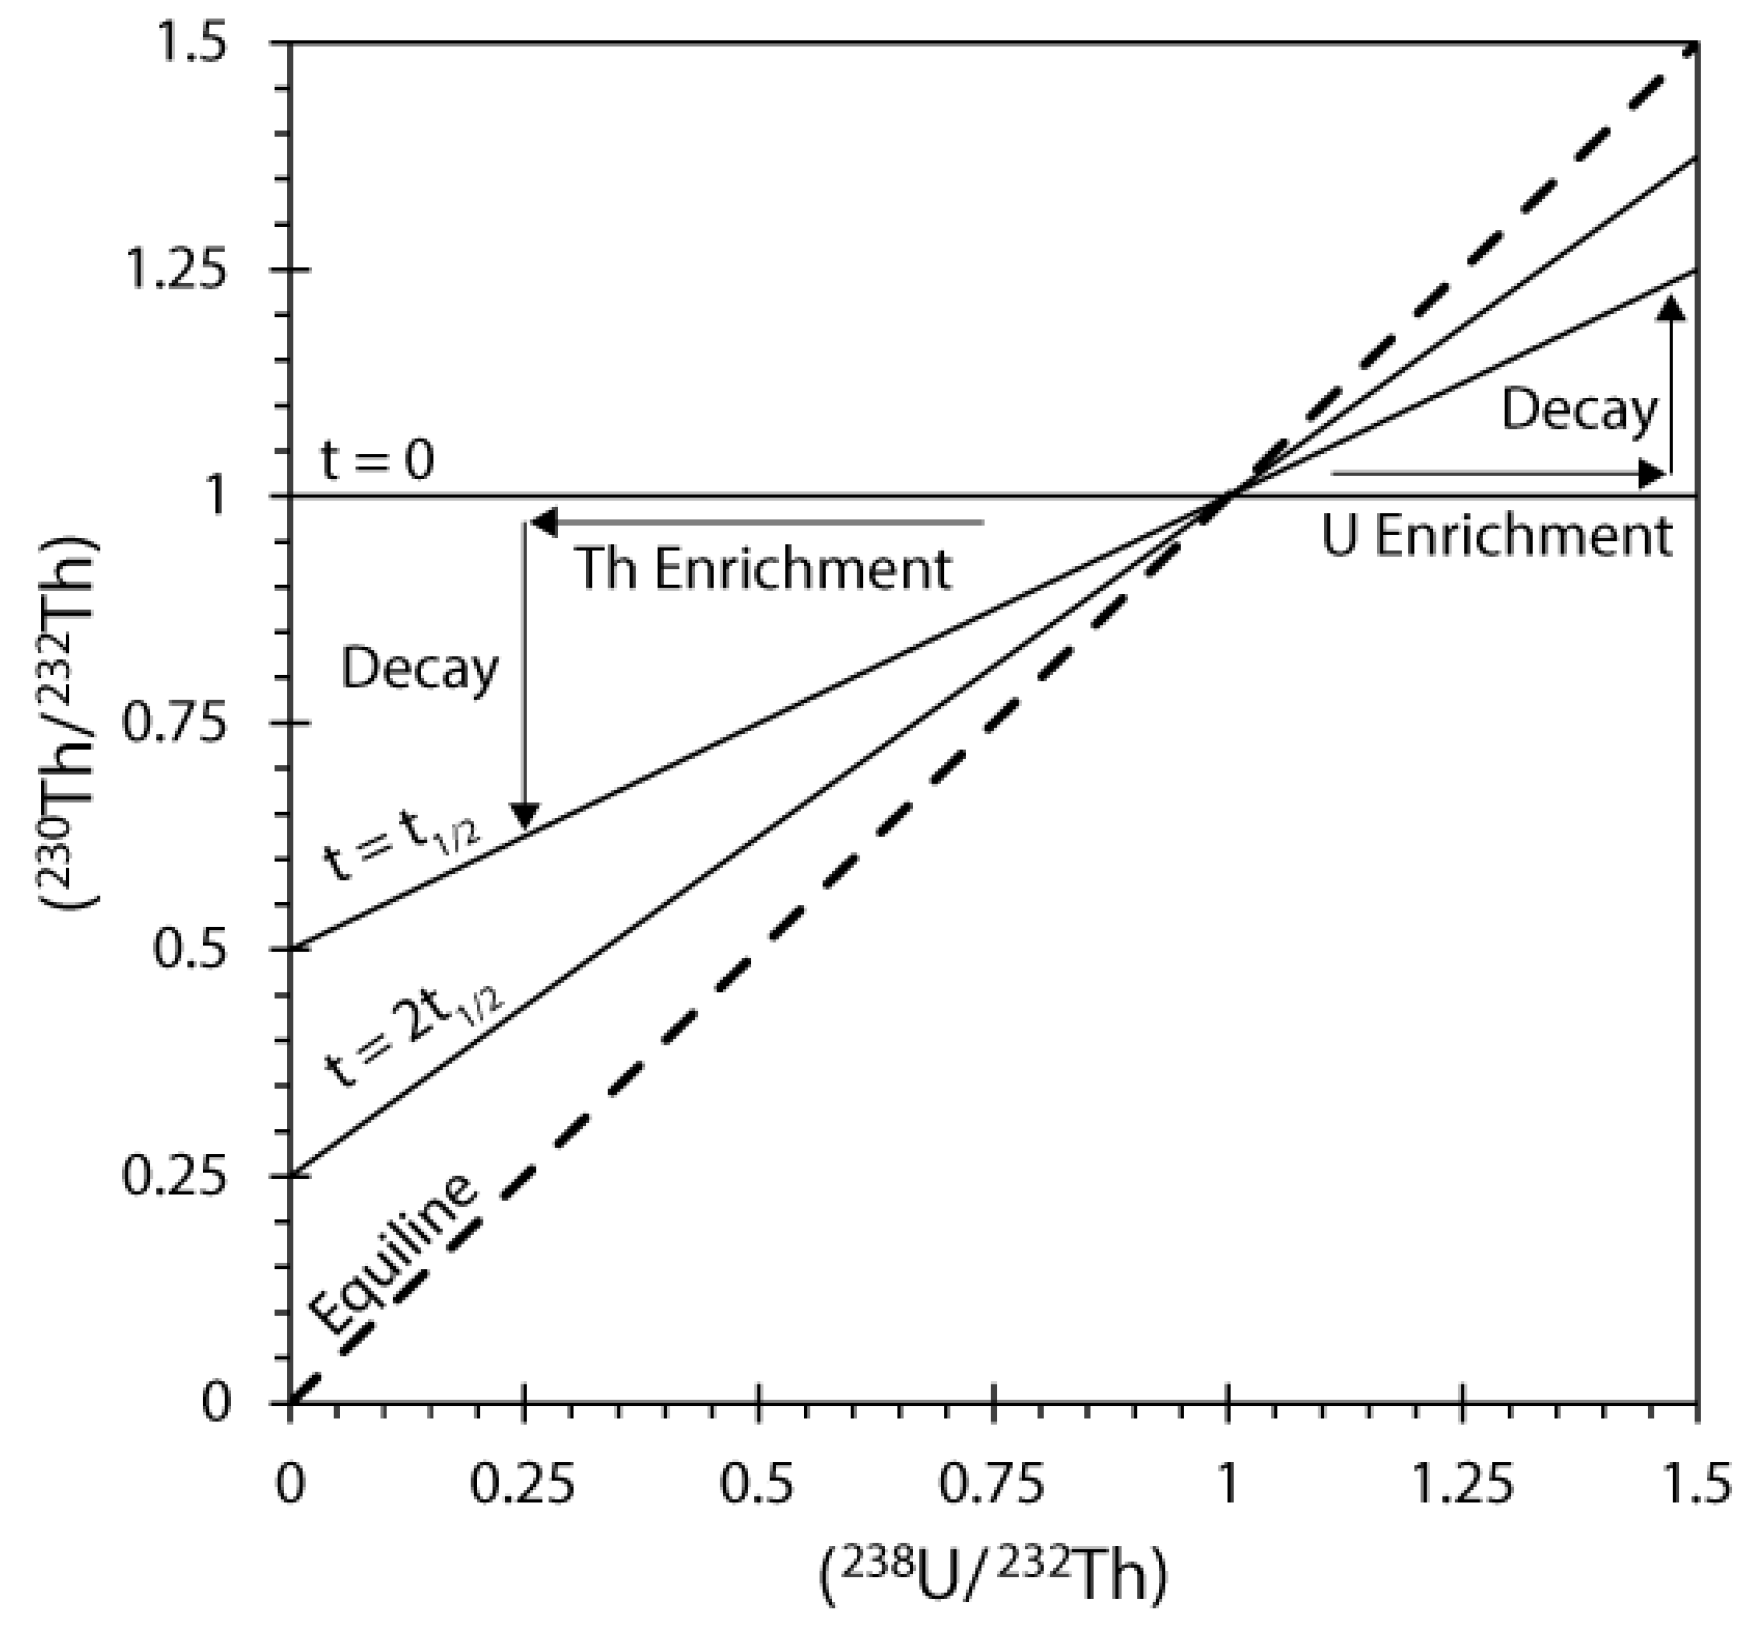
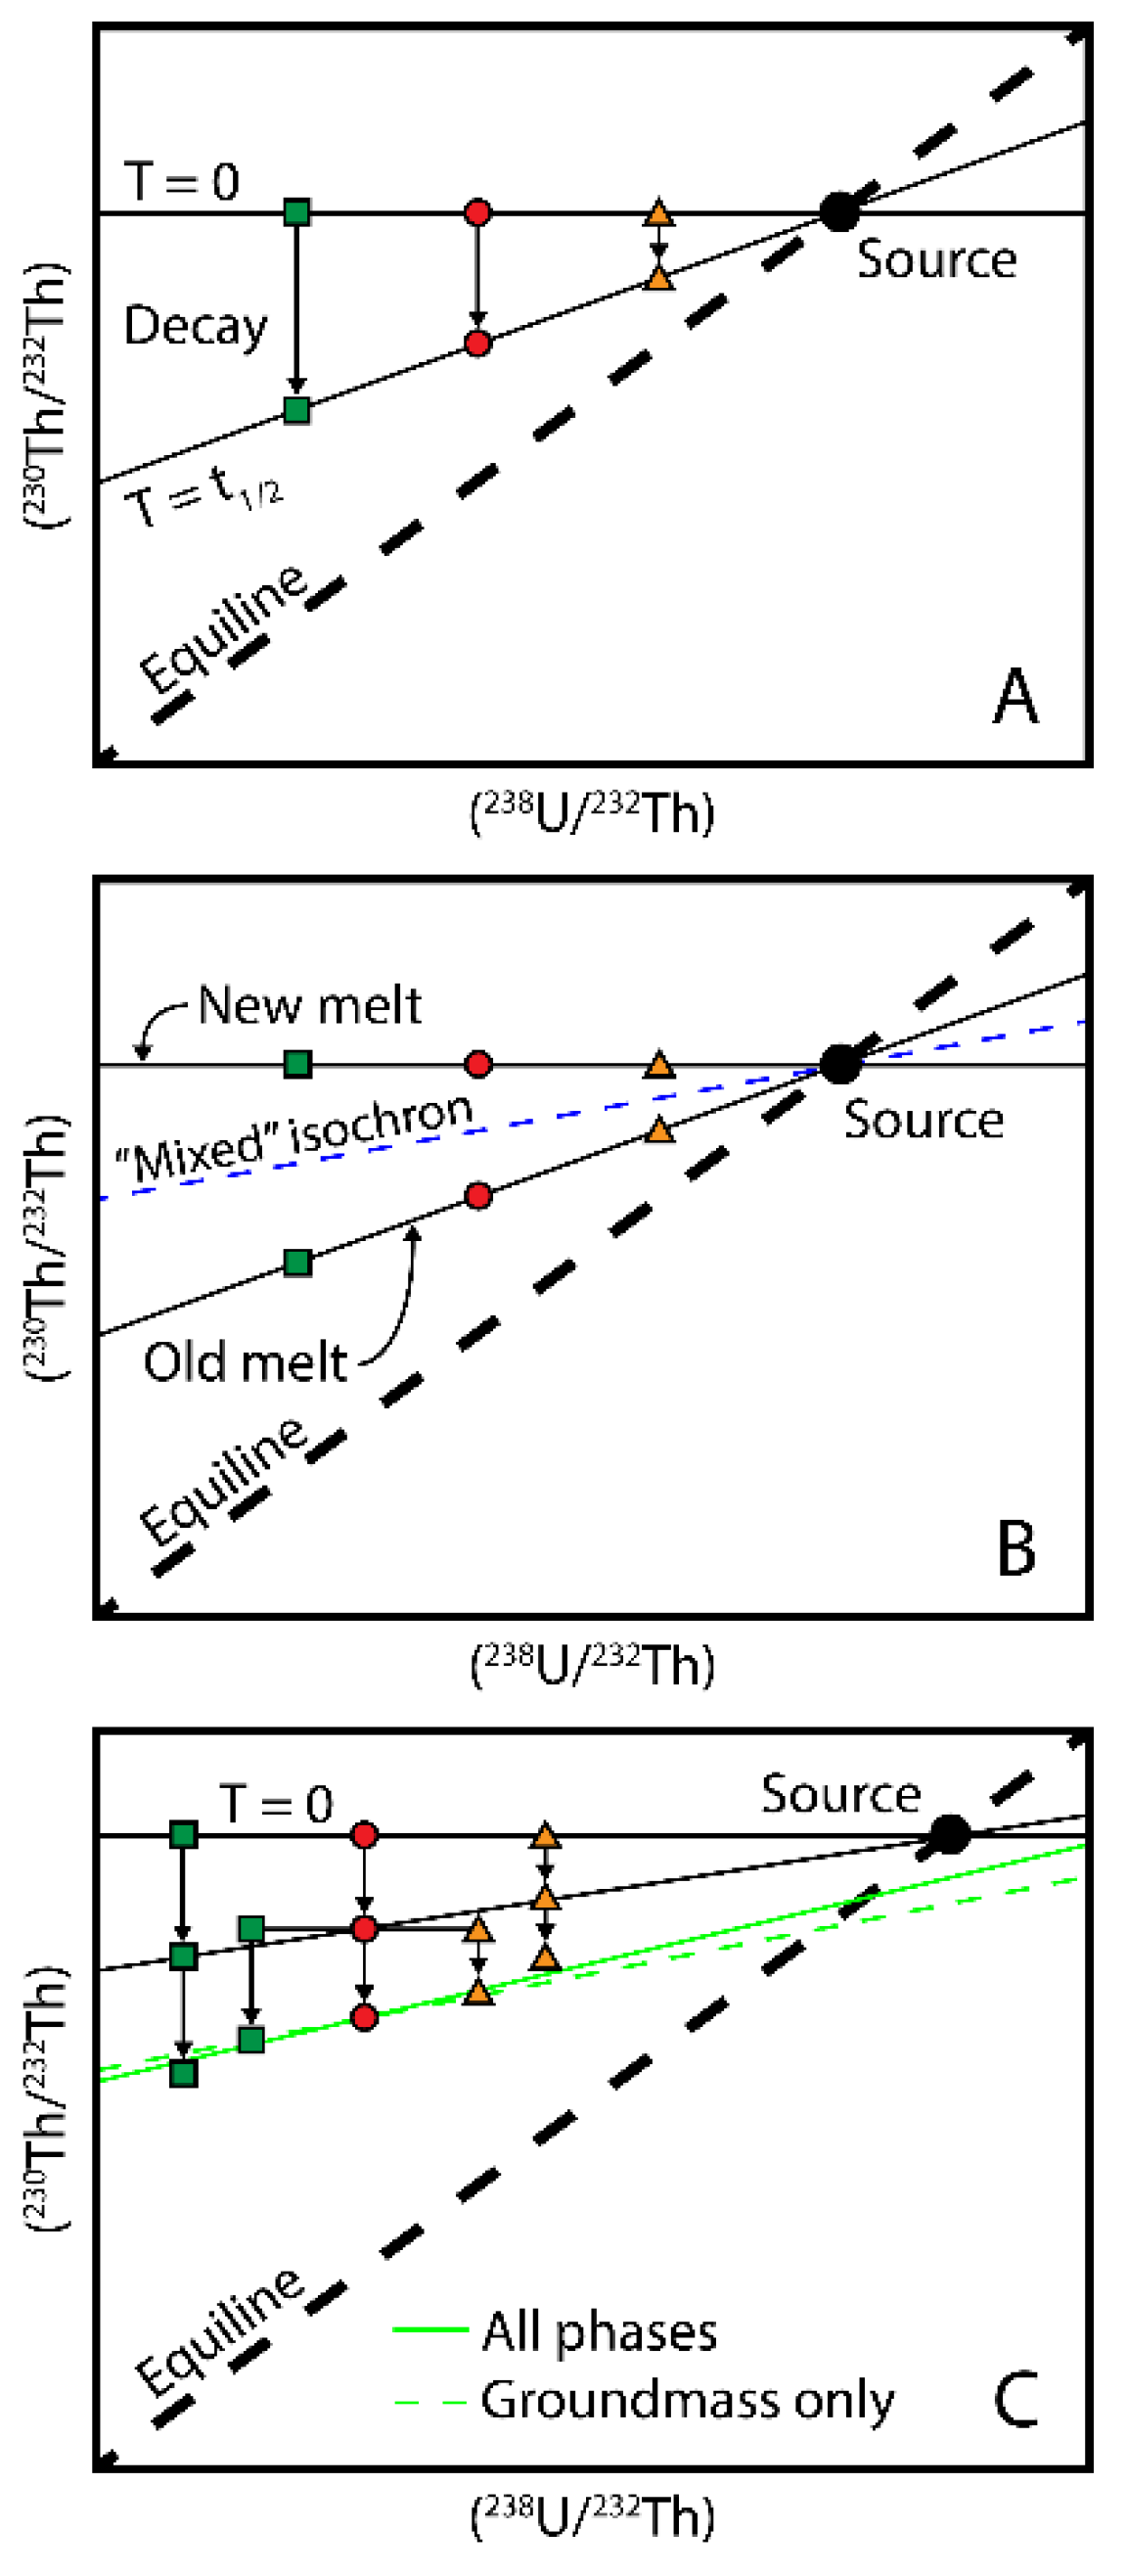
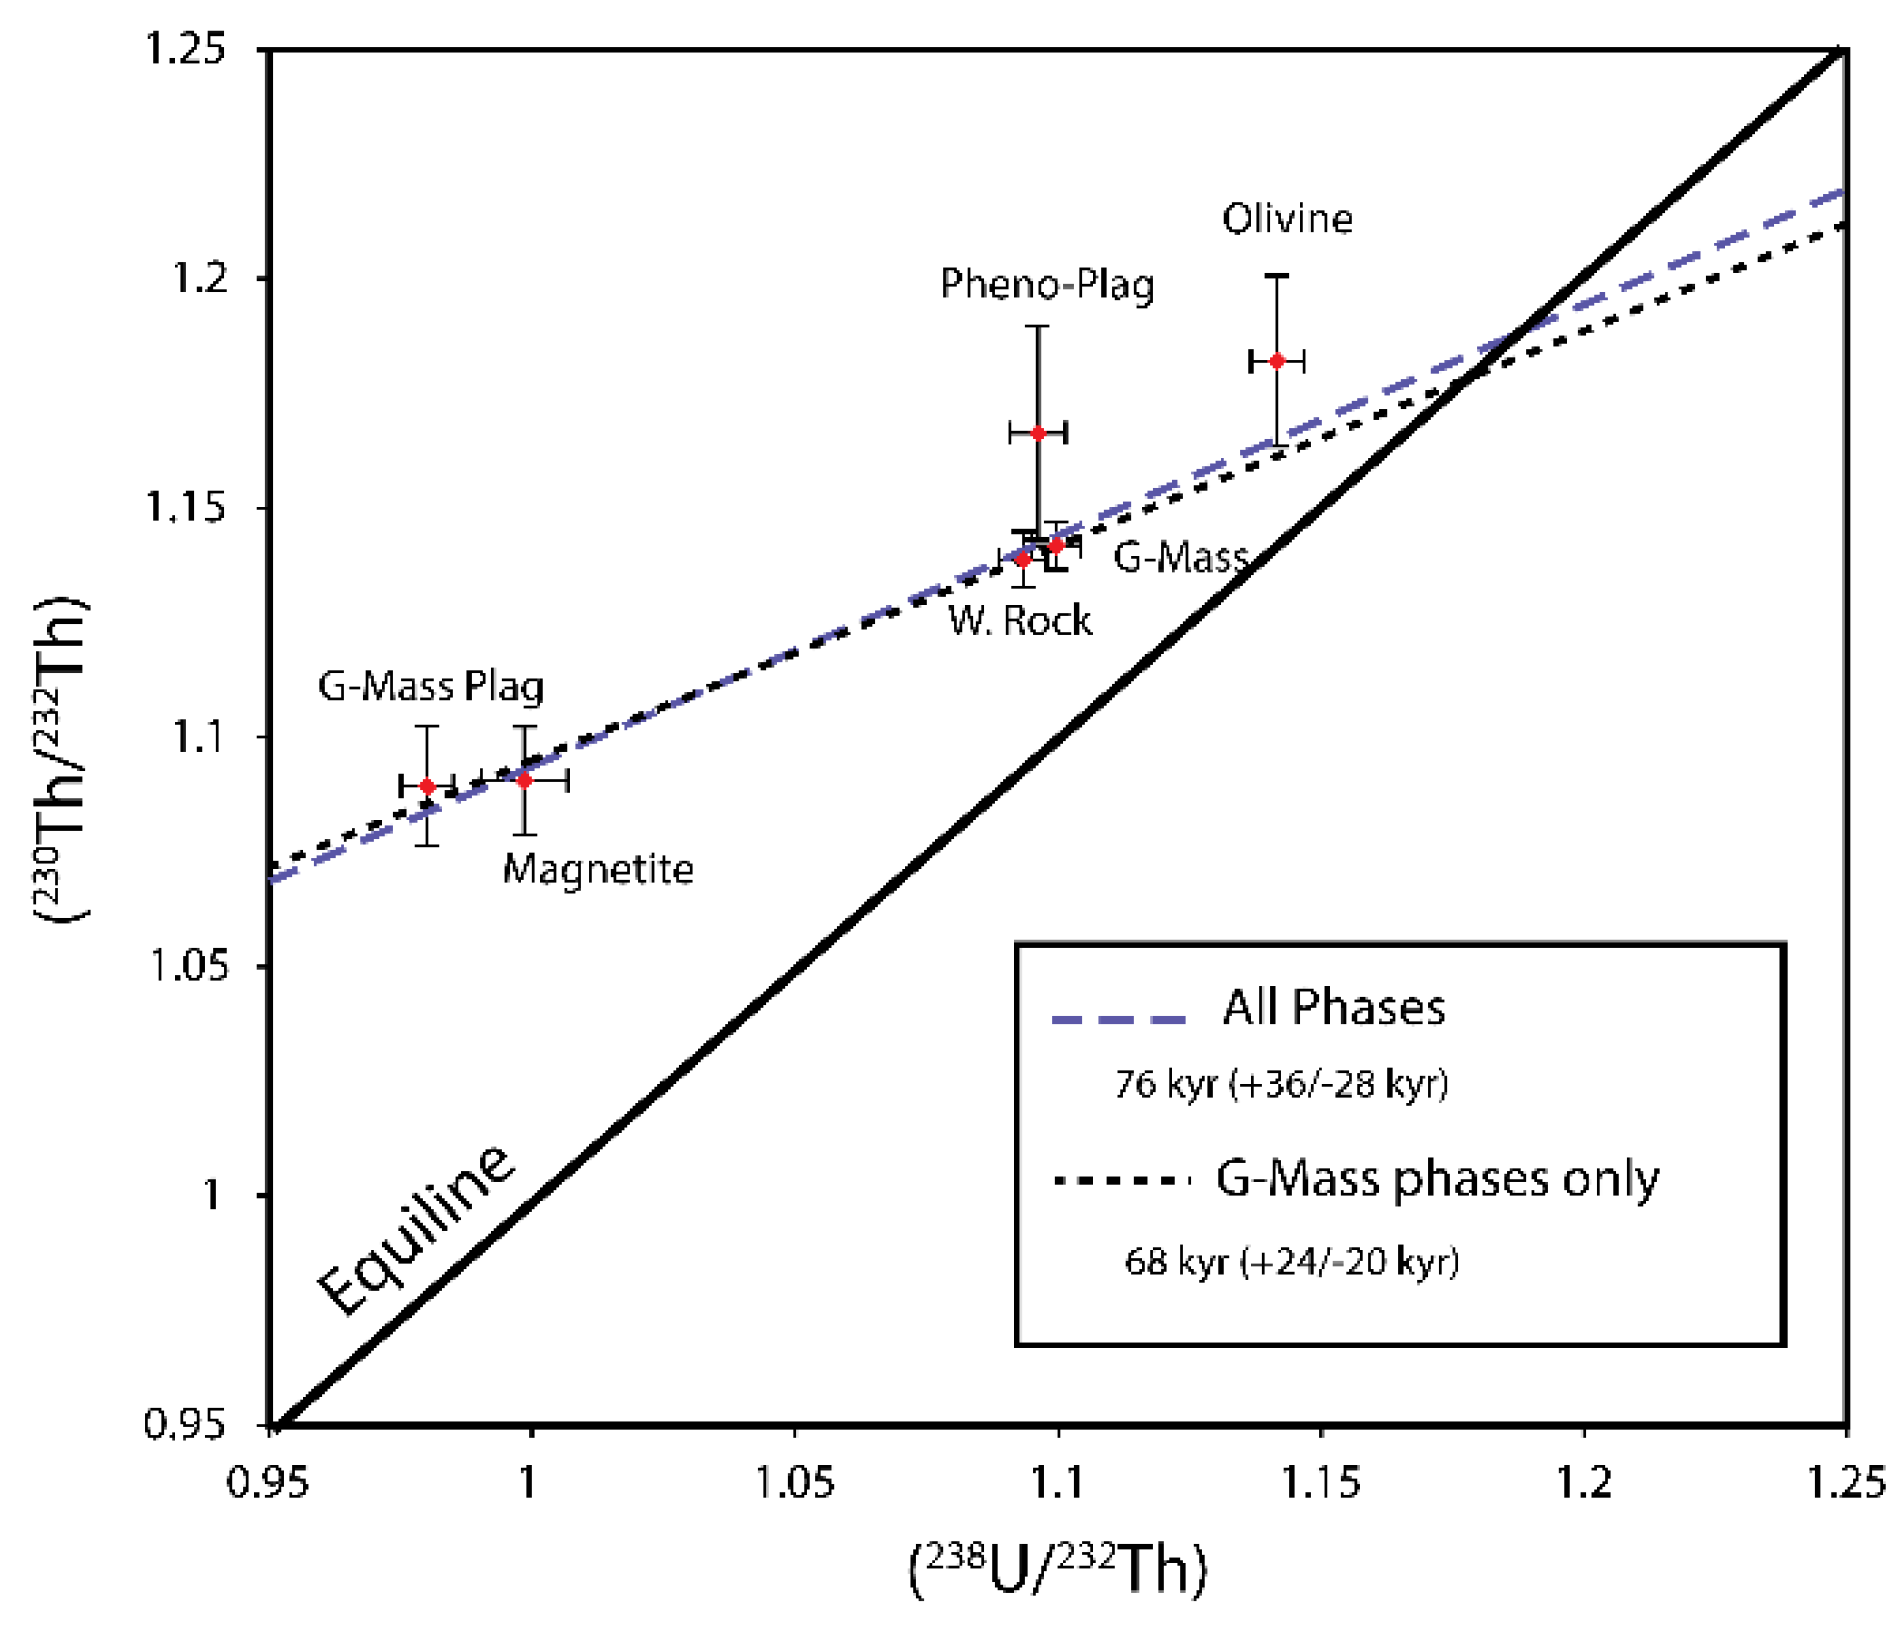
4.2.1.(238. U)/(232Th) - (230Th)/(232Th)

As discussed above, the Bateman equation for the 238U-230Th system, when normalized to 232Th, is linear in the space of (230Th/232Th) versus (238U/232Th) (see Equation 20; Figure 25). In these coordinates, b (the intercept with the equiline) is given by the expression (230Th/232Th)XS · e-λ230t and provides an important measure of the long-term (238U/232Th) ratio in the lava’s source and, by extrapolation, the extent of initial (230Th/238U) disequilibrium, and m (the slope of a linear isochron) is given by the relationship 1 e λ 230 t  and provides the measure of time since crystallization, as defined by:
t = l n 1 m λ
The assumptions for the (238U)/(232Th)-(230Th)/(232Th) isochron method are the same as for most other isotope systems, namely that the minerals are cogenetic and coeval, have uniform (238U/230Th) at a given time (i.e., the array is linear), and have remained closed to migration of U and Th since crystallization. However, because the timescales over which magma chamber processes operate are potentially similar to the half-life of 230Th, there are two additional concerns that must be considered, namely: 1) did the minerals grow quickly or slowly? and 2) was the magma residence time long or short relative to the half-life of 230Th or to diffusional equilibration of U and Th between magmas and crystals?
Depending on the sequence of petrological events (e.g., melting, mixing, crystallization, assimilation, etc.) relative to the half-life of the daughter isotope being considered, mineral isochrons can be simple and easily interpreted in terms of eruption ages (Figure 25). However, nuclide behavior also can be complex and non-systematic. In other words, was crystallization a short, one-time event that occurred soon before or during the eruption, or did the crystals grow episodically over timescales on the order of tens of thousands of years? Furthermore, there is the possibility of intermittent recharge to a magma chamber and, thus, the mixing of crystals of different age and magma residence time (Figure 26). As such, because the isochron is constructed from mineral phenocrysts, which may have resided in a crustal magma chamber for a significant period, particularly for more evolved magmas, the calculated age can be a combination of both eruption age and magma chamber residence time. The best way to resolve this issue is to separate and measure just the groundmass phases, as these minerals grew syn-eruptively and thus provide an explicit eruption age. Although the effective separation of such groundmass phases is tedious and time-consuming [208], results for such careful sample preparation can provide both an eruption age and constrain the timescale of crystallization for the older phenocryst phases (Figure 27). In such cases, combining the U-series groundmass isochron age with cosmogenic 3He concentrations (Figure 28) provide a unique and self-consistent quantification of both the eruption age and the erosion rate [208].
There are numerous examples of 238U-230Th mineral isochrons in arc and continental systems (e.g. [204]), but only a few in oceanic settings [108]. This dearth of 238U-230Th isochrons for MORB is because most MORB samples are phenocryst-poor, with the exception being some glasses that are plagioclase-phyric.
Figure 26. Three simplified, potential (238U/232Th)-(230Th/232Th) isochron scenarios. (A) Polymineralic isochron representing the lava eruption age. In this scenario, a melt is extracted from the mantle, quickly crystallizes several phases relative to the half-life of 230Th, and then erupts soon thereafter as a porphyritic lava. The 230Th in the different solidified mineral phases of the lava then decays toward equilibrium for one half-life. (B) Polymineralic isochron representing mixing of two populations of minerals of different ages, producing an isochron of intermediate age, which is the average of the two. This situation is often the case where magmas of like composition (e.g., basalts in a mid-ocean ridge or ocean island setting) are mixing or picking up crystals of similar composition from older cumulate piles. (C) Extraction of melt from the mantle, which rapidly crystallizes several phases relative to the half-life of 230Th and then resides in the magma chamber for about ten thousand years, followed by a second episode of crystallization, and then erupts. In this scenario, a good example would be when the second batch of minerals is the fine-grained eruptive groundmass.
Preprints 184447 g026

4.2.2.(230. Th)/Ba - (226Ra)/Ba Isochrons

Radium is an alkali-earth metal and, therefore, phenocrysts such as plagioclase, K-feldspar, and clinopyroxene are ideal target minerals for examining crystallization and eruption ages in young lavas using the 230Th-226Ra disequilibria chronometer. Use of mineral-glass 226Ra-230Th disequilibria requires knowledge of the initial 226Ra present in the minerals at the time of crystallization. Because no longer-lived or stable isotopes of Ra exists, most studies have used Ba concentrations (another alkali-earth metal) as an analog for the Ra initially present in the crystals (e.g., [210,211,212]).
The use of Ba as a stable analog for Ra requires that Ra and Ba behave identically during crystal growth, which typically is not the case. Theoretical work predicts a significant difference between DRa and DBa, with calculated crystal/melt partition coefficients for Ra significantly lower than those of Ba in plagioclase and pyroxene [54,213]. Not accounting for this difference will produce significant inaccuracies in calculated ages. Furthermore, Ra is preferentially excluded from these minerals, leading to lower (226Ra)/Ba ratios in crystals than in the magmas from which they crystallized. This difference in partitioning behavior will produce the observed non-collinearity between multiple cogenetic phases, even in the absence of open-system behavior. As a result, with the Ra-Ba chronometer, it is difficult to distinguish the effects of initial Ra-Ba fractionation from decreases in (226Ra)/Ba due to the aging of crystals.
Figure 27. U-Th mineral isochrons for Bluewater flow calculated using 1) all groundmass and phenocryst phases and 2) groundmass phases only. These isochrons are determined using a nonlinear, maximum-likelihood method to estimate the slope and intercept of the best-fit line and Monte Carlo methods to estimate 95% confidence limits [214]. Error bars on the data points represent two-sigma analytical uncertainties. Larger uncertainties for the olivine and plagioclase phenocrysts are due to their much lower concentrations. Note the significant difference in (238U/232Th) between the plagioclase phenocrysts and plagioclase groundmass suggesting that either their magma sources were distinct or inclusions (mineral or melt) are causing the difference. The U and Th concentrations of the olivine phenocrysts are also higher than expected from experimental partitioning [215], suggesting again that mineral or melt inclusions are controlling the U and Th budget. These observations demonstrate the importance of using the lava’s groundmass phases for determining its eruption age.
Preprints 184447 g027
Cooper et al. [164] developed a technique to correct 226Ra-230Th crystal ages for the large difference in DRa and DBa in plagioclase and then applied this method to minerals separated from lavas of the 1955 eruption of Kilauea Volcano, Hawaii. Because the compositions of plagioclase and pyroxene were in equilibrium with the liquid in which they had erupted, they argued that their calculated crystallization age of 1,000 ± 350 yrs. (or given the lava’s age, 950 ± 350 yrs. before eruption) provides a minimum measurement of the residence time of the magma in the crustal reservoir. From this crystallization age, they then calculated a maximum average magmatic cooling rate of 0.1 °C/yr by combining the average crystal age with the temperature interval between saturation and eruption. Subsequent studies have applied this method, or some other variant of the application of the Ra chronometer, to MORB and OIB from a variety of locations, including the 1996 North Gorda Ridge eruption [108] and Iceland [207,216]. These studies demonstrated that 226Ra-230Th dating of crystals can be an effective tool for examining magmatic processes that occurred within the past ~10 kyr, although a correction for impurities in the bulk separates must be applied and the effects of differential partitioning behavior of Ra and Ba considered and accounted for [89,217].
Figure 28. 3He exposure age as a function of erosion rate for the three sites sampled for exposure-age dating on the Bluewater flow. Two-sigma analytical uncertainties are shown by the dotted lines. Errors in production rate, scaling, and attenuation length will shift the curves uniformly up or down, but not change the relative distance between them. Given that the exposure age must equal the eruption age at all sites, different curves indicate that different erosion rates must have affected each site. The U-Th isochron age with one sigma (68% confidence level) and two-sigma (95% confidence level) are shown. The extrapolation of the U-Th ages to the 3He age curves provides an estimate of the erosion rates for the different samples (indicated by arrows at left of figure). Minimum erosion rate for BW-1 is calculated using the geomorphologic estimate of Dunbar and Phillips [218] who infer at least 10 cm of erosion. The maximum erosion rate of ZB-93–1 is determined by extrapolation of the upper age limit (two-sigma) for the U-Th groundmass-mineral isochron.
Preprints 184447 g028
Additionally, it is also important to note that because the timescales of crystallization are comparable to the half-life of 226Ra, the calculated ages represent an integrated growth rate of a crystal or crystal population. Continuous crystal growth over the timescales of the half-life 226Ra is an important issue that was not considered in these past studies, but which can significantly impact the calculated crystallization age. An illustrative example of how measurements of only 226Ra/230Th in mineral phases and host glasses can lead to erroneous results was demonstrated by Sims et al. [89] on recently erupted lava bombs from Mount Erebus volcano (Figure 29). The calculated 226Ra-230Th isochron ages for anorthoclase and host phonolite glass separated from the lava bombs gave incorrect crystallization ages ranging from many hundred years to a few thousand years, depending on DRa/DBa [89,90]. While these ages may seem reasonable, measurements of (228Ra/232Th) in these same crystals were out of equilibrium, which is highly problematic for the 226Ra-230Th isochron ages given that 228Ra has a half-life of only 5.77 years. To resolve this discrepancy, Sims et al. [89] measured all the relevant nuclides from the 238U, 235U, and 232Th decay series in the anorthoclase megacrysts and glasses of recently erupted, known-age lava bombs and then created a finite-addition numerical model which incorporates the effects of magma recharge, anorthoclase crystal growth, and radioactive decay in both the magma and the anorthoclase crystals. Their model results show that by incorporating nuclide in-growth and decay during continuous crystallization they can successfully reproduce the measured 226Ra/230Th, 210Pb/226Ra, 228Ra/232Th, and 228Th/232Th in both the anorthoclase megacrysts and phonolite melt (Figure 29e), demonstrating that when the timescale of crystallization is comparable to the half-life of 226Ra, the simple 230Th-226Ra isochron techniques typically used in most U-series studies provide incorrect ages. Thus, caution is warranted when interpreting 226Ra-230Th ages in the absence of other age constraints, either within the decay series or with other dating methods.
Figure 29. Crystal ages for Mount Erebus anorthoclase megacrysts [89]. (A) Backscattered electron image (BSE) and Ca element map of a single anorthoclase crystal. The darkest areas in the BSE image are the anorthoclase host crystals. The abundant irregular areas, slightly brighter than the anorthoclase, are melt inclusions. Other included phases are pyroxene (light grey phase on Ca map), apatite (second brightest in BSE, highlighted in red on Ca map), and magnetite (brightest in BSE, dark on Ca map). The size of the apatite crystals has been slightly increased to improve visibility. (B) Ra/Ba isochrons. 226Ra/Ba E-3 versus 230Th/Ba E-3 for anorthoclase and glass separates plotted on a conventional Ba-normalized 230Th-226Ra isochron diagram. (C) Calculated Ra age versus DRa/DBa showing how the age of crystallization changes as a function of DRa/DBa. Calculated DRa/DBa values for Or18 and An17 are taken from Blundy & Wood [54]. The value of DRa/DBa of 0·1 is a lower limit (because of potential 226Ra decay). (D) Time-series data for 228Ra over the 34-year historical record from 1972 to 2005.Time is since 2012. (228Ra/232Th)* was determined using 228Th/232Th measured by alpha spectroscopy as a proxy. The half-life of 228Th is 1·9 years, so for this 2005 sample (measured in 2008) the (228Ra/232Th)* inferred from (228Th/232Th) is a minimum value as the system had not yet attained full equilibrium. Reagan et al. (1992) data are shown for comparison. (E) For the Erebus lavas the equilibrium (210Pb/226Ra) and (227Ac/231Pa) suggest that the magma residence time is long compared with the half-lives of 210Pb (t1/2 = 22· 6 years) and 227Ac (t1/2 = 21·77 years) (not shown). However, the observation that (228Ra/230Th) (t1/2= 5·77 years) is out of equilibrium in the anorthoclase suggests that the Erebus magmatic differentiation and crystallization processes are continuous and continuing. With this observation in mind, an open-system, finite-element, continuous-crystallization model was developed that incorporates ingrowth and decay of the different nuclides in the continuously growing anorthoclase crystals and associated phonolitic melt. Because the Ba and Th concentrations are measured in both the anorthoclase crystals and the melt, they can constrain the anorthoclase/phonolite melt partitioning of Ba and Th. It is found that the only way to replicate the observed Ba and Th concentrations and 238U, 235U, and 232Th decay series data is to incorporate magma recharge into the shallow system. To successfully model the present data set the recharge rate has to exceed the crystallization rate, which implies that the shallow magma reservoir within Mount Erebus is growing. This has important implications for hazard assessment as the modeled duration of reservoir growth is 2000 years, which coincides, within error, with the ages of the two youngest lavas from the flanks of Mount Erebus (the Northwest and Upper Ice Tower Ridge flows; [219]). Modified after Sims et al. [89].
Preprints 184447 g029

4.3. U-Th-Ra ‘Model’ Ages

If the initial extent of disequilibrium at the time of eruption is known, then the difference between the initial activity ratios and the measured activity ratios can be used to determine the lava’s eruption age. These “model ages” improve the resolution of the U-series ages by roughly an order of magnitude for each parent-daughter pair; by tens of thousands of years for 230Th model ages, and by hundreds to thousands of years for 226Ra model ages.
It is important to note that such U-series ages are ‘model ages’, in that they assume an unvarying source (both spatially and temporally), and represent the time since partial melting and are, therefore, the integration of a lava’s magma chamber residence time and its eruption age. When determining U-series model ages, the following conditions must be met and demonstrated:
  • U-series disequilibria were initially created by primary magmatic processes and the lavas being dated have not undergone significant secondary alteration. The lavas have remained a closed system with respect to Th/U, Ra/Th, and Pa/U after eruption.
  • After melt generation and transport, the magma has not resided in a magma chamber for periods of time that are significant relative to the half-lives of 230Th, 231Pa, and 226Ra. If it has, then the determined age will be the sum of the integrated crustal residence time and the age of the lava, as the disequilibria is assumed to have been initiated by a melting process, which is when the radiometric clock was started. Furthermore, if a magma chamber is filled repeatedly and slowly with respect to the half-life of the geochronometer nuclide, then the age of the erupted lava will be the sum of the integrated magma residence time and the time since eruption,
  • The initial extent of disequilibria in all lavas under consideration is the same, which requires the sources of all lavas to have constant Th/U, Ra/Th, and Pa/U. This further requires that lavas were generated by similar degrees of melting at similar depths of melting from a relatively homogenous mantle source that had not recently lost partial melts. It also requires that all melts have similar transport rates (e.g., [20,45,46,107]).
Thus, if after eruption the lava remains a closed system, disequilibria between parent and daughter will decay back to equilibrium at a rate proportional to the half-life of the daughter isotope, and this decay can be used for dating lavas of unknown age (Figure 4 and Figure 24), given that the above conditions are met.
If the above requirements are met, then U-Th and Th-Ra model ages of unknown age lavas can be determined from the relationships:
t = 1 λ 230 l n T h 230 T h 232 m U 238 T h 232 m T h 230 T h 232 0 U 238 T h 232 m
and
t = 1 λ 226 l n R a 226 T h 230 m 1 T h 226 T h 233 0 1
where the subscript m represents the sample’s measured activity ratio, the subscript 0 is its initial activity ratio upon eruption, and λ230 and λ226 are the decay constants for 230Th and 226Ra, respectively. In Equation 36, 232Th is used as a stable analog for 230Th [5,7]. The different form of Equation 37 is used because no stable analog exists for 226Ra. The equation for determining 231Pa model ages is of a similar form to the equation for 226Ra.
In these equations, the one additional unknown, besides time, is the initial activity ratio [i.e. (230Th/232Th)0, (226Ra/230Th)0, and (231Pa/235U)0]. U-series ages are then determined by estimating this initial activity ratio from data for young, “known-age” lavas and comparing this with the sample’s measured activity ratio.
Probably the best examples of model age dating are for MORB [20,45,46,107,186,187,188,189,190,195,196]. The most well-studied ridge in the mid-ocean ridge system with regard to U-series dating is the 9°-10° N segment of the East Pacific Rise [20,45,46,107,188,189,190,195,196] because this particular segment of the EPR was a focus of the US National Science Foundation Ridge and Ridge Y2K programs. In studies of samples from this region, 238U-230Th-226Ra dating evolved to include both larger sample suites of well-located and geologically well-constrained samples, as well as measurements of 226Ra, which provided finer time resolution. These spatial and temporal geological constraints for the axial lavas were also essential to the application of (226Ra/230Th) for dating off-axis samples. All lavas collected within the axial valley trough at 9-10°N EPR were geologically constrained to be less than 375 years old, such that (230Th/232Th)0, (226Ra/230Th)0, and (231Pa/235U)0 were all known explicitly for the magmatic system [20].
A fundamental observation of Sims et al. [107] was that many off-axis samples have higher U-Th and Th-Ra disequilibria, and thus younger model ages, than would be predicted for their off-axis locations and the time-integrated spreading rate of the ridge (Figure 30). Collectively, the resulting understanding from the U-series chronology and enhanced observations and mapping has led to a fundamental paradigm shift for models of mid-ocean ridge construction. The distribution of young lavas requires that a significant component of oceanic crustal construction at the fast-spreading EPR involves multiple volcanic and tectonic processes acting in concert to form a complex patchwork of lava ages [20,45,46,107,195,196,220], whereas previously it was assumed that nearly all volcanic activity was limited to a very narrow axial summit trough. One possible mechanism to explain such extensive off-axis volcanism is that bending and unbending stresses play a key role in triggering volcanism on the flanks of the EPR, by simultaneously opening tensile cracks near the surface and increasing the pore pressure of melt bodies trapped in the lower crust [220]. Similar systematics were also suggested for samples from the Southweast Indian Ocean Ridge (SWIR; Figure 31) where young ages were inferred for lavas far off-axis and high on fault scarps [110]. These important observations provide evidence that crustal accretion of young volcanic rocks is not confined to a narrow central spreading axis as had long been the standard paradigm.

4.4. Dating Young Volcanic Rocks with 226Ra-210Pb

While there have been numerous measurements of (210Pb/226Ra) in young volcanic arc lavas [191,209,221,222,223,224], there are relatively few such measurements in MORB (e.g. [43,46,81,101,106,191]) and in oceanic intra plate settings (e.g. [35,163,225,226]).
Figure 30. (A) (238U/232Th) versus (230Th/232Th) for the 9°50’N off-axis samples compared to the 9-10°N EPR axial samples [20,107]. Errors represent two sigma analytical uncertainties. Solid line represents the zero-age axial trend used for calculating “trend line” ages; dashed line is the equiline. For most of the off-axis samples (230Th/232Th) and (238U/232Th) are similar to the axial samples from 9°50’N EPR; the three samples that lie below the range of axial values are interpreted to be older. Inset provides regional context and shows the 9-10°N EPR axial samples [20,107] compared with the Siqueiros Transform samples [20,34]. Also shown are the near-axial basalts from 9°37’N EPR [187]. (B) 230Th/238U versus 226Ra/230Th for 9°50’N EPR off-axis samples compared with the 9°50’N EPR axial samples [20,107]. Error bars represent two sigma analytical uncertainties. Because of the significant difference in the half-lives of 226Ra and 230Th, (226Ra/230Th) decays back to equilibrium before (230Th/238U) (note decay curve on plot). The correlation observed among the zero-age samples (shown by solid line) is used as the trend line from which Th-Ra ages are calculated (see text for details). Isochrons of equal age are plotted. Note that several off-axis samples have (226Ra/230Th) in equilibrium, indicating that their ages are older (> 8 ka) than can be determined through 230Th-226Ra disequilibria. Inset provides regional context and shows (230Th/238U) versus (226Ra/230Th) for the 9°50’N EPR off-axis samples from this study compared with the 9-10°N EPR axial samples [20,107], three “near-axis” 9°30N EPR samples, including one E-type from close to the 9°37’N DEVAL [192], and the Siqueiros transform samples [34]. (C) 9°50’N EPR samples (230Th/238U) versus their distance from the center of the ridge axis, or Axial Summit Trough. Decay curves show how (230Th/238U) decreases as a function of distance from the AST. Initial values for decay curves come from the average, red, and high and low values of (230Th/238U) for the 9°50’N EPR axial samples as reported in Sims et al. [20]. (D) 9°50’N EPR samples (226Ra/230Th) versus their location relative to the AST. Decay curves show how (226Ra/230Th) decreases as a function of distance from the AST. The initial values for these decay curves come from the average, red, and high and low values of (226Ra/230Th) for the 9°50’N EPR axial samples [20]. (E) U-Th and Th-Ra trend-line model ages for the 9°50’N off-axis samples (Figure 9; [107]) compared with ages calculated from the half-spreading rate (5.5 cm/yr) as determined from paleomagnetic data [227]. Note that a majority of the measured off-axis basalt samples from the 9°50’N section of the EPR have U-Th and Th-Ra disequilibria that are larger, and model ages that are younger, than would be predicted from their off-axis distance and the time-integrated spreading rate. There are, however, a few off-axis samples with U-Th model ages that are consistent with their spreading rate ages.
Preprints 184447 g030
For most MORB lavas, 226Ra-210Pb disequilibria have been used as a chronometer to establish whether lavas are greater or less than ~100 years old based on the half-life of 210Pb (t1/2 = 22 years) and the presence or absence of disequilibria [35,43,46,191,228]. However, as recently shown, for some lavas it is also possible to determine model eruption ages on a decadal scale using 226Ra-210Pb disequilibria [81].
If the required source homogeneity criteria are met, then 226Ra-210Pb model ages can be determined from the relationship:
T =   1 λ 210 ln P b 210 / R a 226 m 1 P b 210 / R a 226 o 1
where (210Pb/226Ra)m is the measured ratio, (210Pb/226Ra)o is the calculated initial ratio at the time of eruption of the lavas, and λ210 is the decay constant of 210Pb. Again, calculating (210Pb/226Ra) model eruption ages requires an assessment of the initial extent of 210Pb excess at the time of eruption of the samples in question.
Sims et al. [81] used (210Pb/226Ra) to calculate model submarine lava ages from the ABE vent site in the Lau basin with decadal scale resolution. A crucial criterion for using (210Pb/226Ra) to calculate model ages at this location was that the ABE vent site lavas had essentially constant (226Ra/230Th) and (230Th/238U) disequilibria (Figure 32). Given this constraint, Sims et al. [81] calculated the time of (210Pb/226Ra) decay since eruption, obtaining model eruption ages of 0 to 100 years, with an average eruption age for the vent field of roughly 53 ± 29 years at the time of analysis in 2013.

4.4. Dating Young Volcanic Rocks with 210Po-210Pb

In subaerial lavas and shallow submarine volcanoes, 210Po (t1/2 = 138.4 days) is posited to degas entirely at magmatic temperatures, whereas its grandparent nuclide, 210Pb (t1/2 = 22.6 years), remains almost entirely in the melt (e.g. [229], and references therein). The intermediate radionuclide in the decay chain, 210Bi, has a relatively short half-life (t1/2 = 5.012 days) and is thus assumed to be in equilibrium with its parent, 210Pb. Therefore, by assuming that 210Po is completely degassed and thus has an initial concentration of zero at the time of eruption, a series of measurements of the 210Po activity can be made in the weeks and months following eruption and an ingrowth curve can be fitted to the data to determine the maximum eruption age (Figure 33). The 210Po activity as a function of time is described by the Bateman equation:
P o 210 = P o 210 0 e λ t + P b 210 1 e λ t
Assuming P o 210 0 = 0 , this simplifies to:
P o 210 = P b 210 1 e λ t
The assumption that initial 210Po activity is zero generally holds true for subaerial basaltic eruptions and for submarine eruptions at less than 3 km depth [230]. Lavas erupted at greater depths are subject to higher hydrostatic pressures, which may limit the degassing efficiency. Rapid eruption and quenching of lavas may also reduce the degassing efficiency in differentiated magmas [206,223]. Nevertheless, lavas that actively degas until eruption most commonly lose >90% of their Po [199,222,231,232,233], which means that calculated eruption ages assuming 210Po = 0 may typically be too old by up to about 3 weeks.
Figure 31. Measured U-series disequilibria in SWIR MORB as a function of distance from the spreading axis. (a) Variable (230Th/238U) for both spreading axis lavas (green triangles) and rift valley lavas (red circles) with respect to the spreading axis indicate no correlation between disequilibrium and crustal age. Decay curves bracketing the spreading axis track the amount of disequilibrium in a basalt assumed to have an initial excess of ~27% as a function of distance from the axis, given a spreading rate of 7.1 mm/yr. Based on their measured U-Th disequilibrium and current locations, five rift valley lavas could not have erupted within the spreading axis. For comparison, dashed decay curve represents spreading rate of 55 mm/yr (9 ºN EPR). (b) As in a), solid and dashed curves contrast different spreading rate decay curves for (226Ra/230Th) disequilibrium. Three of the five lavas with U-Th disequilibrium have excess 226Ra constraining their ages to < 8 ka. Alternatively, at 7.1 mm/yr, an age < 8 ka is equivalent to 55 m of movement since emplacement.
Preprints 184447 g031
Validation of the 210Po dating technique, and the assumption that Po is completely degassed during eruption, has been completed in a few important studies, indicating that 210Po can be a powerful tool to precisely date recent, unobserved volcanic eruptions. Two seminal examples include:
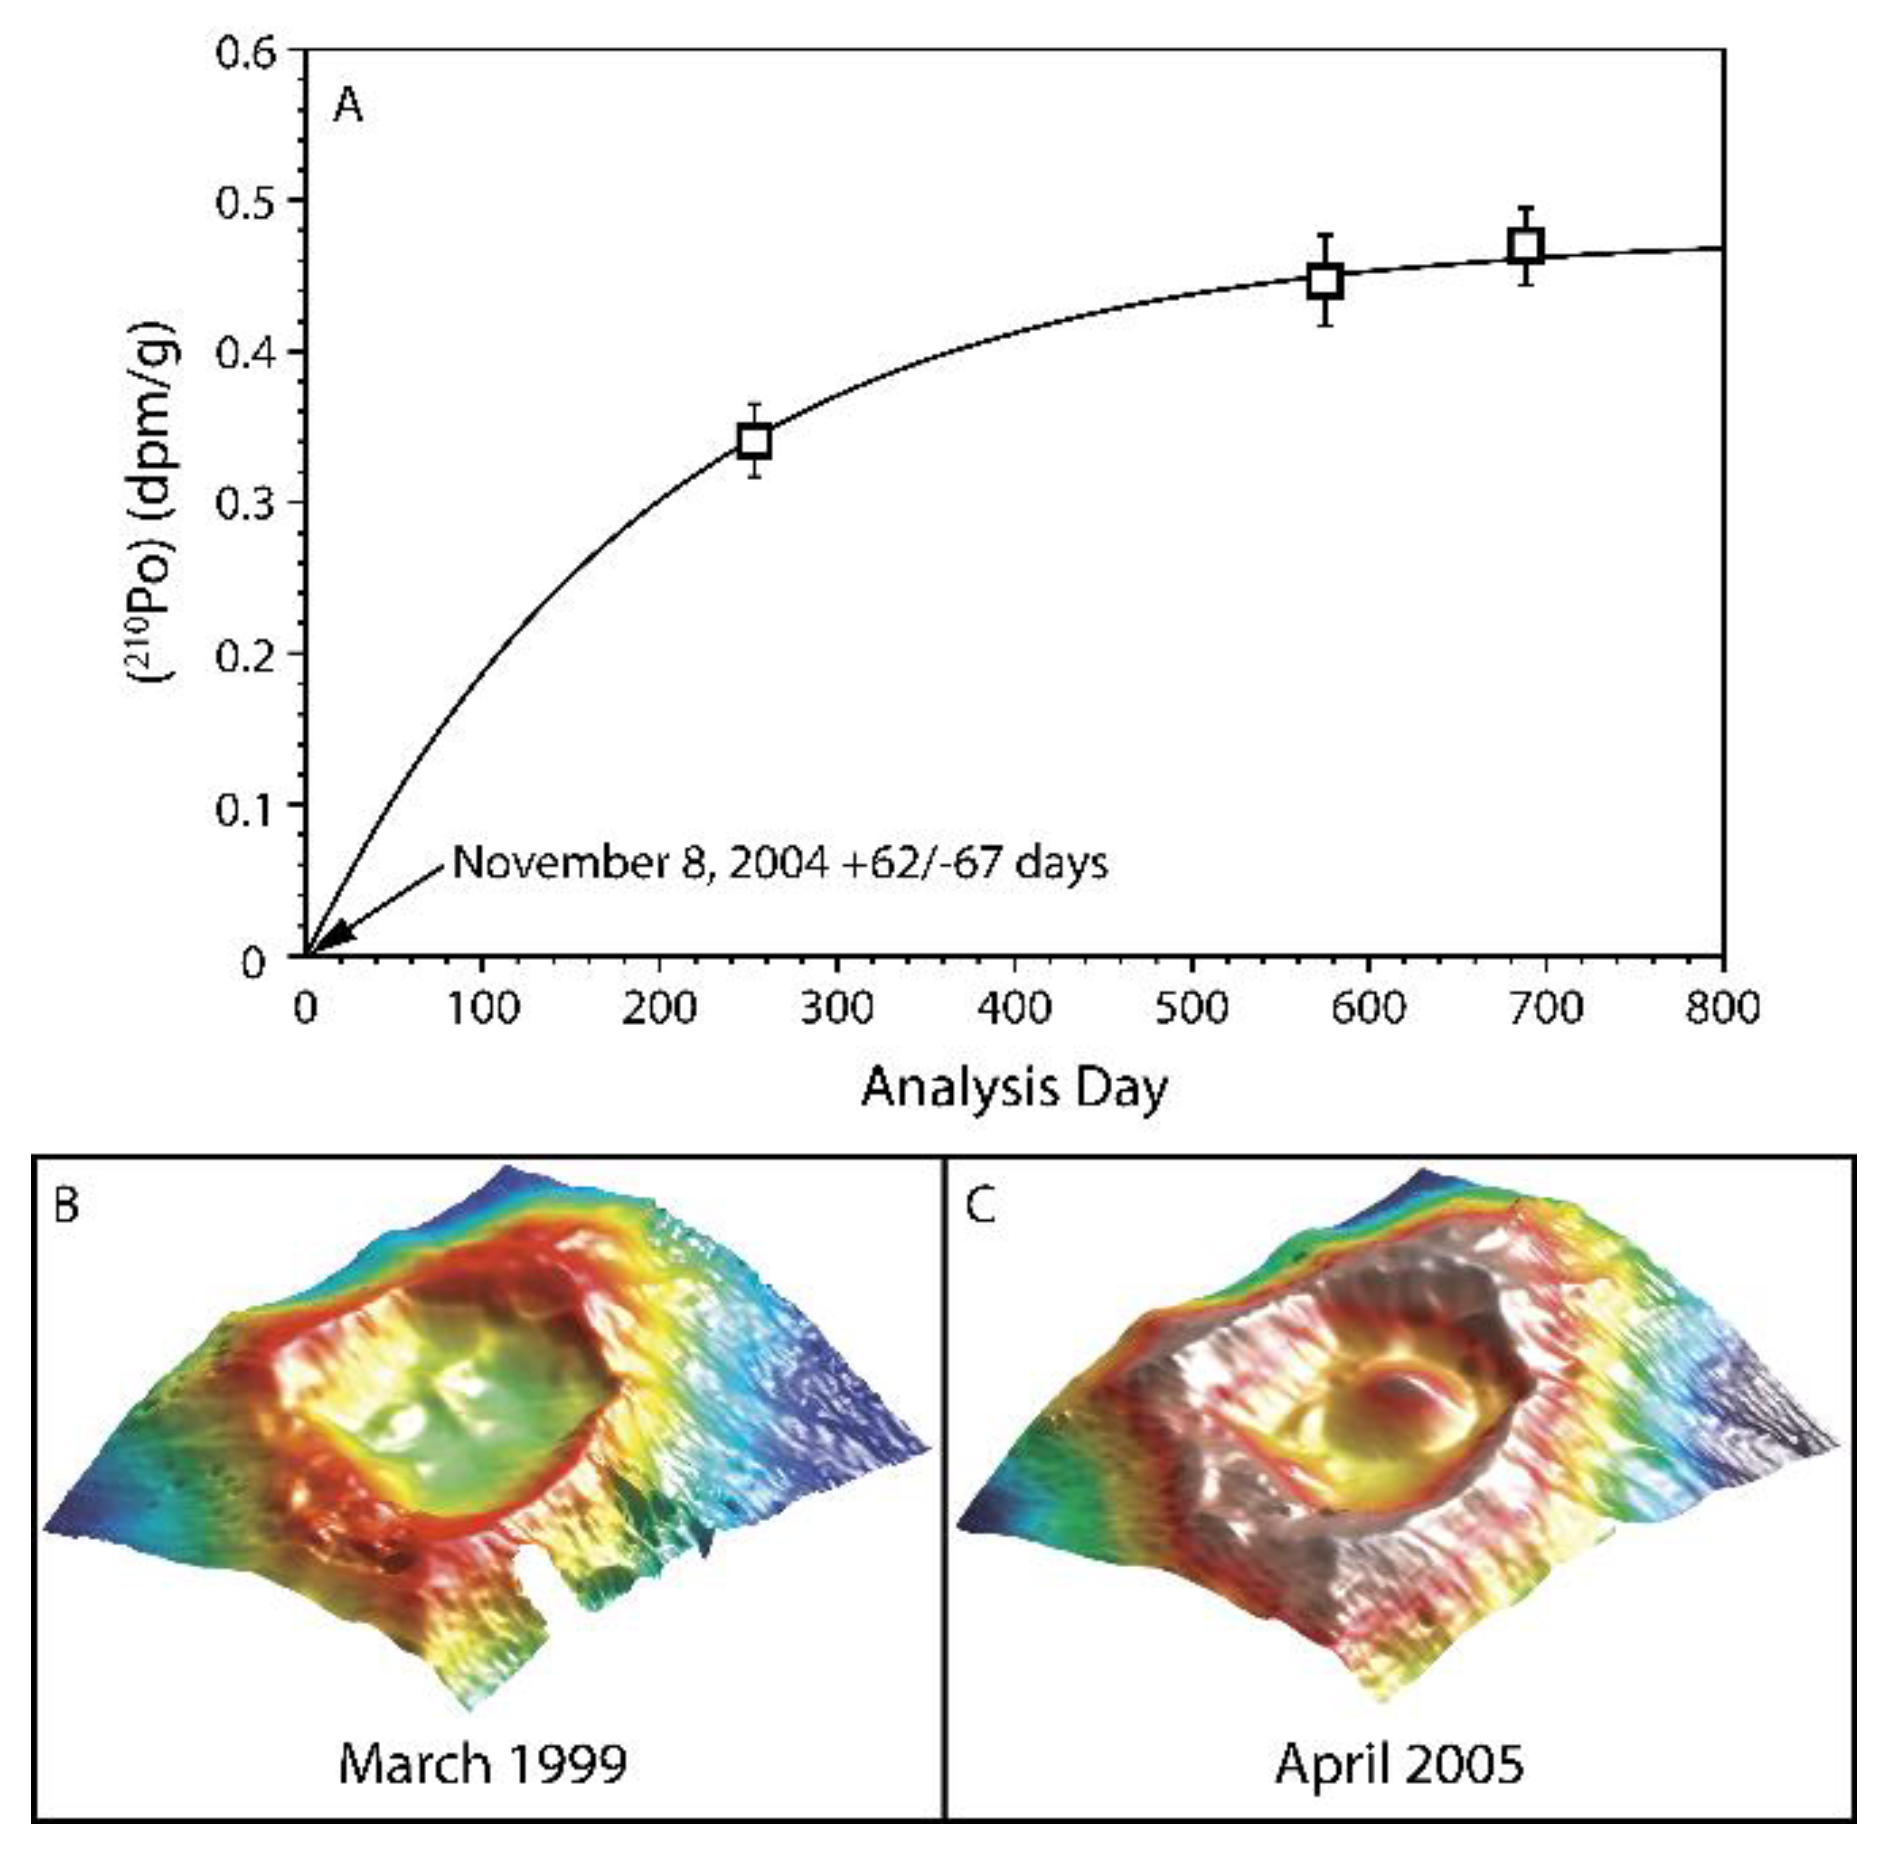
  • In a study of lavas from Vailulu’u and Malumalu in Samoa, Sims et al. [35] demonstrate that the calculated 210Po age, which provides an eruption date of 8 November, 2004 (+62 days/-67 days), falls within a window of bathymetric imaging showing new dome growth occurring sometime between March 1999 and April 2005 (Figure 33).
  • In a study of the EPR, Tolstoy et al. [234] found a 2+ year buildup of seismic activity preceding a sudden drop in seismic activity on 22 January, 2006. While this event was interpreted as a singular eruption along the East Pacific Rise, the 210Po dates in lava samples from this event show a wider range of eruption dates, from June 2005 to January 2006 [234]. The apparent discrepancy between the calculated ages and seismic observations is controversial; however, a simple interpretation that reconciles this discrepancy is that the 210Po ages may reflect the buildup of seismic activity representing numerous smaller, distant eruptive events rather than precursors to a singular eruptive event.
Figure 32. (a) Map of the ABE vent field showing sample locations and model eruption ages. Image is DLS-120 Side Scan backscatter image. Vent sites, faults, and approximate location of faults and lava flow fronts from Ferrini et al. [235]. (b) (210Pb/226Ra) versus (226Ra/230Th) showing ABE vent field lavas and age trajectories calculated assuming (210Ra/226Ra)0 = 1.82 or 2.0 and (226Ra/230Th)0 = 3.02 or 3.55 and then interpolating a model zero-age isochron between the two end-members. The majority of samples have (210Pb/226Ra) > 1, indicating that they erupted within the past 100 years. RC-086 likely erupted more than 100 years ago; if this sample had (226Ra/230Th) = 3.05–3.63, then 1800–2500 years have elapsed since eruption. (c) Sample photos taken by ROV Jason 2 arranged in order of increasing model age from left to right.
Preprints 184447 g032

5. Timescales of Magma Degassing

Magma recharge and degassing are directly linked to volcanic activity. Determining the timescales of these shallow-level processes is fundamental to our understanding of physical eruption dynamics and hazard assessment.
At many quiescent but potentially dangerous volcanoes, persistent degassing of volatile constituents dissolved in magma after melting is a common manifestation of volcanic activity. Placing constraints on magma residence times in shallow degassing reservoirs and/or feeding systems is critical to understanding magma dynamics beneath these volcanoes. Measurement of radioactive disequilibria between short-lived 238U-series isotopes in volcanic gases and lavas can provide constraints on the timescales of shallow-level magma dynamics (e.g. magma recharge and degassing). While there are a few studies that have measured 222Rn, a noble gas, or its daughter nuclides, 210Po, 210Pb, and 210Bi in gas emissions from actively degassing open-conduit systems [229,230,232], most inferences about magma degassing timescales have come from measurements of ratios between 210Po, 210Pb, and 226Ra in lavas.
Figure 33. (A) Extrapolated best-fit 210Po ingrowth curve assuming 100% Po degassing. Calculated maximum eruption age given with 2-sigma analytical error. (B and C) Bathymetric images showing dome growth occurring sometime between March 1999 and April 2005. Modified after Sims et al. [35].
Preprints 184447 g033
Measurements of (210Pb)/(226Ra) in erupted lavas are ideal for constraining the processes and timescales of magma degassing because a) 222Rn, which is an intermediary nuclide between 226Ra and 210Pb in the 238U-decay series (Figure 2 and Figure 34a), is a noble gas that is highly volatile; and b) the 22.3 year half-life of 210Pb is appropriate for monitoring gas fluxes in magmas over a timeframe from several decades to years before eruption. Degassing processes generally have a negligible effect on the concentrations and activities of 210Pb and 226Ra themselves, as Ra is not volatile and only about 1% of Pb typically degasses from magmas [229,230,232]. In contrast, Rn strongly partitions from magma into gas [199,236]. Hence, if magma degassing endures for years to decades, (210Pb/226Ra) values are lowered as a function of the half-life of 210Pb (Figure 34a and b) and the 222Rn degassing efficiency [221,225]. Similarly, if 222Rn concentrates in the gas phase of a magma that has stalled somewhere, then 210Pb generated by decay of 222Rn can lead to a 210Pb excess (Figure 34a and b) in the magma (e.g. [209,222,236]). However, because of the large differences in the half-lives of 222Rn (3.8 days) and 210Pb, the erupted lavas must derive from a small part of the whole magma system, and the ratio of the magma that is degassing to the amount of magma that accumulates the 222Rn and erupts must be on the order of tens to thousands [222,225]. Lastly, if stored magma is undersaturated in volatiles or has maintained a steady pressure and temperature for a hundred years or more, (210Pb)/(226Ra) may attain a state of radioactive equilibrium [89].
Like 222Rn, 210Po, the immediate daughter of 210Pb, is volatile at magmatic temperatures. With its short half-life of 138 days, 210Po is useful for constraining degassing of magmas in the timeframe from months to weeks before eruption. Most lavas erupt with magmatic (210Po/210Pb) values near zero, indicating that they were degassing Po and other volatiles until eruption [199,222,231,232,233]. There are exceptions to this rule, however, including at Mount Erebus, which is discussed below. Prior work has attributed elevated (210Po/210Pb) values to (a) less efficient degassing resulting from a rapid rise of magma to the surface, (b) late-stage magmatic stagnation, or (c) infusion of Po from streaming gasses after magmas reach the near-surface environment (e.g., [206,238]).
Figure 34. (A) Schematic illustration showing how accumulation or degassing of 222Rn can lead to either (210Pb) excesses relative to (226Ra) or (210Pb) deficits relative to (226Ra). (B) Global compilation of (210Pb/226Ra) versus (226Ra/230Th) for arc and oceanic samples. Data from Gauthier & Condomines [221], Turner et al. [209], Rubin et al. [191], Reagan et al. [222,223]; Berlo & Turner [224]. Note both 210Pb excesses and deficits relative to 226Ra.
Preprints 184447 g034
In the following, we briefly discuss several examples using (210Pb/226Ra) and, where available, (210Po/210Pb) to understand magma degassing processes in mid-ocean ridge (9°03N EPR and the Lau Basin ABE vent site) and ocean island/plume settings (Hawaii, Tristan de Cunha, Mount Erebus Volcano). These examples are chosen to illustrate situations where (210Pb /226Ra) is greater than one, less than one, and at unity and clearly demonstrate that the relationships between crystallization, recharge, and volatile behavior are complex, but tractable, through the measurement of (210Pb/226Ra) coupled with other petrological, geochemical, and isotopic constraints.

5.1. Magma Degassing in Ocean Ridge Settings

While there is a substantial data set for (210Pb/226Ra) in young arc volcanic lavas (Figure 34b), there are relatively few studies using (210Pb/226Ra) to understand magma degassing in MORB. Early measurements of (210Pb/226Ra) disequilibria in MORB reported predominantly small 210Pb deficits, with 210Pb/226Ra as low as 0.86 [191,239], which were argued to be a result of melting (Figure 34b and Figure 35b), as Ra is significantly more incompatible in crystals than Pb during mantle melting [54].
However, small 210Pb excesses (~10%) were measured in young MORB (Figure 34b and Figure 35b) from the Axial Seamount on the Juan de Fuca Ridge [191,240]. Radon is more incompatible than Pb during mantle melting making 210Pb excesses more difficult to explain by simple mantle melting. However, because Pb is expected to behave more compatibly than Ra in both plagioclase and sulfide minerals, the 210Pb excesses could have been generated by preferential melting of plagioclase or sulfide minerals in the mantle or crust (perhaps from melt-rock reactions). However, these minerals would need to be young and have pre-existing 210Pb excesses. However, if this were the case, then one would expect correlations between geochemical indices of plagioclase or sulfide melting and (210Pb/226Ra) disequilibria, which are not observed in MORB with 210Pb excesses.
Figure 35. (A) (226Ra/230Th) versus (210Pb/226Ra) for lavas from the overlapping spreading center at 9°03 N EPR. Note the significant excesses of 210Pb relative to 226Ra for the basalts and basaltic andesites. (B) Axis-perpendicular schematic cross-section of the east limb of the 9103′N OSC, illustrating how Waters et al. [46] envision the formation of 210Pb excesses in basalt beneath a dacite magma body and the eruption of an off-axis pillow ridge from an off-axis magma body. (C) The inset illustration is an enlarged view of the sub-axial magma bodies and corresponds to the dashed box above. The illustration is not to scale. Additionally, while the illustration suggests the presence of a dacitic magma body overlying the sub-axial magma sill, the location of dacitic magma is not explicitly known. Detailed images and information on the seismically determined distribution and geometry of subsurface melt can be found in Kent et al. [241] and Singh et al. [242].
Preprints 184447 g035
More recently, larger excesses of 210Pb have been observed at two spreading-ridge locations, with (210Pb/226Ra) as high as 1.69 at 9°03N EPR (Figure 35; [44]) and 1.82 at the Lau Basin ABE vent site (Figure 32; [81]). In both cases, the large 210Pb excesses are posited to be caused by shallow magma chamber accumulation of 222Rn produced by deeper magmatic degassing. In general, buoyancy and viscosity relationships (i.e. Stokes' Law) suggest that gas bubbles will rise fast enough through basaltic magma (but not through more viscous, SiO2-rich magmas) to allow differential motion of Rn-bearing gas and melt phases over timescales similar to the half-life of 222Rn. However, it is worth noting that, as suggested for Pinatubo [243], Rn-bearing gas may rise even more rapidly through pipe vesicles and fractured viscous magma.
In the case of 9°03’ N EPR (Figure 35), there is a wide range of erupted lava compositions that includes viscous, dacitic lavas and an imaged melt lens [241]. Waters et al. [46] envisioned a scenario in which a relatively large volume of basaltic magma residing within the lower to middle crust is continuously degassing. Radon-bearing, CO2-rich gas bubbles rise and accumulate within a smaller, shallow reservoir of basalt and basaltic andesite beneath a larger volume of more viscous, dacite magma. 222Rn accumulates in the resulting bubble-rich basaltic froth and decays to 210Pb. Density instability due to accumulation of this buoyant basaltic froth beneath dacitic magma may also facilitate magma mixing between basaltic and dacitic magma end-members, resulting in eruptions of mafic to intermediate lavas with large 210Pb excesses.
In the case of the ABE lavas (Figure 32), which erupted off-axis from the main Lau Spreading center, Sims et al. [81] similarly posit that their 210Pb excesses were created by a low-density, high-viscosity, rheological magma barrier which prevented volatile phase migration and caused a build-up of water and 222Rn in an underlying magma layer. This hypothesis is supported by two observations about the ABE lavas: 1) they have geochemical signatures suggesting they have been significantly influenced by subduction processes and therefore are relatively water-rich, and 2) they are relatively SiO2-rich with high viscosities, which would cause a rheological barrier.

5.2. Magma Degassing in Ocean Island Plume Settings

5.2.1. Kilauea

Kilauea volcano on the island of Hawaii is one of the Earth’s most active volcanoes. During the period from 1983 to 2018, Kilauea erupted nearly continuously, predominantly from the Pu‘u‘ O‘o vent, with brief eruptions from other vents and fissure systems. Gas emissions at the summit caldera occurred over the entire period [244]. Girard et al. [163] analyzed (210Pb/226Ra) ratios in lavas erupted over this period up through 2008. With the exception of lavas emitted when vents first opened, lavas from Pu‘u ‘O‘o, the nearby Kupahianaha vent, and Halema’uma’u within the summit caldera had (210Pb)/(226Ra) = 0.80±0.11. These 210Pb deficits were attributed to loss of Rn partitioned into CO2-rich gasses from the point of volatile saturation at about 30 km depth to the surface over an average of 8 years. These data show that lavas erupted steadily at Kilauea rise to the surface after volatile saturation without significantly stalling within its magma chamber system. In contrast, more crystalline lavas that erupted immediately after the vent openings at Pu’u’ O’o and Napau, which is up-rift of Pu’u’ O’o, had near-equilibrium (210Pb/226Ra) values, implying that these lavas had been stored in the rift system for several decades or more before being pushed out by newly intruding magmas.
Explosions in March 2008 opened a vent along the lower east wall of Halema’uma’u, ejecting basalts and altered lithic fragments. These explosions were followed by effusion of lavas that filled the crater. This marked the first eruption in recorded history when lavas simultaneously erupted from the summit and the East Rift Zone at Kilauea. Tephra samples with altered rock fragments and Pele’s hair had 210Pb excesses over 226Ra resulting from 222Rn decay as well as minor Pb condensation and infusion from magmatic gasses (Figure 36). Lava samples erupted during this episode have (210Pb/226Ra) values ranging from 0.8 to 1, suggesting they represented both stored and new lavas [163].
Several samples erupted between 2005 and 2008 were also serially analyzed for (210Po). This serial analysis allows fitting of a radiogenic ingrowth curve and thus determination of both (210Po) and (210Pb) at the time of eruption. All lavas erupted from Pu‘u ‘O‘o have near-zero initial (210Po)/(210Pb) values (Figure 36). Several samples from Halema’uma’u had similarly low values, including one with an equilibrium (210Pb)/(226Ra) value. Thus, newly arrived magmas as well as some of the shallowly stored magmas must have degassed until eruption. Pele’s hair and tephra samples erupted in 2008 from Halema’uma’u, in contrast, had significant excesses of (210Po) over (210Pb) with measured (210Po)/(210Pb) values as high as 6.5 soon after eruption. This is despite acid leaching of the Kilauea samples to remove 210Po-bearing sublimates from sample surfaces. These 210Po excesses were created by the infusion of Po from magmatic gasses into particles making up the fragmental deposits. A presence of sublimated Po on the surfaces of tephra particles was clearly shown by the high (210Po) values measured in leachates, particularly from the Pele’s hair sample (Figure 36). This illustrates a rarely mentioned, but noteworthy, hazard associated with erupting, as well as passively degassing, volcanoes, namely the presence of short-lived radionuclides, including those that decay by energetic alpha emissions, on ash and smoke particles in volcanic plumes.
Figure 36. Measured (210Po) values in decays per minute per gram (circles with 2σ error bars) and ingrowth curves for two samples erupted from Kilauea plotted against the number of days between the eruption and the date of analysis. Also plotted are (226Ra) values for these samples. Samples have been leached with 0.5 M HCl to remove polonium from surfaces. (A) Lava sample erupted in 2005. Partitioning of polonium into the gas phase led to an initial (210Po) value near 0. The best fit ingrowth curve gives an initial (210Pb) value of 0.204 dpm/g, which is below the measured (226Ra) value of 0.244 dpm/g. Deficits of 210Pb with respect to 226Ra in Kilauea lavas are likely caused by persistent 222Rn loss during magma degassing before eruption [163]. For this sample, 6 years of persistent Rn-degassing would be needed. (B) Pele’s hair erupted in 2008. The leached sample had excess 210Po, which decayed towards an initial (210Pb) value above that of (226Ra) suggesting that the Pele’s hair fibers contained Pb absorbed from the gas phase. The leachate for this sample had (210Po) = 952, illustrating the high (210Po) concentrations in sublimated particles generated from cooling magmatic gasses [163].
Preprints 184447 g036

5.2.2. Tristan de Cunha

Tristan de Cunha island is a remote oceanic volcanic center in the South Atlantic Ocean at the west end of the Walvis Ridge, which has been attributed to mantle melting in a long-lived mantle plume. On July 19-20, 2004, a period of intense seismic activity was recorded by newly installed Comprehensive Test Ban Treaty Organization/International Monitoring System seismometers on Tristan da Cunha, indicating that there had been an eruption on a rift zone flanking the nearby Nightingale Island. A few days later, pumice began to wash up on local beaches. Samples of the pumice were collected by the British Geological Survey, and one was analyzed for (210Pb/226Ra), as reported by Reagan et al. [223]. The pumice was phonolite, a highly differentiated lava produced by crystal fractionation from an alkaline basalt. 210Pb was enriched over 226Ra by about 50% in the phonolite, despite accompanying evidence for degassing of volatile elements such as Po, and thus Rn, associated with the eruption. Instead of gas accumulation, the 210Pb excess in this case was attributed to the extensive fractionation of feldspars and amphiboles required to produce phonolite from basalt, as both of these phases preferentially incorporate Ra over Pb into their crystal structures. Modeling of these and other data showed that the original basaltic magma was low in volume and had intruded into the rift zone no more than two centuries before eruption. The significant 210Pb excess in the pumice showed that the crystal fractionation to generate the phonolite was likely ongoing until the time of eruption. Serial analysis of 210Po in the same sample (Figure 37) showed that it had an initial (210Po)/(210Pb) value of 0.15 upon eruption, illustrating that the pumice in question was indeed ejected during the July 2004 eruption [223].
Figure 37. Measured (210Po) and ingrowth curves for an acid-leached sample of phonolite pumice collected from a beach on Tristan da Cunha in September 2004. Also plotted are (226Ra) values for this sample. The illustrated 210Po deficit with respect to 210Pb shows that this pumice erupted within a few months of the date of collection. The most likely origin of the pumice was a subsea eruption associated with an earthquake swarm offshore of Nightingale Island on July 29 and 30, 2004. The (210Pb) excess over (226Ra) calculated from the (210Po) ingrowth curve was attributed to rapid crystal fractionation of Ra-bearing minerals from the magma over a period of several decades to a century before the eruption [223].
Preprints 184447 g037

5.2.3. Mount Erebus Volcano

Mount Erebus Volcano has a HIMU radiogenic Sr, Nd, Hf, and Pb isotopic signature [245] and a thermal structure suggestive of deep mantle upwelling [246,247]. Mount Erebus also has the most persistent, continuously degassing lava lake on Earth [89,90,245,248]. The Erebus lava lake degasses both by quiescent emissions and strombolian eruptions with distinct gas compositions [249]. These originate from different depths within the magma conduit, with the quiescent emissions coming from shallow passive degassing, and deeper eruptions deriving from deep within the system ([90], and references therein).
Measurements of U and Th decay series nuclides in young Erebus lava bombs (collected at the time of eruption) show (210Pb/226Ra) of unity and are thus in radioactive equilibrium [89]. This observation, that 210Pb is in equilibrium with 226Ra, is rather surprising as one would expect that removal of 222Rn by magma degassing would have a significant impact on the (210Pb/226Ra) of the magma. To explain the measured (210Pb/226Ra) of unity in the young, known-age Erebus phonolite bombs, Sims et al. [89] posited that magma degassing for the phonolitic magma occurred deeper and hundreds of years before eruption and therefore (210Pb) and (226Ra) had reached a state of radioactive equilibrium. In this scenario, the anorthoclase-rich phonolite circulating in the upper part of the magmatic system is made of old, degassed magma that does not communicate with gas emissions derived from deeper parts of the magma chamber. These ongoing emissions are rising to the surface and causing the periodic strombolian eruptions (see e.g., Sims et al. [90], and references therein for an overview of degassing processes on Erebus volcano).
This scenario is consistent with a) the observation that the melt inclusions from anorthoclase megacrysts are highly degassed compared to melt inclusions in olivine from parental basalts from around the flanks of the volcano [250,251,252]; b) calculated magma residence times, using measurements of all relevant 238U, 235U, and 232Th decay nuclides from phonolite glass and anorthoclase megacrysts in known-age lava bombs, are on the order of a thousand years (Figure 29); and c) for the 2005 lava bomb, whose eruption date (16 December, 2005) is known explicitly, serial analysis showed (210Po)/(210Pb) = 0.28, which is significantly higher than observed in most zero-aged lavas, indicating that 210Po was not completely degassed from the lava at the time of eruption. This (210Po)/(210Pb) value was modeled to show that the shallow magma/lava lake system, on average, degasses about 1% of its Po per day [89].

6. Brief Overview of Techniques for Measuring U-Series Nuclides in Oceanic Volcanic Rocks

The U and Th decay series isotope systematics (see section 2) make the measurement of U and Th decay series nuclides quite challenging for two reasons:
  • Because the equilibrium abundances of the U and Th decay series nuclides are proportional to their respective half-lives (a=λn, where a=activity, λ= ln(2)/half-life, and n=number of atoms), the short-lived progeny of 232Th, 238U, and 235U occur in very low concentrations. For example, in most oceanic basalts, 232Th and 238U are generally found in weight concentrations of ng/g to ug/g, 234U and 230Th in concentrations of pg/g, 226Ra in concentrations of fg/g, and 228Ra and 210Pb in concentrations of ag/g.
  • Isotope ratios involving long-lived and short-lived nuclides are often quite extreme as the equilibrium atomic ratios of the various elements are set by the ratio of their decay constants; as such the measured ratios are typically on the order of 10-5 for 234U/238U, 10-6 for 230Th/232Th, 10-3 for 226Ra/228Ra, and 10-8 for 210Pb/208Pb.
Early measurements of U decay series nuclides relied exclusively on alpha- and gamma-spectrometric methods that counted individual decay events [186,199,231,233,253]. These counting methods provided seminal and cutting-edge U and Th-decay series data and are still used today for short-lived nuclides such as 210Pb, 210Po, 228Th, and 227Ac [37,45,81,88,89,163,206,254,255]. However, for the longer-lived U and Th decay series isotopes 232Th, 238U, 230Th, and 226Ra, these decay counting techniques have very large uncertainties due to their low count rates. Thus, mass spectrometric methods that count atoms rather than decay events, such as TIMS, SIMS, and MC-ICPMS, significantly improve sensitivity and precision for the measurement of the longer-lived isotopes such as 238U-234U-230Th-226Ra and 235U-231Pa, while simultaneously decreasing analysis times significantly [35,167,210,256,257,258,259,260,261,262,263,264]. Readers are referred to the above papers for details on chemical separations and purification methods and counting and mass spectrometric techniques. For a one-to-one comparison of samples measured by both alpha and gamma versus mass spectrometry, see Sims et al. [262].
Finally, quality assurance needs careful attention, particularly when calculating U-series disequilibria, as these ages involve multiple measurements and therefore propagation of many and varied sources of analytical uncertainty. This includes determining the uncertainties of each individual factor leading to the analytical measurement. Such uncertainty propagation can become complicated when there is covariance between measurement errors. Several papers explicitly address the proper handling of errors associated with U and Th decay series chronological measurements (e.g., [265], and references therein). It is important to note that reference materials, run as unknowns, are essential for establishing both the precision and accuracy of the measurements. One crucial quality of U and Th decay series measurements is that the equilibrium decay principles establish the relative abundances of the parent-daughter pairs. Determining both the precision and accuracy of these abundances requires use of unaltered quality assurance materials (e.g., well characterized international rock standards) that are old relative to the half-lives of the isotope system of interest (e.g. [262,263,265,266]).

7. Summary

This paper demonstrates the potential of U and Th decay series for unraveling the temporal complexities of oceanic magmatism. While there admittedly are remaining uncertainties limiting the results that are obtainable from U and Th decay series measurements, there are several robust results.
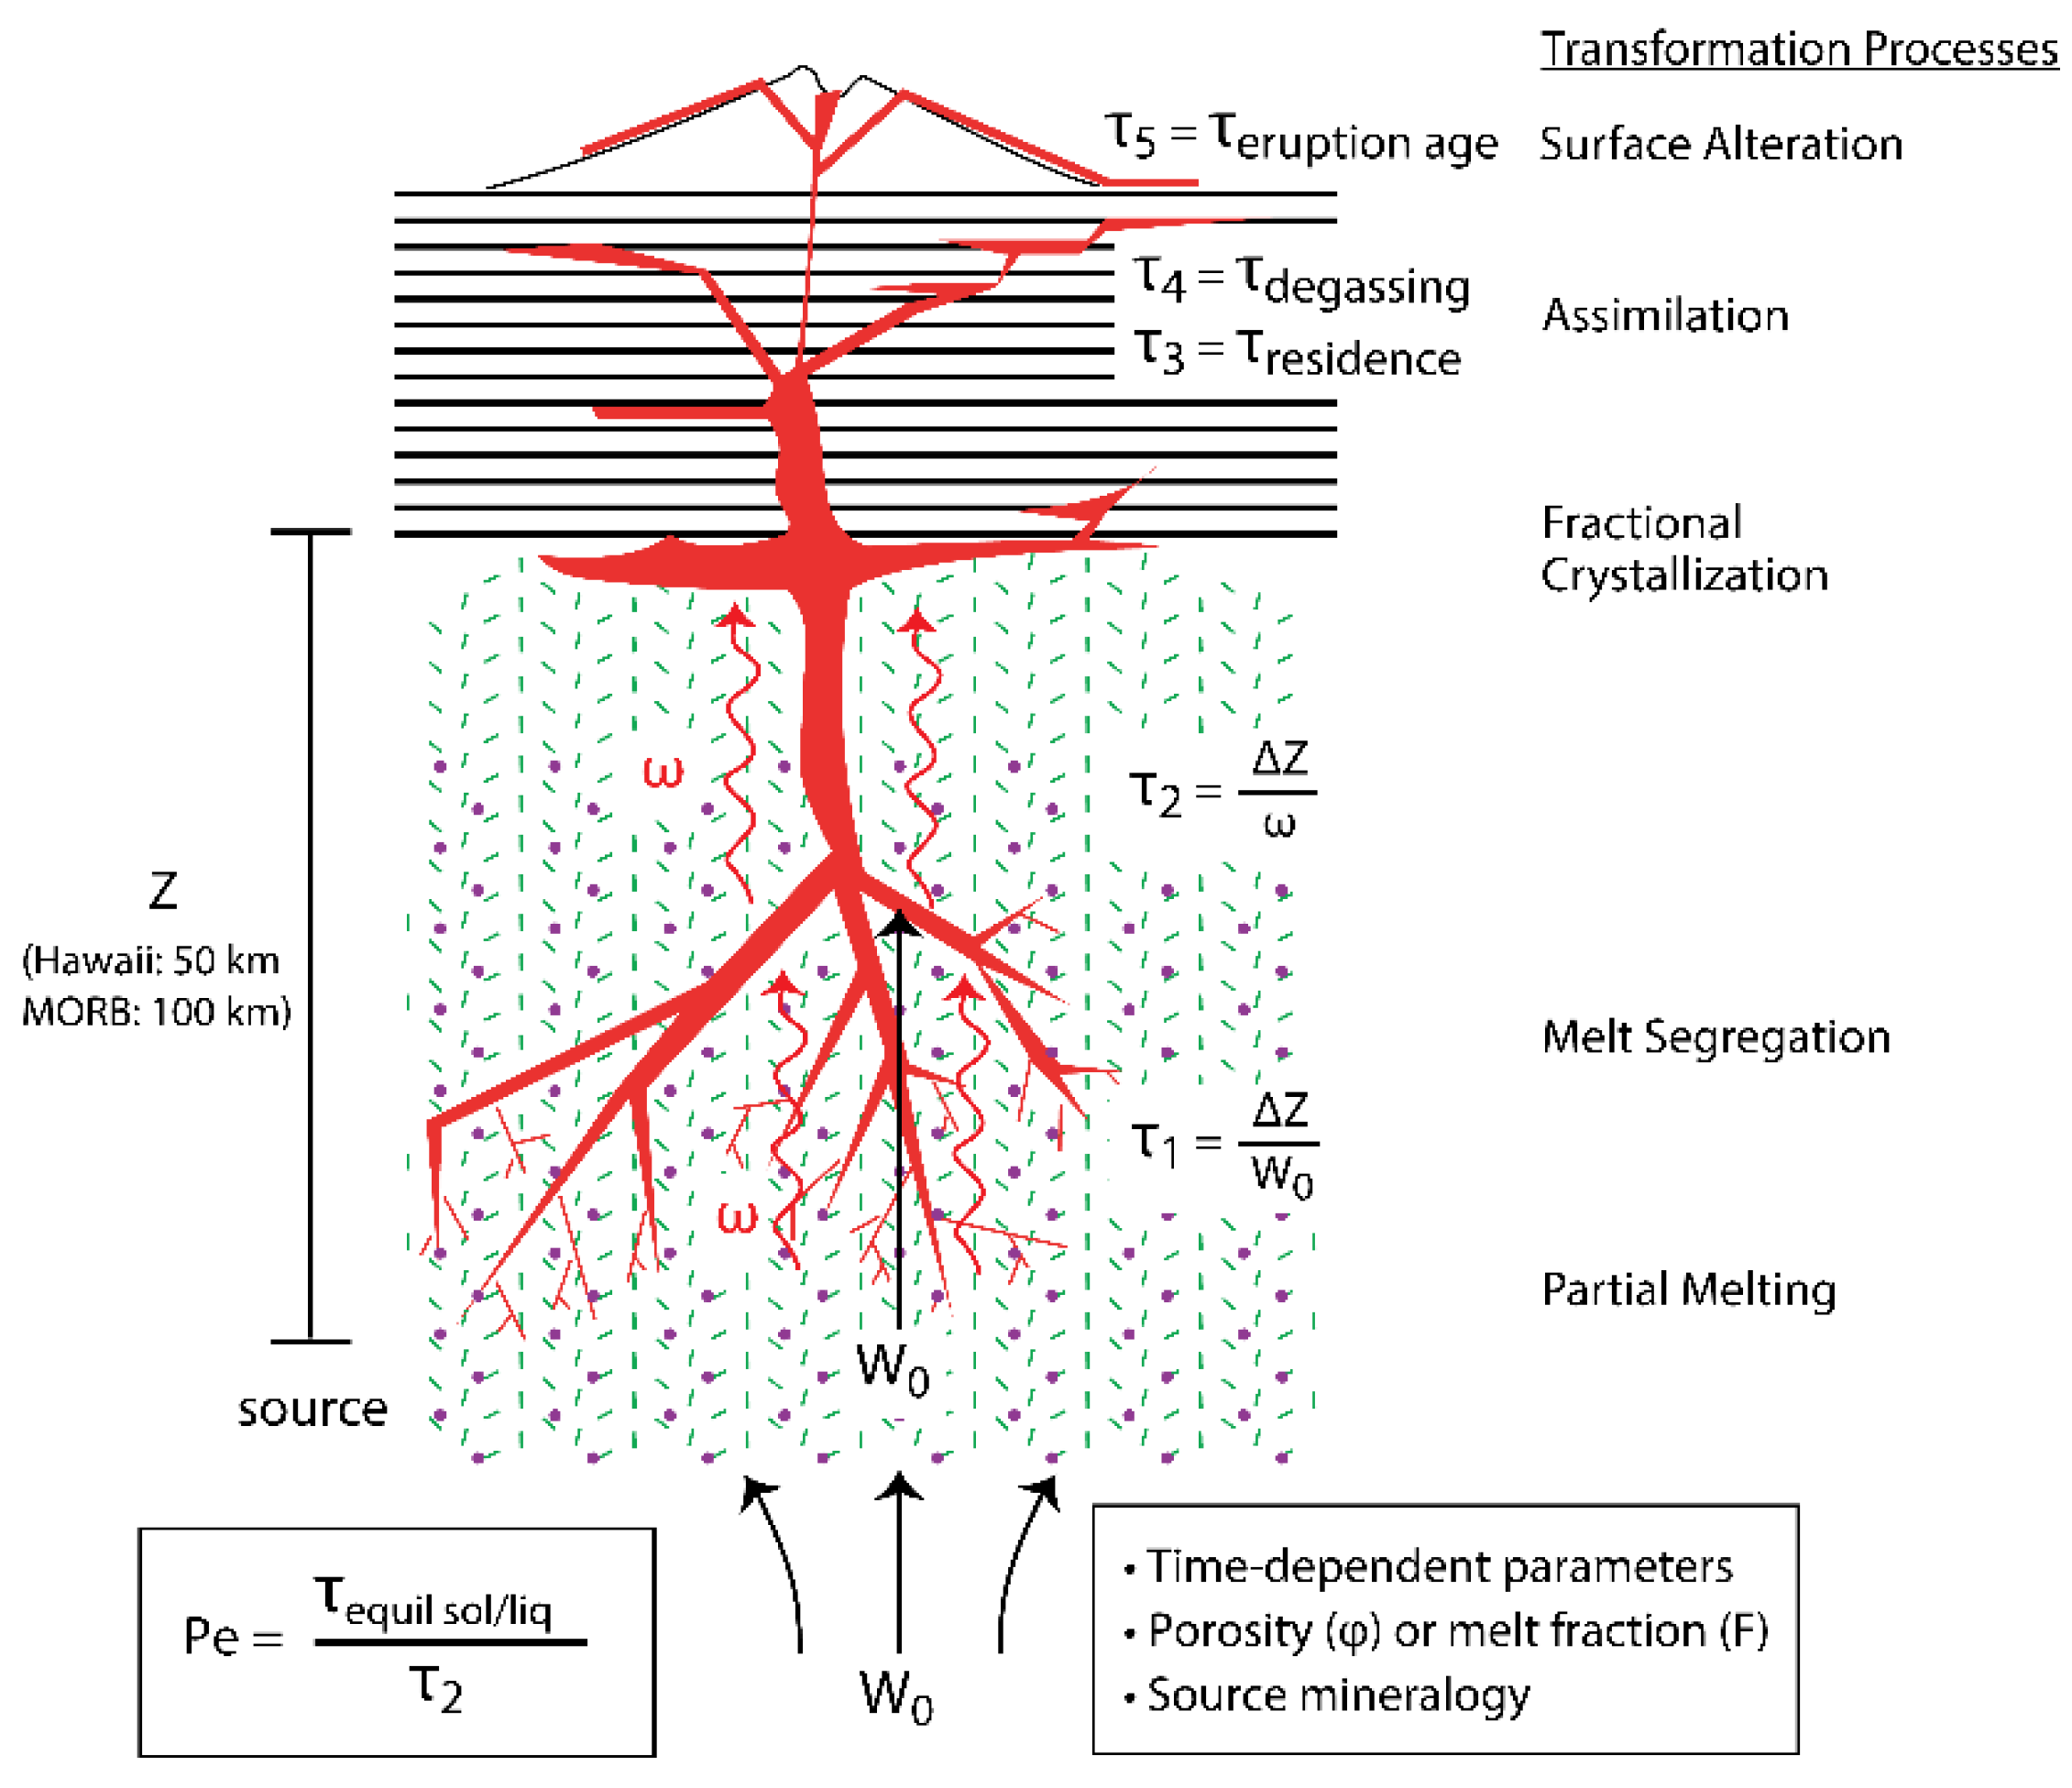
  • Defining the timescales of magma genesis during decompression mantle melting. The formation and transport of basaltic magma in the mantle during adiabatic decompression can be characterized in terms of the velocity of the upwelling solid mantle, the rate of melting, the melt velocity, melt transport processes (time scale, focused and diffuse, closed or open system), and the delay time, or storage time, of magma before eruption. While the velocity of upwelling mantle and the corresponding melting rate can be estimated from models coupled with thermodynamic data and geophysical observations (e.g., [23,24,150,267]), the melt velocity and magma storage times are difficult to estimate from first principles and require measurement. Fortunately, because the daughter isotopes 230Th and 226Ra of the 238U decay series and the daughter isotope 231Pa of the 235U decay series have half-lives that bracket the timescales over which melting and melt extraction are thought to occur, measurements of (230Th/238U), (226Ra/230Th), and (231Pa/235U) ratios in young basaltic lavas provide unique information on the timescales and modes of melt generation and transport.
  • Determining the eruption ages of oceanic Quaternary volcanism. Without lava ages it is not possible to relate volcanic activity to tectonics processes, establish the timing and duration of changes in lava compositions, and link hydrothermal and biological activities to fluctuations in submarine and subaerial oceanic volcanism. Thus, age constraints are not a detail, they are necessary. Without them, our understanding of oceanic systems will remain limited. Dating young submarine lavas has proven to be notoriously difficult – long-lived radiogenic isotope systems such as Rb-Sr, Sm-Nd, Lu-Hf, and U-Th-Pb have half-lives that are too long and hence lack the temporal resolution for precise ages; cosmogenic age dating on the ocean floor is not possible; potassium-argon dating techniques suffer from a myriad of problems when applied to young oceanic basalts; and sedimentation rates are known to vary widely over short spatial scales. Thus, the visual appearance of lavas provides only a subjective, semi-quantitative estimate of age [268]. Fortunately, 238U and 232Th decay series disequilibria can provide robust constraints on the eruption ages of young oceanic basalts. The application of the 238U, 235U, and 232Th for dating eruption ages of volcanic rocks uses three different approaches: 1) age limits, whereby the absence or presence of disequilibria can place bounds on the eruption age of a lava; 2) internal mineral isochron methods, which establish the crystallization age of a volcanic rock; and 3) U-Th-Ra 'model' ages, which couple measurements of U and Th disequilibria with geological, geochemical, and isotopic constraints to estimate the eruption age of an individual lava or a sequence of lavas.
  • Establishing the timescales of magma recharge and degassing. Processes operating within magma reservoirs affect both the physical state and the chemical composition of magmas within them. Measurements of (210Po), (210Pb), and (210Bi) in gas emissions from actively degassing open-conduit systems and (210Pb)/(226Ra) and (228Ra/228Th) in young known-age erupted lavas provide otherwise unobtainable constraints on the timescales of magma recharge and degassing. These timescales are directly linked to a volcano’s activity and are thus fundamental to our understanding of physical eruption dynamics and hazard assessment.

References

  1. Bourdon, B.; Henderson, G.M.; Lundstrom, C.C.; Turner, S. Uranium-Series Geochemistry, Vol. 52; Mineralogical Society of America: Washington, D.C., United States, 2003. [Google Scholar]
  2. Bateman, H. The solution of a system of differential equations occurring in the theory of radioactive transformations. Proc. Cambridge Philos. Soc. 1910, 15, 423–427. [Google Scholar]
  3. Ivanovich, M.; Harmon, R.S. Uranium-Series Disequilibrium: Applications to Earth, Marine, and Environmental Sciences, 2nd ed.; Clarendon Press: Oxford, United Kingdom, 1992. [Google Scholar]
  4. Sims, K.W.W.; Stark, G.J.; Reagan, M.R. An Essential Quaternary Clock for Earth System Sciences: An Overview of the Theory and Applications of U and Th Decay Series Isotopes for the Dating of Young Igneous and Sedimentary Rocks. In Encyclopedia of Geology, 2nd ed.; Alderton, D., Elias, S.A., Eds.; Elsevier: Cambridge, Massachusetts, United States, 2021; Volume 6, pp. 76–100. [Google Scholar] [CrossRef]
  5. Allègre, C.J. 230Th dating of volcanic rocks: a comment. Earth Planet. Sci. Lett. 1968, 5, 209–210. [Google Scholar] [CrossRef]
  6. Owens, S.A.; Buesseler, K.O.; Sims, K.W.W. Re-evaluating the 238U-salinity relationship in seawater: Implications for the 238U-234Th disequilibrium method. Mar. Chem. 2011, 127, 31–39. [Google Scholar] [CrossRef]
  7. Allègre, C.J.; Condomines, M. Basalt genesis and mantle structure studied through Th-isotopic geochemistry. Nature 1982, 299, 21–24. [Google Scholar] [CrossRef]
  8. Sims, K.W.W.; DePaolo, D.J.; Murrell, M.T.; Baldridge, W.S.; Goldstein, S.J.; Clague, D.A. Mechanisms of magma generation beneath Hawaii and mid-ocean ridges: Uranium/thorium and samarium/neodymium isotopic evidence. Science 1995, 267, 508–512. [Google Scholar] [CrossRef]
  9. Elliott, T.R. Fractionation of U and Th during mantle melting: A reprise. Chem. Geol. 1997, 139, 165–183. [Google Scholar] [CrossRef]
  10. McKenzie, D. The generation and compaction of partially molten rock. J. Petrol. 1984, 25, 713–765. [Google Scholar] [CrossRef]
  11. Williams, R.W.; Gill, J.B. Effects of partial melting on the uranium decay series. Geochim. Cosmochim. Acta 1989, 53, 1607–1619. [Google Scholar] [CrossRef]
  12. Spiegelman, M.; Elliott, T. Consequences of melt transport for uranium series disequilibrium in young lavas. Earth Planet. Sci. Lett. 1993, 118, 1–20. [Google Scholar] [CrossRef]
  13. Lundstrom, C.C.; Gill, J.; Williams, Q.; Perfit, M.R. Mantle melting and basalt extraction by equilibrium porous flow. Science 1995, 270, 1958–1961. [Google Scholar] [CrossRef]
  14. McKenzie, D. 230Th-238U disequilibrium and the melting processes beneath ridge. Earth Planet Sci Lett 1985, 72, 149–157. [Google Scholar] [CrossRef]
  15. Qin, Z.W. Disequilibrium partial melting model and its implications for trace element fractionations during mantle melting. Earth Planet. Sci. Lett. 1992, 112, 75–90. [Google Scholar] [CrossRef]
  16. Qin, Z.W. Dynamics of melt generation beneath midocean ridge axes-theoretical analysis based on 238U-230Th-226Ra and 235U-231Pa disequilibria. Geochim. Cosmochim. Acta 1993, 57, 1629–1634. [Google Scholar] [CrossRef]
  17. Iwamori, H. 238U-230Th-226Ra and 235U-231Pa disequilibria produced by mantle melting with porous and channel flows. Earth Planet. Sci. Lett. 1994, 125, 1–16. [Google Scholar] [CrossRef]
  18. Richardson, C.; McKenzie, D. Radioactive disequilibria from 2D models of melt generation by plumes and ridges. Earth Planet. Sci. Lett. 1994, 128, 425–437. [Google Scholar] [CrossRef]
  19. Sims, K.W.W.; DePaolo, D.J.; Murrell, M.T.; Baldridge, W.S.; Goldstein, S.; Clague, D.; Jull, M. Porosity of the melting zone and variations in the solid mantle upwelling rate beneath Hawaii: Inferences from 238U-230Th-226Ra and 235U-231Pa disequilibria. Geochim. Cosmochim. Acta 1999, 63, 4119–4138. [Google Scholar] [CrossRef]
  20. Sims, K.W.W.; Goldstein, S.J.; Blichert-Toft, J.; Perfit, M.R.; Kelemen, P.; Fornari, D.J.; Michael, P.; Murrell, M.T.; Hart, S.R.; DePaolo, D.J.; Layne, G.D.; Jull, M. Chemical and isotopic constraints on the generation and transport of melt beneath the East Pacific Rise. Geochim. Cosmochim. Acta 2002, 66, 3481–3504. [Google Scholar] [CrossRef]
  21. Stracke, A.; Zindler, A.; Salters, V. J.; McKenzie, D.; Grönvold, K. The dynamics of melting beneath Theistareykir, northern Iceland. Geochem. Geophys. Geosyst. 2003, 4. [Google Scholar] [CrossRef]
  22. Stracke, A.; Bourdon, B.; Mckenzie, D. Melt extraction in the Earth’s mantle: Constraints from U–Th–Pa–Ra studies in oceanic basalts. Earth Planet. Sci. Lett. 2006, 244, 97–112. [Google Scholar] [CrossRef]
  23. Mckenzie, D.; Bickle, M.J. The volume and composition of melt generated by extension of the lithosphere. J. Petrol. 1988, 29, 625–679. [Google Scholar] [CrossRef]
  24. Asimow, P.D.; Hirschmann, M.M.; Stolper, E.M. An analysis of variations in isentropic melt productivity. Phil. Trans. R. Soc. A 1997, 355, 255–281. [Google Scholar] [CrossRef]
  25. Turner, S.; Hawkesworth, C.; Rogers, N.; King, P. U-Th isotope disequilibria and ocean island basalt generation in the Azores. Chem. Geol. 1997, 139, 145–164. [Google Scholar] [CrossRef]
  26. Bourdon, B.; Langmuir, C.H.; Zindler, A. Ridge-hotspot interaction along the Mid-Atlantic Ridge between 37°30′ and 40°30′N: The U-Th disequilibrium evidence. Earth Planet. Sci. Lett. 1996, 142, 175–189. [Google Scholar] [CrossRef]
  27. Bourdon, B.; Zindler, A.; Elliott, T.; Langmuir, C. Constraints on mantle melting at mid-ocean ridges from global 238U-230Th disequilibrium data. Nature 1996, 384, 231–235. [Google Scholar] [CrossRef]
  28. Bourdon, B.; Joron, J.-L.; Claude-Ivanaj, C.; Allègre, C. J. U–Th–Pa–Ra systematics for the Grande Comore volcanics: Melting processes in an upwelling plume. Earth Planet. Sci. Lett. 1998, 164, 119–133. [Google Scholar] [CrossRef]
  29. Dosso, L.; Bougault, H.; Langmuir, C.; Bollinger, C.; Bonnier, O.; Etoubleau, J. The age and distribution of mantle heterogeneity along the Mid-Atlantic Ridge (31–41 N). Earth Planet. Sci. Lett. 1999, 170, 269–286. [Google Scholar] [CrossRef]
  30. Claude-Ivanaj, C.; Bourdon, B.; Allègre, C.J. Ra-Th-Sr isotope systematics in Grande Comore Island: a case study of plume-lithosphere interaction. Earth Planet. Sci. Lett. 1998, 164, 99–117. [Google Scholar] [CrossRef]
  31. Claude-Ivanaj, C.; Joron, J.-L.; Allègre, C.J. 238U-230Th-226Ra fractionation in historical lavas from the Azores : long-lived source heterogeneity vs. Metasomatism fingerprints. Chem. Geol. 2001, 176, 295–310. [Google Scholar] [CrossRef]
  32. Bourdon, B.; Van Orman, J.A. Melting of enriched mantle beneath Pitcairn seamounts: Unusual U–Th–Ra systematics provide insights into melt extraction processes. Earth Planet. Sci. Lett. 2009, 277, 474–481. [Google Scholar] [CrossRef]
  33. Lundstrom, C.C.; Williams, Q.; Gill, J.B. Investigating solid mantle upwelling rates beneath mid-ocean ridges using U-series disequilibria, 1: a global approach. Earth Planet. Sci. Lett. 1998, 157, 151–165. [Google Scholar] [CrossRef]
  34. Lundstrom, C.C.; Sampson, D.E.; Perfit, M.R.; Gill, J.; Williams, Q. Insight into mid-ocean ridge basalt petrogenesis: U-series disequilibria from the Siqueiros Transform, Lamont Seamounts, and East Pacific Rise, J. Geophys. Res. 1999, 104, 13035–13048. [Google Scholar] [CrossRef]
  35. Sims, K.W.W.; Hart, S.R.; Reagan, M.K.; Blusztajn, J.; Staudigel, H.; Sohn, R.A.; Layne, G.D.; Ball, L.A.; Andrews, J. 238U-230Th-226Ra-210Pb-210Po, 232Th-228Ra, and 235U-231Pa constraints on the ages and petrogenesis of Vailulu’u and Malumalu Lavas, Samoa. Geochem. Geophys. Geosyst. 2008, 9. [Google Scholar] [CrossRef]
  36. Sims, K.W.W.; Maclennan, J.; Blichert-Toft, J.; Mervine, E.M.; Bluzstajn, J.; Grönvold, K. Short length scale mantle heterogeneity beneath Iceland probed by glacial modulation of melting. Earth Planet. Sci. Lett. 2013, 379, 146–157. [Google Scholar] [CrossRef]
  37. Phillips, E.H.; Sims, K.W.W.; Sherrod, D.R.; Salters, V.J.M.; Blusztajn, J.; Dulai, H. Isotopic constraints on the genesis and evolution of basanitic lavas at Haleakala, Island of Maui, Hawaii. Geochim. Cosmochim. Acta 2016, 195, 201–225. [Google Scholar] [CrossRef]
  38. Sigmarsson, O.; Carn, S.; Carracedo, J.C. Systematics of U-series nuclides in primitive lavas from the 1730–36 eruption on Lanzarote, Canary Islands, and implications for the role of garnet pyroxenites during oceanic basalt formations. Earth Planet. Sci. Lett. 1998, 162, 137–151. [Google Scholar] [CrossRef]
  39. Williams, R.W.; Gill, J.B. Th isotope and U-series disequilibria in some alkali basalts. Geophys. Res. Lett. 1992, 19, 139–142. [Google Scholar] [CrossRef]
  40. Peate, D.W.; Hawkesworth, C.J.; van Calsteren, P.W.; Taylor, R.N.; Murton, B.J. 238U-230Th constraints on mantle upwelling and plume-ridge interaction along the Reykjanes Ridge. Earth Planet. Sci. Lett. 2001, 187, 259–272. [Google Scholar] [CrossRef]
  41. Sturm, M.E.; Goldstein, S.J.; Klein, E.M.; Karson, J.A.; Murrell, M.T. Uranium-series age constraints on lavas from the axial valley of the Mid-Atlantic Ridge, MARK area. Earth Planet. Sci. Lett. 2000, 181, 61–70. [Google Scholar] [CrossRef]
  42. Tepley, F.J. III; Lundstrom, C.C.; Sims, K.W.W.; Hékinian, R. U-series disequilibria in MORB from the Garrett Transform and implications for mantle melting. Earth Planet. Sci. Lett. 2004, 223, 79–97. [Google Scholar] [CrossRef]
  43. Elkins, L.J.; Sims, K.W.W.; Prytulak, J.; Elliott, T.; Mattielli, N.; Blichert-Toft, J.; Blusztajn, J.; Devey, C.; Mertz, D.; Schilling, J.-G.; M. Murrell. Understanding melt generation beneath the slow-spreading Kolbeinsey Ridge using 238U, 230Th, and 231Pa excesses. Geochim. Cosmochim. Acta 2011, 75, 6300–6329. [Google Scholar] [CrossRef]
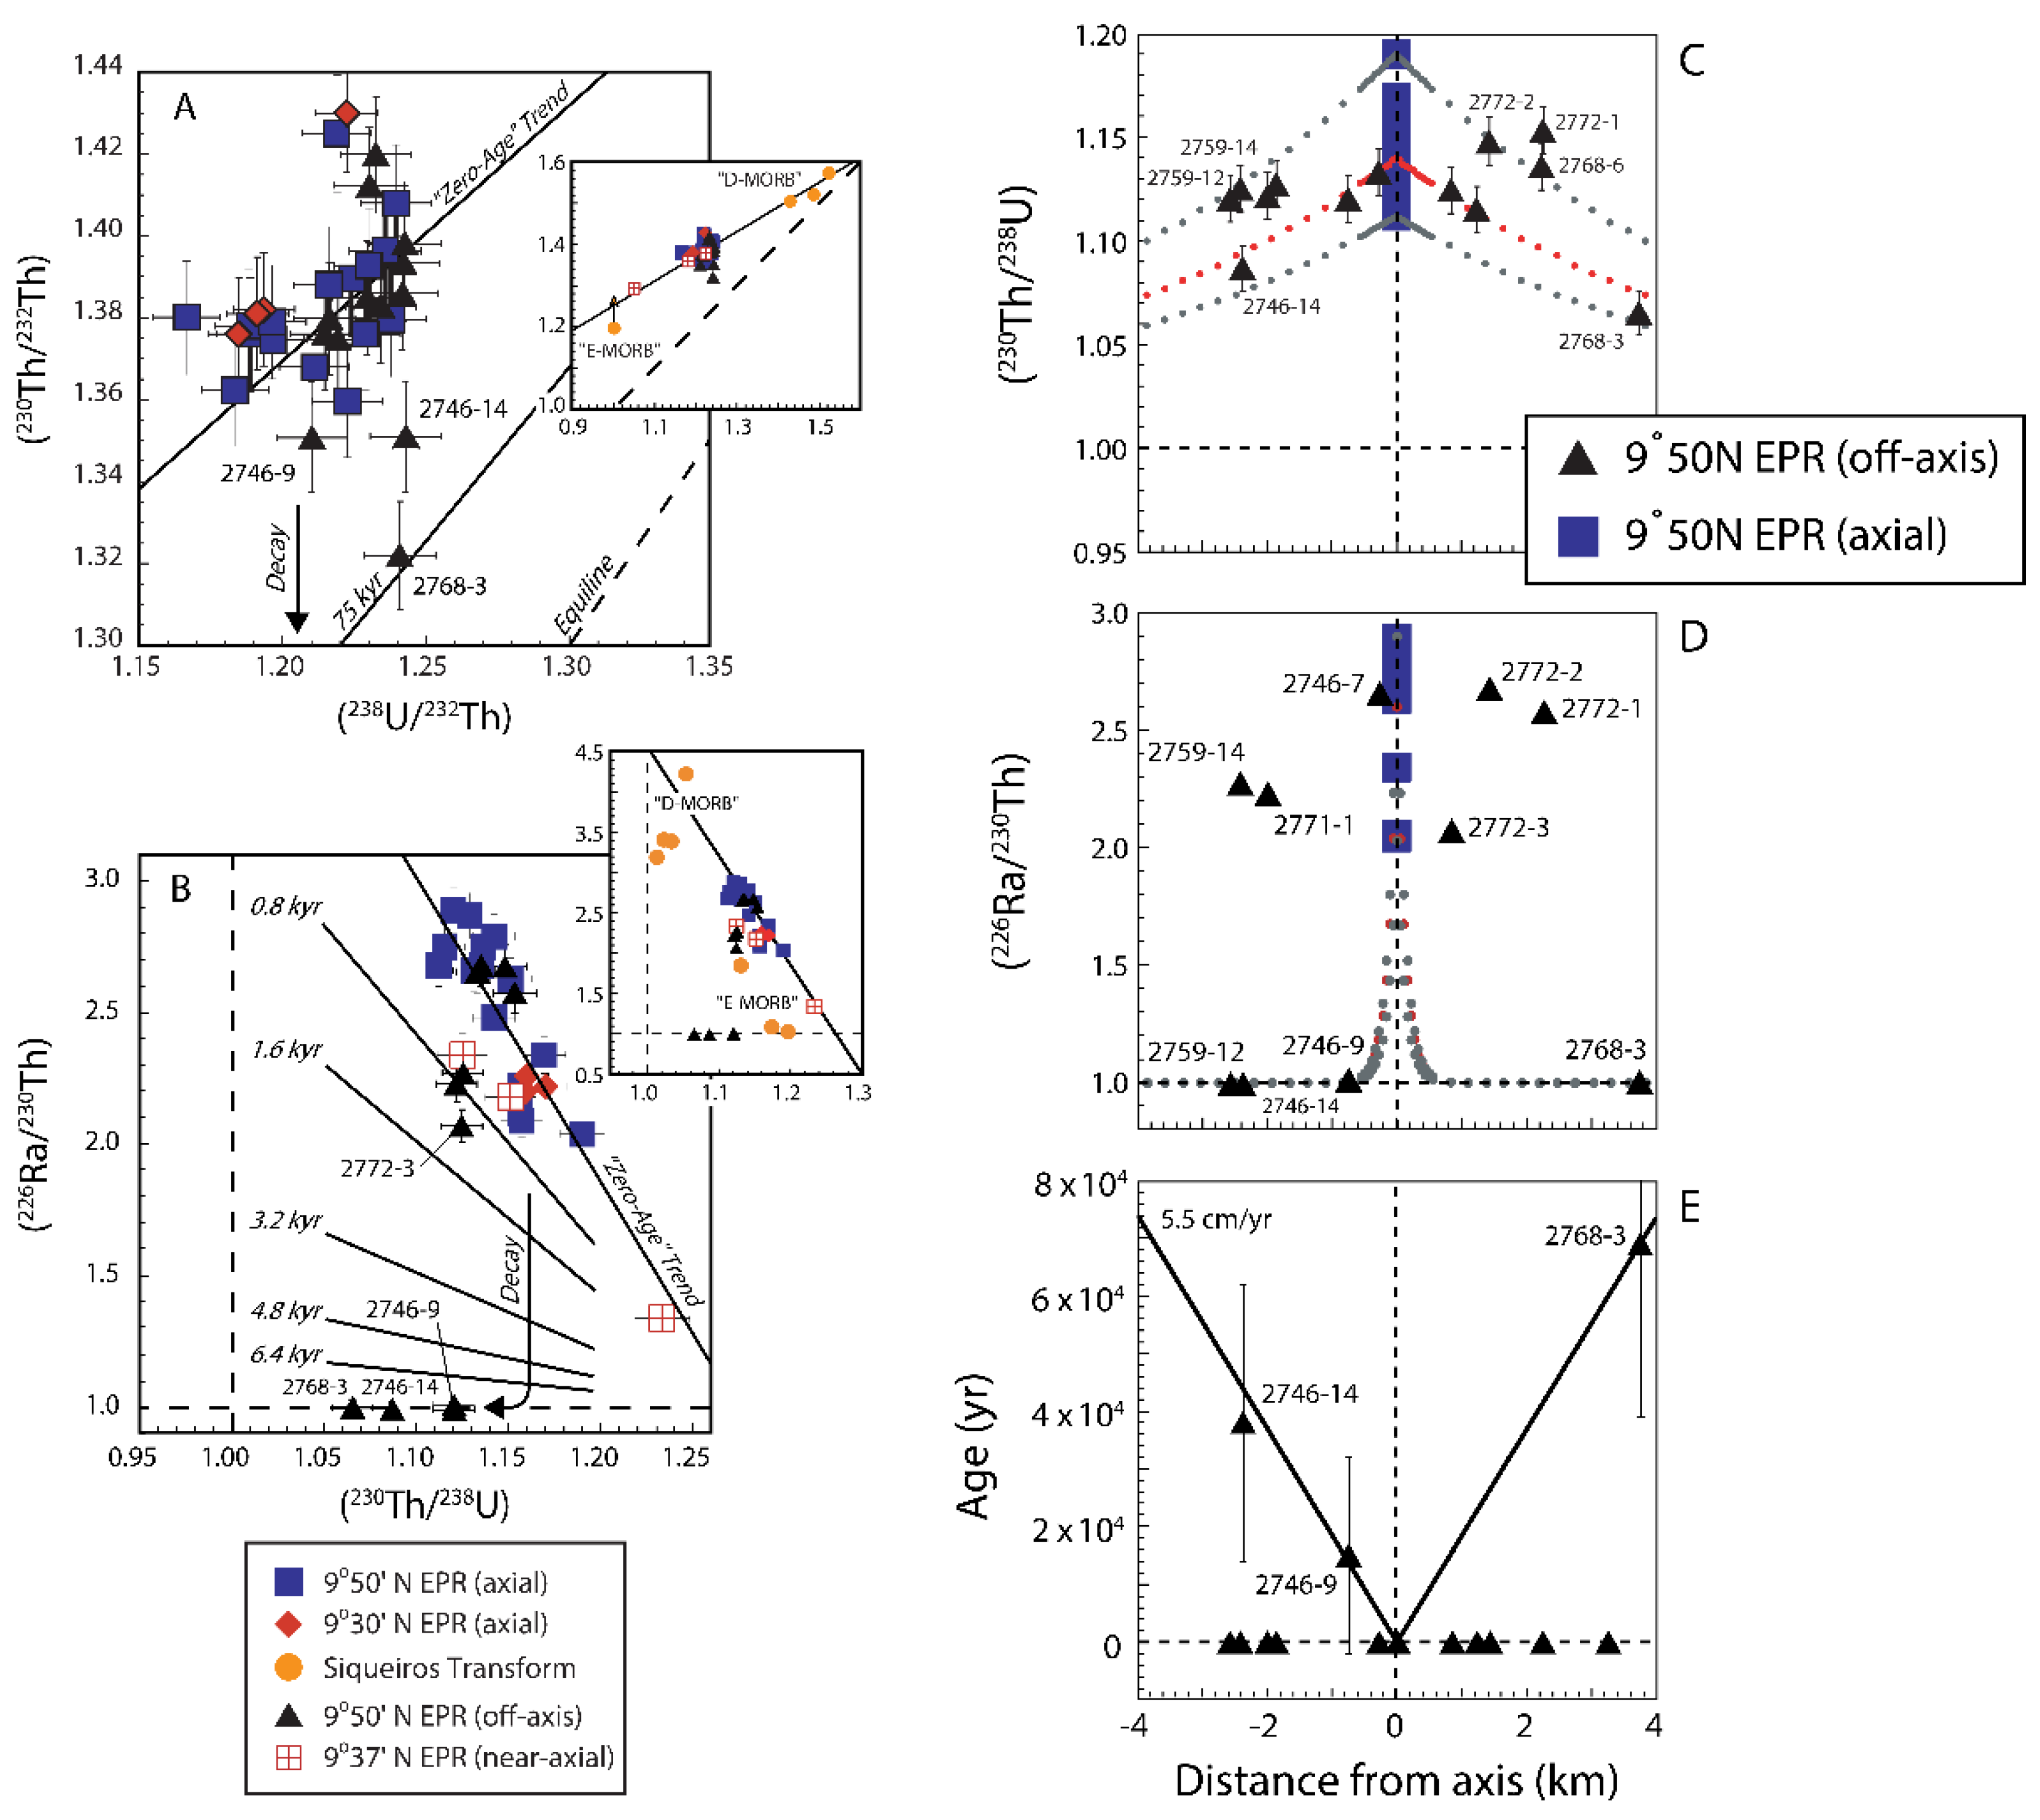
  44. Waters, C.L.; Sims, K.W.W.; Perfit, M.R.; Blichert-Toft, J.; Blusztajn, J. Perspective on the genesis of E-MORB from Chemical and Isotopoic Heterogeneity at 9-10°N East Pacific Rise. J. Petrol. 2011, 52, 565–602. [Google Scholar] [CrossRef]
  45. Waters, C.L.; Sims, K.W.W.; Klein, E.M.; White, S.M.; Reagan, M.K.; Girard, G. Sill to Surface: Linking Young Off-Axis Volcanism with Subsurface Melt at the Overlapping Spreading Center at 9°03’N East Pacific Rise. Earth Planet. Sci. Lett. 2013, 369, 59–70. [Google Scholar] [CrossRef]
  46. Waters, C.L.; Sims, K.W.W.; Soule, S.A.; Blichert-Toft, J.; Dunbar, N.W.; Plank, T.; Sohn, R.A.; Tivey, M.A. Recent Volcanic Accretion at 9-10°N East Pacific Rise as Resolved by Combined Geochemical and Geological Observations. Geochem. Geophys. Geosyst. 2013, 14, 2547–2574. [Google Scholar] [CrossRef]
  47. Zou, H.; Zindler, A. Constraints on the degree of dynamic partial melting and source composition using concentration ratios in magmas. Geochim. Cosmochim. Acta 1996, 60, 711–717. [Google Scholar] [CrossRef]
  48. Jaffey, A.H.; Flynn, K.F.; Glendenin, L.E.; Bentley, W.C.; Essling, A.M. Precision Measurement of Half-Lives and Specific Activities of 235U and 238U. Phys. Rev. C 1971, 4, 1889–1906. [Google Scholar] [CrossRef]
  49. Cheng, H.; Edwards, R.L.; Shen, C.C.; Polyak, V.J.; Asmerom, Y.; Woodhead, J.; Hellstorm, J.; Yongjin, W.; Kong, X.; Spötl, C.; Wang, X.; Alexander Jr, E.C. Improvements in 230Th dating, 230Th and 234U half-life values, and U–Th isotopic measurements by multi-collector inductively coupled plasma mass spectrometry. Earth Planet. Sci. Lett. 2013, 371, 82–91. [Google Scholar] [CrossRef]
  50. Tuli, J.K. Nuclear Wallet Cards, National Nuclear Data Center. Brookhaven National Laboratory, Upton, 2000.
  51. Holden, N.E. Total half-lives for selected nuclides. Pure Appl. Chem. 1990, 62, 941–958. [Google Scholar] [CrossRef]
  52. Robert, J.; Miranda, C.F.; Muxart, R. Mesure de la période du protactinium 231 par microcalorimétrie. Radiochim. Acta 1969, 11, 104–108. [Google Scholar] [CrossRef]
  53. Le Roux, L.A.; Glendenin, L.E. Half-life of 232Th. In Proceedings of the National Meeting on Nuclear Energy (Vol. 83, p. 94), Pretoria, South Africa, April 1963.
  54. Blundy, J.D.; Wood, B.J. Mineral-Melt Partitioning of Uranium, Thorium and Their Daughters. In U-series Geochemistry; Bourdon, B., Lundstrom, C., Henderson, G., Turner, S.P., Eds.; Eds., Mineralogical Society of America: Washington, D.C., United States, 2003; pp. 59–123. [Google Scholar] [CrossRef]
  55. Spiegelman, M. UserCalc: A Web-based uranium series calculator for magma migration problems. Geochem. Geophys. Geosyst. 2000, 1. [Google Scholar] [CrossRef]
  56. Elkins, L.J.; Spiegelman, M. pyUserCalc: A revised Jupyter Notebook calculator for uranium-series disequilibria in basalts. Earth Space Sci. 2021, 8. [Google Scholar] [CrossRef]
  57. Asimow, P.D. Calculation of peridotite partial melting from thermodynamic models of minerals and melts, IV. Adiabatic decompression and the composition and mean properties of mid-ocean ridge basalts. J. Petrol. 2001, 42, 963–998. [Google Scholar] [CrossRef]
  58. Beattie, P. The generation of uranium series disequilibria by partial melting of spinel peridotite: constraints from partitioning studies. Earth Planet. Sci. Lett. 1993, 117, 379–391. [Google Scholar] [CrossRef]
  59. Beattie, P. Uranium-thorium disequilibria and partitioning on melting of garnet peridotite. Nature 1993, 363, 63–65. [Google Scholar] [CrossRef]
  60. LaTourette, T.Z.; Burnett, D.S. Experimental determination of U and Th partitioning between clinopyroxene and synthetic basaltic liquid. Earth Planet. Sci. Lett. 1992, 110, 227–244. [Google Scholar] [CrossRef]
  61. LaTourrette, T.Z.; Kennedy, A.K.; Wasserburg, G. J. Thorium-uranium fractionation by garnet: evidence for a deep source and rapid rise of oceanic basalts. Science 1993, 261, 739–742. [Google Scholar] [CrossRef]
  62. Lundstrom, C.C.; Shaw, H.F.; Ryerson, F.J.; Phinney, D.L.; Gill, J.B.; Williams, Q. Compositional controls on the partitioning of U, Th, Ba, Pb, Sr and Zr between clinopyroxene and haplobasaltic melts: implications for uranium series disequilibria in basalts. Earth Planet. Sci. Lett. 1994, 128, 407–423. [Google Scholar] [CrossRef]
  63. Landwehr, D.; Blundy, J.; Chamorro-Perez, E.; Hill, E.; Wood, B. U-series disequilibria generated by partial melting of spinel lherzolite. Earth Planet. Sci. Lett. 2001, 188, 329–348. [Google Scholar] [CrossRef]
  64. Butcher, J.C. Numerical Methods for Ordinary Differential Equations. John Wiley & Sons: New York, United States, 2003.
  65. Lambert, J.D. Numerical Methods for Ordinary Differential Systems. Wiley: New York, United States, 1992.
  66. Hairer, E.; Wanner, G. Solving Ordinary Differential Equations II: Stiff and Differential-Algebraic Problems (2nd ed.), Springer-Verlag: Berlin, Germany, 1996.
  67. Elkins, L.J.; Bourdon, B.; Lambart, S. Testing pyroxenite versus peridotite sources for marine basalts using U-series isotopes. Lithos 2019, 332–333, 226–244. [Google Scholar] [CrossRef]
  68. Elkins, L.J.; Lambart, S. Uranium-series disequilibria in MORB, revisited: A systematic numerical approach to partial melting of a heterogeneous mantle. Volcanica 2024, 7, 685–715. [Google Scholar] [CrossRef]
  69. Krein, S.B.; Behn, M.D.; Grove, T.L. Origins of major element, trace element, and isotope garnet signatures in mid-ocean ridge basalts. J. Geophys. Res.: Solid Earth 2020, 125. [Google Scholar] [CrossRef]
  70. Lambart, S. No direct contribution of recycled crust in Icelandic basalts. Geochemical Perspectives Letters 2017, 4, 7–12. [Google Scholar] [CrossRef]
  71. Lambart, S.; Baker, M.B.; Stolper, E.M. The role of pyroxenite in basalt genesis: Melt-PX, a melting parameterization for mantle pyroxenites between 0.9 and 5 GPa. J. Geophys. Res.: Solid Earth 2016, 121, 5708–5735. [Google Scholar] [CrossRef]
  72. Ghiorso, M.S.; Hirschmann, M.M.; Reiners, P.W.; Kress III, V. C. The pMELTS: A revision of MELTS for improved calculation of phase relations and major element partitioning related to partial melting of the mantle to 3 GPa. Geochem. Geophys. Geosyst. 2002, 3, 1–35. [Google Scholar] [CrossRef]
  73. Salters, V.J.M.; Longhi., J.E.; Bizimis, M. Near mantle solidus trace element partitioning at pressures up to 3.4 GPa. Geochem. Geophys. Geosyst. 2002, 3, 1–23. [Google Scholar] [CrossRef]
  74. Landwehr, D.; Blundy, J.; Chamorro-Perez, E.; Hill, E.; Wood, B. U-series disequilibria generated by partial melting of spinel lherzolite. Earth Planet. Sci. Lett. 2001, 188, 329–348. [Google Scholar] [CrossRef]
  75. Klemme, S.; Günther, D.; Hametner, K.; Prowatke, S.; Zack, T. The partitioning of trace elements between ilmenite, ulvospinel, armalcolite and silicate melts with implications for the early differentiation of the moon. Chem. Geol. 2006, 234, 251–263. [Google Scholar] [CrossRef]
  76. Salters, V.J.M.; Longhi, J.E. Trace element partitioning during the initial stages of melting beneath ocean ridges. Earth Planet. Sci. Lett. 1999, 166, 15–30. [Google Scholar] [CrossRef]
  77. Fabbrizio, A.; Schmidt, M.W.; Günther, D.; Eikenberg, J. Experimental determination of Ra mineral/melt partitioning for feldspars and 226Ra-disequilibrium crystallization ages of plagioclase and alkali-feldspar. Earth Planet. Sci. Lett. 2009, 280, 137–148. [Google Scholar] [CrossRef]
  78. Pertermann, M.; Hirschmann, M.M.; Hametner, K.; Günther, D.; Schmidt, M.W. Experimental determination of trace element partitioning between garnet and silica- rich liquid during anhydrous partial melting of MORB-like eclogite. Geochem. Geophys. Geosyst. 2005, 5. [Google Scholar] [CrossRef]
  79. Van Westrenen, W.; Blundy, J.; Wood, B. Crystal-chemical controls on trace element partitioning between garnet and anhydrous silicate melt. Am. Mineral. 1999, 84. [Google Scholar] [CrossRef]
  80. Elkins, L.J.; Gaetani, G.A.; Sims, K.W.W. Partitioning of U and Th during garnet pyroxenite partial melting: Constraints on the source of alkaline ocean island basalts. Earth Planet. Sci. Lett. 2008, 265, 270–286. [Google Scholar] [CrossRef]
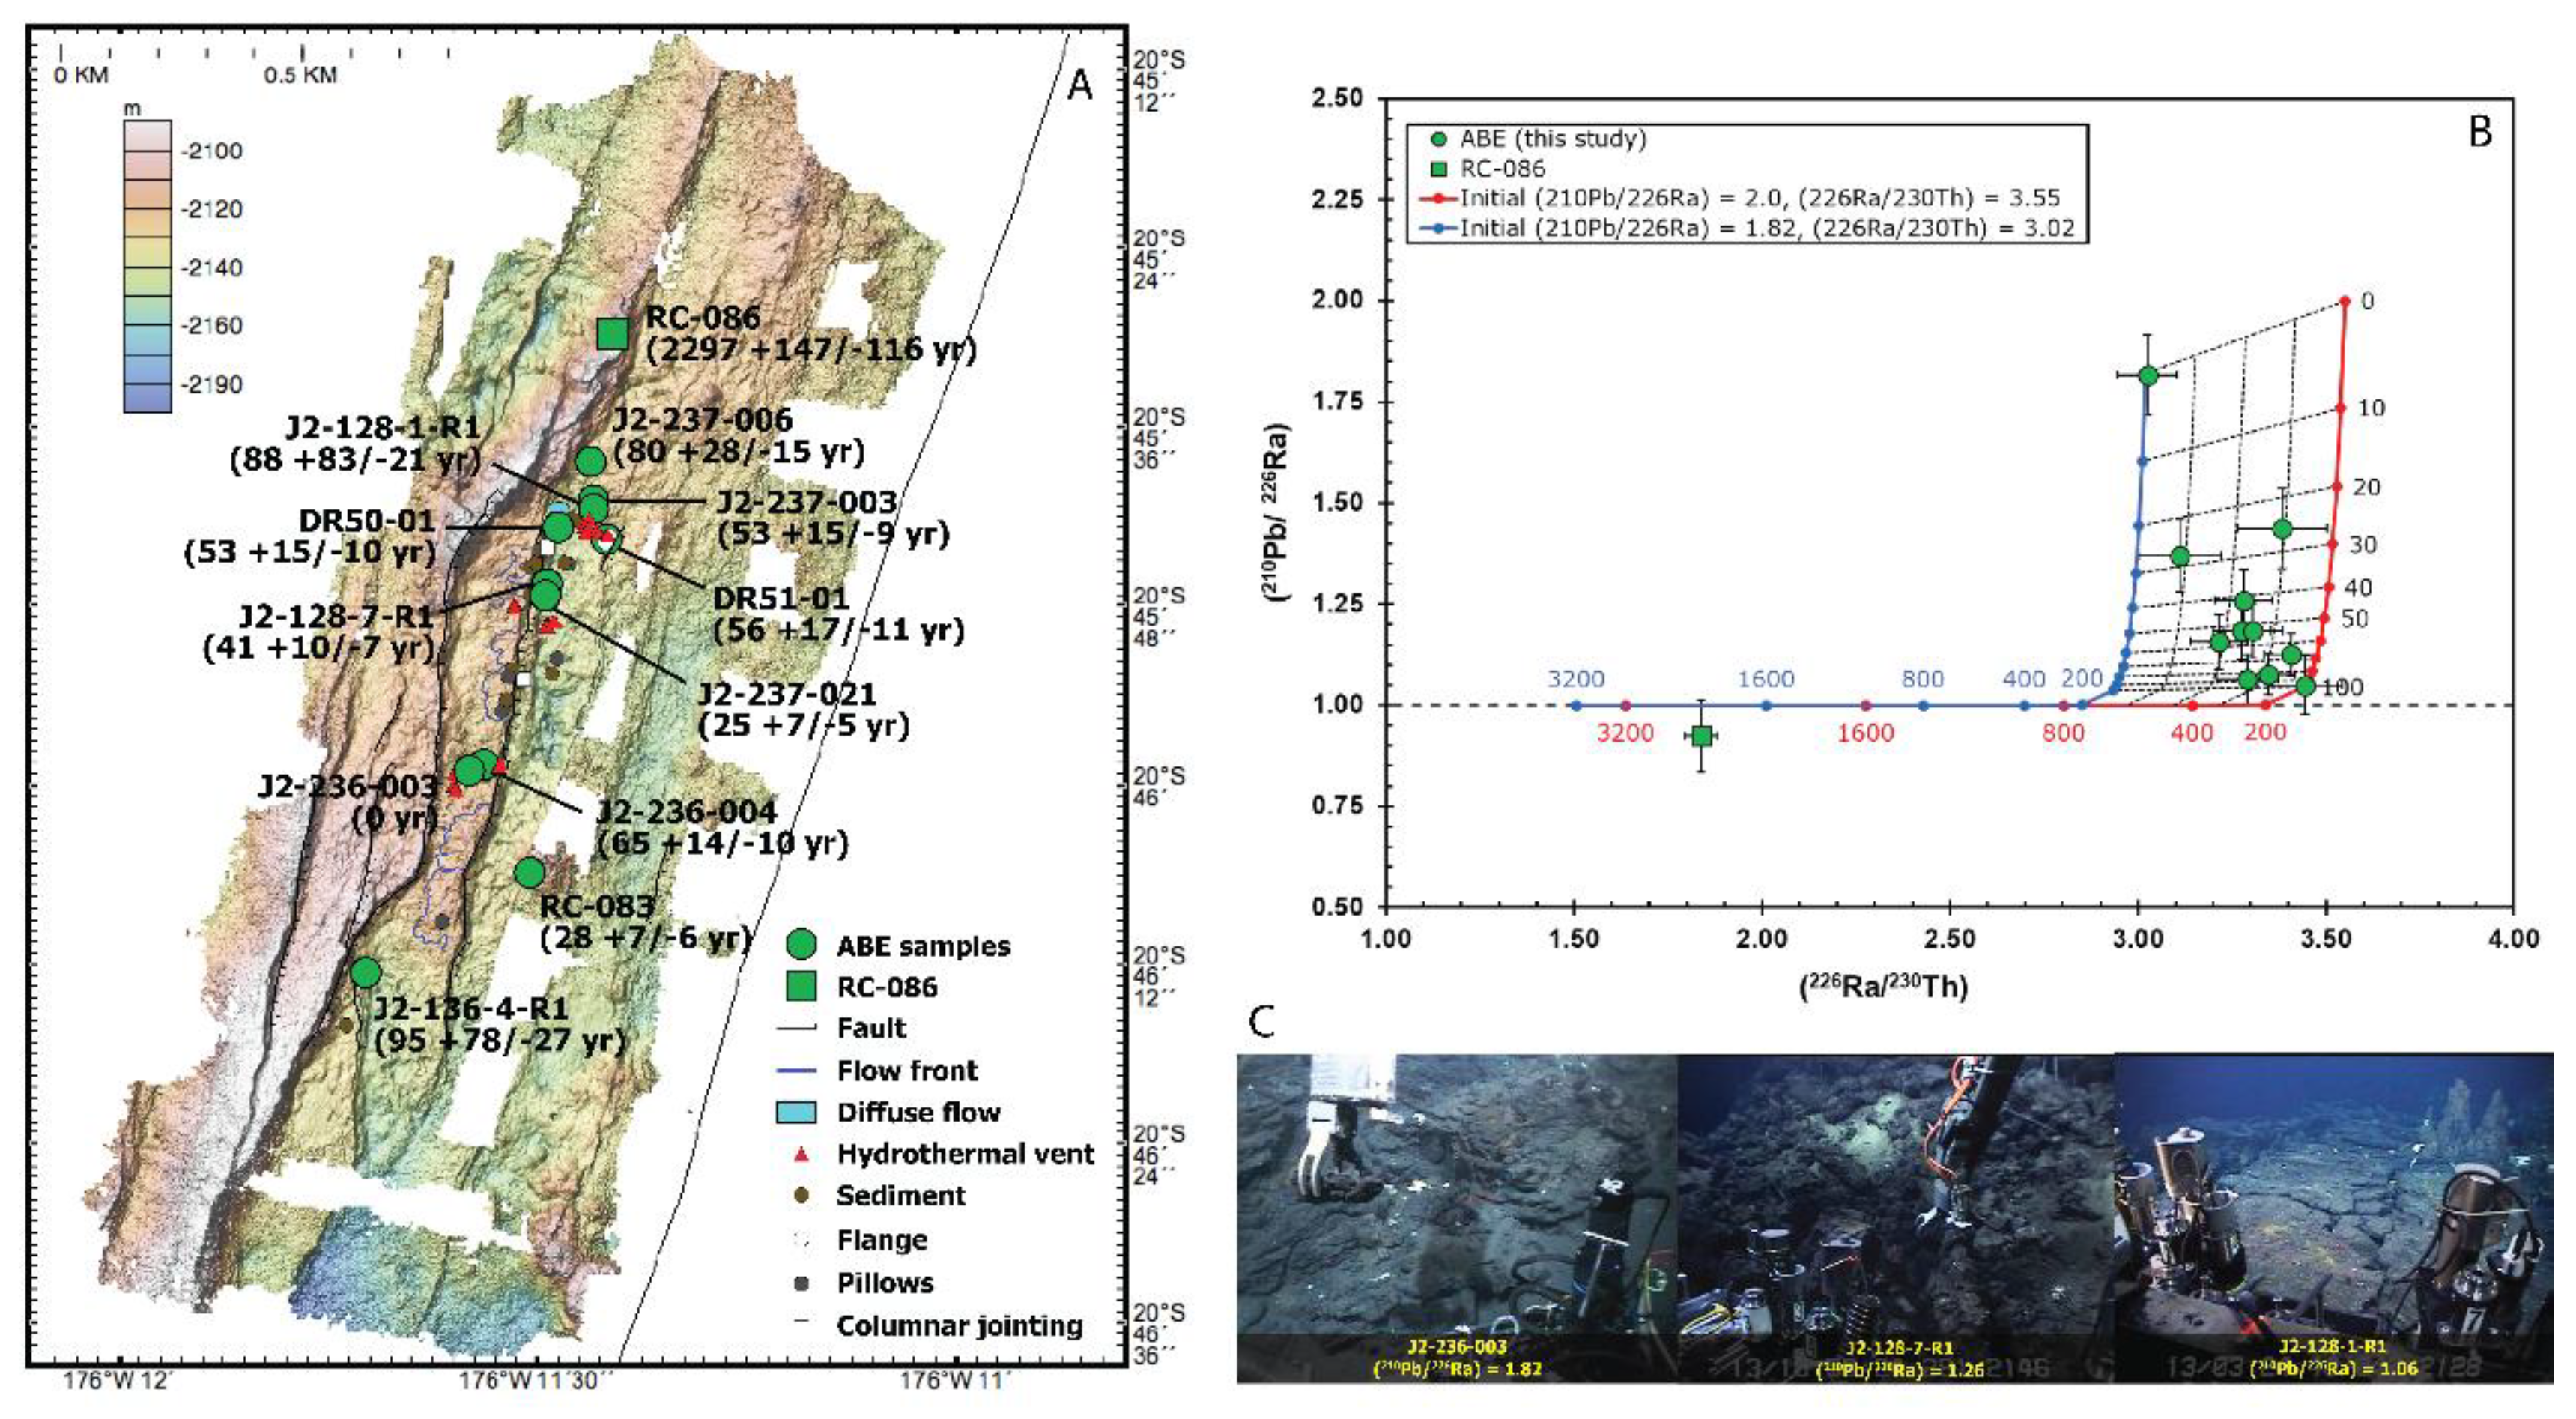
  81. Sims, K.W.W.; Kant, L.B.; Stark, G.J.; Reagan, M.K.; Standish, J.J.; Langmuir, C.H. High-resolution decadal-scale eruption age dating of young oceanic basalts at an active hydrothermal vent site. Front. Geochem. 2024, 2. [Google Scholar] [CrossRef]
  82. Bourdon, B.; Turner, S.P.; Ribe, N.M. Partial melting and upwelling rates beneath the Azores from a U-series isotope perspective. Earth Planet. Sci. Lett. 2005, 239, 42–56. [Google Scholar] [CrossRef]
  83. Elkins, L.J.; Bourdon, B.; Lambart, S. (2023). Corrigendum to “Testing pyroxenite versus peridotite sources for marine basalts using U-series isotopes” [Lithos 332–333 (2019) 226–244]. Lithos 2023, 452. [Google Scholar] [CrossRef]
  84. Thurber, D.L. Anomalous U234/U238 in nature. J. Geophys. Res. 1962, 67. [Google Scholar] [CrossRef]
  85. Ku, T.L.; Mathieu, G.G.; Knauss, K.G. Uranium in open ocean: concentration and isotopic composition. Deep Sea Res. 1977, 24, 1005–1017. [Google Scholar] [CrossRef]
  86. Henderson, G.M.; Cohen, A.S.; O'nions, R.K. 234U/238U ratios and 230Th ages for Hateruma Atoll corals: implications for coral diagenesis and seawater 234U/238U ratios. Earth Planet. Sci. Lett. 1993, 115, 65–73. [Google Scholar] [CrossRef]
  87. Robinson, L.F.; Henderson, G.M.; Hall, L.; Matthews, I. Climatic control of riverine and seawater uranium-isotope ratios. Science 2004, 305, 851–854. [Google Scholar] [CrossRef]
  88. Dulaiova, H.; Sims, K.W.W.; Charette, M.A. A new method for the determination of low-level actinium-227 in geological samples. J. Radioanal. Nucl. Chem. 2013, 296, 279–283. [Google Scholar] [CrossRef]
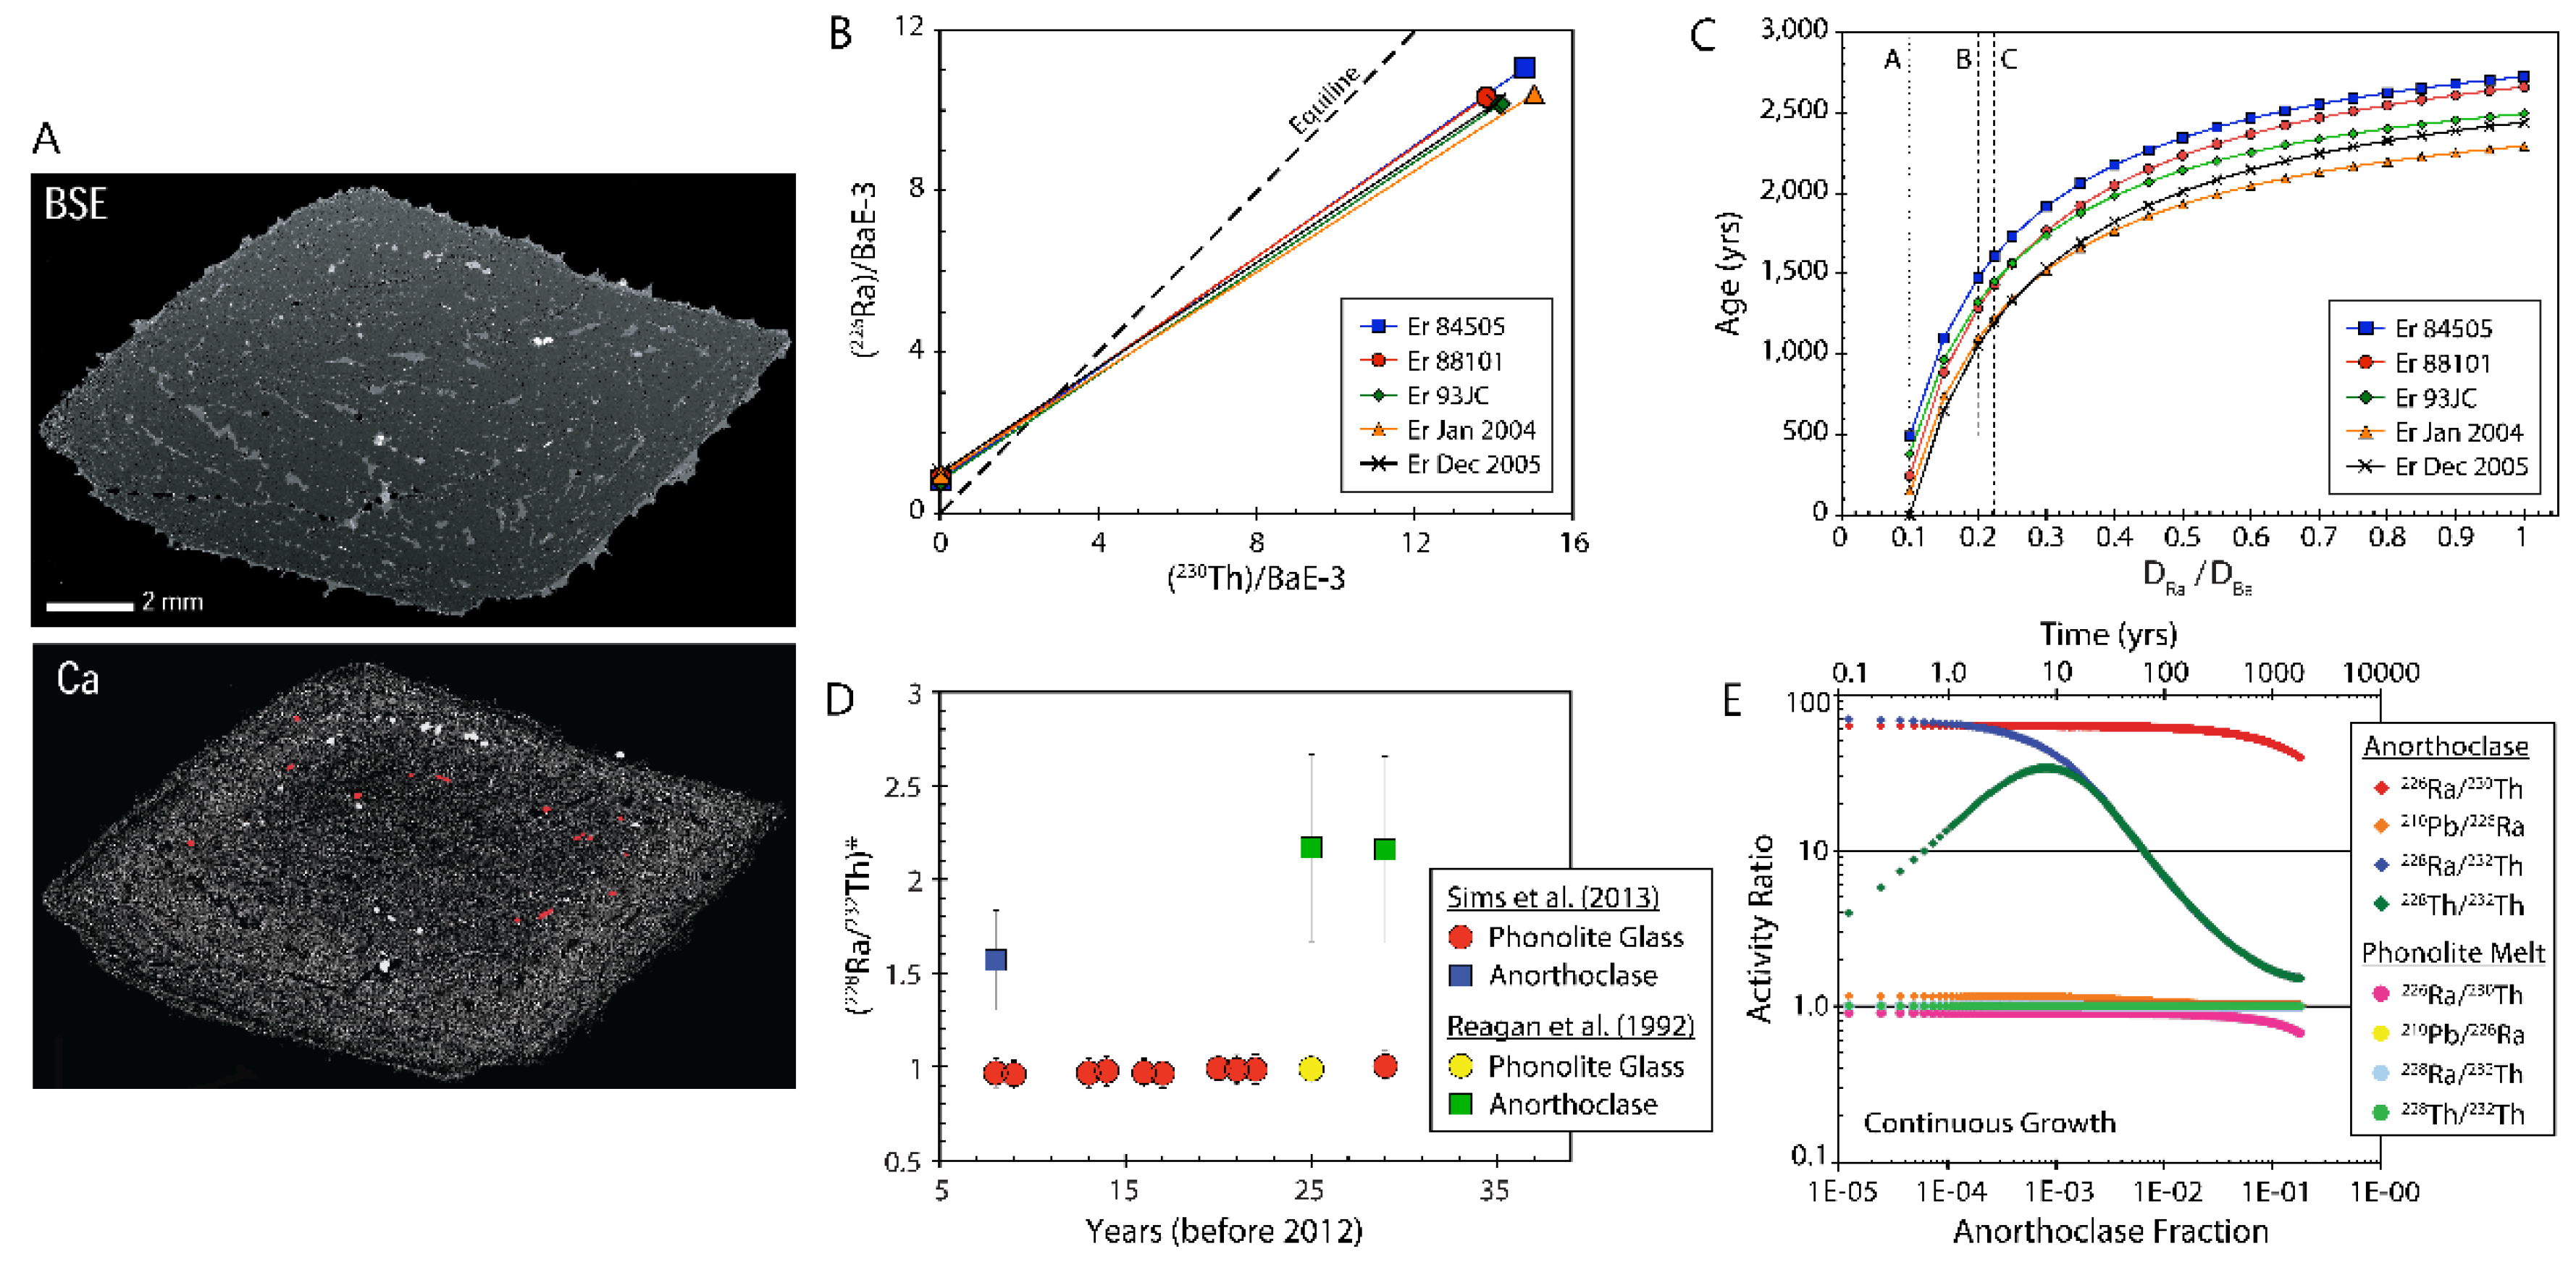
  89. Sims, K.W.W.; Pichat, S.; Reagan, M.K.; Kyle, P.R.; Dulaiova, H.; Dunbar, N.; Prytulak, J.; Sawyer, G.; Layne, G.; Blichert-Toft, J.; Gauthier, P.J.; Charrette, M.A.; Elliott, T.R. On the timescales of magma genesis, melt evolution, crystal growth rates and magma degassing in the Erebus volcano magmatic system using the 238U, 235U and 232Th-decay series. J. Petrol. 2013, 54, 2–235. [Google Scholar] [CrossRef]
  90. Sims, K.W.W.; Aster, R.; Gaetani, G.; Blichert-Toft, J.; Phillips, E.H.; Wallace, P.J.; Mattioli, G.S.; Rasmussen, D.; Boyd, E.S. Mount Erebus Volcano: An Exceptional Natural Laboratory to Study Alkaline Magmatism and Open-Conduit Volcano Behavior. In Volcanism in Antarctica: 200 Million Years of Subduction, Rifting and Continental Break-Up; Smellie, J., Panter, K., Eds.; Geyer, A. Geological Society: London, United Kingdom, 2021; Volume 55, pp. 695–731. [Google Scholar]
  91. Hiraga, T.; Hirschmann, M.M.; Kohlstedt, D.L. Equilibrium interface segregation in the diopside–forsterite system II: applications of interface enrichment to mantle geochemistry. Geochim. Cosmochim. Acta 2007, 71, 1281–1289. [Google Scholar] [CrossRef]
  92. Hiraga, T.; Kohlstedt, D.L. Hidden Records Of Critical Melt Fraction? Constant Intergranular Component In Mantle Xenoliths. In AGU Fall Meeting Abstracts, San Francisco, California, United States, December 2007.
  93. Hiraga, T.; Kohlstedt, D.L. Equilibrium interface segregation in the diopside–forsterite system I: Analytical techniques, thermodynamics, and segregation characteristics Geochim. Cosmochim. Acta 2007, 71, 1266–1280. [Google Scholar] [CrossRef]
  94. O’Neill, H.S.C.; Jenner, F.E. The global pattern of trace-element distributions in ocean floor basalts. Nature 2012, 491, 698–704. [Google Scholar] [CrossRef]
  95. Lissenberg, C.J.; MacLeod, C.J.; Bennett, E.N. Consequences of a crystal mush-dominated magma plumbing system: a mid-ocean ridge perspective. Phil. Trans. R. Soc. A 2019, 377. [Google Scholar] [CrossRef]
  96. Saal, A.E.; Van Orman, J.A. The 226Ra enrichment in oceanic basalts: Evidence for melt-cumulate diffusive interaction processes within the oceanic lithosphere. Geochem. Geophys. Geosyst. 2004, 5. [Google Scholar] [CrossRef]
  97. Van Orman, J.A.; Saal, A.E.; Bourdon, B.; Hauri, E.H. Diffusive fractionation of U-series radionuclides during mantle melting and shallow-level melt-cumulate interaction. Geochim. Cosmochim. Acta 2006, 70, 4797–4812. [Google Scholar] [CrossRef]
  98. Klein, E.M.; Langmuir, C.H. Global correlations of ocean ridge basalt chemistry with axial depth and crustal thickness. J. Geophys. Res.: Solid Earth 1987, 92, 8089–8115. [Google Scholar] [CrossRef]
  99. Hauri, E.H.; Whitehead, J.A.; Hart, S.R. Fluid dynamic and geochemical aspects of entrainment in mantle plumes. J. Geophys. Res. 1994, 99, 24–275. [Google Scholar] [CrossRef]
  100. Wood, B.J.; Blundy, J.D.; Robinson, J.A.C. The role of clinopyroxene in generating U-series disequilibrium during mantle melting. Geochim. Cosmochim. Acta 1999, 63, 1613–1620. [Google Scholar] [CrossRef]
  101. Elkins, L.J.; Sims, K.W.W.; Prytulak, J.; Blichert-Toft, J.; Elliott, T.; Blusztajn, J.; Fretzdorff, S.; Reagan, M.K.; Haase, K.; Humphris, S.; Schilling, J.-G. Melt generation beneath Arctic Ridges: Implications from measurements of U decay series disequilibria in the Mohns, Knipovich, and Gakkel Ridges. Geochim. Cosmochim. Acta 2014, 127, 140–170. [Google Scholar] [CrossRef]
  102. Jokat, W.; Schmidt-Aursch, M.C. Geophysical characteristics of the ultraslow spreading Gakkel Ridge, Arctic Ocean. Geophys. J. Int. 2007, 168, 983–998. [Google Scholar] [CrossRef]
  103. Hellebrand, E.; Snow, J.E.; Mühe, R. Mantle melting beneath Gakkel Ridge (Arctic Ocean): abyssal peridotite spinel compositions. Chem. Geol. 2002, 182, 227–235. [Google Scholar] [CrossRef]
  104. Michael, P.J.; Langmuir, C.H.; Dick, H.J.B.; Snow, J.E.; Goldstein, S.L.; Graham, D.W.; Lehnert, K.; Kurras, G.; Jokat, W.; Mühe, R.; Edmonds, H.N. Magmatic and amagmatic seafloor generation at the ultraslow-spreading Gakkel ridge, Arctic Ocean. Nature 2003, 423, 956–961. [Google Scholar] [CrossRef] [PubMed]
  105. Elliott, T.R.; Spiegelman, M. Melt Migration in Oceanic Crustal Production: A U-Series Perspective. In Treatise on Geochemistry; Rudnick, R.L.; Holland, H.D.; Turekian, K.K., Eds.; Elsevier, Amsterdam, Netherlands, 2003; Volume 3, pp. 465 – 510. [CrossRef]
  106. Elkins, L.J.; Scott, S.R.; Sims, K.W.W.; Rivers, E.R.; Devey, C.W.; Reagan, M.K.; Hamelin, C.; Pedersen, R.B. Exploring the role of mantle eclogite at mid-ocean ridges and hotspots: U-series constraints on Jan Mayen Island and the Kolbeinsey Ridge. Chem. Geol. 2016, 444, 128–140. [Google Scholar] [CrossRef]
  107. Sims, K.W.W.; Blichert-Toft, J.; Fornari, D.J.; Perfit, M.R.; Goldstein, S.J.; Johnson, P.; DePaolo, D.J.; Hart, S.R.; Murrell, M.T.; Michael, P.J.; Layne, G.D.; Ball, L.A. Aberrant youth: Chemical and isotopic constraints on the origin of off-axis lavas from the East Pacific Rise, 9°–10°N. Geochem. Geophys. Geosyst. 2003, 4. [Google Scholar] [CrossRef]
  108. Cooper, K.; Goldstein, S.J.; Sims, K.W.W.; Murrell, M.T. Uranium-Series Chronology of Gorda Ridge Volcanism: New evidence from the 1996 Eruption. Earth Planet. Sci. Lett. 2003, 206, 459–475. [Google Scholar] [CrossRef]
  109. Russo, C.J.; Rubin, K.H.; Graham, D.W. Mantle melting and magma supply to the Southeast Indian Ridge: The roles of lithology and melting conditions from U-series disequilibria. Earth Planet. Sci. Lett. 2009, 278, 55–66. [Google Scholar] [CrossRef]
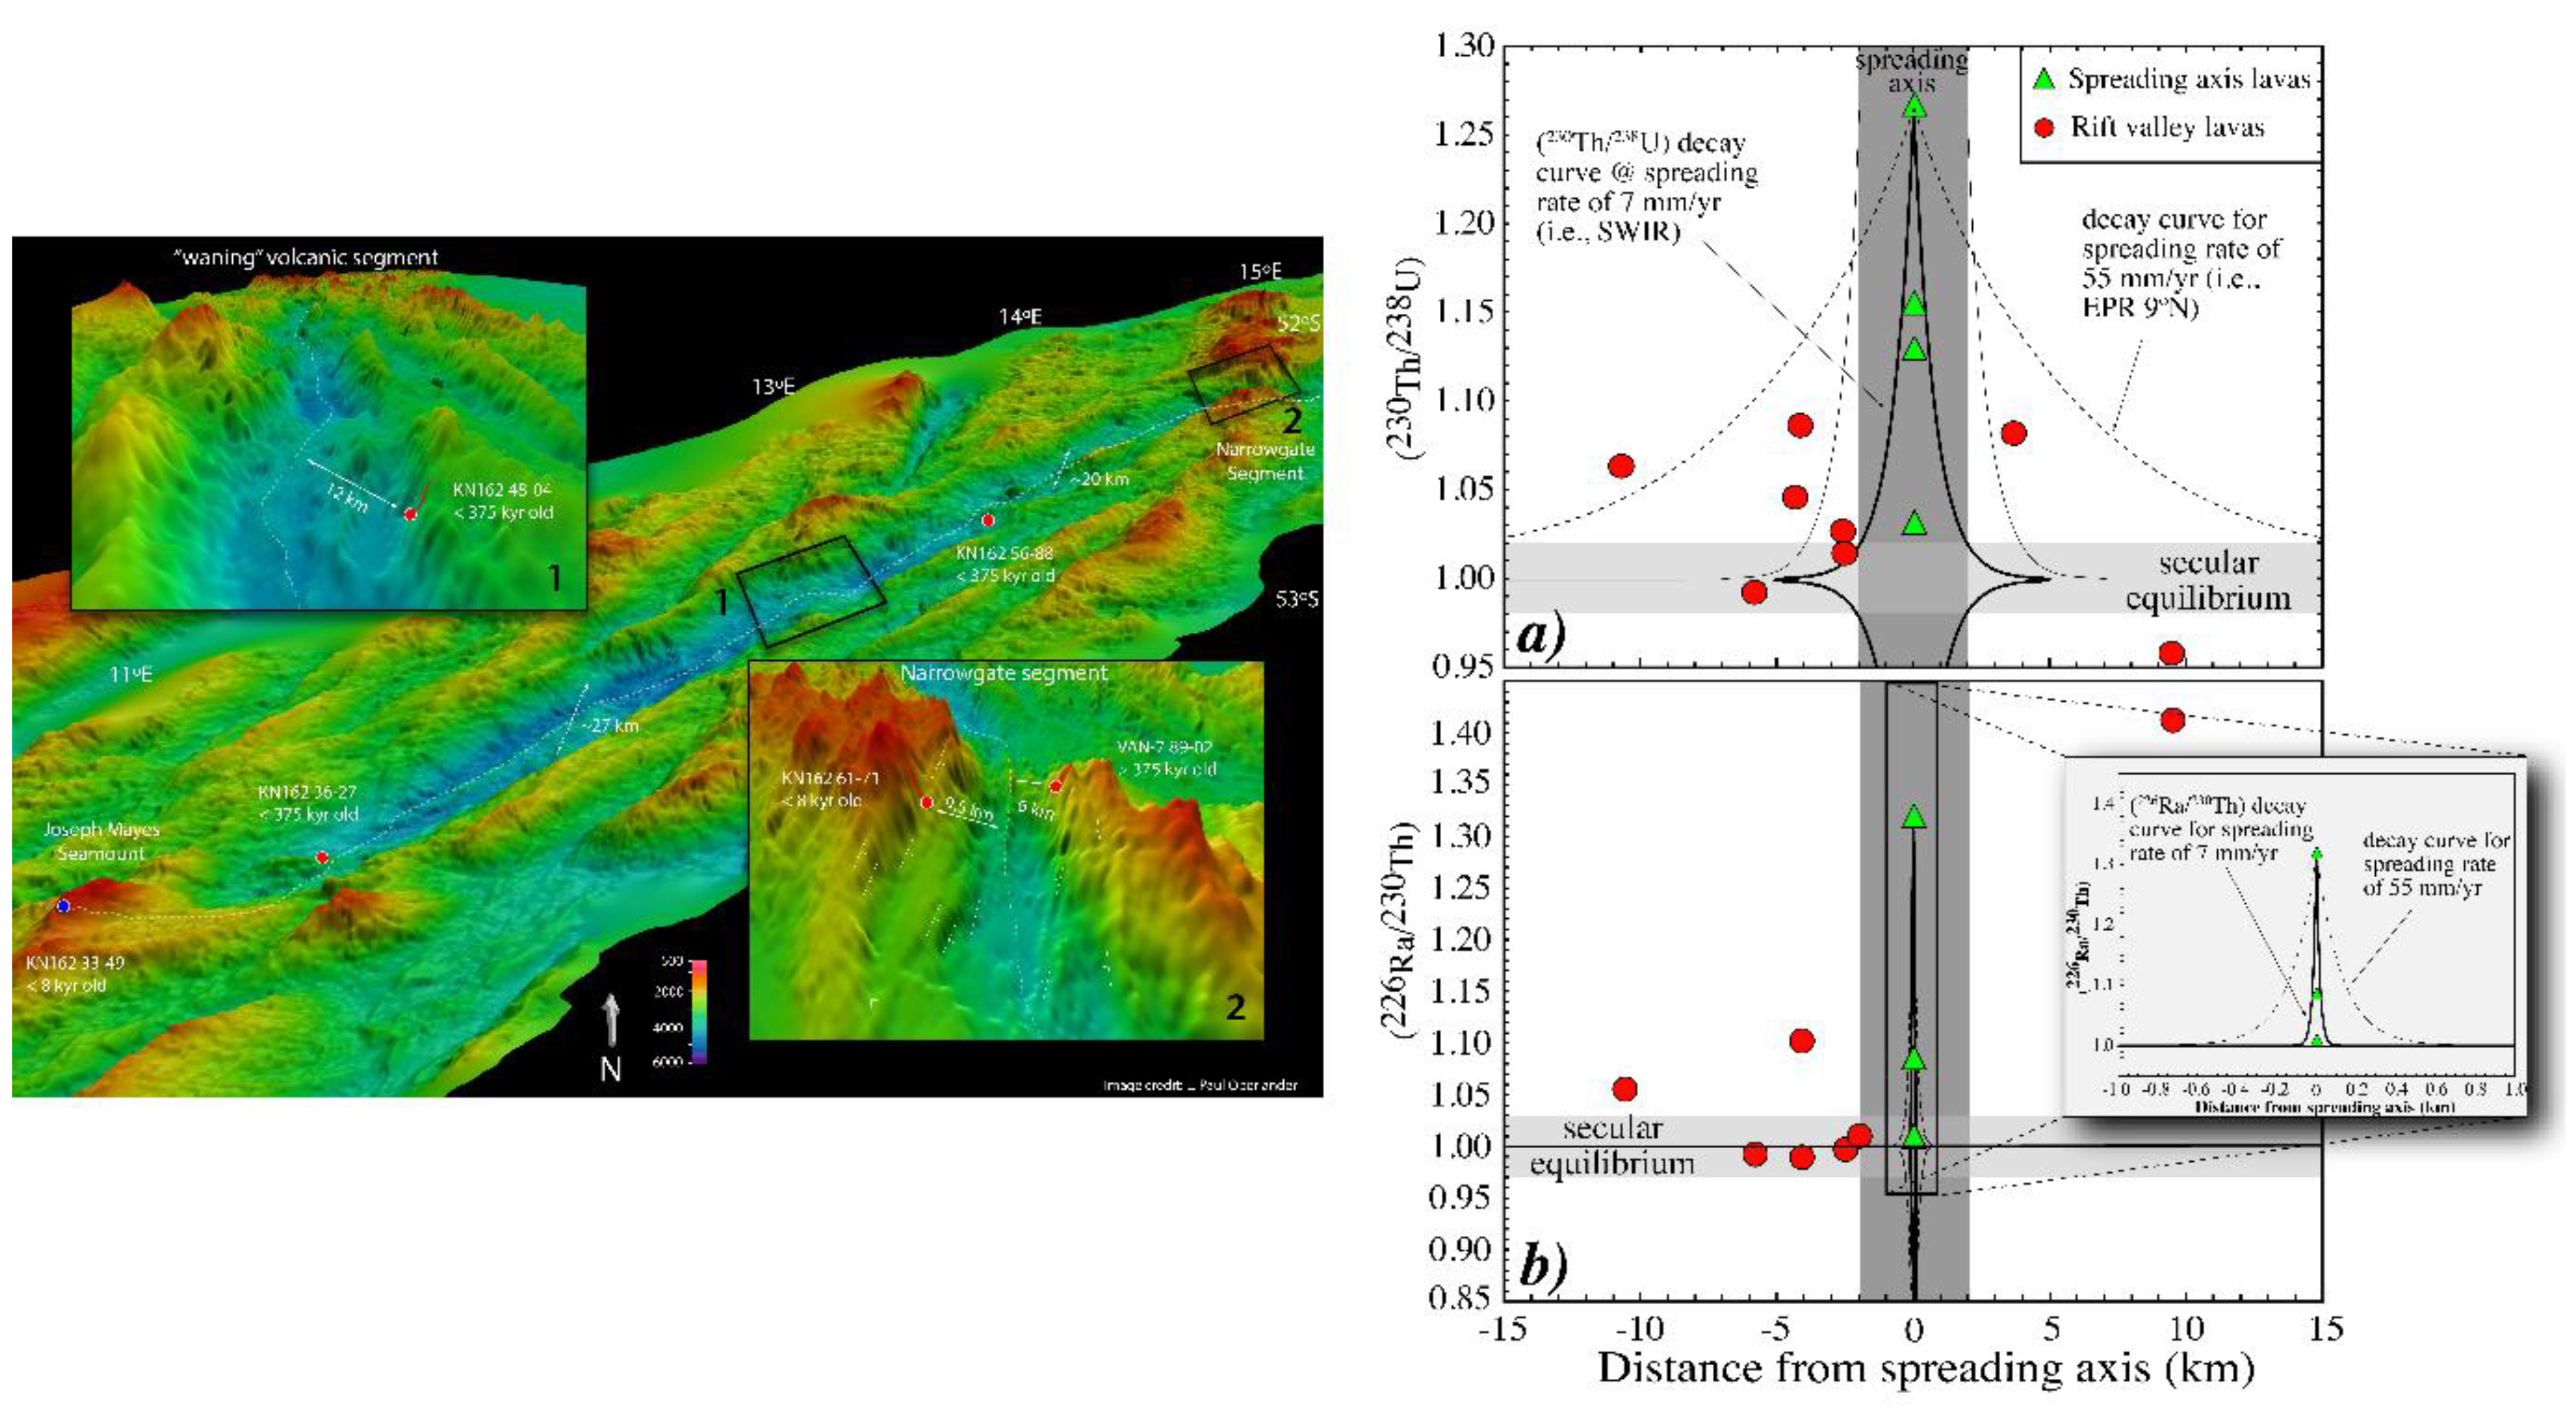
  110. Standish, J.J.; Sims, K.W.W. Young volcanism and rift valley construction at an ultraslow spreading ridge. Nat. Geosci. 2010, 3, 286–292. [Google Scholar] [CrossRef]
  111. Kelemen, P.B.; Hirth, G.; Shimizu, N.; Spiegelman, M.; Dick, H.J.B. A review of melt migration processes in the adiabatically upwelling mantle beneath oceanic spreading ridges. Philos. Trans. R. Soc. London Ser. A 1997, 355, 1–35. [Google Scholar] [CrossRef]
  112. Sims, K.W.W.; DePaolo, D.J. Inferences about mantle magma sources from incompatible element concentration ratios in oceanic basalts. Geochim. Cosmochim. Acta 1997, 61, 765–784. [Google Scholar] [CrossRef]
  113. Iwamori, H. Dynamic disequilibrium melting model with porous flow and diffusion controlled-chemical equilibration. Earth Planet. Sci. Lett. 1993, 114, 301–313. [Google Scholar] [CrossRef]
  114. Jull, M.; Kelemen, P.B.; Sims, K.W.W. Consequences of diffuse and channelled porous melt migration on uranium series disequilibria. Geochim. Cosmochim. Acta 2002, 66, 4133–4148. [Google Scholar] [CrossRef]
  115. Kelemen, P.B.; Shimizu, N.; Salters, V.J. Extraction of mid-ocean-ridge basalt from the upwelling mantle by focused flow of melt in dunite channels. Nature 1995, 375, 747–753. [Google Scholar] [CrossRef]
  116. Katz, R.F.; Jones, D.W.R.; Rudge, J.F.; Keller, T. Physics of melt extraction from the mantle: Speed and style. Annu. Rev. Earth Planet. Sci. 2022, 50, 507–540. [Google Scholar] [CrossRef]
  117. Sim, S.J.; Spiegelman, M.; Stegman, D.R.; Wilson, C. The influence of spreading rate and permeability on melt focusing beneath mid-ocean ridges. Phys. Earth Planet. Inter. 2020, 304. [Google Scholar] [CrossRef]
  118. Stracke, A.; Bourdon, B. The importance of melt extraction for tracing mantle heterogeneity. Geochim. Cosmochim. Acta 2009, 73, 218–238. [Google Scholar] [CrossRef]
  119. Hirschmann, M.M.; Stolper, E.M. A possible role for pyroxenite in the origin of the garnet signature in MORB. Contrib. Mineral. Petrol. 1996, 124, 185–208. [Google Scholar] [CrossRef]
  120. Kogiso, T.; Hirschmann, M.M.; Pertermann, M. High-pressure partial melting of mafic lithologies in the mantle. J. Petrol. 2004, 45, 2407–2422. [Google Scholar] [CrossRef]
  121. Sobolev, A.V.; Hofmann, A.W.; Sobolev, S.V.; Nikogosian, I.K. An olivine-free mantle source of Hawaiian shield basalts. Nature 2005, 434, 590–597. [Google Scholar] [CrossRef]
  122. Sobolev, S.V.; Sobolev, A.V.; Kuzmin, D.V.; Krivolutskaya, N.A.; Petrunin, A.G.; Arndt, N.T.; Radko, V.A.; Vasiliev, Y.R. The amount of recycled crust in sources of mantle-derived melts. Science 2007, 316, 412–417. [Google Scholar] [CrossRef]
  123. Pertermann, M.; Hirschmann, M.M. Partial melting experiments on a MORB-like pyroxenite between 2 and 3 GPa: Constraints on the presence of pyroxenite in basalt source regions from solidus location and melting rate. J. Geophys. Res.: Solid Earth 2003, 108. [Google Scholar] [CrossRef]
  124. Phipps Morgan, J. Thermodynamics of pressure release melting of a veined plum pudding mantle. Geochem. Geophys. Geosyst. 2001, 2. [Google Scholar] [CrossRef]
  125. Ito, G.; Mahoney, J.J. Flow and melting of a heterogeneous mantle: 1. Method and importance to the geochemistry of ocean island and mid-ocean ridge basalts. Earth Planet. Sci. Lett. 2005, 230, 29–46. [Google Scholar] [CrossRef]
  126. Ito, G.; Mahoney, J.J. Flow and melting of a heterogeneous mantle: 2. Implications for a chemically nonlayered mantle. Earth Planet. Sci. Lett. 2005, 230, 47–63. [Google Scholar] [CrossRef]
  127. Liang, Y.; Parmentier, E.M. A two-porosity double lithology model for partial melting, melt transport and melt–rock reaction in the mantle: mass conservation equations and trace element transport. J. Petrol. 2010, 51, 125–152. [Google Scholar] [CrossRef]
  128. Liang, Y. Trace element fractionation and isotope ratio variation during melting of a spatially distributed and lithologically heterogeneous mantle. Earth Planet. Sci. Lett. 2020, 552, 1–13. [Google Scholar] [CrossRef]
  129. Shorttle, O.; Maclennan, J. Compositional trends of Icelandic basalts: Implications for short-length scale lithological heterogeneity in mantle plumes. Geochem. Geophys. Geosystems 2011, 12, 1–32. [Google Scholar] [CrossRef]
  130. Pertermann, M.; Hirschmann, M.M.; Hametner, K.; Günther, D.; Schmidt, M.W. Experimental determination of trace element partitioning between garnet and silica-rich liquid during anhydrous partial melting of MORB-like eclogite. Geochem. Geophys. Geosyst. 2004, 5. [Google Scholar] [CrossRef]
  131. Stracke, A.; Salters, V.J.M.; Sims, K.W.W. Assessing the presence of garnet-pyroxenite in the mantle sources of basalts through combined hafnium-neodymium-thorium isotope systematics. Geochem. Geophys. Geosyst. 1999, 1. [Google Scholar] [CrossRef]
  132. Sun, C.; Graff, M.; Liang, Y. Trace element partitioning between plagioclase and silicate melt: The importance of temperature and plagioclase composition, with implications for terrestrial and lunar magmatism. Geochim. Cosmochim. Acta 2017, 206, 273–295. [Google Scholar] [CrossRef]
  133. Lin, J.; Purdy, G.M.; Schouten, H.; Sempere, J.-C.; Zervas, C. Evidence from gravity data for focused magmatic accretion along the Mid-Atlantic Ridge. Nature 1990, 344, 627–632. [Google Scholar] [CrossRef]
  134. Donnelly, K.E.; Goldstein, S.L.; Langmuir, C.H.; Spiegelman, M. Origin of enriched ocean ridge basalts and implications for mantle dynamics. Earth Planet. Sci. Lett. 2004, 226, 347–366. [Google Scholar] [CrossRef]
  135. Kent, G.M.; Harding, A.J.; Orcutt, J.A. Distribution of magma beneath the East Pacific Rise between the Clipperton transform and the 9°17′ N Deval from forward modeling of common depth point data. J. Geophys. Res.: Solid Earth 1993, 98, 13945–13969. [Google Scholar] [CrossRef]
  136. Schilling, J.G.; Kingsley, R.; Fontignie, D.; Poreda, R.; Xue, S. Dispersion of the Jan Mayen and Iceland mantle plumes in the Arctic: A He-Pb-Nd-Sr isotope tracer study of basalts from the Kolbeinsey, Mohns, and Knipovich Ridges. J. Geophys. Res.: Solid Earth 1999, 104, 10543–10569. [Google Scholar] [CrossRef]
  137. Blichert-Toft, J.; Agranier, A.; Andres, M.; Kingsley, R.; Schilling, J.; Albarède, F. Geochemical segmentation of the Mid-Atlantic Ridge north of Iceland and ridge–hot spot interaction in the North Atlantic. Geochem. Geophys. Geosyst. 2006, 6. [Google Scholar] [CrossRef]
  138. Turner, S.; Hoernle, K.; Hauff, F.; Johansen, T.S.; Klügel, A.; Kokfelt, T.; Lundstrom, C. 238U–230Th–226Ra Disequilibria Constraints on the Magmatic Evolution of the Cumbre Vieja Volcanics on La Palma, Canary Islands. J. Petrol. 2015, 56, 1999–2024. [Google Scholar] [CrossRef]
  139. Elkins, L.J.; Hamelin, C.; Blichert-Toft, J.; Scott, S.R.; Sims, K.W.W.; Yeo, I.A.; Devey, C.W.; Pederson, R.B. North Atlantic hotspot-ridge interaction near Jan Mayen Island. Geochem. Perspect. Lett. 2016, 2, 55–67. [Google Scholar] [CrossRef]
  140. Spiegelman, M.; Kelemen, P.B.; Aharnohov, E. Causes and consequences of flow organization during melt transport: The reaction infiltration instability in compactible media. J. Geophys. Res.: Solid Earth 2001, 106, 2061–2077. [Google Scholar] [CrossRef]
  141. Spiegelman, M.; Kelemen, P.B. Extreme chemical variability as a consequence of channelized melt transport. Geochem. Geophys. Geosyst. 2003, 4. [Google Scholar] [CrossRef]
  142. Pietruszka, A.J.; Rubin, K.H.; Garcia, M.O. 226Ra-230Th-238U disequilibria of historical Kilauea lavas (1790–1982) and the dynamics of mantle melting within the Hawaiian plume. Earth Planet. Sci. Lett. 2001, 186, 15–31. [Google Scholar] [CrossRef]
  143. Kokfelt, T.F.; Hoernle, K.; Hauff, F. Upwelling and melting of the Iceland plume from radial variation of 238U-230Th disequilibria in postglacial volcanic rocks. Earth Planet. Sci. Lett. 2003, 214, 167–186. [Google Scholar] [CrossRef]
  144. Bourdon, B.; Sims, K.W.W. U-series Constraints on Intraplate Basaltic Magmatism. In U-series Geochemistry; Bourdon, B., Lundstrom, C., Henderson, G., Turner, S.P., Eds.; Eds., Mineralogical Society of America: Washington, D.C., United States, 2003; pp. 215–254. [Google Scholar] [CrossRef]
  145. Prytulak, J.; Elliott, T. Determining melt productivity of mantle sources from 238U-230Th and 235U-231Pa disequilibria; an example from Pico Island, Azores. Geochim. Cosmochim. Acta 2009, 73, 2103–2122. [Google Scholar] [CrossRef]
  146. Wilson, T.J. Hypothesis of Earth's behaviour. Nature 1963, 198, 925–929. [Google Scholar] [CrossRef]
  147. Morgan, W.J. Convection plumes in the lower mantle. Nature 1971, 230, 42–43. [Google Scholar] [CrossRef]
  148. Morgan, W.J. Deep mantle convection plumes and plate motions. Bull. Am. Assoc. Pet. Geol. 1972, 56, 203–213. [Google Scholar] [CrossRef]
  149. Whitehead Jr., J. A.; Luther, D.S. Dynamics of laboratory diapir and plume models. J. Geophys. Res. 1975, 80, 705–717. [Google Scholar] [CrossRef]
  150. Watson, S.; McKenzie, D. Melt generation by plumes: a study of Hawaiian volcanism. J. Petrol. 1991, 32, 501–537. [Google Scholar] [CrossRef]
  151. White, W.M. Sources of oceanic basalts: Radiogenic isotopic evidence. Geology 1985, 13, 115–118. [Google Scholar] [CrossRef]
  152. White, W.M. Oceanic island basalts and mantle plumes: The geochemical perspective. Annu. Rev. Earth Planet. Sci. 2010, 38, 133–160. [Google Scholar] [CrossRef]
  153. Bourdon, B.; Ribe, N.M.; Stracke, A.; Saal, A.E.; Turner, S.P. Insights into the dynamics of mantle plumes from uranium-series geochemistry. Nature 2006, 444, 713–717. [Google Scholar] [CrossRef]
  154. Pietruszka, A.J.; Garcia, M.O.; Carlson, R.W.; Hauri, E.H. Slow changes in lava chemistry at Kama‘ehuakanaloa linked to sluggish mantle upwelling on the margin of the Hawaiian plume. Geology 2023, 51, 713–717. [Google Scholar] [CrossRef]
  155. MacDonald, G.A.; Katsura, T. Chemical composition of Hawaiian lavas. J. Petrol. 1964, 5, 82–133. [Google Scholar] [CrossRef]
  156. Chen, C.-Y.; Frey, F.A. Origin of Hawaiian tholeiite and alkalic basalt. Nature 1983, 302, 785–789. [Google Scholar] [CrossRef]
  157. Krishnaswami, S.; Turekian, K.K.; Bennett, J.T. The behavior of 232Th and the 238U decay chain nuclides during magma formation and volcanism. Geochim. Cosmochim. Acta 1984, 48, 505–511. [Google Scholar] [CrossRef]
  158. Newman, S.; Finkel, R.C.; Macdougall, J.D. Comparison of 230Th-238U disequilibrium systematics in lavas from three hot spot regions: Hawaii, Prince Edward and Samoa, Geochim. Cosmochim. Acta 1984, 48, 315–324. [Google Scholar] [CrossRef]
  159. Reinitz, I.M.; Turekian, K.K. The behavior of the uranium decay chain nuclides and thorium during the flank eruptions of Kilauea (Hawaii) between 1983 and 1985. Geochim. Cosmochim. Acta 1991, 55, 3735–3740. [Google Scholar] [CrossRef]
  160. Hémond, C.; Hofmann, A.W.; Heusser, G.; Condomines, M.; Raczek, I.; Michael^Rhodes, J. U-Th-Ra systematics in Kilauea and Mauna Loa basalts, Hawaii. Chem. Geol. 1994, 116, 163–180. [Google Scholar] [CrossRef]
  161. Cohen, A.S.; O’Nions, R.K. Melting rates beneath Hawaii: Evidence from uranium series isotopes in recent lavas. Earth Planet. Sci. Lett. 1993, 120, 169–175. [Google Scholar] [CrossRef]
  162. Pietruszka, A.J.; Rubin, K.H.; Garcia, M.O. 238U-230Th-226Ra disequilibria in historical Kilauea volcano lavas: Mantle melting within the Hawaiian plume. In Proceedings of the Ninth Annual V.M. Goldschmidt Conference, Cambridge, Massachusetts, United States, August 1999. [Google Scholar]
  163. Girard, G.; Reagan, M.K.; Sims, K.W.W.; Thornber, C.R.; Waters, C.L.; Phillips, E.H. 238U-230Th-226Ra-210Pb-210Po Disequilibria constraints on magma generation, ascent, and degassing during the ongoing eruption of Kilauea. J. Petrol. 2017, 58, 1199–1226. [Google Scholar] [CrossRef]
  164. Cooper, K.M.; Reid, M.R.; Murrell, M.T.; Clague, D.A. Crystal and magma residence at Kilauea Volcano, Hawaii: 230Th-226Ra dating of the 1955 east rift eruption. Earth Planet. Sci. Lett. 2001, 184, 703–718. [Google Scholar] [CrossRef]
  165. Pietruszka, A.J.; Rubin, K.H.; Garcia, M.O. 226Ra–230Th–238U disequilibria of historical Kilauea lavas (1790–1982) and the dynamics of mantle melting within the Hawaiian plume. Earth Planet. Sci. Lett. 2001, 186, 15–31. [Google Scholar] [CrossRef]
  166. Salters, V.J.M.; Hart, S.R. The hafnium paradox and the role of garnet in the source of mid-ocean-ridge basalts. Nature 1989, 342, 420–422. [Google Scholar] [CrossRef]
  167. Pickett, D.A.; Murrell, M.T. Observations of 231Pa/235U disequilibrium in volcanic rocks. Earth Planet. Sci. Lett. 1997, 148, 259–271. [Google Scholar] [CrossRef]
  168. Ribe, N.M.; Christensen, U.R. The dynamical origin of Hawaiian volcanism. Earth Planet. Sci. Lett. 1999, 171, 517–531. [Google Scholar] [CrossRef]
  169. Pietruszka, A.J.; Keyes, M.J.; Duncan, J.A.; Hauri, E.H.; Carlson, R.W.; Garcia, M.O. Excesses of seawater-derived 234U in volcanic glasses from Loihi Seamount due to crustal contamination. Earth Planet. Sci. Lett. 2011, 304, 280–289. [Google Scholar] [CrossRef]
  170. Chabaux, F.; Allègre, C.J. 238U-230Th-226Ra disequilibria in volcanics- a new insight into melting conditions. Earth Planet. Sci. Lett. 1994, 126, 61–74. [Google Scholar] [CrossRef]
  171. Sleep, N.H. Hotspots and mantle plumes—some phenomenology. J. Geophys. Res. 1990, 95, 6715–6736. [Google Scholar] [CrossRef]
  172. Ribe, N.M. The dynamics of plume-ridge interaction 2. Off-ridge plumes. J. Geophys. Res. 1996, 101, 16,195–16,204. [Google Scholar] [CrossRef]
  173. DePaolo, D.J.; Stolper, E.M. Models of Hawaiian volcano growth and plume structure: Implications of results from the Hawaii Scientific Drilling Project. J. Geophys. Res.: Solid Earth 1996, 101, 11643–11654. [Google Scholar] [CrossRef]
  174. Jull, M.; Ribe, N. The geochemistry of Hawaiian plume dynamics. In Proceedings of the Twelfth Annual V.M. Goldschmidt Conference, Davos, Switzerland, August 2002. [Google Scholar]
  175. Sims, K.W.W.; Hart, S.R. Comparison of Th, Sr, Nd and Pb isotopes in oceanic basalts: Implications for mantle heterogeneity and magma genesis. Earth Planet. Sci. Lett. 2006, 245, 743–761. [Google Scholar] [CrossRef]
  176. DePaolo, D.J.; Wasserburg, G.J. Inferences about magma sources and mantle structure from variations of 143Nd/144Nd. Geophys. Res. Lett. 1976, 3, 743–746. [Google Scholar] [CrossRef]
  177. Zindler, A.; Hart, S.R. Chemical Geodynamics. Ann. Rev. Earth Planet. Sci. 1988, 14, 493–571. [Google Scholar] [CrossRef]
  178. Hart, S.R. Heterogeneous mantle domains: signatures, genesis and mixing chronologies. Earth Planet. Sci. Lett. 1988, 90, 273–296. [Google Scholar] [CrossRef]
  179. Stracke, A.; Hofmann, A.W.; Hart, S.R. FOZO, HIMU, and the rest of the mantle zoo. Geochem. Geophys. Geosyst. 2005, 6. [Google Scholar] [CrossRef]
  180. Rudge, J.F.; Maclennan, J.; Stracke, A. The geochemical consequences of mixing melts from a heterogeneous mantle. Geochim. Cosmochim. Acta 2013, 114, 112–143. [Google Scholar] [CrossRef]
  181. Oliveira, B.; Afonso, J.C.; Tilhac, R. A disequilibrium reactive transport model for mantle magmatism. J. Petrol. 2020, 61. [Google Scholar] [CrossRef]
  182. Stracke, A.; Willig, M.; Genske, F.; Béguelin, P.; Todd, E. Chemical geodynamics insights from a machine learning approach. Geochem. Geophys. Geosyst. 2022, 23. [Google Scholar] [CrossRef]
  183. Prytulak, J.; Avanzinelli, R.; Koetsier, G.; Kreissig, K.; Beier, C.; Elliott, T. Melting versus contamination effects on 238U-230Th-226Ra and 235U-231Pa disequilibria in lavas from São Miguel, Azores. Chem. Geol. 2014, 381, 94–109. [Google Scholar] [CrossRef]
  184. Neymark, L.A.; Amelin, Y.V.; Paces, J.B. 206Pb–230Th–234U–238U and 207Pb–235U geochronology of Quaternary opal, Yucca Mountain, Nevada. Geochim. Cosmochim. Acta 2002, 64, 2913–2928. [Google Scholar] [CrossRef]
  185. Duncan, R.A.; Hogan, L.G. Radiometric dating of young MORB using the 40Ar-39Ar incremental heating method. Geophys. Res. Lett. 1994, 21, 1927–1930. [Google Scholar] [CrossRef]
  186. Rubin, K.H.; Mcdougall, J.D. Dating of neovolcanic MORB using (226Ra/230Th) disequilibrium. Earth Planet. Sci. Lett. 1990, 101, 313–322. [Google Scholar] [CrossRef]
  187. Goldstein, S.J.; Murrell, M.T.; Janecky, D.R.; Delaney, J.R.; Clague, D.A. Geochronology and petrogenesis of MORB from the Juan de Fuca and Gorda ridges by 238U–230Th disequilibrium. Earth Planet. Sci. Lett. 1991, 107, 25–41. [Google Scholar] [CrossRef]
  188. Goldstein, S.J.; Murrell, M.T.; Williams, R.W. 231Pa and 230Th chronology of mid-ocean ridge basalts. Earth Planet. Sci. Lett. 1993, 115, 151–159. [Google Scholar] [CrossRef]
  189. Goldstein, S.J.; Perfit, M.R.; Batiza, R.; Fornari, D.J.; Murrell, M.T. Off-axis volcanism at the East Pacific Rise detected by uranium-series dating of basalts. Nature 1994, 367, 157–159. [Google Scholar] [CrossRef]
  190. Rubin, K.H.; Macdougall, J.D.; Perfit, M.R. 210Po-210Pb dating of recent volcanic eruptions on the sea floor. Nature 1994, 368, 841–844. [Google Scholar] [CrossRef]
  191. Rubin, K.H.; Van der Zander, I.; Smith, M.C.; Bergmanis, E.C. Minimum speed limit for ocean ridge magmatism from 210Pb–226Ra–230Th disequilibria. Nature 2005, 437, 534–538. [Google Scholar] [CrossRef] [PubMed]
  192. Volpe, A.M.; Goldstein, S.J. 226Ra-230Th disequilibrium in axial and off-axis mid-ocean ridge basalts. Geochim. Cosmochim. Acta 1993, 57, 1233–1241. [Google Scholar] [CrossRef]
  193. Haase, K.M.; Brandl, P.A.; Devey, C.W.; Hauff, F.; Melchert, B.; Garbe-Schönberg, D.; Kokfelt, T.F.; Paulick, H. Compositional variation and 226Ra-230Th model ages of axial lavas from the southern Mid-Atlantic Ridge, 8° 48′ S. Geochem. Geophys. Geosyst. 2016, 17, 199–218. [Google Scholar] [CrossRef]
  194. Scott, S.R.; Ramos, F.C.; Gill, J.B. Spreading dynamics of an intermediate Ridge: Insights from U-series disequilibria, Endeavour Segment, Juan de Fuca Ridge. J. Petrol. 2018, 59, 1847–1868. [Google Scholar] [CrossRef]
  195. Zou, H.; Zindler, A.; Niu, Y. Constraints on melt movement beneath the East Pacific Rise from 230Th-238U disequilibrium. Science 2002, 295, 107–110. [Google Scholar] [CrossRef]
  196. Turner, S.; Beier, C.; Niu, Y.; Cook, C. U-Th-Ra disequilibria and the extent of off-axis volcanism across the East Pacific Rise at 9 30′ N, 10 30′ N, and 11 20′ N. Geochem. Geophys. Geosyst. 2011, 12. [Google Scholar] [CrossRef]
  197. Reubi, O.; Sims, K.W.W.; Bourdon, B. 238U-230Th equilibrium in arc magmas and implications for the time scales of mantle metasomatism. Earth Planet. Sci. Lett. 2014, 391, 146–158. [Google Scholar] [CrossRef]
  198. Reagan, M.K.; Sims, K.W.W.; Erich, J.; Thomas, R.B.; Cheng, H.; Edwards, R.L.; Layne, G.; Ball, L. Time-scales of differentiation from mafic parents to rhyolite in North American continental arcs. J. Petrol. 2003, 44, 1703–1726. [Google Scholar] [CrossRef]
  199. Gill, J.; Williams, R.; Bruland, K. Eruption of basalt and andesite lava degasses 222Rn and 210Po. Geophys. Res. Lett. 1985, 12, 17–20. [Google Scholar] [CrossRef]
  200. Condomines, M.; Hémond, C.; Allègre, C.J. U-Th-Ra radioactive disequilibria and magmatic processes. Earth Planet. Sci. Lett. 1988, 90, 243–262. [Google Scholar] [CrossRef]
  201. Sigmarsson, O. Short magma chamber residence time at an Icelandic volcano inferred from U-series disequilibria. Nature 1996, 382, 440–442. [Google Scholar] [CrossRef]
  202. Reid, M.R.; Coath, C.D.; Harrison, T.M.; McKeegan, K.D. Prolonged residence times for the youngest rhyolites associated with Long Valley Caldera: 230Th–238U ion microprobe dating of young zircons. Earth Planet. Sci. Lett. 1997, 150, 27–39. [Google Scholar] [CrossRef]
  203. Reid, M.R. Timescales of Magma Transfer and Storage in the Crust. In Treatise on Geochemistry; Rudnick, R.L.; Holland, H.D.; Turekian, K.K., Eds.; Elsevier, Amsterdam, Netherlands, 2003; Volume 3, pp. 167-193. [CrossRef]
  204. Condomines, M.; Gauthier, P.J.; Sigmarsson, O. Timescales of magma chamber processes and dating of young volcanic rocks. In U-series Geochemistry; Bourdon, B., Lundstrom, C., Henderson, G., Turner, S.P., Eds.; Eds., Mineralogical Society of America: Washington, D.C., United States, 2003; pp. 125–174. [Google Scholar] [CrossRef]
  205. Jicha, B.R.; Singer, B.S.; Beard, B.L.; Johnson, C.M. Contrasting timescales of crystallization and magma storage beneath the Aleutian Island arc. Earth Planet. Sci. Lett. 2005, 236, 195–210. [Google Scholar] [CrossRef]
  206. Reagan, M.K.; Tepley III, F.J.; Gill, J.B.; Wortel, M.; Hartman, B. Rapid time scales of basalt to andesite differentiation at Anatahan volcano, Mariana Islands. J. Volcanol. Geotherm. Res. 2005, 146, 171–183. [Google Scholar] [CrossRef]
  207. Cooper, K.M.; Sims, K.W.W.; Eiler, J.M.; Banerjee, N. Timescales of storage and recycling of crystal mush at Krafla Volcano, Iceland. Contrib. Mineral. Petrol. 2016, 171, 54. [Google Scholar] [CrossRef]
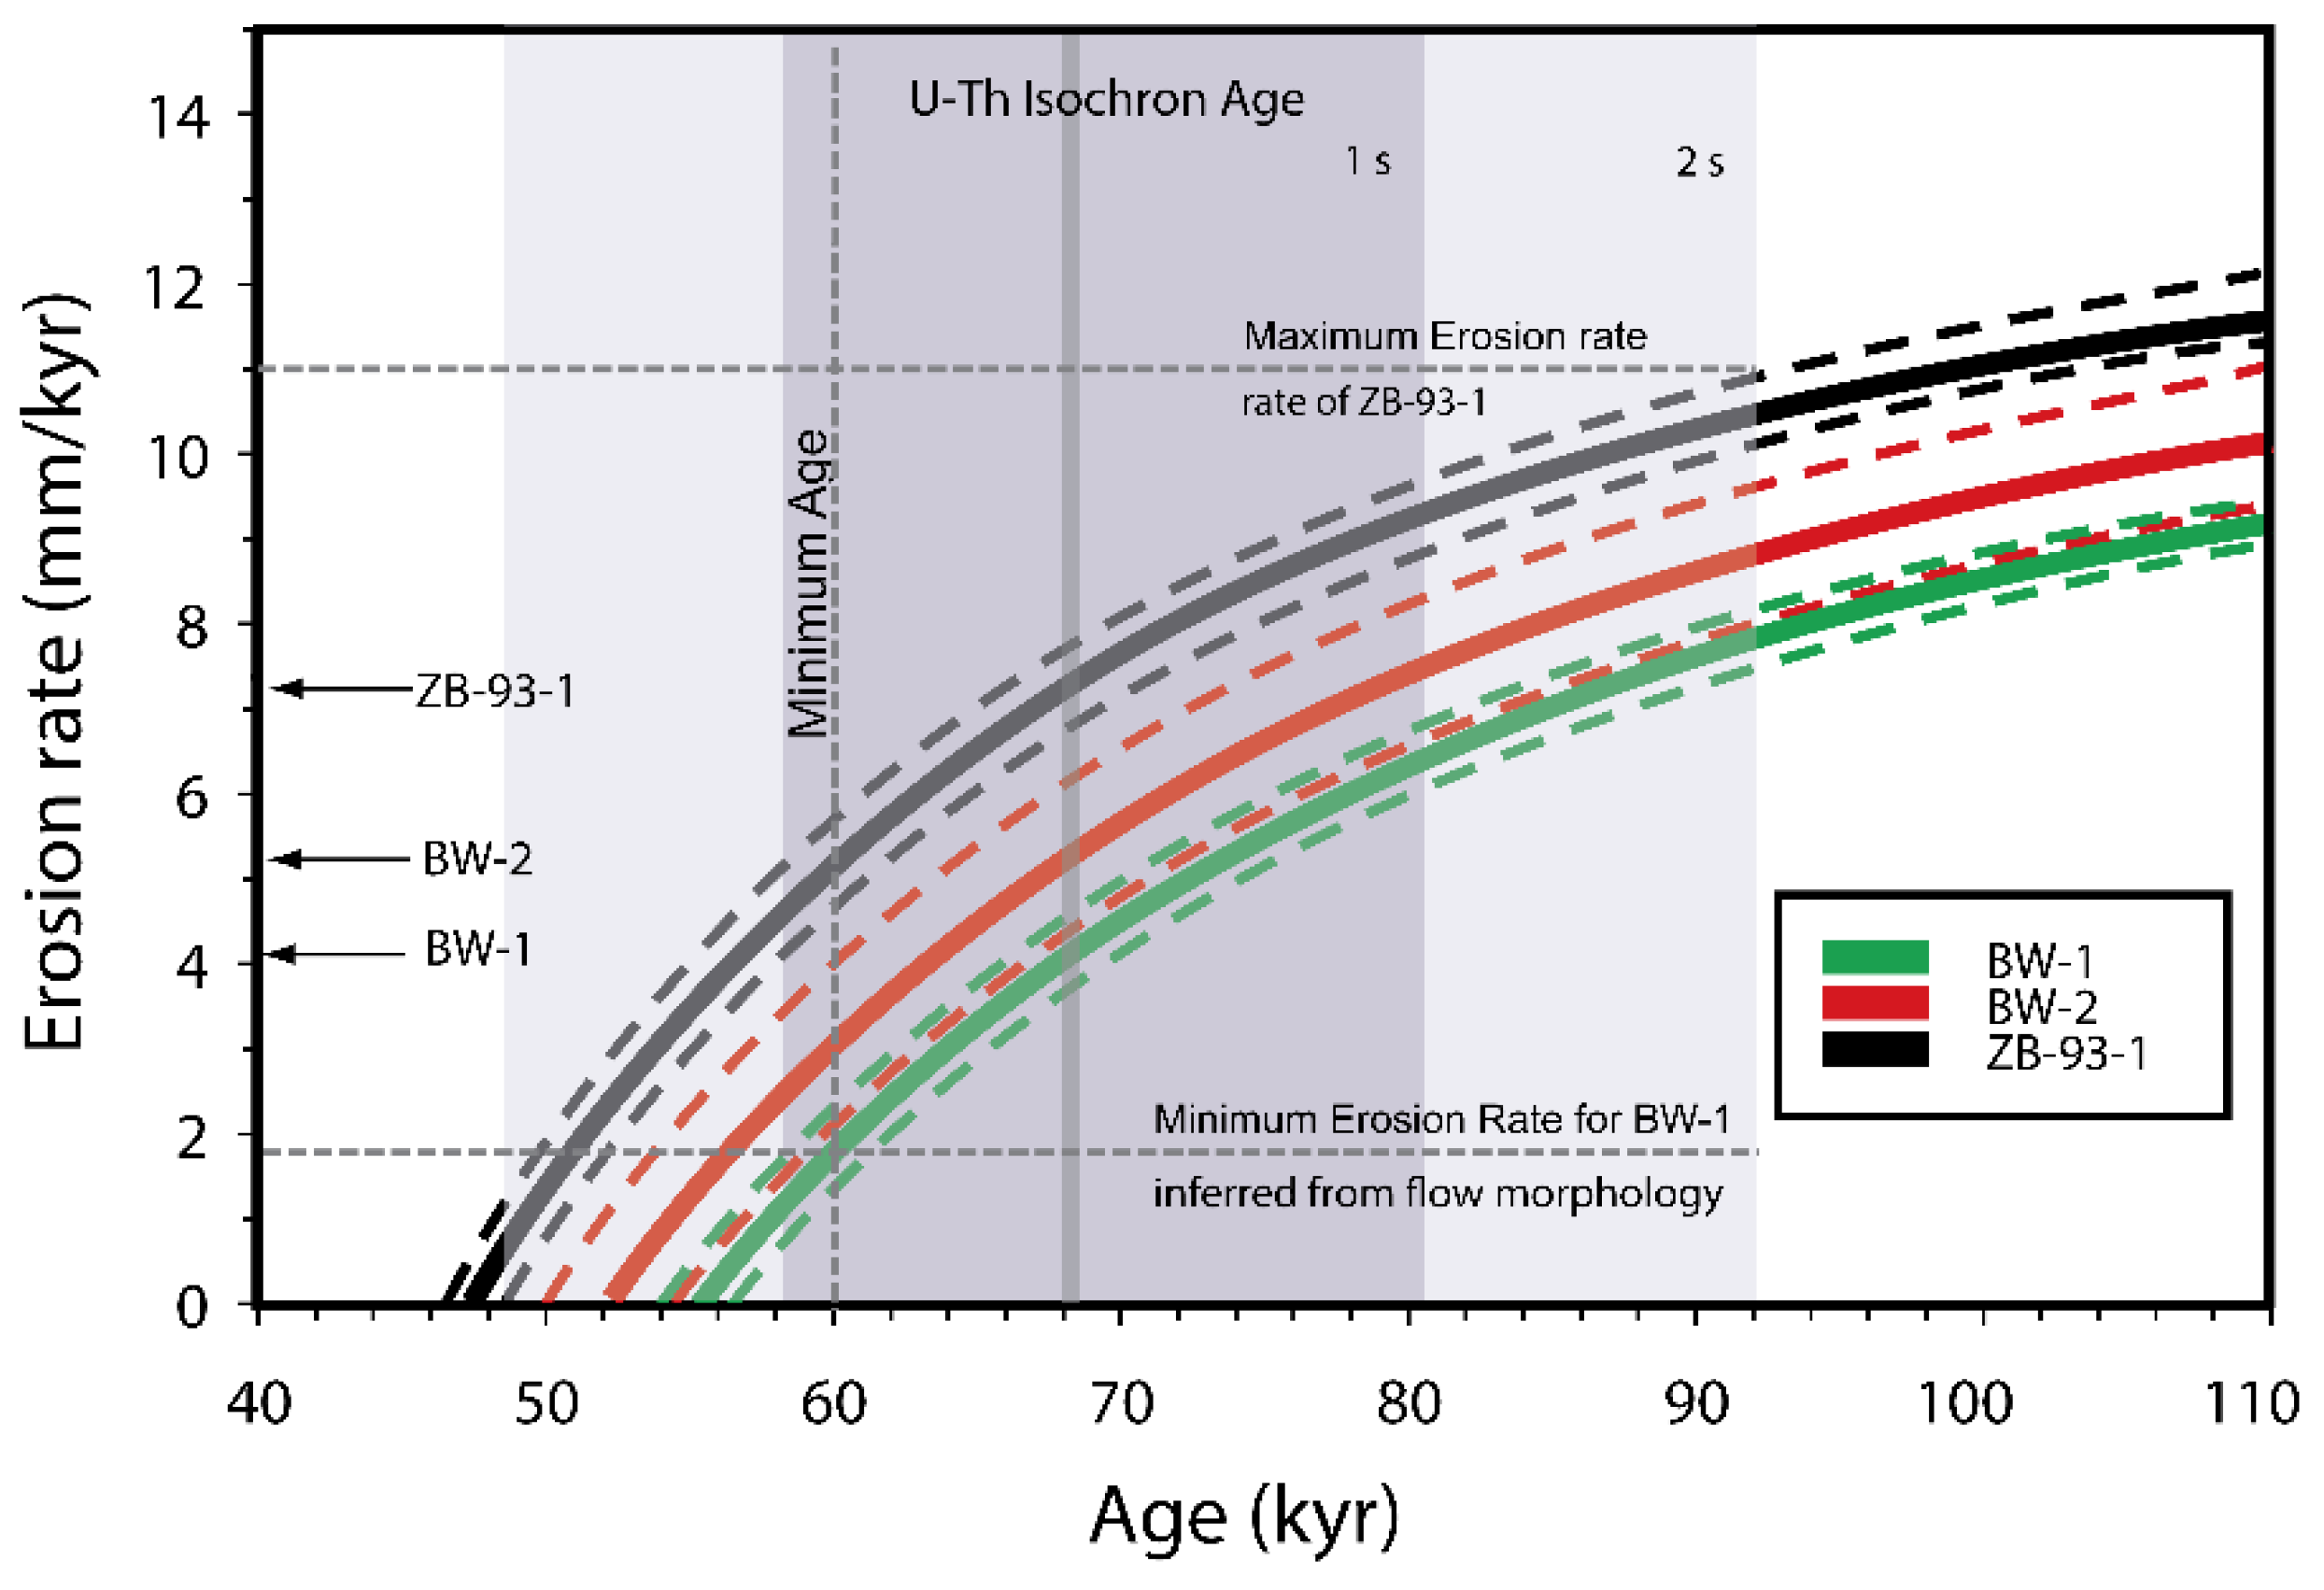
  208. Sims, K.W.W.; Ackert, Jr., R. P.; Ramos, F.; Sohn, R.A.; Murrell, M.T.; DePaolo, D.J. Determining eruption ages and erosion rates of Quaternary basaltic volcanism from combined U-series disequilibria and cosmogenic exposure ages. Geology 2007, 35, 471–474. [Google Scholar] [CrossRef]
  209. Turner, S.; Black, S.; Berlo, K. 210Pb–226Ra and 228Ra–232Th systematics in young arc lavas: implications for magma degassing and ascent rates. Earth Planet. Sci. Lett. 2004, 227, 1–16. [Google Scholar] [CrossRef]
  210. Volpe, A.M.; Hammond, P.E. 238U-230Th-226Ra disequilibria in young Mount St. Helens rocks: time constraint for magma formation and crystallization. Earth Planet. Sci. Lett. 1991, 107, 475–486. [Google Scholar] [CrossRef]
  211. Volpe, A.M. 238U-230Th-226Ra disequilibrium in young Mt. Shasta andesites and dacites. J. Volcanol. Geotherm. Res. 1992, 53, 227–238. [Google Scholar] [CrossRef]
  212. Zellmer, G.F.; Rubin, K.H.; Grönvold, K.; Jurado-Chichay, Z. On the recent bimodal magmatic processes and their rates in the Torfajökull–Veidivötn area, Iceland. Earth Planet. Sci. Lett. 2008, 269, 388–398. [Google Scholar] [CrossRef]
  213. Blundy, J.; Wood, B. Prediction of crystal-melt partition coefficients from elastic moduli. Nature 1994, 372, 452–454. [Google Scholar] [CrossRef]
  214. Sohn, R.A.; Menke, W. Application of maximum likelihood and bootstrap methods to nonlinear curve-fit problems in geochemistry. Geochem. Geophys. Geosyst. 2002, 3, 1–17. [Google Scholar] [CrossRef]
  215. Wood, B.J.; Blundy, J.D. Trace Element Partitioning under Crustal and Uppermost Mantle Conditions: The Influences of Ionic Radius, Cation Charge, Pressure, and Temperature. In Treatise on Geochemistry; Carlson, R.W.; Holland, H.D.; Turekian, K.K., Eds.; Elsevier, Amsterdam, Netherlands, 2003; Volume 3, pp. 568. [CrossRef]
  216. Kokfelt, T.F.; Hoernle, K.; Lundstrom, C.; Hauff, F.; Van Den Bogaard, C. Time-scales for magmatic differentiation at the Snaefellsjökull central volcano, western Iceland: Constraints from U–Th–Pa–Ra disequilibria in post-glacial lavas. Geochim. Cosmochim. Acta 2009, 73, 1120–1144. [Google Scholar] [CrossRef]
  217. Cooper, K.M.; Reid, M.R. Uranium-series crystal ages. Rev. Mineral. Geochem. 2008, 69, 479–544. [Google Scholar] [CrossRef]
  218. Dunbar, N.W.; Phillips, F.M. Cosmogenic 36Cl ages of lava flows in the Zuni-Bandera volcanic field, north central New Mexico, USA. New Mex. Bur. of Geol. and Miner. Resour. Bull. 2004, 160, 309–317. [Google Scholar]
  219. Harpel, C.J.; Kyle, P.R.; Esser, R.P.; McIntosh, W.C.; Caldwell, D.A. 40Ar/39Ar dating of the eruptive history of Mount Erebus, Antarctica: summit flows, tephra, and caldera collapse. Bull. Volcanol. 2004, 66, 687–702. [Google Scholar] [CrossRef]
  220. Sohn, R.A.; Sims, K.W.W. Bending as a mechanism for triggering off-axis volcanism on the East Pacific Rise. Geology 2005, 33, 93–96. [Google Scholar] [CrossRef]
  221. Gauthier, P.J.; Condomines, M. 210Pb–226Ra radioactive disequilibria in recent lavas and radon degassing: inferences on the magma chamber dynamics at Stromboli and Merapi volcanoes. Earth Planet. Sci. Lett. 1999, 172, 111–126. [Google Scholar] [CrossRef]
  222. Reagan, M.K.; Tepley III, F.J.; Gill, J.B.; Wortel, M.; Garrison, J. Timescales of degassing and crystallization implied by 210Po–210Pb–226Ra disequilibria for andesitic lavas erupted from Arenal volcano. J. Volcanol. Geotherm. Res. 2006, 157, 135–146. [Google Scholar] [CrossRef]
  223. Reagan, M.K.; Turner, S.; Legg, M.; Sims, K.W.W.; Hards, V.L. 238U- and 232Th-decay series constraints on the timescales of crystal fractionation to produce the phonolite erupted in 2004 near Tristan da Cunha, South Atlantic Ocean. Geochim. Cosmochim. Acta 2008, 72, 4367–4378. [Google Scholar] [CrossRef]
  224. Berlo, K.; Turner, S. 210Pb–226Ra disequilibria in volcanic rocks. Earth Planet. Sci. Lett. 2010, 296, 155–164. [Google Scholar] [CrossRef]
  225. Condomines, M.; Sigmarsson, O.; Gauthier, P.J. A simple model of 222Rn accumulation leading to 210Pb excesses in volcanic rocks. Earth Planet. Sci. Lett. 2010, 293, 331–338. [Google Scholar] [CrossRef]
  226. Sigmarsson, O.; Condomines, M.; Gauthier, P.J. Excess 210Po in 2010 Eyjafjallajökull tephra (Iceland): Evidence for pre-eruptive gas accumulation. Earth Planet. Sci. Lett. 2015, 427, 66–73. [Google Scholar] [CrossRef]
  227. Carbotte, S.; Macdonald, K. East Pacific Rise 8–10 30′ N: Evolution of ridge segments and discontinuities from SeaMARC II and three-dimensional magnetic studies. J. Geophys. Res.: Solid Earth 1992, 97, 6959–6982. [Google Scholar] [CrossRef]
  228. Hervé, G.; Sigmarsson, O.; Larsen, G. Declining Gas Accumulation Under Hekla Volcano, Iceland, From 210Pb-226Ra Disequilibrium. J. Geophys. Res.: Solid Earth 2025, 130. [Google Scholar] [CrossRef]
  229. Gauthier, P.J.; Le Cloarec, M.F.; Condomines, M. Degassing processes at Stromboli volcano inferred from short-lived disequilibria (210Pb–210Bi–210Po) in volcanic gases. J. Volcanol. Geotherm. Res. 2000, 102, 1–19. [Google Scholar] [CrossRef]
  230. Rubin, K.H. Degassing of metals and metalloids from erupting seamount and mid-ocean ridge volcanoes: Observations and predictions. Geochim. Cosmochim. Acta 1997, 61, 3525–3542. [Google Scholar] [CrossRef]
  231. Bennett, J.T.; Krishnaswami, S.; Turekian, K.K.; Melson, W.G.; Hopson, C.A. The uranium and thorium decay series nuclides in Mt. St. Helens effusives. Earth Planet. Sci. Lett. 1982, 60, 61–69. [Google Scholar] [CrossRef]
  232. Lambert, G.; Le Cloarec, M.F.; Ardouin, B.; Le Roulley, J.C. Volcanic emission of radionuclides and magma dynamics. Earth Planet. Sci. Lett. 1985, 76, 185–192. [Google Scholar] [CrossRef]
  233. Rubin, K.H.; Macdougall, J.D. Submarine magma degassing and explosive magmatism at Macdonald (Tamarii) seamount. Nature 1989, 341, 50–52. [Google Scholar] [CrossRef]
  234. Tolstoy, M.; Cowen, J.P.; Baker, E.T.; Fornari, D.J.; Rubin, K.H.; Shank, T.M.; Waldhauser, F.; Bohnenstiehl, D.R.; Forsyth, D.W.; Holmes, R.C.; Glazer, B. A sea-floor spreading event captured by seismometers. Science 2006, 314, 1920–1922. [Google Scholar] [CrossRef]
  235. Ferrini, V.L.; Tivey, M.K.; Carbotte, S.M.; Martinez, F.; Roman, C. Variable morphologic expression of volcanic, tectonic, and hydrothermal processes at six hydrothermal vent fields in the Lau back-arc basin. Geochem. Geophys. Geosyst. 2008, 9. [Google Scholar] [CrossRef]
  236. Sato, K.; Sato, J. Estimation of gas-releasing efficiency of erupting magma from 226Ra–222Rn disequilibrium. Nature 1977, 266, 439–440. [Google Scholar] [CrossRef]
  237. Berlo, K.; Turner, S.; Blundy, J.; Black, S.; Hawkesworth, C. Tracing pre-eruptive magma degassing using (210Pb/226Ra) disequilibria in the volcanic deposits of the 1980–1986 eruption of Mount St. Helens. Earth Planet. Sci. Lett. 2006, 249, 337–349. [Google Scholar] [CrossRef]
  238. Le Cloarec, M.F.; Gauthier, P.J. Merapi Volcano, Central Java, Indonesia: A case study of radionuclide behavior in volcanic gases and its implications for magma dynamics at andesitic volcanoes. J. Geophys. Res.: Solid Earth 2003, 108. [Google Scholar] [CrossRef]
  239. Bergmanis, E.C.; Sinton, J.; Rubin, K.H. Recent eruptive history and magma reservoir dynamics on the southern East Pacific Rise at 17°30′ S. Geochem. Geophys. Geosyst. 2007, 8. [Google Scholar] [CrossRef]
  240. Dreyer, B.; Clague, D.A.; Gill, J.B. Magmagenesis at Axial Seamount, Juan de Fuca Ridge: Insights from Uranium-Series Systematics. In AGU Fall Meeting Abstracts, San Francisco, California, United States, December 2009.
  241. Kent, G.M.; Singh, S.; Harding, A.; Sinha, M.; Orcutt, J.; Barton, P.; Bazin, S.; Hobbs, R.; Tong, C.; Pye, J. Evidence from three-dimensional seismic reflectivity images for enhanced melt supply beneath mid-ocean ridge discontinuities. Nature 2000, 406, 614–618. [Google Scholar] [CrossRef] [PubMed]
  242. Singh, S.; Harding, A.; Kent, G.; Sinha, M.; Combier, V.; Bazin, S.; Tong, C.; Pye, J.; Barton, P.; Hobbs, R.; White, R.; Orcutt, J. Seismic reflection images of the moho underlying melt sills at the East Pacific Rise. Nature 2006, 442, 287–290. [Google Scholar] [CrossRef]
  243. Kayzar, T.M.; Cooper, K.M.; Reagan, M.K.; Kent, A.J. Gas transport model for the magmatic system at Mount Pinatubo, Philippines: Insights from (210Pb)/(226Ra). J. Volcanol. Geotherm. Res. 2009, 181, 124–140. [Google Scholar] [CrossRef]
  244. Sutton, A.J.; Elias, T. One hundred volatile years of volcanic gas studies at the Hawaiian Volcano Observatory. Characteristics of Hawaiian Volcanoes 2014, 1801, 295–320. [Google Scholar]
  245. Sims, K.W.W.; Blichert-Toft, J.; Kyle, P.R.; Pichat, S.; Bluzstajn, J.; Kelly, P.J.; Ball, L.A.; Layne, G.D. A Sr, Nd, Hf, and Pb isotope perspective on the genesis and long-term evolution of alkaline magmas from Erebus volcano, Antarctica. J. Volcanol. Geotherm. Res. 2008, 177, 606–618. [Google Scholar] [CrossRef]
  246. Phillips, E.H.; Sims, K.W.W.; Blichert-Toft, J.; Aster, R.C.; Gaetani, G.A.; Kyle, P.R.; Wallace, P.J.; Rasmussen, D.J. The nature and evolution of mantle upwelling at Ross Island, Antarctica, with implications for the source of HIMU lavas. Earth Planet. Sci. Lett. 2018, 498, 38–53. [Google Scholar] [CrossRef]
  247. Park, S-H.; Langmuir, C.H.; Sims, K.W.W.; Blichert-Toft, J.; Kim, S-S.; Scott, S.R.; Lin, J.; Choi, H.; Yang, Y-S.; Michaels, P.J. An isotopically distinct Zealandia-Antarctic mantle domain in the Southern Ocean, Nat. Geosci. 2019, 12, 206–214. [CrossRef]
  248. Kelly, P.J.; Kyle, P.R.; Dunbar, N.W.; Sims, K.W.W. Geochemistry and mineralogy of the phonolite lava lake, Mount Erebus volcano, Antarctica: 1972 – 2004 and comparison with older lavas. J. Volcanol. Geotherm. Res. 2008, 177, 589–605. [Google Scholar] [CrossRef]
  249. Oppenheimer, C.; Moretti, R.; Kyle, P.R.; Eschenbacher, A.; Lowenstern, J.B.; Hervig, R.L; Dunbar, N.W. Mantle to surface degassing of alkalic magmas at Erebus volcano, Antarctica. Earth Planet. Sci. Lett. 2011, 306, 261–271. [Google Scholar] [CrossRef]
  250. Dunbar, N.W.; Cashman, K.V.; Dupré, R. Crystallization Processes of Anorthoclase Phenocrysts in the Mount Erebus Magmatic System: Evidence from Crystal Composition, Crystal Size Distributions, and Volatile Contents of Melt Inclusions. In Volcanological and Environmental Studies of Mount Erebus, Antarctica; Kyle, P.R., Ed.; American Geophysical Union: Washington D.C., United States, 1994; Volume 66, pp. 129–146. [Google Scholar] [CrossRef]
  251. Eschenbacher, A.J. Open-System Degassing of a Fractionating, Alkaline Magma, Mount Erebus, Ross Island, Antarctica. M.S. Thesis, N.M. Institute of Mining and Technology, Socorro, New Mexico, United States, 1999. [Google Scholar]
  252. Rasmussen, D.J.; Kyle, P.R.; Wallace, P.J.; Sims, K.W.W.; Gaetani, G.A.; Phillips, E.H. Understanding degassing and transport of CO2 rich alkalic magmas at Ross Island, Antarctica using olivine-hosted melt inclusions. J. Petrol. 2017, 58, 841–861. [Google Scholar] [CrossRef]
  253. Williams, R.W.; Gill, J.B.; Bruland, K.W. Ra-Th disequilibria systematics: timescale of carbonatite magma formation at Oldoinyo Lengai volcano, Tanzania. Geochim. Cosmochim. Acta 1986, 50, 1249–1259. [Google Scholar] [CrossRef]
  254. Reagan, M.K.; Herrstrom, E.A.; Murrell, M.T. Uranium series and beryllium isotope evidence for an extended history of subduction modification of the mantle below Nicaragua. Geochim. Cosmochim. Acta 1994, 58, 4199–4212. [Google Scholar] [CrossRef]
  255. McGee, L.; Reagan, M.; Turner, S.; Sparks, R.S.; Handley, H.; Didonna, R.; Berlo, K.; Hansen, S.; Barclay, J. U-series histories of magmatic volatile phase and enclave development at Soufrière Hills Volcano, Montserrat. Chem. Geol. 2021, 559. [Google Scholar] [CrossRef]
  256. Goldstein, S.J.; Murrell, M.T.; Janecky, D.R. Th and U isotopic systematics of basalts from the Juan de Fuca and Gorda Ridges by mass spectrometry, Earth Planet. Sci. Lett. 1989, 96, 134–146. [Google Scholar] [CrossRef]
  257. Halliday, A.N.; Lee, D.C.; Christensen, J.N.; Walder, A.J.; Freedman, P.A.; Jones, C.E.; Hall, C.M.; Yi, W.; Teagle, D. Recent developments in inductively coupled plasma magnetic sector multiple collector mass spectrometry. Int. J. Mass Spectrom. Ion Processes 1995, 146, 21–33. [Google Scholar] [CrossRef]
  258. Layne, G.D.; K. W.W. Sims Analysis of 232Th/230Th in volcanic rocks by Secondary Ionization Mass Spectrometry. Int. J. Mass Spectrom. 2000, 203, 1-3, 187-198. [Google Scholar] [CrossRef]
  259. Pietruszka, A.J.; Carlson, R.W.; Hauri, E.H. Precise and accurate measurement of 226Ra -230Th-238U disequilibria in volcanic rocks using plasma ionization muticollector mass spectrometry. Chem. Geol. 2002, 188, 171–191. [Google Scholar] [CrossRef]
  260. Hoffmann, D.L.; Prytulak, J.; Richards, D.A.; Elliott, T.; Coath, C.D.; Smart, P.L.; Scholz, D. Procedures for accurate U and Th isotope measurements by high precision MC-ICPMS. Int. J. Mass Spectrom. 2007, 264, 97–109. [Google Scholar] [CrossRef]
  261. Ball, L.A.; Sims, K.W.W.; Schwieters, J. Measurement of 234U/238U and 230Th/232Th in volcanic rocks using the Neptune MC-ICP-MS. J. Anal. At. Spectrom. 2008, 23, 173–180. [Google Scholar] [CrossRef]
  262. Sims, K.W.W.; Gill, J.; Dossetto, A.; Hoffmann, D.; Lundstrom, C.C.; Williams, R.; Ball, L.A.; Tollstrup, D.; Turner, S.P.; Prytulak, J.; Glessner, J.; Standish, J.J. Elliott, T. An inter-laboratory assessment of the Th Isotopic Composition of Synthetic and Rock standards. Geostand. and Anal. Res. 2008, 32, 65–91. [Google Scholar] [CrossRef]
  263. Scott, S.R.; Sims, K.W.W.; Reagan, M.K. , Ball, L.; Schwieters, J.B.; Bouman, C.; Lloyd, N.S.; Waters, C.L.; Standish, J.J.; Tollstrup, D.L. The application of abundance sensitivity filters to the precise and accurate measurement of U-series nuclides by plasma mass spectrometry. Int. J. Mass Spectrom. 2019, 435, 321–332. [Google Scholar] [CrossRef]
  264. Koornneef, J.M.; Stracke, A.; Aciego, S.; Reubi, O.; Bourdon, B. A new method for U–Th–Pa–Ra separation and accurate measurement of 234U–230Th–231Pa–226Ra disequilibria in volcanic rocks by MC-ICPMS. Chem. Geol. 2010, 277, 30–41. [Google Scholar] [CrossRef]
  265. Dutton, A.; Rubin, K.; McLean, N.; Bowring, J.; Bard, E.; Edwards, R.; Henderson, G.; Reid, M.; Richards, D.; Sims, K.W.W.; Walker, J.; Yokoyama, Y. Data reporting standards for publication of U-series data for geochronology and timescale assessment in the Earth Sciences. Quat. Geochronol. 2017, 39, 142–149. [Google Scholar] [CrossRef]
  266. Rubin, K.H. Analysis of 232Th/230Th in volcanic rocks: a comparison of thermal ionization mass spectrometry and other methodologies. Chem. Geol. 2001, 175, 723–750. [Google Scholar] [CrossRef]
  267. Forsyth, D.W. Geophysical constraints on mantle flow and melt generation beneath mid-ocean ridges. Geophysical Monograph Series 1992, 71, 1–65. [Google Scholar] [CrossRef]
  268. Klein, E.M.; White, S.M.; Nunnery, A.; Mason, J.L.; Wanless, D.; Perfit, M.R.; Waters, C.L.; Sims, K.W.W.; Fornari, D.J.; Zaino, A.J.; Ridley, W.I. Seafloor photo-geology and sonar terrain modeling at the 9°N overlapping spreading center, East Pacific Rise. Geochem. Geophys. Geosyst. 2013, 14. [Google Scholar] [CrossRef]
Figure 1. Schematic showing the transformation processes that influence magma compositions and timescales of the magmatic processes that can be discerned by measurement of U and Th decay series disequilibria.
Preprints 184447 g001
Figure 5. Schematic showing the systematics of 238U-230Th in the two end-member models proposed to account for the 238U-230Th disequilibria measured in oceanic basalts: 1) Time-independent melting in which net elemental fractionation of Th from U at low melt fractions (and porosities) is the driving mechanism creating disequilibria [7,8,9]; and 2) time-dependent melting, where 230Th grows in over the timescale of melt generation [10,12]. If net elemental fractionation of U/Th during partial melting is the dominant effect, then the U/Th of the mantle source is best determined from the 230Th/232Th activity ratio of the lavas. On the other hand, if 230Th ingrowth is the fundamental mechanism generating 238U-230Th disequilibria, then the U/Th source ratio is best determined from the 238U/232Th activity ratio of the lavas and 238U/232Th will be best correlated with long-lived radiogenic isotope ratios, such as 87Sr/86Sr.
Preprints 184447 g005
Figure 7. Global MORB data set for which U-series nuclides have been measured [8,13,19,25,26,27,28,29,30,31,32,33,34,35,36,37,38,39,40,41,42,43,44,45,46].
Preprints 184447 g007
Disclaimer/Publisher’s Note: The statements, opinions and data contained in all publications are solely those of the individual author(s) and contributor(s) and not of MDPI and/or the editor(s). MDPI and/or the editor(s) disclaim responsibility for any injury to people or property resulting from any ideas, methods, instructions or products referred to in the content.
Copyright: This open access article is published under a Creative Commons CC BY 4.0 license, which permit the free download, distribution, and reuse, provided that the author and preprint are cited in any reuse.
Prerpints.org logo

Preprints.org is a free preprint server supported by MDPI in Basel, Switzerland.

Subscribe

Disclaimer

Terms of Use

Privacy Policy

Privacy Settings

© 2025 MDPI (Basel, Switzerland) unless otherwise stated