Submitted:
11 November 2025
Posted:
11 November 2025
You are already at the latest version
Abstract
Modern statistical techniques allow quantitative characterization of seismic activity. Analysis of the 2011 Tohoku megathrust earthquake revealed clear precursory signals: shortened inter-event intervals, increased magnitude scale (σ), and a pronounced precur-sory swarm immediately before the mainshock. While unique to this magnitude 9 event, here I present subtler anomalies may precede magnitude 7-class events, especially when swarms occur. In such cases, magnitude distributions often differ from background seis-micity, frequently showing elevated location (μ) and scale (σ). Conversely, σ was some-times reduced, particularly in volcanic regions, where large earthquakes may occur with-out discernible swarms. Detection of swarm activity and analysis of magnitude parame-ters thus remain central to seismic risk assessment. If swarm characteristics resemble background levels, the likelihood of a major event is presumably low. However, the dis-tinct, immediate precursory swarm observed before the Tohoku earthquake was not repli-cated elsewhere. These findings indicate that statistical anomalies may signal elevated risk but are unlikely to enable precise temporal prediction of seismic events.
Keywords:
seismic parameters
; magnitude
; volcanic activity
; precursory swarm
1. Introduction
For many years, it was widely believed that earthquakes could not be predicted [1]. However, statistical analysis has revealed three notable precursory phenomena [2] preceding the 2011 Tohoku earthquake, which registered a magnitude of 9.0 [3,4]. These precursors were as follows:
- A shortening of the interval between seismic events, indicating an increase in frequency.
- A rise in magnitude, accompanied by a significant increase in the standard deviation of the normally distributed magnitude data—suggesting a heightened likelihood of large-scale earthquakes.
- Immediately prior to the main event, a sequence of unusually high-magnitude earthquakes occurred, resulting in an improbably elevated average magnitude.
These findings suggest that the potential for predicting major seismic events may be considerable. Nevertheless, such precursors have thus far been reported primarily in connection with exceptionally large earthquakes. This naturally raises the question of whether comparable patterns might also be discernible in smaller seismic events. With respect to the timing of major earthquakes, some studies have introduced the concept of “natural time” to analyse phenomena such as magnetic field changes [5,6,7]. Other investigations have explored geodetic, electromagnetic, ionospheric, and macroscopic anomalies [8]. In the present work, we adopt a more restrained approach, considering only the timing of earthquakes and their magnitude.
In Japan, moderate earthquakes—classified as magnitude 5 to 6—occur with notable frequency [9]. For instance, in 2002, there were 60 magnitude 5 earthquakes, 13 magnitude 6 earthquakes, and one magnitude 7 earthquake [9]. While not all of these result in significant ground motion or human casualties, the ability to predict such events would undoubtedly enhance disaster preparedness [3,10]. This is particularly relevant given that many individuals remain unaware of the full implications of an earthquake. Should a major event occur, it would likely result in widespread power outages, disrupting internet access, telecommunications, and broadcast services. Food distribution would be impeded, as supermarkets without electricity would be unable to operate tills or refrigeration units. Petrol supplies would also be affected. Foreknowledge of such an event would allow for a degree of pre-emptive action.
Most recently, a major earthquake (M7.6) struck the Noto Peninsula in January 2024 [11]. The damage caused by this event remains unresolved, and full recovery has yet to be achieved. This study investigates whether precursory phenomena were present in this case, as well as in several other recent seismic events.
2. Materials and Methods
All data utilised in this study were obtained from the Japan Meteorological Agency (JMA) [9,12,13]. Two primary sources were employed:
- Periodical reports published in PDF format, which comprehensively document all perceptible seismic events occurring within Japan [9].
It should be noted that the catalogue data include a substantial number of events originating outside Japan, particularly those of higher magnitudes. For instance, approximately half of the entries for magnitude 5 and 6 earthquakes pertain to overseas events. Efforts were made to exclude such non-domestic data wherever feasible.
As of October 2025, the most recent full-year catalogue available covered the year 2022 [12]. More recent data are organised on a daily basis, rendering them less amenable to large-scale analysis [13]. Consequently, representative samples from selected days were extracted for inclusion.
Unless otherwise indicated, magnitude distributions were derived from the periodical reports, which focus exclusively on earthquakes felt within Japan. In contrast, earthquake frequency data were sourced from the comprehensive catalogues [12], as the regional limitation inherent in the periodicals results in a reduced number of data points.
3. Results
Figure 1A illustrates the regions examined in this study, with the relevant areas shaded in blue or aqua. Several of these regions encompass substantial oceanic zones. Figure 1B presents the number of earthquakes recorded in the catalogue. The lower 14 data points exhibit an approximately lognormal distribution (see Figure S1A). Since the 2011 Tohoku earthquake—and particularly from 2016 onwards—the number of recorded events has been markedly higher than during the preceding, quieter years. This increase may be partially attributable to advancements in earthquake detection technologies following the Tohoku event, including the implementation of GPS and submarine cable systems [15]. Recently, this increase appears to have stabilised, becoming a lognormal distribution with σ similar to that observed previously (Figure S1A, dotted line).
3.1. 2024 Noto Peninsula Earthquake
The 2024 Noto Peninsula earthquake registered a magnitude of 7.6 [11], approximately 1/125th the energy release of the M9.0 Tohoku earthquake [3,[3,4[]. Were the three precursory characteristics identified in the Tohoku eventalso present in this case?
Figure 2A displays the proportion of earthquakes occurring in the Noto region relative to the entire catalogue. This region constitutes roughly 0.5% of Japan’s total land area. If seismic events were uniformly distributed and detection sensitivity were consistent nationwide, one would expect a similar proportion of earthquakes. In practice, however, the number of events—excluding swarm activity—generally follows a lognormal distribution (see Figure S1C and S1D), with the mean significantly below 0.5% (Figure 2A). The solid black line in the figure represents values three standard deviations above the mean. A notable increase in earthquake proportion is observed several years prior to the mainshock. The P-value associated with the 3σ threshold is approximately 0.13%.
Additionally, a magnitude 6.9 earthquake occurred in the same region in 2007. In both instances, a seismic swarm was observed approximately six months prior to the mainshock (Figure 2A and 2B), indicating a shortening of earthquake intervals.
No frequent occurrence of large-magnitude earthquakes was detected immediately preceding the 2024 event (Figure 2B) [2]. The larger earthquakes were confined to the earlier swarm, and no anomalous seismic activity was observed directly before the mainshock. In fact, the swarm had subsided somewhat in the days leading up to the event—a trend even more pronounced in the 2007 case. The phenomenon of a particularly intense precursory swarm occurring immediately prior to the mainshock was not observed in any of the other earthquakes discussed below.
The shortening of earthquake intervals and increase in magnitude were difficult to detect when examining only the month preceding the event. Indeed, such records were scarcely available in the periodical reports [9]. However, when anomalies were identified during the swarm phase, the trends of decreasing intervals and increasing magnitudes became more evident (Figure 2CD, Figure 3AB). These precursors were also present prior to the 2007 Noto Peninsula earthquake (M6.9) (Figure 2A, Figure 3CD).
3.2. 2002 Northern Miyagi Earthquake (M6.4)
Several significant seismic events occurred around the same period, including the Miyagi-oki earthquake (M7.0) on 26 May 2003 and the Tokachi-oki earthquake (M8.0) in September 2003 [9]. However, no records of precursory swarms were identified for these offshore events, possibly due to limitations in measurement capabilities. In July 2003, the Northern Miyagi Earthquake (M6.4) occurred, but an increase in magnitude was only observed following the May Miyagi-oki event (M7.0) (Figure S2).
3.3. 2018 Eastern Iburi Earthquake (M6.7)
Documentation of the 2018 Eastern Iburi Earthquake (M6.7), which struck Hokkaido, was limited in the periodical reports [9]. This may be attributed to the sparse distribution of seismic intensity monitoring equipment in the region. The combined area of Ishikari, Iburi, and Urakawa comprises nearly 1% of Japan’s total landmass, yet seismic records from this region remain scarce. Analysis of the comprehensive catalogue data revealed a precursory swarm (Figure 4A), with magnitudes within the swarm exceeding that of the mainshock (Figure 4B).
Notably, the magnitude distribution in the catalogue does not conform to a normal distribution; instead, it exhibits a J-shaped curve. This suggests a potential underestimation of smaller earthquakes, likely due to detection limitations. Periodical data only include perceptible events, typically those with magnitudes greater than 2.
3.4. 2016 Kumamoto Earthquake (M6.5)
There are instances where the location (μ) of magnitude, the mean, of a precursory swarm was reduced. One such case is the Kumamoto earthquake of April 2016 [16,17]. Although considered a fault-driven event, the mainshock occurred on the flank of the active volcano Mount Aso (Figure 5A, blue), and subsequent aftershocks reached the crater, culminating in an eruption.
The proportion of seismic activity in this region increased, briefly exceeding the 3σ threshold (Figure 5B). However, both during the swarm phase (blue) and throughout the year (green), the magnitude μ and standard deviation σ remained consistently low (Figure 5C). This trend is particularly evident in the catalogue data. As in other volcanic regions, frequent low-magnitude earthquakes likely result from magma movement. Unlike Tokara [18], the epicentres observed in 2015 prior to the mainshock were dispersed across the entire prefecture (Figure 5A, red), suggesting the presence of multiple magma pathways.
By 2022, these low-σ, low-μ anomalies had dissipated, and the region’s seismic characteristics had returned to background levels (Figure 5D). This implies heightened volcanic activity during 2015 and 2016.
3.5. 2000 Miyake Island Eruption (M5.6)
A comparable example of a low-σ precursory swarm is the earthquake (M5.6) associated with the Miyakejima eruption in June 2000 [9]. In this case, a swarm occurred approximately one year prior (Figure S3A). Analysis of the catalogue data from this period reveals magnitudes higher than the overall average, yet with a low σ (Figure S3B, green). Throughout the year, magnitudes remained consistently elevated (blue), a pattern also confirmed in the periodical reports (Figure S3C).
It is likely that frequent earthquakes on Miyakejima serve to supply magma to the active volcano. These events appear to exhibit low σ but high μ. However, this anomaly had resolved by 2022 (Figure S3D), suggesting that the period of heightened seismic activity had concluded.
3.6. Volcanic Presence Does Not Necessarily Imply Lower σ Values
The presence of a volcano does not inherently result in a lower standard deviation (σ) of earthquake magnitudes. This was evident in Kumamoto in 2022 (Figure 5D) [16] and Miyakejima in 2000 (Figure S3D) [9]. Similarly, in Kagoshima Prefecture—home to the active volcano Sakurajima—the recorded magnitudes were nearly identical to the national background level (Figure S4A) [9]. Despite Sakurajima erupting in 2022, this suggests that volcanic activity in the region may not be strongly associated with seismic anomalies. Although Mount Fuji remains a concern due to the long interval since its last eruption, as of 2022, it appears to exert no discernible influence on σ values (Figure S4B) [19].
3.7. March 2022 Fukushima Offshore Earthquake (M7.3)
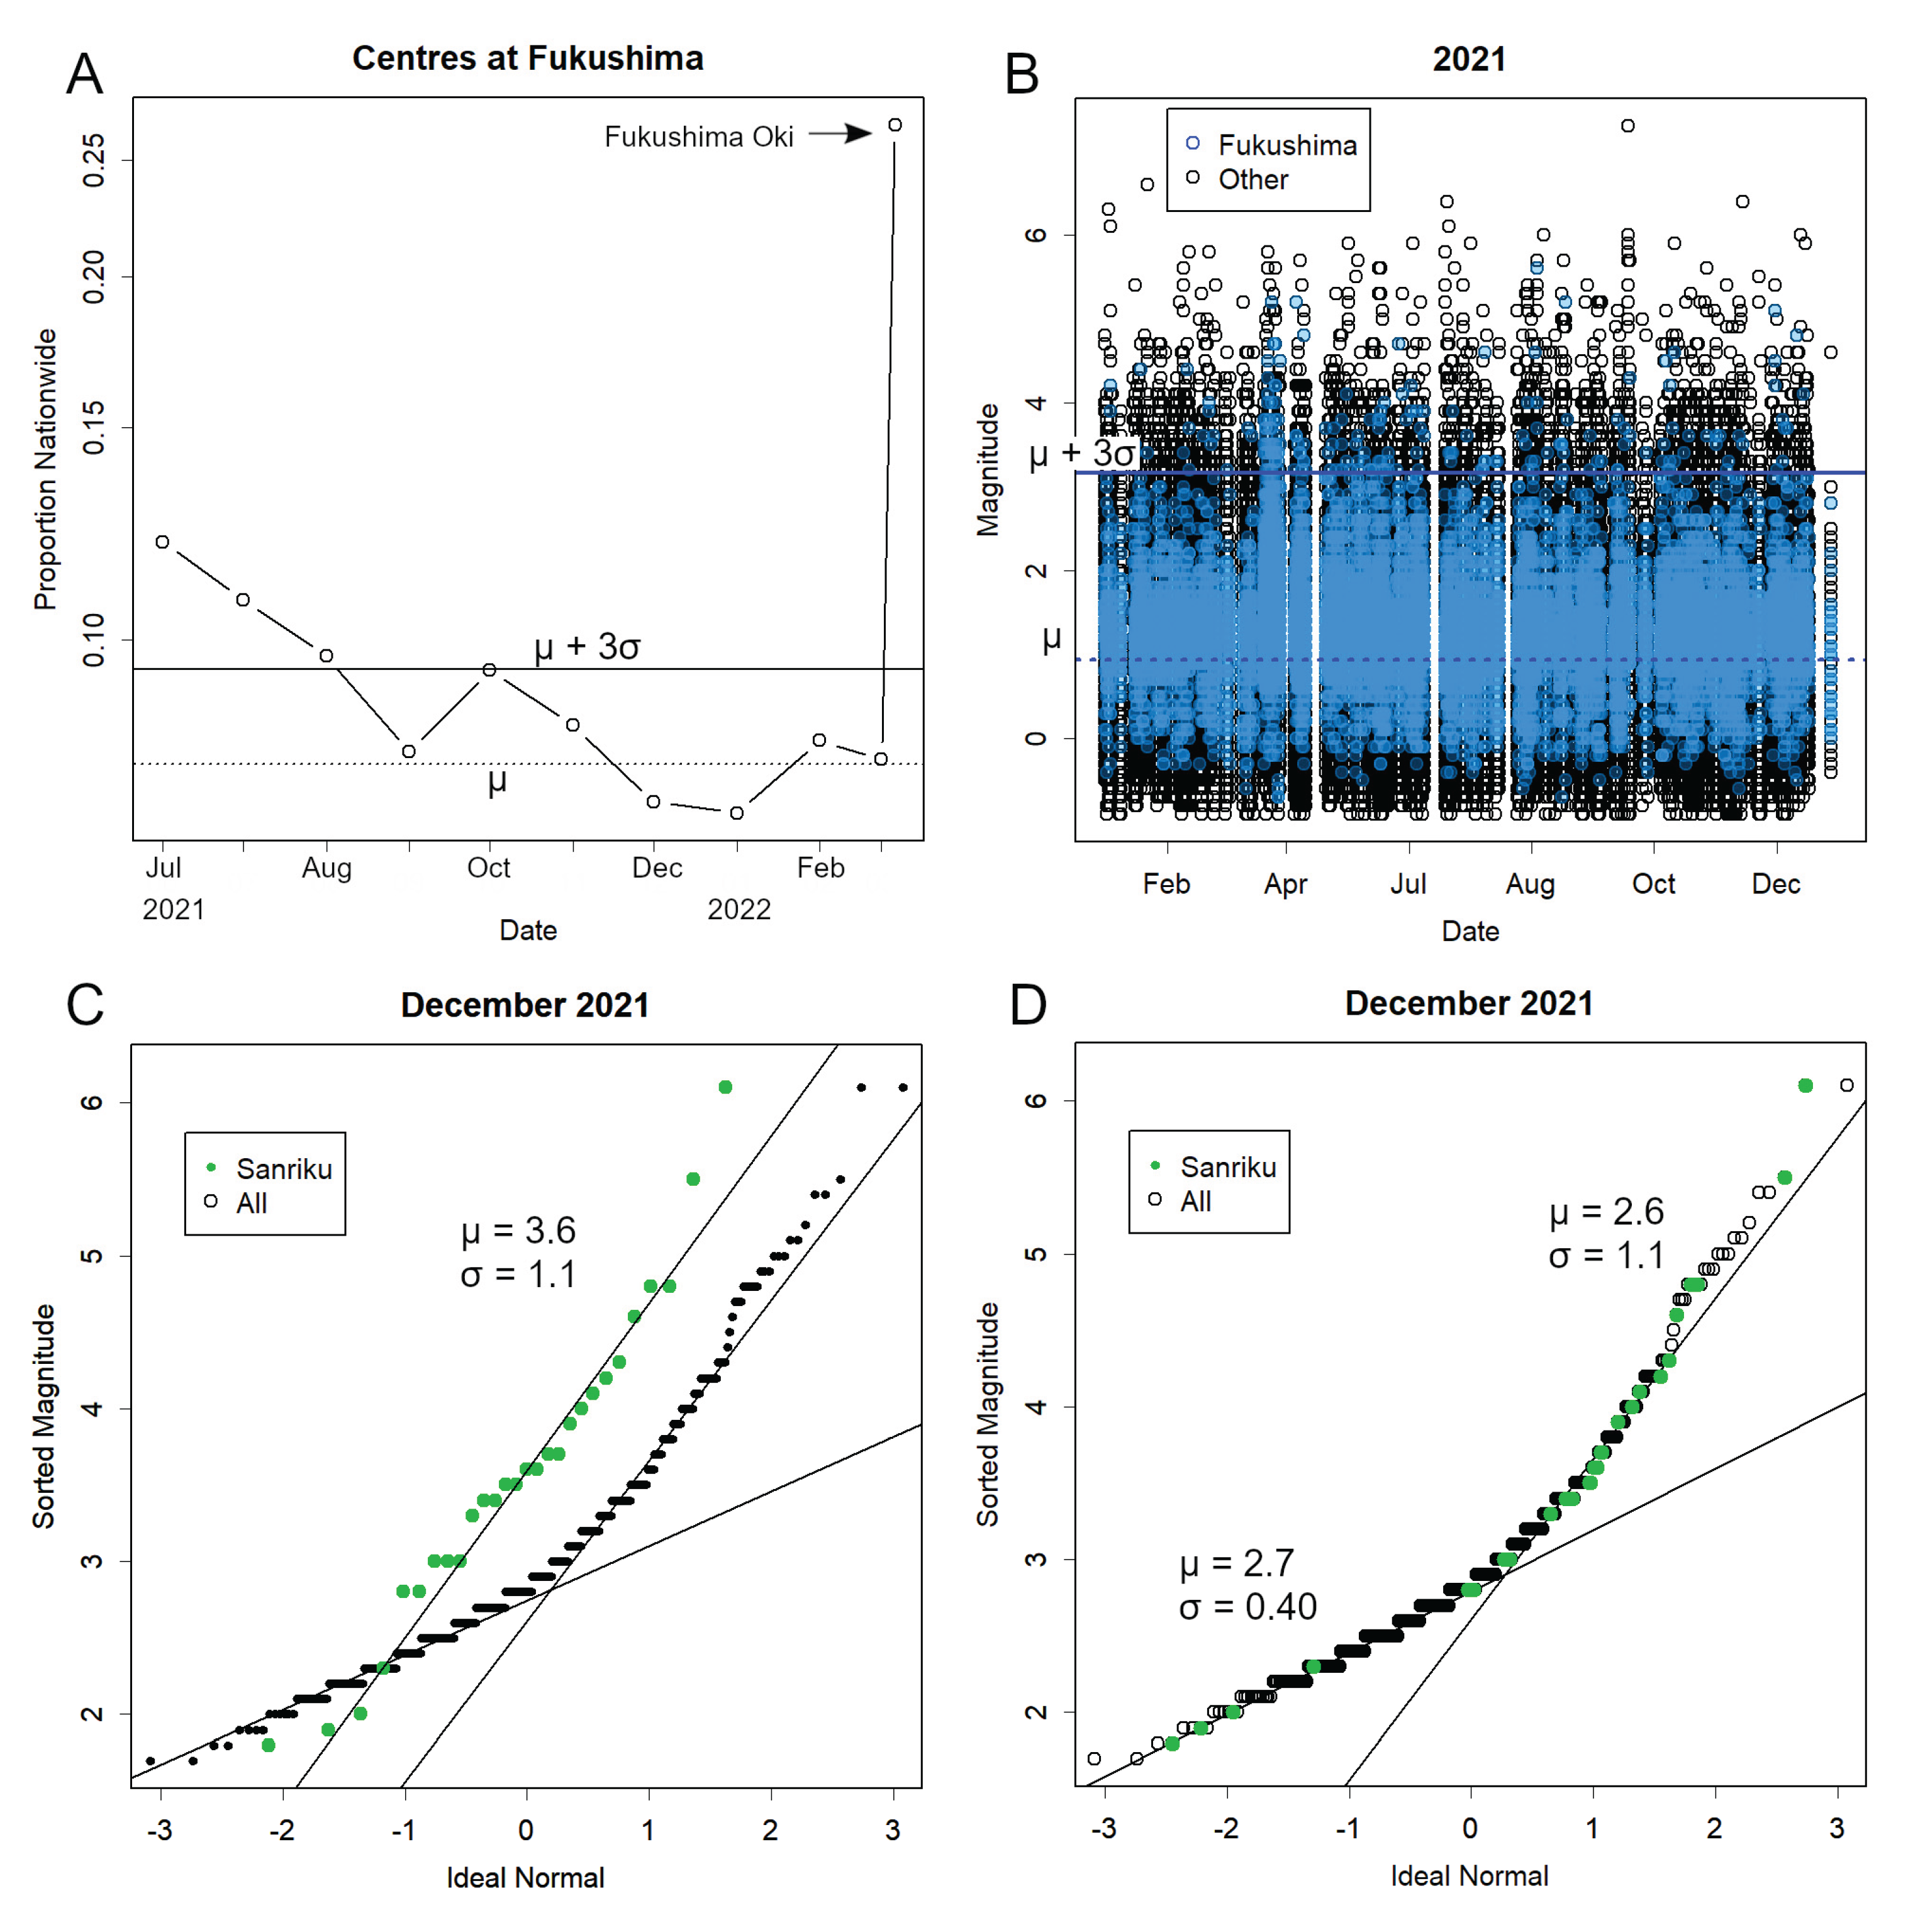
In this case, a precursory swarm was difficult to identify (Figure 6A). While its offshore location may have contributed to this, a more significant factor was likely the presence of aftershocks from three magnitude 6-class earthquakes that occurred between March and May 2021. Nevertheless, catalogue data indicated that throughout 2021, the average magnitude in this region was slightly elevated compared to other areas (Figure 6B). Although a nationwide increase in magnitude was observed in December 2021, aggregated data for the Sanriku coast—including Fukushima—showed that magnitudes remained above background levels during this period (Figure 6C). Further analysis revealed that a substantial portion of the December increase originated from this region (Figure 6D).
3.8. 2025 Tokara Islands Swarm Earthquakes
Swarm earthquakes have long been observed in the Tokara Islands [20]. In periodicals that record only perceptible events, earthquakes in this region exhibit lower mean magnitudes (μ) and smaller σ values compared to other regions (Figure S5A). However, catalogue data revealed the opposite trend, with μ values higher than the national average. This was true both in the frequently active zone between Akuseki and Takara Islands (Figure S5B) and in the intermittently active area near Suwanose Island (Figure S5C).
Due to this discrepancy, published reports showed higher magnitudes near Suwanose Island, whereas catalogue data indicated otherwise (Figure S5D). Typically, only a portion of the catalogue is published, and higher magnitudes tend to be concentrated in that subset, artificially inflating the μ value (compare panels A and B, or C and D, in black) [9]. This trend is also evident in the Tokara data, although the magnitude of the increase appears to be smaller [18].
3.9. Do Swarms Necessarily Precede Major Earthquakes?
In practice, regions with high detection rates—such as those shown in Figure 2A—do tend to exhibit seismic activity both before and after major events. For example, the region with the highest frequency in 2021 was Fukushima, which experienced a magnitude 7.3 offshore earthquake in March. Noto ranked third, followed by Miyagi, each of which has experienced significant seismic events in recent years [9].
However, in 2018—the year of the Eastern Iburi Earthquake—Ishikari and Iburi ranked only 19th in terms of seismic frequency. The top regions by proportion were Ibaraki, Oshima, Shiga, and Kumamoto. Although these areas recorded high frequencies of seismic events, their magnitudes did not deviate significantly from background levels (Figure S6A–C). The anomaly in Kumamoto (Figure S6D), which showed a low μ in 2018 likely due to the 2016 earthquake, gradually diminished and had disappeared by 2022 (Figure 5D).
In 2022, regions such as Fukushima, the Sanriku coast, and Noto exhibited relatively high values due to large aftershocks, but no anomalies were detected (Figure S7A). The anomalies observed in previous years (Figure 6) appear to have resolved. Subsequent regions included Wakayama and the Hyuga-nada area, yet no anomalies were found there either (Figure S7B–C). Furthermore, the 2022 data for the Iburi region aligned with background levels (Figure S7D), clearly contrasting with the elevated values seen in 2018 (Figure 4B). Although data for Iburi remain limited, the evidence suggests that large earthquakes are not selectively recorded. Moreover, no significant seismic events have occurred in these regions since.
4. Discussion
This study demonstrates that even for earthquakes with magnitudes approximately one-hundredth that of the 2011 Tohoku earthquake—or smaller—identifying a precursory swarm and examining the associated magnitude distribution may offer insights into the likelihood of a forthcoming mainshock (Figure 2, Figure 3 and Figure 4). However, no precursory swarm of the exceptionally large magnitude observed immediately prior to the Tohoku event was detected in these cases (Figure 2B). Consequently, it remains challenging to pinpoint the precise timing of a mainshock, particularly given that a significant temporal gap—often up to six months—can exist between the swarm and the main event.
In several offshore seismic events, no precursory swarms were observed. This may be attributed to limitations in detection capabilities, as seismic instrumentation is not deployed in a uniform mesh across the region. Data acquisition is especially constrained over open ocean areas and in sparsely populated regions. In such cases, catalogue data may provide more comprehensive insights than periodical reports (Figure 4). Moreover, even when a swarm was not clearly evident, analysis of magnitude distributions occasionally revealed anomalies (Figure 6).
Certain regions and time periods exhibited unusual magnitude distributions characterised by low standard deviation (σ), often accompanied by a lower mean magnitude (μ). These patterns were predominantly observed in volcanic regions such as Tokara (Figure S5) [18,20], Mount Aso (Figure 5), and Miyakejima (Figure S3) [9]. These events are likely attributable to magma-induced seismicity. As such earthquakes tend to occur under relatively stable conditions, their frequency is high and their σ values correspondingly low. In these volcanic zones, seismic activity appears to follow different statistical parameters compared to tectonic regions. Precursory swarms may not manifest in such contexts, possibly due to differing underlying mechanisms or their association with eruptive processes.
Although the 2016 Kumamoto earthquakes are generally considered to be fault-driven [17], the mainshock occurred on the flank of Mount Aso, and the subsequent aftershocks extended toward the crater, culminating in an eruption. This raises the question of whether the seismicity in this case should be re-evaluated in light of potential volcanic influences. Notably, the associated anomaly dissipated over the following years (Figure 5D, Figure S3D).
It is important to note that such low-σ phenomena do not occur uniformly across all volcanic regions. For instance, although Sakurajima in Kagoshima Prefecture erupted in 2022, no corresponding decrease in σ was observed (Figure S4A). This may reflect the structural characteristics of Sakurajima, where magma movement is less likely to induce seismic activity. Indeed, the number of detected earthquakes in this region was relatively low—only about one-seventh of that recorded in the similarly sized Kumamoto region in 2022 [9].
Conversely, swarm activity has persisted in the Tokara Islands (Figure S5) [18,20]. While both σ and μ remain low, the possibility of significant earthquakes occurring without clear precursors in volcanic regions suggests that such areas may not be inherently safe. The ongoing evolution of seismic and volcanic activity in Tokara warrants close observation. Interestingly, the magnitude distributions in this region showed minimal discrepancy between periodicals and catalogue data, a pattern not commonly observed elsewhere. Typically, periodicals report only larger events, whereas catalogues include a broader range. If the catalogue data are accurate, the relatively higher magnitudes observed in Tokara may indicate a greater seismic hazard than previously assumed. This challenges earlier conclusions that the region was safe based solely on periodical records [18].
The detection of swarm activity is relatively straightforward and appears to be a valuable tool. Regions exhibiting elevated seismic frequency are likely experiencing increased tectonic or volcanic stress. However, assessing the magnitude distribution at such locations is essential for evaluating the associated risk. If the observed magnitudes align with background levels, the likelihood of a major event is low. For instance, in regions with frequent activity in 2018 and 2022, no significant earthquakes followed (Figure S6, S7).
Nevertheless, caution is warranted. As demonstrated by the 2016 Kumamoto case, both μ and σ can decrease, potentially signalling heightened volcanic activity (Figures 5, S3, S5). Such conditions may necessitate a different form of risk assessment and preparedness, distinct from that applied to tectonic swarm events.
The approach employed here relies on relatively simple measurements, which has the advantage of being broadly applicable. This stands in contrast to approaches that draw on diverse measurement materials and attempt to identify singular points in time that appear to coincide with major earthquakes [5,6,7,8]. While such approaches may hold promise, it remains challenging to determine in advance the precise location of a forthcoming event. In addition, given the frequent occurrence of large earthquakes in Japan, it is not straightforward to assess whether such singular points are directly related to the underlying causes of a particular earthquake. The coexistence of multiple predictive perspectives is, of course, to be regarded as valuable. In particular, as suggested in the present analysis, earthquakes of magnitude 6–7 did not appear to exhibit the pronounced, immediate precursor swarms that preceded the Tohoku disaster. Thus, the timing of the main shock remains uncertain. Should another method be able to provide further insight into this aspect, it would represent a useful complement.
5. Conclusions
Through the analysis of comprehensive seismic data, it is possible to determine the proportion of earthquake detections within a given region. As this proportion typically follows a lognormal distribution, evaluating its statistical parameters over time enables the identification of deviations from expected values. An increase in this proportion, coupled with anomalous magnitude characteristics relative to background levels, may indicate an elevated seismic hazard. Such assessments necessitate continuous monitoring, and further research is required to establish precise threshold values—both high and low—that reliably signal impending danger. While clear precursors were evident prior to the 2011 Tohoku earthquake, such as a precursory swarm with a z-score exceeding 10, similarly distinct indicators are unlikely to precede magnitude 7-class events. As a result, individuals receiving warnings must maintain a heightened state of preparedness over extended periods. This underscores the importance of sustained public education and awareness initiatives to ensure that communities remain vigilant and capable of responding effectively to seismic risks.
Supplementary Materials
The following supporting information can be downloaded at: Preprints.org, Figure S1. Distribution of seismic data; Figure S2. The 2003 Miyagi-oki and Northern Miyagi Earthquakes; Figure S3. Pre-eruption seismic state associated with the 2000 Miyakejima eruption; Figure S4. Magnitude distributions in volcanic regions; Figure S5. Precursory activity preceding the March 2022 Fukushima offshore earthquake (M7.4); Figure S6. Seismic activity in the Tokara Islands; Figure S7. Magnitude distributions in regions with high earthquake proportions in 2018.
Funding
This research received no external funding.
Data Availability Statement
Conflicts of Interest
The authors declare no conflicts of interest.
Abbreviations
| JMA | Japan Meteorological Agency |
References
- JMA. About earthquake prediction. 2024. Available online: https://www.jma.go.jp/jma/kishou/know/faq/faq24.html (accessed on 4 November 2025).
- Konishi, T. Seismic pattern changes before the 2011 Tohoku earthquake revealed by exploratory data analysis. Interpretation 2025, T725–T735. [Google Scholar] [CrossRef]
- Cabinet Office, Japan. Special Feature: The Great East Japan Earthquake (Japanese). Available online: https://www.bousai.go.jp/kohou/kouhoubousai/h23/63/special_01.html (accessed on 4 November 2025).
- JMA. Great East Japan Earthquake. Available online: https://www.jma.go.jp/jma/menu/jishin-portal.html (accessed on 4 November 2025).
- Tanaka, H. , Varotsos, P.A., Skordas E.S., A plausible universal behaviour of earthquakes in the natural time-domain. Proceedings of the Japan Academy, Series B 2004, 80, 283–289. [Google Scholar] [CrossRef]
- Varotsos, P.A.; Sarlis, N.V.; Skordas, E.S.; Lazaridou-Varotsos, M.S. MW9 Tohoku earthquake in 2011 in Japan: precursors uncovered by natural time analysis. Earthquake Science 2017, 30, 183–191. [Google Scholar] [CrossRef]
- Varotsos PA, Skordas ES, Sarlis NV, Christopoulos S-RG. Review of the Natural Time Analysis Method and Its Applications. Mathematics, 2024; 12, 3582. [CrossRef]
- Nagao, T.; Orihara, Y.; Kamogawa, M. Precursory Phenomena Possibly Related to the 2011 M 9.0 Off the Pacific Coast of Tohoku Earthquake. Journal of Disaster Research 2014, 9, 303–310. [Google Scholar] [CrossRef]
- JMA. Summary of earthquake activity for each month. Available online: https://www.data.jma.go.jp/eqev/data/gaikyo/ (accessed on 4 November 2025).
- JMA. Types of information related to the Nankai Trough earthquake and conditions for its release. Available online: https://www.data.jma.go.jp/eqev/data/nteq/info_criterion.html (accessed on 4 November 2025).
- JMA. Related information on the 2024 Noto Peninsula Earthquake. 2024. Available online: https://www.jma.go.jp/jma/menu/20240101_noto_jishin.html (accessed on 4 November 2025).
- JMA. Earthquake Monthly Report (Catalog Edition). Available online: https://www.data.jma.go.jp/eqev/data/bulletin/hypo.html (accessed on 4 November 2025).
- JMA. List of epicenter location. Available online: https://www.data.jma.go.jp/eqev/data/daily_map/index.html (accessed on 4 November 2025).
- R Core Team. R: A language and environment for statistical computing; R Foundation for Statistical Computing: Vienna, 2025; Available online: https://cran.r-project.org (accessed on 4 November 2025).
- The Headquarters for Earthquake Research Promotion. Promoting new earthquake research. Available online: https://www.jishin.go.jp/main/suihon/honbu09b/suishin090421.pdf (accessed on. 4 November.
- JMA. The 2016 Kumamoto Earthquake. Available online: https://www.data.jma.go.jp/eqev/data/2016_04_14_kumamoto/index.html (accessed on 4 November 2025).
- JMA. 2016 Kumamoto Earthquake Investigation Report. Available online: https://www.jma.go.jp/jma/kishou/books/gizyutu/135/gizyutu_135.html (accessed on 4 November 2025).
- Konishi, T. Earthquake Swarm Activity in the Tokara Islands (2025): Statistical Analysis Indicates Low Probability of Major Seismic Event. GeoHazards 2025, 6, 52. [Google Scholar] [CrossRef]
- JMA. Fujisan. Available online: https://www.data.jma.go.jp/vois/data/tokyo/314_Fujisan/314_index.html (accessed on 11/4).
- JMA. Assessment of seismic activity off the coast of the Tokara Islands. Available online: https://www.static.jishin.go.jp/resource/monthly/2025/20250703_tokara_2.pdf (accessed on 4 November 2025).
Figure 1.
Seismic context in Japan. A. Regions analysed in this study are shaded in blue, extending from Ishikari in the north to Kumamoto in the south. These include both inland and substantial oceanic zones. The Pacific coastal prefectures—Miyagi, Fukushima, Iwate, and Aomori—are collectively referred to as the Sanriku region. B. Number of earthquakes recorded in the 2000–2003 catalogue. The dotted line represents the mean (μ) estimated from the lowest 14 data points, while the solid line indicates values 3σ above this mean, which was estimated from the logarithms of the data. These parameters may not be applicable to data from 2016 onwards due to advancements in seismic measurement technologies (Figure S1A) [15].
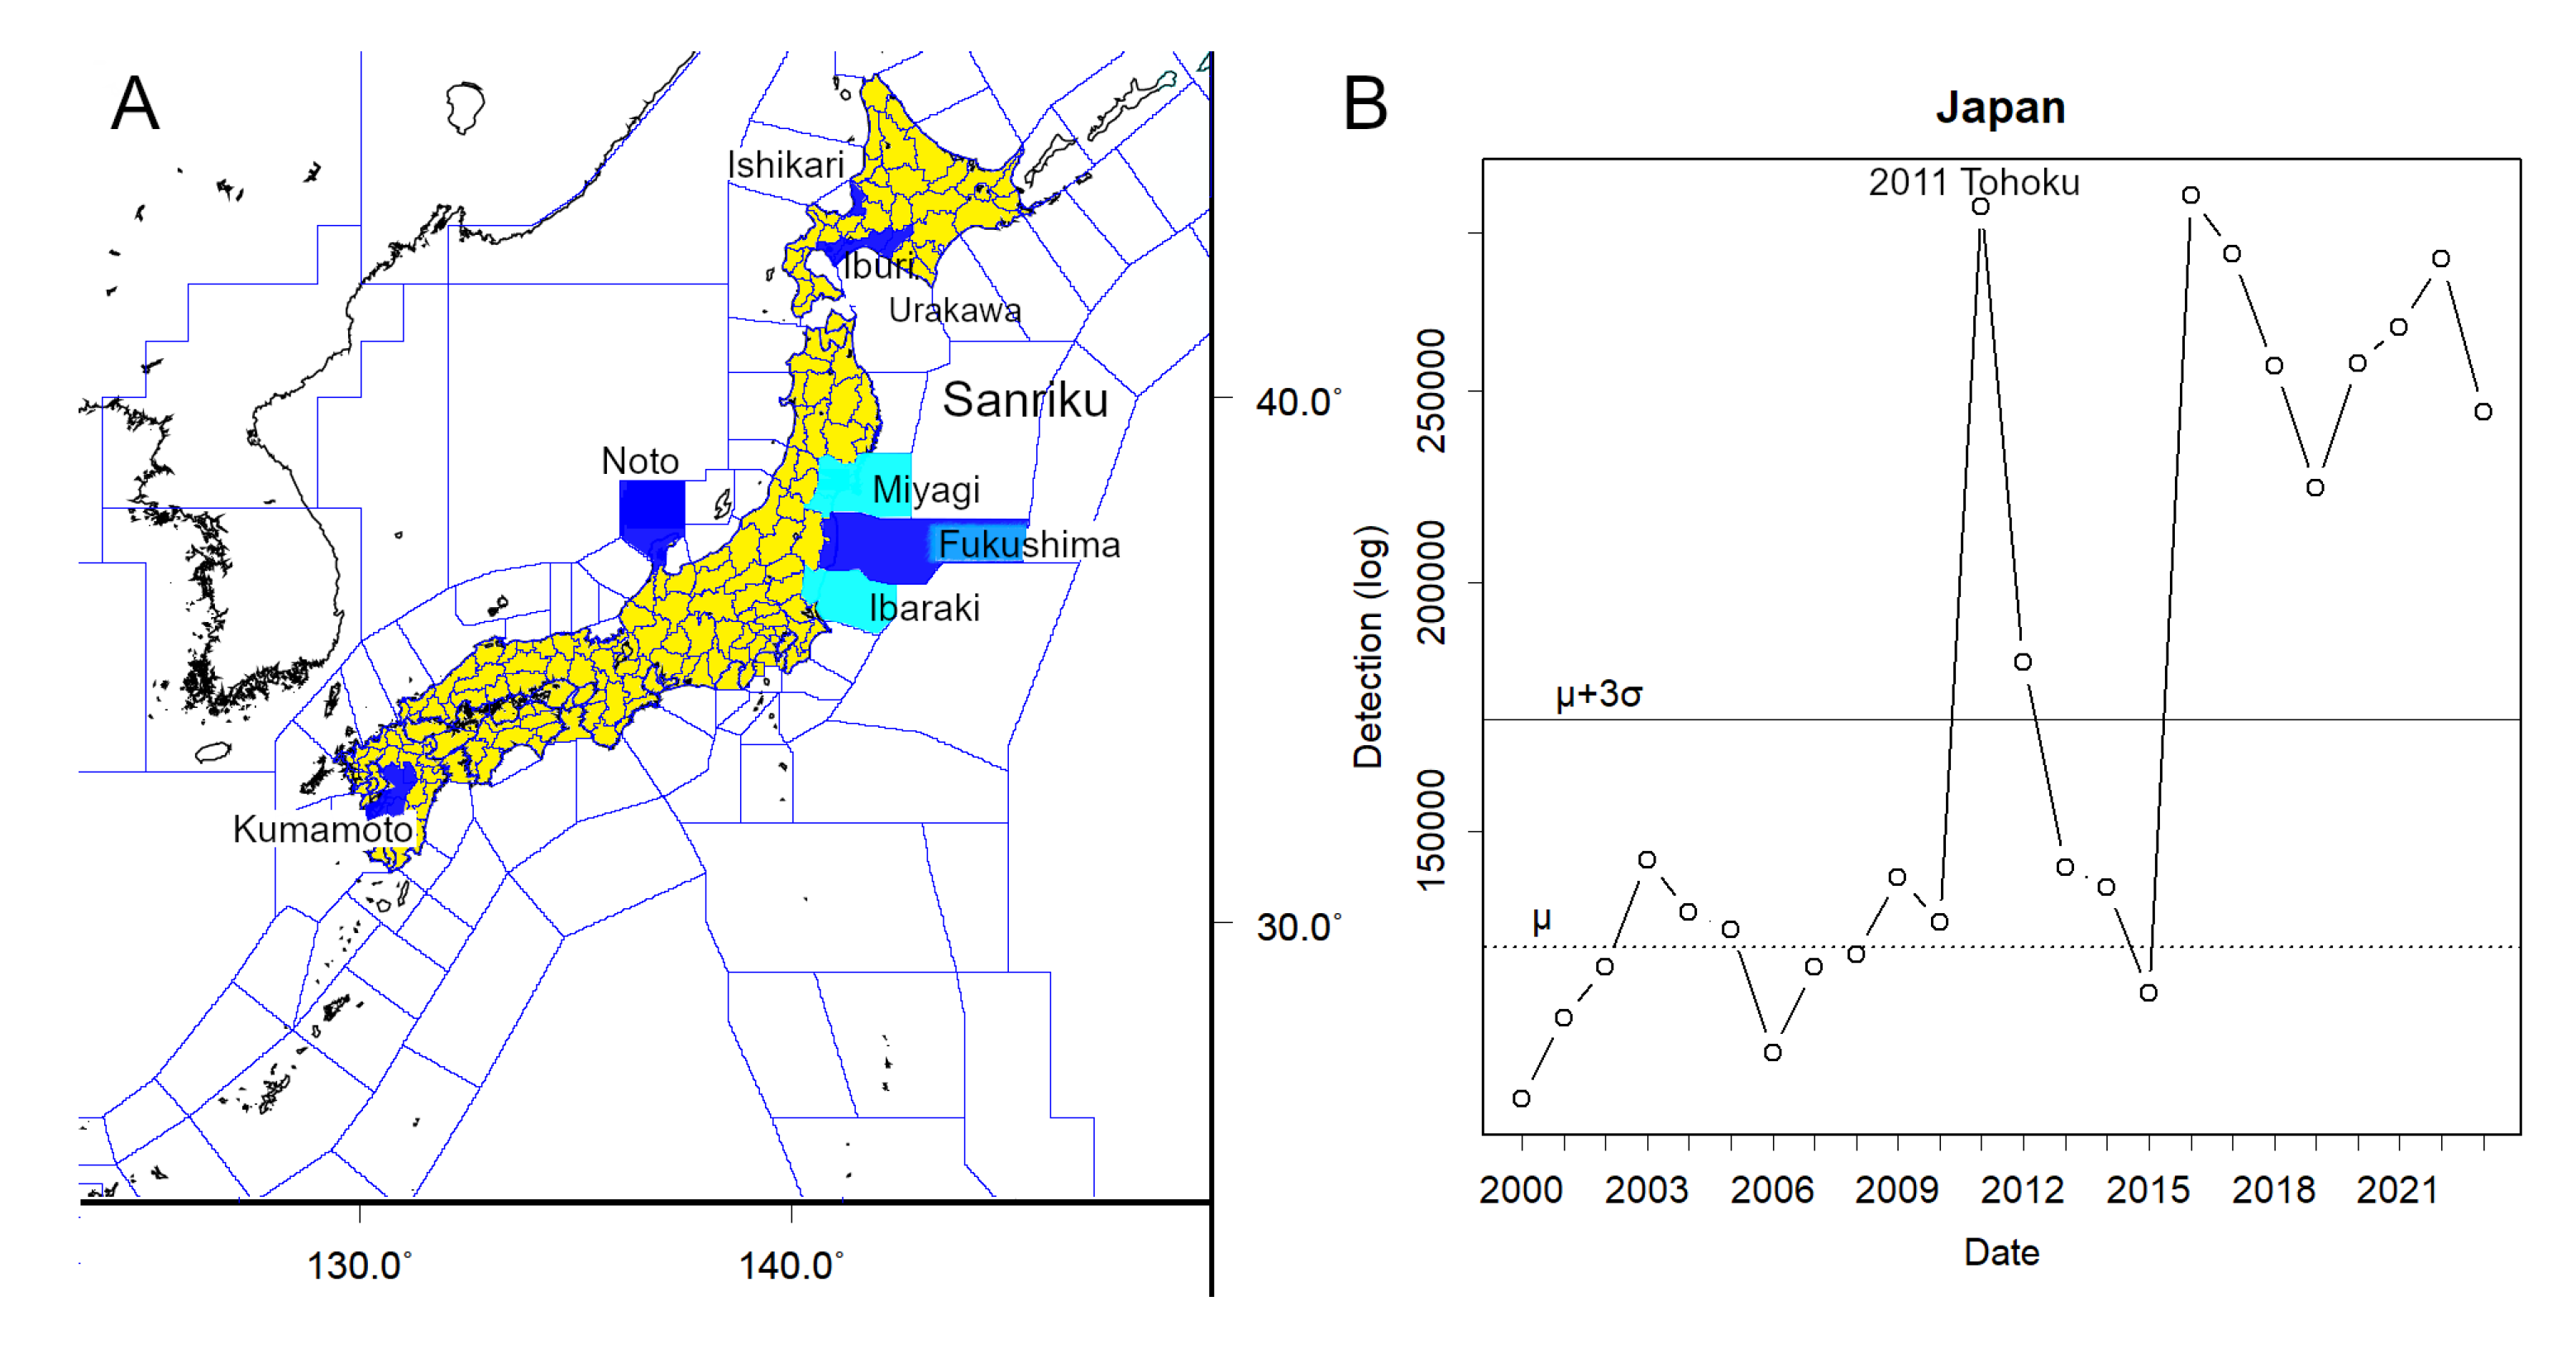
Figure 2.
Earthquake activity in the Noto Peninsula. A. Monthly log-ratio of earthquakes in Noto relative to the national total, based on catalogue data since 2000. This proportion increases following major events due to aftershocks, but also rises in advance when a precursory swarm occurs—approximately six months prior in both 2007 and 2024. B. Magnitude trends in Noto (blue). No increase in magnitude was observed immediately prior to the mainshock. C. Magnitude distribution in May, when the swarm occurred. Anomalies were evident, largely attributable to the Noto earthquake [11]. A similar graph could not be produced for the preceding December due to limited entries in periodical records [9]. D. Magnitude distribution in May from the comprehensive catalogue, showing elevated values compared to other regions [13].
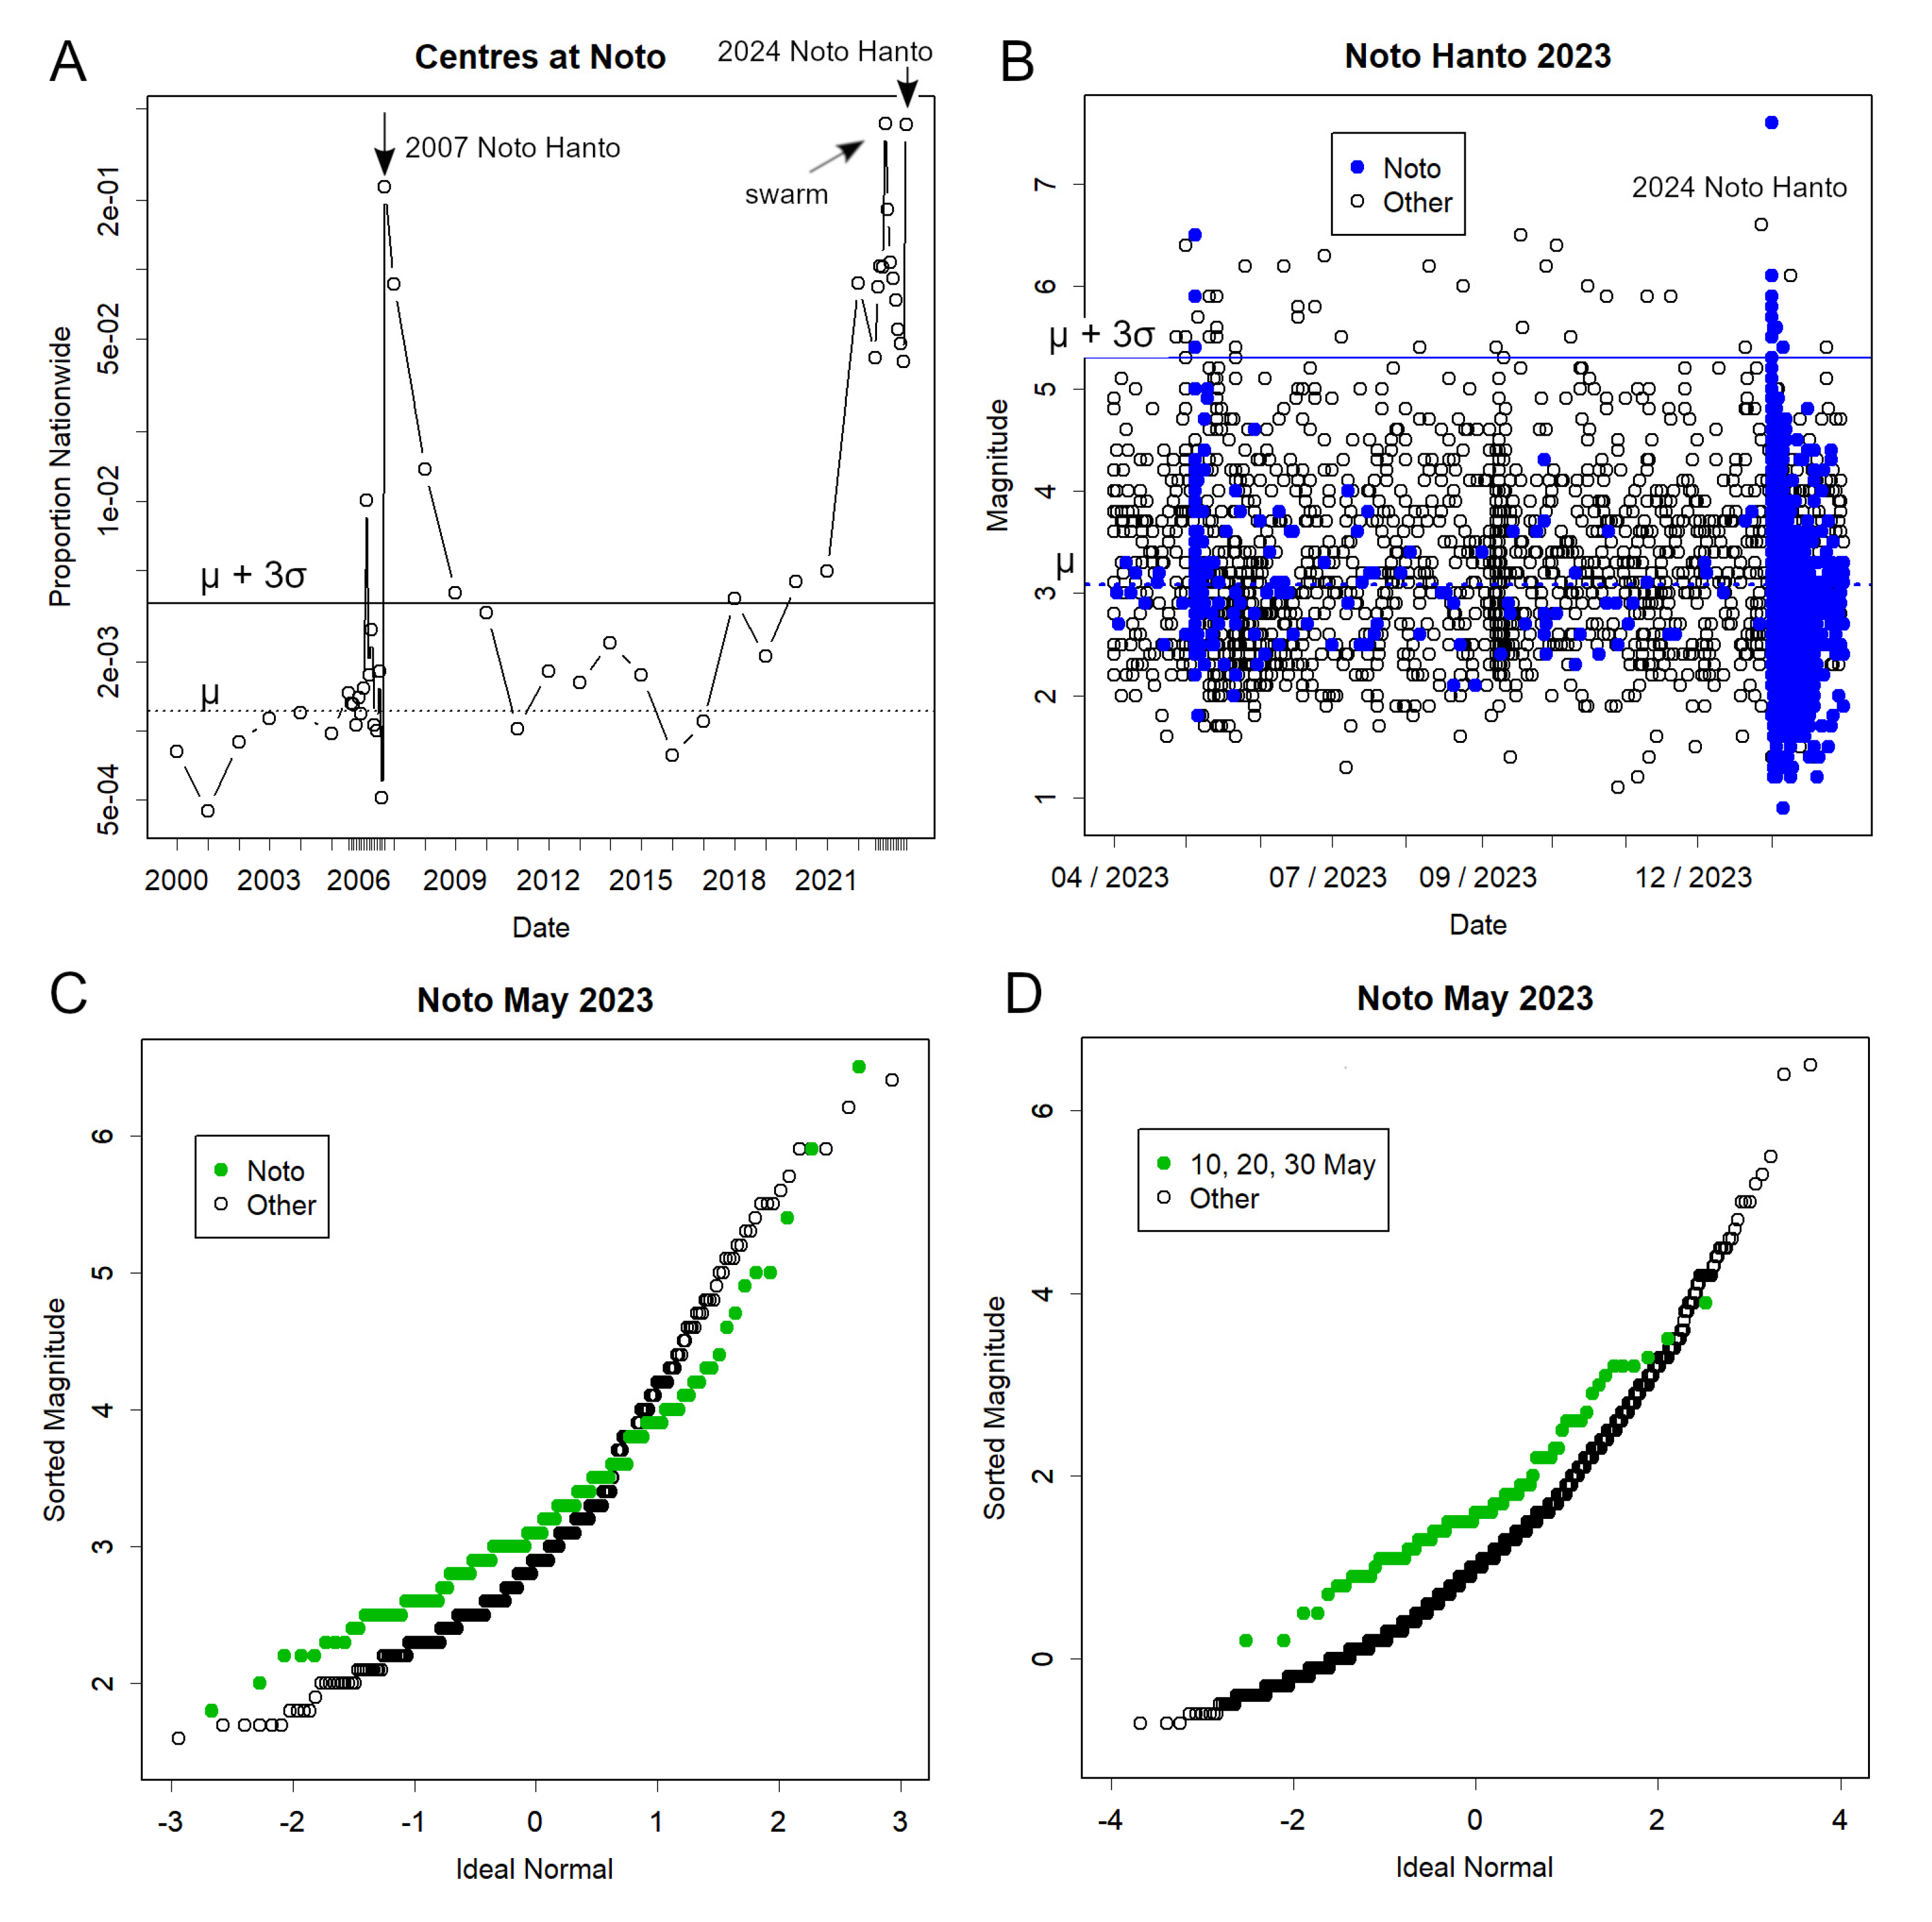
Figure 3.
Nationwide seismic data during Noto Peninsula swarm activity. A, B. Data from 2023; C, D. data from 2007. A, C. Earthquake intervals. Curvature in the plots indicates swarm activity. B, D. Magnitude distributions. Curved lines suggest increased standard deviation, deviating from expected linearity. All data sourced from periodicals.
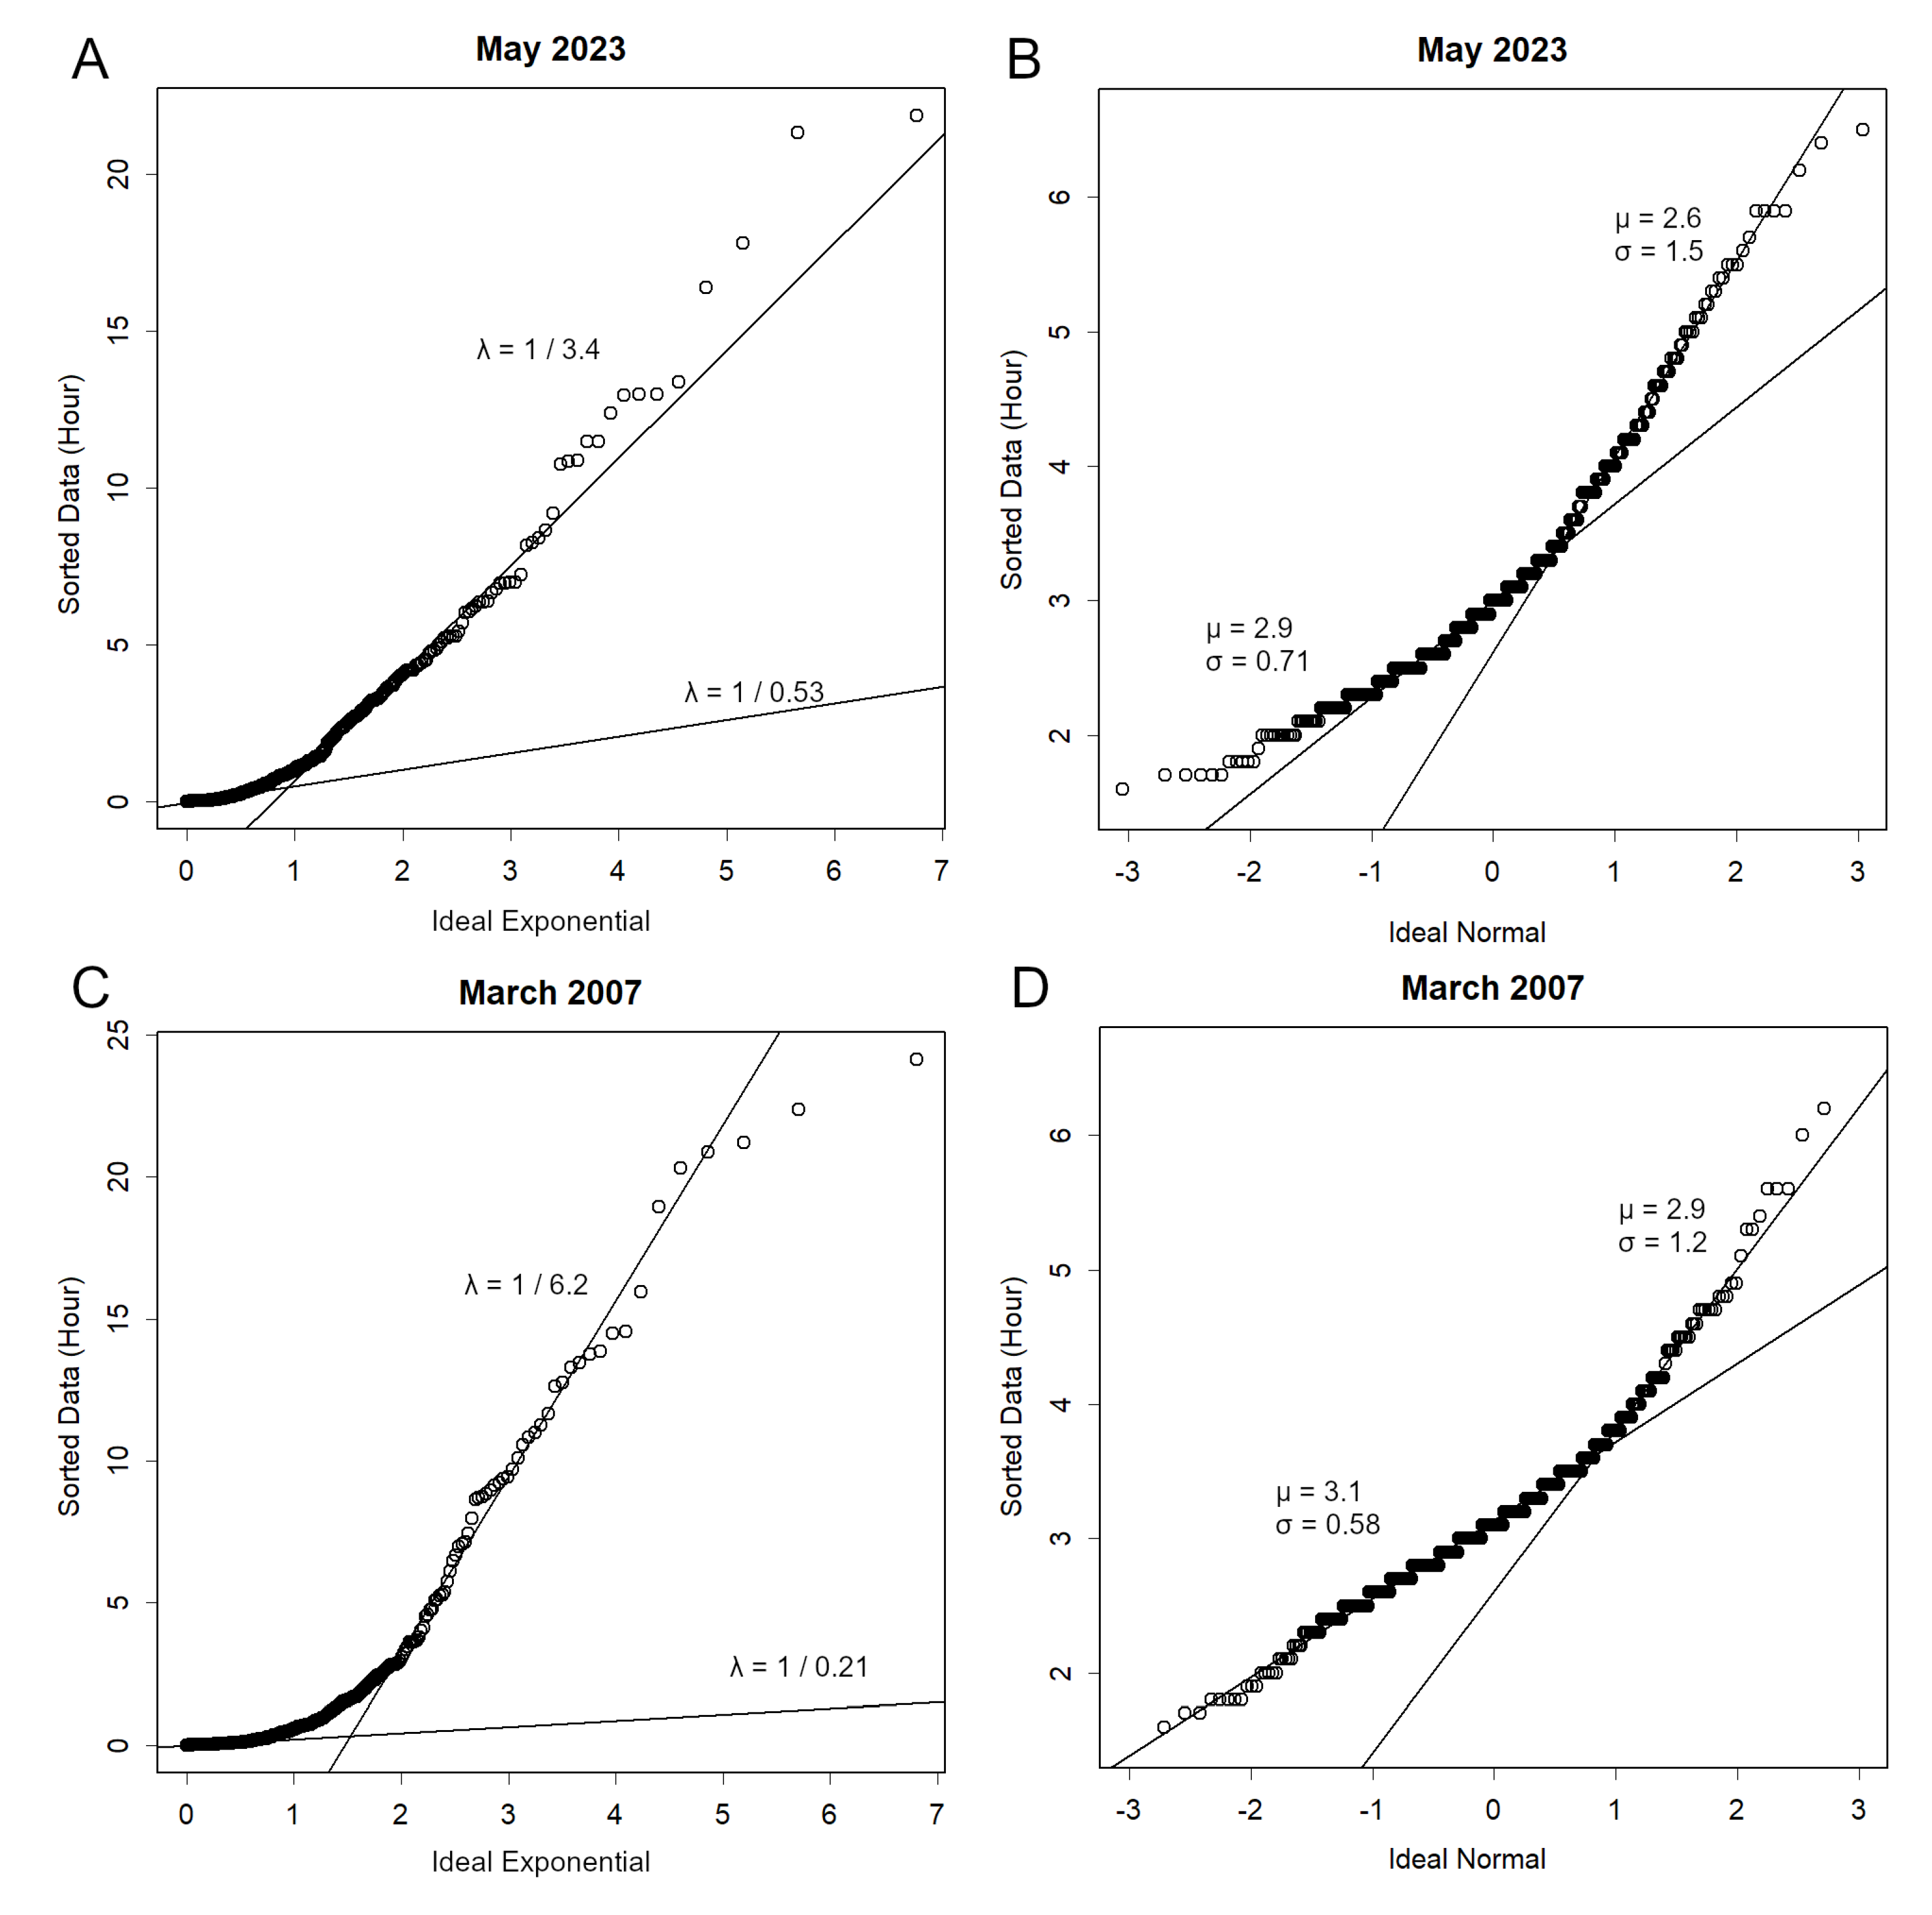
Figure 4.
Precursory swarm preceding the 2018 Eastern Iburi Earthquake. A. A swarm was detected two months prior to the mainshock. Due to limited detector coverage in Iburi, data were supplemented with records from Ishikari. B. Magnitude distributions in the region, with offshore Urakawa data included (green). Nationwide data shown in black. Overlaid QQ plots reveal consistently higher magnitudes in Iburi at equivalent quantiles.
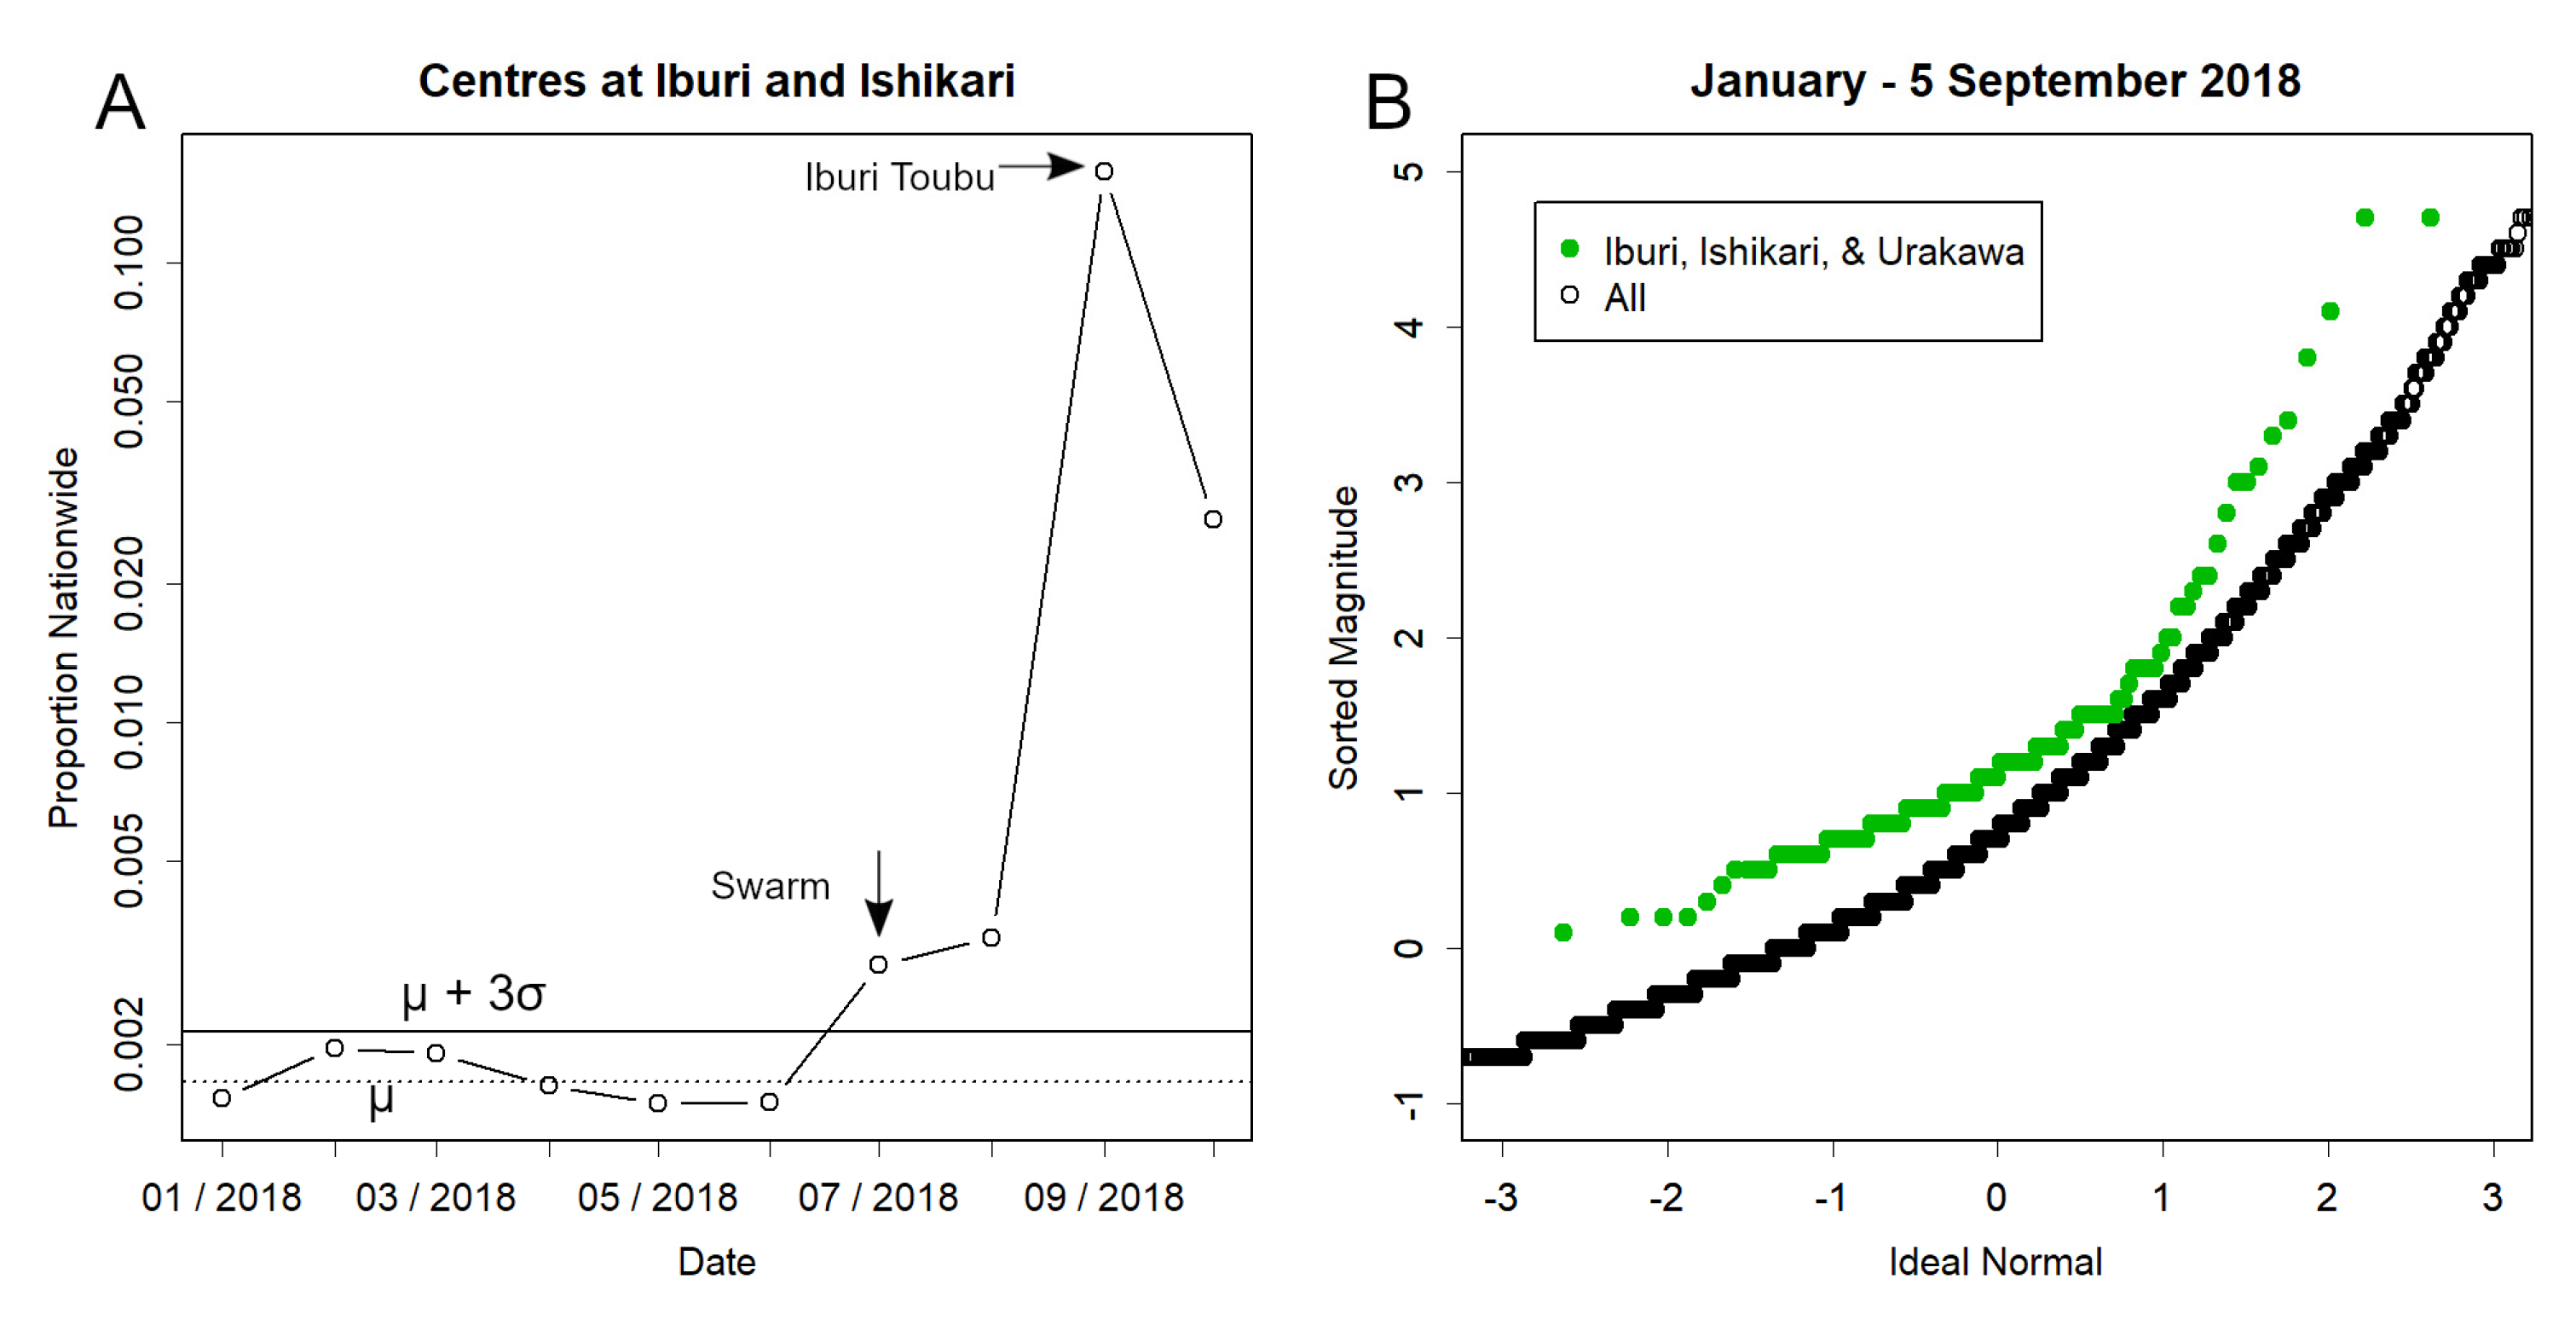
Figure 5.
Seismic activity in Kumamoto Prefecture and Mount Aso. A. Epicentres prior to the 2015 mainshock (red) were widely dispersed across the prefecture. Aftershocks (blue) within 500 events of the mainshock were concentrated at the foot of Mount Aso and later spread across the volcano. B. Earthquake counts surged during the mainshock and aftershock sequence. Only one instance exceeded 3σ, indicating swarm conditions. C. Magnitude analysis during this period revealed lower μ and σ values than the national average, suggesting an anomaly unrelated to the swarm. Catalogue data used. D. By 2022, the swarm had subsided.
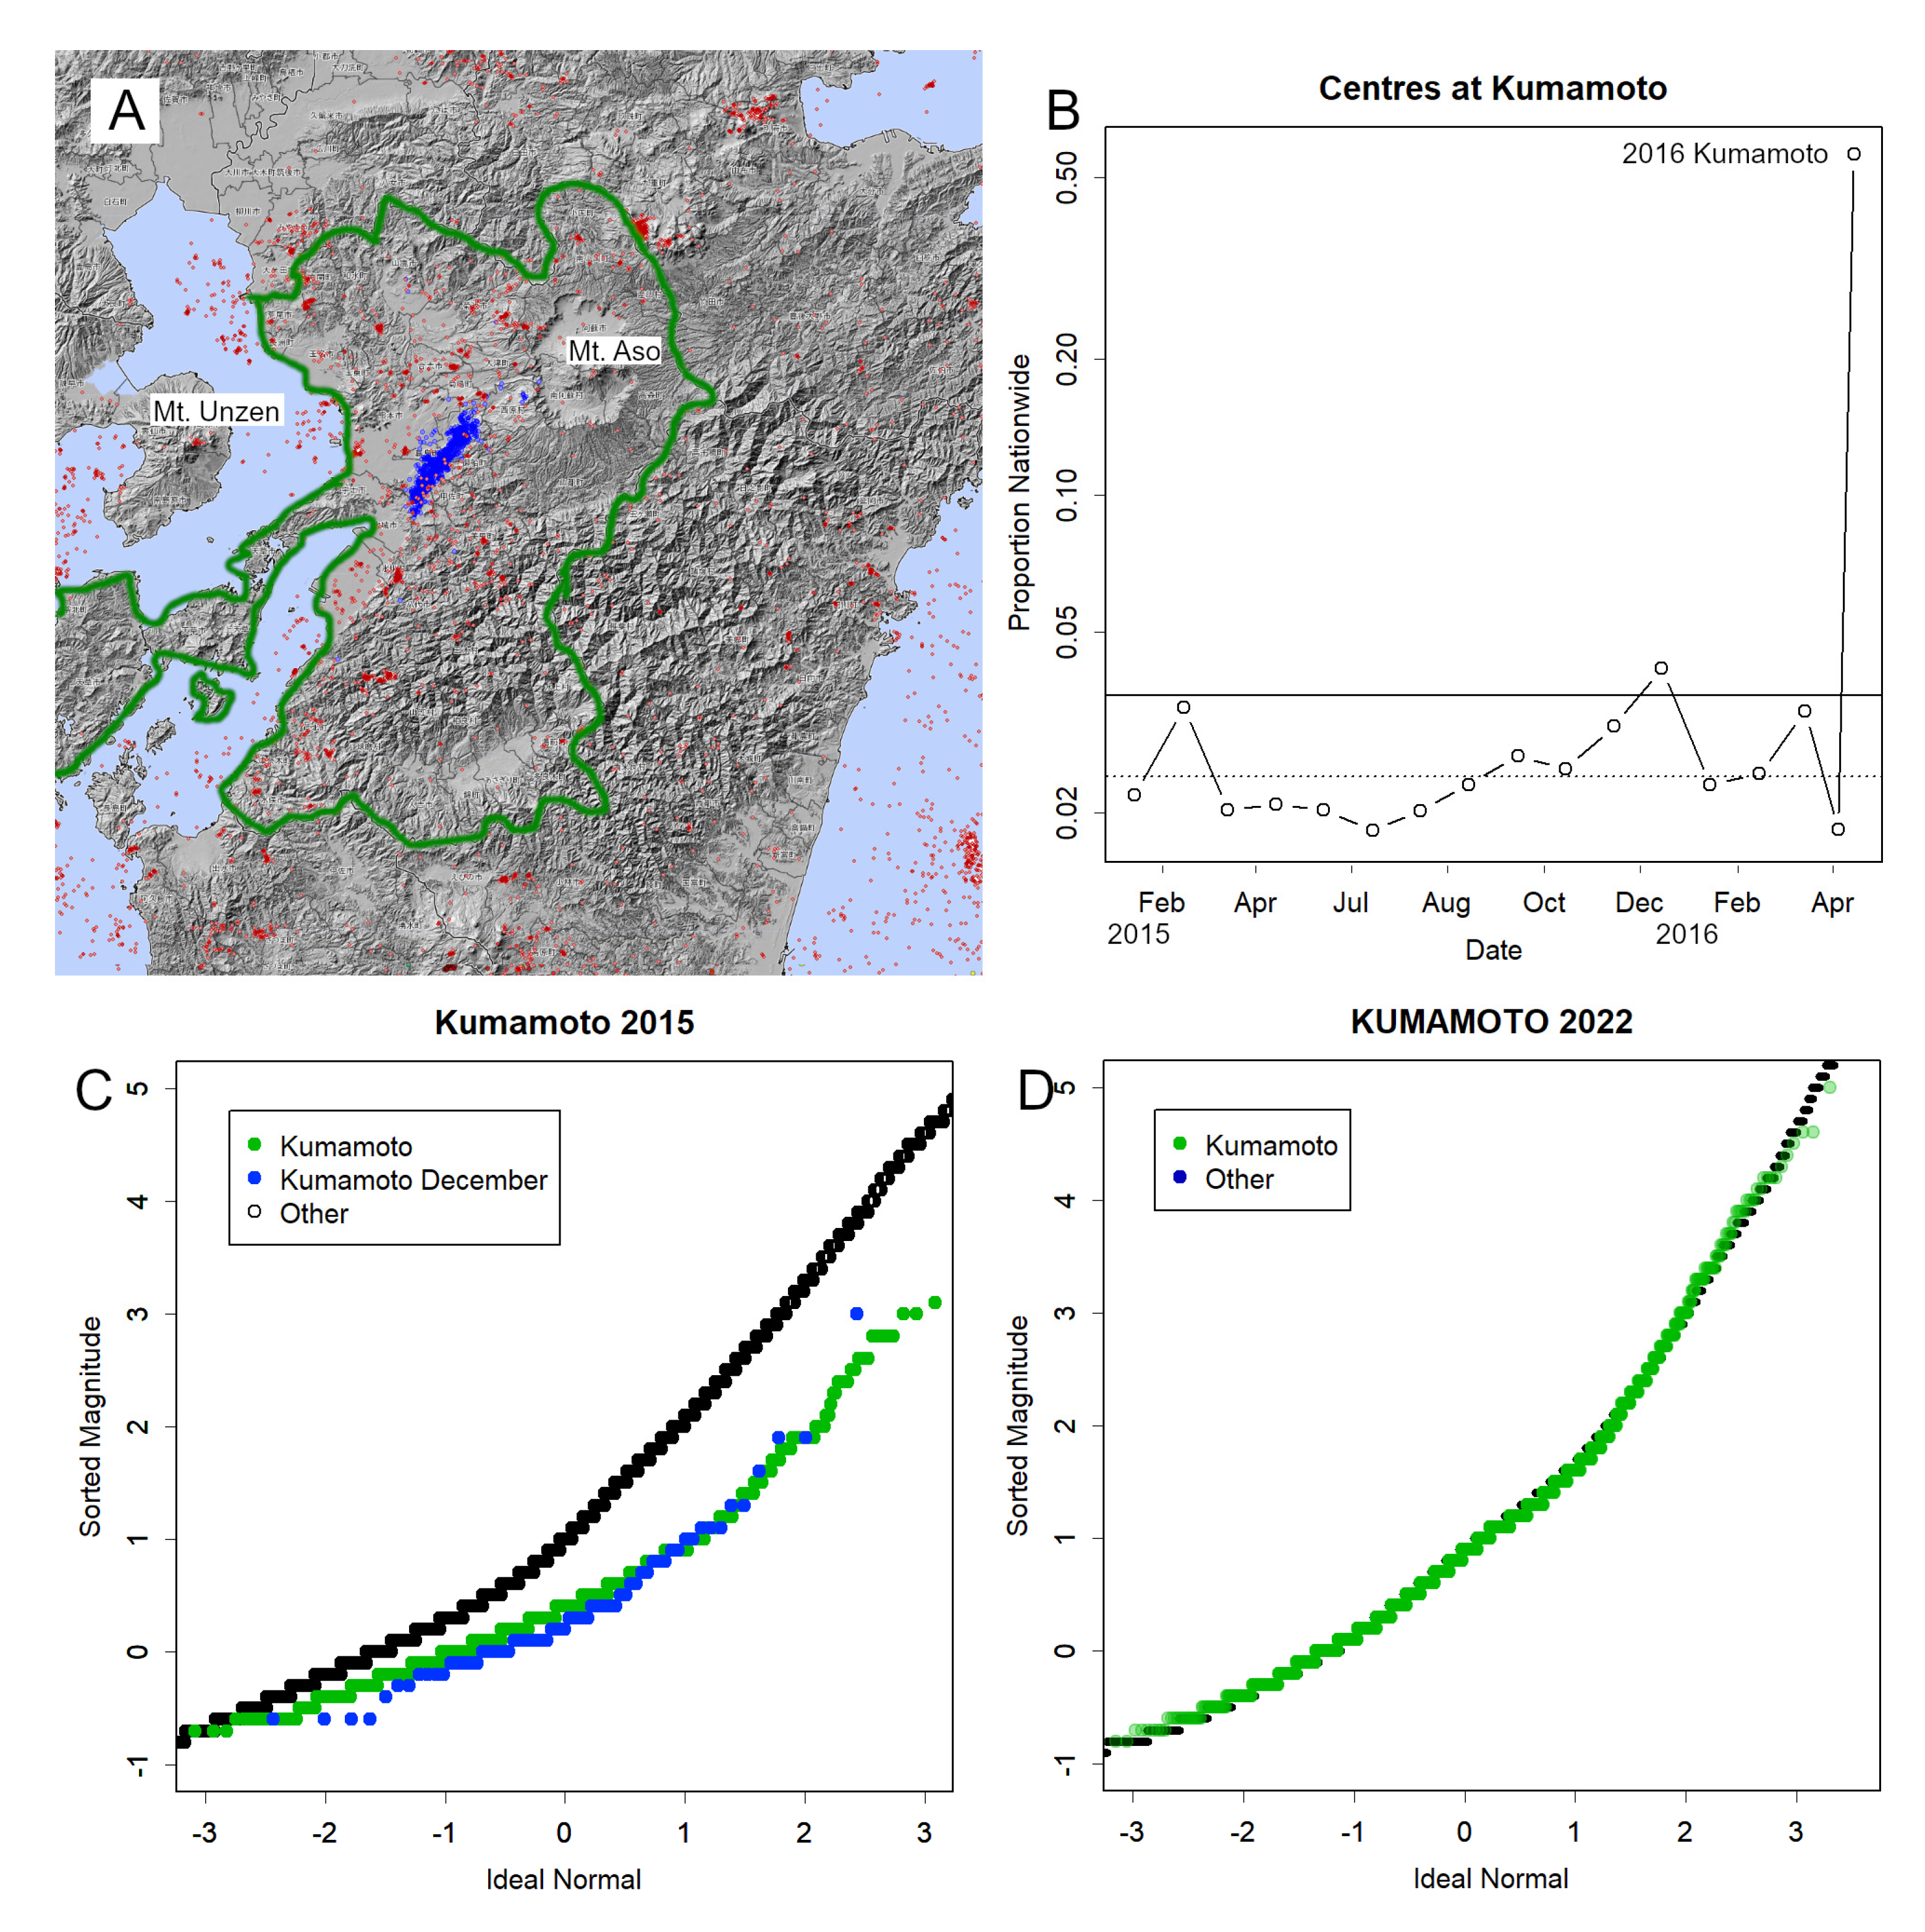
Figure 6.
Offshore Fukushima seismicity prior to the 2022 M7.3 earthquake. A. Elevated proportions persisted due to aftershocks from M6-class events in 2021. B. Magnitudes remained high throughout this period. C. No swarm was observed in November 2021, although magnitudes were elevated. Periodical data used. D. Sanriku region highlighted within the national dataset. The graph for this month shows curvature, indicating an increase in high-magnitude events, with many originating from this region.
Disclaimer/Publisher’s Note: The statements, opinions and data contained in all publications are solely those of the individual author(s) and contributor(s) and not of MDPI and/or the editor(s). MDPI and/or the editor(s) disclaim responsibility for any injury to people or property resulting from any ideas, methods, instructions or products referred to in the content. |
© 2025 by the authors. Licensee MDPI, Basel, Switzerland. This article is an open access article distributed under the terms and conditions of the Creative Commons Attribution (CC BY) license (http://creativecommons.org/licenses/by/4.0/).
Copyright: This open access article is published under a Creative Commons CC BY 4.0 license, which permit the free download, distribution, and reuse, provided that the author and preprint are cited in any reuse.


