
Submitted:
10 November 2025
Posted:
11 November 2025
You are already at the latest version
Abstract
Addressing the limitations of conventional financial time series models in capturing modern market dynamics, this study introduces a novel financial monitoring framework based on Temporal Attentive Graph Networks (TAGN). The TAGN model integrates Graph Attention Networks (GAT) and Gated Recurrent Units (GRU) to simultaneously capture spatial dependencies among financial entities and the dynamic evolution of network structure. The framework uses a multi-relational dynamic graph of 50 NASDAQ stocks. Node features fuse multi-scale information (micro, meso, macro), and the graph structure integrates price correlation, supply chain, and institutional co-holdings. Compared to benchmarks (Logistic Regression, GCN, GCN-LSTM), TAGN demonstrates superior performance (AUC: 0.89) in predicting stocks likely to experience extreme volatility (>±15%) within three months. Empirical analysis (2018–2023) effectively quantifies network imprints of major events (e.g., 45% average edge weight surge during COVID-19; community stability Jaccard similarity drop to 0.34 following the SVB incident). An ablation study confirms the critical contribution of the attention and temporal components. Finally, by generating a risk early-warning index integrating network topology and model output, this research offers a new tool for systemic risk quantification and proactive anticipation.
Keywords:
financial monitoring
; temporal graph networks
; dynamic network analysis
; risk management
; systemic risk
1. Introduction
Modern financial markets have evolved into highly complex, adaptive systems where financial entities form dynamic, multi-layered networks through channels such as supply chains, capital flows, and information diffusion [1]. Conventional econometric models, such as ARIMA and GARCH, typically rely on assumptions of independent and identically distributed (i.i.d.) data and static correlation. This foundation presents significant limitations when attempting to explain market behaviors driven by non-linear, time-varying interactions.
Market participants’ actions are not isolated but are profoundly influenced by network effects. For instance, price adjustments in upstream firms (e.g., semiconductor manufacturers) can propagate to downstream industries through the supply chain network [2]. Concurrently, overlapping holdings by common funds lead to liquidity co-movements among individual stocks [3]. More recently, the social-media-driven "Meme stock" phenomenon has underscored how retail investor behavior, facilitated by information diffusion networks, forms small-world imitation effects [4]. Furthermore, the market’s macroeconomic structure is itself dynamically evolving. During financial crises, market correlation generally intensifies, and the network topology shifts from a random network toward a scale-free network, significantly accelerating risk propagation [5].
In the face of this dynamic complexity, Dynamic Graph Neural Networks (DGNNs), which are capable of concurrently processing both graph-structured data and time series information, exhibit immense potential. Early research (e.g., [6]) has already demonstrated the feasibility of this path by combining GCN with RNN for cryptocurrency volatility prediction. However, a unified framework that can effectively capture heterogeneous influences (i.e., varying importance among neighboring nodes) within the financial network and model the evolution of the network structure remains to be fully developed.
To this end, this study proposes the Temporal Attentive Graph Networks (TAGN). This model innovatively integrates the GAT and the GRU: GAT is employed at each time step to capture the heterogeneous influences among financial entities, while GRU is utilized to model the temporal evolution of the node states. We construct a dynamic financial network driven by multi-source data and conduct comprehensive empirical analysis based on this network. The main contributions of this paper are summarized as follows:
- We propose a rigorous TAGN model capable of simultaneously modeling spatial dependencies and temporal dynamics within the financial network;
- We construct a multi-relational graph structure that fuses multi-dimensional information, including price, supply chain, news sentiment, and macroeconomic indicators;
- We systematically validate the superiority of TAGN in the financial risk prediction task through comparison with a comprehensive set of benchmark models;
- We develop and evaluate a risk early-warning index, demonstrating the model’s potential for application in real-world financial monitoring.
The remainder of this paper is structured as follows: Section 2 reviews related work; Section 3 details the methodology of the TAGN model; Section 4 introduces the data sources and experimental setup; Section 5 presents and analyzes the empirical results; Section 6 conducts the ablation study; Section 7 performs scenario analysis; and finally, Section 8 provides the conclusion.
2. Related Work
This study builds upon two major fields: financial network analysis and Dynamic Graph Neural Networks.
2.1. Financial Network Analysis
Since Mantegna (1999) first utilized the Minimum Spanning Tree (MST) to reveal the hierarchical structure of the stock market, the application of network science to the financial domain has grown significantly. Researchers have constructed financial networks using various methodologies, such such as those based on stock price correlations [6], industry linkages [7], or institutional co-holdings [8]. The majority of these studies, however, focus on static network analysis. While they are effective at revealing certain structural features of the market, they struggle to capture its dynamic evolutionary process.
2.2. Dynamic Graph Neural Networks
To effectively model time-varying graph-structured data, researchers have proposed various Dynamic Graph Neural Network models. A major category of these approaches involves Recurrent Neural Network (RNN)-based Graph Snapshot Models. These models treat the dynamic graph as a sequence of static graph snapshots, where a Graph Neural Network (GNN) is used at each time step to extract spatial features, and subsequently, a Recurrent Neural Network (RNN) is employed to capture temporal dependencies. For instance, the GCN-LSTM model directly combines GCN with LSTM [9]. However, the fixed weights of GCN limit its ability to express heterogeneous influences. Other models, such as T-GCN [10], follow a similar framework. The TAGN model proposed in this study also belongs to this category, but by introducing the GAT, it aims to more accurately capture the time-varying and heterogeneous inter-node influence within the financial network.
3. Methodology
This section details the definition of the proposed Temporal Attentive Graph Networks (TAGN) model. The model is designed to operate on and model the dynamic graph sequence , where represents the graph snapshot at time step t. Here, is the set of nodes, is the set of edges (or the adjacency matrix), and is the node feature matrix.
3.1. TAGN Model Architecture
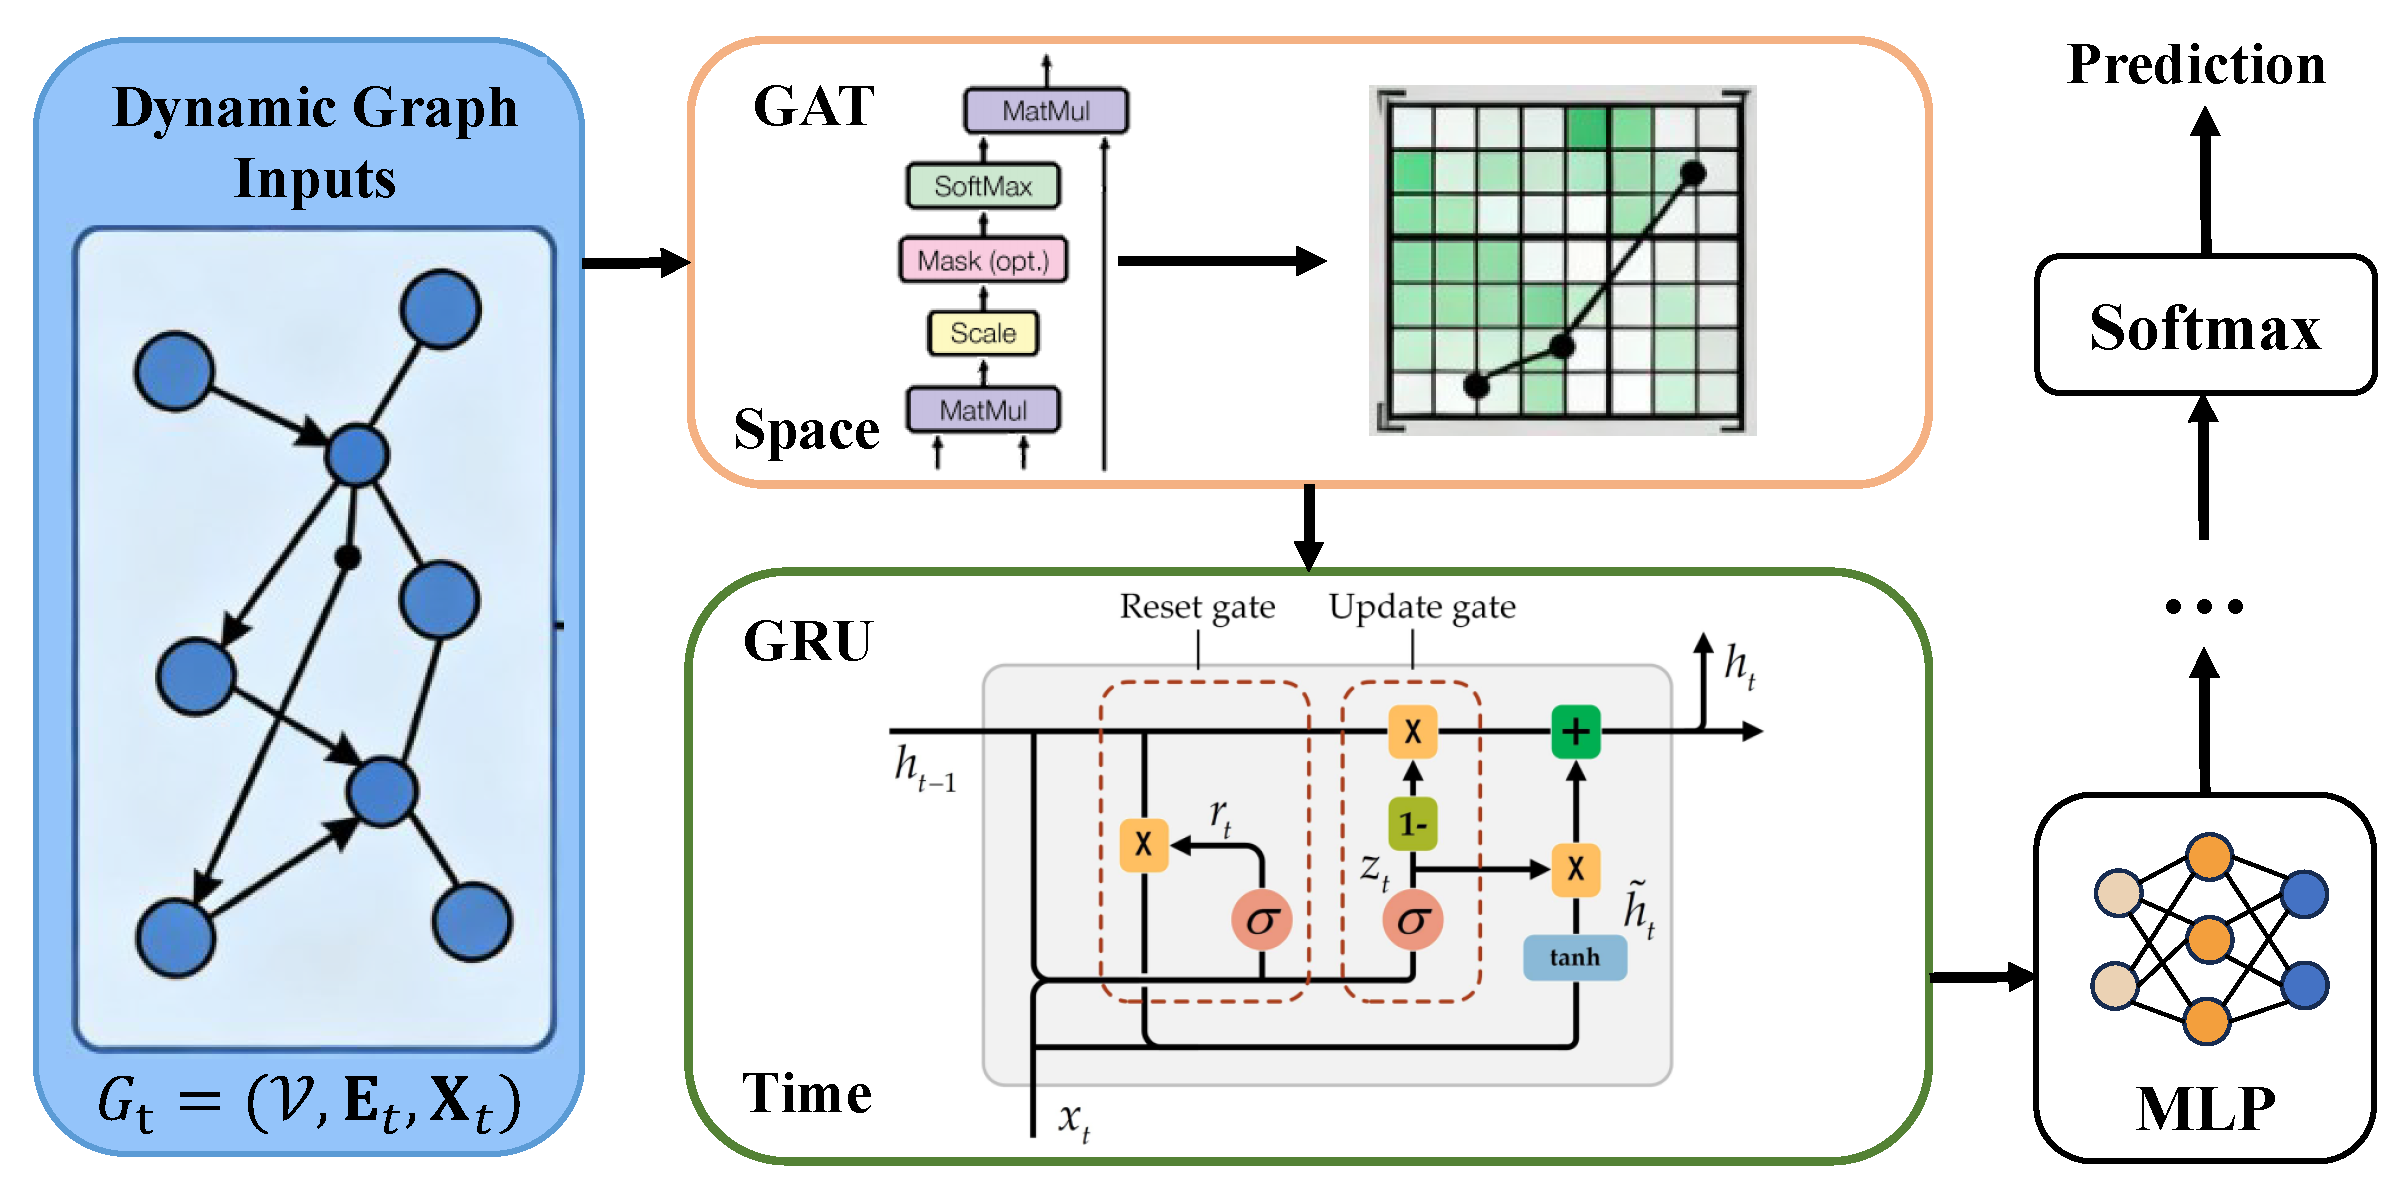
The TAGN model employs a two-layered architecture to cooperatively process information across both spatial and temporal dimensions.
Spatial Dependency Module: At each time step t, a GAT module is responsible for learning the node representations within the graph snapshot . It effectively captures the heterogeneous influence among financial entities by assigning distinct weights to each neighbor via an attention mechanism.
Temporal Dependency Module: A GRU module is tasked with updating the hidden state of each node. It integrates the node representation generated by the GAT at the current time step t with the historical information from the previous time step , thereby capturing the dynamic evolution of the network structure.
Figure 1.
The Proposed TAGN Model Architecture. At each time step t, the GAT encodes the current graph snapshot, and the GRU updates the node states along the temporal axis.
Figure 1.
The Proposed TAGN Model Architecture. At each time step t, the GAT encodes the current graph snapshot, and the GRU updates the node states along the temporal axis.
3.2. Mathematical Formulation of Model Components
3.2.1. Graph Attention Network (GAT) Module
The purpose of the GAT module is to learn how each node aggregates information from its neighbors within a single time step t. Unlike GCN with fixed weights or GraphSAGE with fixed aggregation, GAT dynamically computes the importance of neighbor nodes via a self-attention mechanism. This is crucial in financial networks, where the influence of different firms (e.g., supply chain partners, varying market sizes) on a target firm is heterogeneous and time-varying.
For any arbitrary node i, its input feature at time step t is . The GAT first projects all node features into a higher dimension using a shared linear transformation . Subsequently, the attention coefficient between node i and its neighbor is computed:
where is a learnable weight vector, denotes vector concatenation, and LeakyReLU is the non-linear activation function.
To make the coefficients comparable across different neighbors, we apply the softmax function for normalization to obtain the final attention weight :
Finally, the new representation for node i at this layer is obtained by a weighted sum of neighbor features, followed by a non-linear activation function (e.g., ELU):
This output captures the spatial dependency information within the graph snapshot at time t and serves as the input to the GRU module.
3.2.2. Gated Recurrent Unit (GRU) Module
The GRU module is integrated to capture the dynamic evolutionary patterns of the financial network over time. The adoption of GRU, as opposed to LSTM, is justified by its reduced parameter count, which ensures higher training efficiency and mitigates the risk of model overfitting, while retaining robust capability for capturing long-term temporal dependencies in financial time series data.
The GRU updates the hidden state for each node i at every time step t. This process utilizes the spatially encoded feature vector (the output of the GAT module at time t) and the historical hidden state as inputs.
The update mechanism is governed by the following equations:
- Reset Gate (): This gate determines the degree to which the information from the previous hidden state () is incorporated.
- Update Gate (): This gate controls the balance between retaining the existing hidden state and incorporating the new candidate hidden state.
The gate activations and the subsequent hidden state computation are mathematically defined as:
where , , and are learnable weight matrices, and ⊙ denotes the Hadamard product (element-wise product). The final hidden state encapsulates the spatiotemporal information of node i up to time t.
3.2.3. Prediction Layer and Loss Function
For the specific task of node classification (i.e., predicting extreme volatility), the final hidden state , which encapsulates the full spatiotemporal history, is passed through one or more fully connected layers (Multilayer Perceptron, MLP). The final output layer utilizes a softmax activation function to generate the predicted probability distribution over C target classes for each node.
The model parameters are optimized end-to-end by minimizing the cross-entropy loss (), mathematically expressed as:
where is the total number of nodes, C denotes the number of classes, is the ground-truth binary indicator for node i belonging to class c, and is the corresponding predicted probability. Training is performed using the adam optimization algorithm.
4. Data and Experimental Setup
4.1. Dataset
This study integrates multi-source heterogeneous data to construct a comprehensive financial network. All features were processed using Z-score normalization. The detailed composition, sources, purpose, and integration methods of the dataset are summarized in Table 1.
4.2. Dynamic Graph Construction
We construct a temporal multi-relational graph sequence . At each time step t, the resultant adjacency matrix is generated through the weighted fusion of multiple relation matrices:
Here, represents the dynamic matrix calculated based on a rolling window (60 days) of price correlation. Conversely, (supply chain) and (institutional co-holdings) are considered relatively static structural matrices. The fusion weights are treated as hyperparameters and are determined via a grid search on the validation set, rather than being subjectively pre-determined.
4.3. Experimental Setup
We define the task as a node binary classification problem: predicting whether a given stock will experience at least one daily return exceeding (i.e., extreme volatility) within the subsequent three-month period. The dataset is temporally partitioned as follows: data spanning 2018–2021 is utilized for training; 2022 data serves as the validation set for hyperparameter tuning; and 2023 data is reserved for the final testing and performance evaluation.

Table 2.
Hyperparameter Settings for the TAGN Model.
| Hyperparameter | Value |
|---|---|
| Learning Rate | 0.001 |
| Optimizer | Adam |
| Training Epochs | 200 |
| GAT Hidden Dimension | 128 |
| GAT Attention Heads | 4 |
| GRU Hidden Dimension | 128 |
| Dropout Rate | 0.5 |
To robustly validate the necessity of both the attentive mechanism and temporal modeling, we compare TAGN against the following benchmark models:
- Non-Graph Model (XGBoost): Utilizes only node-specific features for prediction, assessing the necessity of the graph structure.
- Static Graph Model (GCN): Performs prediction on a single, aggregated static graph, assessing the necessity of modeling temporal dynamics.
- Classic Temporal Graph Model (GCN-LSTM): Combines GCN with LSTM, assessing the superiority of the attention mechanism incorporated in TAGN.
Model performance is comprehensively evaluated using the following metrics: Accuracy, F1-Score, and AUC. Key hyperparameters for all models (including learning rate, hidden dimension size, and the number of GAT attention heads) were determined through a systematic grid search conducted on the validation set.
5. Results
5.1. Performance Comparison
The TAGN model significantly outperforms all baseline models across every evaluation metric, thereby demonstrating its superior efficacy in simultaneously capturing spatiotemporal dependencies within the financial network. The quantitative comparison of performance metrics on the test set is detailed in Table 3.
The observed performance gains underscore the necessity of the architectural choices made in TAGN:
- TAGN vs. XGBoost: The substantial performance improvement (AUC increase of ) validates the critical role of incorporating inter-corporate relationships (i.e., the graph structure) for accurate financial risk prediction.
- TAGN vs. GCN: The notable gain in performance (AUC increase of ) highlights the essential requirement for modeling the dynamic evolution of the network structure over time.
- TAGN vs. GCN-LSTM: The superior performance (AUC increase of ) confirms the advantage of the GAT’s attention mechanism in precisely capturing the heterogeneous influences among distinct financial entities, overcoming the limitations of fixed-weight aggregation.
5.2. Historical Event Analysis
We analyze the variations in key network topological metrics during significant historical events observed across both the training and test sets. These metrics offer quantifiable insights into the structural impact of market crises and anomalies on the underlying financial network. The analysis findings are comprehensively summarized in Table 4.
The analysis of topological metrics during these three key events highlights how the financial network structure reacts to varying types of shocks:
- COVID-19 Shock (March 2020): This global panic induced a massive synchronization across the market. The network’s average edge weight surged by (to ), indicating that systemic linkage intensified sharply. Concurrently, the low Jaccard Similarity () suggests that this collective panic effectively disrupted the existing, pre-crisis community structure.
- Silicon Valley Bank (SVB) Failure (March 2023): This event represented a localized financial risk that quickly became contagious. The network responded with a increase in average edge weight, reflecting a significant contagion and heightened systemic risk. The resulting Jaccard Similarity of confirms that the banking risk contagion led to a severe structural reorganization of the market’s internal architecture.
- Meme Stock Frenzy (January 2021): This was characterized by a different mechanism—a highly localized, non-fundamental shock. The internal clustering was profound, evidenced by a increase in average edge weight within the affected subgroup only. While the overall network structure was less severely disrupted than during the major crises (Jaccard Similarity of ), the formation of these highly-weighted internal clusters indicates a decoupling from the broader, fundamentally-driven market, validating the ability of our metrics to capture idiosyncratic risk dynamics.
During the early months of 2021, nodes corresponding to Meme stocks, notably GME and AMC, clustered to form an unusually dense and highly-correlated community. The average edge weight within this specific community attained , which represents a magnitude of times the network’s overall average weight during the corresponding period (). Simultaneously, the strength of connections between these Meme stock nodes and nodes representing institutionally-held blue-chip stocks (e.g., AAPL, MSFT) significantly attenuated. This quantitative observation reveals the market dynamic during this event, which was characterized by retail-driven herding and a demonstrable detachment from conventional fundamental economic drivers.
5.3. Risk Early-Warning Index Evaluation
We constructed a novel Risk Early-Warning Index () that integrates the following component metrics: (1) Network average edge weight; (2) Average clustering coefficient; (3) The average node risk probability output by the TAGN model; and (4) Aggregated negative news sentiment score. The weights assigned to each component were determined using Principal Component Analysis (PCA) to effectively capture the most dominant dimensions of risk variation.
A comparative analysis was conducted by benchmarking against the VIX index, revealing the following key findings:
- Both indices exhibited clear peaks during periods of major crisis (e.g., March 2020 and March 2023), demonstrating a strong correlation coefficient of 0.78.
- Critically, demonstrated a 1–2 week leading indication compared to the VIX index during specific events. This leading performance was particularly pronounced during risk accumulation phases driven primarily by internal changes in network structure, rather than by pure volatility alone.
6. Ablation Studies
To validate the individual effectiveness and contribution of each key component within the TAGN model, we conducted a series of ablation experiments. All subsequent experiments were evaluated using the AUC metric on the test set.
6.1. Discussion of Ablation Results
The results detailed in Table 5 strongly confirm the necessity and contribution of every designed component:
- Effect of Attention Mechanism (Variant 1): Replacing the GAT with a standard GCN (Variant 1) led to a notable performance decline of in AUC (from to ). This result confirms that the attention mechanism is crucial for capturing the heterogeneous and time-varying influences among financial entities, surpassing the limitations of fixed-weight aggregation.
- Effect of Temporal Modeling (Variant 2): Removing the GRU module entirely (Variant 2), resulting in a static graph approach, incurred the largest performance penalty, with a significant AUC drop of (to ). This outcome underscores that temporal modeling is indispensable for accurately capturing the dynamic evolutionary patterns of the network structure over time.
- Effect of Multi-Source Features (Variant 3): The removal of unstructured news sentiment features (Variant 3) resulted in a minor yet distinct AUC reduction of . This suggests that external, non-structural sentiment data provides valuable supplementary information for risk assessment.
- Effect of Multi-Relational Structure (Variant 4): The exclusion of the supply chain relational layer (Variant 4) caused an AUC drop of . This validates that the multi-relational graph structure offers a more comprehensive representation of market interconnectedness than relying solely on single-source (e.g., co-holding) relationships.
The synthesis of these findings proves the architectural choices of the TAGN model are well-justified for achieving superior risk prediction performance.
7. Scenario Analysis
To assess the model’s proactive risk early-warning capability, this section presents a hypothetical scenario analysis (stress test). We simulated the 2025 tariff shock, a sudden geopolitical event resulting in high tariffs on specific technology and manufacturing products. The scenario’s structure and results are summarized as follows:
-
Scenario Parameterization: The model inputs were adjusted to reflect the shock:
- ’Cost’ features for affected industry nodes increased by .
- Inter-sector correlation edges were reduced by , modeling risk aversion.
- Intra-sector correlation edges were increased by , simulating panic selling within the impacted group.
- Simulation Process: These parameterized graph snapshots were input into the trained TAGN model to observe predictive output and network metrics.
- Predictive Results: The model predicted that of the companies within the affected industries would be classified as high-risk within the subsequent month.
- Network Impact: The network’s overall average edge weight was projected to rise by , a magnitude consistent with the systemic linkage observed during the 2020 COVID-19 shock.
This simulation confirms that TAGN can perform forward-looking risk inference based on hypothetical events, offering crucial decision support for risk management strategies.
8. Conclusion
This study proposed and validated the Temporal Attentive Graph Networks (TAGN) framework for dynamic monitoring and risk early-warning in financial markets. By integrating the Graph Attention Network (GAT) with the Gated Recurrent Unit (GRU), TAGN effectively captures the complex spatiotemporal dependencies inherent in financial networks.
The core contributions of this research are multi-faceted. First, we presented a rigorous and unified dynamic graph modeling approach, demonstrating its superiority in financial risk prediction through comprehensive comparison against a suite of benchmark models. Second, we illustrated the integration of multi-source heterogeneous data (including trading data, supply chains, news sentiment, and macroeconomic factors) to construct a more holistic multi-relational financial graph structure. Our empirical analysis showed that TAGN can accurately identify and quantify the structural imprints of major historical events (such as the COVID-19 shock and the Meme stock frenzy) on the network topology. Finally, the ablation studies and scenario analysis further confirmed the rationality of the model design and its potential as a proactive risk analysis tool.
The study, however, is subject to certain limitations. For instance, the scope of the investigation was constrained to 50 NASDAQ-listed stocks. Furthermore, the construction of graph relationships relies on statistical metrics like correlation rather than strictly established causal mechanisms. Future research avenues include: (1) extending the model to a wider array of asset classes (e.g., bonds, cryptocurrencies) and global markets; (2) integrating more sophisticated causal discovery techniques to guide graph construction; and (3) exploring the feasibility of deploying the model on real-time data streams to achieve true real-time financial monitoring.
In summary, the TAGN framework provides a powerful and scalable tool for understanding and predicting the complex dynamic behavior of modern financial markets, holding significant theoretical and practical value for risk management, investment decision-making, and systemic crisis early-warning.
References
- Elliott M, Golub B, Jackson M O. Financial networks and contagion. American Economic Review 2014, 104, 3115–3153. [Google Scholar] [CrossRef]
- Leontief, W. Input-output economics. Oxford University Press, 1986.
- Patton A J, Verardo M. Does beta move with news? Firm-specific information flows and learning about profitability. The Review of Financial Studies 2012, 25, 2789–2839. [Google Scholar] [CrossRef]
- Antweiler W, Frank M Z. Is all that talk just noise? The information content of internet stock message boards. The Journal of finance 2004, 59, 1259–1294. [Google Scholar] [CrossRef]
- Onnela J P, Chakraborti A, Kaski K, et al. Asset trees and asset graphs in financial markets. Physica Scripta, 2003, T106, 48. [Google Scholar] [CrossRef]
- Li Z, Zhang Y, Wang Q, et al. Transactional network analysis and money laundering behavior identification of central bank digital currency of china. Journal of Social Computing 2022, 3, 219–230. [Google Scholar] [CrossRef]
- Acs Z J, Audretsch D B, Braunerhjelm P, et al. Growth and entrepreneurship. Small Business Economics 2012, 39, 289–300. [Google Scholar] [CrossRef]
- Glattfelder J, Battiston S. The backbone of complex networks of corporations: Who is controlling whom, 2009.
- Seo Y, Defferrard M, Vandergheynst P, et al. Structured sequence modeling with graph convolutional recurrent networks, International conference on neural information processing. Siem Reap, Cambodia, Dec. 2018, 362–373. [Google Scholar]
- Zhao L, Song Y, Zhang C, et al. T-GCN: A temporal graph convolutional network for traffic prediction. IEEE transactions on intelligent transportation systems 2019, 21, 3848–3858. [Google Scholar]
Table 1.
Datasets.
| Data Category | Suggested Source | Value and Purpose | Format and Integration Method |
|---|---|---|---|
| Fundamental Trading Data | Yahoo Finance | Captures price behavior and liquidity. | Node Features: Daily returns, rolling volatility, Amihud illiquidity measure. |
| Inter-Corporate Linkages | Bloomberg, Refinitiv | Graph Structure: Constructs multi-layer heterogeneous graphs, including supply chain, board overlap, and institutional co-holding networks. | Edge Lists: Forms multiple adjacency matrices , . |
| News and Sentiment Data | RavenPack, Reuters | Node Features: Quantifies market sentiment by using daily news sentiment scores as time-varying node features. | Time Series CSV: Integrated as a time-varying feature vector per node (Timestamp, Company ID, Sentiment Score). |
| Macroeconomic Indicators | FRED | Node/Global Features: Enables the model to perceive the macro environment by using indicators such as the VIX index and interest rates. | Time Series CSV: Used as global features, or replicated as node features . |
| Macroeconomic Indicators | FRED | Node/Global Features: Enables the model to perceive the macro environment by using indicators such as the VIX index and interest rates. | Time Series CSV: Used as global features, or replicated as node features . |
Table 3.
Performance Comparison of TAGN against Baseline Models on the Test Set.
| Model | Accuracy | F1-Score | AUC |
|---|---|---|---|
| XGBoost | 0.76 | 0.74 | 0.78 |
| GCN | 0.79 | 0.78 | 0.82 |
| GCN-LSTM | 0.81 | 0.80 | 0.85 |
| TAGN (This Study) | 0.83 | 0.82 | 0.89 |
Table 4.
Performance Comparison of TAGN against Baseline Models on the Test Set.
| Time Window | Market Event | Avg. Edge Weight Change | Jaccard Similarity |
|---|---|---|---|
| 2020/03 | COVID-19 Shock | (to 0.78) | 0.31 |
| 2021/01 | Meme Stock Frenzy | (within subgroup) | 0.55 |
| 2023/03 | Silicon Valley Bank Failure | (to 0.72) | 0.34 |
Table 5.
Results of the Ablation Study on Key Components of the TAGN Model.
| Model Variant | Description | AUC | Performance Drop |
|---|---|---|---|
| TAGN (Full Model) | - | 0.890 | - |
| Variant 1: w/o Attention | GAT is replaced by GCN | 0.852 | -0.038 |
| Variant 2: w/o Temporal | GRU is removed; prediction uses static GAT output | 0.831 | -0.059 |
| Variant 3: w/o News | News sentiment node features are removed | 0.875 | -0.015 |
| Variant 4: w/o Supply | The supply chain relational graph layer is removed | 0.868 | -0.022 |
Disclaimer/Publisher’s Note: The statements, opinions and data contained in all publications are solely those of the individual author(s) and contributor(s) and not of MDPI and/or the editor(s). MDPI and/or the editor(s) disclaim responsibility for any injury to people or property resulting from any ideas, methods, instructions or products referred to in the content. |
© 2025 by the authors. Licensee MDPI, Basel, Switzerland. This article is an open access article distributed under the terms and conditions of the Creative Commons Attribution (CC BY) license (http://creativecommons.org/licenses/by/4.0/).
Copyright: This open access article is published under a Creative Commons CC BY 4.0 license, which permit the free download, distribution, and reuse, provided that the author and preprint are cited in any reuse.


