
Submitted:
08 November 2025
Posted:
10 November 2025
You are already at the latest version
Abstract
Pure calcium hydroxide, Ca(OH)2, and magnesium hydroxide, Mg(OH)2, are limited in their applicability for the storage of medium-temperature heat due to their high dehydration temperatures. Modification of the hydroxides by doping with appropriate materials is a viable method for solving this problem. In this work, samples of Ca(OH)2 and Mg(OH)2 have been doped with various proportions of Boron Nitride (BN) and Potassium Nitrate (KNO3) to reduce their dehydration temperatures. The results showed that the doping processes were successfully achieved as desired, but there was a reduction in their surface areas and porosity, which could impact their thermodynamic behaviour. However, the thermal analysis on the samples revealed that the KNO3 had a more positive effect on the Mg(OH)2 material than Ca(OH)2. For instance, a reduction of 23 ℃ in the dehydration temperature and an increase of 6% in heat storage capacity were achieved with 5 wt% KNO3-doped Mg(OH)2, thus making it applicable for heat storage in the temperature range of 293–400 ℃. Thermodynamic and kinetic studies on this composite material are therefore encouraged to establish its full potential.
Keywords:
doping
; thermophysical properties
; dehydration temperature
; heat storage
; thermochemical energy storage
1. Introduction
There has been increasing interest in materials and technologies for waste heat storage as a viable means of decarbonizing buildings and industries. For instance, in the UK, buildings account for about 35% of final energy consumption and carbon dioxide (CO2) emissions [1]. A greater part of this domestic energy consumption is for hot water and space heating purposes [2]. Meanwhile, a vast amount of waste heat is generated annually from the industrial and power sectors, estimated at approximately 391 TWh, which is 35% more than the UK’s total annual electricity demand [3]. Thus, heat storage is explored as a means of augmenting the energy demand of buildings as well as mitigating carbon dioxide emitted by current technologies. Thermochemical energy storage (TCES) has attracted growing research interest due to its higher energy storage density, smaller storage volume, no heat losses, wide storage temperatures, and long-term storage [4].
This technology is envisioned to be suitable for utilizing vast amounts of variable temperature waste heat sources, which can be classified into three categories: low-grade (ambient–250 °C), medium-grade (250–500 °C), and high-grade (> 500 °C). However, for years, most research had focused on exploring low-temperature [5,6,7,8,9] and high-temperature [10,11,12,13,14] materials, thereby creating a gap in materials for medium-range applications. Therefore, metal hydroxides have been explored in recent years as materials for medium-temperature thermochemical heat storage [15]. Promising hydroxides studied for this purpose are calcium hydroxide, Ca(OH)2, and magnesium hydroxide, Mg(OH)2, which store heat when dehydrated according to the following equations:
Their dehydration/rehydration reactions normally occur at temperatures in the range 250-450 ℃ and are driven by steam partial pressure and temperature [11]. Both materials have been extensively studied in theoretical and experimental research [10], in thermogravimetry analysis (TGA), and in lab-scale reactors [11]. However, the dehydration of these hydroxides does not proceed at favourable temperatures for the utilization of surplus heat sources in the medium temperature range [15,16]. For instance, Ca(OH)2 dehydration proceeds at ≥ 390 ℃ at steam partial pressure P(H2O) of 0.024, while Mg(OH)2 dehydrates around 350 ℃ [17]. Lowering the dehydration temperatures of these hydroxides will broaden their storage bandwidth for these heat sources. One effective proposal for achieving this goal is the chemical modification of the materials by doping with appropriate doping agents [16].
Accordingly, Shkatulov and Aristov [15] achieved a 35 ℃ reduction in the dehydration temperature of Ca(OH)2 with a 5 wt% KNO3 ratio, but the dehydration heat was reduced by 7%. Huang et al. [18] reported 6% improvement in the dehydration reaction of Ca(OH)2 with 15 wt% BN-doping, but the dehydration temperature was not explicitly stated. Furthermore, Wang et al. [19] achieved 33 ℃ reduction in dehydration temperature with a 10 wt% KNO3-doped Ca(OH)2 but reported a decrease in heat storage. Yan and Zhao [20] also reduced the dehydration temperature of Ca(OH)2 by 26 ℃ with LiOH addition, but the specific heat capacity was reduced.
Similar experiments with Mg(OH)2 have also been reported. Vermiculite addition to Mg(OH)2 lowered its dehydration temperature by 50 ℃, but the heat storage capacity was twice as low as in the pure Mg(OH)2 [21]. Li et al. [22] achieved a reduction of 56 ℃ in the dehydration temperature of Mg(OH)2 with 10 wt% LiNO3, whereas Shkatulov and Aristov [23] also reported a 50 ℃ reduction with 20 wt% NaNO3 but the heat storage decreased from 1325 to 1040 J/g. Kato et al. [17] tried doping Mg(OH)2 with Ni(OH)2. The mixed hydroxide, Mg0.5Ni0.5(OH)2, stored heat at < 300 ℃, but the estimated heat capacity of the composite (165 kJ/kg) was less than that for pure Mg(OH)2 (887 KJ/kg) [24].
It can be observed from the foregoing that doping resulted in a reduction in the dehydration temperatures of Ca(OH)₂ and Mg(OH)₂; however, the respective heat storage capacities were often compromised. In this study, hexagonal Boron Nitride (BN) and Potassium Nitrate (KNO₃) were selected as doping materials, owing to their complementary modification mechanisms and potential to benefit medium-temperature heat storage. Alkali metal nitrates such as KNO₃, for instance, can introduce imperfections in the hydroxide structure serving as nucleation sites, thereby facilitating dehydration at lower temperatures [15,25]. On the other hand, BN is a thermally conductive yet chemically inert material that can improve internal heat transfer and maintain the structural stability of hydroxide composites during cycling [18]. While KNO₃ primarily acts as an ionic promoter and BN as a structural and thermal enhancer, their comparative influence on Ca(OH)₂ and Mg(OH)₂ has not been systematically assessed.
Accordingly, this work investigates the thermophysical performance of BN- and KNO₃-doped Ca(OH)₂ and Mg(OH)₂, to reduce their dehydration temperatures while retaining favourable heat storage capacities. By comparing the effects of these two doping materials, the study provides new insights into the prospects of developing hydroxide-based composites for medium-temperature TCES applications.
2. Materials and Methods
2.1. Materials Development
The core materials used in this work are Ca(OH)2 of 99.995% purity and Mg(OH)2 of 95.0% purity obtained from Sigma-Aldrich, Gillingham, UK. The doping materials are 98% purity hexagonal boron nitride (BN) and 99% purity potassium nitrate (KNO3), all obtained from Sigma-Aldrich, Gillingham, UK.
The composite materials were prepared by doping Ca(OH)2 or Mg(OH)2 with 5, 10, 15, and 20 wt% of BN or KNO3. The BN-doped composites were prepared based on ultrasonic and mechanical agitation methods described by Huang et al. [18]. The 5 wt% BN mass ratio was synthesized by mixing 0.05 g of BN powder, 0.95 g of Ca(OH)2 or Mg(OH)2 powder, and 50 ml of ethanol. The mixture was then sonicated for 1 hour at 48 ℃, followed by magnetic stirring for 1.5 hours. The composite was then filtered and dried for 12 hours in an oven at 80 ℃. The 10 wt%, 15 wt%, and 20 wt% ratios were similarly prepared using 0.1056 g, 0.1676 g, and 0.2375 g of BN, respectively, with the same amount of Ca(OH)2 or Mg(OH)2 powder (0.95 g).
The KNO3-doped Ca(OH)2 or Mg(OH)2 were prepared in a total controlled sample mass of 6 g. The weight of KNO3 in each composite (5%, 10%, 15%, and 20%) was 0.3 g, 0.6 g, 0.9 g, and 1.2 g, respectively. Initial mixing of the KNO3 and Ca(OH)2 or Mg(OH)2 powders was done in an agate mortar to ensure thorough blending, then transferred into a beaker for mixing with 20 ml of distilled water. The mixture was simultaneously stirred while being heated at 90 ℃ for 1.5 hours, and then oven-dried at 120 ℃ for 12 hours.
A total of 16 composite materials were developed, 4 in each matrix of Ca(OH)2-BN, Ca(OH)2-KNO3, Mg(OH)2-BN, and Mg(OH)2-KNO3. For simplicity, the designations CH-BN, CH-PN, MH-BN, and MH-PN are further used to represent BN-doped, KNO3-doped Ca(OH)2, and Mg(OH)2. The additive ratios are detailed in Table 1.
2.2. Materials Characterization
The composites were characterized to correlate structural, surface, and thermal properties using X-ray diffraction (XRD), Brunauer-Emmett-Teller (BET) analysis, scanning electron microscopy (SEM), differential scanning calorimetry (DSC), and thermogravimetry analysis (TGA).
2.2.1. Powder X-Ray Diffractometry
Powder X-ray diffraction (XRD) was obtained at room temperature using a PANalytical X’Pert PRO diffractometer (Malvern Instruments Ltd, Worcestershire, UK), with CuKa radiation (l = 1.5406 Å, 40 kV, 40 mA), for values of 2-Theta and 0.02 step size, 50s step time in the range 2°–70°. XRD provides information on structures, phases, crystal orientations (texture), and other structural parameters in materials. Here, the developed TCES materials were characterized for phase identification of the composite elements.
2.2.2. Brunauer-Emmett-Teller Analysis
The surface areas of the materials were determined using a nitrogen sorption isotherm with a Micromeritics 3Flex analyzer (Micromeritics Instrument Corporation, Norcross, Georgia, USA) at -196 ℃. Before analysis, the samples were degassed at 100 ℃ for 16 hours under vacuum. The specific surface areas were calculated using the Brunauer–Emmett–Teller (BET) method from the nitrogen adsorption data within the relative pressure (P/P0) range of 0.05–0.30. The total pore volume was estimated using total nitrogen adsorbed at a relative pressure close to saturation (P/P0 ~ 0.99). The pore size distribution (PSD) was determined using non-local density functional theory (NL-DFT) applied to nitrogen isotherm data.
2.2.3. Scanning Electron Microscopy
Samples were imaged by means of a JEOL 6490LV (JEOL Ltd, Tokyo, Japan) scanning electron microscope (SEM), operated in high vacuum mode at 15 kV, and with a secondary electron detector. The instrument generated detailed images of the materials’ surfaces by detecting variations in topology. This was used to observe the materials’ surface structures.
2.2.4. Differential Scanning Calorimetry
Differential scanning calorimetry (DSC) measurements were performed using a TA Thermal Instrument (TA Instruments, New Castle, Delaware, USA). A baseline measurement was taken in the range of 25 ℃ to 550 ℃ at 10 ℃/min. A 5 mg sample was heated in the same temperature range and heating rate. Nitrogen was used as the purge gas at a volumetric rate of 20 ml/min under 1 atm pressure. DSC analysis was aimed at obtaining the dehydration (or stored) heat and the temperature at which heat was stored.
2.2.5. Thermogravimetry Analysis
Thermogravimetric analysis (TGA) was performed using a vacuum-tight thermo-microbalance (SDT600, TA Instruments, New Castle, Delaware, USA). The vapour pressure was set at 1 atm, and a 20 mg sample was placed on the alumina crucible. This was then subjected to a temperature ramp from 25 ℃ to 600 ℃ at a heating rate of 10 ℃/min under a nitrogen atmosphere at a flow rate of 20 ml/min. TGA was carried out to provide an overview of the thermal stability of the composite materials by observing the weight variation with temperature.
3. Results and Discussion
3.1. Powder XRD
The XRD diffractograms for the pure Ca(OH)2 and its composites are shown in Figure 1. The pure Ca(OH)2 (CH) shows the expected XRD patterns in agreement with the standard Powder Diffraction Form (PDF) available in the Inorganic Crystal Structure Database (ICSD) reference 01-087-0674. For the composite materials, the XRD patterns show two phases: one of Ca(OH)2 and the other of either BN ( Figure 1a) or KNO3 (Figure 1b), when doped with BN or KNO3, in agreement with the reference 00-045-1171 (standard BN) and 00-001-0493 (standard KNO3), respectively.
It appears the BN particles were physically embedded or surface-adhered onto Ca(OH)₂ grains, possibly aided by hydrogen bonding or van der Waals forces between hydroxyl groups and the BN surface. No substitutional doping occurred because BN did not chemically integrate into the hydroxide lattice. This may be why the XRD revealed distinct reflections from both Ca(OH)₂ and BN phases, with no significant peak shifts. For KNO3 doping, the mixture was heated at 90 ℃ in water, which could allow for partial dissolution and ion mobility. So the most realistic scenario could be surface adsorption/ionic association. So, the observed distinct reflections correspond to Ca(OH)₂ and residual KNO₃ phases. The intensity of the peaks increases with an increase in the dopant percentage, as indicated in the inset. The highlighted area in each case shows the peak positions of BN and KNO3, respectively.
In the case of pure Mg(OH)2, the XRD patterns show one phase (Figure 2), which agrees well with the brucite Mg(OH)2 ICSD reference 01-074-2220. The XRD patterns for the composites in Figure 2a and Figure 2b show two phases of Mg(OH)2 and BN, or Mg(OH)2 and KNO3, in agreement with reference 00-045-0895 (standard BN) and PDF 00-001-0493 (standard KNO3), respectively.
Similarly, BN was physically embedded or surface-adhered to Mg(OH)₂ grains through weak interactions such as hydrogen bonding or van der Waals forces, without lattice substitution. Accordingly, XRD show distinct Mg(OH)₂ and BN reflections with no peak shifts. For KNO₃ doping, heating in water likely promoted partial dissolution and surface adsorption or ionic association, yielding distinct Mg(OH)₂ and residual KNO₃ reflections. The insets in the figures show the increasing intensity of the peaks with the increase in the dopant’s proportion. The highlighted area shows the peak positions of BN and KNO3, respectively.
The XRD peaks are formed by constructive interference of an X-ray beam at specific angles from each set of lattice planes in a material sample. The peak intensities are determined by the distribution of atoms within the material. Therefore, the X-ray diffraction pattern fingerprints the atomic arrangements in the developed materials, thus enabling quick phase identification in the samples. Therefore, these results confirm that the doping process was successful.
3.2. BET Analysis
The BET surface areas (SBET) of the pure and doped materials are summarized in Table 2. It shows that the surface areas of CH-BN composites range from 15 to 20 m²/g, with CH-BN20 having the highest value of 20 m²/g, compared to 32 m²/g for the pure material (CH). The surface areas of the CH-PN composites were also found to be in the range of 10–21 m²/g, with CH-PN5 having the highest value of 21 m²/g. As presented in Figure 3, the samples exhibit type III isotherms, characterized by low adsorption volume at low relative pressures and high adsorption volumes at high relative pressures. This indicates that the materials are either non-porous or possess some level of macroporosity. On the other hand, the BET results for the doped MH samples show a more drastic reduction in their surface areas in comparison with the pure MH sample. For instance, surface areas for MH-BN composites were in the range between 7 and 13 m2/g, while the MH-PN composites were between 5 and 6 m2/g, as against 25 m2/g for pure MH. This can be attributed to the pore-plugging effect of the dopants, resulting in a decline in the porosity.
In Figure 4, the adsorption profile for pure MH appears as a type IV isotherm, which indicates the presence of some level of mesoporosity. However, the doped samples appear as type III isotherms.
The SBET characteristics of CH and MH were further revealed and understood by comparing their pore size distribution (PSD), as shown in Figure 5a and Figure 5b (each for pure material and 5 wt% doping proportions). The PSD results show clear evidence that the pore size decreased after doping. Thus, the doping of the two hydroxides with either BN or KNO3 resulted in a decrease in the overall surface area and porosity of the materials. The reduced pore sizes and overall surface areas may likely slow both the dehydration and rehydration kinetics because of reduced reactive surface and poorer vapour transport, thus suggesting the possibility of lower effective reversible capacity.
3.3. SEM Analysis
The SEM image of the pure Ca(OH)2 is shown in Figure 6 as bulky, oval-shaped grains that tend to aggregate. The crystallites in an aggregate are more densely packed with less intra-crystallite porosity.
With the addition of BN in CH-BN composites, there is a redistribution of particles in non-homogeneous morphologies (Figure 7a-d). The presence of larger voids within clusters of particles, especially for the CH-BN10 sample (Figure 7b), was observed. Generally, the addition of BN weight ratios to Ca(OH)2 produced various morphologies with non-uniform particle packing.
The SEM images for CH-PN composites are shown in Figure 8, where the CH-PN5 sample shows a reticulate morphology comprising moderate-sized grains (Figure 8a). Further increment in the additive ratio results in the formation of lumps and a close-up on intraparticle spaces, as shown in (b) and (c). At 20 wt% of KNO3 (CH-PN5), the material’s microstructure begins to flake as shown in (d).
Figure 9 is the SEM image of pure Mg(OH)2 (MH) with a closely-packed fluffy morphology. This spongy texture is suggestive of a large surface area.
However, the addition of 5, 10, and 15 wt% BN (Figure 10) resulted in particulate compaction, leading to increased grain packing. At 20 wt% BN addition, large aggregative lumps appeared, as seen in Figure 10d.
On the other hand, the SEM images of Mg(OH)2 composites with KNO3 as the doping material are presented in Figure 11. In this case, the 5 wt% additive proportion appeared to improve particle distribution, demonstrating a reduction in the sintering effect (Figure 11a). However, for proportions >5 wt%, there is a progressive increase in particle compaction resulting in coalescence at 20 wt% mass ratio (Figure 11c).
3.4. DSC
These curves exhibited broad endothermic peaks during the dehydration. The variability of the peak positions is dependent on the dopants’ proportions. The different characteristic values of these peaks were evaluated by integrating the area under the peak, which yields the reaction heat flow. For dehydration, this represents the stored heat. Another important parameter is the onset temperature, which is the temperature at which a reaction starts at a measurable rate, in this case, the dehydration reaction.
Given the reduced pore size and surface area observed in the BET analysis, the dehydration endotherms would, generally, tend to broaden or shift to higher temperatures (for the same heating rate and per-gram-of-sample normalization). This is because with poorer mass transport and fewer surface sites, a larger driving force (higher temperature or lower pH₂O) would be required to sustain the same reaction rate; therefore, the onset and peak temperatures would move up. However, if the dopant chemically/physically catalyses dehydration or lowers the local activity of water (like certain salts acting as flux), the onset could shift lower instead.
Figure 12 represents the DSC thermograms for pure Ca(OH)2 and its (a) BN-doped and (b) KNO3-doped composites.
The summaries of these results are shown in Table 3.
In Table 3, the dehydration temperature (onset temperature) decreases upon the addition of BN. This demonstrates that the modification of the Ca(OH)2 structure by BN addition has a considerable effect on its dehydration temperature. The aim was to obtain a minimal onset temperature. In this case, the minimal dehydration temperature is 433.89 ℃ for 10 wt% of BN proportion. This means the dehydration temperature of the CH-BN10 composite can be achieved at about 17 ℃ less than that of the pure material. The dehydration heat of CH-BN10 is 1016.80 J/g, which is 15% less than the dehydration heat of CH.
For KNO3-doped composites, the dehydration temperature decreased as the KNO3 content increased up to the KNO3 additive proportion of 20 wt%. In this case, the minimal dehydration temperature is 426.00 ℃ with a 20 wt% mass fraction of KNO3. So, the heat storage reaction of the CH-PN20 material can be carried out at a temperature lower by 25 ℃, but at 25% less dehydration heat. A phenomenon was observed at additive ratios >10 wt% with the occurrence of small endothermic peaks. For the CH-PN15 composite, two peaks appeared at 133 ℃ and 331 ℃, and at 132 ℃ and 333 ℃ for CH-PN20. A similar observation was reported in the literature [15] though occurred at a single temperature of 334 °C. This was attributed to the fusion of crystalline KNO3.
Similarly, the DSC thermograms for pure Mg(OH)2 (MH) and its composites are shown in Figure 13, while the quantitative data are presented in Table 4.
As seen in Table 4, the variation of onset temperature with additive mass fractions in BN-doped Mg(OH)2 composites did not show any effect on lowering the dehydration temperature. None of the composites minimized the onset temperature of the pure Mg(OH)2 material (MH). This indicates that the additive proportions of BN do not positively enhance the dehydration behaviour of pure Mg(OH)2. On the other hand, the KNO3-doped composites showed the lowest decrease with 5 wt% KNO3 addition, but started to increase at proportions of KNO3 >5 wt%. This lowest dehydration temperature at 5wt% KNO3 proportion is 293.88 ℃, which is about 23 ℃ less than the dehydration temperature of the pure Mg(OH)2 (MH) material. In this case, a dehydration heat of 1317.10 J/g is about 6% more than the dehydration heat of MH. The appearance of minute peaks was observed at 132 ℃ with progressing troughs as the proportion increased ≥10 wt%.
3.5. TGA
Figure 14 represents the TGA overlay curves for pure Ca(OH)2 and its (a) BN-doped and (b) KNO3-doped composites.
From Table 5, pure CH exhibits a weight loss of 18.40%. The addition of BN reduced the weight loss across all compositions. The weight loss decreased progressively with increasing BN content, with CH-BN5 showing 16.80%, CH-BN10 at 14.65%, and both CH-BN15 and CH-BN20 at 14.28%. The plateau in weight loss between CH-BN15 and CH-BN20 appears to suggest that the reduction in weight loss stabilized at higher BN concentrations, possibly indicating that a maximum stabilization effect was reached.
However, for the KNO3-doped counterparts, the weight loss results are somewhat mixed. CH-PN5 showed a slight increase in weight loss, indicating more degradation. With higher nitrate content (10% and above), the weight loss decreased, with CH-PN10 having the lowest weight loss of 16.82%. This suggests that while the KNO3 addition made the material decompose at lower temperatures, it also reduced the extent of decomposition at higher temperatures.
Similarly, the TGA curves for pure, BN-doped, and KNO3-doped Mg(OH)2 samples are shown in Figure 15. The summaries are presented in Table 6.
In Table 6, pure Mg(OH)2 (MH) has a weight loss of 28.79%. This decreased with increasing BN content, with MH-BN20 showing the lowest weight loss at 22.94%. This indicates that BN not only delayed the onset of decomposition but also reduced the extent of decomposition, suggesting that incorporating BN into MH enhances its thermal stability. The most significant improvement was observed in the MH-BN10 composition, beyond which the thermal stability begins to slightly decrease.
With KNO3 addition, the weight loss decreased as the nitrate content increased, similar to the trend observed with BN-doped materials. MH-PN20 showed the most significant reduction in weight loss at 24.82%, indicating that higher KNO3 content reduced the extent of thermal decomposition. The 5 wt% KNO3 ratio (MH-PN5) has a mass loss (28.80%) very close to the pure material (28.79%), implying that the 5 wt% KNO3 ratio acted more as a thermal stabilizer for the pure material.
Generally, the DSC/TGA thermal characterization results reveal that BN effectively reinforced the structural and thermal robustness of the base materials, with the optimal effect observed at 10–20 wt% BN. This suggests limited degradation at elevated temperatures. In contrast, KNO₃ doping lowered the onset temperature and also exhibited a stabilization effect, especially in Mg(OH)2 at lower weight proportions. Consequently, BN-doped composites may be more suitable for high-temperature thermochemical heat storage requiring enhanced stability, whereas KNO₃-doped materials may be suitable for medium-temperature operation where moderate stability may be acceptable. Specifically, it suggests that a 5 wt% KNO3 proportion acted as a flux and catalysed the dehydration of Mg(OH)2 by lowering the local activity of water, thereby shifting the onset temperature lower.
4. Conclusions
This comparative study aimed to investigate the thermophysical performance of doped Ca(OH)₂ and Mg(OH)₂ for potential applications in medium-temperature thermochemical energy storage. The goal was to understand how these dopants influence structural, morphological, and thermal properties to enhance dehydration behaviour and overall storage efficiency.
Key findings of the study are summarized as follows:
- XRD analysis confirmed the effective incorporation of BN and KNO₃ into both Ca(OH)₂ and Mg(OH)₂ matrices.
- BET and SEM analyses revealed reduced surface areas and porosity in all doped samples, irrespective of doping material type, indicating structural densification upon doping.
- DSC and TGA results demonstrated that KNO₃ doping significantly lowered dehydration temperatures in both materials. (In Ca(OH)₂, 10 wt% KNO₃ reduced the dehydration temperature by 24 ℃, though with a 14% decrease in heat storage capacity. In Mg(OH)₂, 5 wt% KNO₃ reduced the dehydration temperature by 23 ℃ while enhancing heat storage capacity by 6%).
- The thermal indices of 5 wt% KNO₃-doped Mg(OH)₂ were comparable to the base material, suggesting that KNO₃ incorporation did not compromise thermal stability. This indicates good compatibility between KNO₃ and the Mg(OH)₂ matrix.
Therefore, the study has revealed that Mg(OH)2 doped with 5 wt% KNO3 exhibited the most promising performance, showing effective dehydration behaviour, enhanced heat storage, and stable thermal characteristics suitable for the medium-temperature operational range of 293–400 ℃. Studies on the kinetics, reversibility, and cycling durability of the doped material towards long-term capability are, however, encouraged.
Specifically, it is recommended to run DSC at two heating rates (such as 5 and 10 ℃/min) to check how the peak temperature moves (large shifts suggest kinetic control). Additionally, this might be complemented with isothermal TGA (mass vs time) to see the real-time kinetics and confirm whether DSC broadening is mass-transfer limited.
Author Contributions
Conceptualization, J.D., J.C. and R.B.; methodology, J.D., J.C. and R.B.; software, A.K.; formal analysis, A.K., J.D. and J.C; investigation, A.K.; resources, J.D.; writing—original draft preparation, A.K.; writing—review and editing, J.D., J.C. and R.B.; visualization, A.K.; supervision, J.D.; project administration, J.D.; funding acquisition, J.D. All authors have read and agreed to the published version of the manuscript.
Funding
Please add: This research was supported by the Engineering and Physical Sciences Research Council (ESPRC), UK, [grant number ER/V041452/1].
Data Availability Statement
All the data is available in this manuscript.
Acknowledgments
We are grateful for the APC waiver granted by the editorial board of Energy Storage and Applications. (This article is a revised and expanded version of “Synthesis and Characterization of Doped Magnesium Hydroxide for Medium Heat Storage Application” published in Materials (2023, 16, 6296), as part of an ongoing project.)
Conflicts of Interest
The authors declare no conflicts of interest.
References
- Kant, K.; Pitchumani, R. Advances and Opportunities in Thermochemical Heat Storage Systems for Buildings Applications. Appl Energy 2022, 321. [Google Scholar] [CrossRef]
- Watson, S.D.; Lomas, K.J.; Buswell, R.A. Decarbonising Domestic Heating: What Is the Peak GB Demand? Energy Policy 2019, 126, 533–544. [Google Scholar] [CrossRef]
- Stevenson, P.; Hyde, R. The Potential for Recovering and Using Surplus Heat from Industry. Available online: https://assets.publishing.service.gov.uk/government/uploads/system/uploads/attachment_data/file/294900/element_energy_et_al_potential_for_recovering_and_using_surplus_heat_from_industry.pdf (accessed on 20 February 2023).
- Chen, X.; Zhang, Z.; Qi, C.; Ling, X.; Peng, H. State of the Art on the High-Temperature Thermochemical Energy Storage Systems. Energy Convers Manag 2018, 177, 792–815. [Google Scholar] [CrossRef]
- Hongois, S.; Kuznik, F.; Stevens, P.; Roux, J.J. Development and Characterisation of a New MgSO4-Zeolite Composite for Long-Term Thermal Energy Storage. Solar Energy Materials and Solar Cells 2011, 95, 1831–1837. [Google Scholar] [CrossRef]
- Yu, N.; Wang, R.Z.; Wang, L.W. Sorption Thermal Storage for Solar Energy. Prog Energy Combust Sci 2013, 39. [Google Scholar] [CrossRef]
- Scapino, L.; Zondag, H.A.; Van Bael, J.; Diriken, J.; Rindt, C.C.M. Sorption Heat Storage for Long-Term Low-Temperature Applications: A Review on the Advancements at Material and Prototype Scale. Appl Energy 2017, 190, 920–948. [Google Scholar] [CrossRef]
- Jarimi, H.; Aydin, D.; Yanan, Z.; Ozankaya, G.; Chen, X.; Riffat, S. Review on the Recent Progress of Thermochemical Materials and Processes for Solar Thermal Energy Storage and Industrial Waste Heat Recovery. International Journal of Low-Carbon Technologies 2019, 14, 44–69. [Google Scholar] [CrossRef]
- Zhang, Y.; Wang, R. Sorption Thermal Energy Storage: Concept, Process, Applications and Perspectives. Energy Storage Mater 2020, 27, 352–369. [Google Scholar] [CrossRef]
- Felderhoff, M.; Urbanczyk, R.; Peil, S. Thermochemical Heat Storage for High Temperature Applications-A Review. Green 2013, 3, 113–123. [Google Scholar] [CrossRef]
- Pardo, P.; Deydier, A.; Anxionnaz-Minvielle, Z.; Rougé, S.; Cabassud, M.; Cognet, P. A Review on High Temperature Thermochemical Heat Energy Storage. Renewable and Sustainable Energy Reviews 2014, 32, 591–610. [Google Scholar] [CrossRef]
- André, L.; Abanades, S.; Flamant, G. Screening of Thermochemical Systems Based on Solid-Gas Reversible Reactions for High Temperature Solar Thermal Energy Storage. Renewable and Sustainable Energy Reviews 2016, 64, 703–715. [Google Scholar] [CrossRef]
- Wu, S.; Zhou, C.; Doroodchi, E.; Nellore, R.; Moghtaderi, B. A Review on High-Temperature Thermochemical Energy Storage Based on Metal Oxides Redox Cycle. Energy Convers Manag 2018, 168, 421–453. [Google Scholar] [CrossRef]
- Sunku Prasad, J.; Muthukumar, P.; Desai, F.; Basu, D.N.; Rahman, M.M. A Critical Review of High-Temperature Reversible Thermochemical Energy Storage Systems. Appl Energy 2019, 254. [Google Scholar] [CrossRef]
- Shkatulov, A.; Aristov, Y. Calcium Hydroxide Doped by KNO3 as a Promising Candidate for Thermochemical Storage of Solar Heat. RSC Adv 2017, 7, 42929–42939. [Google Scholar] [CrossRef]
- Shkatulov, A.I.; Aristov, Y. Thermochemical Energy Storage Using LiNO3-Doped Mg(OH)2: A Dehydration Study. Energy Technology 2018, 6, 1844–1851. [Google Scholar] [CrossRef]
- Kato, Y.; Takahashi, R.; Sekiguchi, T.; Ryu, J. Study on Medium-Temperature Chemical Heat Storage Using Mixed Hydroxides. International Journal of Refrigeration 2009, 32, 661–666. [Google Scholar] [CrossRef]
- Huang, C.; Xu, M.; Huai, X. Experimental Investigation on Thermodynamic and Kinetic of Calcium Hydroxide Dehydration with Hexagonal Boron Nitride Doping for Thermochemical Energy Storage. Chem Eng Sci 2019, 206. [Google Scholar] [CrossRef]
- Wang, T.; Zhao, C.Y.; Yan, J. Investigation on the Ca(OH)2/CaO Thermochemical Energy Storage System with Potassium Nitrate Addition. Solar Energy Materials and Solar Cells 2020, 215. [Google Scholar] [CrossRef]
- Yan, J.; Zhao, C.Y. Thermodynamic and Kinetic Study of the Dehydration Process of CaO/Ca(OH)2 Thermochemical Heat Storage System with Li Doping. Chem Eng Sci 2015, 138, 86–92. [Google Scholar] [CrossRef]
- Shkatulov, A.; Ryu, J.; Kato, Y.; Aristov, Y. Composite Material “ Mg(OH)2/Vermiculite”: A Promising New Candidate for Storage of Middle Temperature Heat. Energy 2012, 44, 1028–1034. [Google Scholar] [CrossRef]
- Li, S.; Liu, J.; Tan, T.; Nie, J.; Zhang, H. Optimization of LiNO3–Mg(OH)2 Composites as Thermo-Chemical Energy Storage Materials. J Environ Manage 2020, 262. [Google Scholar] [CrossRef]
- Shkatulov, A.; Krieger, T.; Zaikovskii, V.; Chesalov, Y.; Aristov, Y. Doping Magnesium Hydroxide with Sodium Nitrate: A New Approach to Tune the Dehydration Reactivity of Heat-Storage Materials. ACS Appl Mater Interfaces 2014, 6, 19966–19977. [Google Scholar] [CrossRef] [PubMed]
- Piperopoulos, E.; Fazio, M.; Mastronardo, E.; Lanza, M.; Milone, C. Tuning Mg(OH)2 Structural, Physical, and Morphological Characteristics for Its Optimal Behavior in a Thermochemical Heat-Storage Application. Materials 2021, 14, 1–19. [Google Scholar] [CrossRef] [PubMed]
- Albeladi, N.; Kur, A.; Mokaya, R.; Darkwa, J.; Roger-Lund, S.; Worall, M.; Calautit, J.; Boukhanouf, R. Synthesis and Characterization of Doped Magnesium Hydroxide for Medium Heat Storage Application. Materials 2023, 16. [Google Scholar] [CrossRef] [PubMed]
Figure 1.
Powder XRD patterns of pure Ca(OH)2 and (a) BN, (b) KNO3-doped composites. .
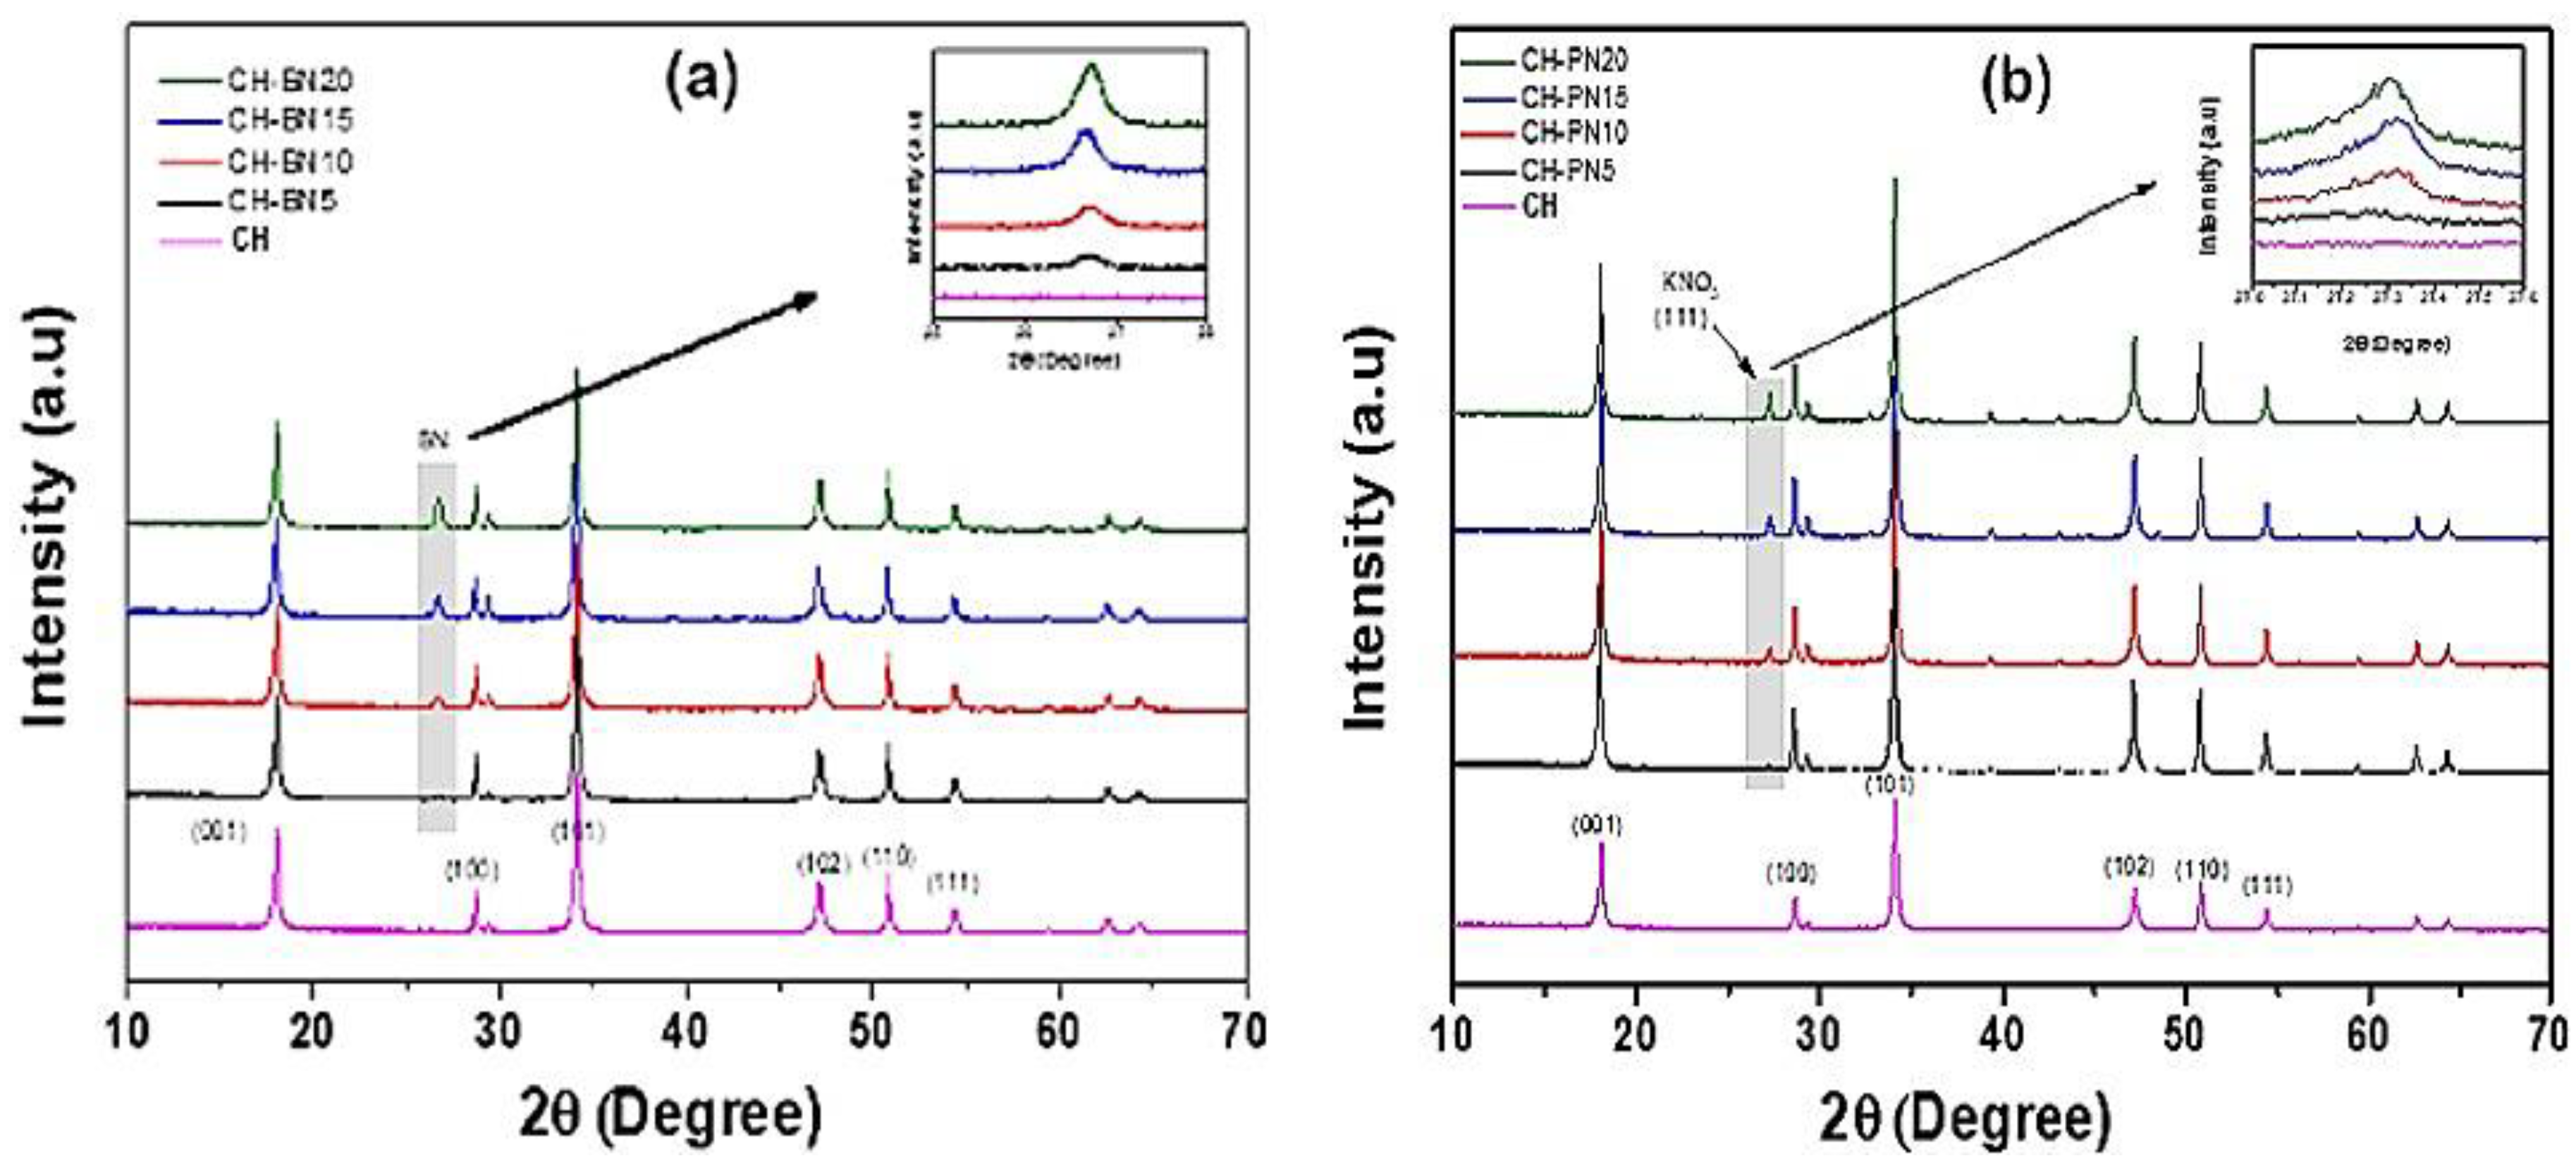
Figure 2.
Powder XRD patterns of pure Mg(OH)2 and (a) BN, (b) KNO3-doped composites.
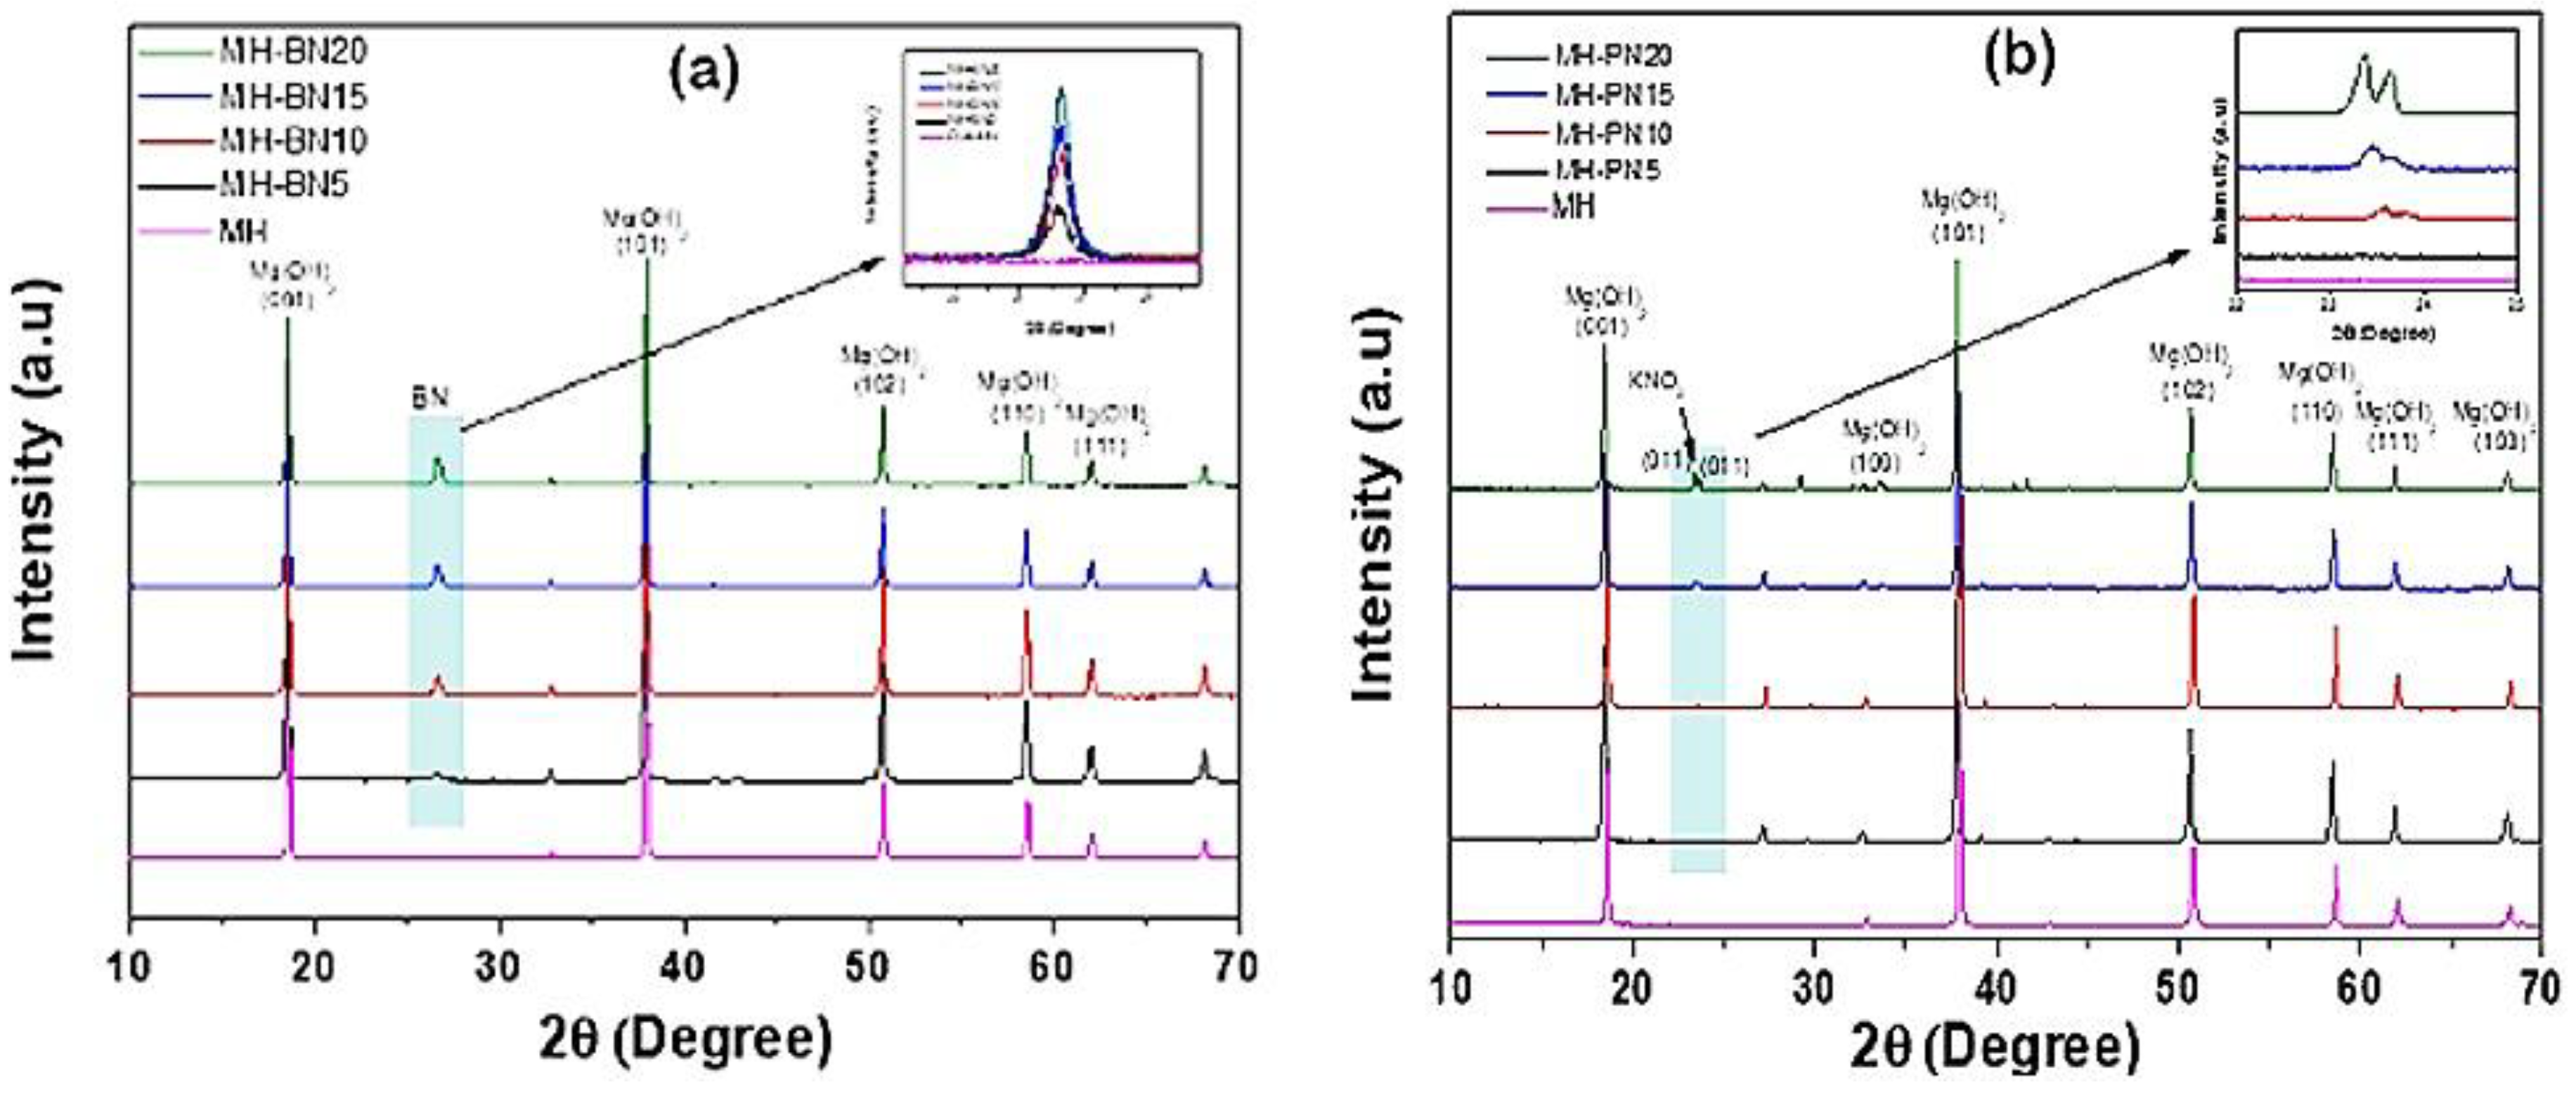
Figure 3.
Nitrogen sorption isotherms of pure Ca(OH)2 and (a) BN, (b) KNO3-doped composites.
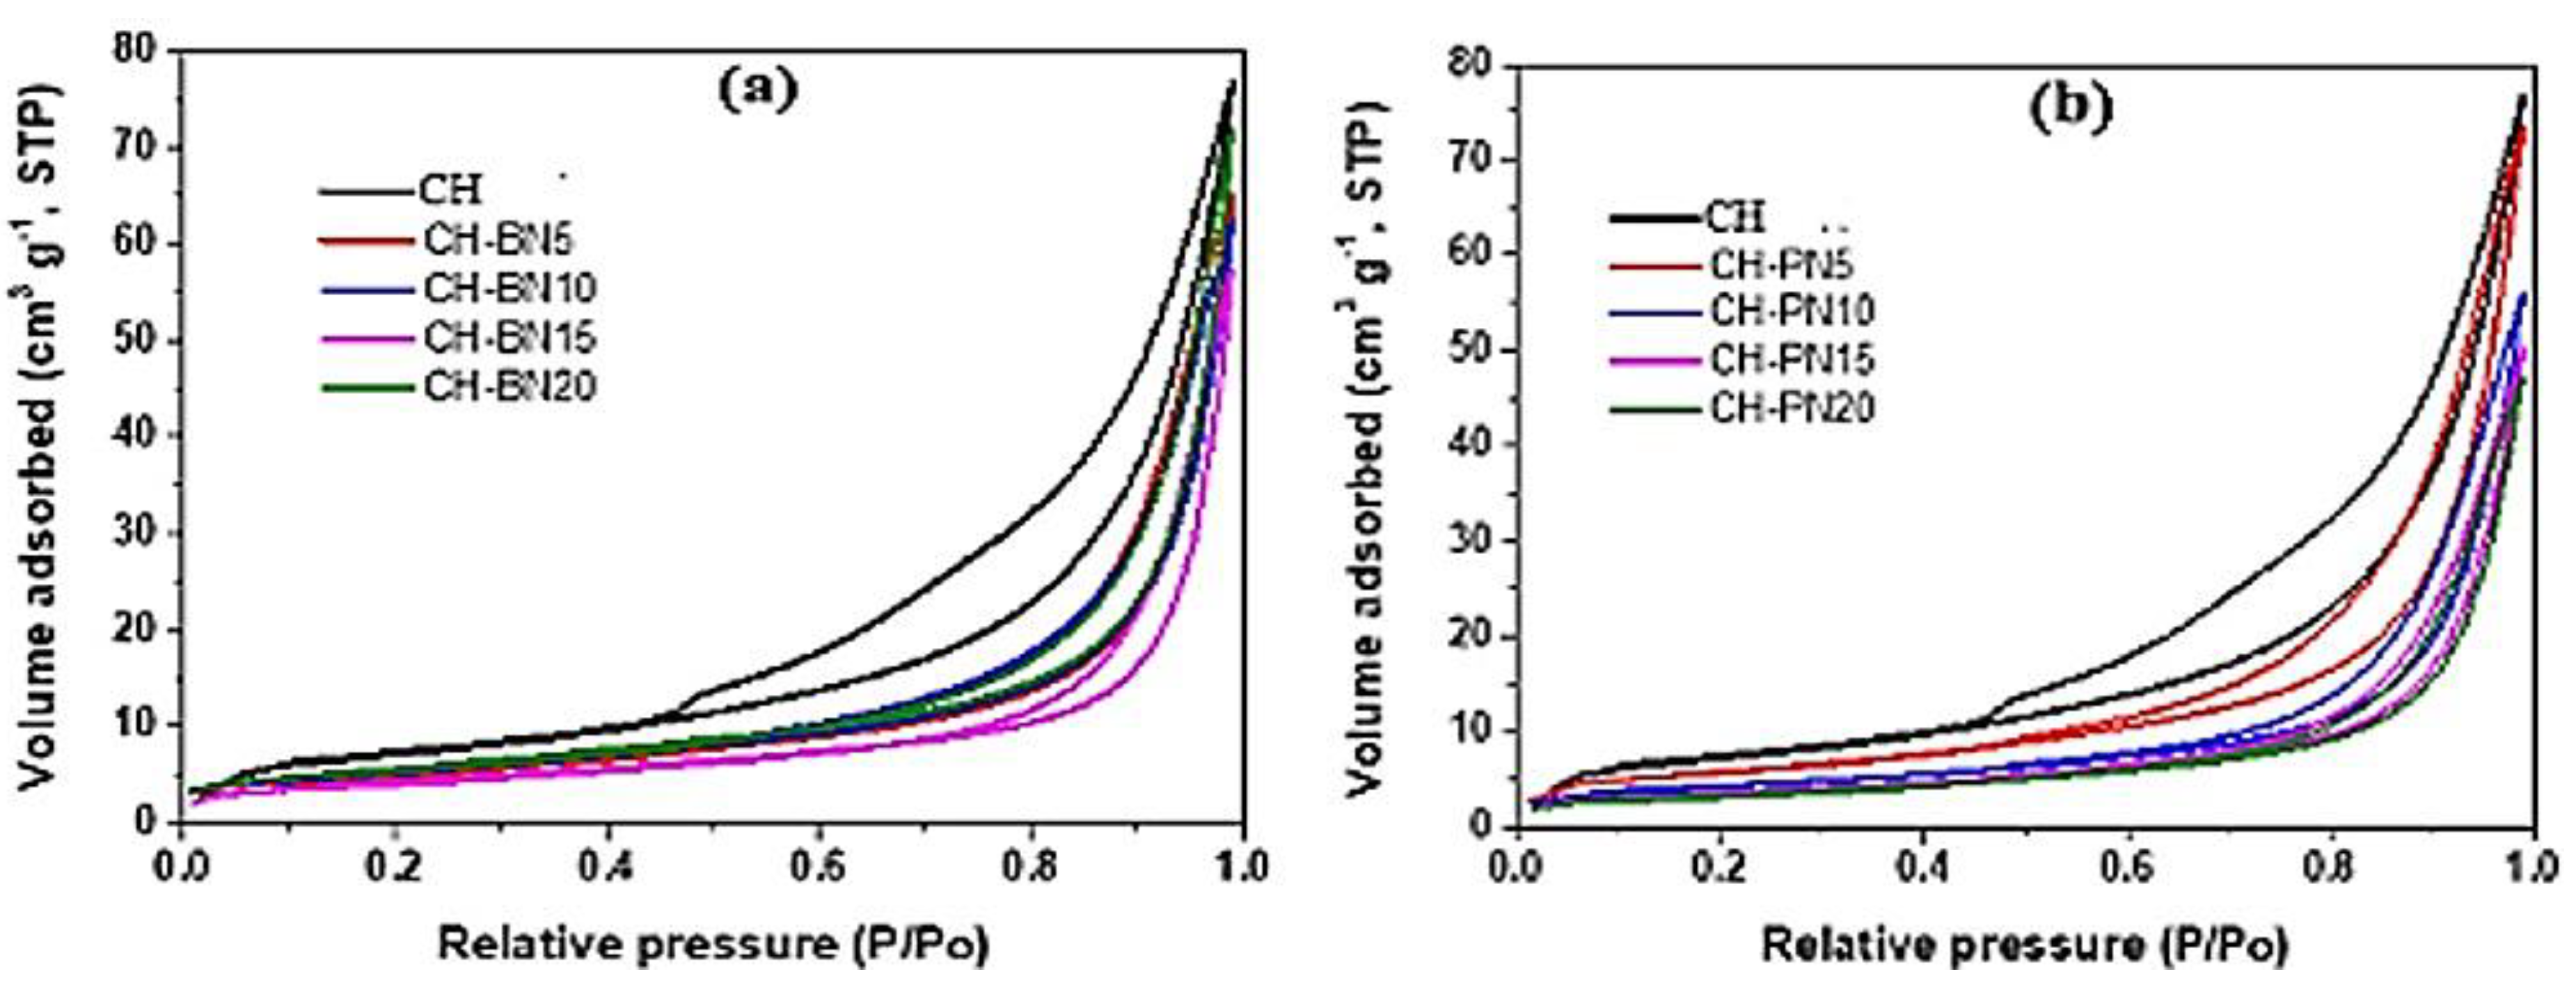
Figure 4.
Nitrogen sorption isotherms of pure Mg(OH)2 and (a) BN, (b) KNO3-doped composites.
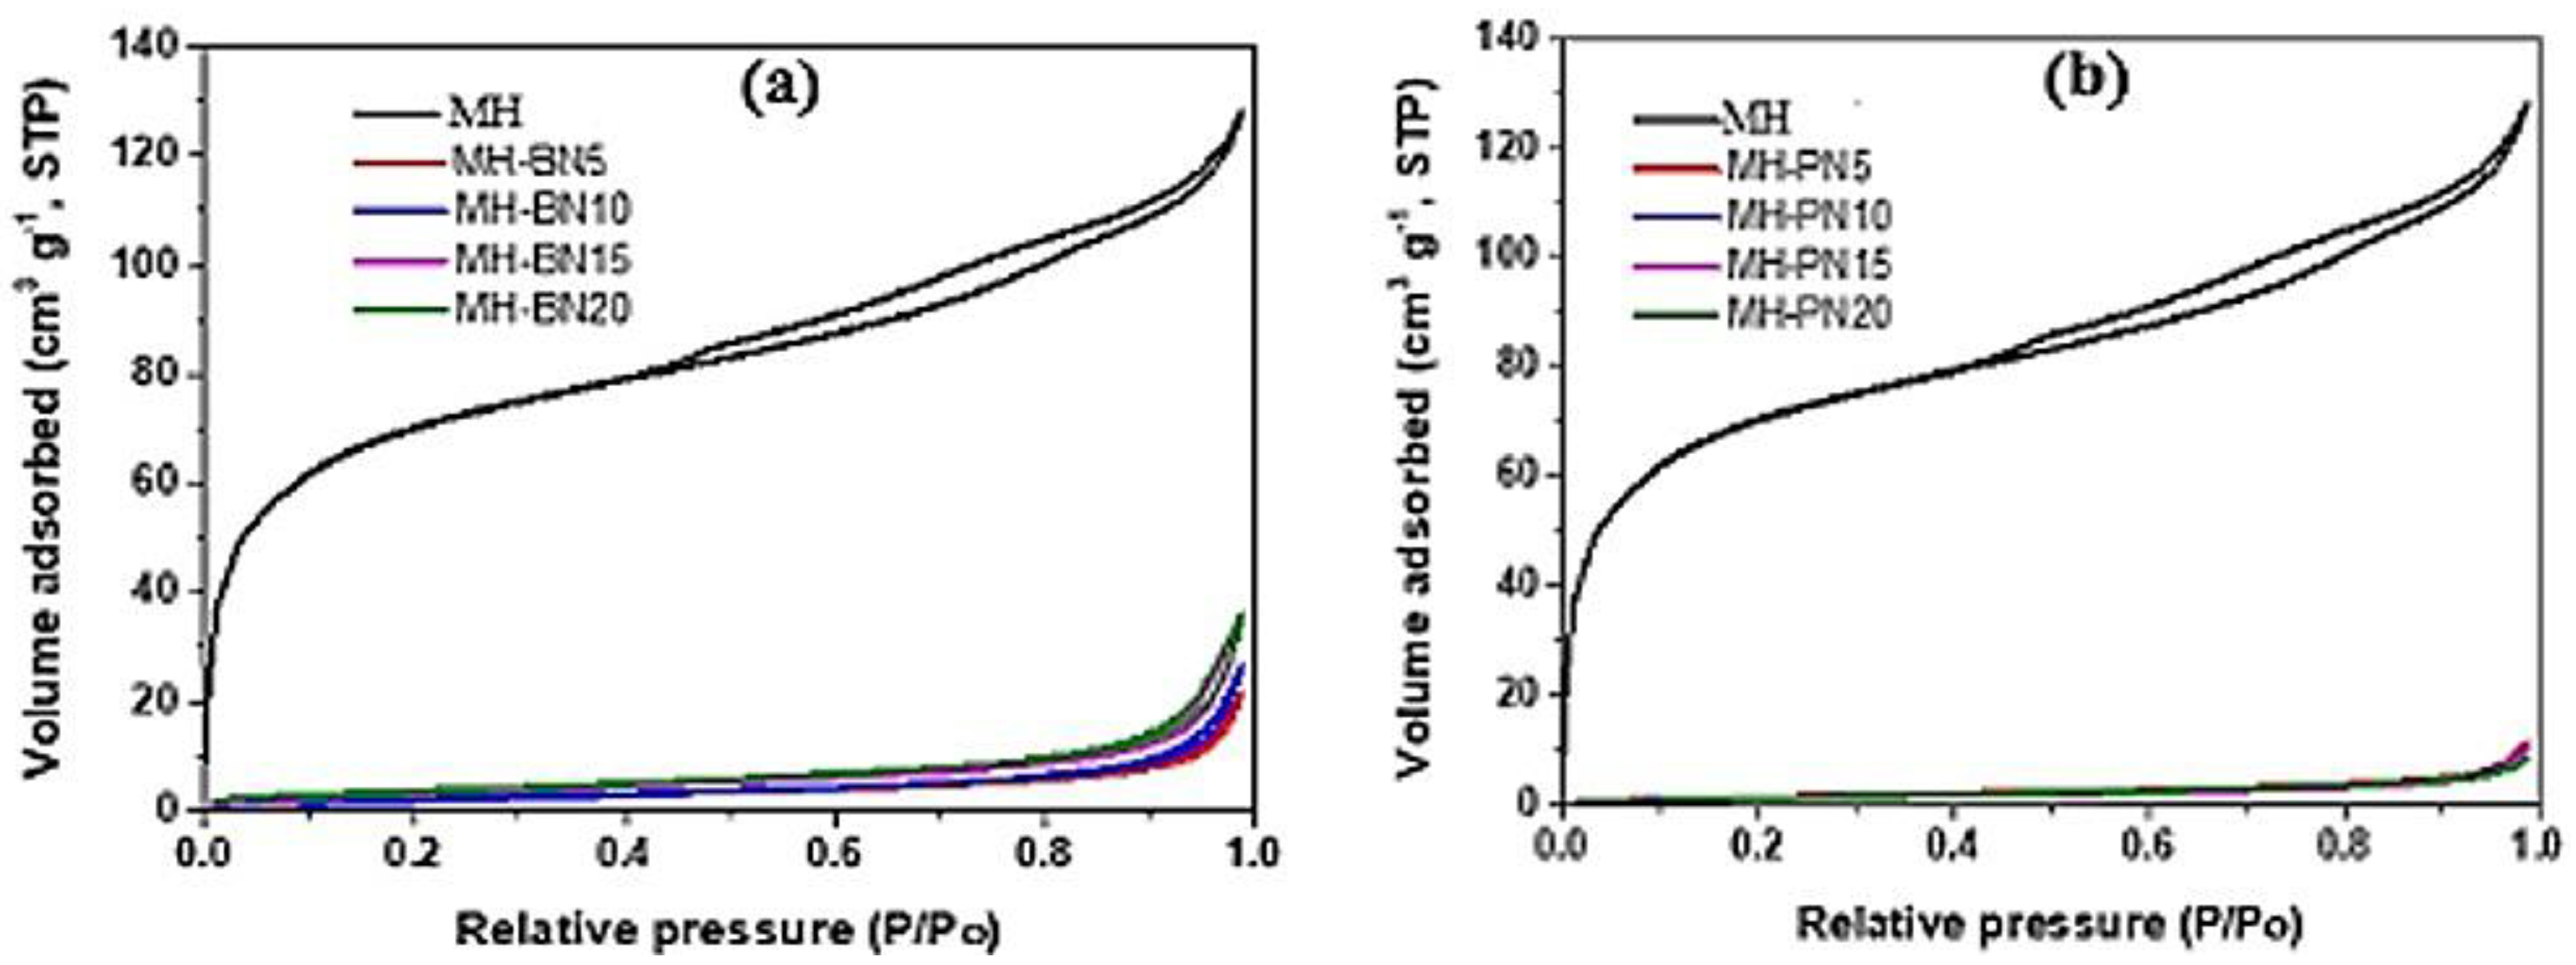
Figure 5.
Comparison of PSD of (a) pure Ca(OH)2, (b) pure Mg(OH)2, and 5 wt% doped composites.
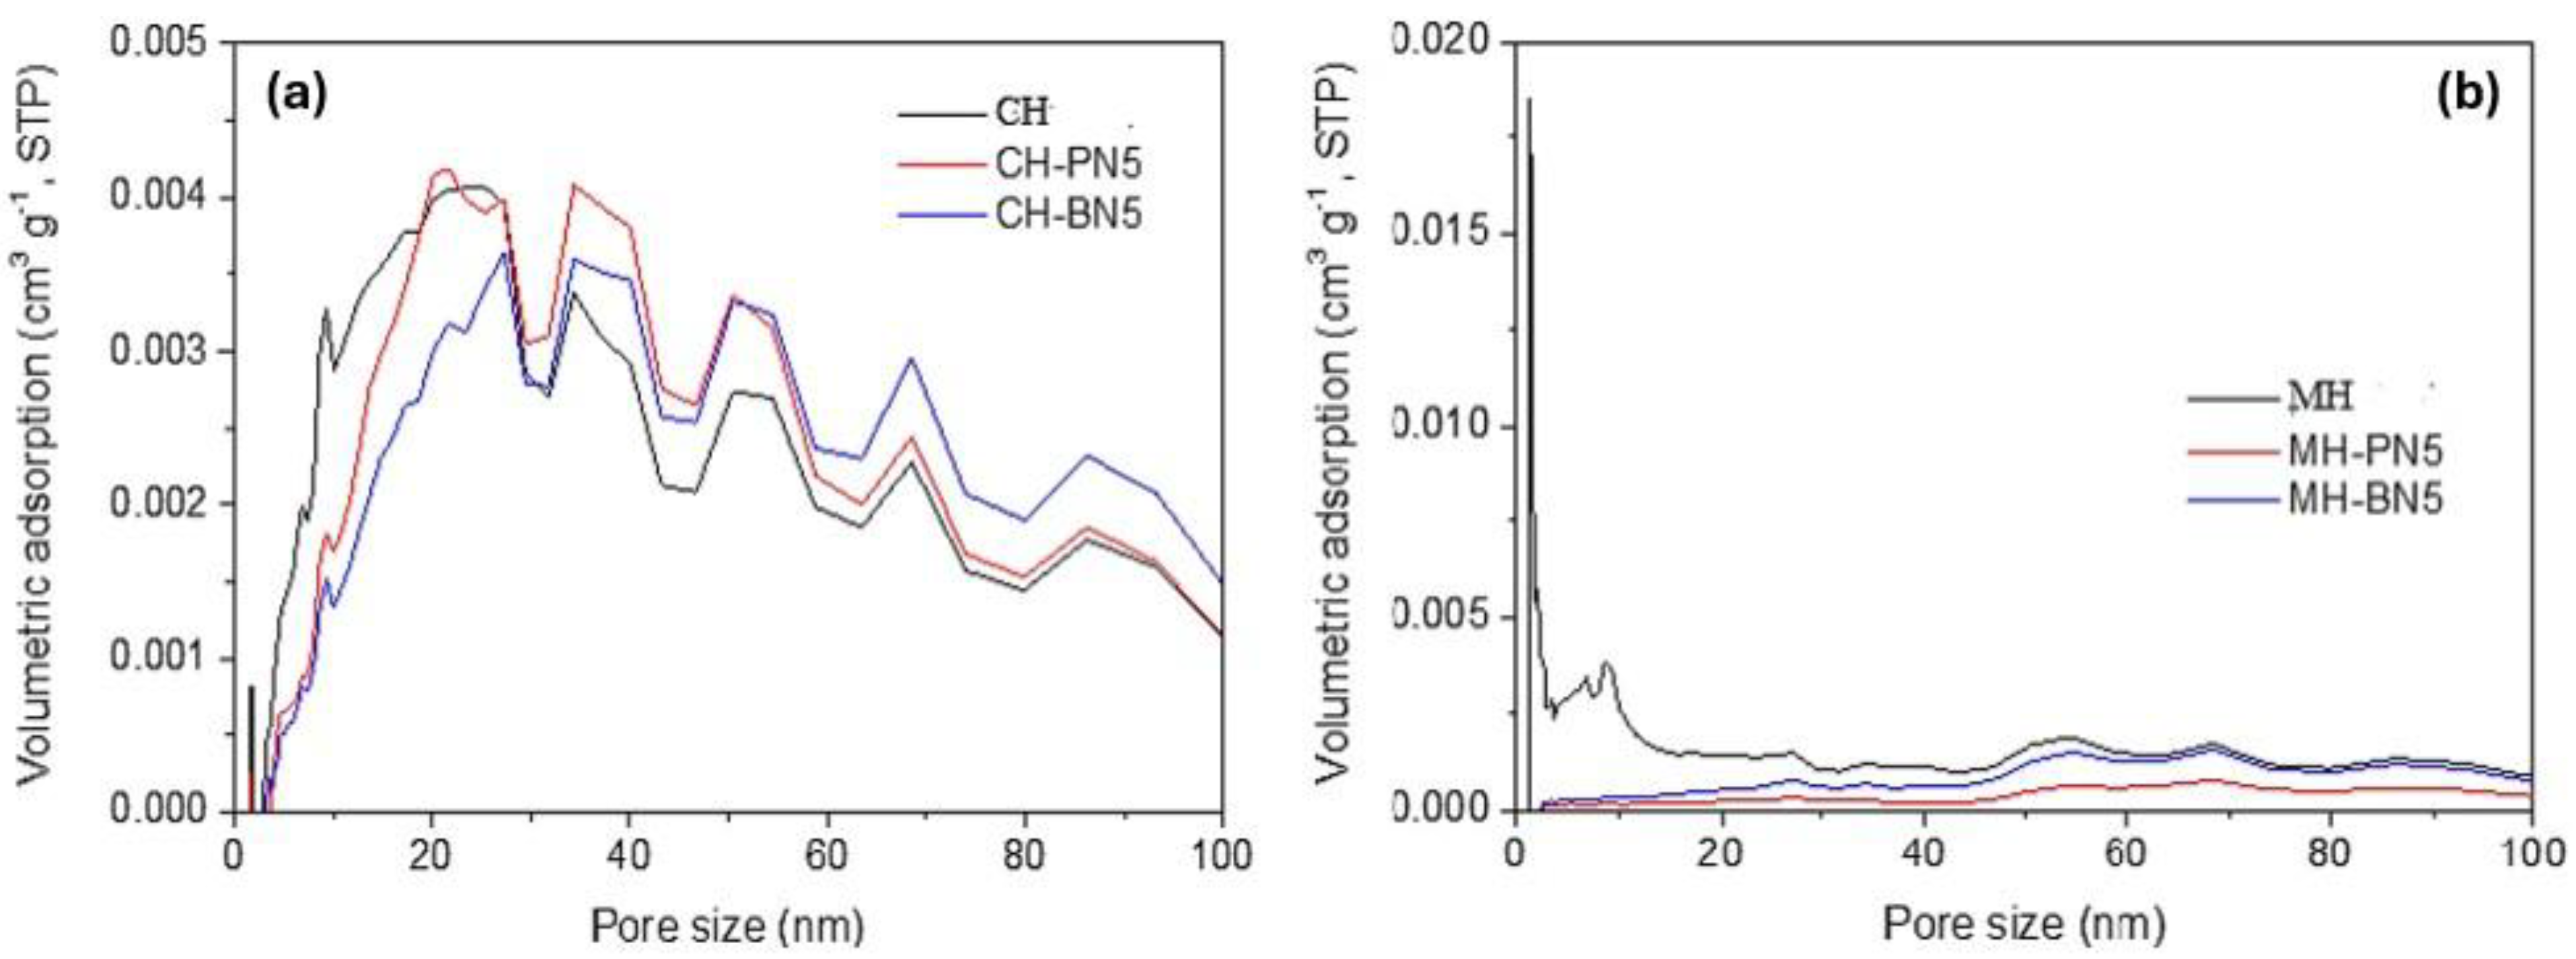
Figure 6.
SEM image of pure Ca(OH)2 showing massive oval-shaped grains.
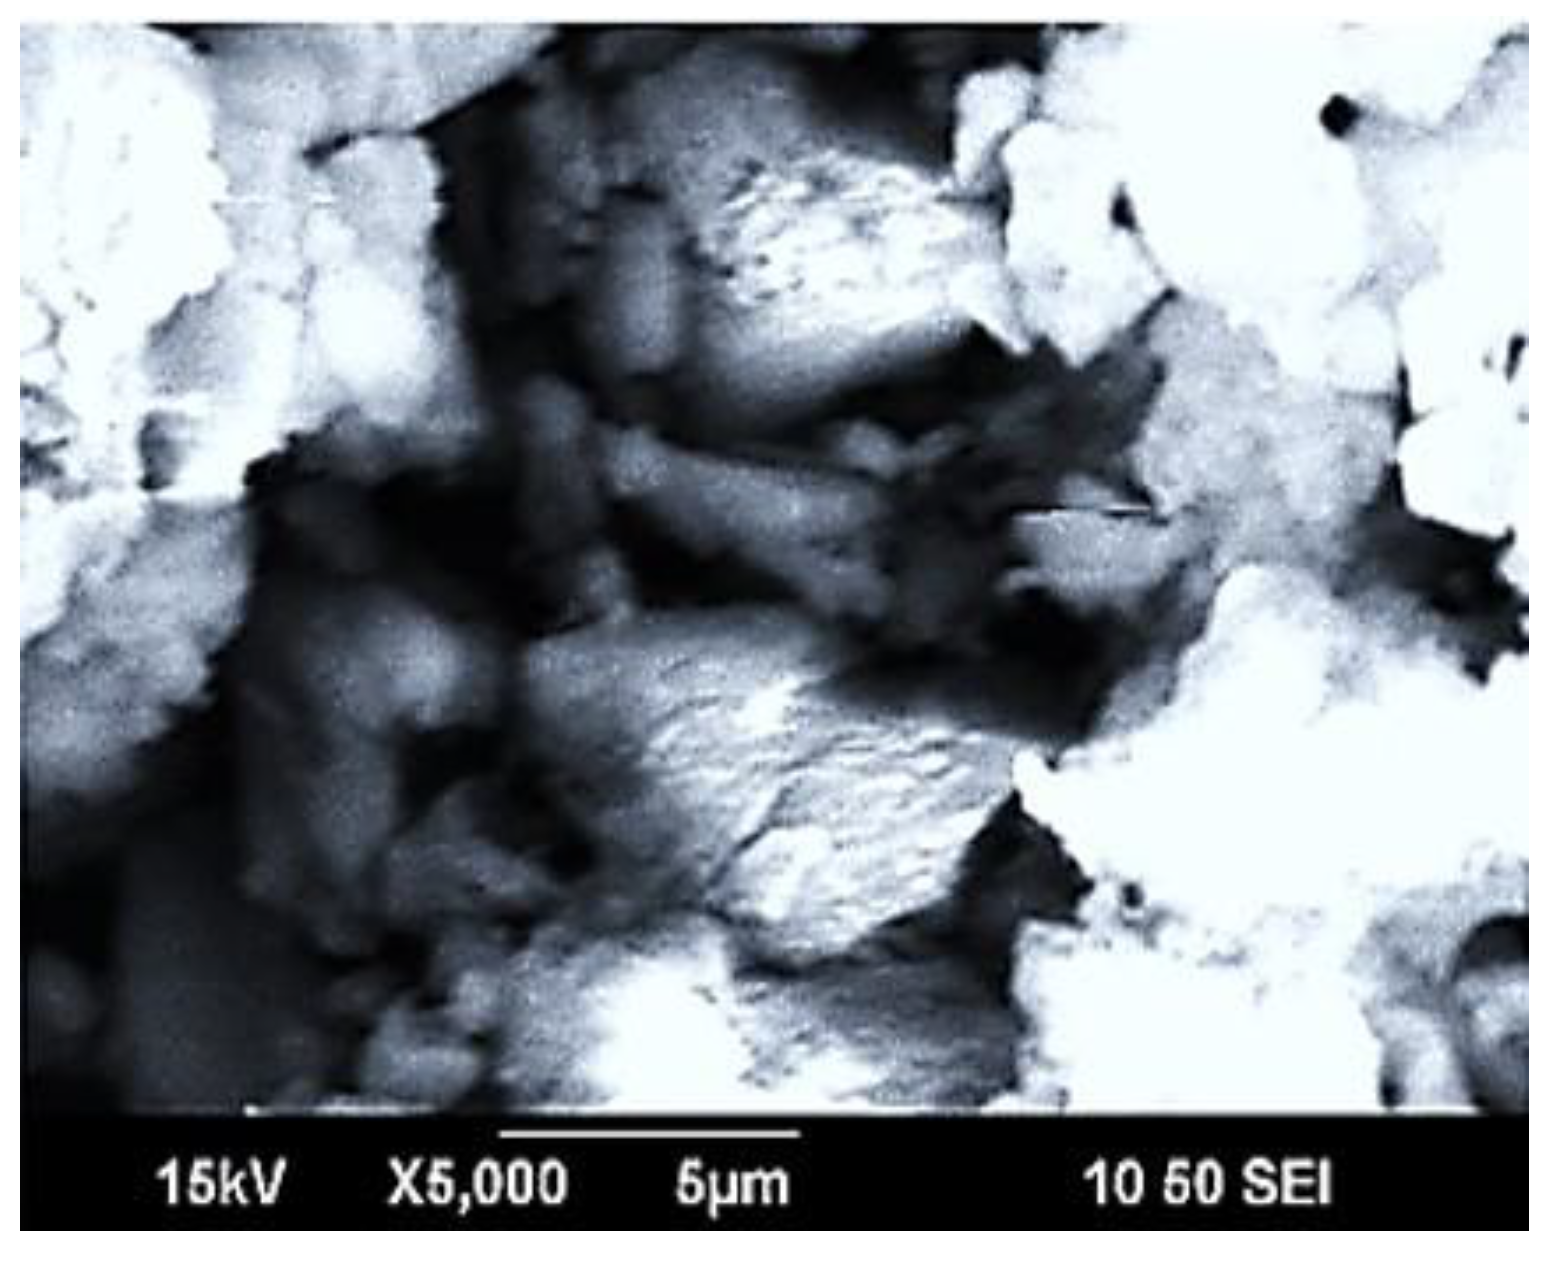
Figure 7.
SEM images of (a) 5% (b) 10% (c) 15% and (d) 20% BN addition to Ca(OH)2.
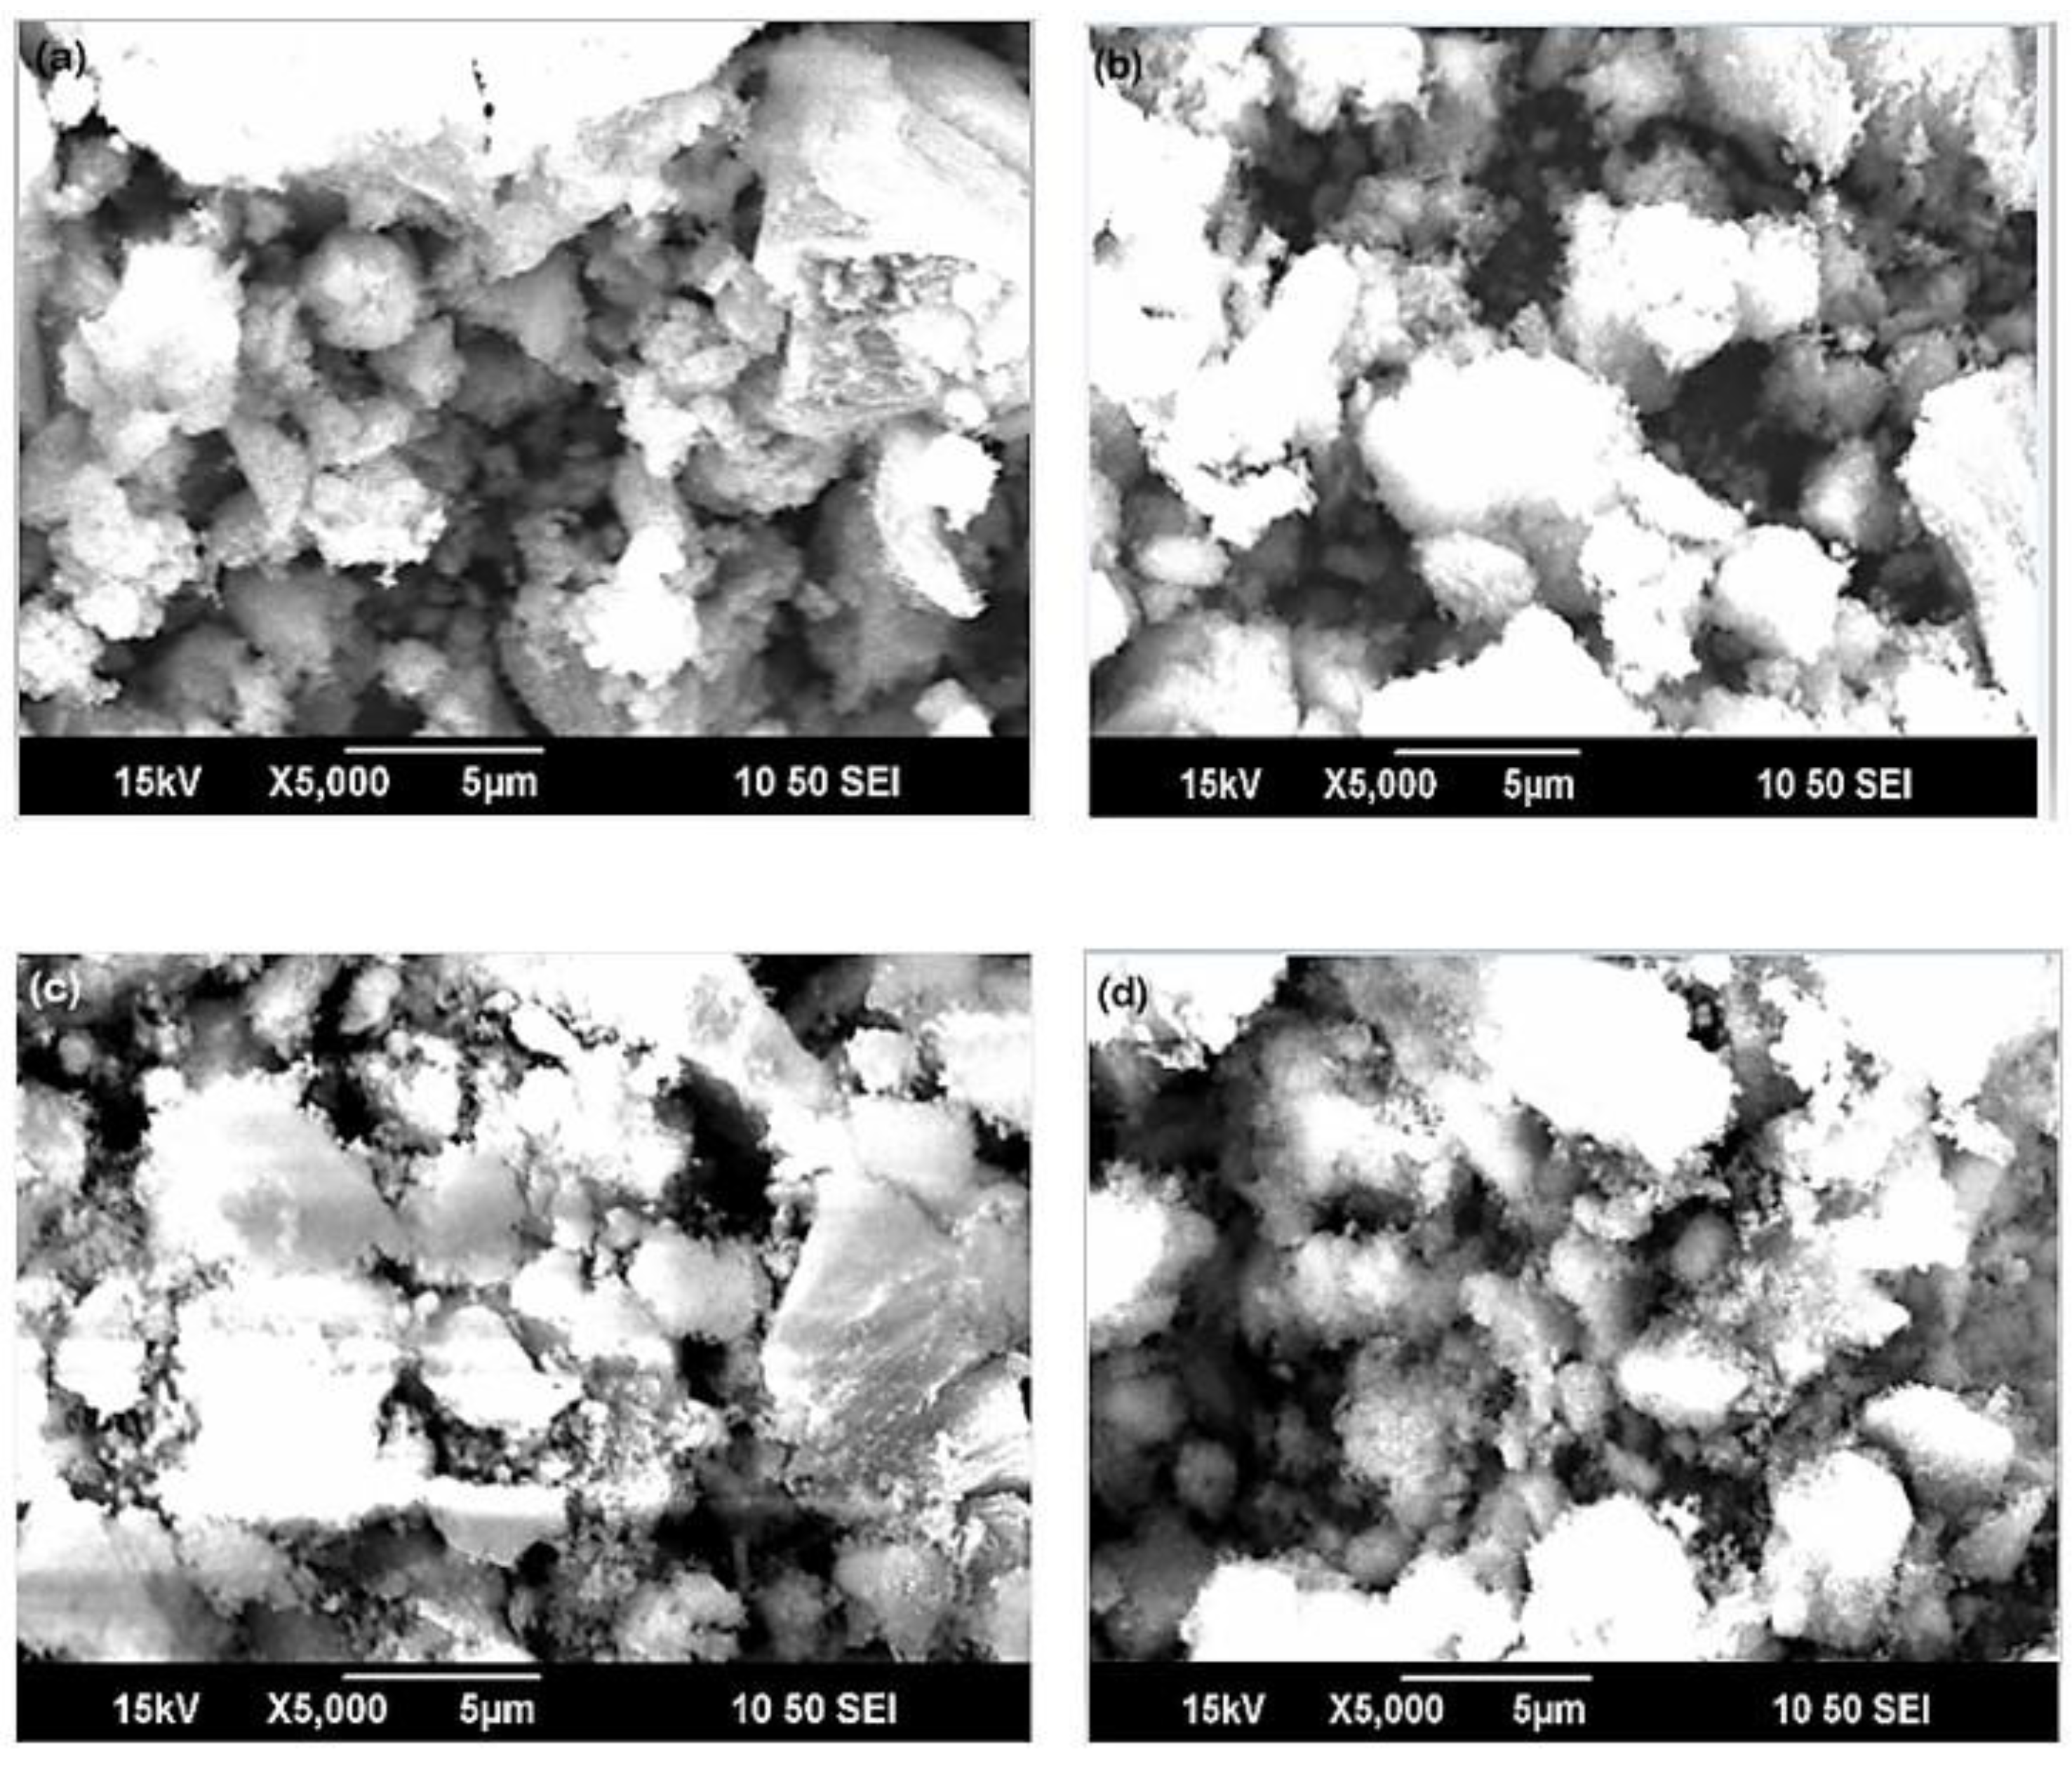
Figure 8.
SEM images of (a) 5% (b) 10% (c) 15% and (d) 20% KNO3 addition to Ca(OH)2. .
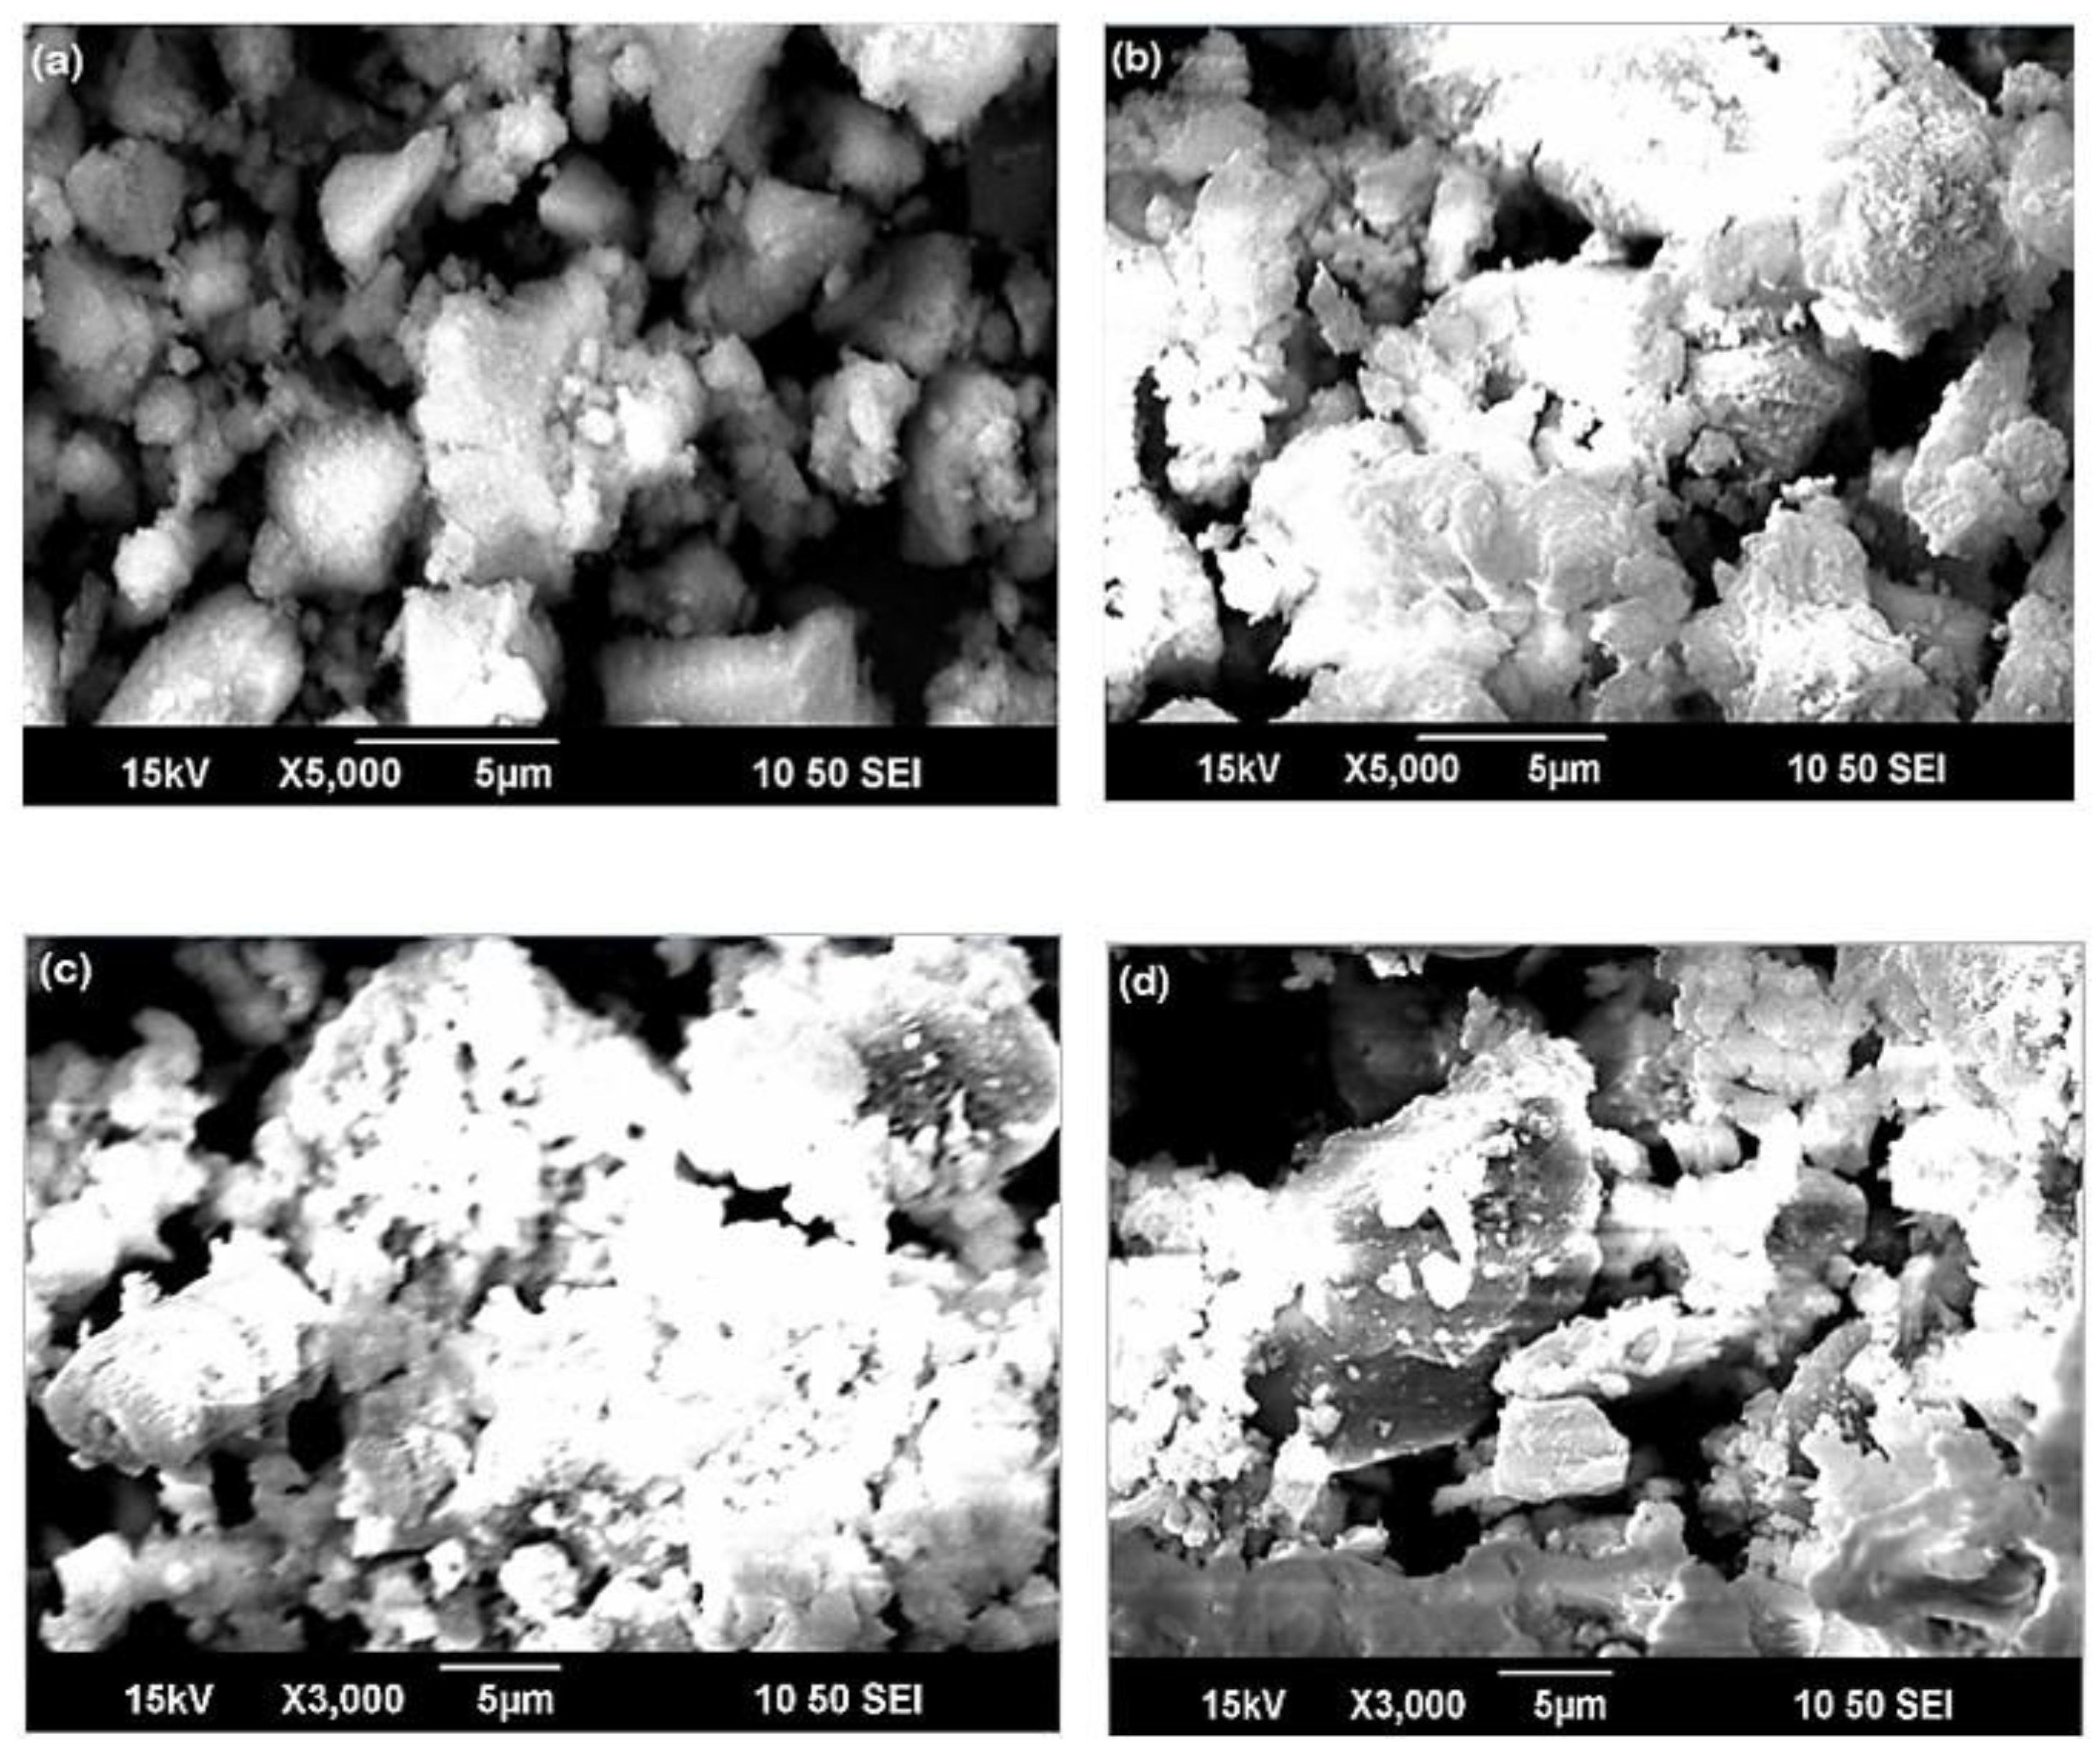
Figure 9.
SEM image of pure Mg(OH)2 showing a spongy texture.
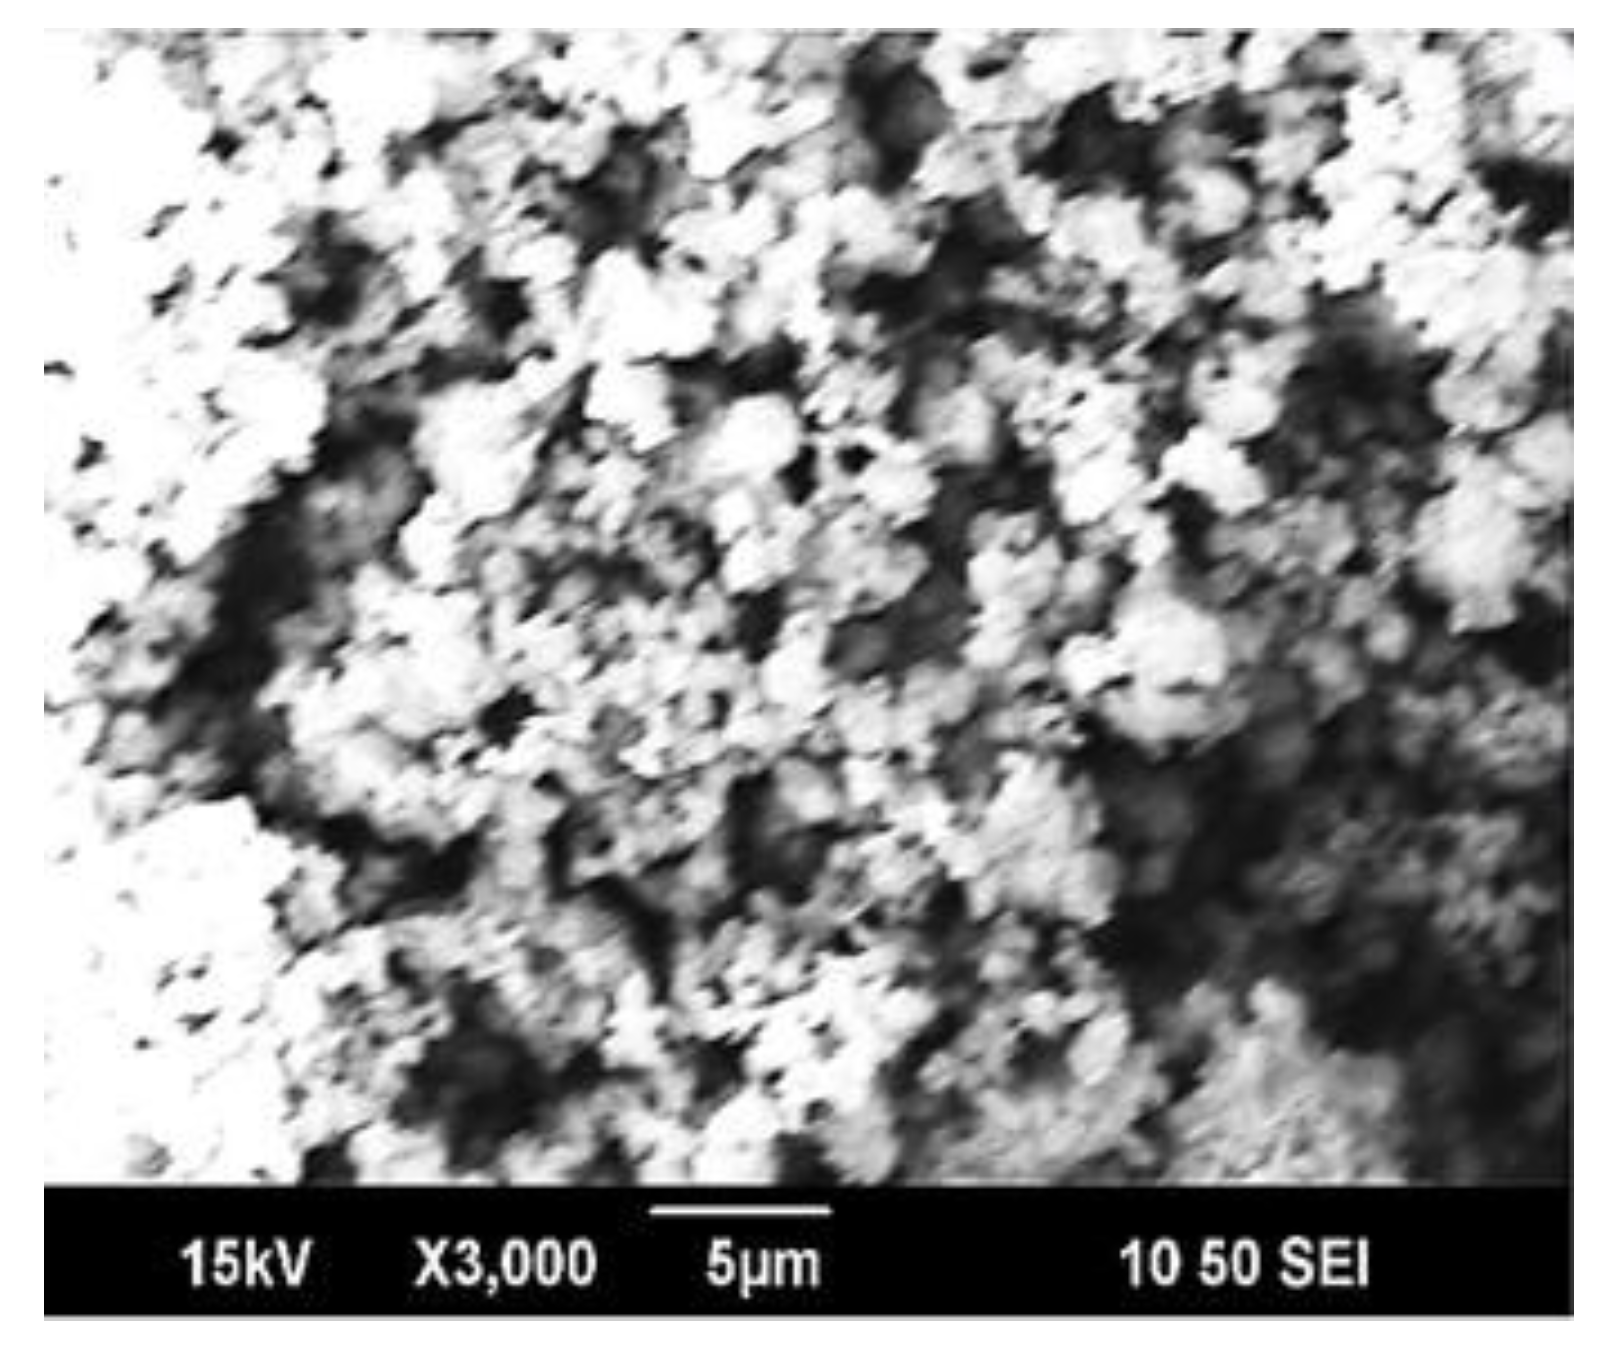
Figure 10.
SEM images of (a) 5% (b) 10% (c) 15% and (d) 20% BN addition to Mg(OH)2.
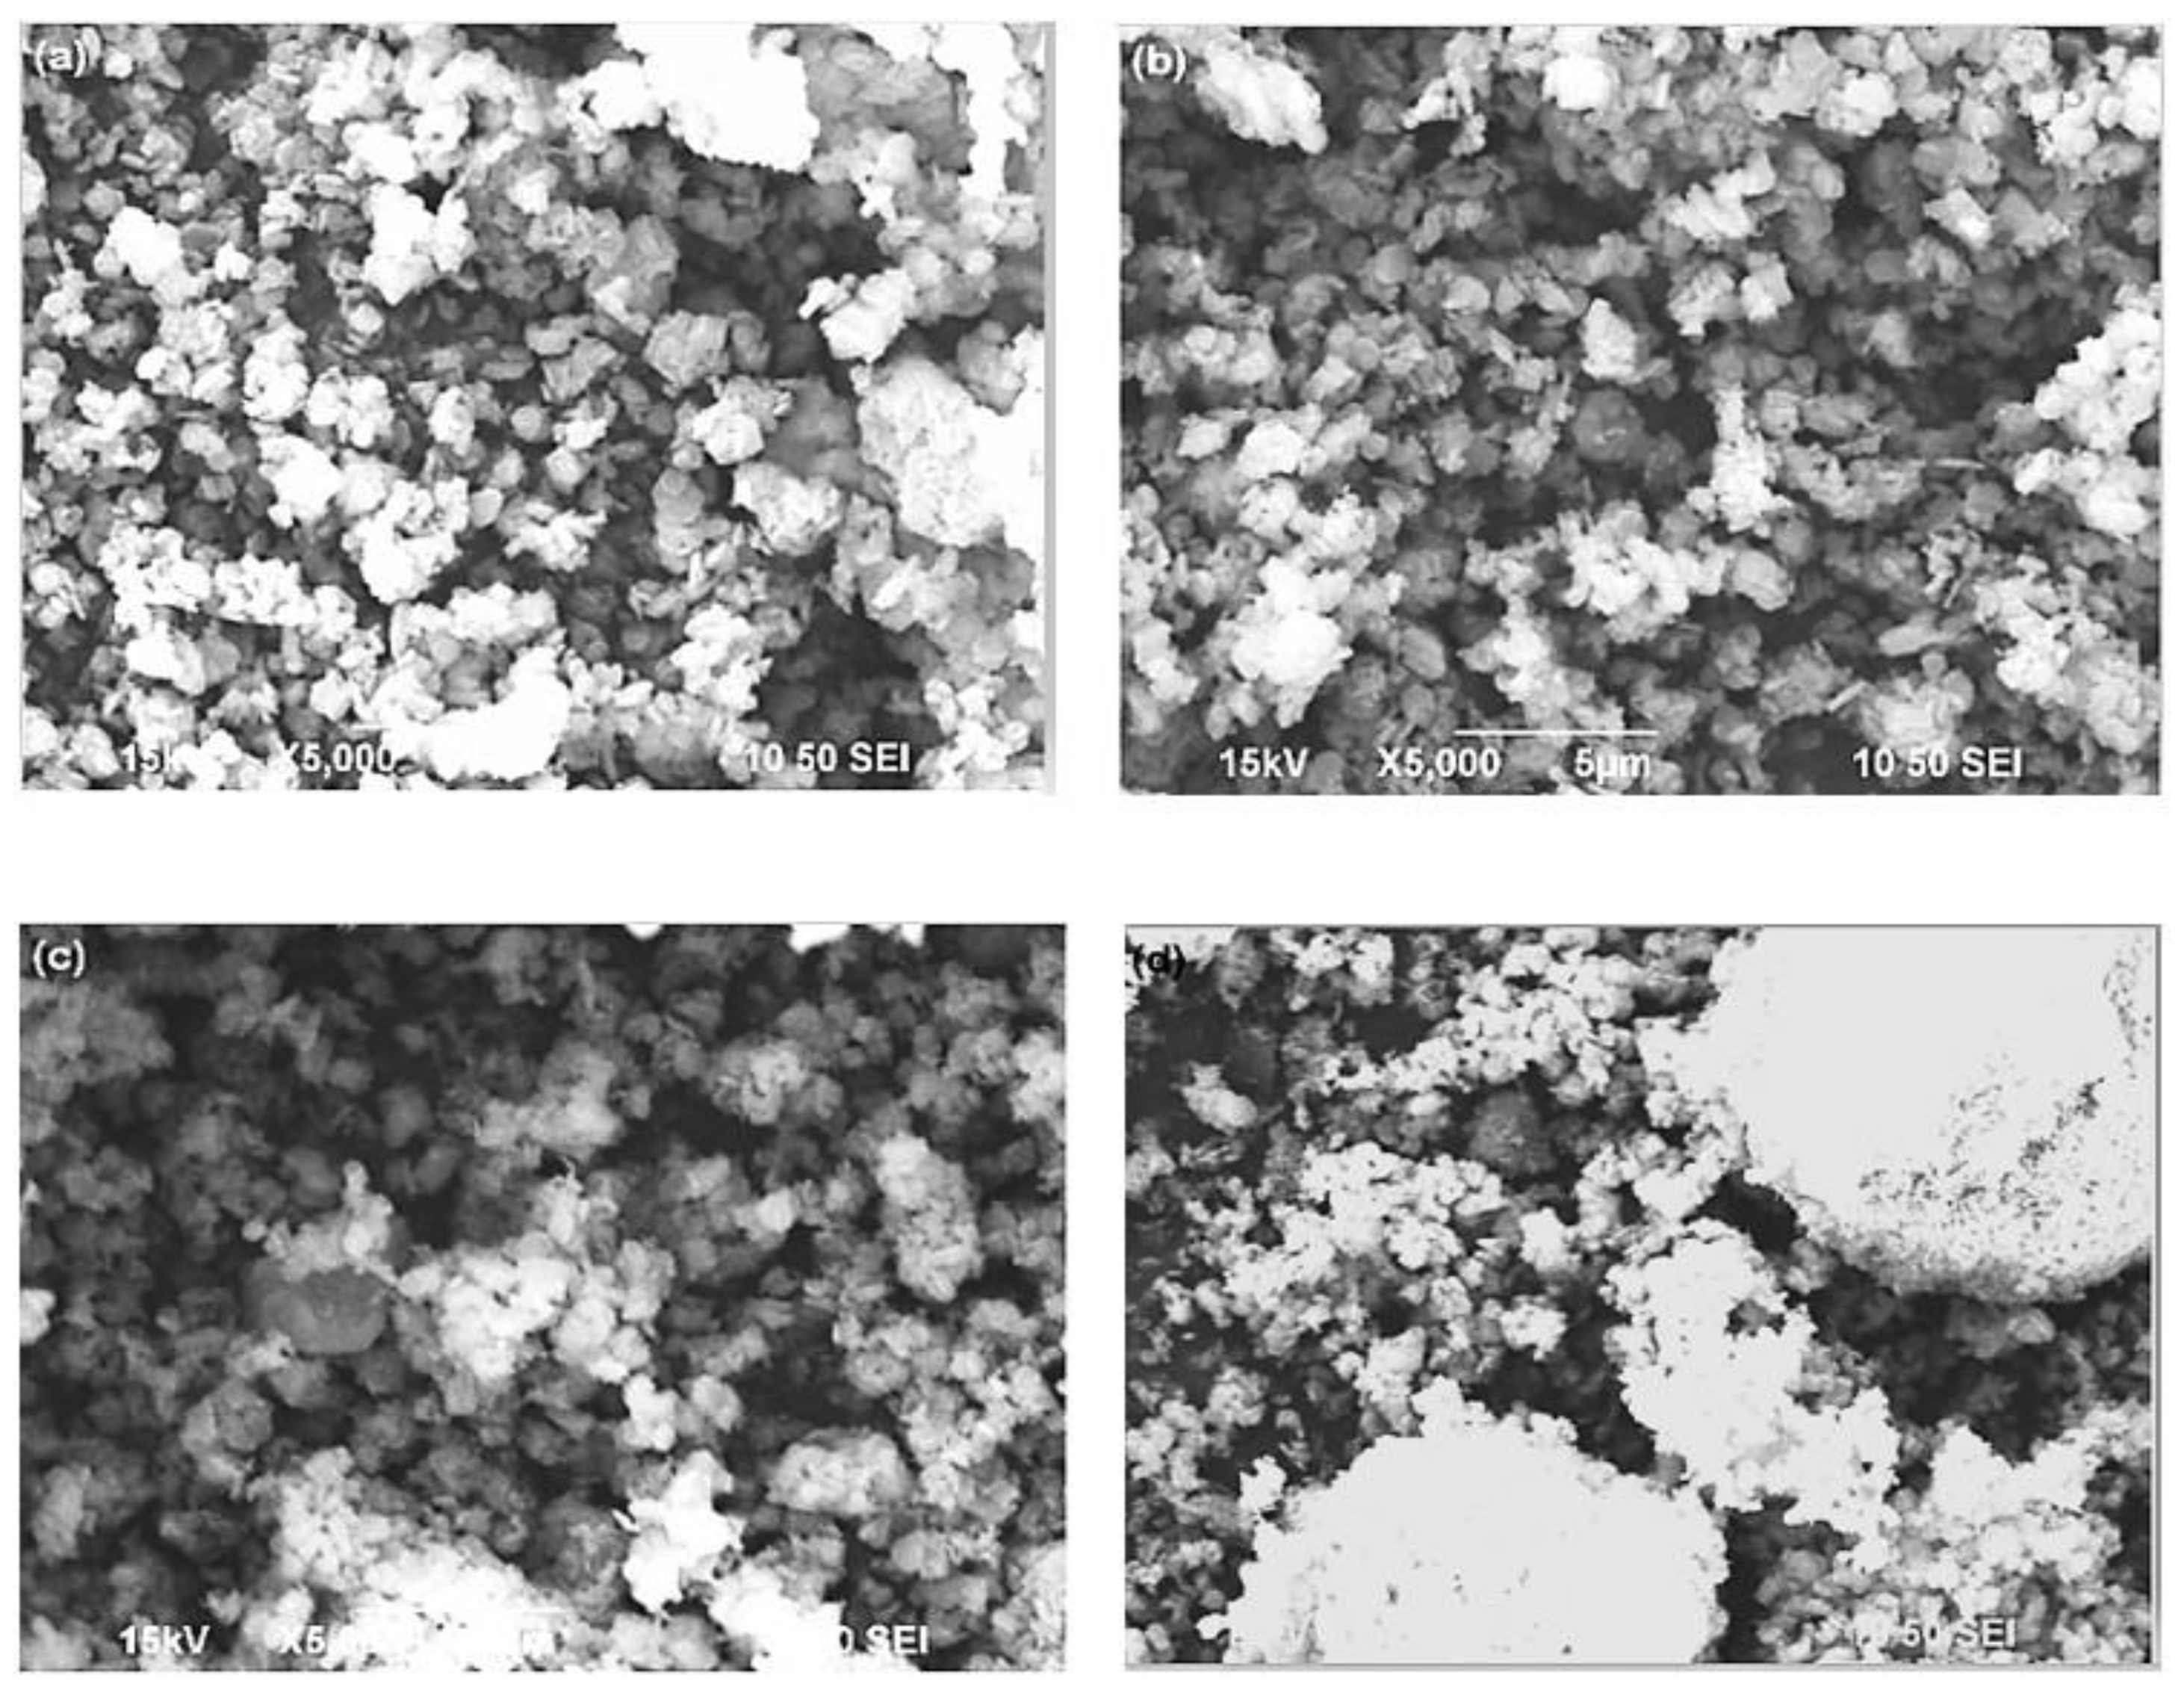
Figure 11.
SEM images of (a) 5% (b) 10% (c) 15% and (d) 20% KNO3 addition to Mg(OH)2.
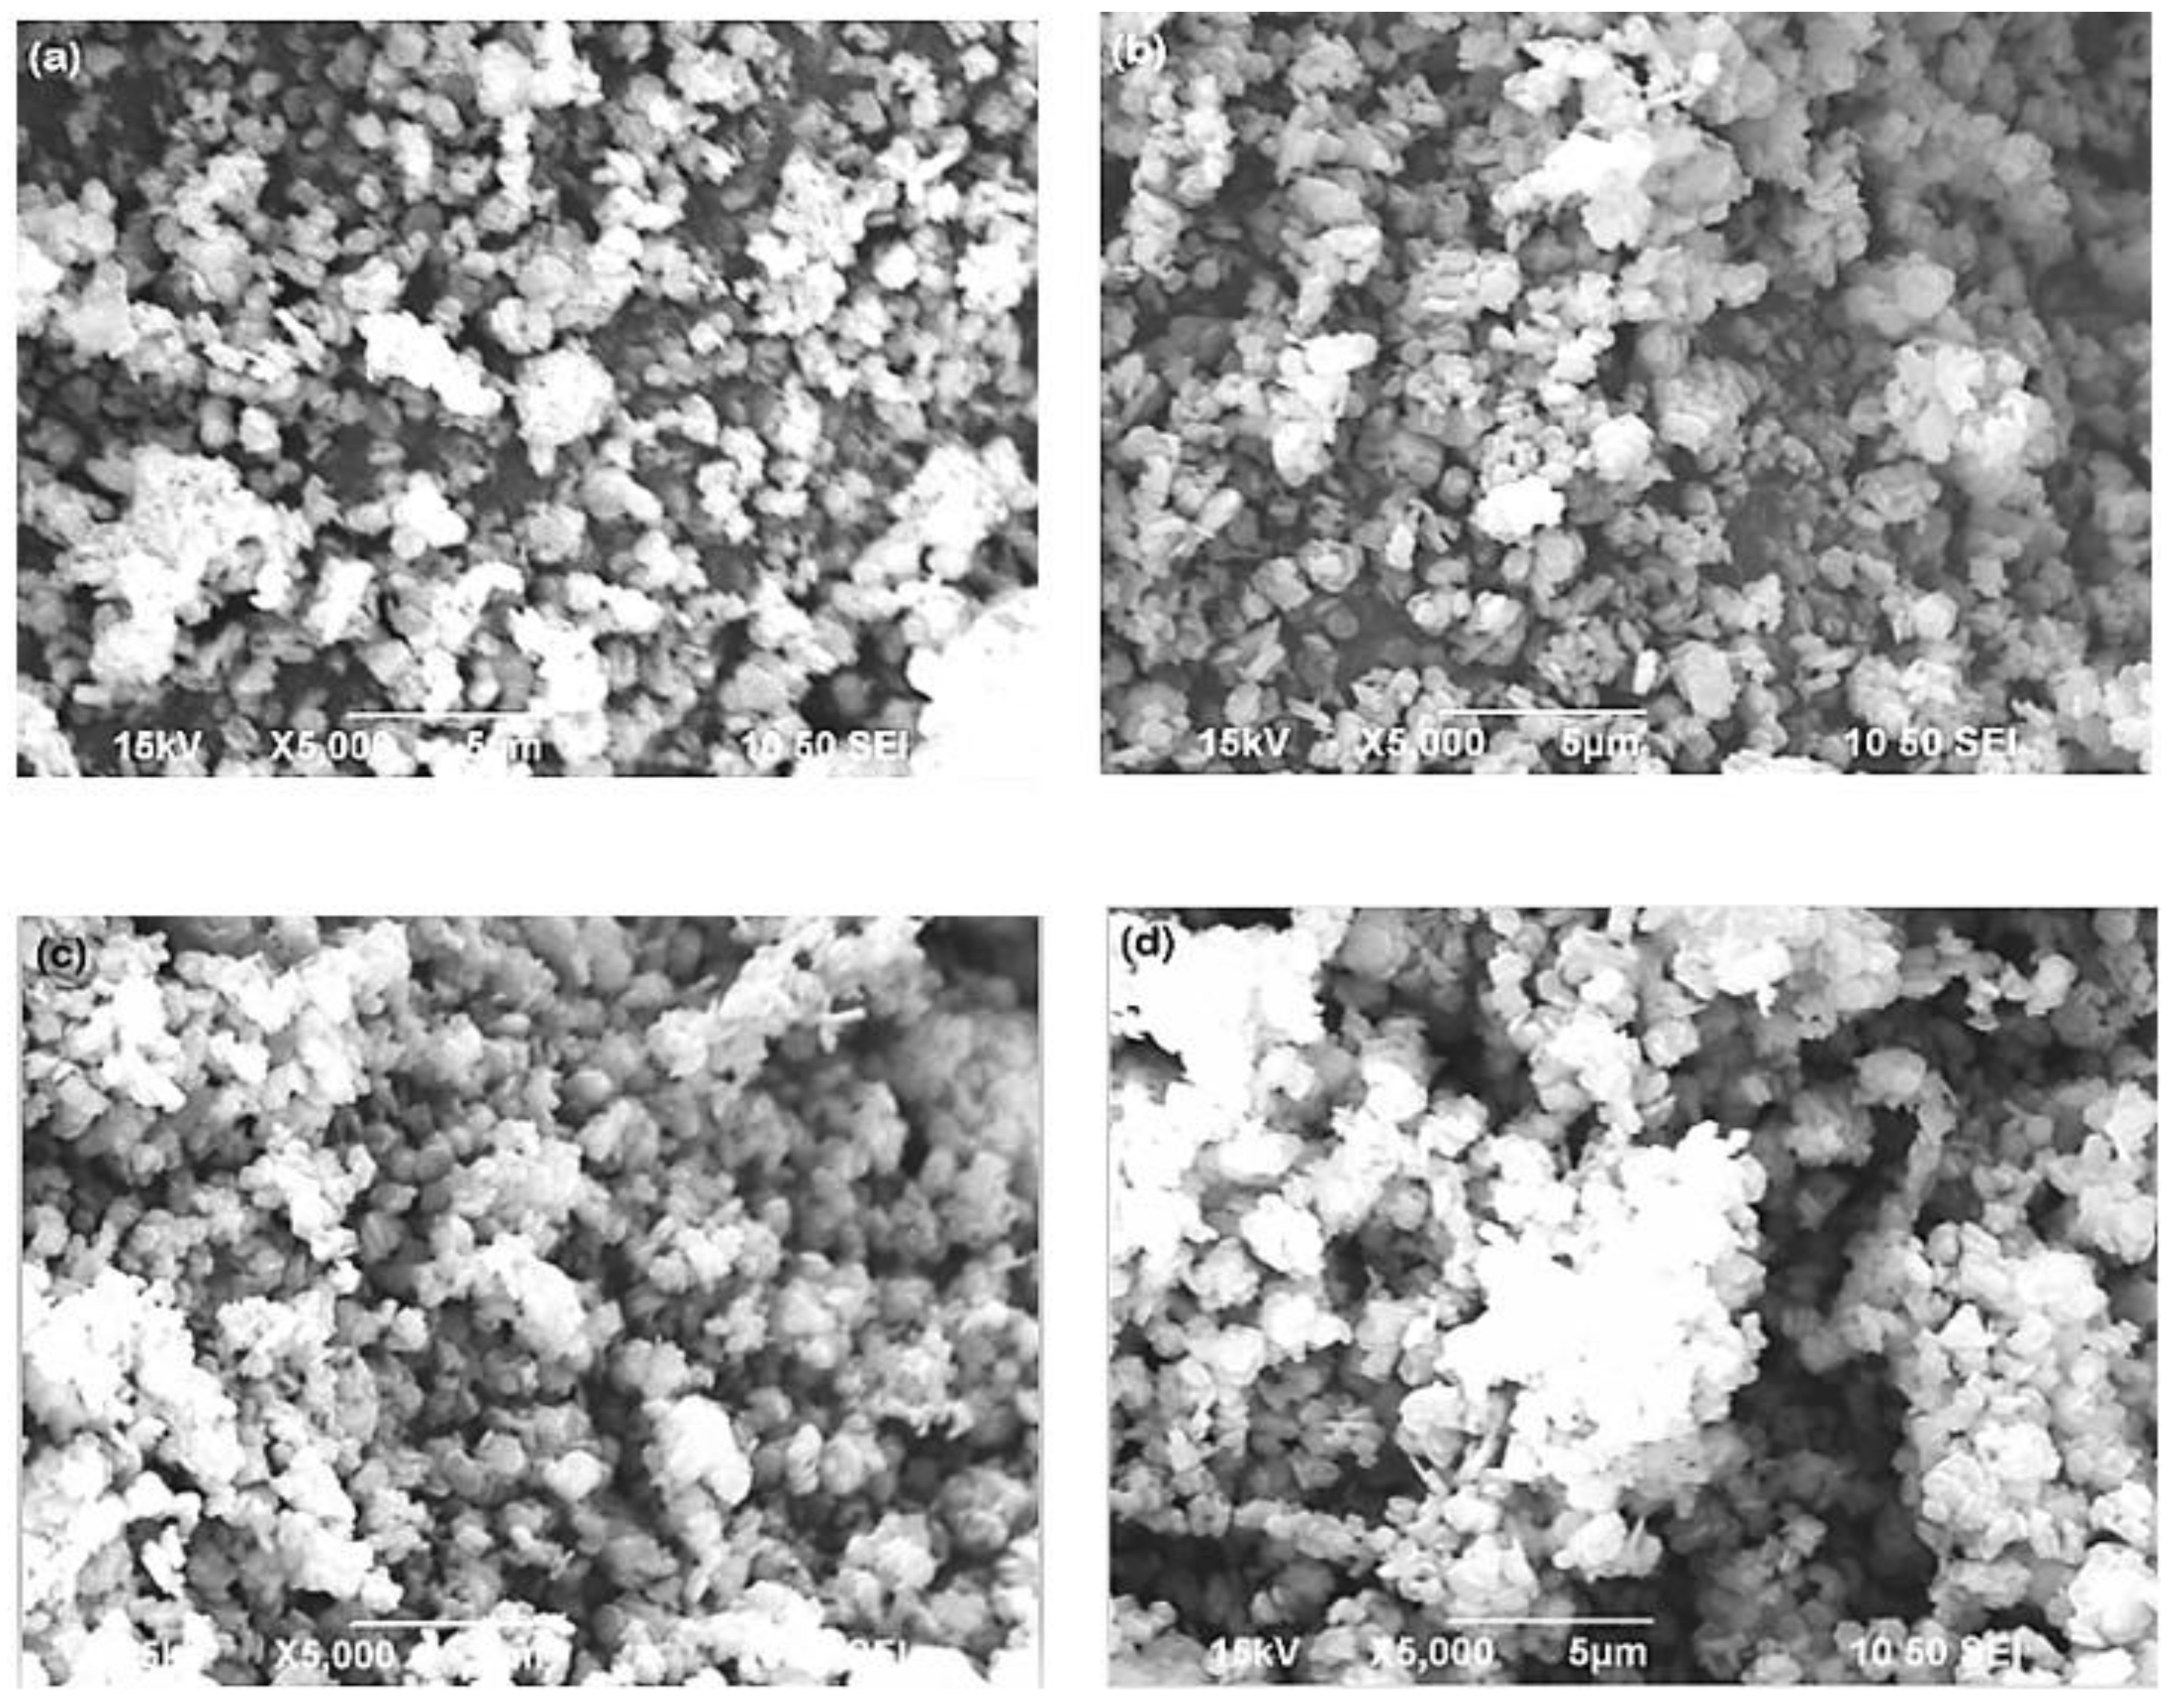
Figure 12.
DSC curves of pure Ca(OH)2 and its composites.
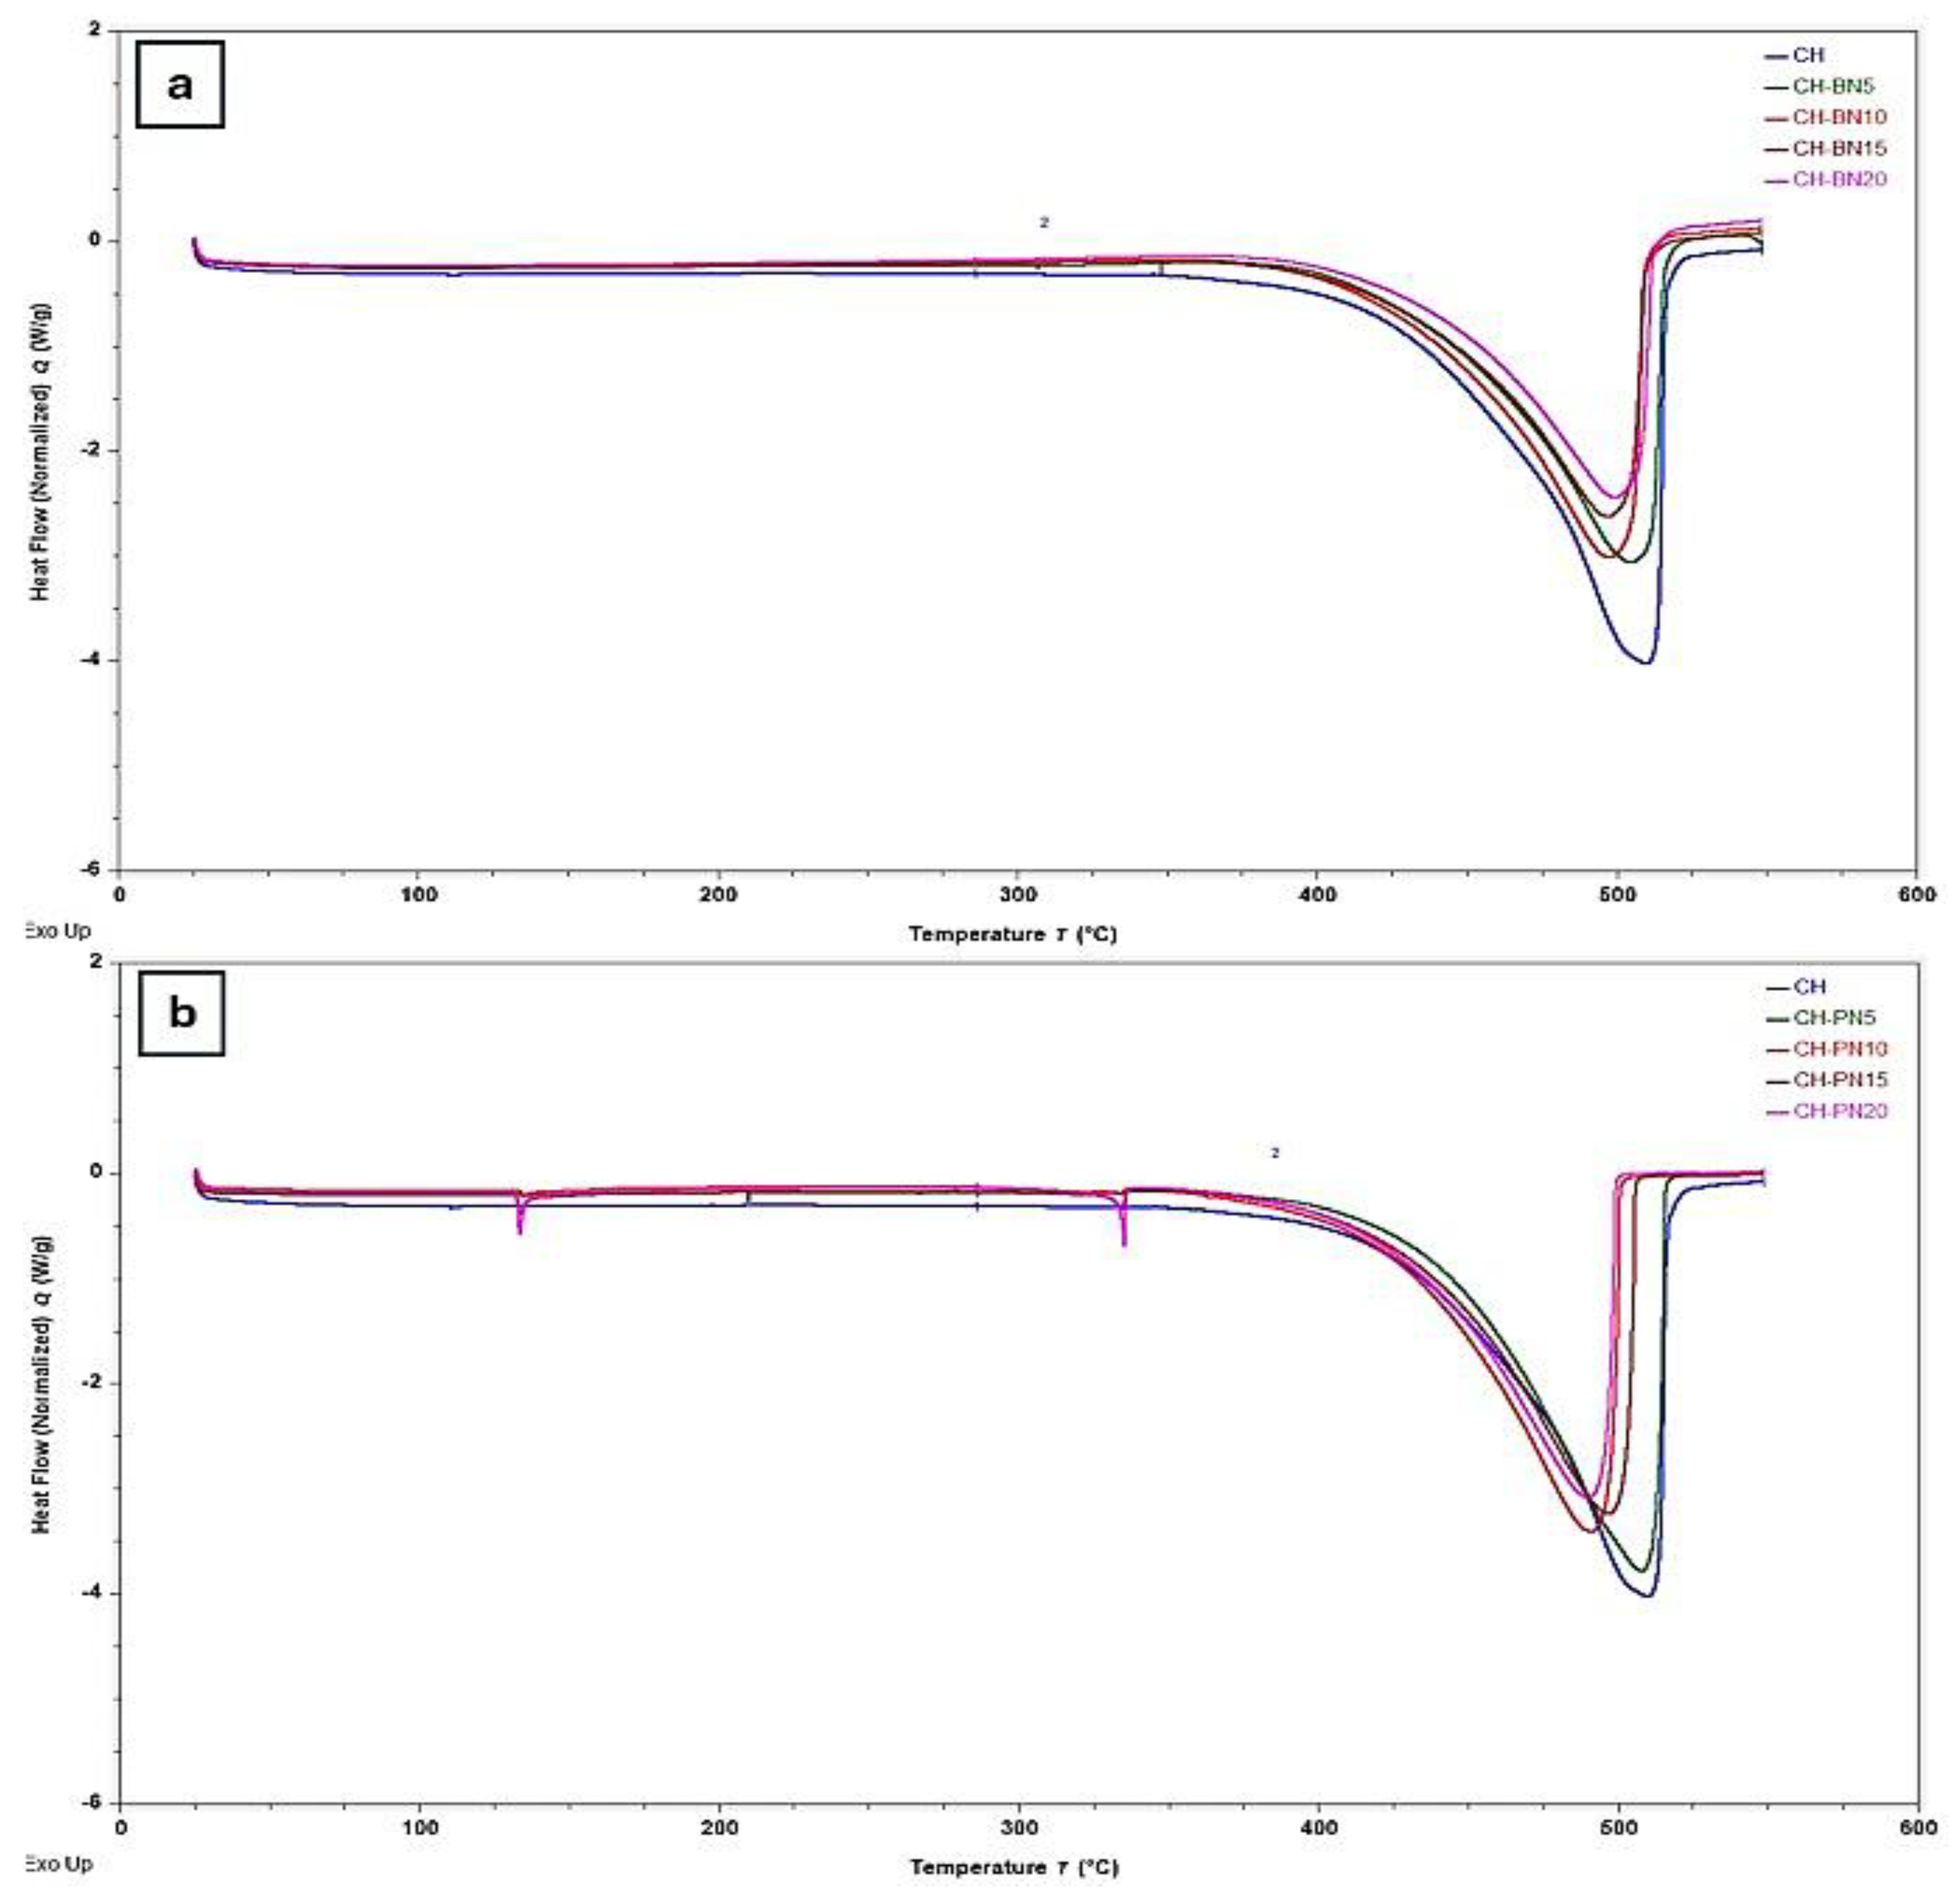
Figure 13.
DSC curves of pure Mg(OH)2 and its composites.
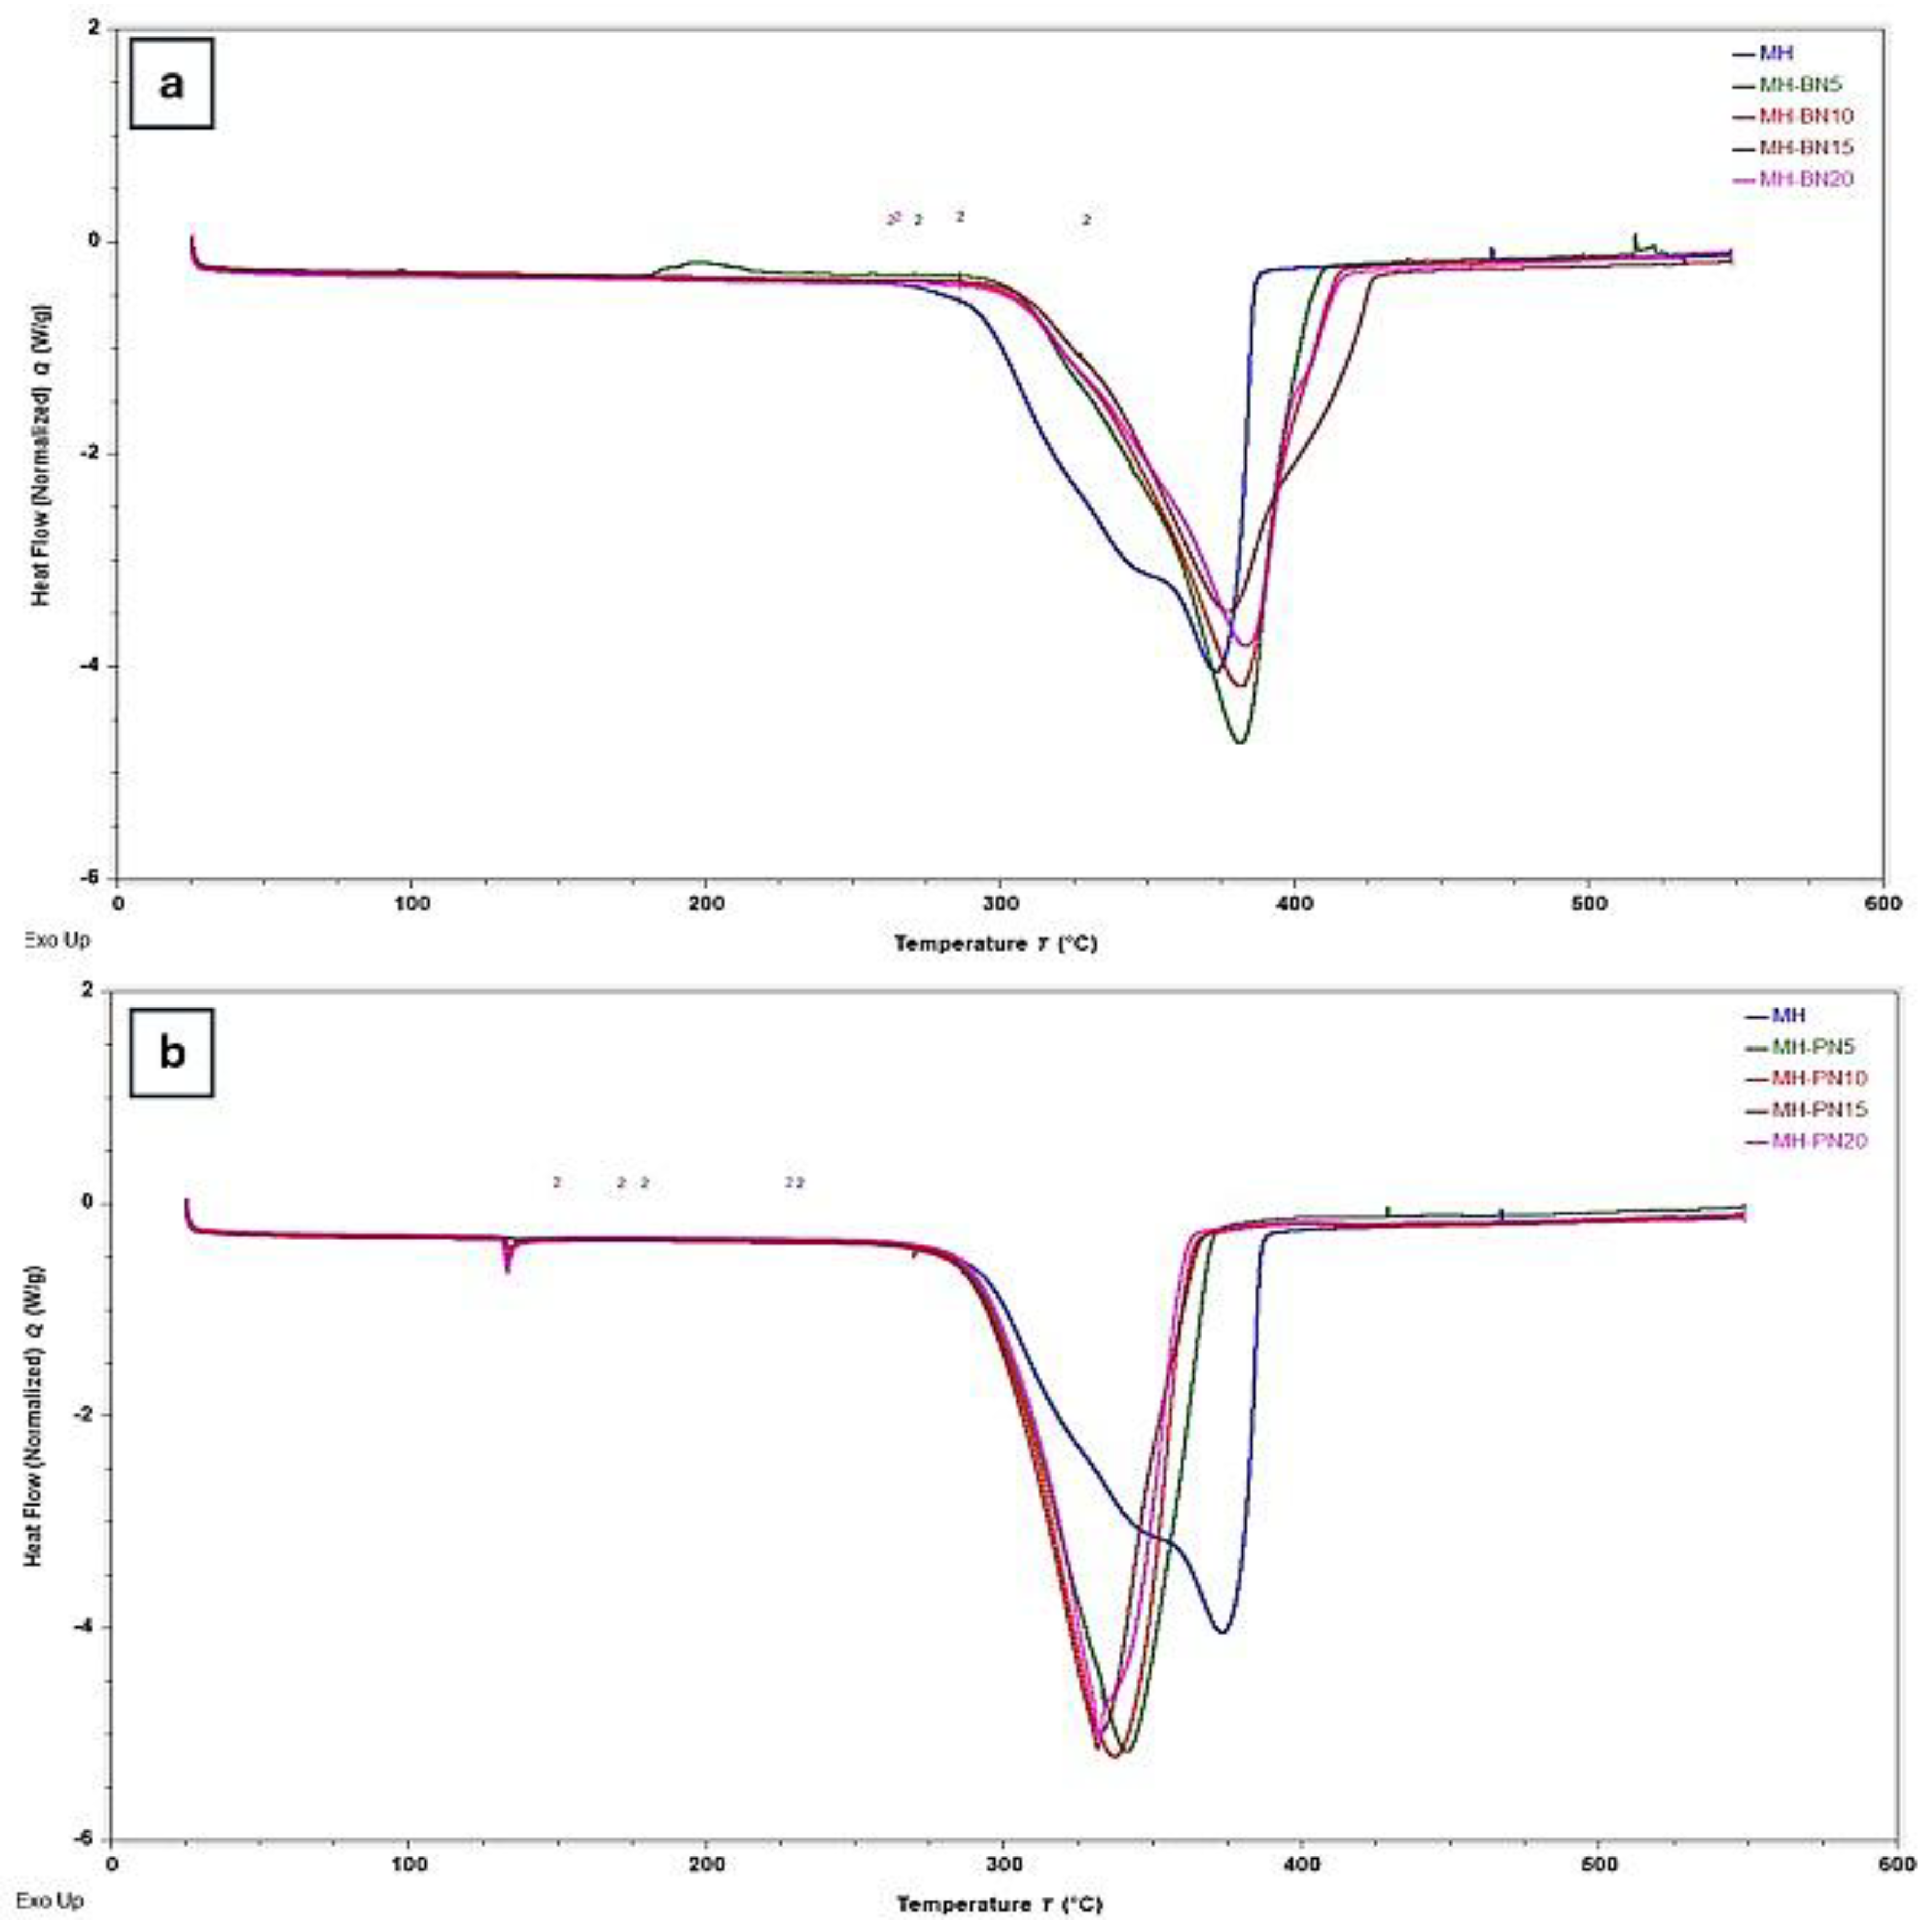
Figure 14.
TGA overly curves for pure Ca(OH)2 and its composites.
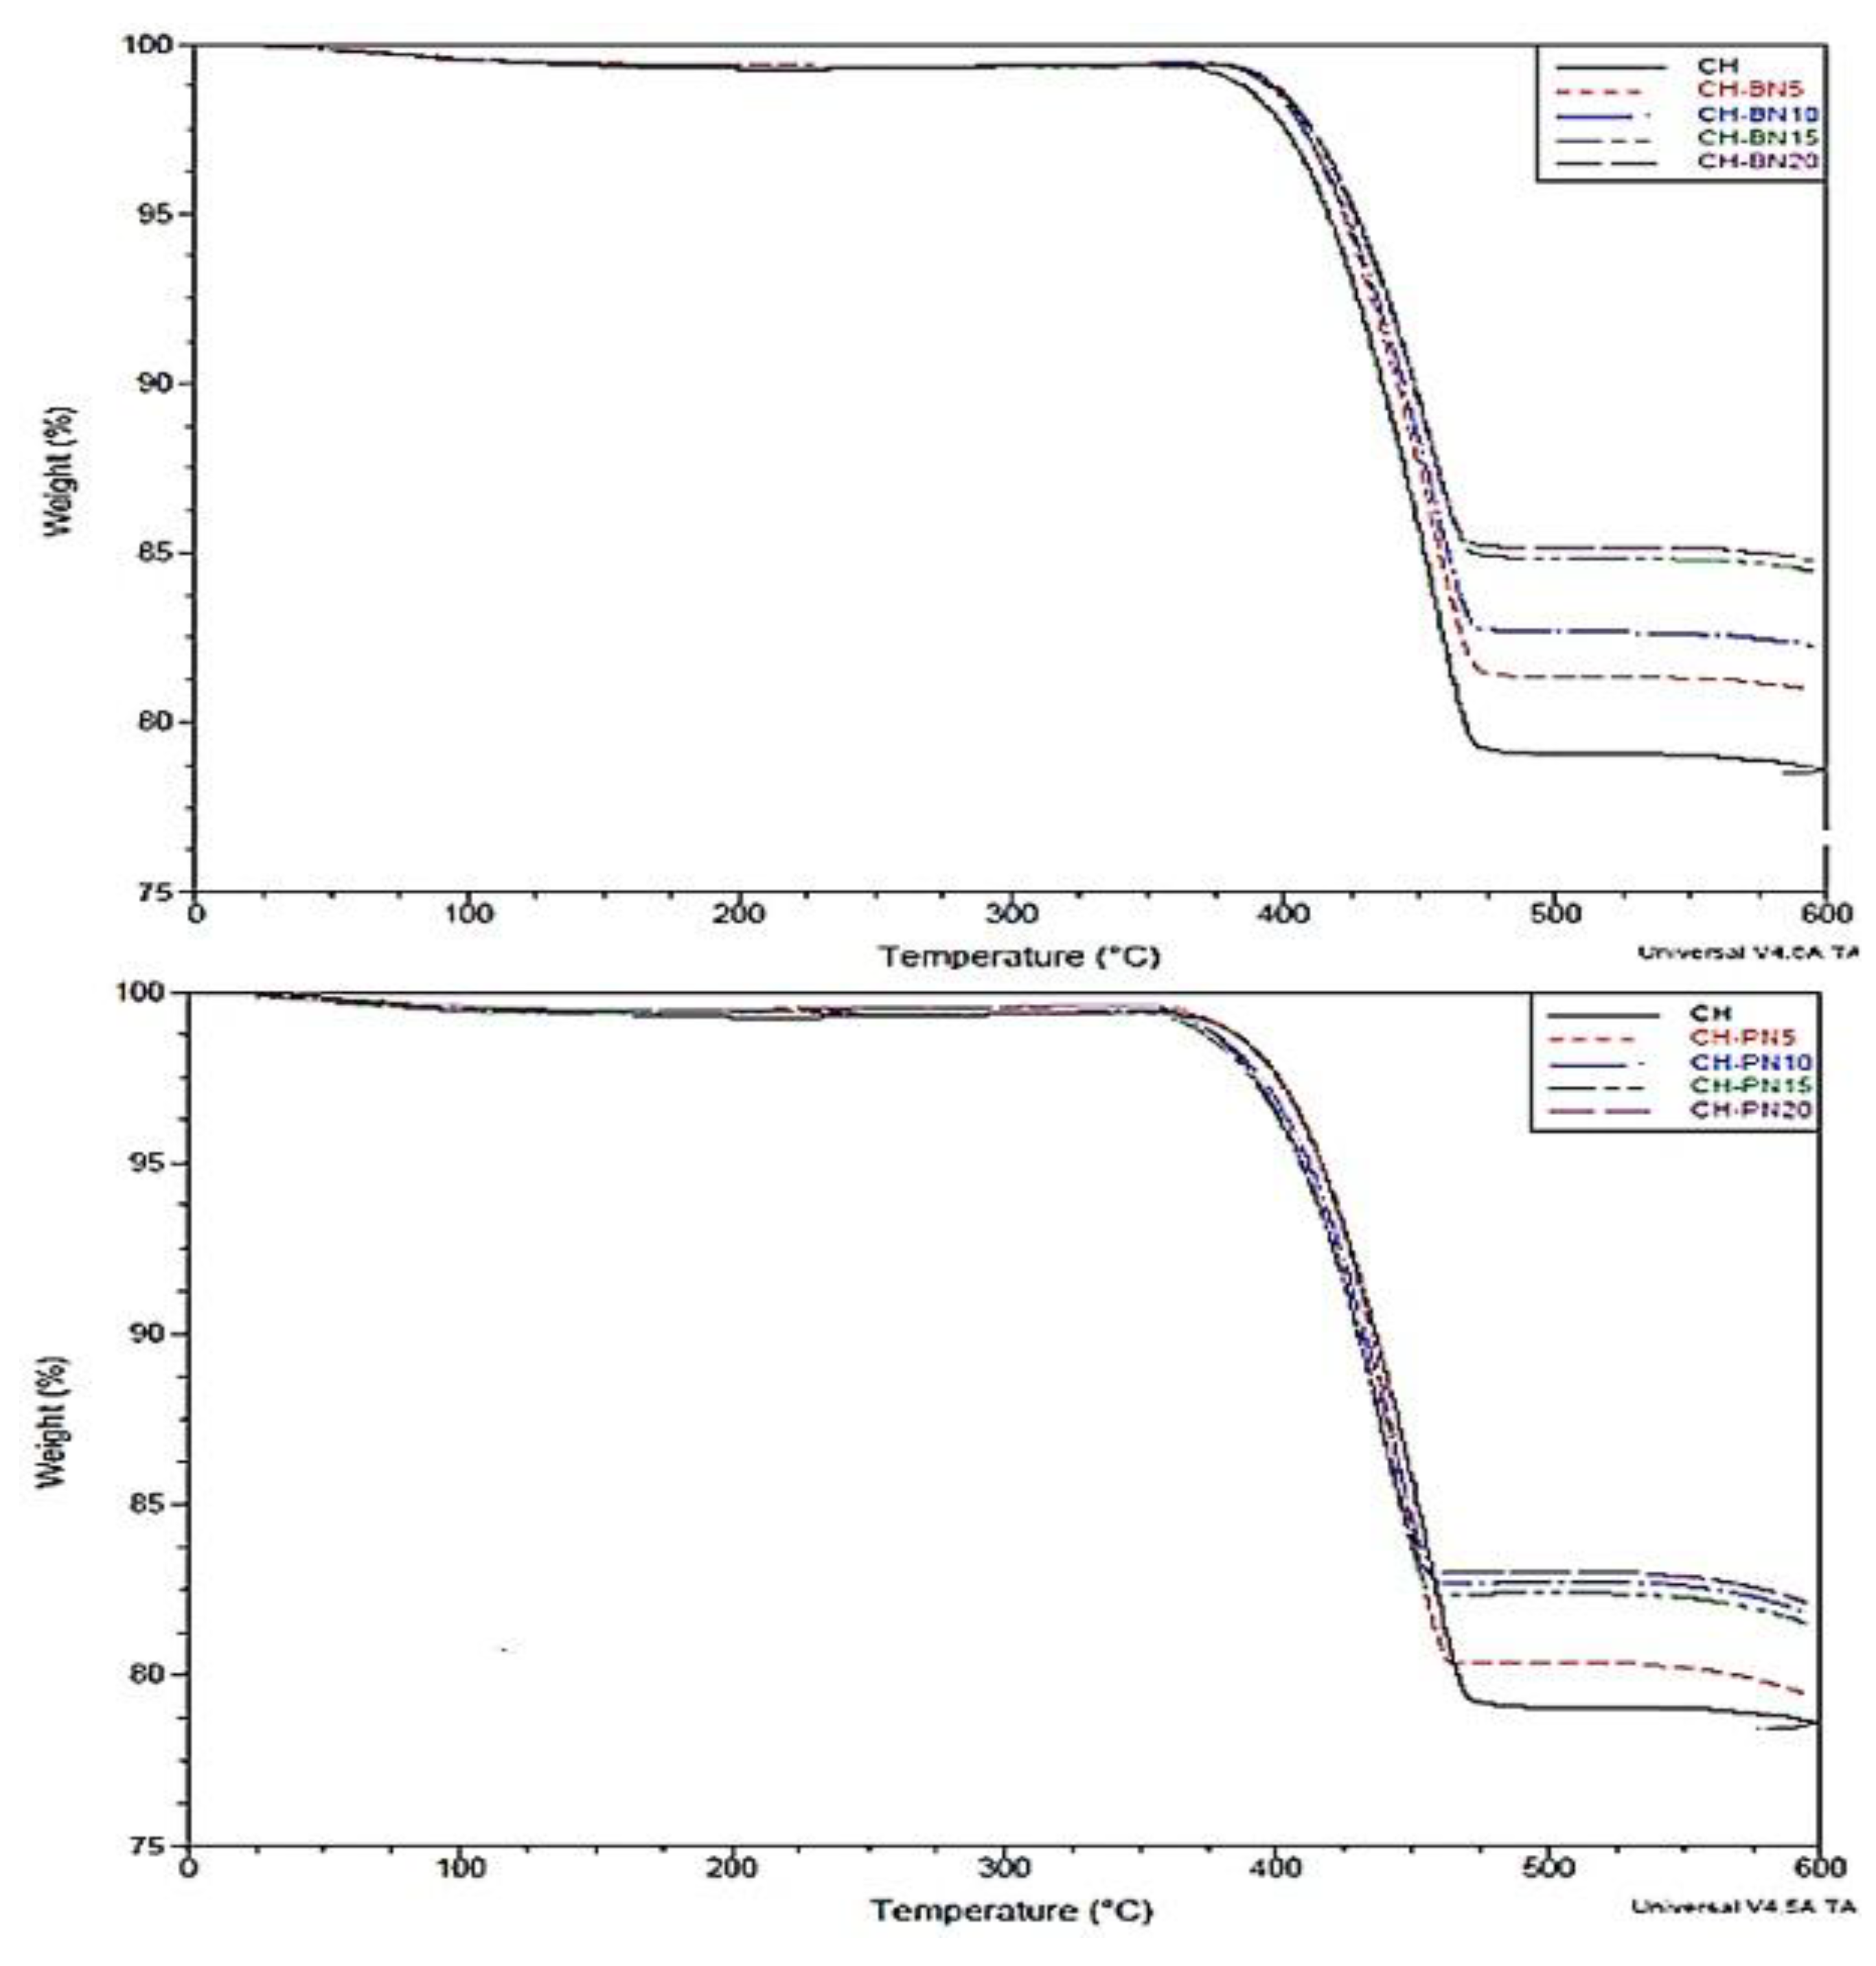
Figure 15.
TGA overly curves for pure Mg(OH)2 and its composites.
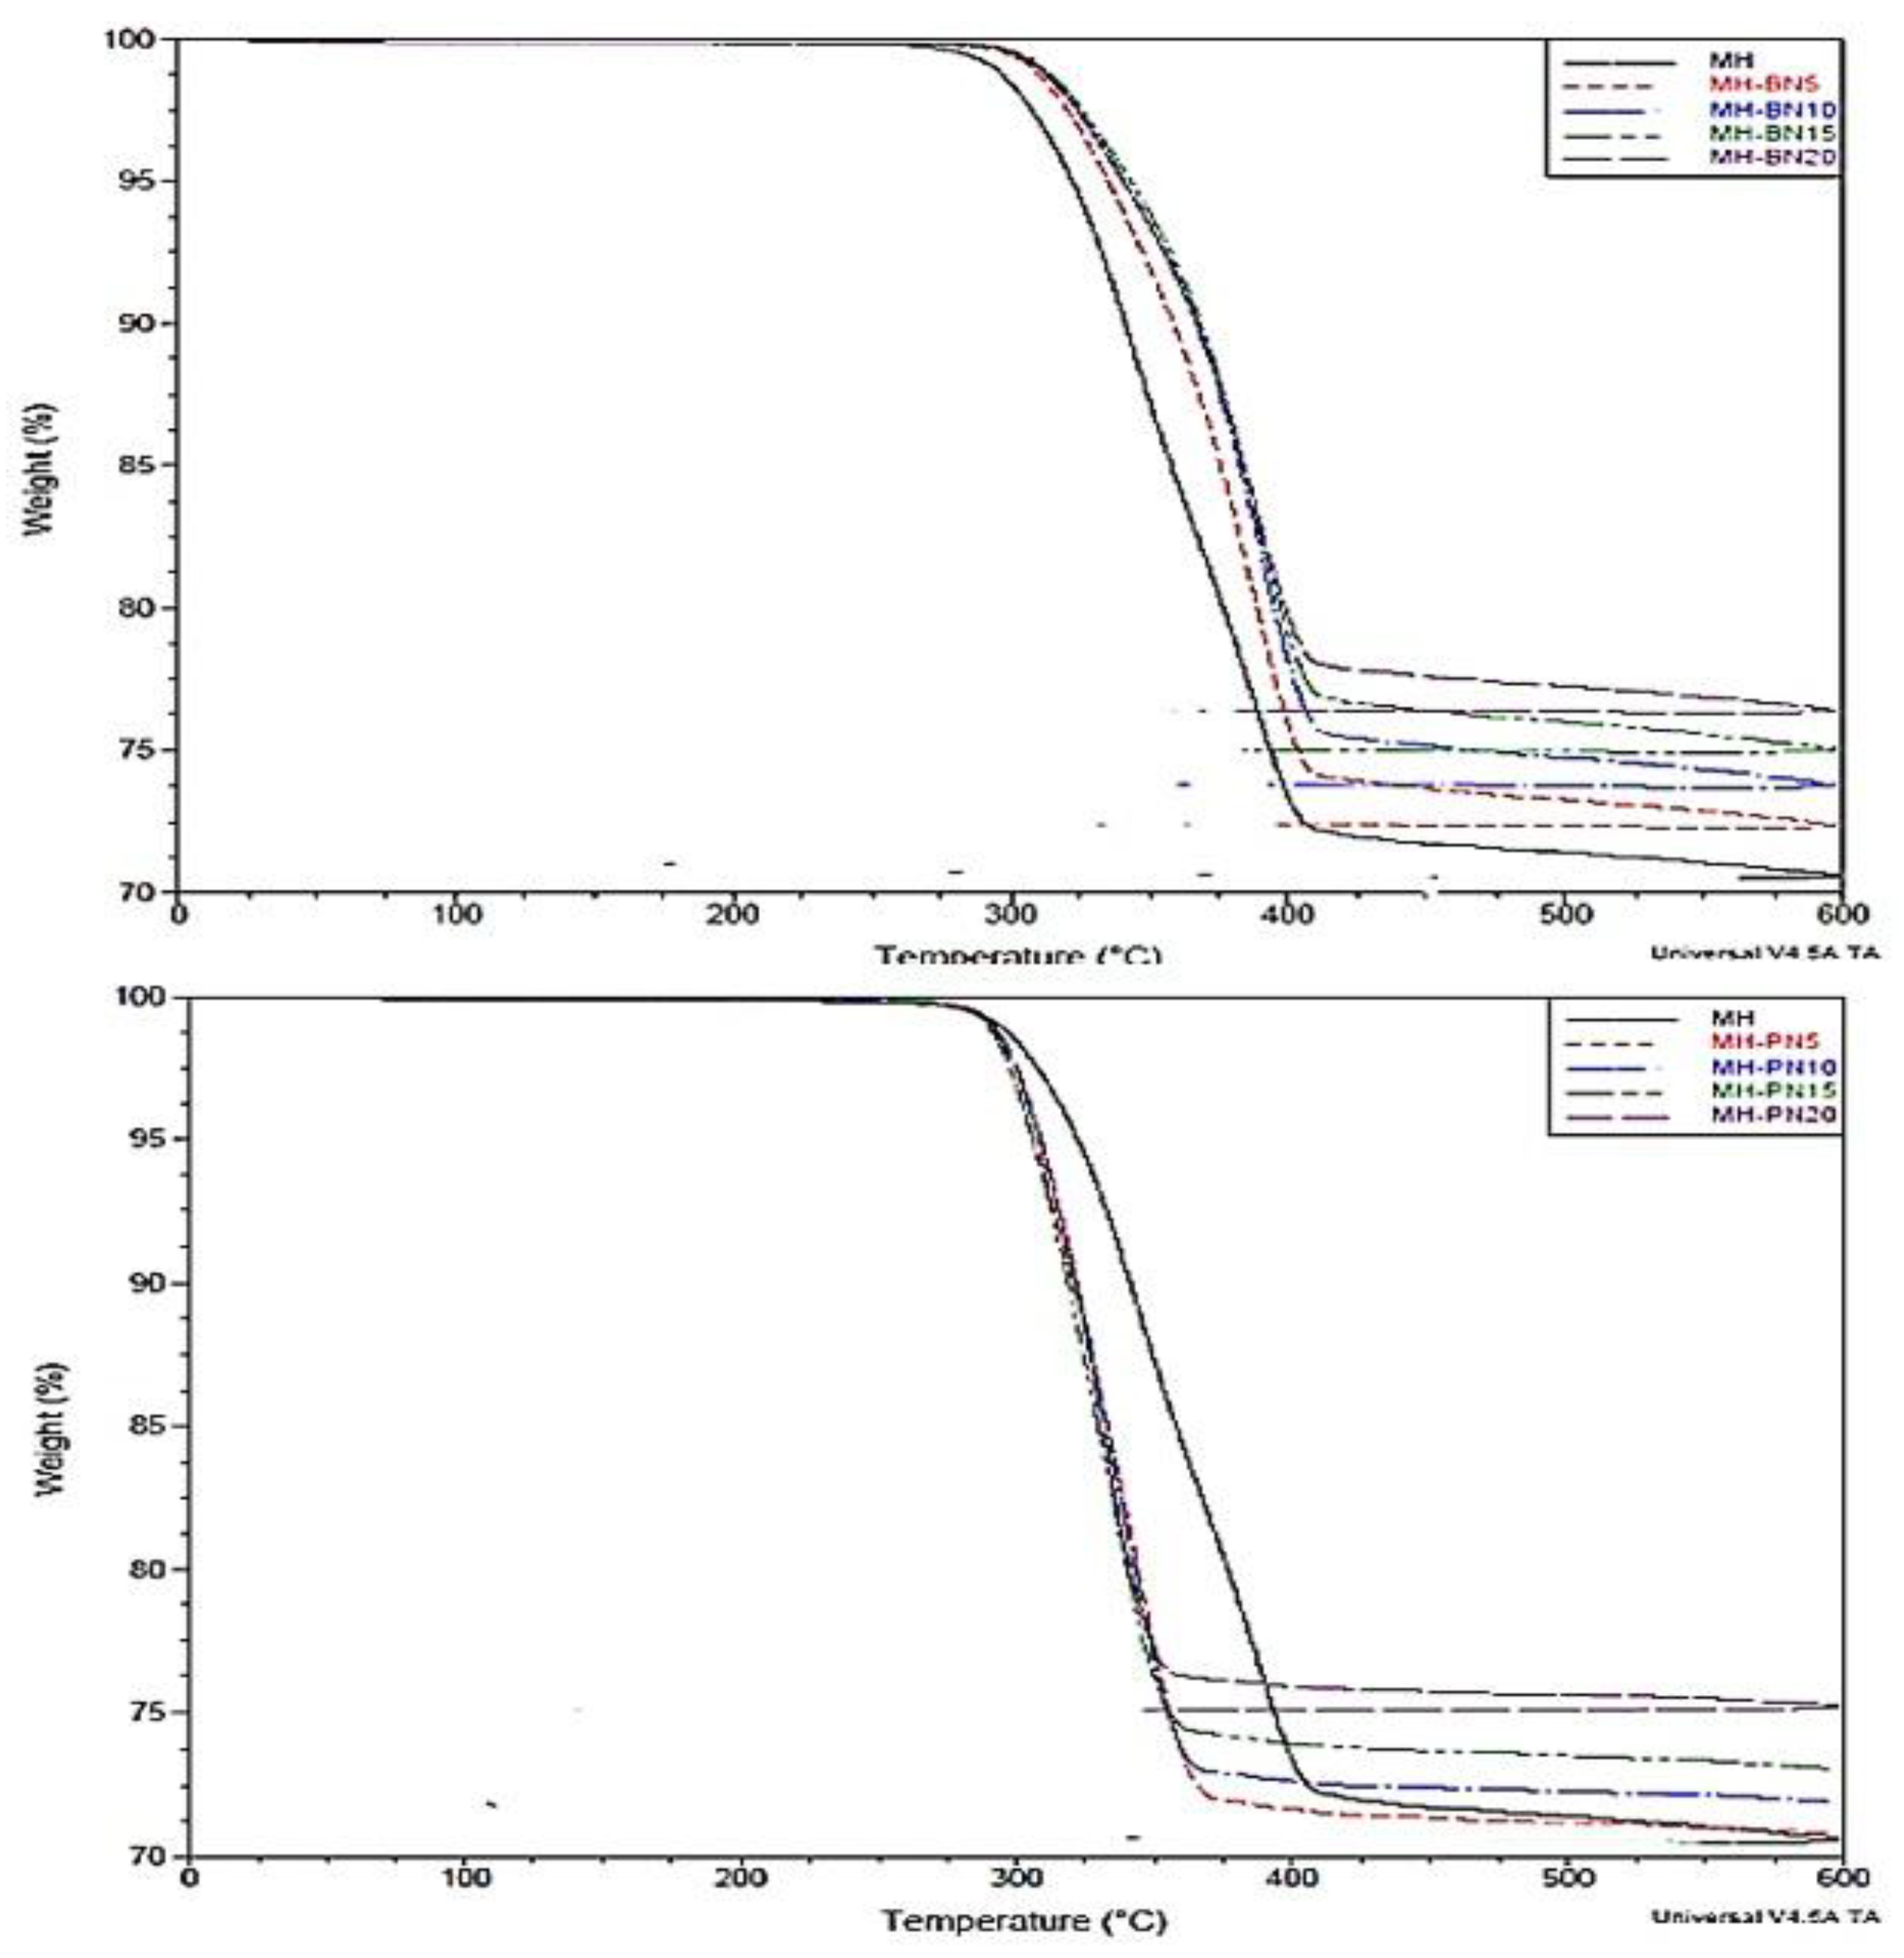

Table 1.
Composites and additive ratios of the doping materials.
| Sample | BN content (%) | Sample | KNO3 content (%) |
|---|---|---|---|
| CH-BN5 | 5 | CH-PN5 | 5 |
| CH-BN10 | 10 | CH-PN10 | 10 |
| CH-BN15 | 15 | CH-PN15 | 15 |
| CH-BN20 | 20 | CH-PN20 | 20 |
| MH-BN5 | 5 | MH-PN5 | 5 |
| MH-BN10 | 10 | MH-PN10 | 10 |
| MH-BN15 | 15 | MH-PN15 | 15 |
| MH-BN20 | 20 | MH-PN20 | 20 |
Table 2.
BET surface areas of the samples.
| Sample | SBET (m2/g) | Sample | SBET (m2/g) |
|---|---|---|---|
| CH | 32 | MH | 25 |
| CH-BN5 | 19 | MH-BN5 | 7 |
| CH-BN10 | 19 | MH-BN10 | 8 |
| CH-BN15 | 15 | MH-BN15 | 12 |
| CH-BN20 | 20 | MH-BN20 | 13 |
| CH-PN5 | 21 | MH-PN5 | 6 |
| CH-PN10 | 15 | MH-PN10 | 5 |
| CH-PN15 | 13 | MH-PN15 | 5 |
| CH-PN20 | 10 | MH-PN20 | 5 |
Table 3.
Onset temperatures and stored heat for pure and doped Ca(OH)2.
| Material | Onset temperature (℃) | Heat stored (J/g) |
|---|---|---|
| Pure CH | 451.26 | 1196.90 |
| CH-BN5 | 441.01 | 1002.10 |
| CH-BN10 | 433.89 | 1016.80 |
| CH-BN15 | 434.65 | 853.69 |
| CH-BN20 | 435.48 | 800.42 |
| CH-PN5 | 438.87 | 1135.80 |
| CH-PN10 | 426.96 | 1027.50 |
| CH-PN15 | 431.18 | 956.30 |
| CH-PN20 | 426.00 | 894.97 |
Table 4.
Onset temperatures and stored heat for pure and doped Mg(OH)2.
| Material | Onset temperature (℃) | Heat stored (J/g) |
|---|---|---|
| Pure MH | 317.03 | 1246.40 |
| MH-BN5 | 336.12 | 1233.20 |
| MH-BN10 | 328.31 | 1168.20 |
| MH-BN15 | 321.38 | 1122.70 |
| MH-BN20 | 331.01 | 1062.50 |
| MH-PN5 | 293.88 | 1317.10 |
| MH-PN10 | 297.82 | 1171.60 |
| MH-PN15 | 296.47 | 1103.40 |
| MH-PN20 | 308.20 | 1044.00 |
Table 5.
TG onset temperatures and weight loss in Ca(OH)2 and its composites.
| Material | Onset temperature (℃) | Weight loss (%) |
|---|---|---|
| CH | 397.30 | 18.40 |
| CH-BN5 | 393.40 | 16.80 |
| CH-BN10 | 393.70 | 14.65 |
| CH-BN15 | 398.26 | 14.28 |
| CH-BN20 | 435.48 | 14.28 |
| CH-PN5 | 391.20 | 19.44 |
| CH-PN10 | 376.35 | 16.82 |
| CH-PN15 | 367.52 | 17.09 |
| CH-PN20 | 372.82 | 16.98 |
Table 6.
TG onset temperatures and weight loss in Mg(OH)2 and its composites.
| Material | Onset temperature (℃) | Weight loss (%) |
|---|---|---|
| MH | 295.25 | 28.79 |
| MH-BN5 | 311.07 | 26.92 |
| MH-BN10 | 312.46 | 25.49 |
| MH-BN15 | 309.72 | 24.26 |
| MH-BN20 | 305.52 | 22.94 |
| MH-PN5 | 291.65 | 28.80 |
| MH-PN10 | 293.56 | 27.73 |
| MH-PN15 | 292.00 | 26.56 |
| MH-PN20 | 293.69 | 24.82 |
Disclaimer/Publisher’s Note: The statements, opinions and data contained in all publications are solely those of the individual author(s) and contributor(s) and not of MDPI and/or the editor(s). MDPI and/or the editor(s) disclaim responsibility for any injury to people or property resulting from any ideas, methods, instructions or products referred to in the content. |
© 2025 by the authors. Licensee MDPI, Basel, Switzerland. This article is an open access article distributed under the terms and conditions of the Creative Commons Attribution (CC BY) license (http://creativecommons.org/licenses/by/4.0/).
Copyright: This open access article is published under a Creative Commons CC BY 4.0 license, which permit the free download, distribution, and reuse, provided that the author and preprint are cited in any reuse.


