Submitted:
08 November 2025
Posted:
12 November 2025
You are already at the latest version
Abstract
Background: The high prevalence of overweight and obesity in Singapore necessitates scalable primary prevention strategies. This study evaluated the short-term effectiveness of FitterLife, a 12-week, digitally delivered, group-based behavioural weight management programme targeting at-risk adults without diabetes or hypertension in the community.
Methods: In a retrospective matched cohort study, we compared 306 FitterLife participants (enrolled from October 2021 to January 2025) with 5,087 controls identified from a population health data mart, matched on age, sex, ethnicity, and baseline body mass index (BMI). The primary outcome was achieving ≥5% weight loss or a ≥1 kg/m² BMI reduction at 12 weeks. Programme effectiveness was analysed using propensity score matching (1:1) and inverse probability weighted regression. Mixed-effects models assessed weight/BMI trajectories and modified Poisson regression identified behavioural factors associated with success.
Results: After matching, FitterLife participants were more likely to achieve the weight loss target than controls (45.7% vs 13.7%, coefficient=0.32, 95% confidence interval [CI]: 0.26-0.38) and were over three times as likely to succeed (Adjusted incidence rate ratio [aIRR]=3.37, 95% CI: 2.87-3.93). The programme group showed significant reductions in weight (-2.23 kg, 95% CI: -2.57 to -1.90) and BMI (-0.86 kg/m2, 95% CI: -0.95 to -0.73) at the end of programme. Higher session attendance and improved behavioural factors were associated with success.
Conclusions: FitterLife was effective in achieving clinically significant short-term weight loss in a real-world setting. The findings demonstrate the potential of a scalable, behavioural theory-informed, virtual group model as a viable primary prevention strategy within national chronic disease management efforts.
Keywords:
behavioural intervention
; body mass index
; digital health
; primary prevention
; programme evaluation
; weight management
Background
Overweight and obesity have emerged as a pressing global public health challenge, strongly associated with over 50 medical conditions including type 2 diabetes, hypertension, cardiovascular disease, several cancers, and musculoskeletal disorders [1,2,3]. Beyond health impact,obesity imposes a staggering societal burden: elevated BMI accounted for 3.7 million deaths from non-communicable diseases in 2021 [4], can reduce life expectancy by 5 to 20 years [5, 6], and generates substantial economic costs through healthcare expenditure and reduced productivity [3]. Global economic losses linked to overweight and obesity are projected to exceed US$3 trillion annually by 2030 and US$18 trillion by 2060 [4].
The prevalence of overweight and obesity has exhibited a relentless upward trajectory worldwide, driven by problems of modern living factors such as sedentary behaviour, poor dietary practices, and chronic stress. According to the World Health Organization, an estimated 2.5 billion adults (43% of those aged 18 years and older) were overweight (defined as a body mass index (BMI) ≥25 kg/m²) in 2022, including over 890 million (16%) living with obesity (BMI ≥30 kg/m²) [4]. This represents a dramatic increase from1990, when only 25% of adults were overweight [3, 7]. Projections indicate that by 2035, 1.9 billion adults (25% of the world’s population) will be living with overweight or obesity, rising further to 3.80 billion (over 50%) by 2050 [7]. Singapore exemplifies this global pattern: the 2022 National Population Health Survey reported a combined overweight and obesity prevalence of 40.2%, of whom 11.6% classified as obese [8]. Alarmingly, despite widespread recognition of this crisis, no country has yet successfully reversed these upward trends [9].
These trends underscore the urgency of developing scalable preventive interventions targeting overweight adults before adverse health conditions such as metabolic diseases develop. Despite evidence that modest weight loss of 5 -10% can significantly improve blood pressure, glycaemic control, and lipid profiles [10, 11], effective prevention and management remain elusive. Lifestyle modification, comprising dietary changes, increased physical activity, and behavioural support, remains the cornerstone of obesity management. Numerous systematic reviews demonstrate the effectiveness of multi-component behavioural interventions, particularly those incorporating structured coaching and group-based support [12,13,14,15,16,17].
More recently, digital and remote delivery models have gained traction as a viable strategy to enhance the scalability and accessibility of behavioural interventions. Meta-analyses show that eHealth interventions can achieve short-term weight loss comparable to face-to-face programmes [18,19,20]. The remote delivery format can directly address key barriers to participation such as time, travel, and stigma, while still incorporating core behavioural change techniques like structured education, goal-setting, and peer support.
Despite encouraging evidence, weight management programmes continue to face challenges such as high attrition, modest weight loss, and difficulties with long-term adherence. Many are resource-intensive, delivered primarily in healthcare settings, and target individuals with established obesity-related conditions. Although digital and remote behavioural interventions have been associated with improved adherence [20], evidence on the effectiveness of theory-informed, digitally delivered behavioural interventions among overweight adults without diabetes or hypertension, particularly as a scalable primary prevention strategy in Asian community settings, remains limited.
To address this gap, the National Healthcare Group (NHG), one of the three public healthcare clusters in Singapore, launched FitterLife in 2021. Building on a proof-of-concept phase, FitterLife Phase 2 was designed as a 12-week, community-based, virtually delivered weight management programme targeting overweight adults without diabetes or hypertension. The programme was explicitly designed for scalability, employing a group-based virtual format to overcome traditional barriers to access. It incorporated key behavioural change techniques including eight weekly interactive sessions via Zoom, covering moderate-to-vigorous physical activity (MVPA), nutrition management, health educational lectures, and group-based goal-setting discussions facilitated by trained health coaches to build skills and self-efficacy. This was followed by three weeks of self-practice with health coaches’ support. Week 12 (session 9) was to address any lapses. Each session lasted two hours. Participants also received guidance on dietary modification (e.g., portion control, fibre intake), physical activity, and behaviour change strategies such as goal-setting and self-monitoring throughout the programme period via WhatsApp group chat. This is to foster a supportive community and enable continuous self-monitoring and feedback. The overall aims of the FitterLife were to (1) lower the level of obesity by reducing weight, Body Mass Index (BMI) and waist circumference; (2) promote positive lifestyle change through reduction in fat and sugar intake, increase in fibre, wholegrain and vegetable intake, and increase in physical activity level; and (3) increase knowledge and self-efficacy on weight management among at-risk individuals.
This study evaluated the short-term effectiveness of FitterLife phase 2. Specifically, we assessed the likelihood of achieving ≥5% weight loss or ≥1 BMI unit reduction at 12 weeks compared with matched controls, examined weight and BMI trajectories, and investigated the behavioural factors (e.g., attendance, dietary change, physical activity) associated with successful weight loss.
Methods
Study Design and Data Sources
We conducted a retrospective matched cohort study using data from two sources: 1) programme data systematically collected during FitterLife phase 2 implementation, and 2) retrospectively collected electronic health records from the NHG Population Health Data Mart (PHDM). The PHDM is a comprehensive administrative database that consolidates de-identified individual-level medical, lifestyle, and social data from electronic medical records, laboratory results, clinical registries, and health surveys across NHG’s network of healthcare and social care providers and partners.
Study Participants
FitterLife (Intervention) Cohort: The exposed group consisted of 360 community-dwelling individuals enrolled in FitterLife phase 2 between October 2021 and January 2025. Eligibility criteria were: 1) Singapore residents aged 21-64 years, 2) overweight (BMI ≥23.0 kg/m², based on Asian cut-offs), 3) no prior diagnosis of diabetes or hypertension, and 4) not pregnant and free from active medical conditions that could impede exercise, including cardiac, respiratory, musculoskeletal, or psychiatric issues, for the past six months. Recruitment prioritised ethnic minority and lower socioeconomic status subgroups to ensure programme accessibility and representation. The programme was delivered over 20 runs, with cohort sizes ranging from 8 to 30 participants per run. After excluding ineligible recruits (n=14), withdrawals (n=15), and those with incomplete baseline (n=3) or follow-up data (n=22), the final intervention cohort for analysis was 306 individuals.
Control Cohort: The unexposed controls were selected from the PHDM database using the same inclusion and exclusion criteria during the identical study period. To be eligible, controls must have had at least one visit to any NHG Polyclinic (NHGP), a group of polyclinics providing subsidised primary care in Singapore, but no record of enrolment in FitterLife. A random visit date was designated as the index enrolment date for each control to establish a temporal reference point analogous to the enrolment date for FitterLife participants. The initial control pool meeting these criteria comprised 5,464 individuals (Figure 1).
Outcome Measures
The primary outcome was achievement of clinically significant weight loss at week 12, defined as either a ≥5% reduction in body weight or a ≥1 kg/m2 reduction in BMI. Secondary outcomes included absolute weight and BMI at weeks 1, 4, 8, 12, and 36 as well as changes from baseline in these measures at weeks 4, 8, 12, and 36.
Data for FitterLife participants were obtained retrospectively from anonymised programme records containing self-reported measurements collected during routine programme monitoring. In the original programme, participants were instructed to use the same weighing scale throughout and to submit photographs of their readings, which were subsequently verified and documented by programme coordinators. Missing follow-up data were supplemented, where available, with corresponding measurements from the PHDM. For controls, all weight and BMI data were obtained directly from the PHDM, with baseline values defined as measurements taken within 120 days before or up to 14 days after enrolment, and follow-up values defined as those recorded within ± 14 days of each target week.
Percentage weight change at week 12 was calculated as follows: [(weight at week 12 − baseline weight) / baseline weight] × 100. The absolute change in BMI was calculated as BMI at week 12 - baseline BMI. For participants missing week 12 data, week 8 measurements were carried forward (last observation carried forward).
Demographic and Behavioural Variables
Demographic factors including age, sex, and ethnicity were obtained for both cohorts. Self-reported behavioural data at weeks 1 and 12 including time spent on MVPA per week and walking per day (assessed using questions adapted from the International Physical Activity Questionnaire [21]), and dietary patterns (measured by fat and fibre intake collected using questions adapted from the fat and fibre behaviour questionnaire [22]) were retrieved from anonymised FitterLife programme records. These behavioural data were used exclusively to explore factors associated with successful weight loss within the FitterLife group and not for the comparative effectiveness analysis against controls.
Data on programme engagement (e.g., session attendance) and operating costs were also obtained (reported in Supplementary File 1).
Statistical Analysis
Descriptive Statistics and Exploratory Analysis
Baseline characteristics were summarised using frequencies (n) and percentages (%) for categorical variables and means with standard deviations (SD) for continuous variables. Group comparisons before and after matching were conducted using Chi-square tests for categorical variables and independent t-tests for continuous variables. The absolute proportion of individuals who achieved the weight loss target was calculated for both groups after matching. Additionally, programme cost per kilogram of weight loss was calculated as a descriptive indicator of programme efficiency (reported in Supplementary File 1).
Propensity Score Matching (PSM)
To account for baseline confounding, propensity scores were estimated via logistic regression using age, sex, ethnicity, and baseline BMI as predictors of programme enrolment. Analyses were restricted to the region of common support [23], excluding 377 controls outside this range (Figure 1). Participants were matched 1:1 using nearest-neighbour matching without replacement and a caliper width of 0.001. This narrow caliper was selected to ensure close matches and minimise residual bias, made feasible by the large pool of potential controls. Covariate balance was assessed using standardised mean differences (<0.10 indicating good balance) and variance ratios (0.5-2.0 indicating adequate balance).
Primary Effectiveness Analysis
The average treatment effect on the treated (ATET) for achieving the weight loss target was estimated using inverse probability weighted regression adjustment (IPWRA) with robust standard errors. This doubly robust estimator combines propensity score weighting with outcome regression to provide unbiased effect estimates under either correct specification. Results were expressed as risk differences (coefficients) with 95% confidence intervals (CIs). Sensitivity analysis using modified Poisson regression were performed on both unmatched and matched cohorts to estimate relative risks (adjusted incidence rate ratios, IRRs) with 95% CIs, adjusting for baseline covariates (age, female, Chinese, and baseline BMI).
Longitudinal Trajectory Analyses
To assess changes in weight and BMI over time, mixed-effects linear regression models were applied to the trimmed control cohort (before matching), analysing both absolute values and changes from baseline at each follow-up. Models included fixed effects for treatment group, baseline covariates (age, sex, ethnicity, baseline BMI), categorical time points (weeks 1, 4, 8, 12, and 36), and group-by-time interaction terms, with random intercepts for individuals. An unstructured variance-covariance matrix was specified to account for within-person correlations.
Predictors of Success Analysis
Within the FitterLife cohort, modified Poisson regression was used to identify behavioural factors associated with successful weight loss (≥ 5% body weight or ≥ 1 kg/m² BMI reduction) at week 12. Predictors included session attendance, and change in physical activity and dietary intake, adjusting for age, sex, ethnicity, and baseline BMI. Multicollinearity was assessed using variance inflation factors (VIF < 5.0 indicating no substantive concern) [24].
All analyses were conducted using Stata SE 18.0, with statistical significance set at p<0.05.
Ethical Considerations
This study used only anonymised programme and administrative data and was therefore exempt from ethics review. Approval for exemption was obtained from the NHG Group Research & Innovation Office. As no identifiable information was used, patient informed consent was not required.
Results
Participant Characteristics and Propensity Score Matching
Before matching, the mean age of the 306 FitterLife participants was 47.8 (SD: 10.7) years, which was comparable to the control group (p=0.676). The majority were females (77.8%) and Chinese (83.3%), both proportions higher than in the control group (both p <0.001). Baseline weight was 73.6 (SD: 12.1) kg and BMI was 28.1 (SD: 3.6) kg/m2, with BMI significantly higher than the control group mean of 27.2 kg/m2 (p <0.001).
After matching, all variables achieved adequate balance with non-significant differences (Table 1). The absolute standardised mean difference was less than 5% for all variables, ranging from -2.0% for age to 4.2% for baseline BMI. Variance ratios for baseline age (0.84) and BMI (1.05) within the recommended range of 0.5-2.0, confirming successful matching.
Effectiveness on Weight Loss Target
The FitterLife programme significantly increased the probability of achieving the weight loss target by 32 percentage points (ATET = 0.32, 95% CI: 0.26, 0.38, p<0.001). Specifically, 45.7% of participants achieved success, compared to a counterfactual estimate of 13.7% in the absence of the programme.
These findings were consistent across analytical approaches. Modified Poisson regression demonstrated that participants in the FitterLife programme were 3.32 times more likely to achieve weight loss target at week 12 in the unmatched cohort (aIRR=3.32, 95% CI = 2.85, 3.86, p<0.001), with similar results in the matched cohort (aIRR=3.37, 95% CI = 2.87, 3.93, p<0.001) (Table 2).
Trajectories of Weight and BMI Change
Mixed-effects models revealed a statistically significant group-by-time interaction (p<0.001), indicating significant differences in weight and BMI trajectories between FitterLife and Controls over 36 weeks (Figure 2, Figure 3, Figure 4 and Figure 5). The FitterLife group demonstrated progressive weight and BMI reductions throughout the intervention period, with maximum reductions observed at week 12 (end of programme): with a mean weight loss of -2.23 kg (95% CI: -2.57, -1.90) and a BMI reduction of -0.86 kg/m2 (95% CI: -0.95, -0.73). In contrast, controls showed minimal change (-0.19 kg and -0.11 kg/m², respectively). Although some weight regain occurred post-intervention, the FitterLife group maintained meaningful reductions at week 36 (weight change: -1.99 kg [95% CI: -2.34, -1.63], BMI change: -0.75 kg/m2 [95% CI: -0.89, -0.62]).
Behavioural factors Associated with Weight Loss Success
Higher session attendance (7-9 sessions), dietary improvements (≥20% fat reduction, increased fibre intake), and increased physical activity (≥1 hour MVPA weekly) were associated with greater likelihood of achieving week 12 weight loss target among FitterLife participants (Table 3).
Discussion
This retrospective matched cohort study evaluated the real-world effectiveness of FitterLife, a scalable, digitally delivered, community-based behavioural intervention for overweight adults in Singapore without diabetes or hypertension. Our results showed that programme participation was associated with a significantly higher likelihood of achieving successful weight loss (≥5% weight or ≥1 kg/m2 BMI reduction) at week 12 compared to matched controls, with an adjusted incidence rate ratio of 3.37, representing 32-percentage point increase in success probability. Furthermore, mixed-effects models confirmed a superior trajectory of weight and BMI reduction throughout the intervention period. Critically, our within-group analysis provides insights into the behavioural mechanisms of change, demonstrating that higher programme engagement and positive behavioural changes were key drivers of success.
The FitterLife programme demonstrated substantial effectiveness, with 45.7% participants achieving successful weight loss, a success rate comparable to other real-world lifestyle interventions [12, 13, 25]. The mean absolute weight loss of 2.23 kg at week 12 aligns with established efficacy of short-term, multi-component interventions (a pooled mean change of -2.70 kg) [16]. These findings collectively support the evidence that short-term, multi-component lifestyle interventions can yield modest but clinically meaningful weight loss [26, 27].
Our findings add to the growing body of evidence supporting digital and remote delivery models for behavioural interventions [18,19,20]. The programme’s virtual, group-based format likely enhanced accessibility and scalability while actively leveraging behavioural principles. The use of live, interactive Zoom sessions and WhatsApp groups facilitated a sense of community and provided timely support, key elements for maintaining engagement and self-efficacy in remote interventions. This model is particularly suited for a busy, multi-ethnic urban populations like Singapore’s, where barriers such as time and travel can hinder participation in traditional face-to-face programmes [19, 28]. Our study provides robust evidence that such a digitally-enabled, theory-informed approach is effective in an Asian, community-based preventive population — an underrepresented group in prior research.
Our analysis of the FitterLife cohort offers valuable insights into behavioural mechanisms underpinning its effectiveness. The dose-response relationship between session attendance (7-9 sessions) and successful weight loss underscores that engagement with the behavioural content and group process is a critical active ingredient and highlights the critical importance of programme engagement and adherence, a consistent finding across behavioural science [30, 31]. Furthermore, the independent association between increased fibre intake and weight loss success highlights the pivotal role of targeting specific, actionable dietary behaviours beyond mere caloric restriction [32,33,34]. Collectively, these findings reinforce the value of the programme’s multi-component behavioural approach, which simultaneously targeted knowledge, skills, self-monitoring, and social support to facilitate change across multiple lifestyle domains.
Strengths and Limitations
The primary strength of this study is its robust quasi-experimental design, which leverages a large, well-characterised control pool. The application of rigorous propensity score matching provides high confidence that the groups were highly comparable on observed baseline characteristics, thereby strengthening causal inference. Furthermore, the use of mixed-effects models for longitudinal analysis accounted for within-individual correlations and provided a nuanced assessment of weight trajectories over time.
However, several limitations warrant consideration. First, despite rigorous matching, the non-randomised design cannot preclude residual confounding by unmeasured factors, such as underlying motivation, socioeconomic status, or social support, which may influence both programme enrolment and weight loss success. Second, while administrative data were used for controls, key weight measurements and all behavioural data for the FitterLife group were generally self-reported, introducing potential for measurement error and social desirability bias. Third, the 36-week follow-up period is insufficient to assess long-term weight maintenance; the observed trend of weight regain at week 36 underscores the challenge of sustainability and suggests a need for booster sessions or structured maintenance programmes informed by behavioural maintenance theory.
Programme Implications and Future Directions
Our findings demonstrate that FitterLife is an effective and scalable community-based intervention for primary prevention. The digitally delivered, group-based model successfully supports successful weight loss, offering a viable strategy to reach at-risk individuals at a population level before the onset of chronic disease.
However, the programme’s impact is currently constrained by implementation challenges, primarily low recruitment. Consequently, the operating cost was high for each participant ($988.04 in Singapore dollars) and for every kilogram of weight lost (S$443.07). To translate this clinical efficacy into broader public health impact, future efforts must address these barriers through deeper integration with primary care networks and community partnerships.
For future research, three key priorities emerge: (1) a full cost-effectiveness analysis from a public health perspective; (2) longer-term follow-up to assess the durability of weight loss and its impact on hard endpoints like the incidence of diabetes and hypertension; and (3) mixed-methods research to elucidate the behavioural mechanisms of engagement and dropout, providing a direct evidence base for refining the intervention’s behavioural components and digital delivery.
Conclusions
In conclusion, this evaluation provides evidence for the short-term effectiveness of the FitterLife programme in a real-world community setting. The virtual group-based delivery model is viable, and its success is driven by adherence and improvements in behavioural factors. Despite ongoing challenges in recruitment and cost-efficiency, these findings justify continued investment and systematic optimisation of such scalable interventions.
Author Contributions
Conceptualization, Lixia Ge, Fong Seng Lim, Joseph Molina, Michelle Pereira, Donna Tan and Elaine Tan; Data curation, Lixia Ge, Fong Seng Lim and Shawn Lin; Formal analysis, Lixia Ge; Funding acquisition, Elaine Tan; Investigation, Lixia Ge and Shawn Lin; Methodology, Lixia Ge, Joseph Molina, Michelle Pereira and Elaine Tan; Project administration, Fong Seng Lim, Shawn Lin and Elaine Tan; Resources, Elaine Tan; Supervision, Joseph Molina; Validation, Lixia Ge and Joseph Molina; Visualization, Lixia Ge and A Manohari; Writing – original draft, Lixia Ge and A Manohari; Writing – review & editing, Lixia Ge, Fong Seng Lim, Shawn Lin, Joseph Molina, Michelle Pereira, Donna Tan and Elaine Tan.
Data Availability Statement
The data supporting this study’s findings are not publicly available due to sensitivity concerns but may be obtained from the corresponding author upon reasonable request.
Acknowledgments
The FitterLife programme, as part of the War on Diabetes Community Intervention Programmes (WOD-CIP), was funded by Singapore’s Ministry of Health (MOH Reference 24:42/5-16).
Conflicts of Interests
The authors have no competing interests to declare. The funders had no role in the collection, analysis, or interpretation of the data, in the writing of the report, or in the decision to submit the manuscript for publication. The researchers had full access to the data in the study and took responsibility for the integrity of the data and the data analysis.
Abbreviations
| aIRR | Adjusted incidence rate ratio; |
| ATET | average treatment effect on the treated; |
| BMI | Body Mass Index; |
| IPWRA | inverse probability weighted regression adjustment; |
| MVPA | moderate-to-vigorous physical activity; |
| NHG | National Healthcare Group; |
| NHGP | National Healthcare Group Polyclinic; |
| PHDM | NHG Population Health Data Mart; |
| PSM | propensity score matching; |
| SD | standard deviations; |
| VIFs | variance inflation factors |
References
- Lam BCC, Lim AYL, Chan SL, Yum MPS, Koh NSY, Finkelstein EA. The impact of obesity: a narrative review. Singapore Med J. 2023;64:163–71. [CrossRef]
- Chandrasekaran P, Weiskirchen R. The Role of Obesity in Type 2 Diabetes Mellitus-An Overview. Int J Mol Sci. 2024;25:1882. [CrossRef]
- Blüher, M. An overview of obesity-related complications: The epidemiological evidence linking body weight and other markers of obesity to adverse health outcomes. Diabetes Obes Metab. 2025;27 Suppl 2 Suppl 2:3–19. [CrossRef]
- WHO WHO. Obesity and overweight. Fact sheets. 2025. https://www.who.int/news-room/fact-sheets/detail/obesity-and-overweight. Accessed 19 Sep 2025.
- Fontaine KR, Redden DT, Wang C, Westfall AO, Allison DB. Years of life lost due to obesity. JAMA. 2003;289:187–93. [CrossRef]
- Bhaskaran K, Dos-Santos-Silva I, Leon DA, Douglas IJ, Smeeth L. Association of BMI with overall and cause-specific mortality: a population-based cohort study of 3·6 million adults in the UK. Lancet Diabetes Endocrinol. 2018;6:944–53. [CrossRef]
- Ahmed SK, Mohammed RA. Obesity: Prevalence, causes, consequences, management, preventive strategies and future research directions. Metabolism Open. 2025;27:100375. [CrossRef]
- Ministry of Health, Health Promotion Board. National Population Health Survey 2022. Singapore; 2023.
- Ng M, Gakidou E, Lo J, Abate YH, Abbafati C, Abbas N, et al. Global, regional, and national prevalence of adult overweight and obesity, 1990–2021, with forecasts to 2050: a forecasting study for the Global Burden of Disease Study 2021. The Lancet. 2025;405:813–38. [CrossRef]
- Ryan DH, Yockey SR. Weight Loss and Improvement in Comorbidity: Differences at 5%, 10%, 15%, and Over. Curr Obes Rep. 2017;6:187–94. [CrossRef]
- Wing RR, Lang W, Wadden TA, Safford M, Knowler WC, Bertoni AG, et al. Benefits of Modest Weight Loss in Improving Cardiovascular Risk Factors in Overweight and Obese Individuals With Type 2 Diabetes. Diabetes Care. 2011;34:1481–6. [CrossRef]
- Johns DJ, Hartmann-Boyce J, Jebb SA, Aveyard P, Behavioural Weight Management Review Group. Diet or exercise interventions vs combined behavioural weight management programs: a systematic review and meta-analysis of direct comparisons. J Acad Nutr Diet. 2014;114:1557–68. [CrossRef]
- LeBlanc ES, Patnode CD, Webber EM, Redmond N, Rushkin M, O’Connor EA. Behavioural and Pharmacotherapy Weight Loss Interventions to Prevent Obesity-Related Morbidity and Mortality in Adults: Updated Evidence Report and Systematic Review for the US Preventive Services Task Force. JAMA. 2018;320:1172–91. [CrossRef]
- Madigan CD, Graham HE, Sturgiss E, Kettle VE, Gokal K, Biddle G, et al. Effectiveness of weight management interventions for adults delivered in primary care: systematic review and meta-analysis of randomised controlled trials. BMJ. 2022;377:e069719. [CrossRef]
- Franz MJ, VanWormer JJ, Crain AL, Boucher JL, Histon T, Caplan W, et al. Weight-loss outcomes: a systematic review and meta-analysis of weight-loss clinical trials with a minimum 1-year follow-up. J Am Diet Assoc. 2007;107:1755–67. [CrossRef]
- Rotunda, W. Weight Loss in Short-Term Interventions for Physical Activity and Nutrition Among Adults With Overweight or Obesity: A Systematic Review and Meta-Analysis. Prev Chronic Dis. 2024;21. [CrossRef]
- Borek AJ, Abraham C, Greaves CJ, Tarrant M. Group-Based Diet and Physical Activity Weight-Loss Interventions: A Systematic Review and Meta-Analysis of Randomised Controlled Trials. Applied Psychology: Health and Well-Being. 2018;10:62–86. [CrossRef]
- Kupila SKE, Joki A, Suojanen L-U, Pietiläinen KH. The Effectiveness of eHealth Interventions for Weight Loss and Weight Loss Maintenance in Adults with Overweight or Obesity: A Systematic Review of Systematic Reviews. Curr Obes Rep. 2023;12:371–94. [CrossRef]
- Myers-Ingram R, Sampford J, Milton-Cole R, Jones GD. Effectiveness of eHealth weight management interventions in overweight and obese adults from low socioeconomic groups: a systematic review. Systematic Reviews. 2023;12:59. [CrossRef]
- Cavero-Redondo I, Martinez-Vizcaino V, Fernandez-Rodriguez R, Saz-Lara A, Pascual-Morena C, Álvarez-Bueno C. Effect of Behavioural Weight Management Interventions Using Lifestyle mHealth Self-Monitoring on Weight Loss: A Systematic Review and Meta-Analysis. Nutrients. 2020;12:1977. [CrossRef]
- Booth, M. Assessment of physical activity: an international perspective. Res Q Exerc Sport. 2000;71 Suppl 2:114–20. [CrossRef]
- Fat and fibre behaviour questionnaire: Reliability, relative validity and responsiveness to change in Australian adults with type 2 diabetes and/or hypertension - Reeves - 2015 - Nutrition & Dietetics - Wiley Online Library. https://onlinelibrary.wiley.com/doi/10.1111/1747-0080.12160. Accessed 30 Sep 2025.
- Caliendo M, Kopeinig S. Some practical guidance for the implementation of propensity score matching. Journal of Economic Surveys. 2008;22:31–72. [CrossRef]
- Kim, JH. Multicollinearity and misleading statistical results. Korean J Anesthesiol. 2019;72:558–69. [CrossRef]
- Alolayan RA, Aldisi DA, Hussain DS, Alafif N, Abulmeaty MMA. The Efficacy of Telehealth Versus In-Person Management Delivery in Adult Patients with Obesity. Healthcare (Basel). 2024;12:2190. [CrossRef]
- Cleo G, Glasziou P, Beller E, Isenring E, Thomas R. Habit-based interventions for weight loss maintenance in adults with overweight and obesity: a randomized controlled trial. Int J Obes. 2019;43:374–83. [CrossRef]
- Morgan PJ, Callister R, Collins CE, Plotnikoff RC, Young MD, Berry N, et al. The SHED-IT Community Trial: A Randomized Controlled Trial of Internet- and Paper-Based Weight Loss Programs Tailored for Overweight and Obese Men. Ann Behav Med. 2013;45:139–52. [CrossRef]
- Adebile TV, Adebile TM, Oloyede TF, Asifat OA, Biswas P, Sejoro S, et al. Telemedicine for obesity management among United States adults: A systematic and meta-analysis of intervention studies. J Telemed Telecare. 2025;31:1078–90. [CrossRef]
- Whitehall JM, Cook EJ, Vseteckova J, Jones K, Pappas Y, Donald L, et al. A systematic review of influences on engagement with remote health interventions targeting weight management for individuals living with excess weight. Int J Obes. 2025;49:1427–68. [CrossRef]
- Poupakis S, Kolotourou M, MacMillan HJ, Chadwick PM. Attendance, Weight Loss, and Participation in a Behavioural Diabetes Prevention Programme. Int J Behav Med. 2023;30:904–13. [CrossRef]
- Piernas C, MacLean F, Aveyard P, Ahern AL, Woolston J, Boyland EJ, et al. Greater Attendance at a Community Weight Loss Programme over the First 12 Weeks Predicts Weight Loss at 2 Years. Obes Facts. 2020;13:349–60. [CrossRef]
- Guarneiri LL, Kirkpatrick CF, Maki KC. Protein, fiber, and exercise: a narrative review of their roles in weight management and cardiometabolic health. Lipids Health Dis. 2025;24:237. [CrossRef]
- Kelly RK, Calhoun J, Hanus A, Payne-Foster P, Stout R, Sherman BW. Increased dietary fiber is associated with weight loss among Full Plate Living program participants. Front Nutr. 2023;10:1110748. [CrossRef]
- Howarth NC, Saltzman E, Roberts SB. Dietary fiber and weight regulation. Nutr Rev. 2001;59:129–39. [CrossRef]
- Ow Yong LM, Koe LWP. War on Diabetes in Singapore: a policy analysis. Health Research Policy and Systems. 2021;19:15. [CrossRef]
- Hu L, Illiano P, Pompeii ML, Popp CJ, Kharmats AY, Curran M, et al. Challenges of conducting a remote behavioural weight loss study: Lessons learned and a practical guide. Contemp Clin Trials. 2021;108:106522. [CrossRef]
Figure 1.
Control cohort selection flowchart.
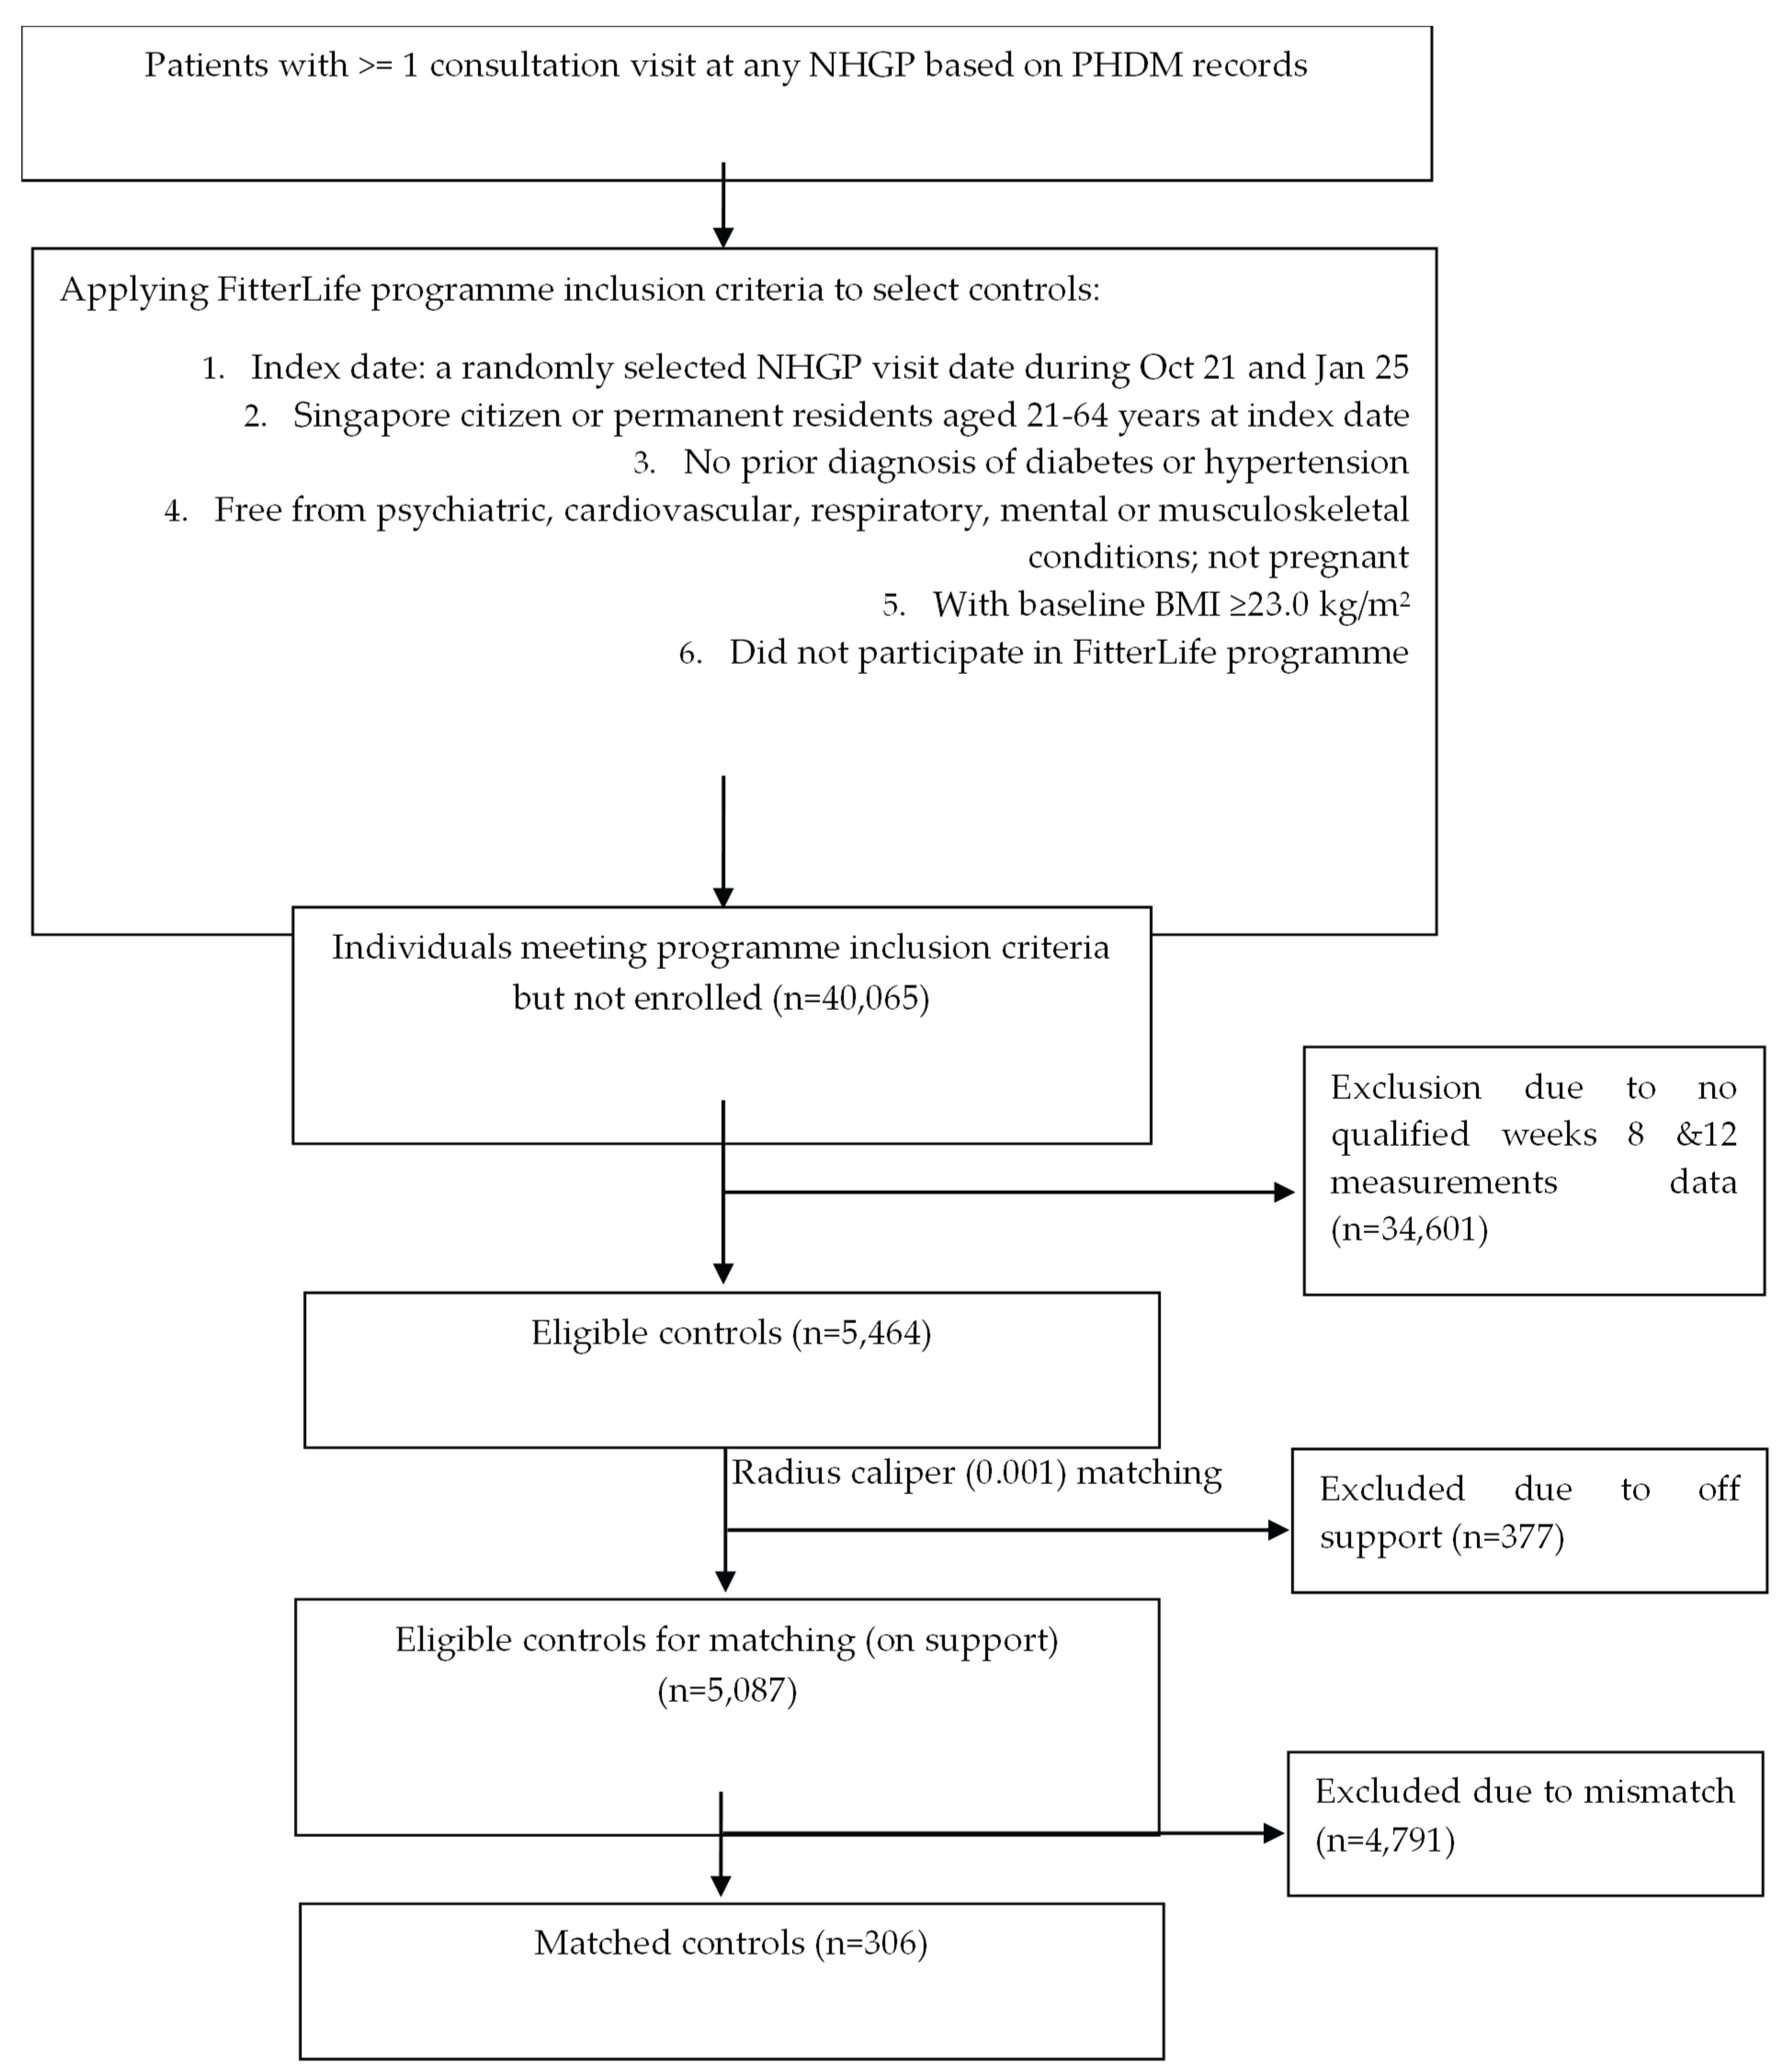
Figure 2.
Predicted weight trajectories by treatment group.
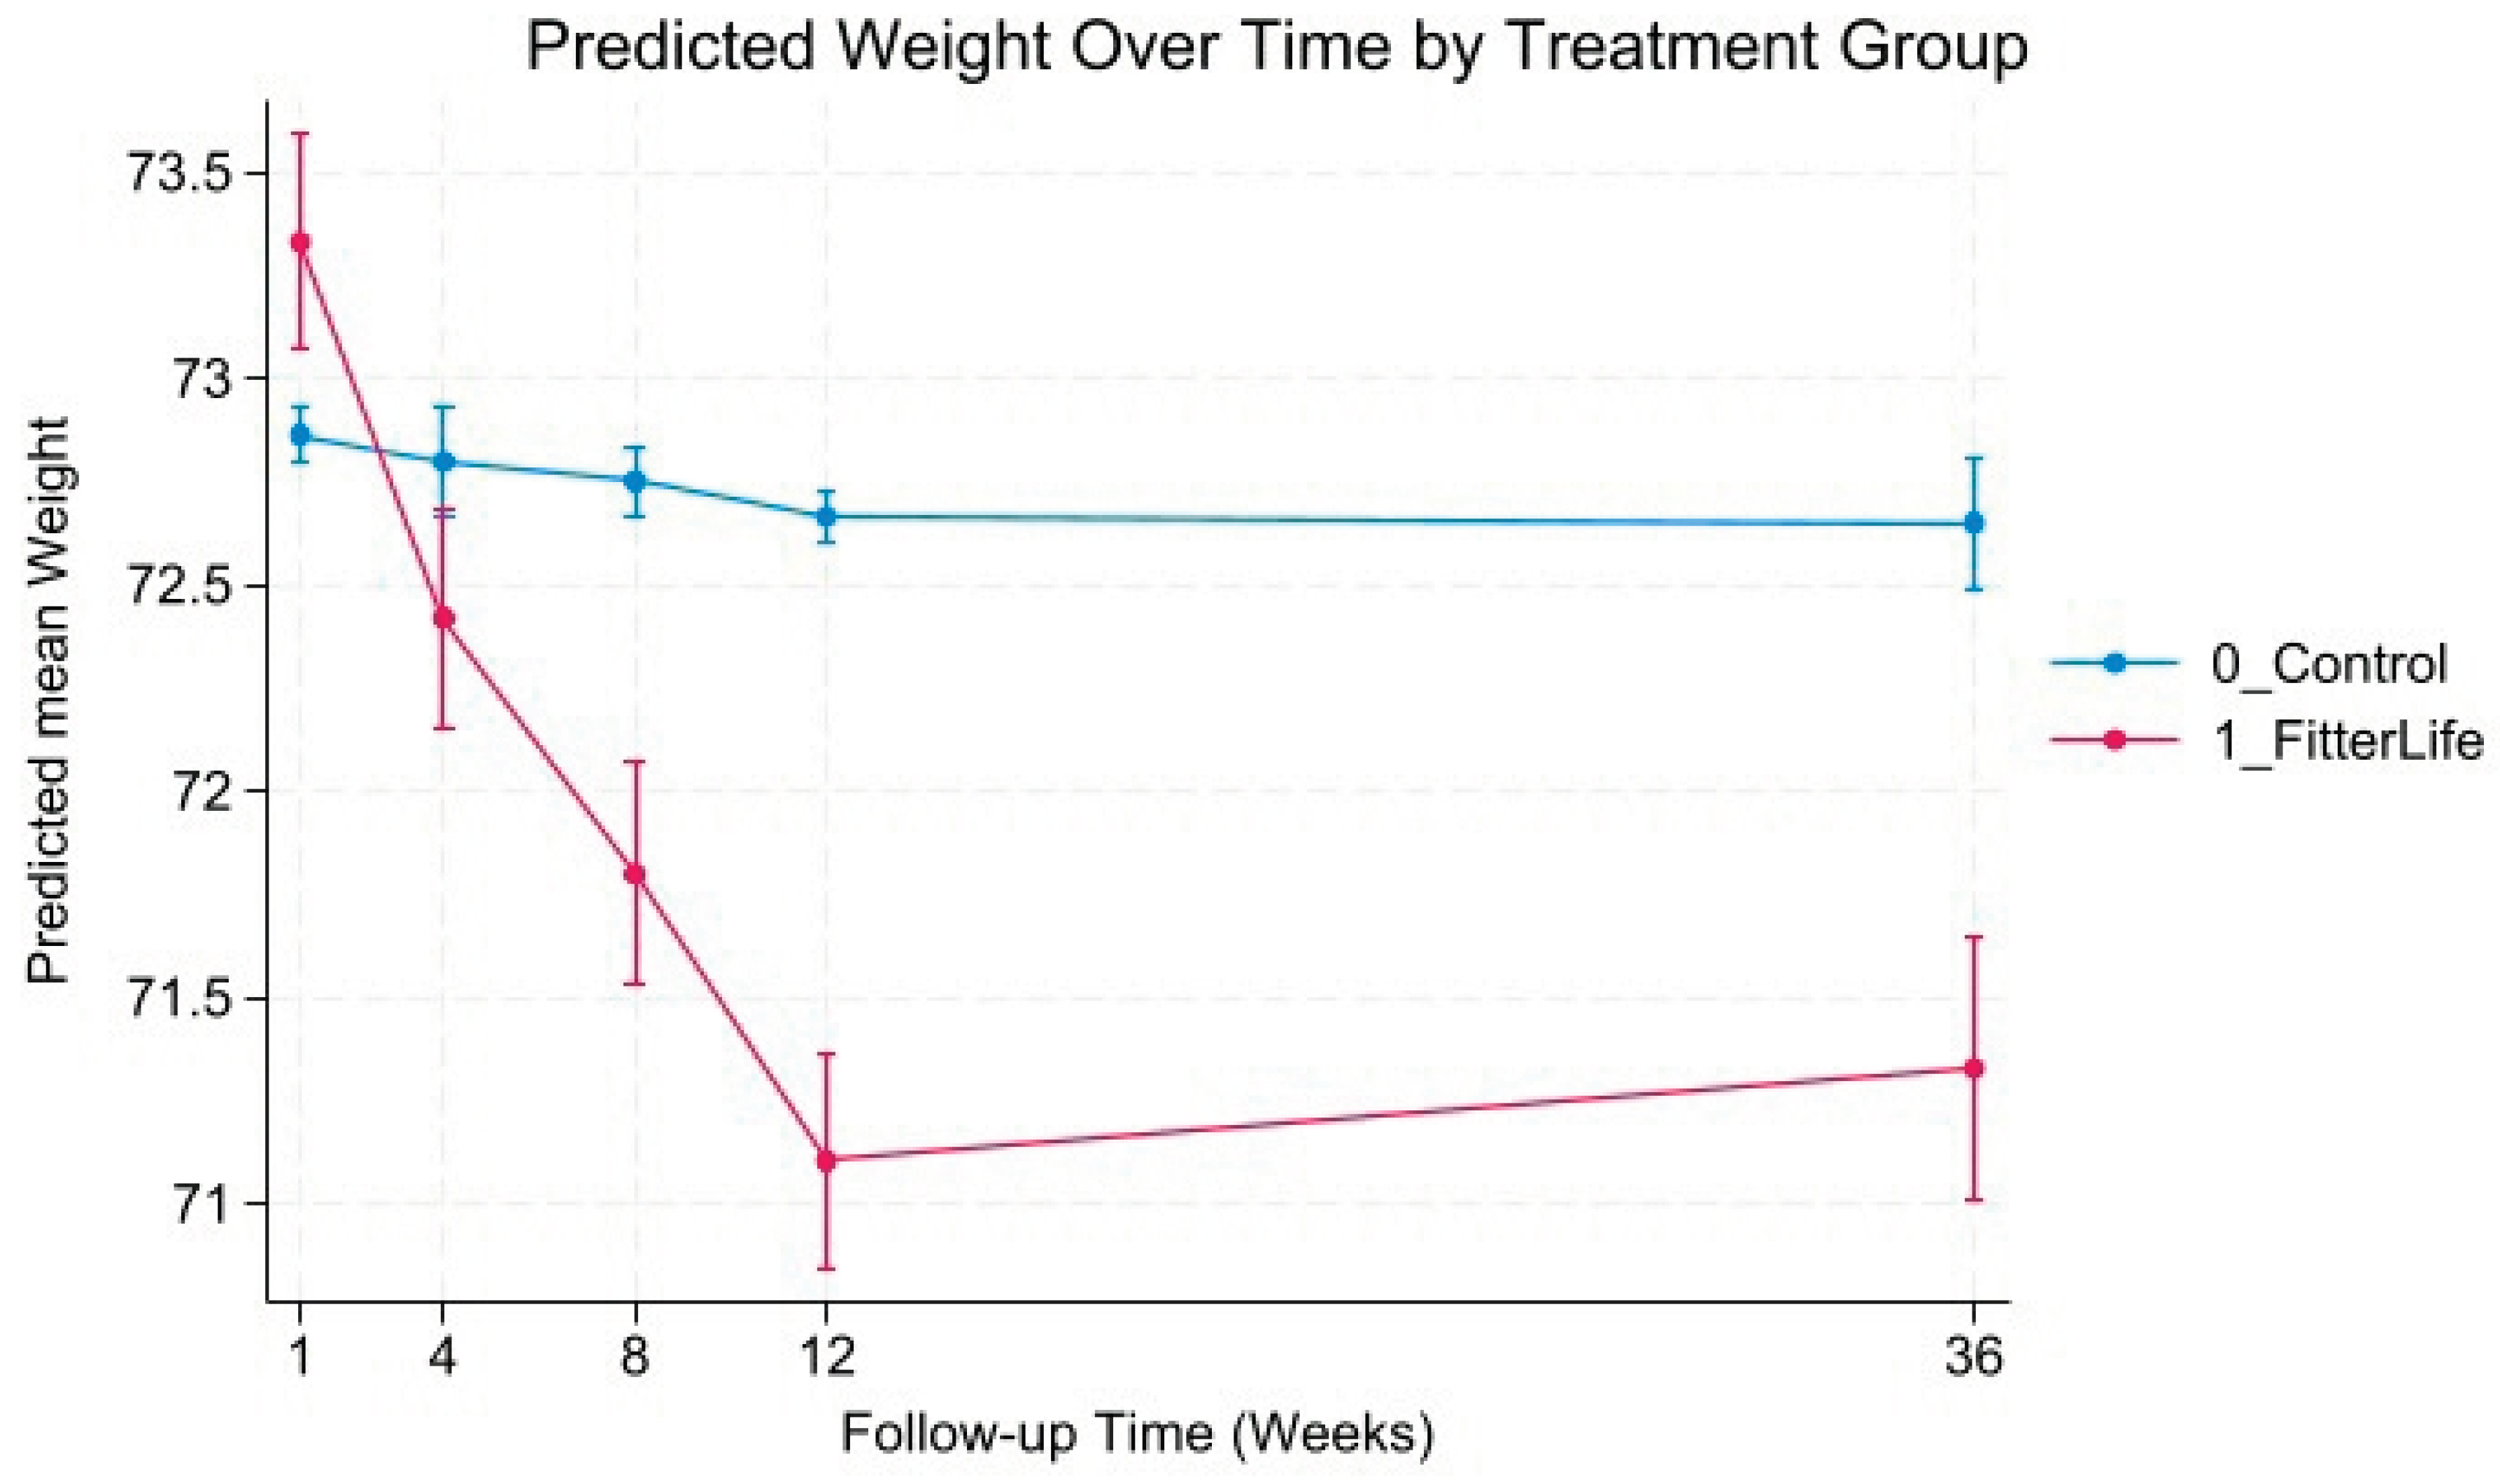
Figure 3.
Predicted weight change trajectories by treatment group.
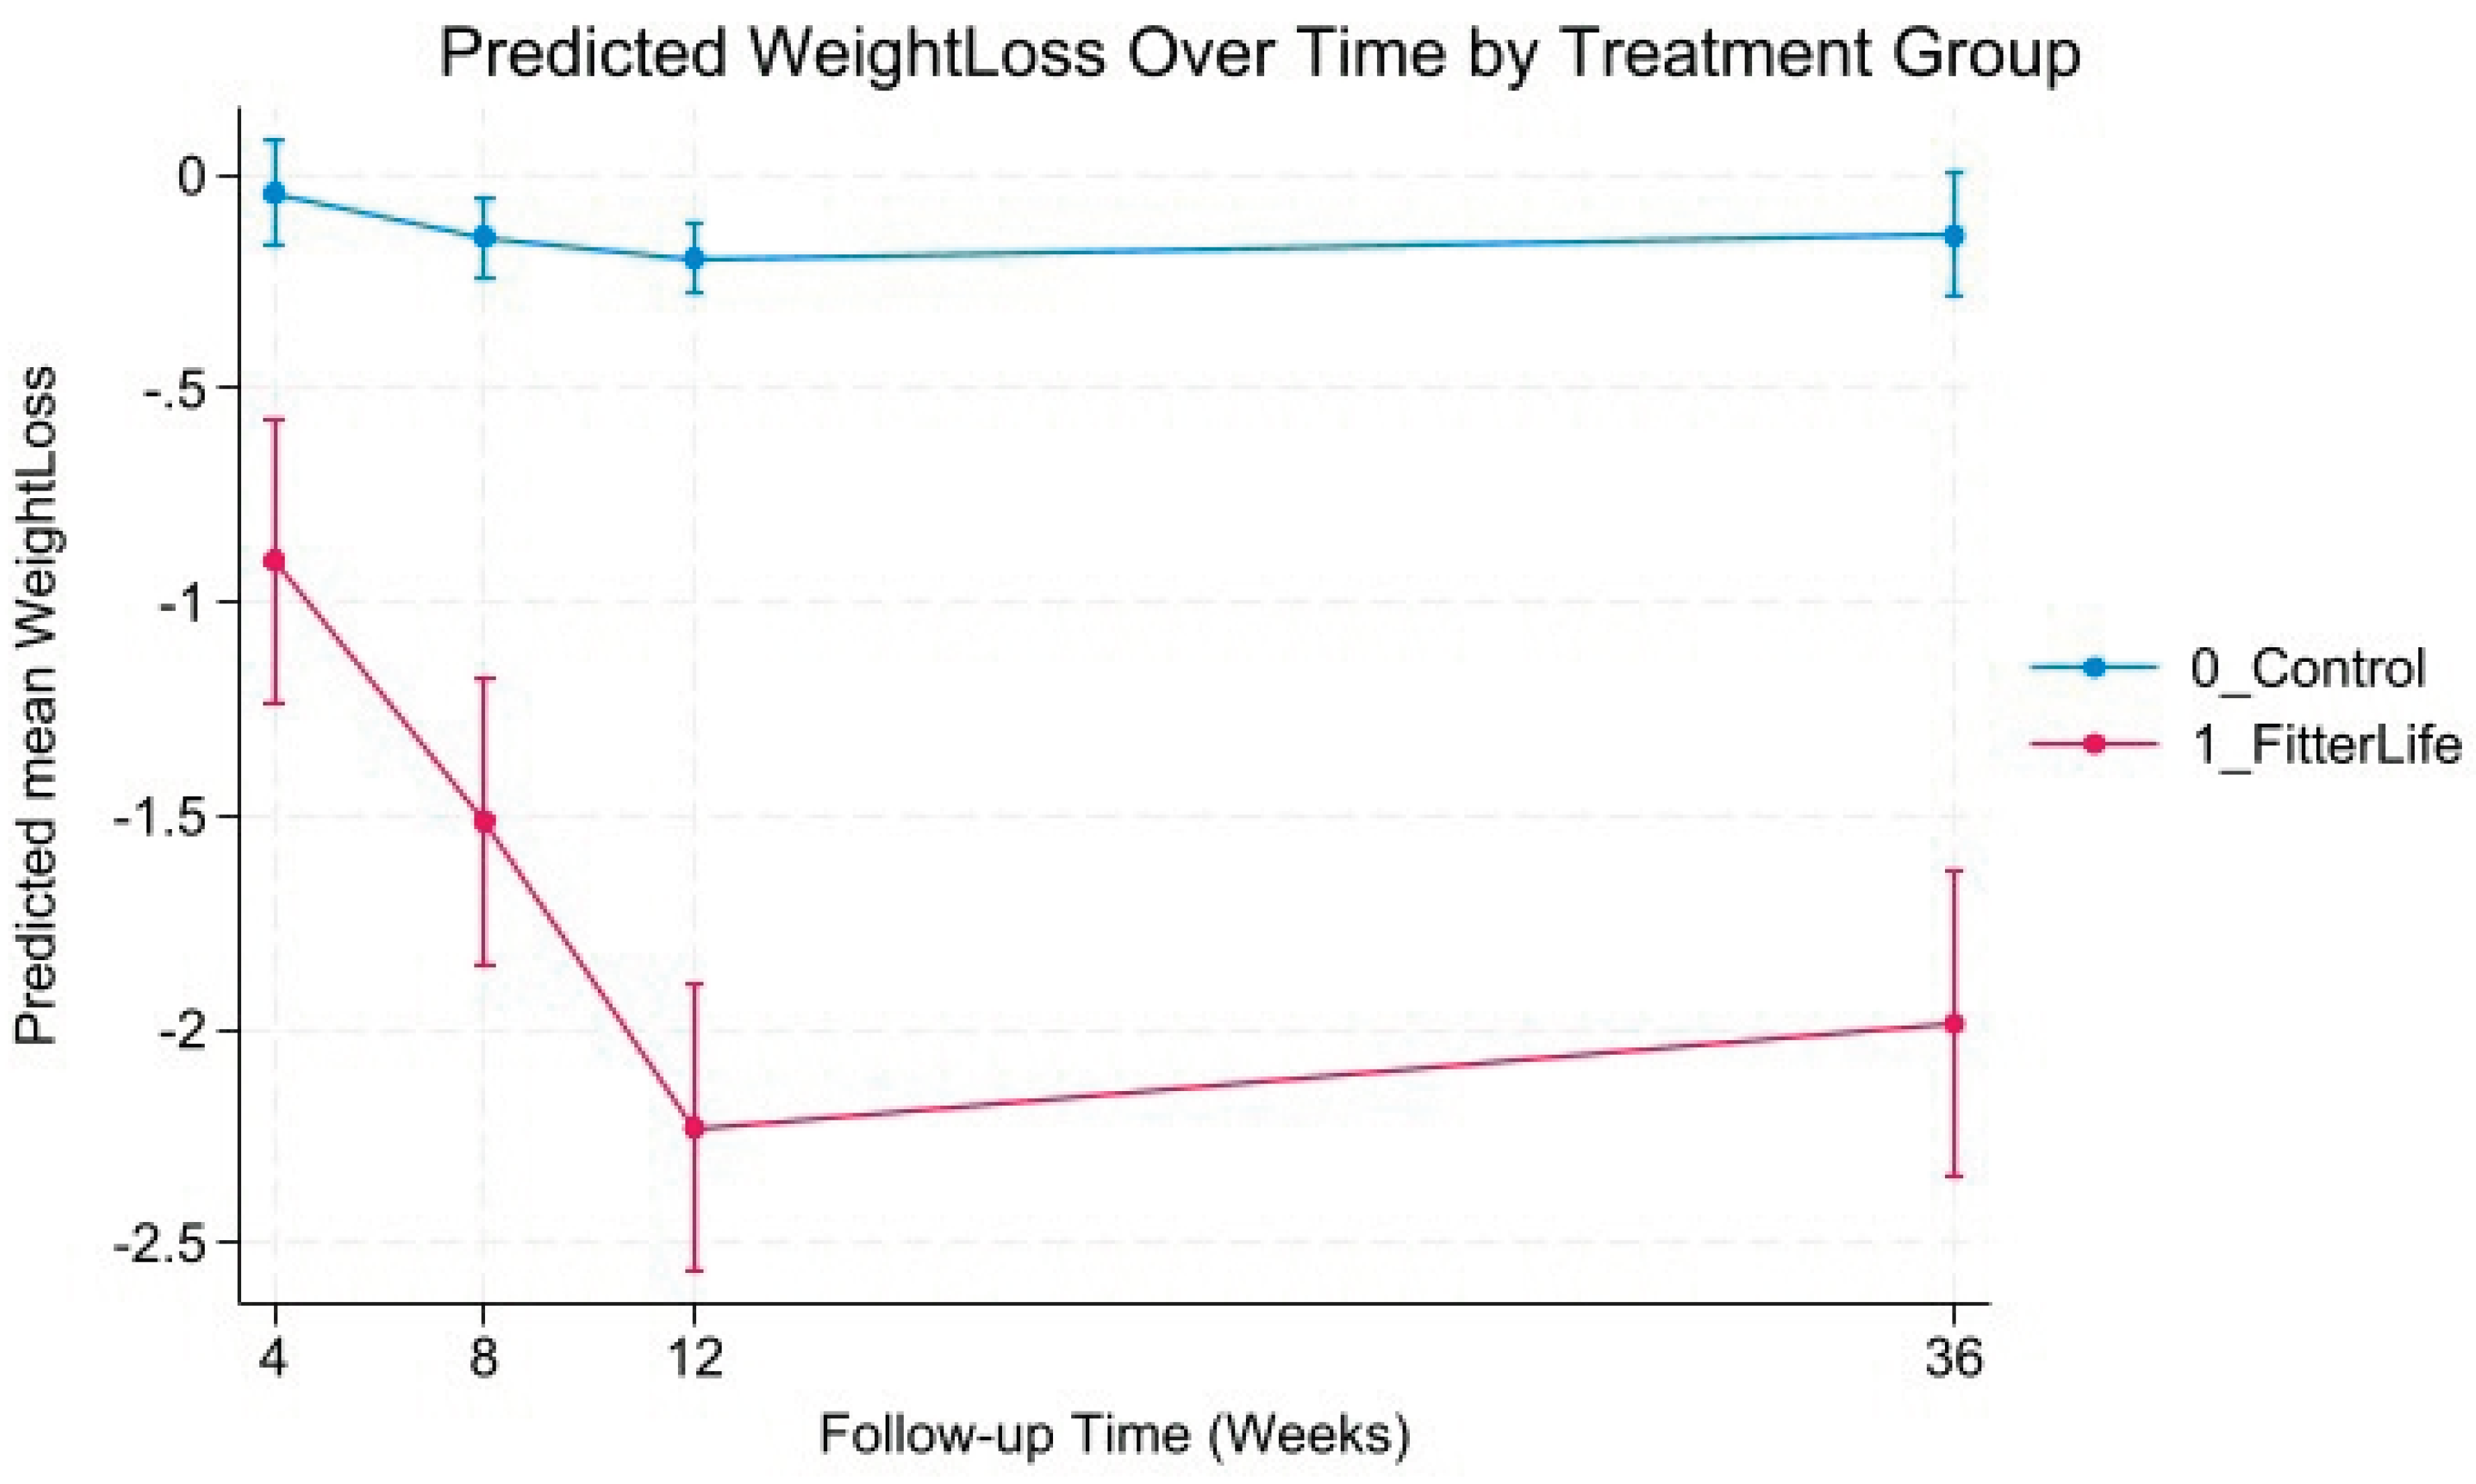
Figure 4.
Predicted BMI trajectories by treatment group.
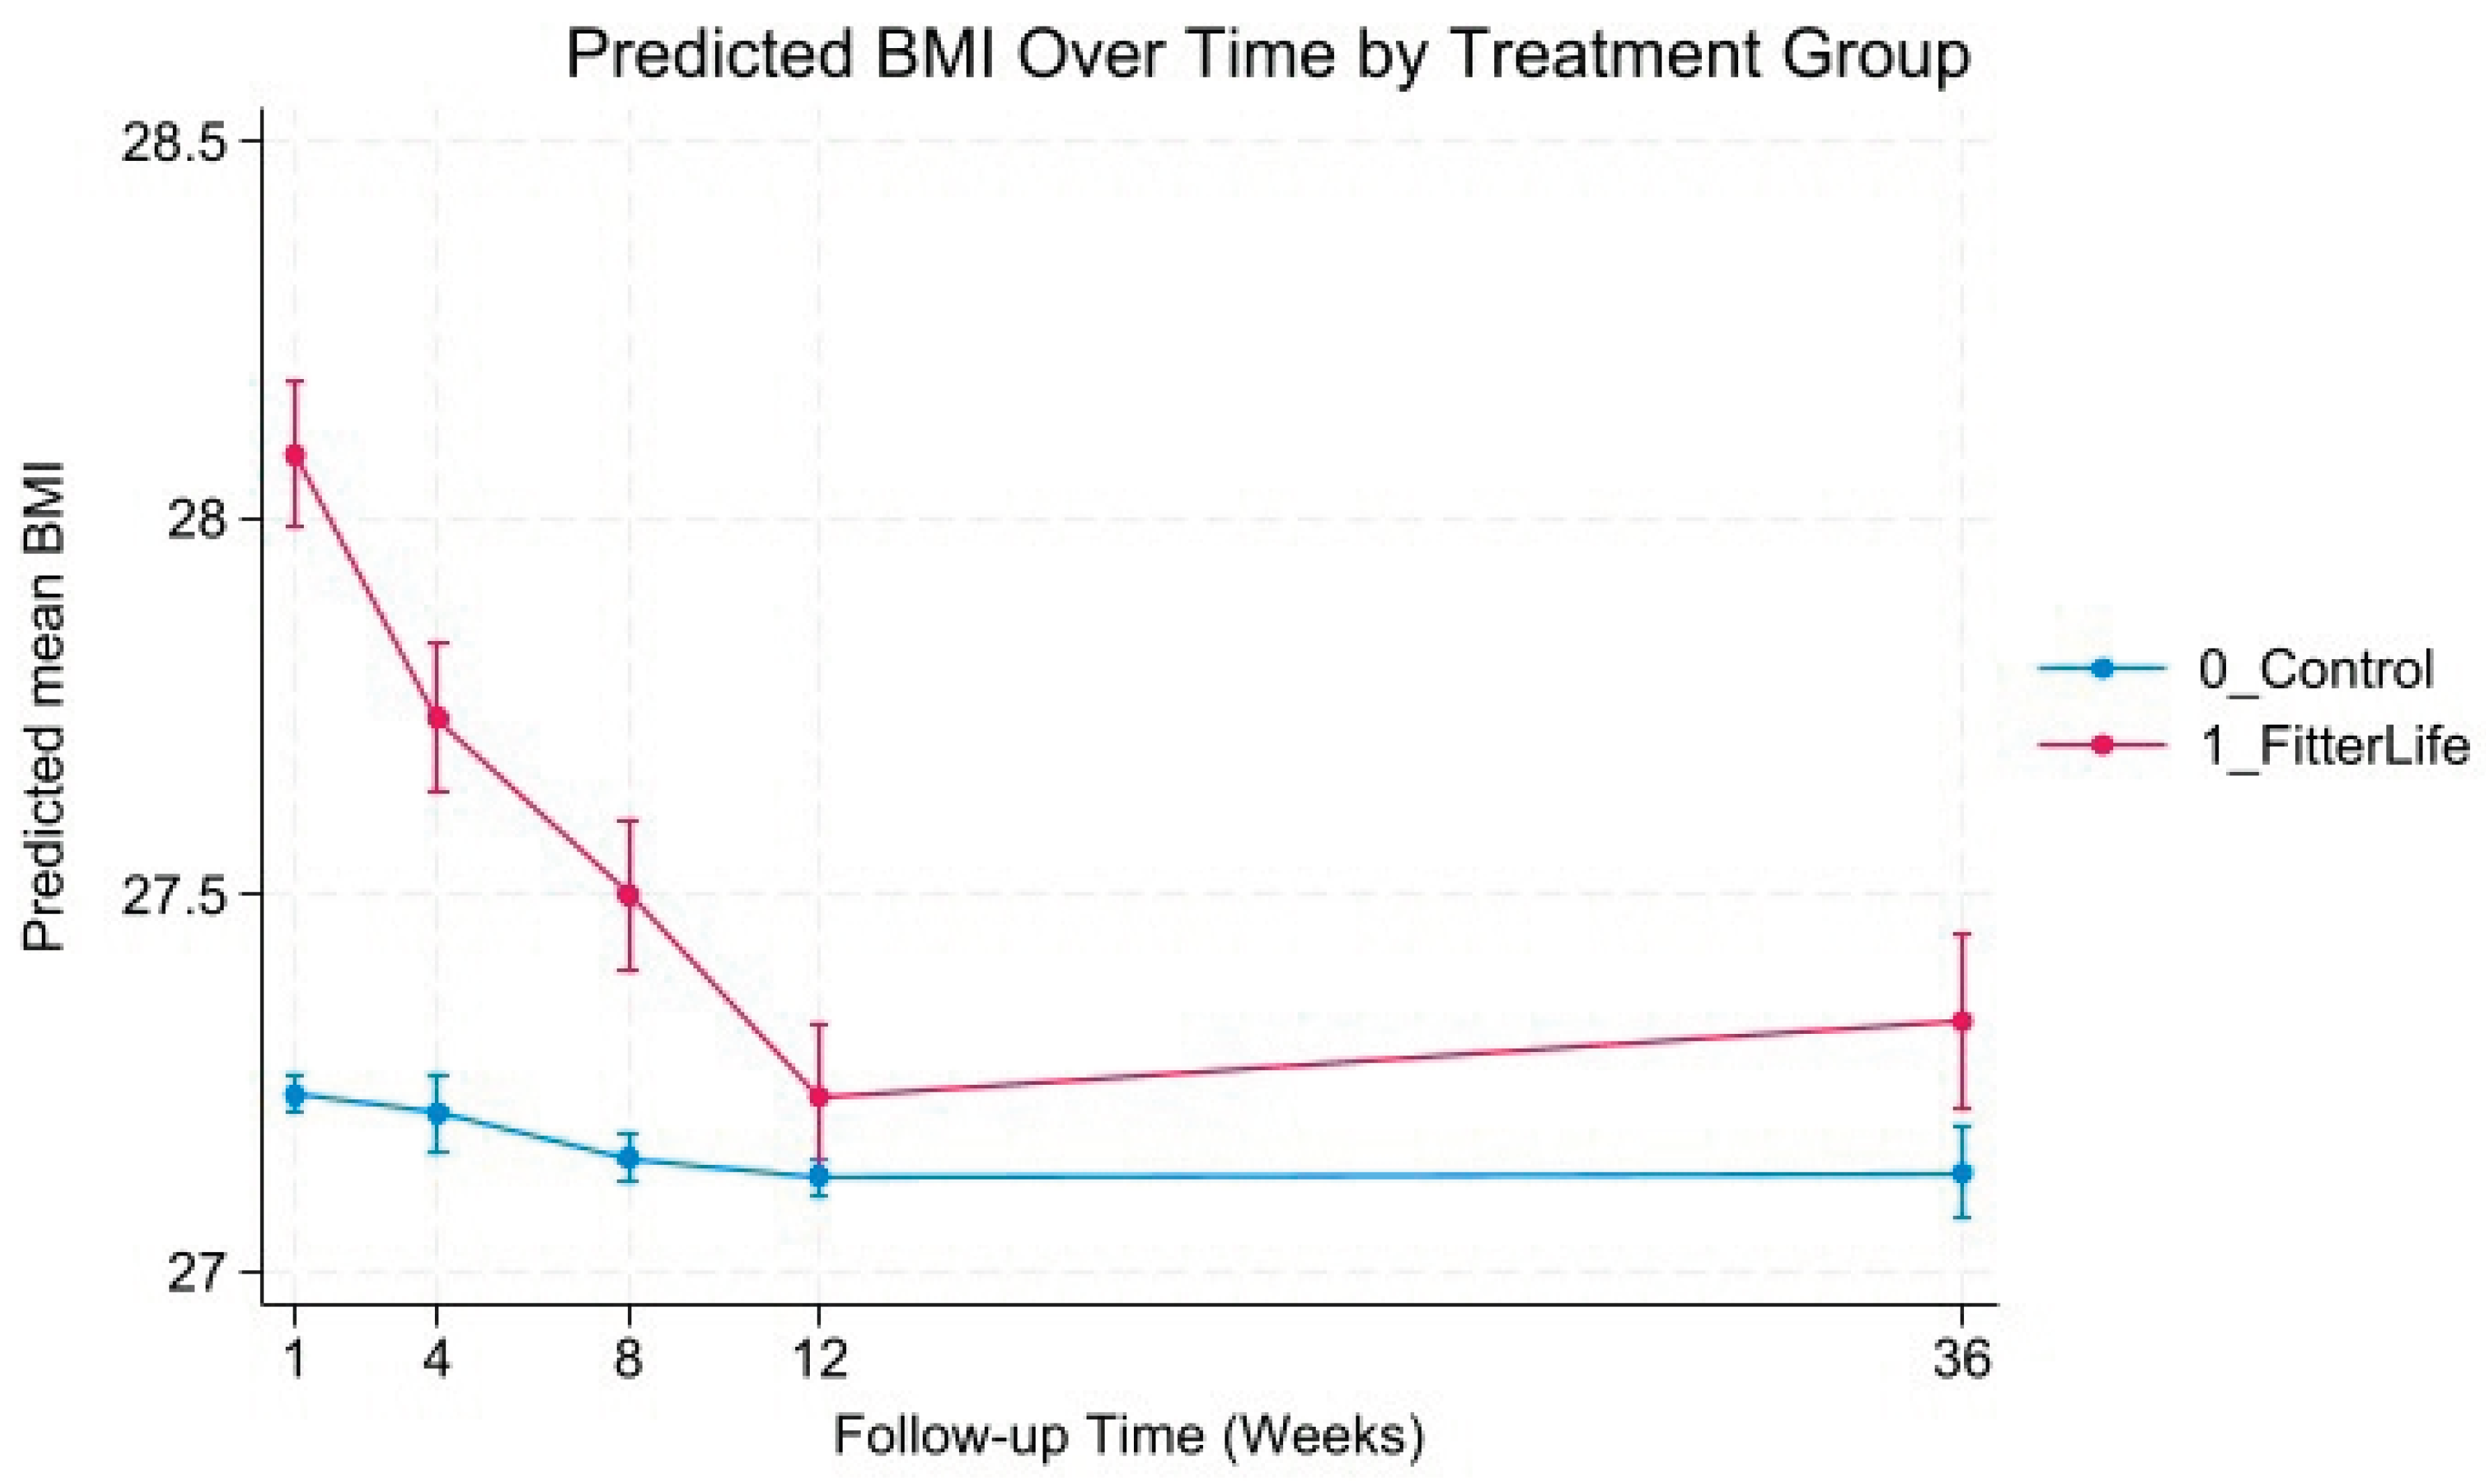
Figure 5.
Predicted BMI change trajectories by treatment group.
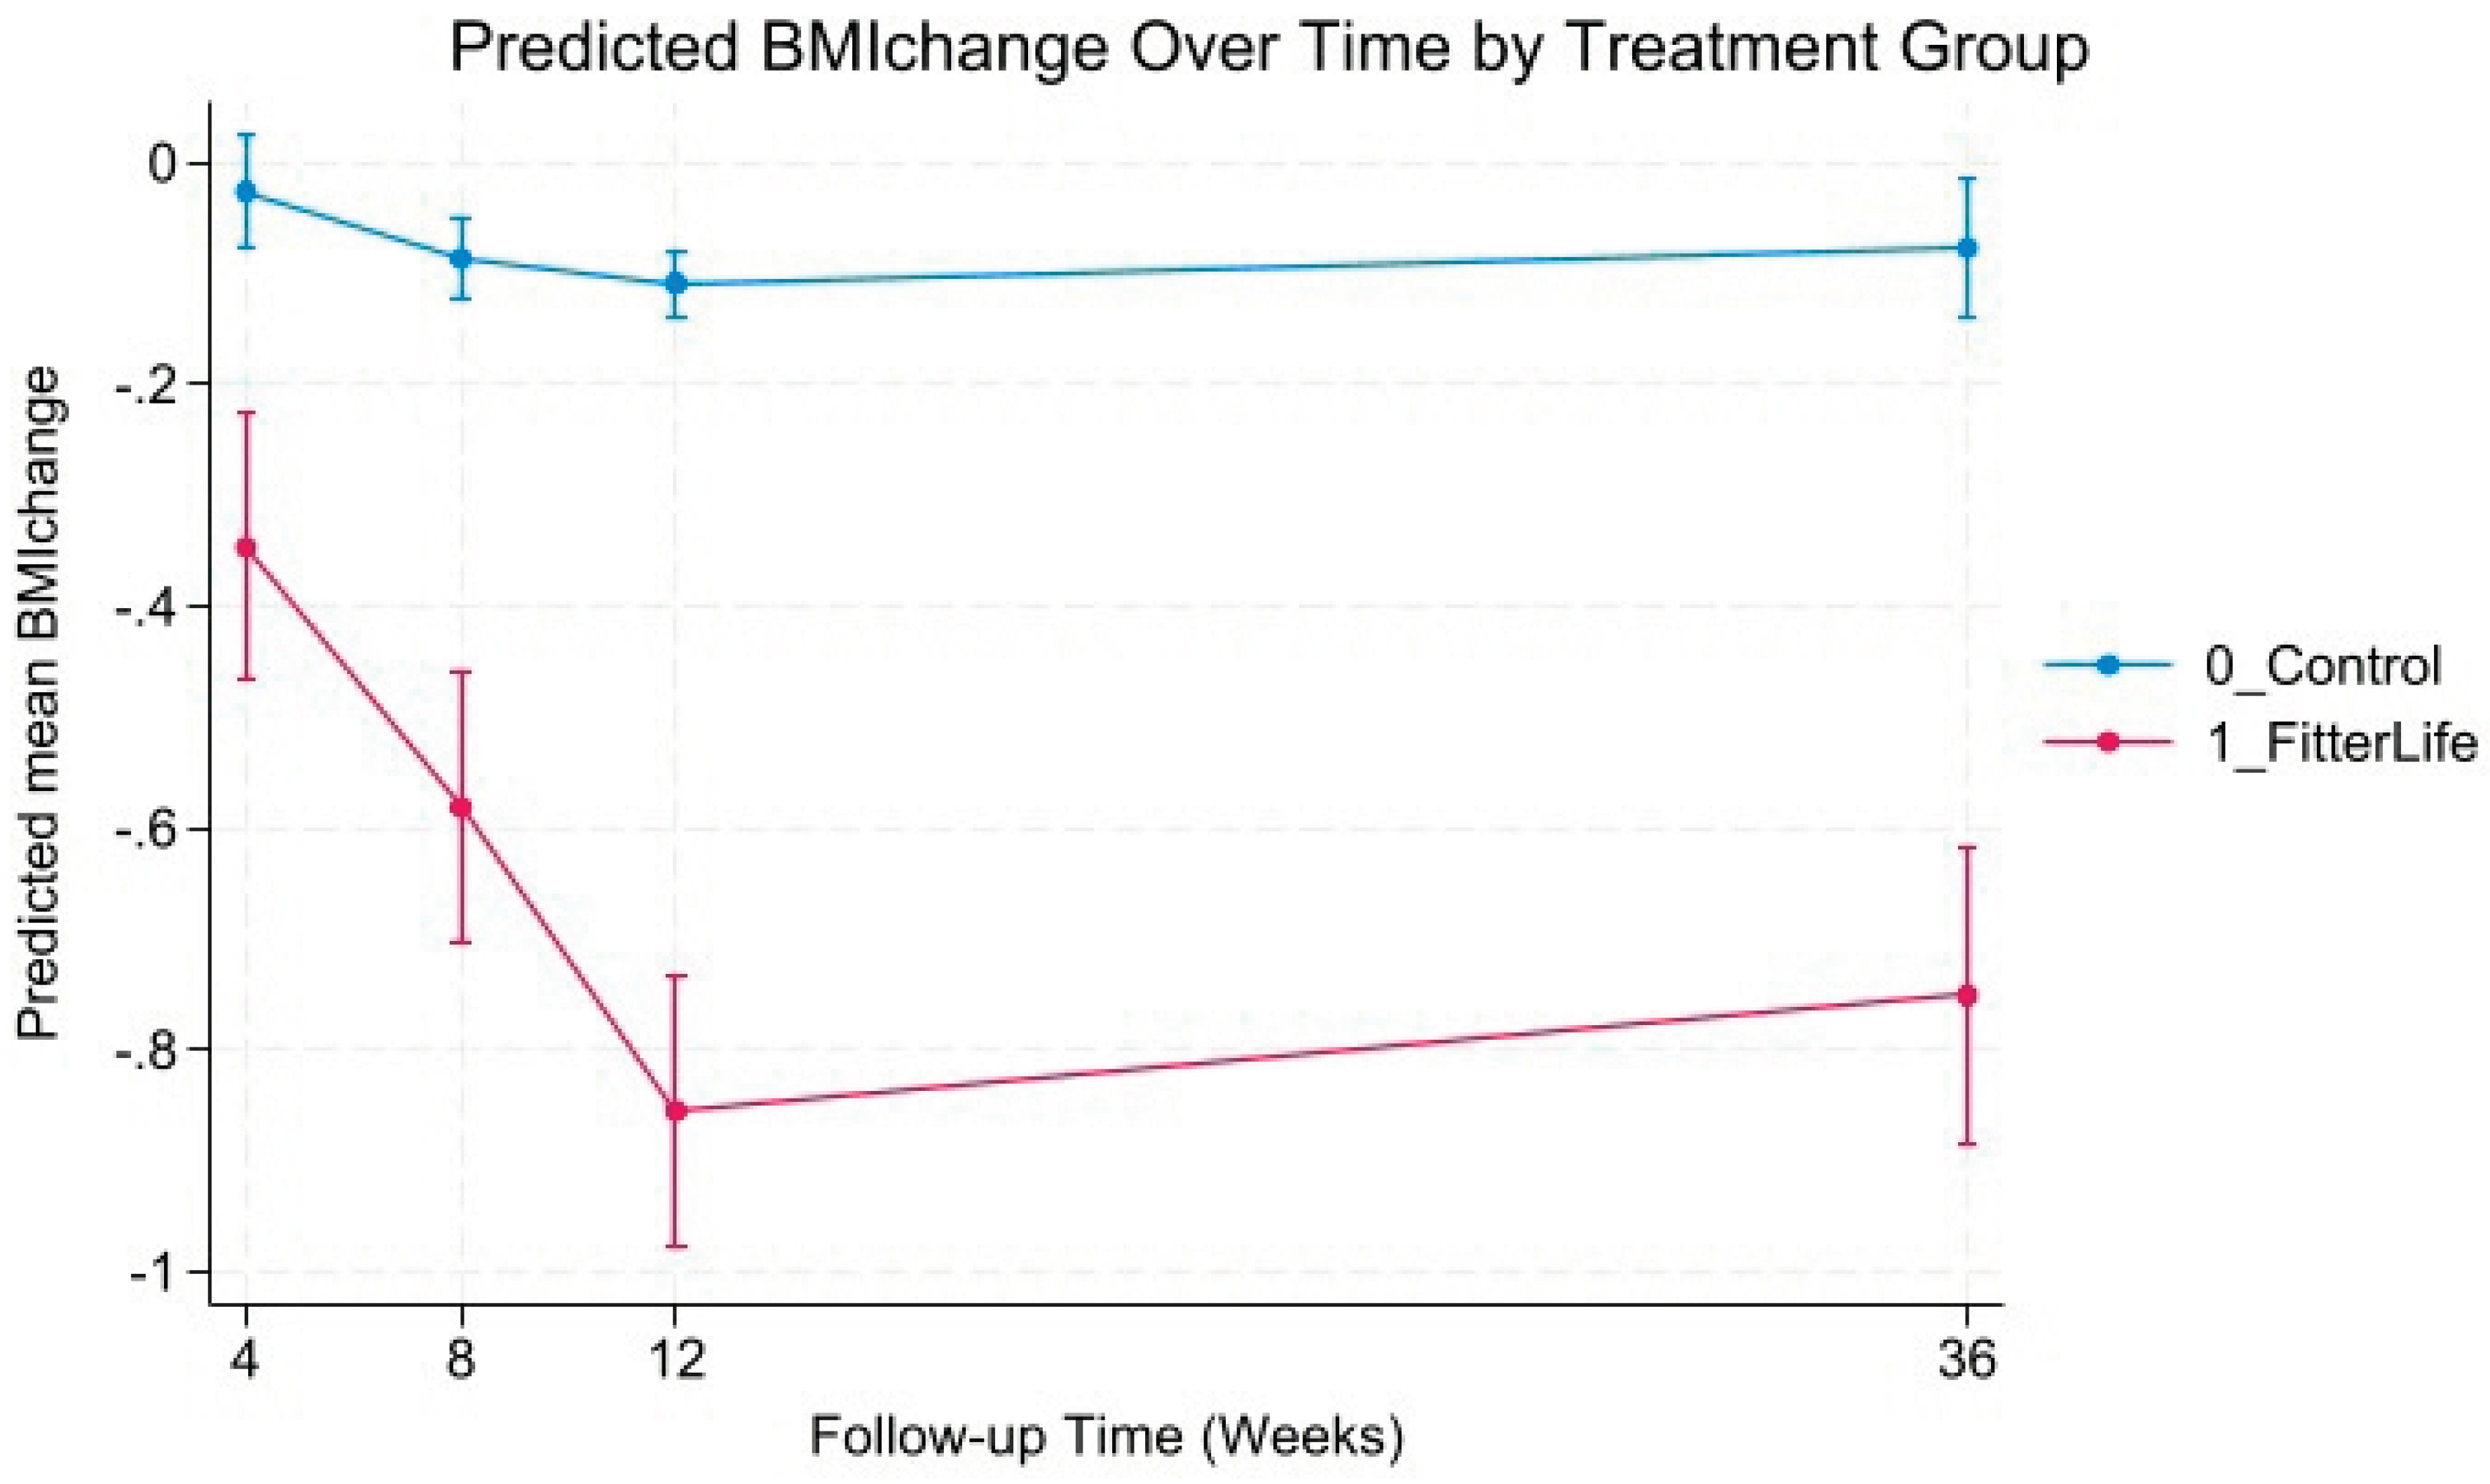

Table 1.
Baseline characteristics before and after matching.
| Baseline characteristics | Before matching | p-value | After matching | p-value | ||
|---|---|---|---|---|---|---|
| FitterLife | Control | FitterLife | Control | |||
| n=306 | n=5,087 | n=306 | n=306 | |||
| Age in years, mean ± SD | 47.8 ± 10.7 | 47.5± 11.9 | 0.676 | 47.8 ± 10.7 | 48.1 ± 11.6 | 0.805 |
| Gender, n (%) | <0.001 | 0.876 | ||||
| Male | 68 (22.2) | 2265 (44.5) | 68 (22.2) | 66 (21.6) | ||
| Female | 238 (77.8) | 2822 (55.5) | 238 (77.8) | 240 (78.4) | ||
| Chinese ethnicity, n (%) | 255 (83.3) | 3563 (70.0) | <0.001 | 255 (83.3) | 257 (83.9) | 0.853 |
| Weight in kg, mean ± SD | 73.6 ± 12.1 | 72.9 ± 12.2 | 0.325 | 73.6 ± 12.1 | 72.7 ± 12.0 | 0.125 |
| BMI in kg/m2, mean ± SD | 28.1 ± 3.6 | 27.2 ± 3.2 | <0.001 | 28.1 ± 3.6 | 28.0 ± 3.5 | 0.605 |
Table 2.
Effectiveness of FitterLife on Weight Loss at Week 12.
| Statistical methods | Outcome: Achieved weight loss target at week 12 (≥5% reduction in weight or ≥1 kg/m2 reduction in BMI) | ||||
|---|---|---|---|---|---|
| Control | FitterLife | P-value | Coefficient /Adjusted incidence rate ratio (ref: Control) | 95% confidence interval | |
| IPWRA (ATET) | 13.7% | 45.7% | <0.001 | 0.32 | 0.26, 0.38 |
| Modified Poisson regression on unmatched sample* | 644 (12.7%) | 140 (45.8%) | <0.001 | 3.32 | 2.85, 3.86 |
| Modified Poisson regression on matched sample* | 42 (13.6%) | 140 (45.8%) | <0.001 | 3.37 | 2.87, 3.93 |
* Adjusted for age, female, Chinese, and baseline BMI.
Table 3.
Behavioural factors associated with successful weight loss at week 12 (n=290).
| Behavioural factor | Outcome: Achieved weight loss target at week 12 (≥5% reduction in weight or ≥1 kg/m2 reduction in BMI) | ||||
|---|---|---|---|---|---|
| n (%) | p-value | Adjusted IRR (95% CI) | p-value | ||
| Sessions attended | 0.001 | 0.011 | |||
| 2 to 6 sessions (n=68) | 20 (29.4%) | Ref. | |||
| 7 to 9 sessions (n=222) | 115 (51.8%) | 1.63 (1.12, 2.37) | |||
| Change in fat intake score | 0.057 | ||||
| No change or increase (n=61) | 21 (34.4%) | Ref. | |||
| 0 to <20% decrease (n=166) | 79 (47.6%) | 1.46 (0.99, 2.16) | 0.057 | ||
| ≥20% decrease (n=63) | 35 (55.6%) | 1.66 (1.14, 2.42) | 0.041 | ||
| Change in fibre intake score | 0.001 | ||||
| No change or decrease (n=68) | 20 (29.4%) | Ref. | |||
| Increase (n=222) | 115 (51.8%) | 2.58 (1.30, 5.14) | 0.007 | ||
| Change in weekly MVPA | 0.013 | ||||
| No change or decrease (n=136) | 56 (41.2%) | Ref. | |||
| 0 to <1h increase (n=69) | 28 (41.6%) | 1.26(0.88, 1.81) | 0.202 | ||
| ≥1h increase (n=85) | 51 (60.0%) | 1.66 (1.24, 2.23) | 0.001 | ||
| Change in daily walking time | 0.079 | ||||
| No change or decrease (n=118) | 48 (40.7%) | Ref. | |||
| 0 to <16mins increase (n=79) | 35 (44.3%) | 1.03 (0.73, 1.47) | 0.859 | ||
| ≥16mins increase (n=93) | 52 (55.9%) | 1.77 (0.95, 1.70) | 0.104 | ||
Adjusted for age, sex, ethnicity, and baseline BMI. Abbreviation: BMI – body mass index, IRR – incidence rate ratio, MVPA – moderate-to-vigorous physical activity, Ref – reference .
Disclaimer/Publisher’s Note: The statements, opinions and data contained in all publications are solely those of the individual author(s) and contributor(s) and not of MDPI and/or the editor(s). MDPI and/or the editor(s) disclaim responsibility for any injury to people or property resulting from any ideas, methods, instructions or products referred to in the content. |
© 2025 by the authors. Licensee MDPI, Basel, Switzerland. This article is an open access article distributed under the terms and conditions of the Creative Commons Attribution (CC BY) license (http://creativecommons.org/licenses/by/4.0/).
Copyright: This open access article is published under a Creative Commons CC BY 4.0 license, which permit the free download, distribution, and reuse, provided that the author and preprint are cited in any reuse.


