Submitted:
07 November 2025
Posted:
10 November 2025
You are already at the latest version
Abstract
The growing demand for efficient hydrogen storage solutions highlights the need for reliable and safe composite overwrapped pressure vessels (COPVs). This study investigates the application of an inline monitoring system combining laser-based measurements and photogrammetric line photography to assess COPV quality during fabrication, including quantitative evaluation of liner concentricity and high-resolution line scanning of the composite surface to detect and measure fiber orientations. Fiber detection and angle measurement using the Hough Transform provide detailed assessment of local winding orientation, while global Fourier Transform analysis supports comparative evaluation across vessels or segments, allowing identification of dominant fiber directions and detection of micro-scale deviations. The integrated approach enables early detection of geometric inconsistencies and localized winding irregularities, providing robust performance-based criteria for accept-reject decisions, while filtering out minor noise and ensuring reliable quantitative evaluation. This framework enhances inline quality control, optimizes material usage, and supports the safe deployment of COPVs in hydrogen storage systems, contributing to efficient and reliable energy storage solutions.
Keywords:
hydrogen storage
; multi-supply-filament-winding
; composite overwrapped pressure vessel
; inline quality control
; line scanning
; laser triangulation
; liner surface measurement
; winding angle measurement
1. Introduction
The global energy sector is undergoing a profound and non-negotiable restructuring driven by two major pressures: the urgent need for decarbonization to meet net-zero targets by 2050 [1,2], and the strategic mandate for energy independence in the face of acute geopolitical and economic instability [3]. This structural transformation represents a pivotal shift away from centralized, fossil-fuel-dependent models toward a distributed, resilient, and clean energy network. The stability of established energy demand patterns has been fundamentally challenged, compelling industrial nations to prioritize energy security alongside environmental responsibility.
The impetus for the energy transition transcends long-term climate targets and has been acutely amplified by immediate global economic and security shocks. The crisis that intensified in the 21st century began with a rapid economic rebound following the global pandemic, which quickly strained energy supply chains and revealed critical fragility in the just-in-time global energy infrastructure. This fragility was subsequently and severely exacerbated by geopolitical risks, which contributed to unprecedented spikes in natural gas and oil prices not seen since 2008 [3]. This dramatic volatility underscored the severe, systemic vulnerability inherent in relying on globally traded fossil fuels, which still account for nearly 60 percent of electricity generation and the majority of greenhouse gas emissions [2]. Consequently, the strategic objective of energy independence has evolved from a long-term economic goal into an immediate, critical national security imperative.
Despite this significant deployment, renewable energy sources like solar and wind inherently suffer from volatile factors such as daylight hours, specific weather conditions, and non-uniform regional availability. This inherent variability presents a profound challenge to achieving reliable resource adequacy and maintaining consistent grid stability, especially as societies move toward widespread electrification [4]. Addressing these supply-demand gaps requires comprehensive energy storage solutions capable of absorbing excess generation and dispatching power when renewables are unavailable.
While energy storage systems, which are utilizing batteries are experiencing exponential growth, their application currently focuses primarily on short-duration flexibility, such as frequency regulation and energy shifting over periods of a few hours [5]. The true scale of the intermittency challenge, however, indicates that energy storage must be capable of bridging gaps that span not merely hours, but days or even weeks, if intermittent renewables are to fully displace dispatchable, base-load generation capacity [6]. This requirement for long-duration, high-density energy storage exposes the limitations of current battery technology for extended retention periods and for mobile applications where weight and volume are paramount. Furthermore, industry sectors, like steel or cement production, as well as long-distance transport, where direct electrification is technically or economically infeasible is expected to rely on hydrogen as a fuel source in the future [7]. In light of the limitations posed by renewable intermittency and the density challenges of conventional battery storage, hydrogen (H₂) has emerged as an essential, flexible energy carrier and storage medium capable of storing energy efficiently over extended periods (weeks or months) [8].
In the long-distance transport sector, hydrogen is usually compressed at high pressures, predominantly 700 bar, to increase the volumetric energy density during transport [9]. Meeting this stringent density requirement within the severely constrained volume and weight envelope of mobile applications mandates the use of high strength materials. Composite Overwrapped Pressure Vessels (COPVs) have proven to be a suitable solution, typically consisting of a polymer liner, which minimizes hydrogen permeation, and a full overwrap of high-strength fibers, such as carbon fiber, applied through filament winding. This combination provides the superior gravimetric energy density required for mobile hydrogen storage, while maintaining structural integrity under high-pressure conditions [10].
Although filament winding is largely automated, deviations still occur that demand a detailed understanding of the underlying process parameters [11]. The current COPV production practices do not adequately address these variations. One reason for the distribution in COPV loading capacity could be explained by fluctuations in manufacturing parameters. Even minor operational deviations during the filament winding process, such as gaps between fiber layers, uneven resin distribution, or out-of-tolerance winding angles, can critically compromise the structural integrity and mechanical response of the composite overwrap [12].
Given the catastrophic potential of high-pressure failures, such as a "burst before leak" mode historically documented in aerospace applications, manufacturers are obligated to incorporate high, necessitates the use of conservative safety margins in their designs [13,14].
This engineering response creates a detrimental safety-cost feedback loop: high manufacturing uncertainty necessitates a high safety factor, which in turn inflates the required mass and material usage. Especially in the automotive industry it is projected that not only millions of electric but also fuel cell vehicles will be on the road by 2033, underlining the necessity of an efficient and economical production of COPVs [15].
The objective of this research is to establish a first approach for the inline detection of laminate defects during production of COPVs, contributing to an integrated framework for scale production of COPVs through synchronized digital quality assurance and high-efficiency manufacturing innovation. This strategy aims to bridge the gap between the design process of COPV and the manufacturing processes, allowing to intervene should there any quality parameters exceed their tolerances, preventing the waste of resources. Moreover, future systems can provide customers with a certificate of production, verifying the quality of the manufactured product.
This work investigates two complementary digital quality control methods for COPV manufacturing. First, a quantitative laser-based assessment of the liner is used to evaluate its concentricity, allowing the detection of excessive deformations and potential flaw propagation, such as deviations in the winding angle, which could lead to local stress peaks during operation. In parallel, a digital visual monitoring system is employed to characterize the structural integrity of the composite laminate and the precision of the winding pattern, enabling the assessment of surface quality and the identification of defects such as variations in tow width or fiber bridging. Together, these methods provide the process data necessary to explore performance-based accept-reject criteria and inform strategies for optimizing material usage and ensuring reliable component quality.
By gathering process data, the research provides the necessary foundation to establish reliable, performance-based “accept-reject criteria”, thereby allowing engineers to optimize the material usage and prevents the use of resources for components that do not meet quality requirements.
2. Materials and Methods
2.1. COPV Manufacturing
In COPV production, the vessels are classified into four main types based on the liner material and the degree of composite overwrapping. This classification reflects differences in structural design, load-bearing mechanisms, and weight efficiency, which are critical factors in their application for hydrogen storage. The choice of COPV type affects not only the mechanical performance and safety but also the manufacturing complexity and material consumption. Table 1 summarizes the key characteristics of each COPV type.
Among the four types, Type IV COPVs are particularly attractive for advanced energy storage solutions due to their high specific energy and lightweight construction. However, their structural reliance on the composite overwrap makes them especially susceptible to manufacturing defects, highlighting the critical importance of comprehensive quality control during production. The demand for Type IV COPVs is steadily increasing, particularly driven by their growing use in fuel cell vehicles [15], which makes time- and resource-efficient manufacturing processes critical.
To address this need, the application of multi-supply filament winding (MFW) has become increasingly important. This technique enables the placement of a larger quantity of material per winding cycle onto the mandrel, significantly enhancing productivity and overall manufacturing speed. MFW is positioned as the key technological step necessary to achieve the high-efficiency, standardized mass production volumes required to meet accelerating global transport sector demands. By bridging the technological gap between high-performance design principles and real-world industrial output through integrated quality control and high-speed manufacturing, this research provides a critical framework for securing the safe, reliable, and cost-effective deployment of hydrogen storage technology, thereby supporting the global drive toward decarbonization and energy independence. Figure 1 illustrates a schematic representation of the Muratec MFW machine [16].
The MFW machine operates somewhat differently from conventional winding equipment, relying on solely rotating mandrel and a transversally moving fiber payout-eye. While the mandrel rotates as usual, it also moves transversally during the winding process. Fibers are guided onto the mandrel, starting from a creel and passing through a precision tensioning system. Using specialized fiber guides—which move transversally on an axis orthogonal to the mandrel’s rotation and can also rotate at their ends—the fibers are positioned in parallel along the mandrel. This method enables precise placement not only in the cylindrical region but also across the dome areas, effectively minimizing fiber slippage and reducing overlap.
2.2. Liner Surface Measurement
Type IV vessels usually rely on blow molded liners. This method is very common due to its fast-processing time and producing little waste. However, these liners tend to shrink while cooling down. Depending on geometric parameters, like the wall thickness and length of the vessel, the shrinking behavior can be substantial, resulting in a noticeable smaller diameter of the vessel. This may lead to deviations in winding angle and wall thickness of the COPV, potentially reducing the loadbearing capabilities and safety of the vessel. These defects will extend throughout the entire component, since all adjacent layers are going to inevitably pass on the liner contour and the resulting winding pattern, including laminate build-up and sections of lower thickness.
To ensure proper concentricity, a Micro-Epsilon optoNCDT 1420 [17] laser triangulation distance sensor was installed at a fixed position above the liner’s surface to continuously record the distance. The sensor operates within a measurement range of 10–500 mm, with a reproducibility of 0.5 µm and a linearity of 0.08 % of the full-scale output. Its adjustable measurement rate of up to 8 kHz allows high-speed monitoring of moving components. An active surface compensation algorithm is implemented to reduce the influence of surface reflectivity and color variations on the measurement results. The liner’s radius can be determined through calibration with an object of known diameter based on the measured distance values. The schematic setup of the measurement system is shown in Figure 2.
During measurement, the liner rotates beneath the distance sensor for complete revolutions under steady conditions, without acceleration or deceleration. After each revolution, the vessel is moved transversally, and the procedure is repeated along the entire length of the mandrel. A surface marker on the liner allows the identification of each full revolution and ensures accurate synchronization of the measured data. The collected measurements are used to evaluate the overall quality and geometric conformity of the liner.
2.3. Geometric Surface Characterization
Following laser-based surface measurements, the captured point cloud data can be subjected to systematic processing to evaluate the geometric consistency of the blow-molded liner. Typical pre-processing steps include noise reduction, alignment, and smoothing, which help mitigate artifacts introduced by surface reflections or minor sensor inconsistencies. The area of interest is usually the cylindrical section of the vessel, where measurement coverage is most reliable. Surface markers used for rotation synchronization may be removed to avoid bias in subsequent analysis, and data points can be interpolated over linearly spaced rotational angles to reconstruct uniform circumferential measurements along the vessel length.
For feature extraction, radial characteristics of the liner can be quantified. For each circumferential cross-section, the mean radius and standard deviation provide an initial estimate of dimensional consistency. While this approach is computationally efficient, misalignment during measurement can artificially inflate the standard deviation, potentially masking the true geometric fidelity. Therefore, a more informative parameter is the liner’s eccentricity, which quantifies deviations from a perfect circular cross-section in both magnitude and orientation.
To determine eccentricity, classical circle fitting algorithms, such as the Kåsa method [18] based on algebraic least squares, can be applied to each circumferential point set. The fitting minimizes the squared differences between measured points and a circle of radius and center :
This method provides robust estimation even in the presence of noise and is particularly well-suited for full circumferential measurements. By analyzing the fitted center coordinates along the longitudinal axis of the liner, variations in the rotational axis can be visualized, allowing quantification of both the magnitude and direction of eccentricity over the vessel length.
The resulting radial profiles, which include mean radius, standard deviation, and eccentricity, offer a comprehensive basis for evaluating dimensional conformity. This analysis can support the assessment of potential deviations that may influence fiber winding quality and provides a link between laser measurement data and the subsequent evaluation of fiber orientation and winding uniformity.
2.4. Photogrammetric Surface Scanning
Multiple factors influence the resulting winding pattern and winding angle. A deformed liner can affect the distribution of winding angles, and manufacturing challenges, such as fiber slippage, may also lead to deviations. Maintaining quality parameters within specified tolerances is essential for system safety and efficient use of materials and time. An optical approach is proposed to enable automatic detection of irregularities in the winding pattern.
2.4.1. Side Photography and Cylindrical Unwrapping
The simplest method for acquiring photographic images of the vessel surface involves positioning a camera at a fixed distance above the rotating vessel, as illustrated in Figure 3. Due to spatial distortions from its cylindrical geometry, camera calibration is required to ensure accurate spatial referencing and dimensional precision. The captured images must then be processed to computationally unwrap the cylindrical surface onto a plane, enabling correct visualization and precise measurement of geometric features [19,20].
Sequential photographic imaging of a rotating cylindrical vessel provides a basic method for surface acquisition, but it has inherent limitations. Distortions at the edges of the unwrapped cylindrical images can lead to loss of detail and inaccuracies in representing the surface geometry, potentially obscuring small defects or variations. These shortcomings highlight the need for more robust measurement techniques, such as dedicated surface scanners, which provide higher fidelity and more reliable dimensional data.
2.4.2. Rotational Scanning and Image Stitching
To capture high-resolution surface data of the pressure vessel, a line scanner is positioned at a fixed, predefined distance to maintain consistent measurement geometry. The CarboScreen GmbH Line Scan system [21] used in this study performs linear pixel acquisition and can be calibrated using a measurement stick or gauge of known dimensions. It includes integrated single- or bidirectional illumination with a focal range extending up to 11 mm above the measured surface. Speeds of 128 mm/s for color scanning at 600 dpi and 385 mm/s for grayscale scanning at 300 dpi are achieved. This configuration provides dimensional measurements suitable for further analysis, and Figure 4 illustrates the arrangement with the scanner fixed relative to the pressure vessel.
The vessel is rotated at a constant angular velocity while a line scan camera captures sequential linear pixel data across the surface. These individual lines are computationally assembled to form a continuous composite image, representing the full circumference and length of the scanned region. This composite image does not contain distortions associated with the cylindrical geometry of the vessel, preserving the detailed fiber architecture of the surface and providing input for subsequent quantitative analysis of fiber orientation and defect detection.
Figure 5 illustrates a high-resolution surface scan of the composite pressure vessel, covering its entire 360-degree circumference. The image, captured by a line-scan camera, reveals fine surface details and serves as input for quantitative analysis of fiber orientation and defect detection. It presents the full circumferential scan of the cylindrical section of the wound vessel with a circumference of about 1100 mm and a width of 300 mm, recorded at 300 dpi in greyscale. To minimize shadowing effects, bidirectional illumination was deliberately used.
2.5. Winding Angle Measurement
The aim of this methodology is to determine the fiber winding angles [22,23] and evaluate the uniformity of filament-wound composite pressure vessels. Accurate fiber orientation assessment is critical for structural integrity and performance. A dual-method approach is employed:
- Fast Fourier Transform (FFT) – for global, averaged analysis of fiber orientation and overall winding pattern uniformity [24].
The workflow proceeds sequentially: FFT is applied first to obtain an overview of dominant winding directions, followed by HT for fine-scale analysis of local variations and potential defects. This combination leverages the computational efficiency of FFT for global trends and the precision of HT for localized inspection.
2.5.1. Global Winding Angle Measurement
The two-dimensional FFT converts a spatial image into a frequency representation:
where and are the image dimensions, and are frequency indices, and is the imaginary unit.
The amplitude spectrum quantifies the magnitude of periodic structures in the image:
The resulting magnitude spectrum visualizes the spatial frequency content of the surface texture, with bright regions indicating dominant fiber orientations (see Figure 6).
Figure 6 presents the FFT magnitude spectrum of the composite surface, with axes labeled (horizontal frequency) and (vertical frequency). The X and Y axes are swapped relative to the conventional FFT output to enable a more intuitive assessment of fiber angles. In this schematic representation, angles are measured from the center of the spectrum: the line extending horizontally to the right corresponds to 0°, the line pointing vertically upwards corresponds to 90°, and intermediate lines represent the corresponding intermediate angles. Bright regions indicate dominant spatial frequencies associated with primary fiber orientations.
To extract orientation information, the spectrum is expressed in polar coordinates:
where is the radial distance from the origin in the frequency domain, and is the angle with respect to the horizontal axis.
The angular energy distribution is computed as:
where denotes the total spectral energy along each angle in the frequency domain. The resulting distribution of spectral energy as a function of angle is shown in Figure 11.
The practical implementation involves the following steps:
- Pre-processing: Convert the surface images to grayscale and apply a Hanning window to minimize edge effects.
- FFT computation: Compute the 2D FFT and scale the magnitude logarithmically to enhance low-intensity components.
- Spectral filtering: Apply radial and angular averaging filters to suppress noise and emphasize dominant frequency orientations.
- Orientation estimation: Compute the angular distribution and identify peaks corresponding to primary fiber directions.
- Regularity assessment: Analyze peak sharpness and symmetry to quantify the uniformity of the winding pattern.
The FFT method offers several advantages. It enables global estimation of fiber orientation across the surface and demonstrates strong robustness to local noise, ensuring reliable results even in the presence of imaging artifacts. Additionally, the method is computationally efficient, making it suitable for processing high-resolution images. Furthermore, FFT is highly sensitive to both fiber angles and periodic spacing irregularities, allowing for detailed assessment of winding patterns and uniformity.
Despite its strengths, the FFT method has certain limitations. It performs poorly on non-periodic or highly irregular textures, where the frequency-domain representation may not capture meaningful patterns. The method is also unable to detect local defects, such as broken or missing fibers, since it primarily provides a global overview of the surface.
2.5.2. Local Winding Angle Measurement
HT detects linear features by mapping edge points from the spatial domain to a parametric line space :
where is the perpendicular distance from the origin, and is the angle between the x-axis and the line normal.
The accumulator array records votes for all lines passing through each edge point:
where is the binary edge image and is the Dirac delta function. Peaks in correspond to dominant fiber orientations (Figure 7).
Figure 7 presents the Hough Transform accumulator, where color intensity represents the number of votes for each combination. The black background corresponds to minimal votes, red lines indicate moderate accumulation, and the yellow central region shows a high concentration of overlapping lines. This visualization reveals the primary fiber orientation while also highlighting less frequent deviations in fiber alignment.
In the accumulator, represents the angle of the normal to a line relative to the x-axis, rather than the orientation of the line itself. To relate the high-intensity regions in the accumulator to actual fiber orientations on the image, detected lines are converted to real-space angles using the coordinates of their endpoints. In practice, discrete implementations, such as the probabilistic HT, extract line segments , from which the fiber angle is computed:
The detected fiber paths overlaid on a subset of the original surface image illustrate local fiber orientations (Figure 8), corresponding to the first 1000 rows of the full original image in Figure 5 and rotated 90 degrees clockwise.
The practical implementation involves the following steps:
- Pre-processing: Convert images to grayscale and apply Gaussian or median filtering.
- Edge detection: Apply Canny or Sobel operators to generate a binary edge map.
- HT space transformation: Map each edge pixel to space to construct the accumulator array.
- Peak detection: Identify local maxima to determine dominant fiber angles.
- Orientation mapping: Overlay detected lines on the original image to analyze local fiber direction.
- Outlier filtering: Apply statistical methods to remove false detections or spurious lines that do not represent actual fiber orientations.
- Defect assessment: Examine deviations in line spacing and angle to detect gaps, overlaps, or misalignment.
HT offers several key advantages. It provides accurate estimation of local fiber orientations, capturing detailed alignment information at the micro-scale. The method is also robust to noise, partial occlusions, and discontinuities, allowing reliable detection even in challenging imaging conditions. Moreover, it provides a direct geometric interpretation of fiber lines, making it intuitive to visualize and analyze the spatial arrangement of fibers on the surface.
Despite its benefits, the HT has several limitations. It is computationally intensive, particularly when applied to high-resolution images, which can increase processing time. The method is also sensitive to edge detection parameters, requiring careful tuning to ensure accurate line identification. Additionally, its performance is limited on curved or highly irregular fibers, where the linear approximation may not accurately capture the true fiber trajectories.
2.5.3 Integration of FFT and HT
FFT offers a global characterization of fiber orientation and overall winding uniformity, capturing the macro-scale patterns across the entire composite surface. In contrast, the HT provides a local, high-resolution analysis of individual fiber trajectories, enabling the detection of micro-scale deviations and defects. By integrating FFT and HT, it is possible to perform a hierarchical evaluation in which regions identified by FFT as exhibiting significant deviations are subsequently examined in detail using HT. This combined approach facilitates a comprehensive, quantitative assessment of fiber alignment, encompassing both large-scale uniformity and localized irregularities, thereby enhancing the effectiveness of quality control procedures for filament-wound composite structures.
3. Results and Discussion
3.1. Liner Surface Measurement
The measured surface of the liner was captured as a point cloud, with a lateral movement of 10 mm along the z-axis between consecutive circumferential measurements (Figure 9). Some artefacts were observed in the boss region, while the dome region showed limited or no measurement values, primarily due to reflection issues that prevented accurate sensor readings. A marker of constant width was visible in the data and used to synchronize distance measurements with the liner’s rotation.
The color-coded point cloud indicates the distance to the rotational axis of the vessel, providing a visualization of the liner’s eccentricity. The fitted circle centers were calculated using the Kåsa method [18] for each circumferential cross-section along the cylindrical portion of the liner (Figure 9).
Figure 10.
Course of eccentricity for the length of the cylindrical vessel section.
The concentricity analysis revealed a small eccentricity of approximately 1 mm, consistent along the entire length of the cylindrical section. Minor misalignment of the rotational axis was observed, likely related to the fitting of the boss system. These results indicate minimal deformation of the liner due to shrinkage after production, suggesting that deviations in fiber winding angles are unlikely to stem from geometric imperfections. Instead, process-related factors, such as variations in fiber tension or slippage on the deposition roller, are more likely contributors to the observed discrepancies in winding angles.
These observations highlight the importance of controlling manufacturing parameters during filament winding. Even when the liner exhibits good concentricity, operational variations can lead to local misalignments affecting the structural performance of the composite overwrap. Inline monitoring and quality control systems are therefore essential to ensure consistent fiber placement and reduce the risk of defects. Future work could explore active compensation strategies, such as adjusting liner pressure during winding to counteract deformations that exceed defined thresholds, thereby minimizing the risk of measurable laminate defects.
3.2. Winding Angle Measurement
The use of a high-resolution line scanner allows comprehensive acquisition of the composite surface, providing input data for quantitative evaluation of fiber winding angles. The captured surface images support both global and local analyses, enabling assessment of overall pattern uniformity and fine-scale deviations.
3.2.1. Global Winding Angle Measurement
The angular energy distribution obtained from the FFT analysis is presented in Figure 11. Four distinct peaks are observed at winding angles of 11°, 167°, 191°, and 347°, corresponding to the two intersecting fiber systems in the cross-ply winding pattern. Each fiber system is represented by two peaks oriented approximately 180° apart.
Analysis of the peak positions indicates that the cross-ply winding pattern consists of two main fiber orientations relative to the central line perpendicular to the vessel axis: approximately +11° (opposite peak at 191°) and –13° (measured as 347° on the polar plot, opposite peak at 167°). These four peaks reflect the two intersecting fiber systems with different inclinations, forming the cross-ply structure.
It should be noted that, due to the limited resolution of the surface image and areas where individual fibers are not clearly distinguishable, the absolute values of the measured winding angles may not be perfectly accurate. Nevertheless, the FFT-based analysis provides consistent relative angle measurements, making it a useful tool for comparative studies between different vessels or different segments of the same vessel. This allows the method to reliably indicate differences or deviations in fiber orientation even if the exact absolute angles are slightly uncertain.
3.2.2. Local Winding Angle Measurement
To assess the local fiber orientation on the surface of the COPV, a histogram of the angles of detected lines (as shown in Figure 8) was constructed, presented in Figure 12. The histogram highlights two dominant peaks corresponding to the primary winding directions. Bars in the negative angle region (green) represent fibers with a negative slope, while bars in the positive angle region (blue) represent fibers with a positive slope.
The histogram analysis shows that the main composite structure is fairly uniform, with most fibers forming two primary winding directions. Real winding defects would appear as a change in the fiber angle affecting a substantial number of fibers, rather than individual lines. Thus, Figure 12 allows identification of the dominant winding angles and assessment of local fiber orientation uniformity, providing a basis for further quantitative evaluation of winding quality.
Figure 13 shows the distribution of detected fiber angles for the two dominant winding directions. The plots illustrate the overall variability of fiber orientation within each primary winding system.
The boxplots demonstrate that the median provides a robust and reliable estimate of the winding angle for each fiber group, with –6.02° for the negative angles and +6.91° for the positive angles. The HT enables local detection of actual fiber angles, offering more precise values compared to the global FFT, which provides only averaged estimates and may be influenced by local variations or noise. Overall, Figure 13 illustrates the distribution and variability of fiber orientations, showing that the HT-based analysis allows accurate quantitative assessment of dominant winding angles and local deviations.
Overall, the combined use of FFT and HT provides a comprehensive approach for evaluating fiber winding angles in COPVs. FFT offers a global perspective, identifying the main fiber orientations and their relative relationships, while HT enables precise local assessment of individual fiber trajectories. Together, these methods allow both large-scale pattern consistency and micro-scale deviations to be quantified, providing a robust framework for assessing winding quality and ensuring structural reliability of the composite overwrap.
4. Conclusions
In this work, the feasibility of integrating a laser-based measurement system into the production line for monitoring COPV liner geometry was investigated. Additionally, the application of a high-resolution line scanner for quantitative assessment of fiber winding angles was examined.
The study demonstrated that the laser system enables precise, continuous measurement of the liner’s geometry, allowing early detection of deformations and eccentricities. This facilitates uniform fiber placement and provides a quantitative evaluation of concentricity and dimensional accuracy along the cylindrical portion of the liner. Minor misalignments and irregularities, which may not be visually apparent, can be detected, forming a basis for performance-based accept-reject criteria and enabling intervention before full-scale COPV production.
Similarly, the use of a high-resolution line scanner allows comprehensive acquisition of the composite surface and supports both global and local analyses of fiber orientation. FFT-based analysis provides a robust overview of dominant winding directions and overall pattern uniformity, while HT enables precise mapping of local fiber trajectories and detection of micro-scale deviations, such as gaps, overlaps, or misalignment.
Together, these methods provide a hierarchical framework for performance-based quality assessment. The results indicate that the combined approach can effectively detect both macroscopic and localized defects, supporting informed process adjustments and enhancing the structural reliability of filament-wound composite pressure vessels.
Funding
This research received no external funding.
Data Availability Statement
The original contributions presented in this study are included in the article. Further inquiries can be directed to the corresponding author.
Conflicts of Interest
The authors declare no conflict of interest.
References
- European Commission. The European Green Deal . Available online: https://commission.europa.eu/strategy-and-policy/priorities-2019-2024/european-green-deal_en (accessed on 22 October 2025).
- United Nations. Renewable Energy—Powering a Safer Future . Available online: https://www.un.org/en/climatechange/raising-ambition/renewable-energy (accessed on 22 October 2025).
- Zhu, Z.; Hunjra, A.I.; Alharbi, S.S.; Zhao, S. Global Energy Transition under Geopolitical Risks: An Empirical Investigation. Energy Economics 2025, 145, 108495. [Google Scholar] [CrossRef]
- Fekete, B.M.; Bacskó, M.; Zhang, J.; Chen, M. Storage Requirements to Mitigate Intermittent Renewable Energy Sources: Analysis for the US Northeast. Frontiers in Environmental Science 2023, 11, 1076830. [Google Scholar] [CrossRef]
- International Energy Agency (IEA). Batteries and Secure Energy Transitions.
- Ruhnau, O.; Qvist, S. Storage Requirements in a 100% Renewable Electricity System: Extreme Events and Inter-Annual Variability; 2021.
- Acharya, G.; Paudel, P.; Arent, D.J.; Gaura, E.; Paudel, S.R. Roadmap to Reach Global Net-Zero Emissions for Developing Regions by 2085. Cell Reports Sustainability 2025, 2, 100306. [Google Scholar] [CrossRef]
- International Energy Agency (IEA). Hydrogen . Available online: https://www.iea.org/energy-system/low-emission-fuels/hydrogen (accessed on 22 October 2025).
- H2-Mobility. Overview: Hydrogen Refuelling for Heavy-Duty Vehicles.
- Nachtane, M.; Tarfaoui, M.; Abichou, M.A.; Vetcher, A.; Rouway, M.; Aâmir, A.; et al. An Overview of the Recent Advances in Composite Materials and Artificial Intelligence for Hydrogen Storage Vessels Design. Journal of Composites Science 2023, 7, 119. [Google Scholar] [CrossRef]
- Stojkovic, M.; Butt, J. Industry 4.0 Implementation Framework for the Composite Manufacturing Industry. Journal of Composites Science 2022, 6, 258. [Google Scholar] [CrossRef]
- Rafiee, R.; Torabi, M.A. Stochastic Prediction of Burst Pressure in Composite Pressure Vessels. Composite Structures 2018, 185, 573–583. [Google Scholar] [CrossRef]
- Revilock, D.M., Jr.; Thesken, J.C.; Schmidt, T.E.; Forsythe, B.S. Three-Dimensional Digital Image Correlation of a Composite Overwrapped Pressure Vessel During Hydrostatic Pressure Tests; 2007.
- McLaughlan, P.B.; Forth, S.C.; Grimes-Ledesma, L.R. Composite Overwrapped Pressure Vessels: A Primer; 2011.
- Composite Overwrapped Pressure Vessels (COPVs) Market Dynamics: Drivers and Barriers to Growth 2025–2033; 2025.
- Jois, C.K. Process-Induced Variations and Their Impact on Structural Properties of Fibre-Reinforced Pressure Vessels; RWTH Aachen University: Aachen, Germany, 2024. [Google Scholar] [CrossRef]
- Micro-Epsilon optoNCDT 1420. Available online: https://www.micro-epsilon.de/abstandssensoren/lasersensoren/optoncdt-1420/ (accessed on 27 October 2025).
- Kåsa, I. A Circle Fitting Procedure and Its Error Analysis. IEEE Transactions on Instrumentation and Measurement, -25. [CrossRef]
- Liu, C.H.; Tsai, W.-H. Recognizing cylindrical objects by single camera views. Computers & Mathematics with Applications 1994, 27, 101–117. [Google Scholar] [CrossRef]
- Zhang, Z.; Liang, X.; Ma, Y. Unwrapping low-rank textures on generalized cylindrical surfaces. In Proceedings of the 2011 International Conference on Computer Vision (ICCV), Barcelona, Spain, 6–13 November 2011; pp. 1347–1354. [Google Scholar] [CrossRef]
- CarboScreen GmbH. Available online: https://carboscreen.com (accessed on 27 October <b>2025</b>).
- Saif, T.; Saad, N.; Al-Zubiedy, A.; Idzikowski, A. Effect of ply angle on the burst pressure of composite pressure vessels by filament winding. Construction of Optimized Energy Potential 2022, 11, 223–233. [Google Scholar] [CrossRef]
- Chiominto, L.; D’Emilia, G.; Natale, E. Statistical analysis of the angle of linear polarization for the winding angle measurement in carbon fibre components. Acta IMEKO 2025, 14, 1–6. [Google Scholar] [CrossRef]
- Josso, B.; Burton, D.R.; Lalor, M.J. Texture Orientation and Anisotropy Calculation by Fourier Transform and Principal Component Analysis. Mechanical Systems and Signal Processing 2005, 19, 1152–1161. [Google Scholar] [CrossRef]
- Kassim, A.A.; Mannan, M.A.; Mian, Z. Texture analysis methods for tool condition monitoring. Image and Vision Computing 2007, 25, 1080–1090. [Google Scholar] [CrossRef]
- Xu, Y.; Zhang, Y.; Liang, W. Automated Industrial Composite Fiber Orientation Inspection Using Attention-Based Normalized Deep Hough Network. Micromachines 2023, 14, 879. [Google Scholar] [CrossRef] [PubMed]
Figure 1.
Muratec Multi-Supply Filament Winding (MFW) machine.
Figure 2.
Schematic display of liner measurement.
Figure 3.
Schematic display of surface photography.
Figure 4.
Schematic display of surface scan.
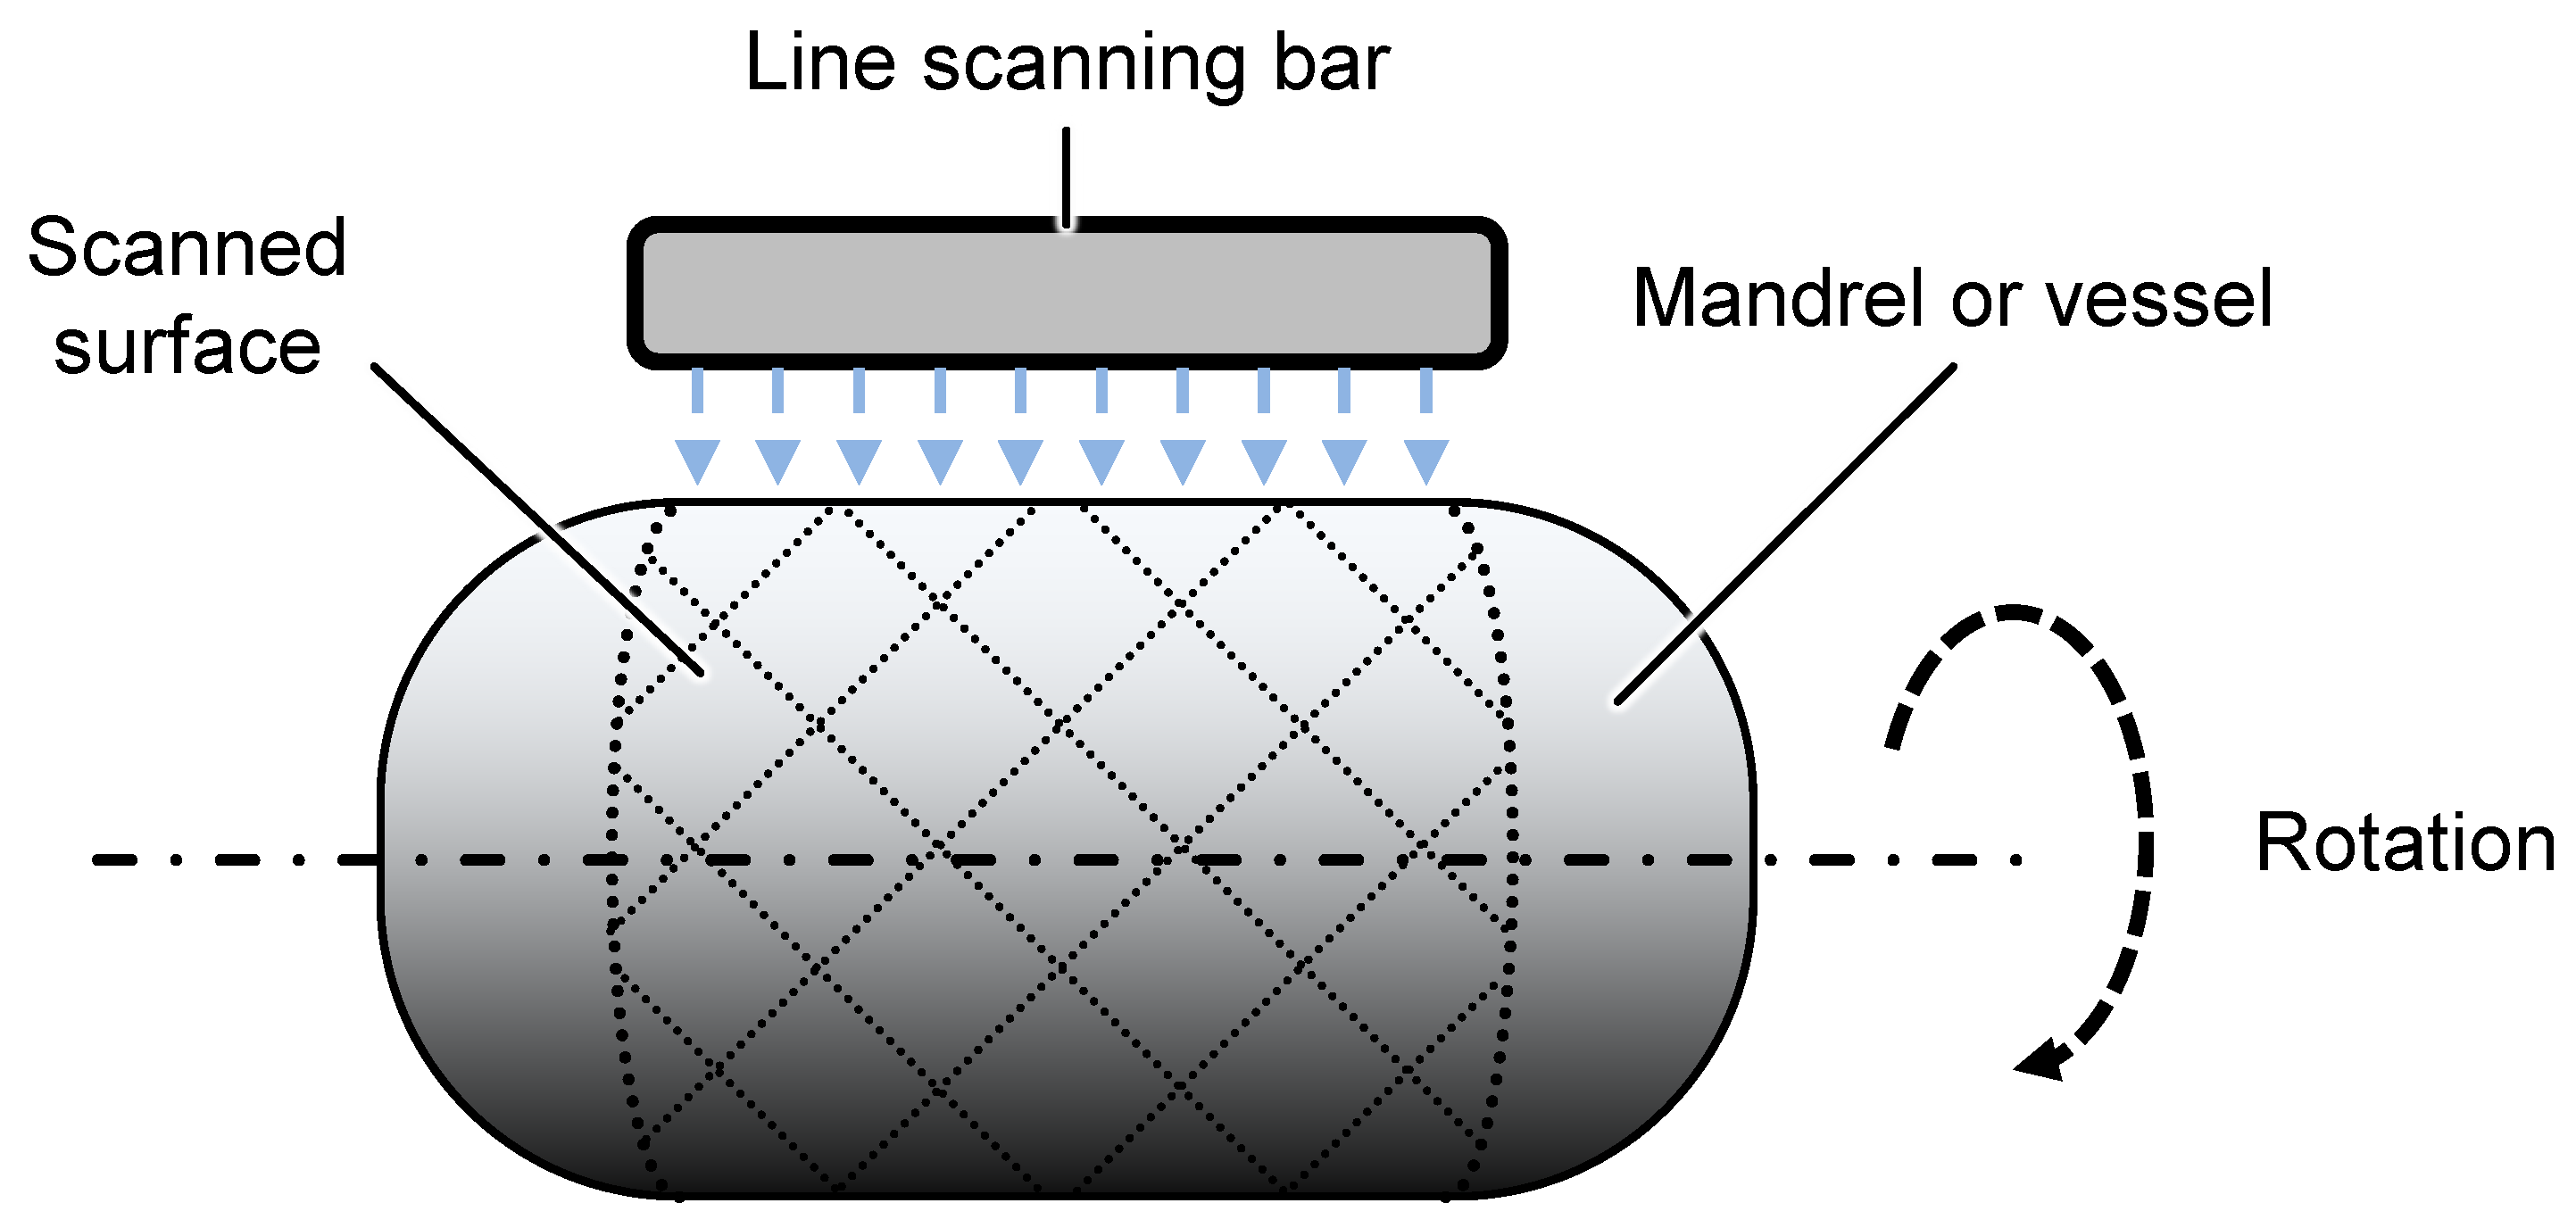
Figure 5.
Surface scan of the composite pressure vessel acquired with a line-scan camera.
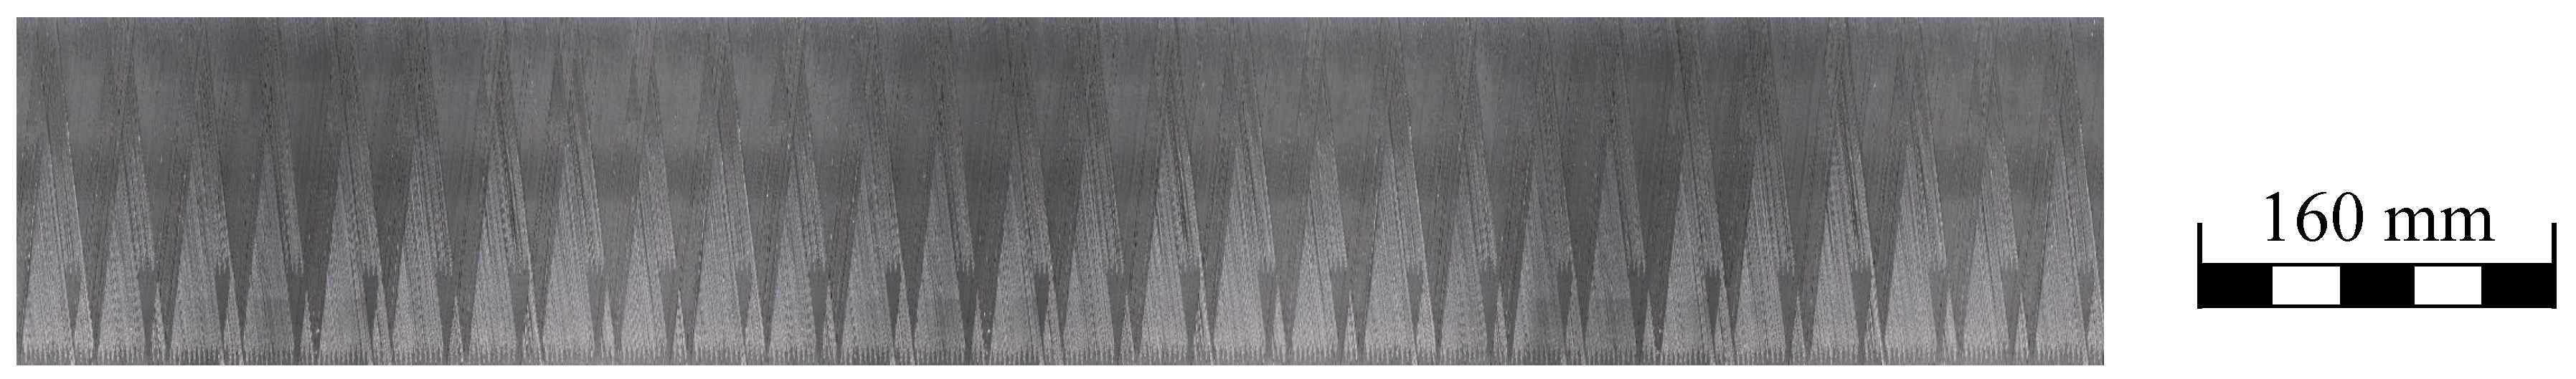
Figure 6.
FFT magnitude spectrum of the composite surface.
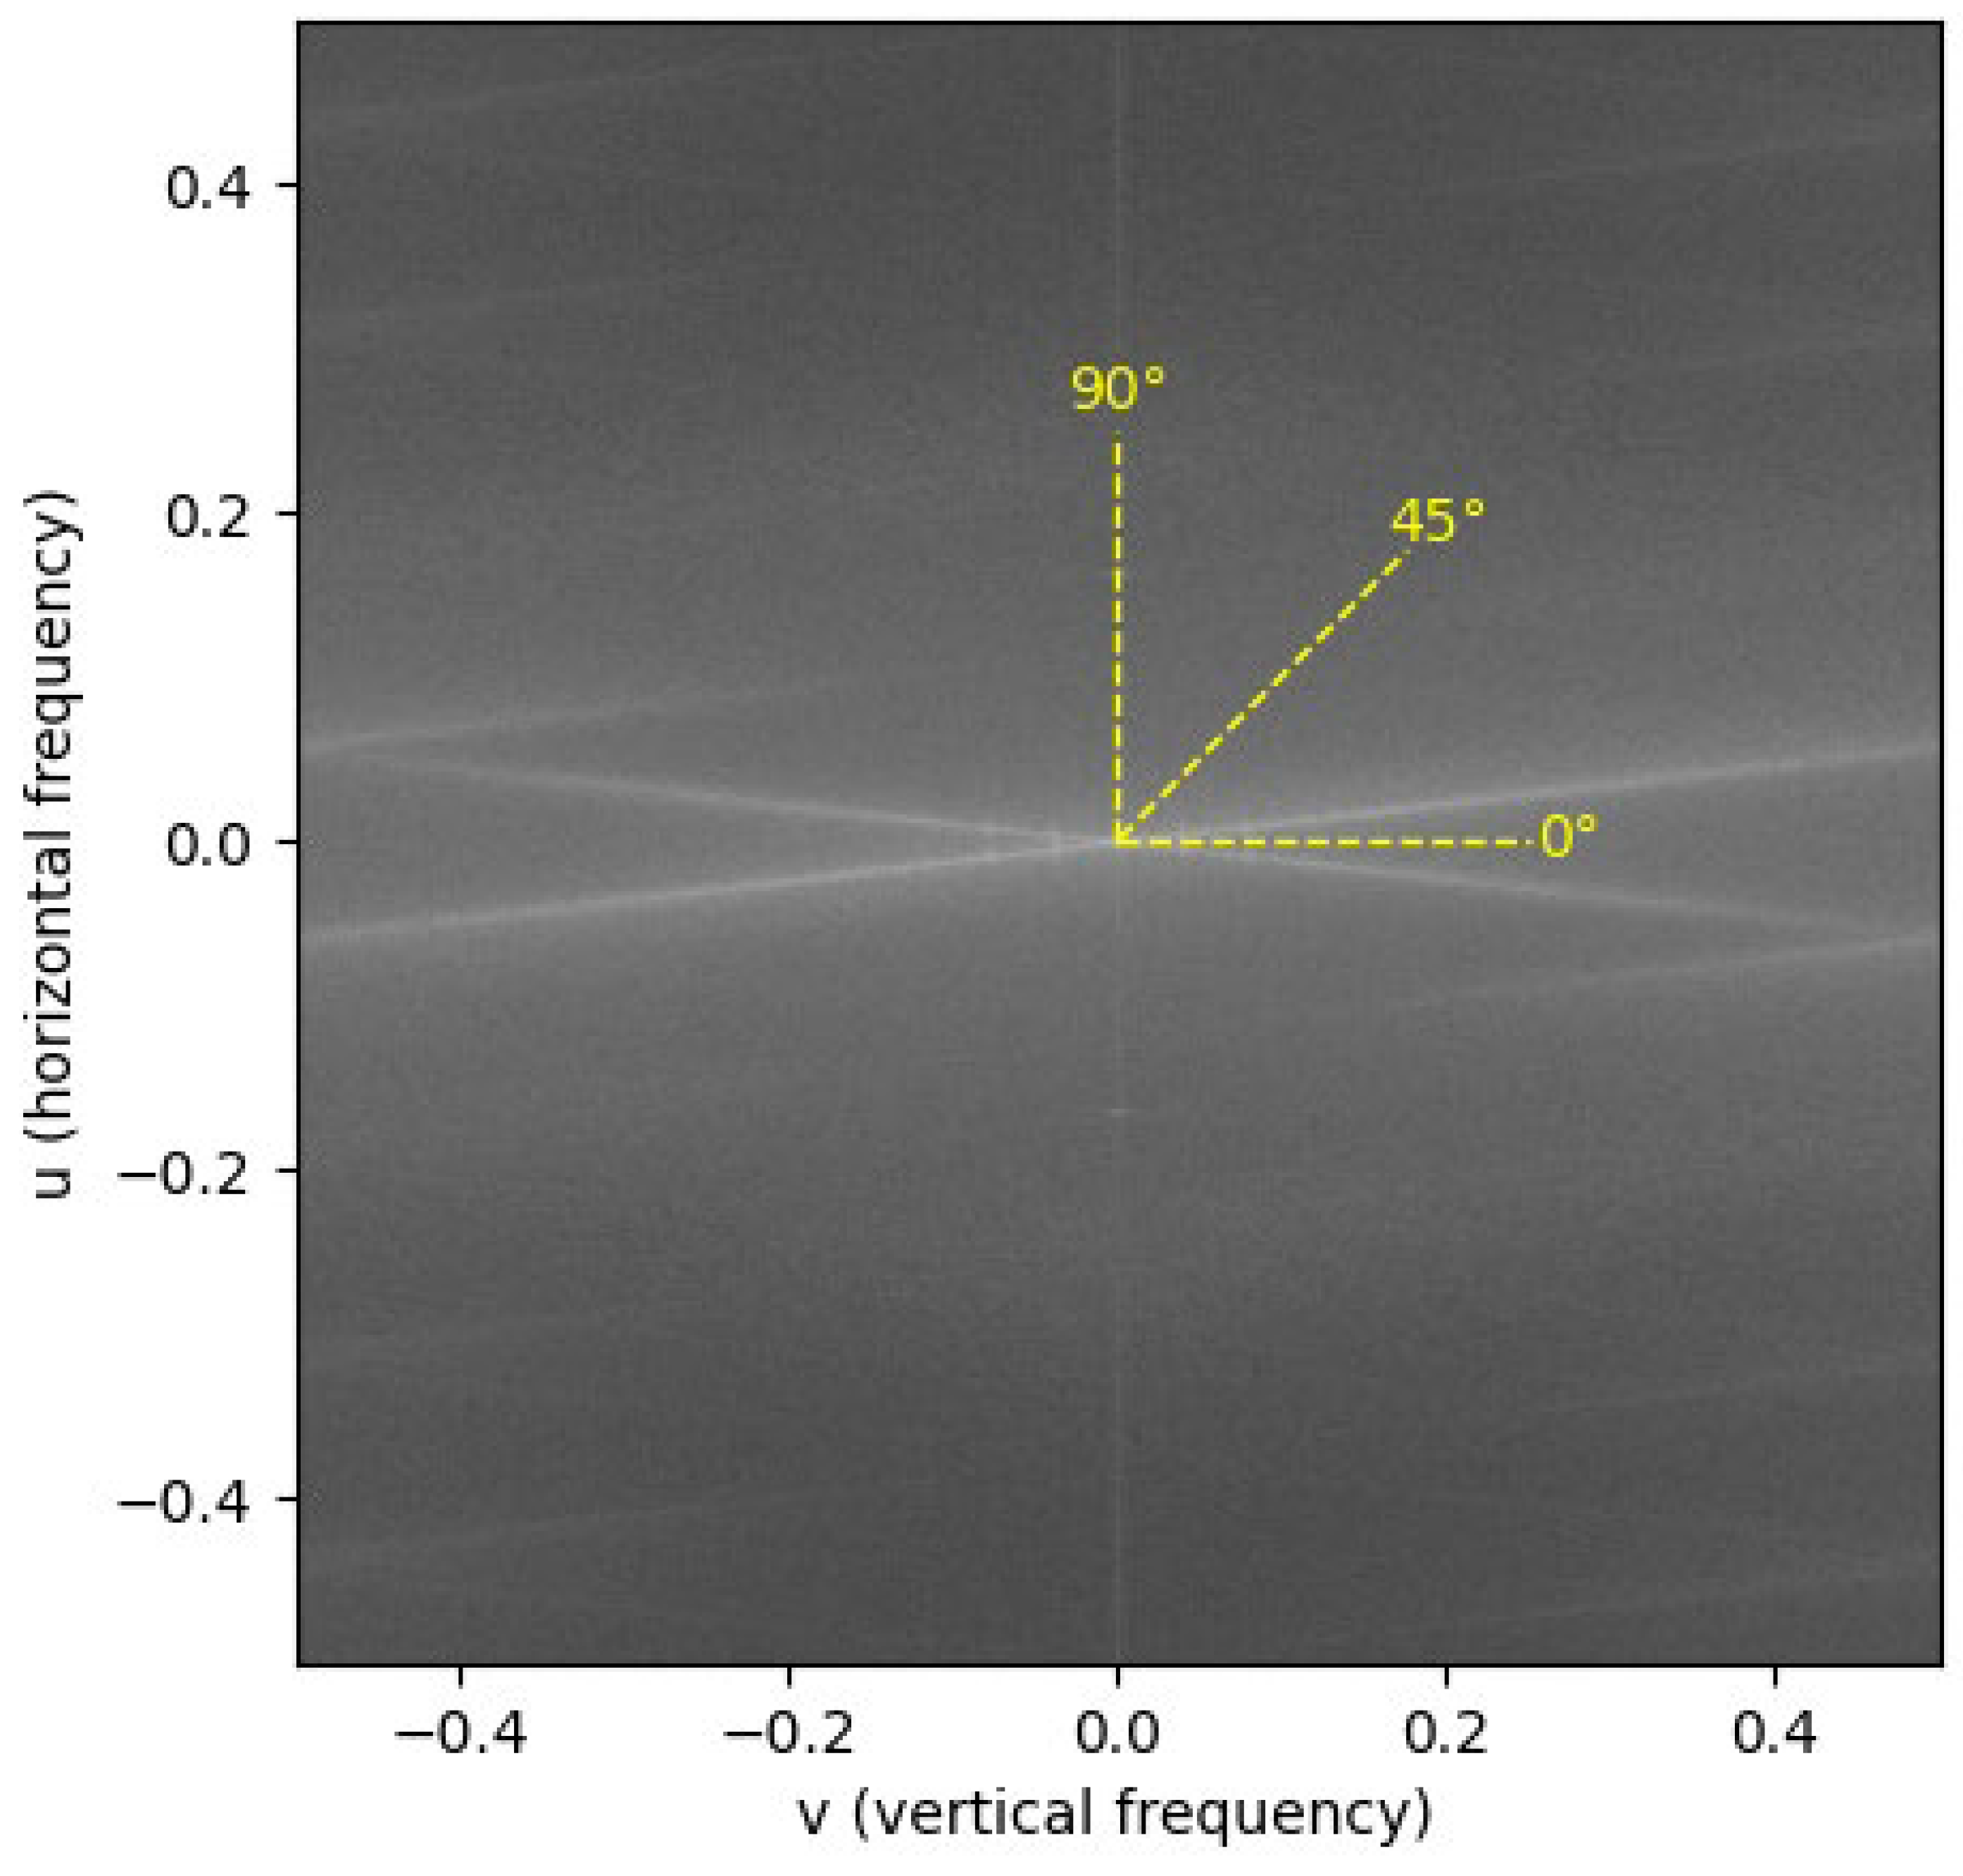
Figure 7.
HT accumulator map.
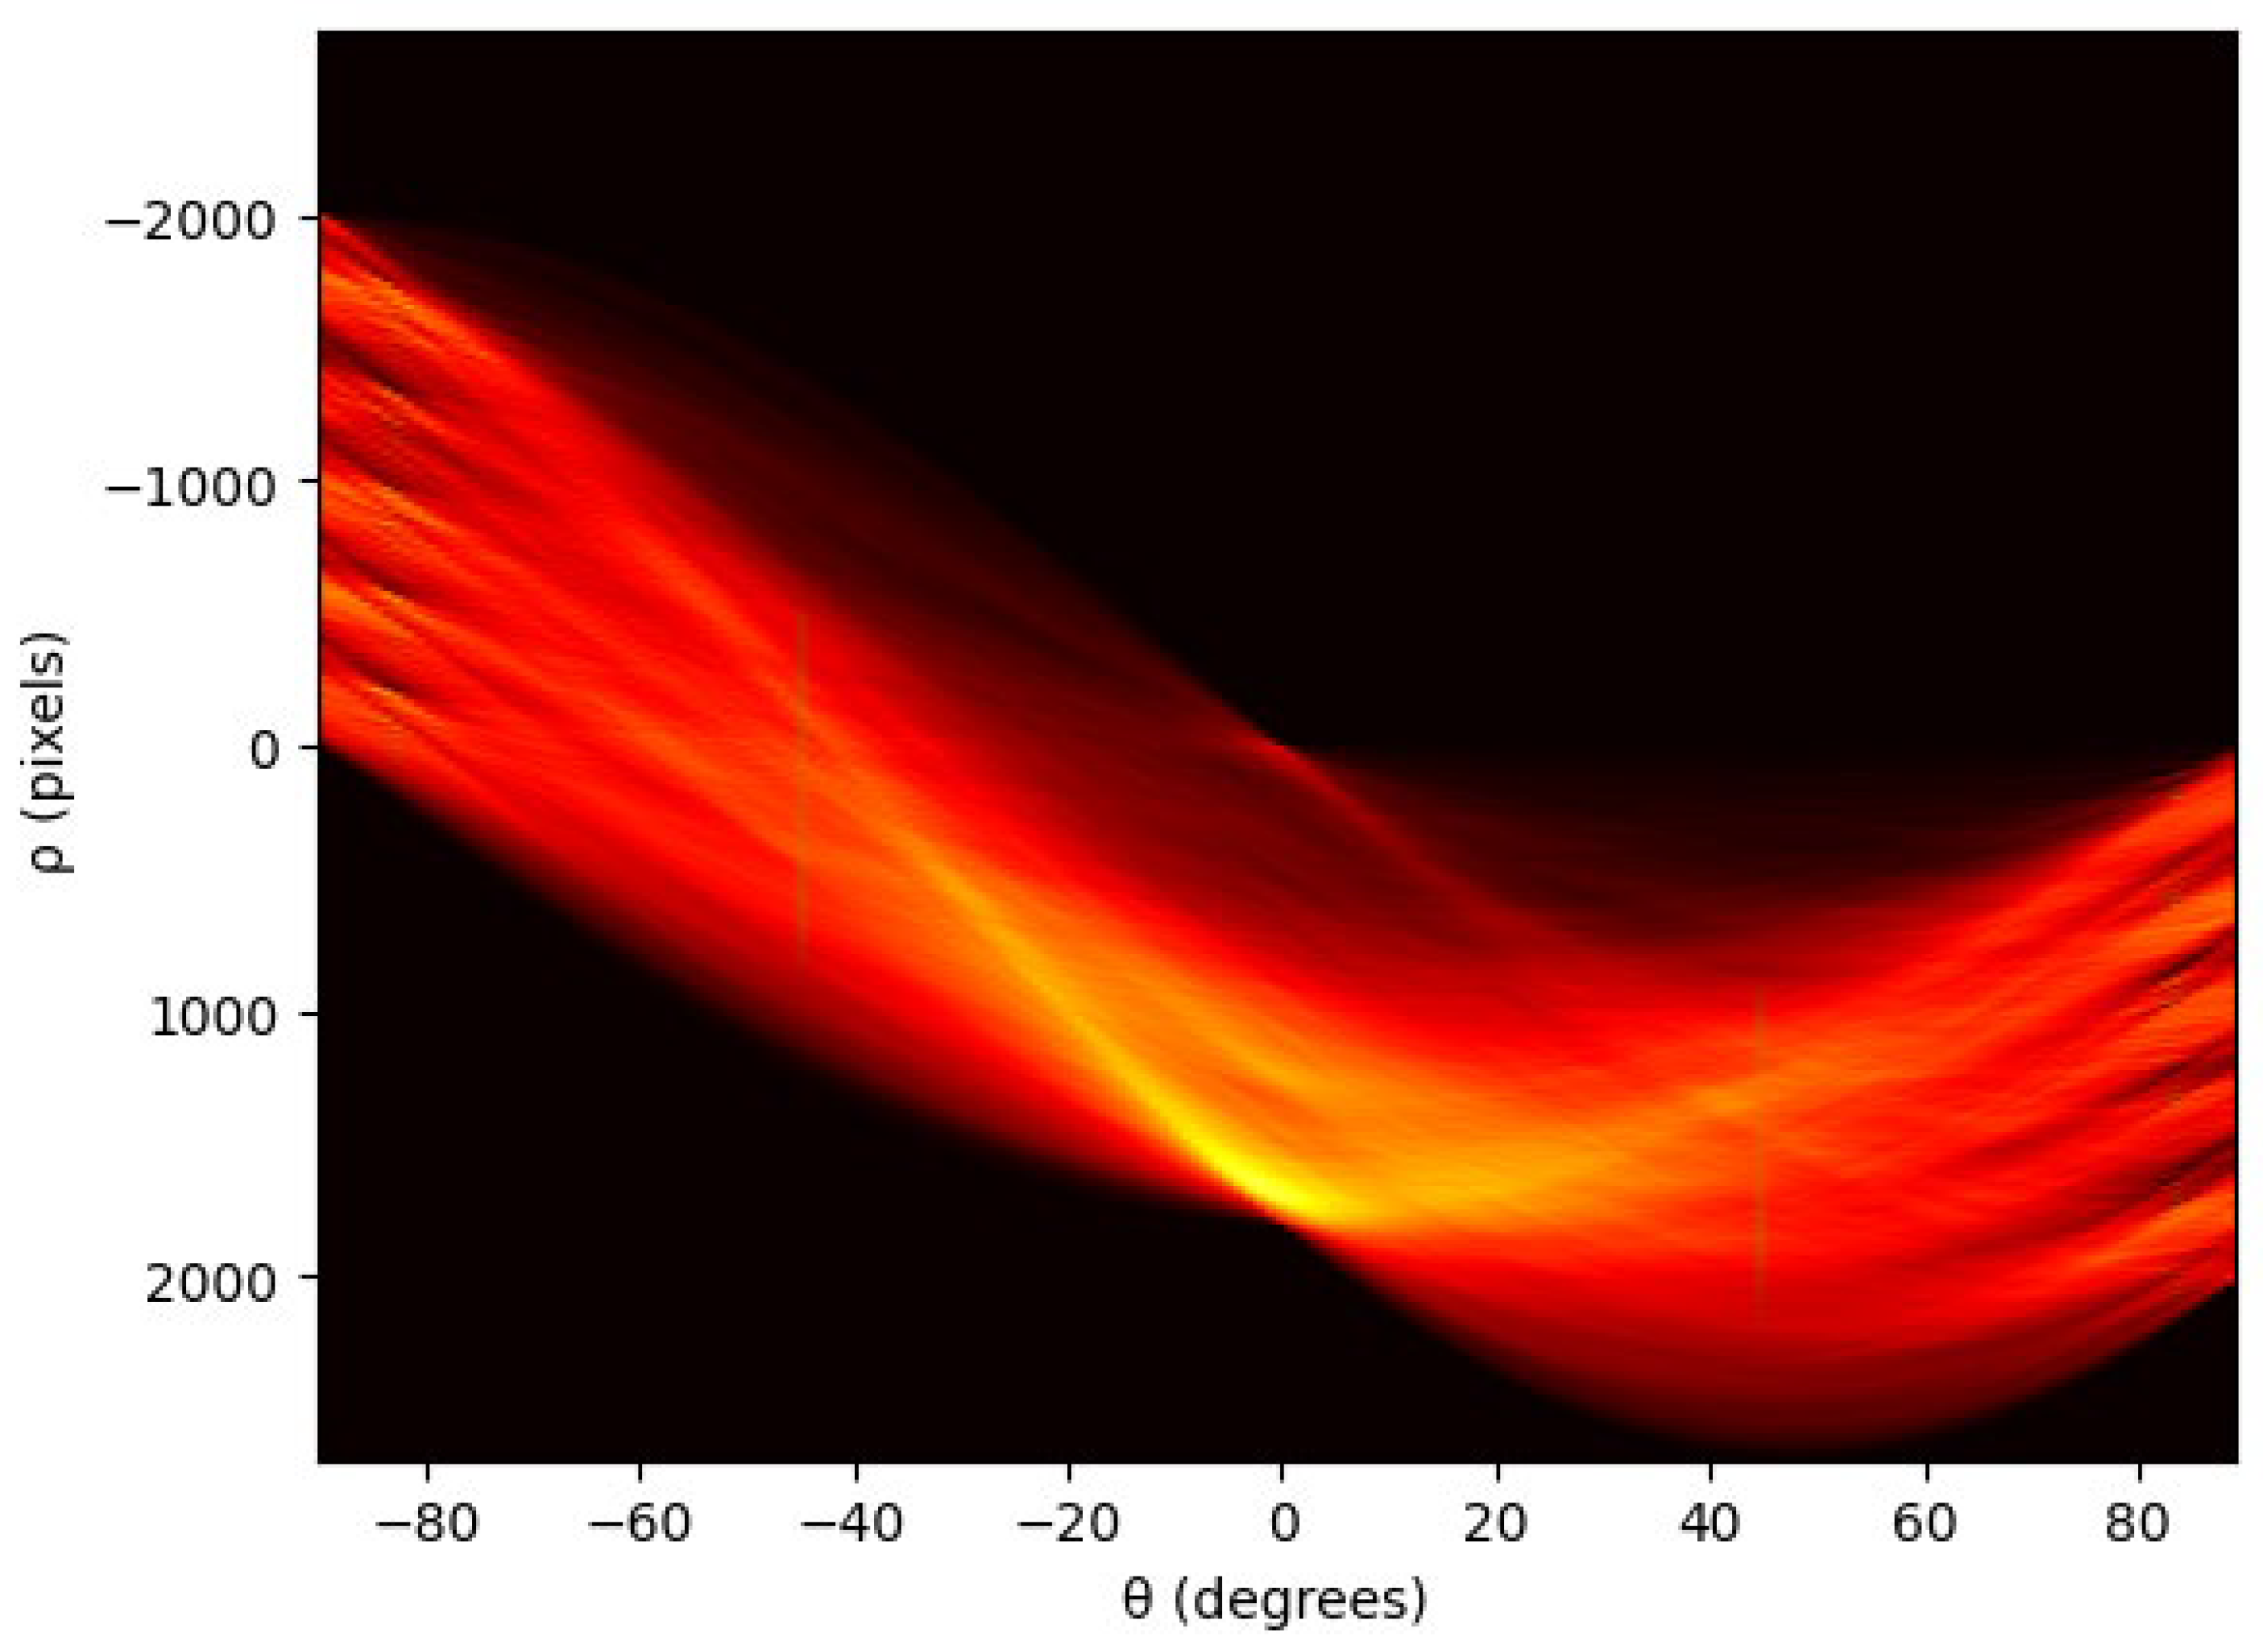
Figure 8.
Detected fiber paths using the HT.
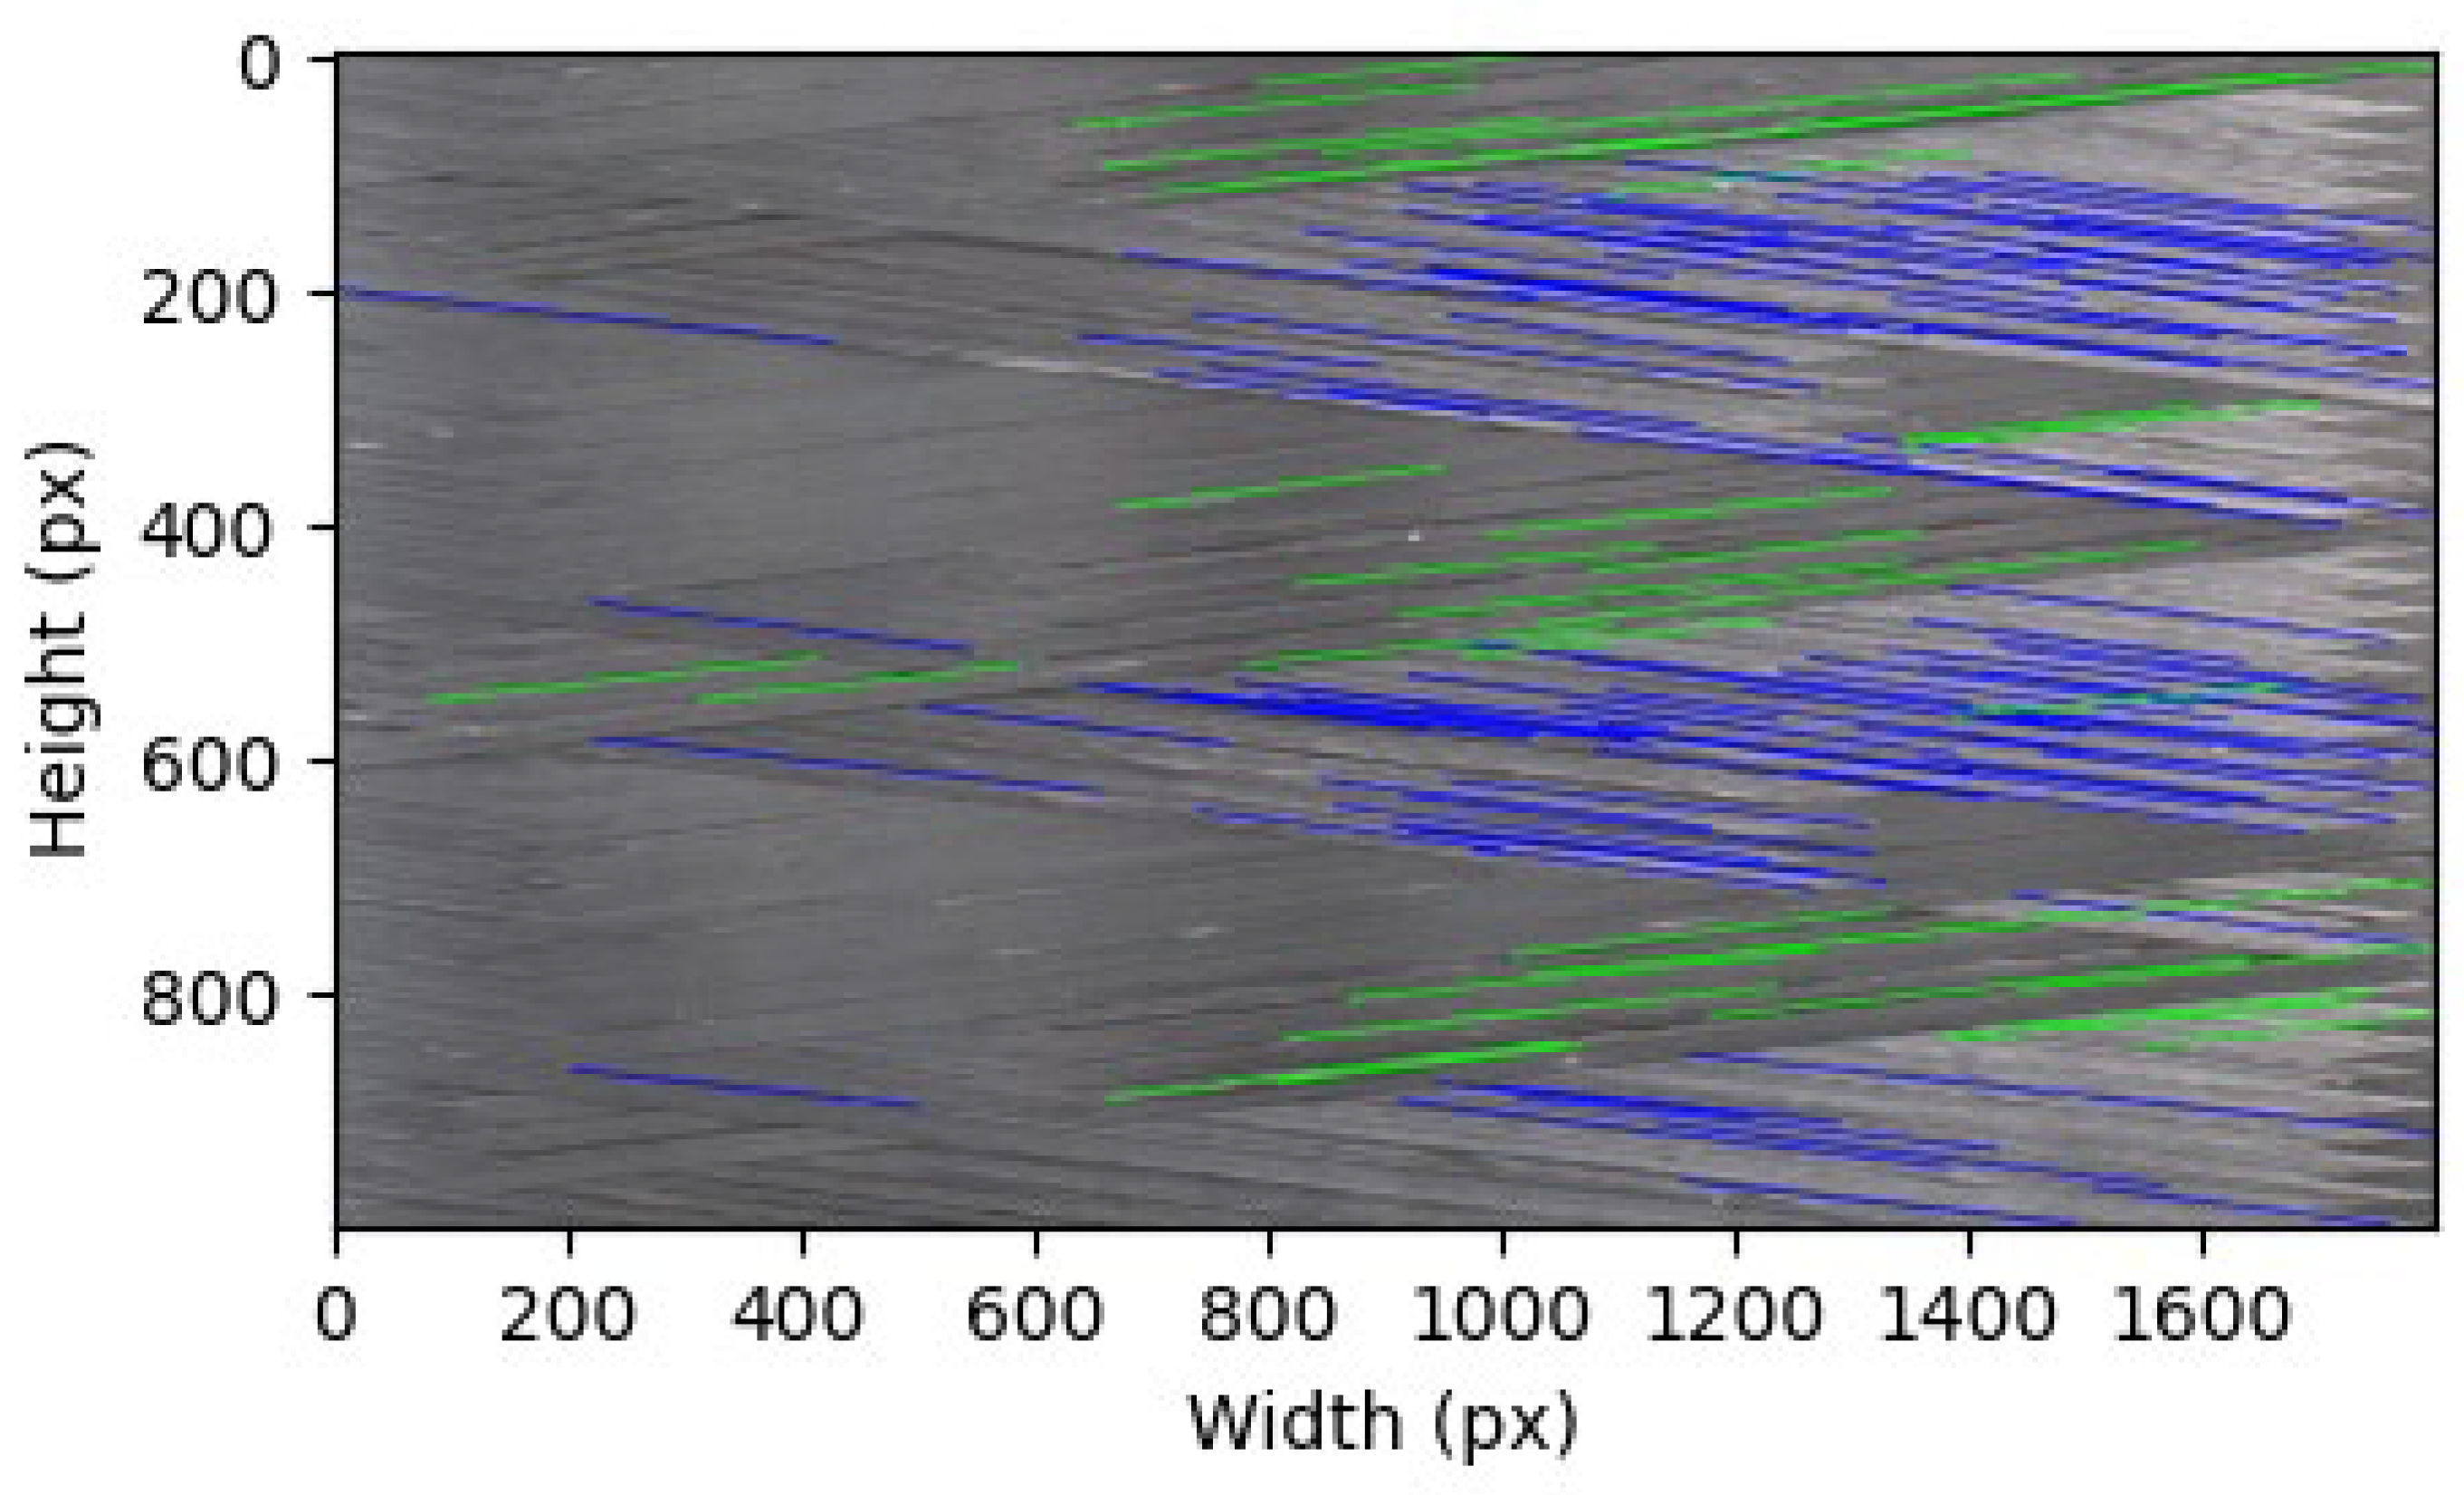
Figure 9.
Point cloud of liner.
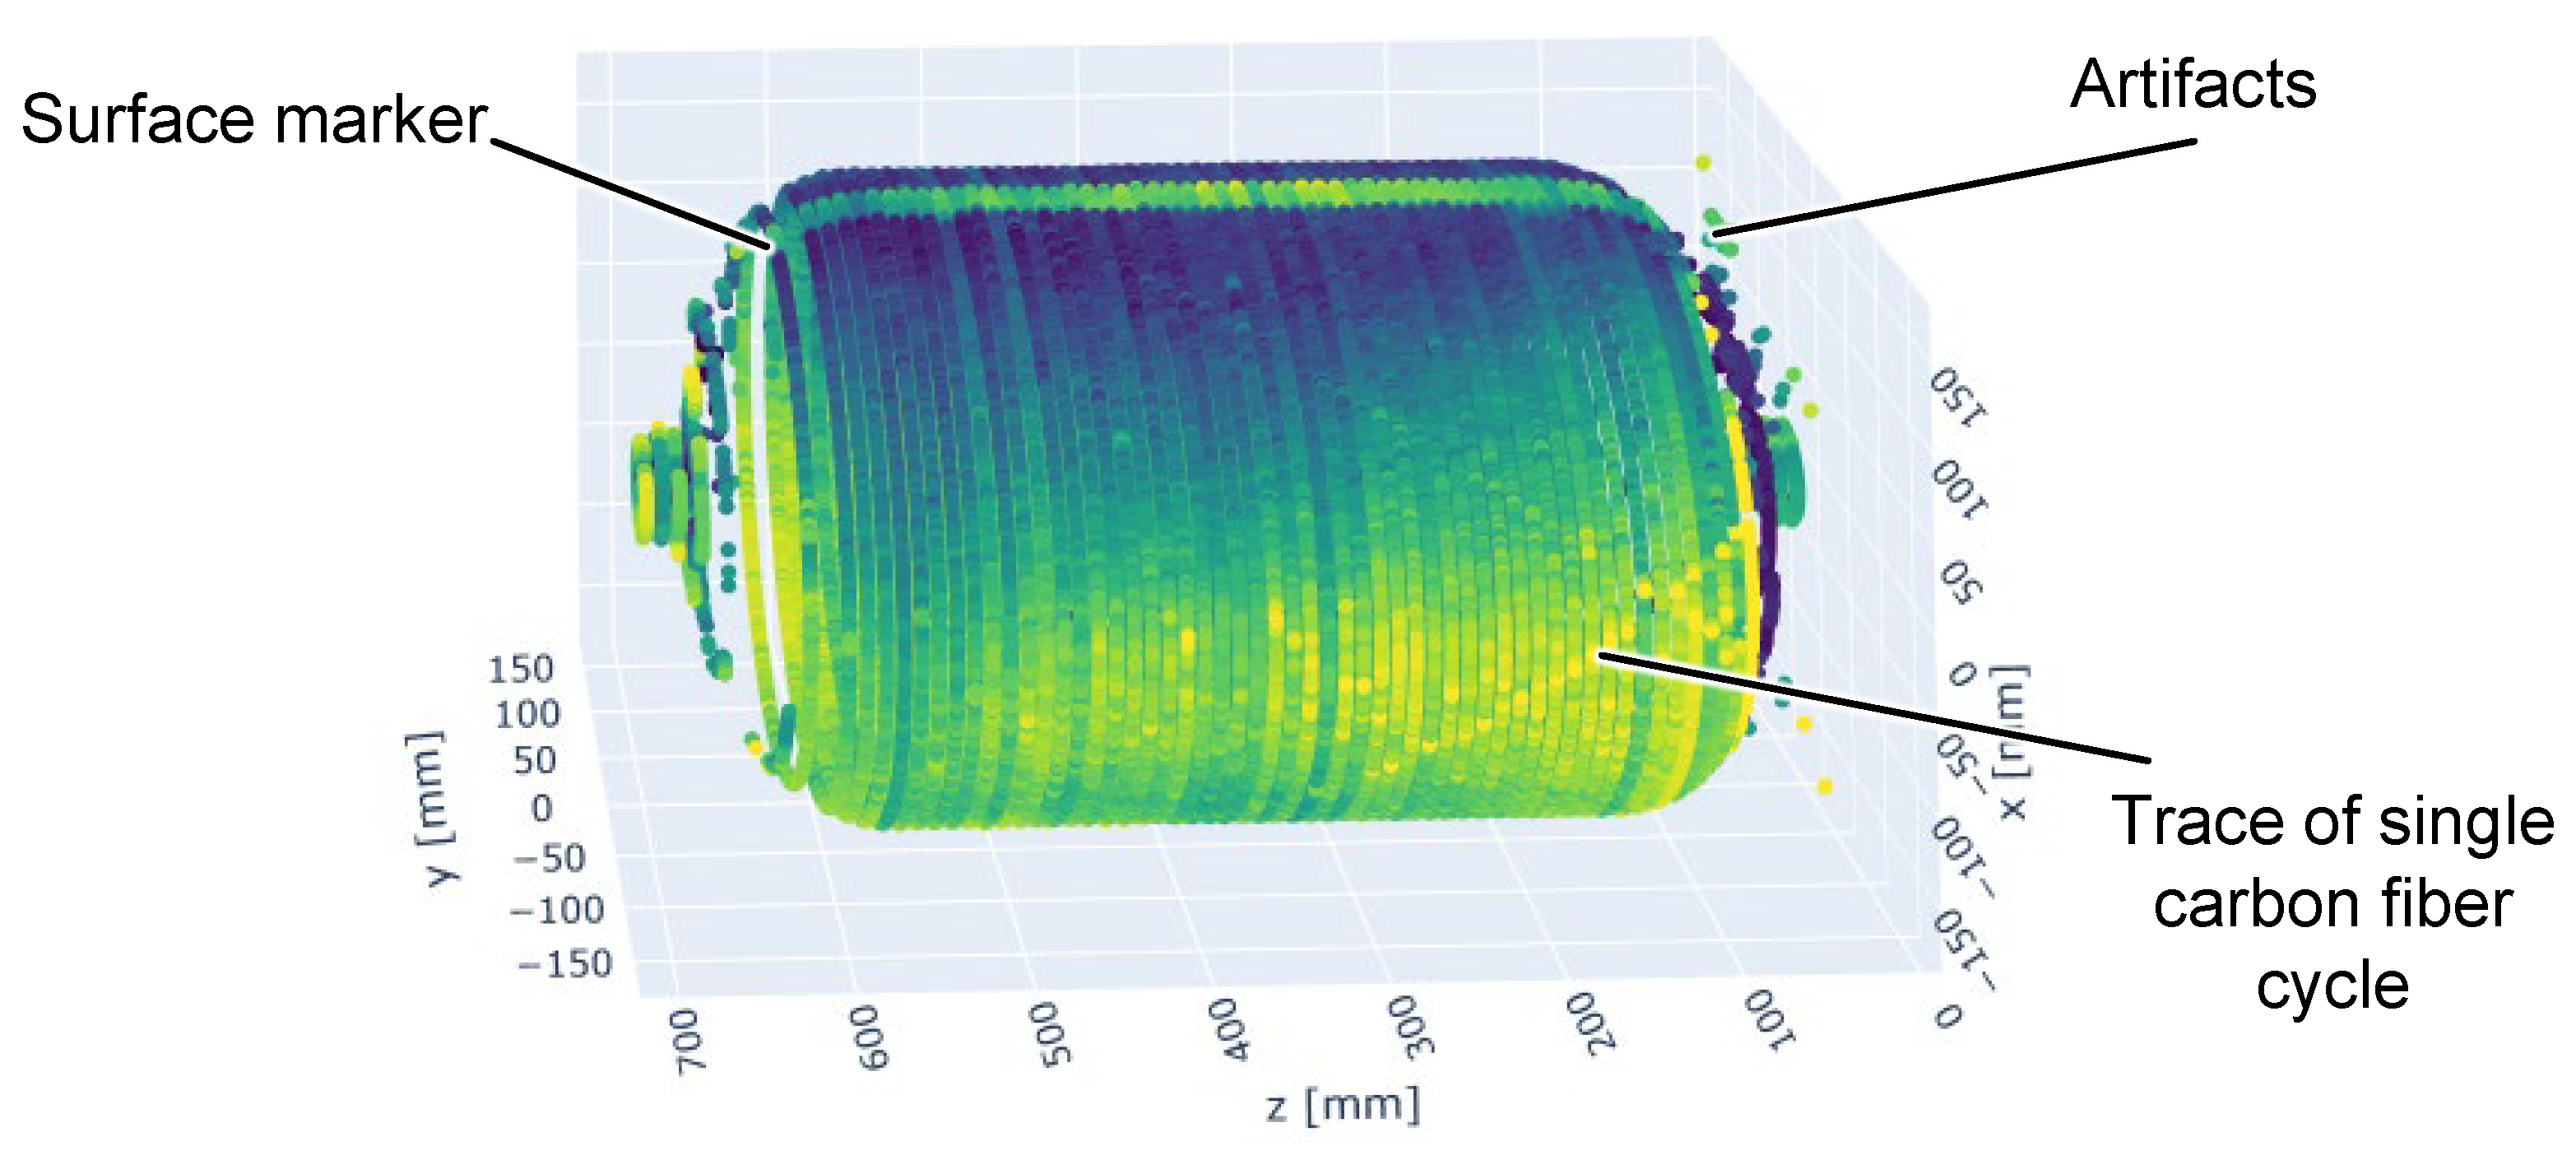
Figure 11.
Polar plot of angular energy distribution.
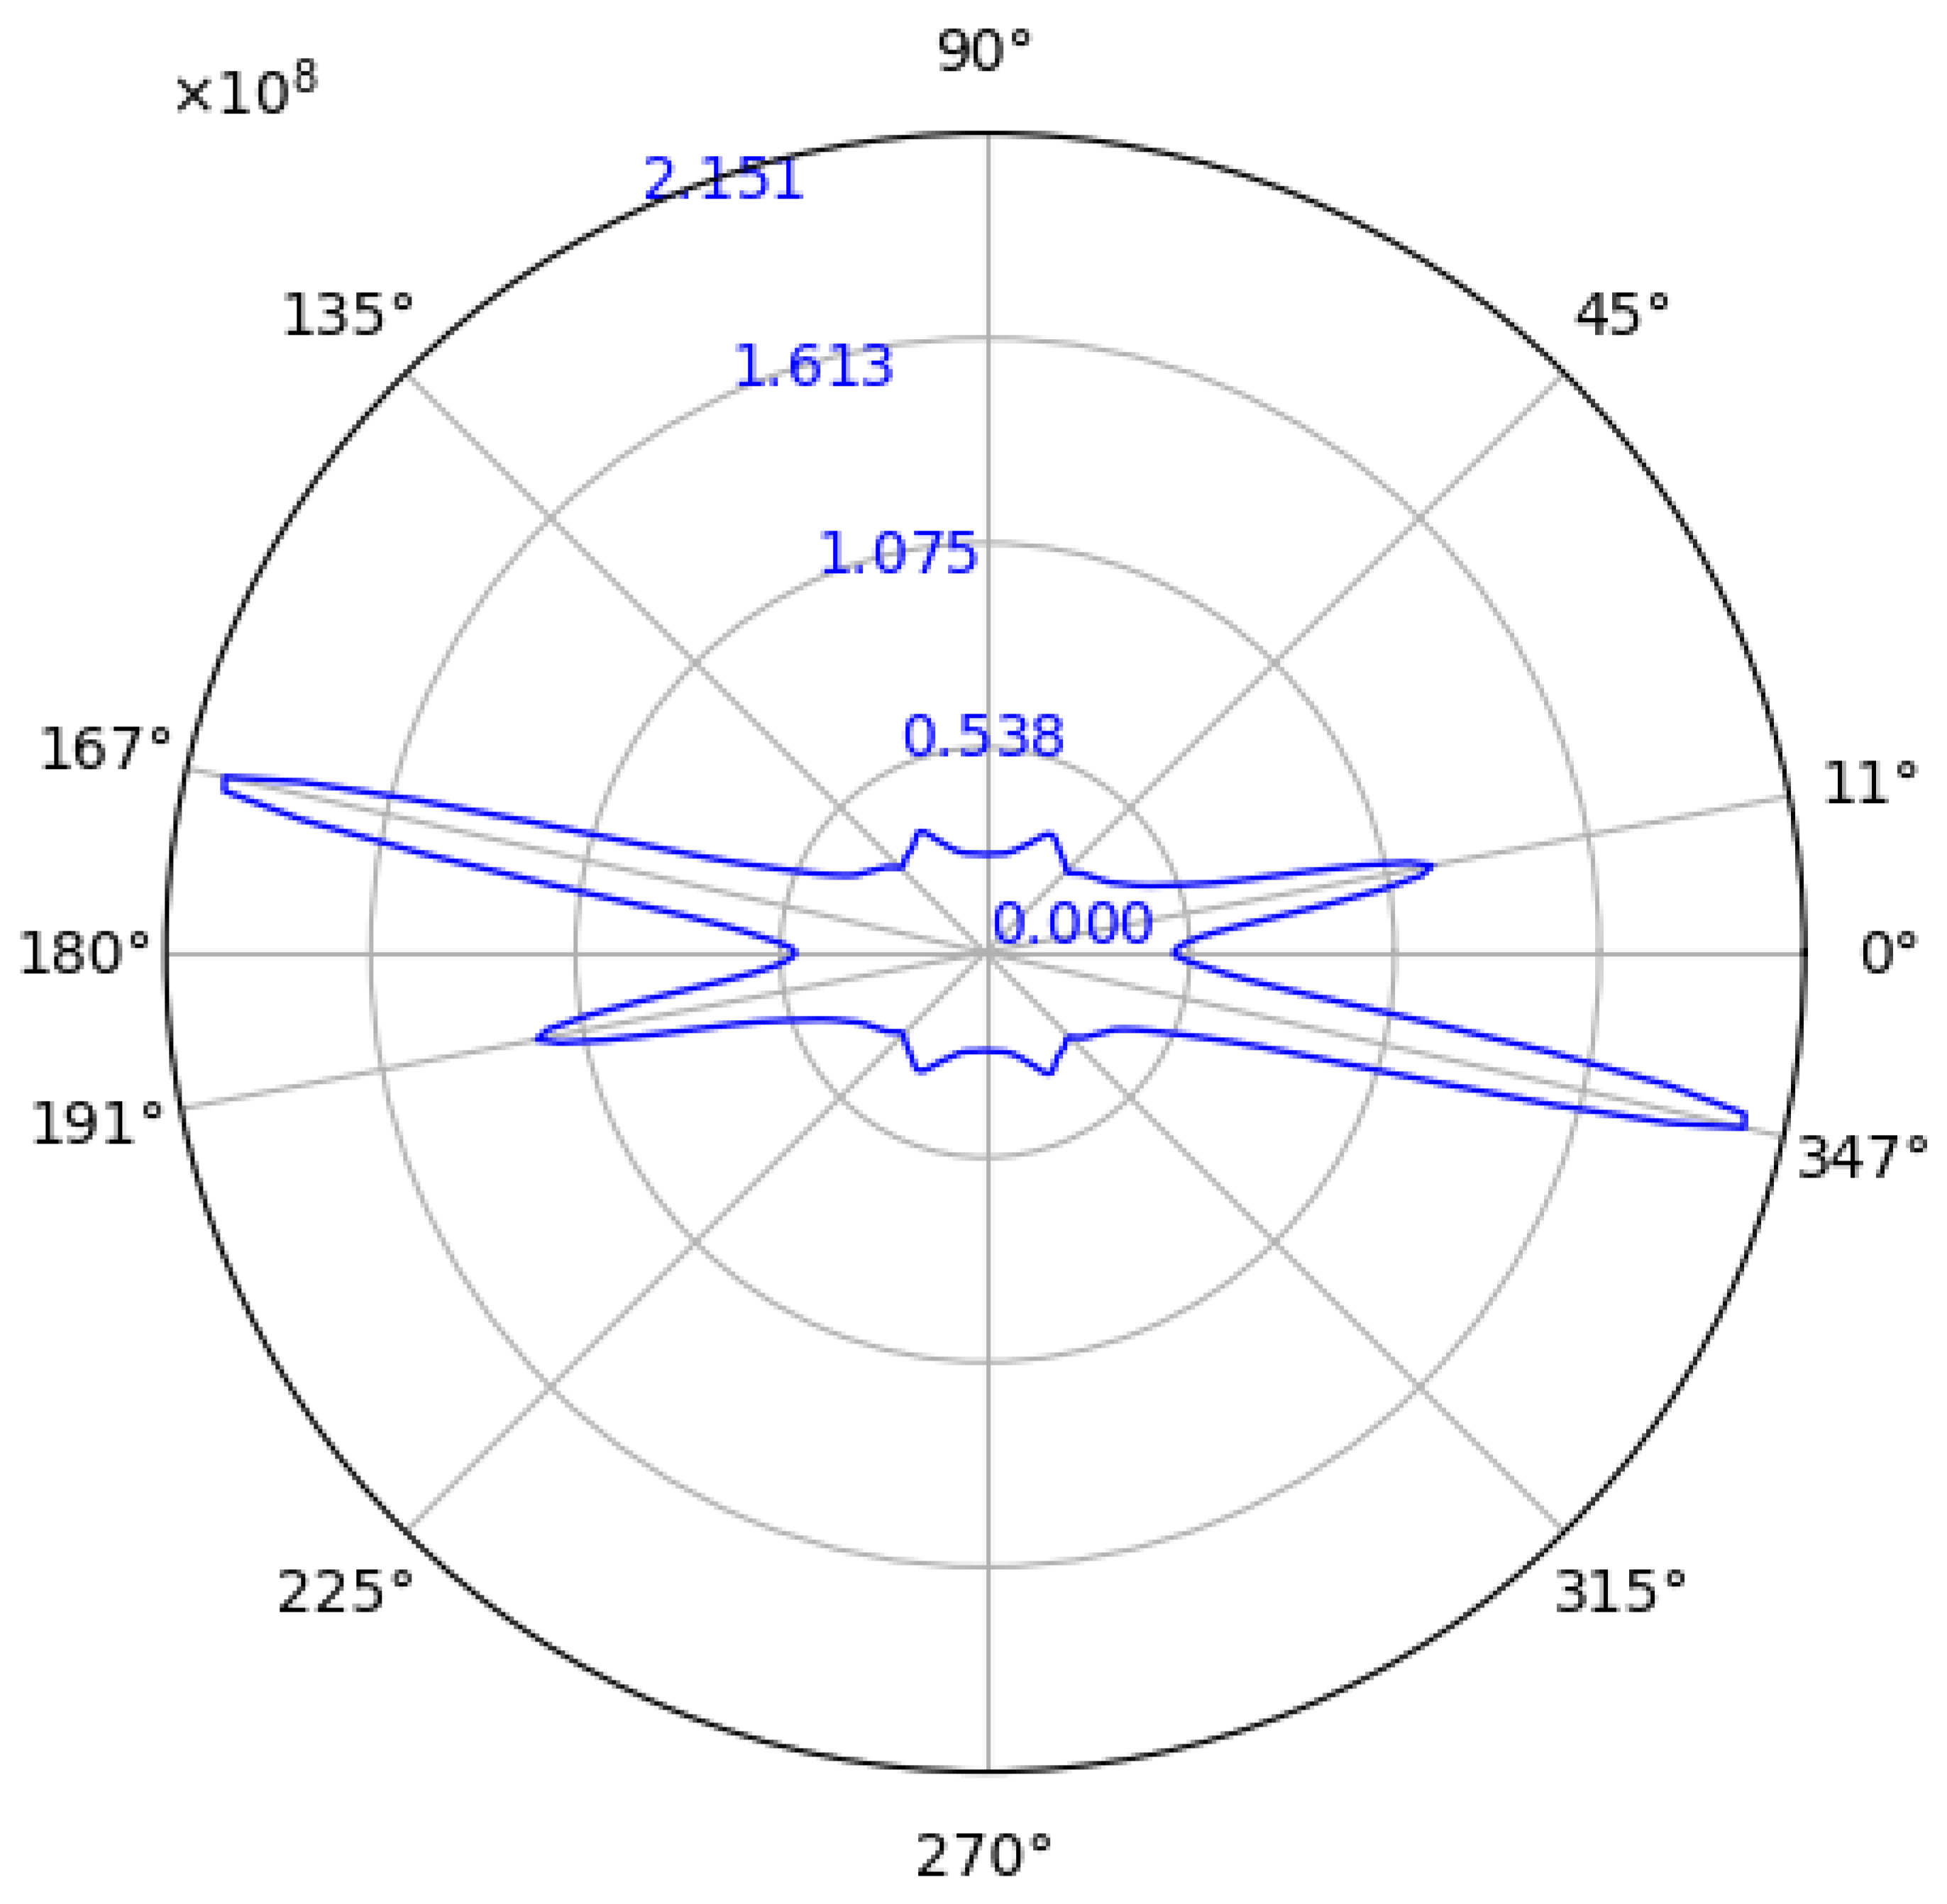
Figure 12.
Angular distribution histogram.
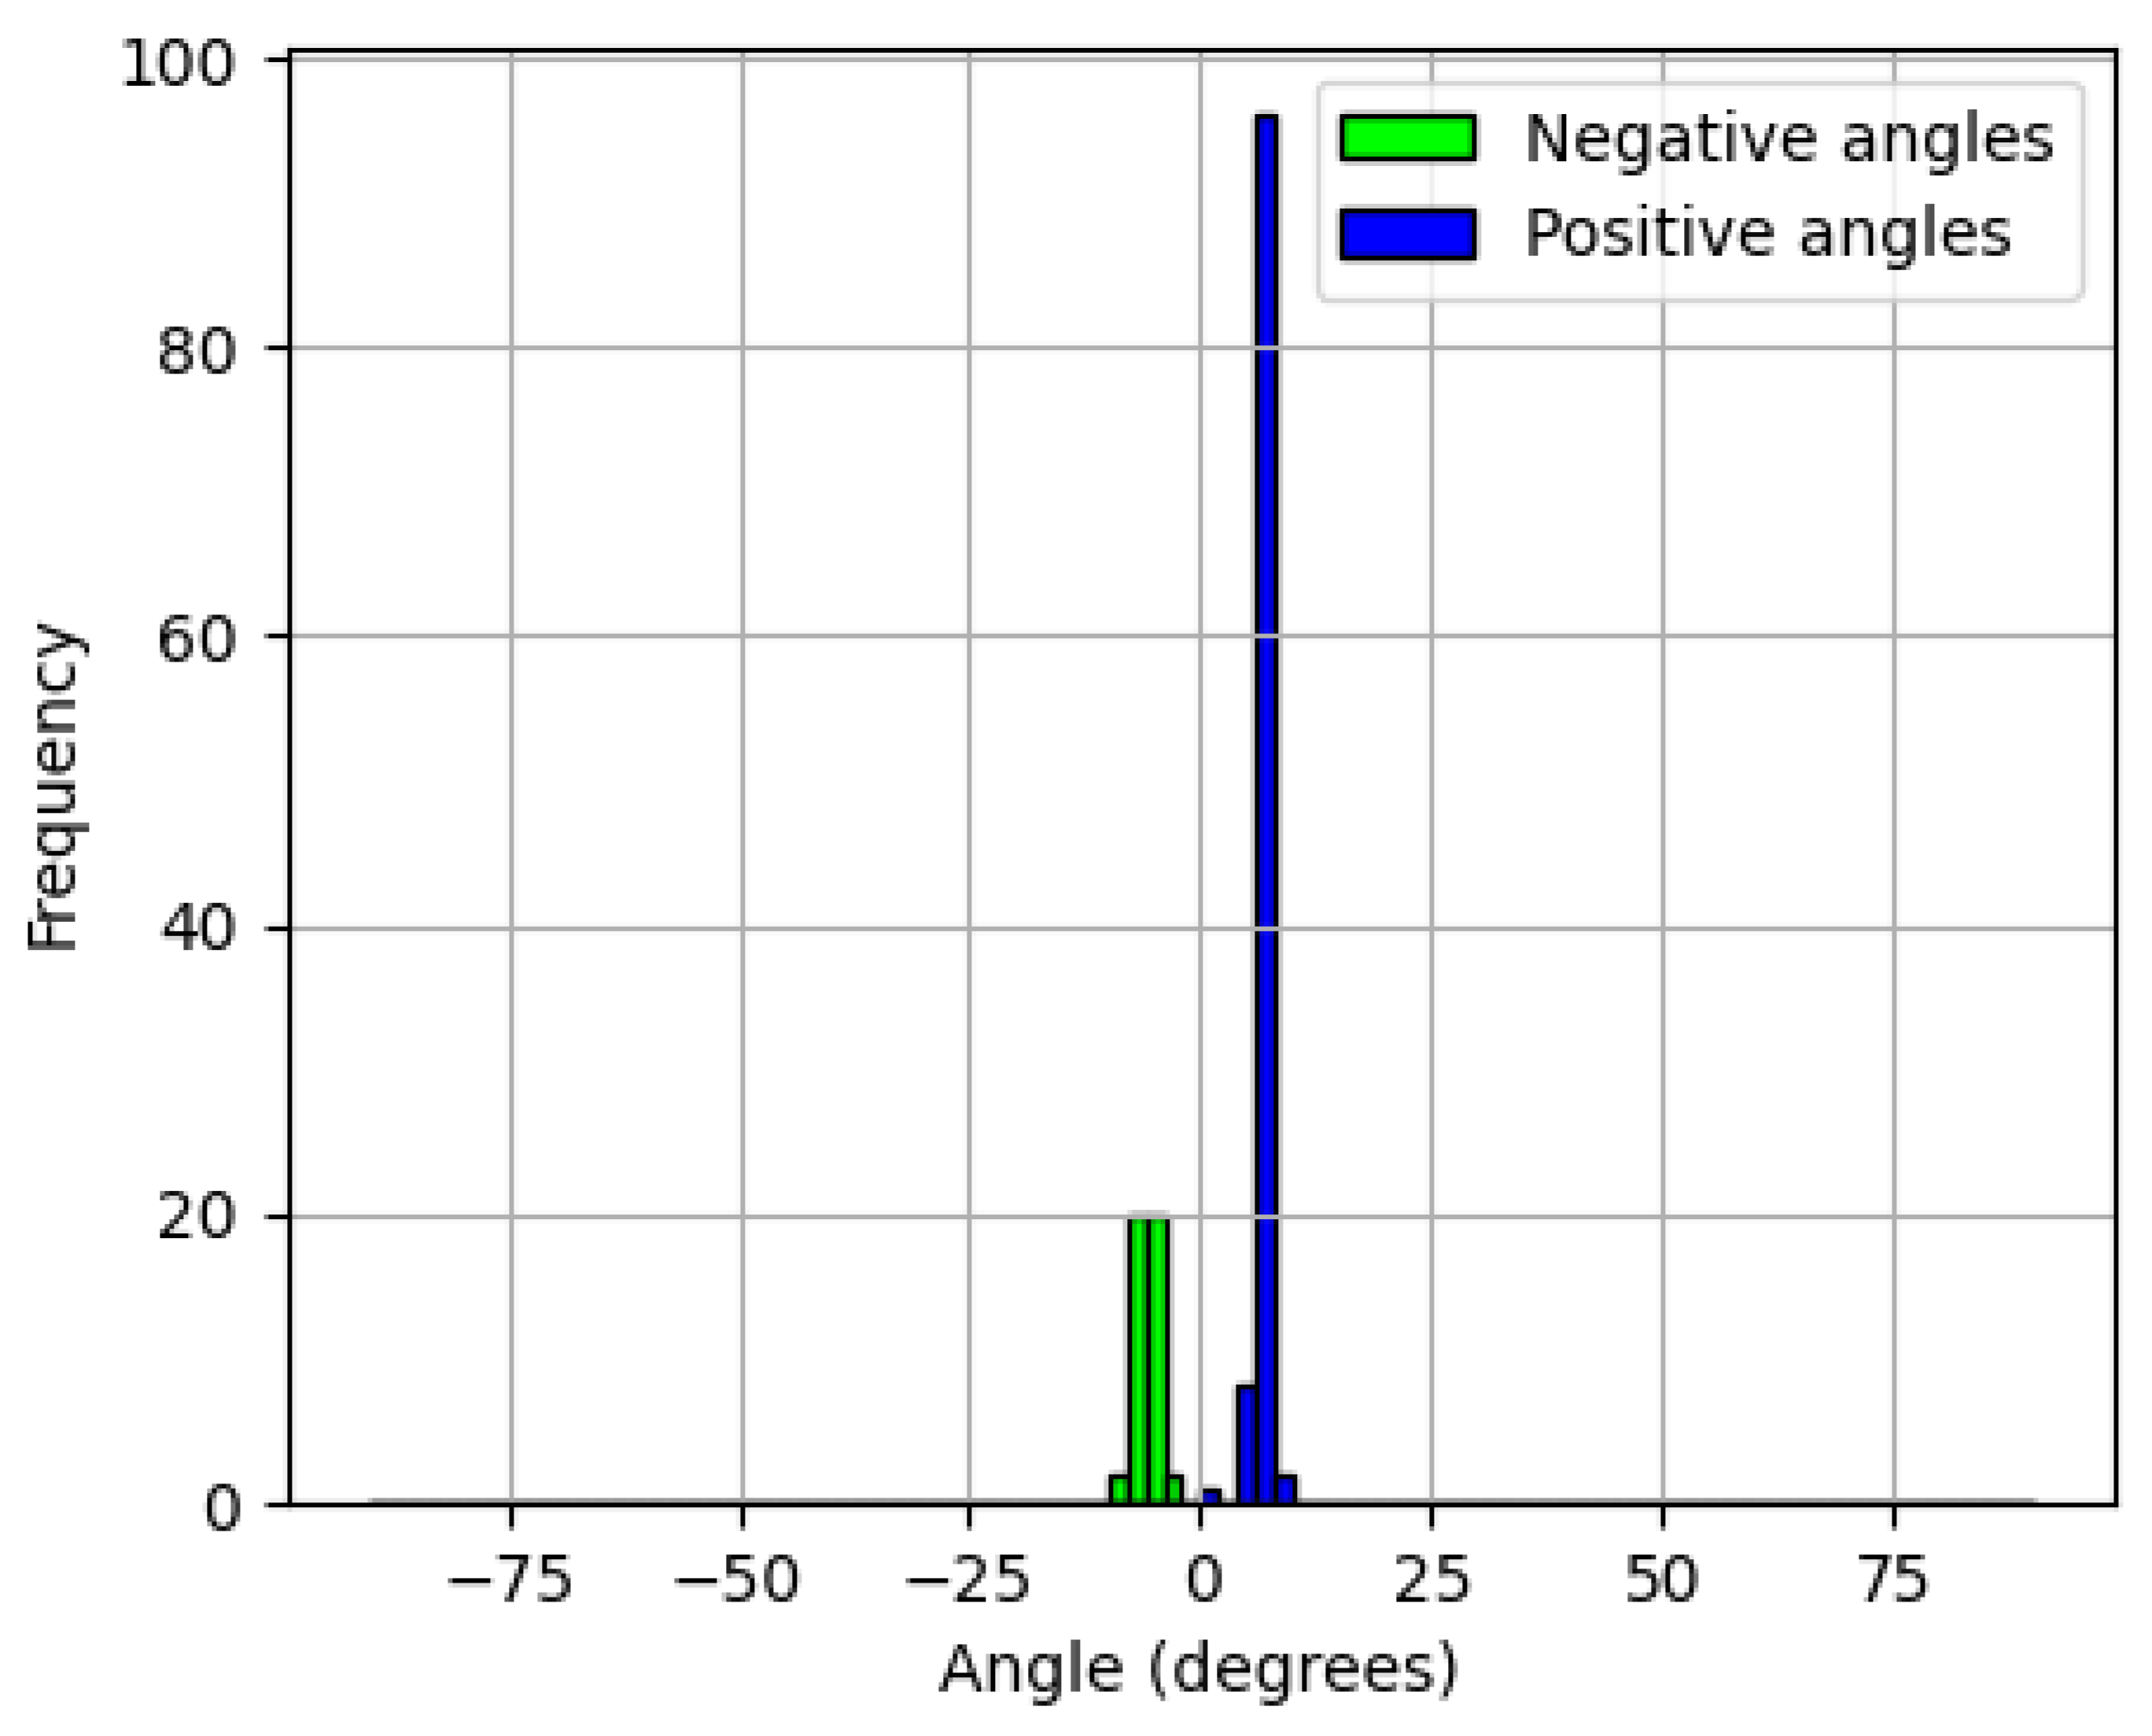
Figure 13.
Boxplot of fiber angle distribution.
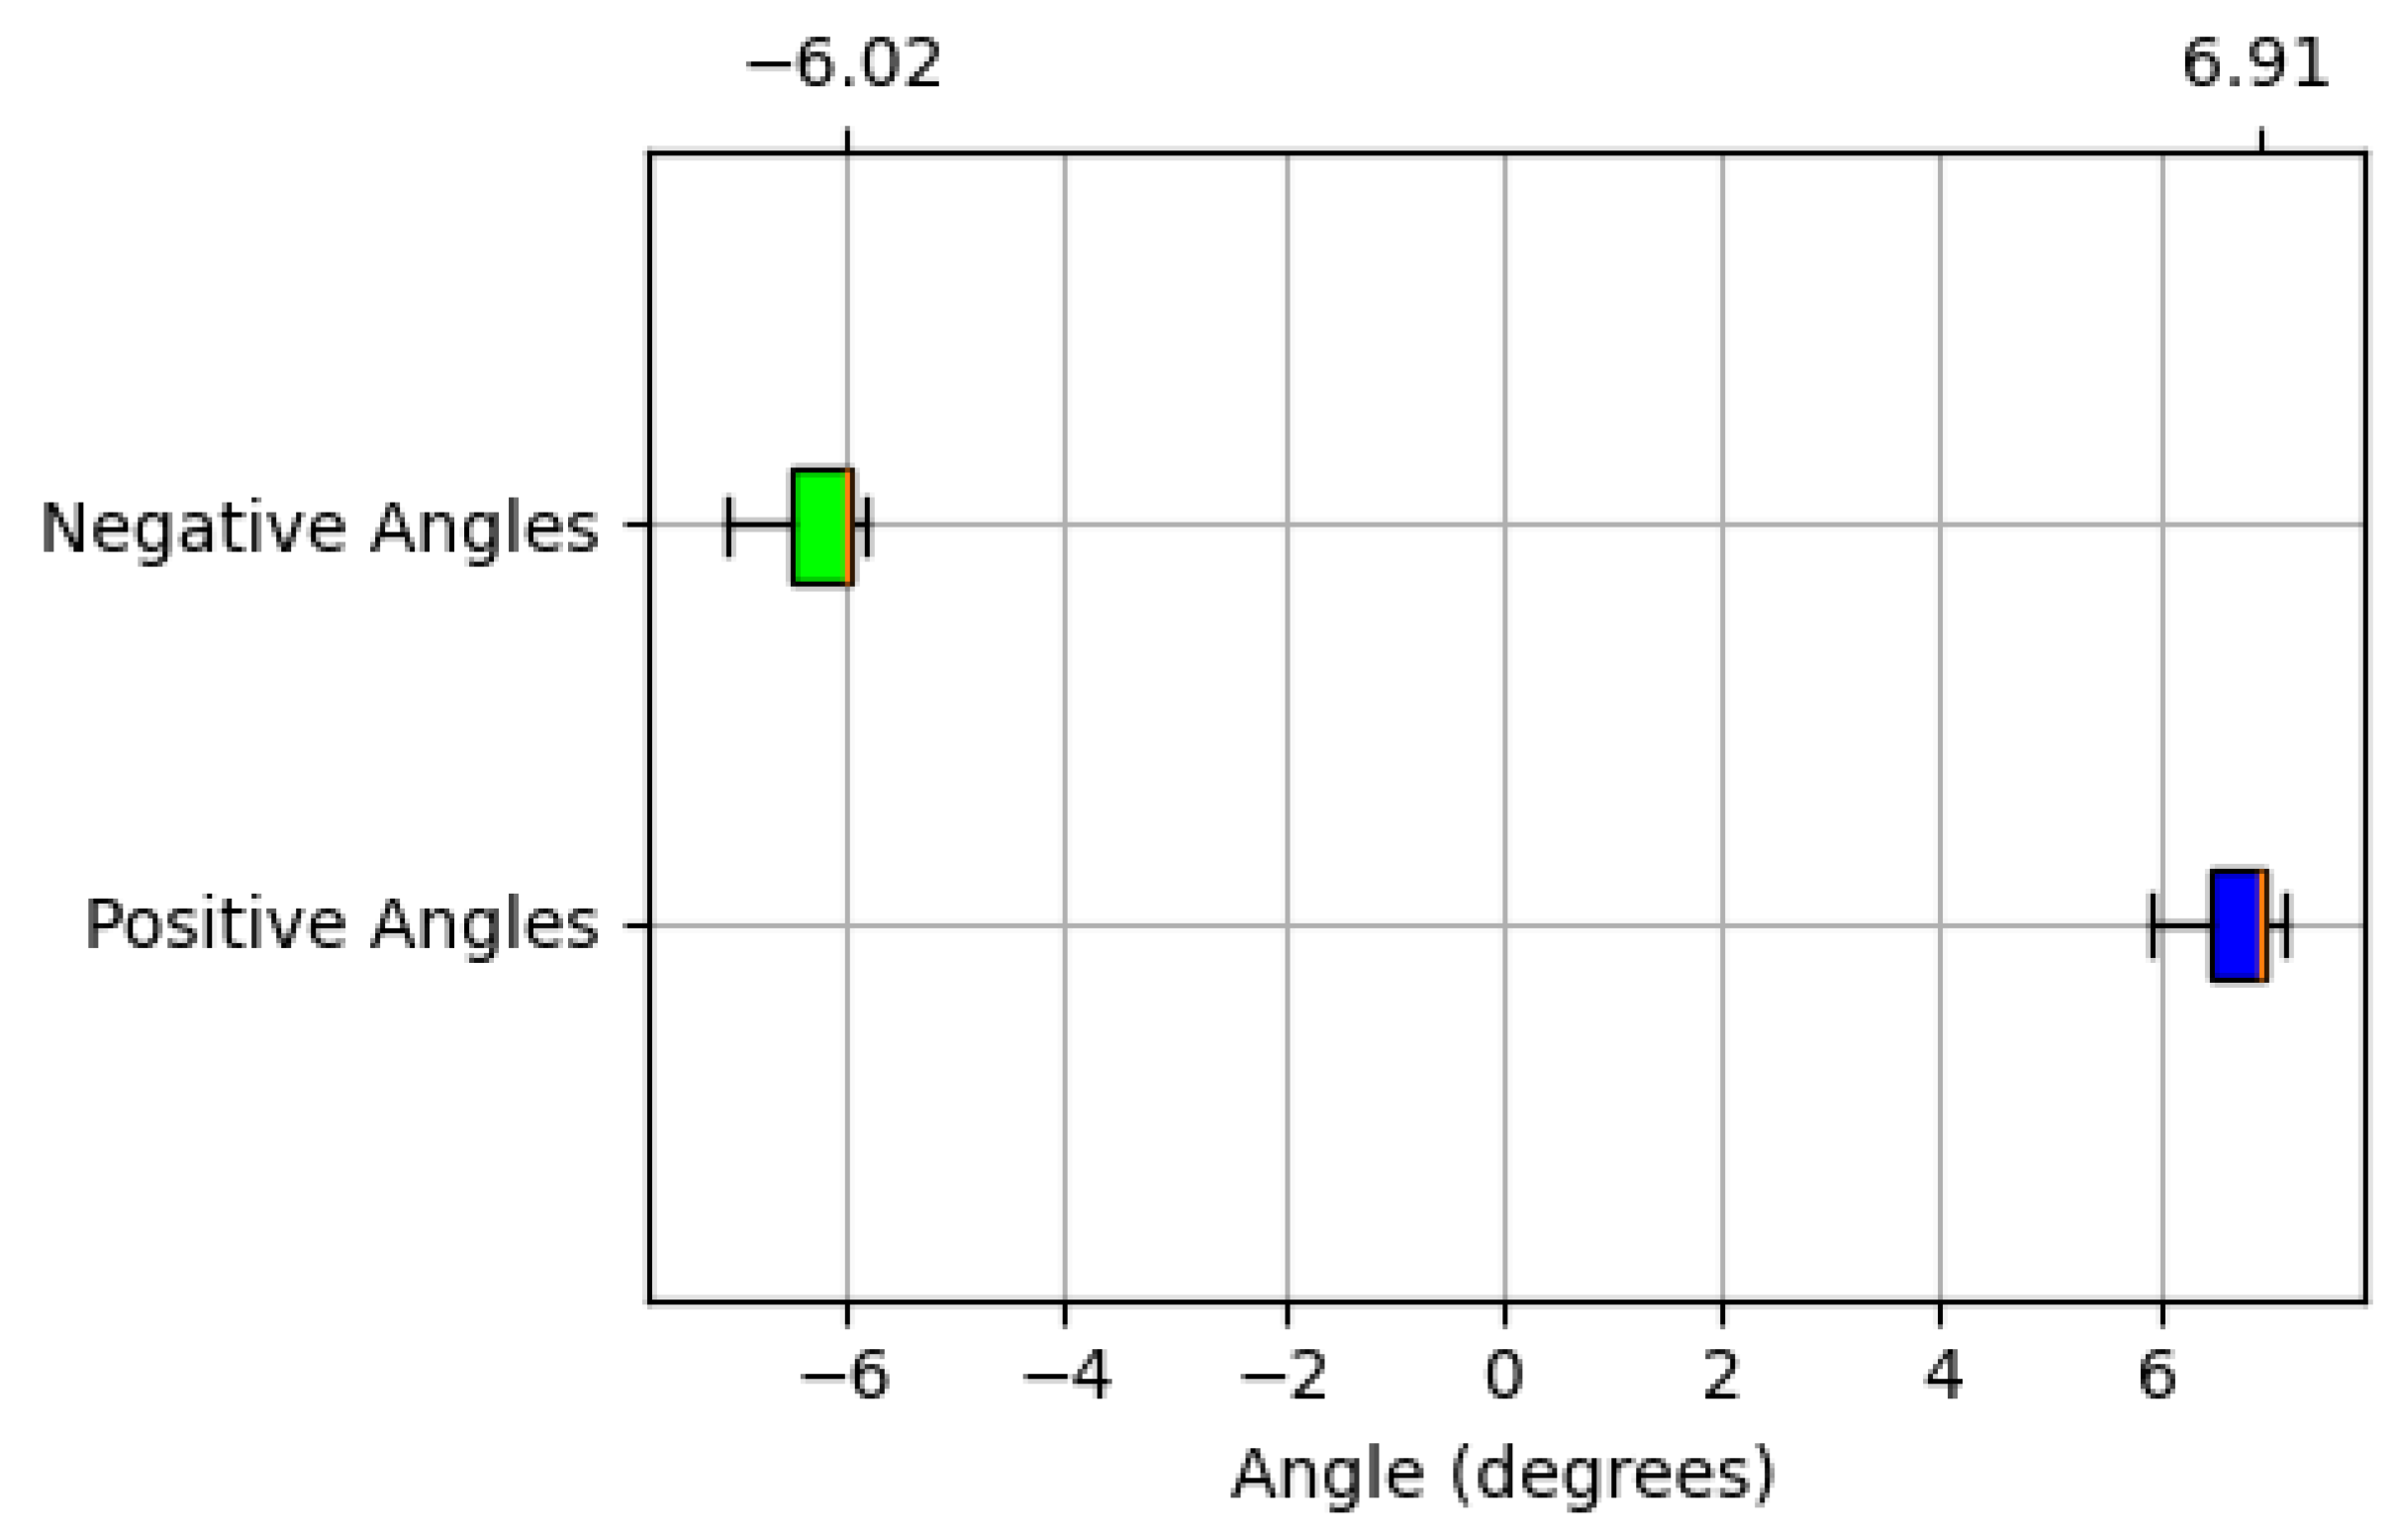

Table 1.
COPV Types and Key Characteristics.
| COPV Type | Key Characteristics | Notes / Comments |
| Type I | Metal liner without composite overwrap | Simple design and manufacturing |
| Type II | Metal liner, hoop-wound composite overwrap | Improved weight efficiency compared to Type I |
| Type III | Metal liner with full composite overwrap | Higher strength and increased energy density |
| Type IV | Polymer liner, fully overwrapped composite | Lightweight, high specific energy; load mainly on composite overwrap |
Disclaimer/Publisher’s Note: The statements, opinions and data contained in all publications are solely those of the individual author(s) and contributor(s) and not of MDPI and/or the editor(s). MDPI and/or the editor(s) disclaim responsibility for any injury to people or property resulting from any ideas, methods, instructions or products referred to in the content. |
© 2025 by the authors. Licensee MDPI, Basel, Switzerland. This article is an open access article distributed under the terms and conditions of the Creative Commons Attribution (CC BY) license (https://creativecommons.org/licenses/by/4.0/).
Copyright: This open access article is published under a Creative Commons CC BY 4.0 license, which permit the free download, distribution, and reuse, provided that the author and preprint are cited in any reuse.


