
Submitted:
08 November 2025
Posted:
11 November 2025
You are already at the latest version
Abstract
Based on the author's self-developed Seismo-Geothermal Theory (SGT) system, this paper uses the M 4.0+ earthquake catalog of China and surrounding areas from the California Earthquake Center, USA, to determine the geographical and three-dimensional spatial distribution characteristics of earthquakes and volcanoes in the study area, the temporal progression of sub-crustal earthquakes, and the relationship between the stratified activity of Seismic Cone Tectonics (SCT) and strong intra-crustal earthquakes. It conducts detailed yet concise studies on 6 SCTs closely related to the study area, preliminarily depicting the surrounding environment of seismic activity in China, and introduces the concept of the upper mantle T-type tectonic belt, which spans the junction of the Pacific Ocean and the Eurasian continent. Operating in the mode of "T-type tectonic belt providing energy for the SCT driving layer → active layer conversion → energy storage layer accumulation → dissipation layer rupture leading to intra-crustal strong earthquakes and/or volcanic eruptions", it may become a powerful driver and source of power for seismic activity in China and surrounding areas. Sub-crustal earthquakes are an important geophysical parameter of the upper mantle that can currently be detected by human seismic instruments, and the stratified activity ε₀ values of sub-crustal earthquakes may also become a predictive indicator for strong intra-crustal earthquakes. On this basis, it may be possible to use multiple precursor indicators to explore the possibility of future moderate to strong seismic activity in the study area, contributing to mitigating disasters caused by intra-crustal strong earthquakes and volcanic eruptions.
Keywords:
Seismic Geothermal Theory (SGT or Seismo-Geothermics)
; Seismic Cone Tectonic (SCT)
; sub-crustal seismic activity ε0 value
; upper mantle T-type tectonic belt
; China region
1. Introduction
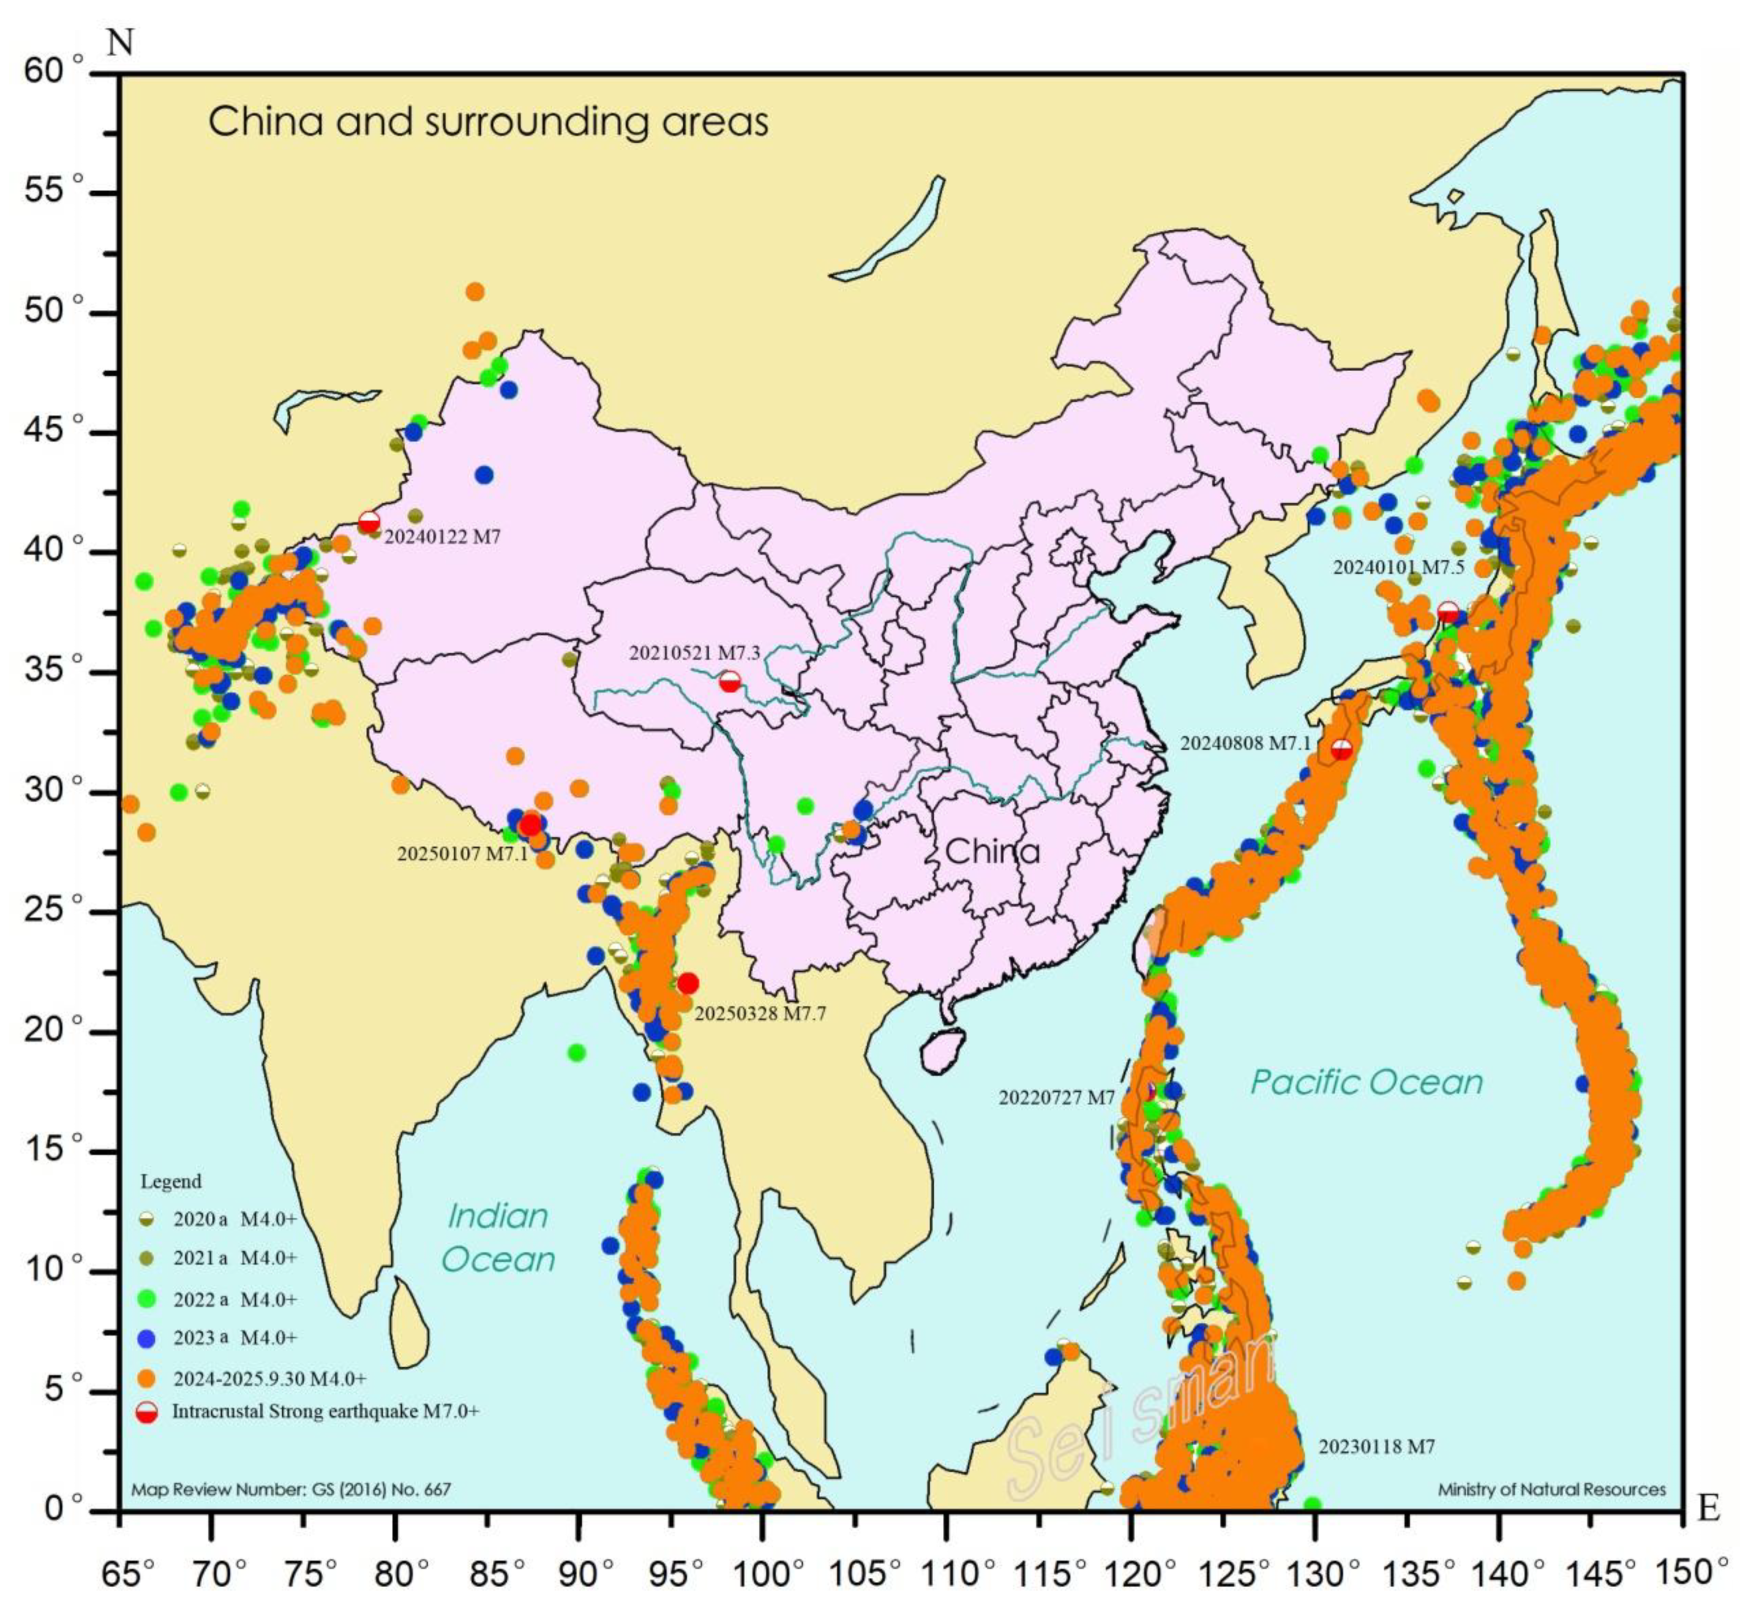
China and its surrounding areas, between 65°~150°E and 0°~60°N, are among the regions with high incidence of global strong earthquakes and volcanic activities, as shown in Figure 1. The population of the entire region accounts for more than one-third of the world’s total, with developed modern civilization. There is close attention to the losses and impacts caused by earthquake and volcanic disasters, and the research on the prediction of earthquake and volcanic activitie is extremely urgent.
The causes and prediction of earthquake and volcanic disasters remain a worldwide problem at present. Based on the principles and methods of the author’s self-created Seismo-Geothermal Theory (SGT or Seismo-Geothermics for short) [1,2,3,4,5,6,7,8,9,10,11,12,13], this paper attempts to explore the characteristics of Seismic Cone Tectonic (SCT or Seismic cone for short) in the study area, as well as the tectonic conditions of the upper mantle and the possibility of predicting strong intra-crustal earthquakes and volcanic activities, using the ANSS earthquake catalog data from the Northern California Earthquake Center in the United States.
The specialized terms used in this article include:
Seismo-Geothermal Theory:abbreviated as SGT, or Seismo-Geothermics, a seismo-thermodynamic theory explaining the causes of earthquakes and volcanoes and exploring their prediction methods, which is one of the basic categories of Seismo-geology;
Intra-crustal strong earthquake: with a depth < 35 km, M 6.5+ (in less seismic areas) or M 7.0+ (in more seismic areas). Considering that some M 6.5+ intra-crustal strong earthquakes may also have abnormal ε0 values, the lower limit of intra-crustal strong earthquakes is uniformly adopted in Figure 8;
Subs-crustal earthquake: with a depth > 35km, serving as the energy flow carrier of SCT;
Seismic Cone Tectonic: abbreviated as SCT or Seismic cone, an inverted cone formed by dense hypocenters of medium and deep-focus earthquakes, with a depth of about 35-700km;
Earthquake & Volcano Disaster Chain: a structure prone to frequent or concurrent occurrences of earthquakes and volcanoes;
Upper mantle T-type tectonic belt: a T-type tectonic belt composed of deep-focus strong earthquakes with a depth greater than 500 km and a magnitude of M 7.0+, where the northeast and northwestern branches intersect vertically;
Heat engine belt: an M-type tectonic belt composed of 24 global SCTs;
Dissipation Layer: approximately 0-35 km, also known as the heat-dissipating layer, the operating platform for intra-crustal strong earthquakes and SCT-type volcanic eruptions;
Energy Storage Layer: approximately 35-150 km, the accumulation layer of energy from the lower stratum, which works together with the dissipation layer during strong intra-crustal earthquake activities, containing volcanic magma chambers [19,25];
Active Layer: approximately 150-350 km, the dominant area of olivine phase transition, a transition layer for energy upload from the driving layer, and also the driving layer of medium and deep-source SCTs; if the starting magnitude is lowered, the driving function may disappear;
Driving Layer: approximately 350-700 km, the dominant area of perovskite phase transition, the energy source for upper mantle seismic activities and volcanic eruptions;
ε0 values of the sub-crustal layered seismic activity: measured by the multi-year anomaly percentage of the number of M4.0 earthquakes converted from the strain energy of annual subsrustal seismic activity, or the multiple of the median value [11].
In the setting of the SCT ideal model, 0-35 km is the Dissipation Layer, 35-150 km is the Energy Storage Layer, 150-350 km is the Active Layer; 350-660 km is the Driving Layer; the layer below is the bottom of the upper mantle. The stratification of each SCT is slightly different (Table 3), so they operate independently without interfering with each other, but the Dissipation Layer and the Driving Layer are basically unchanged.
2. Materials and Working Methods
The seismic data in the study area comes from the ANSS earthquake catalog of the California Earthquake Center, USA. A total of 157,738 earthquakes with a magnitude of 4.0 or higher (M 4.0+) in the study area from 1963 to September 30, 2025 were obtained, with the maximum focal depth being 686 km. The activity distribution of the sub-crustal strata is shown in Table 1, and the geographical distribution of seismic activity is shown in Figure 1. The 3D stereoscopic image of the entire area is shown in Figure 2, the temporal sequence process is shown in Figure 3, and the comparison between the layered seismic activity curves and the strong earthquakes within the crust is shown in Figure 4.
Data preprocessing: Outliers were removed from the M 4.0+ earthquake data in the ANSS catalog from 1963 to 2025 (such as data with a focal depth > 700 km or < 0 km), and the data integrity is over 95%. In the study area, only the region east of 120°E can obtain M 1.0+ earthquakes using Japan’s local earthquake catalog, but most areas west of it basically do not have earthquake catalogs below M 4.0 that meet the SGT requirements, so it is inconvenient to adopt them.
This paper does not include a comparative study on volcanic activity.
Based on the principles and working methods of the Seismo-geothermal theory, this paper mainly conducts the following four studies:
(1) Three-dimensional distribution of seismic activities in the study area
As can be seen from Figure 2, the three-dimensional distribution of seismic activities is helpful for accurately distinguishing the location and activity characteristics of seismic cones or earthquake & volcanic disaster chain systems.
SCT is an inverted cone formed by dense sub-crustal seismic sources. That is to say, SCT is a dense bundle of seismic sources formed by the rupture of sub-crustal rocks (>35km) when hot materials in the deep upper mantle (such as partially molten mantle rocks) migrate upward. It is “inverted cone-shaped” because when deep hot materials diffuse upward, they spread out in a fan shape (the density of deep seismic sources is high and the pressure is strong, while the density in the shallow part is low and the pressure is relatively small). Its essence is the “surface projection” of upper mantle thermal activities under the crust, which is directly related to the thermal disturbance process of the upper mantle. The earthquake and volcanic disaster chain system is a single cylinder formed based on the ideal model of SCT. SCT or the earthquake and volcanic disaster chain system is the main body of sub-crustal seismic activities. The correlation between sub-crustal seismic activities and strong intra-crustal seismic activities is a reliable basis for the causes of earthquakes and volcanic eruptions as well as for earthquake and volcanic prediction. This three-dimensional distribution image clearly reveals the inverted cone shape of SCT, providing an intuitive basis for understanding the connection between the migration of hot materials in the upper mantle and sub-crustal earthquakes.
(2) Temporal process of seismic activity in the study area
As can be seen from Figure 3, the temporal sequence of seismic activity can connect the time series relationship between strong intra-crustal earthquakes and sub-crustal seismic activity, helping to clarify whether the sub-crustal seismic activity before strong intra-crustal earthquakes is a precursor or the result of subduction backlash.
Figure 3 shows traces of sub-crustal earthquakes moving from the bottom up, including deep strong earthquakes with magnitudes of 7 or higher. The time intervals between them are approximately 10-18 years, which seem to be related to sunspot activity or the Earth’s nutation.
The precursor effect should be a premonition of strong intra-crustal earthquakes, while the subduction effect should be the backlash of surface tectonic activity on the sub-crustal strata. The precursor effect can reasonably explain the release of energy accumulated by sub-crustal seismic activity, especially how the energy released by sub-crustal strong earthquakes with magnitudes of 7.0 or higher at depths of hundreds of kilometers can be dissipated. The source of power of backlash cannot be determined.
(3) Comparison chart between the sub-crustal layered seismic activity ε0 and the strong crustal earthquakes in the study area
According to the ideal model of the SCT based on the Seismo-Geothermics and the definition of seismic activity, the ε0 values of the sub-crustal layered seismic activity in the study area can be calculated [11], as shown in Figure 4.
In Figure 4, the ε00 value corresponds to the Dissipation Layer (0-35 km), which is the layer where the thermal energy of the seismic cone is freely dissipated. Its value is relatively large when there are strong intra-crustal seismic activities; otherwise, it tends to be the average value, only reflecting background seismic activities. ε01 corresponds to the Energy Storage Layer (35-150 km), a region where thermal stress of mantle materials accumulates, with dense seismic sources (gradual accumulation of energy). That is, the continuous rise of the ε₀1 value in the Energy Storage Layer reserves energy for intra-crustal seismic activities. The ε02 value corresponds to the Active Layer (150-350 km), a “conduction layer” for thermal stress release, with frequent seismic activities (upward transfer of energy). That is, the abrupt change of ε₀2 in the Active Layer indicates the transfer of energy to the Energy Storage Layer. The ε03 value corresponds to the Driving Layer (350+ km), the core area of thermal material activities in the deep upper mantle, the starting point of thermal energy rise, and the fundamental source of energy for SCT activities. That is, the rise of ε₀3 in the Driving Layer triggers the entire energy conduction chain, ultimately leading to strong intra-crustal earthquakes or volcanic eruptions.
As can be seen from Figure 4, the comparison chart between the sub-crustal layered seismic activity ε0 and strong intra-crustal earthquakes shows that the continuous increase in the ε0 value of the driving layer or active layer is related to the continuous intense activity of strong intra-crustal earthquakes. This is excellent news: the ε0 value of the driving layer or active layer is expected to become a precursor parameter for strong intra-crustal earthquakes.
However, such a judgment requires rigorous and scientific verification. It is best to select appropriate research subjects, such as SCT, or seismic sub-SCT, or disaster chain systems, or small areas around strong intra-crustal earthquakes that can include all relevant sub-crustal earthquakes beneath them. Moreover, it requires seismic data with high-quality resolution of sub-crustal earthquakes.
As can be seen from Figure 4, the relationship between sub-crustal earthquakes and strong intra-crustal earthquakes seems to have gradually established itself only since 1985. Progress in natural sciences is inevitably dependent on advances in science and technology.
(4) The geographical distribution of sub-crustal seismic activity in the years before an earthquake can predict the location of future strong earthquake activity.
This is one of the methods used by the author to determine the Aksu area when predicting the 2024 Xinjiang M 7 intra-crustal strong earthquake [8].
3. Introduction to Seismic Cone Tectonics in the Study Area
According to Seismo-Geothermics’s global Seismic Cone Tectonics (SCT) zoning standards and unified numbering, the study area involves a total of 9 SCTs, namely #07 Japan SCT, #08 China Hunchun SCT, #09 Northern Mariana SCT, #10 Mariana SCT, #11 Taiwan and Ryukyu SCT, #17 Myanmar SCT, #18 Hindu Kush SCT, #22 Manila SCT, and #23 Andaman SCT structures, as shown by the solid or dashed lines in Figure 5. The areas of #06 Okhotsk SCT and #12 Philippines SCT are not included in the study area, resulting in incomplete data, so they are not included in the discussion of this section.
A summary table of the stratified activity status of Seismic Cone Tectonics in the study area is shown in Table 2. Table 2 displays the seismic activity in various strata of SCTs, based on which the resolution of sub-crustal earthquakes in the earthquake catalog and the activity characteristics of SCTs can be judged. The 3D stereoscopic images of each major SCT are shown in Figure 6, the stratified seismic activity curves are shown in Figure 7, the relationship between the stratified seismic activity ε0 values of the main SCTs in the study area and strong intra-crustal earthquakes is shown in Figure 8, and the distribution of sub-crustal earthquakes in the last 5 years (2020-2025) in the study area is shown in Figure 9 and Figure 10.
Figure 6.
Three-dimensional images of each seismic cone structural area in the study area.Figure 6 Description: The seismic cones in China and its surrounding areas that strongly affect China’s seismic status are the six SCTs: #08, #09, #11, #17, #18, and #22.
Figure 6.
Three-dimensional images of each seismic cone structural area in the study area.Figure 6 Description: The seismic cones in China and its surrounding areas that strongly affect China’s seismic status are the six SCTs: #08, #09, #11, #17, #18, and #22.
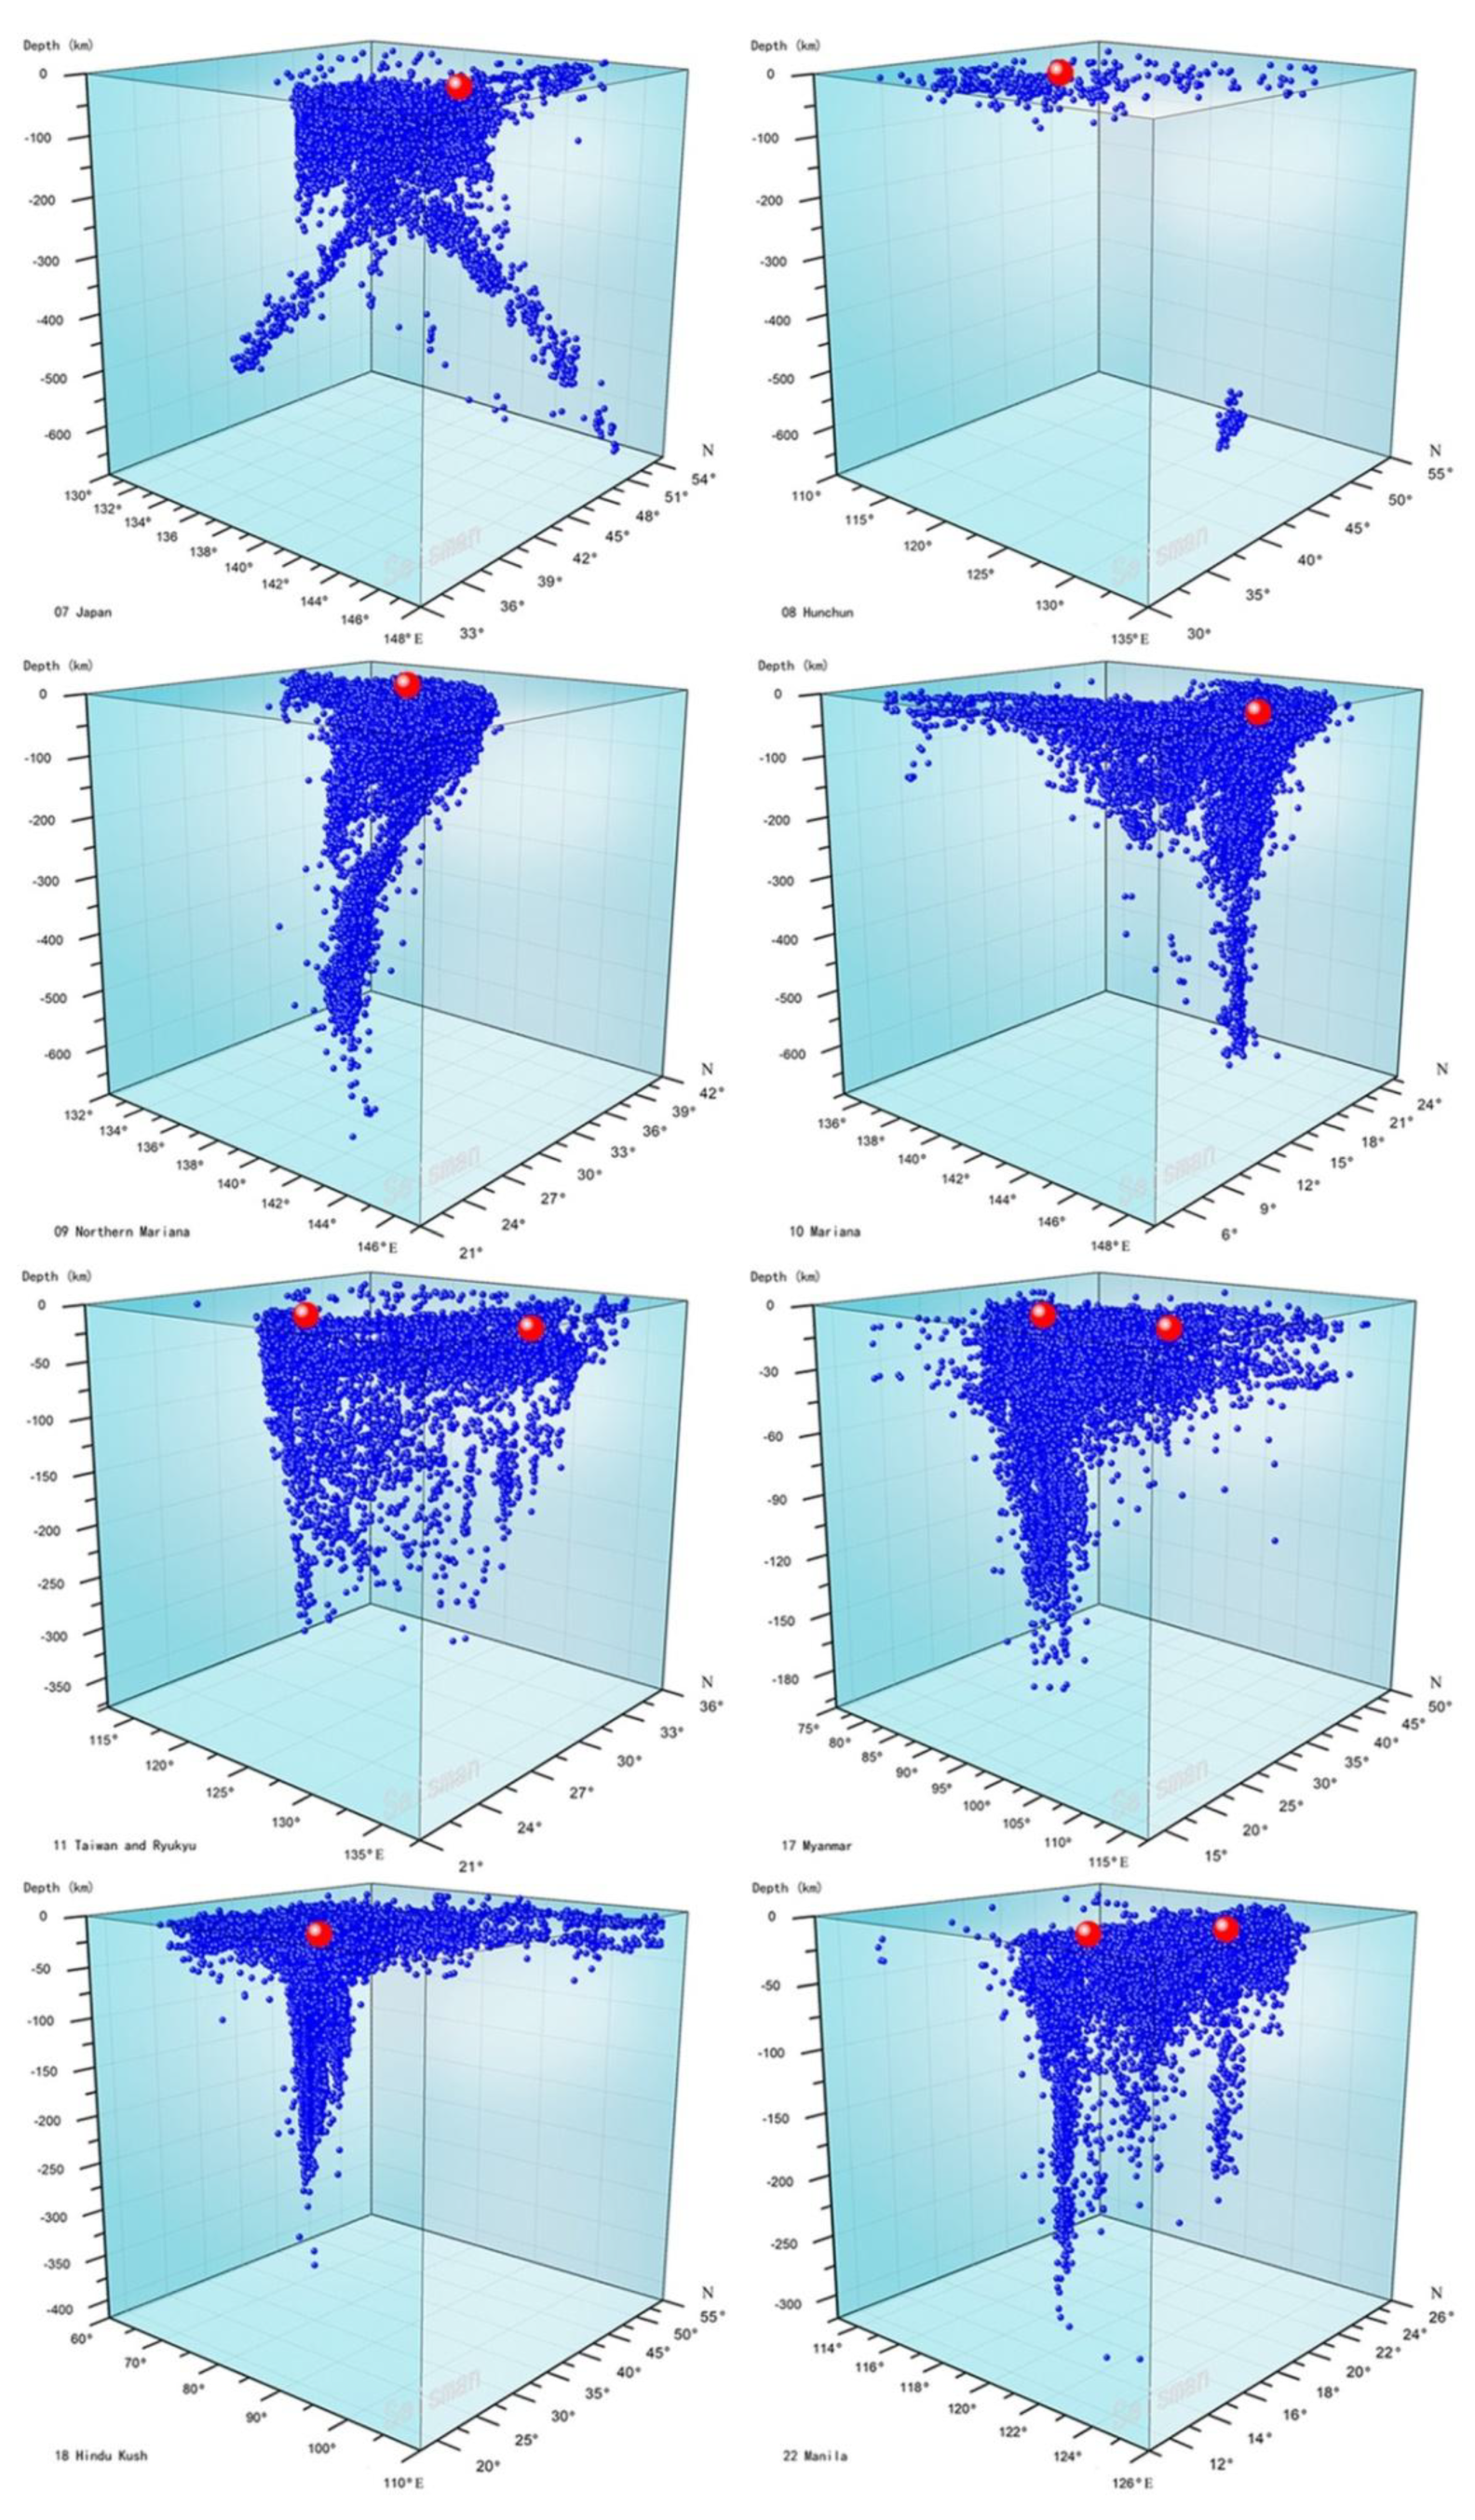
Figure 7.
Chronological process of the main seismic cones in the study area. Explanation of Figure 7: In Figure 7 shows that frequent M 5+ earthquakes occurred in Songyuan, Jilin from 2004 to 2019 within the #08 Hunchun SCT, which is related to the unceasing activity of the driving layer (> 500 km), suggesting that attention should be paid to the risk of future volcanic activities in this region. In #17, the Myanmar SCT shows trending anomalies in both the 2008 Wenchuan earthquake and the 2025 Myanmar earthquake. In #18, the Hindu Kush SCT successfully predicted the last M 7 earthquake.
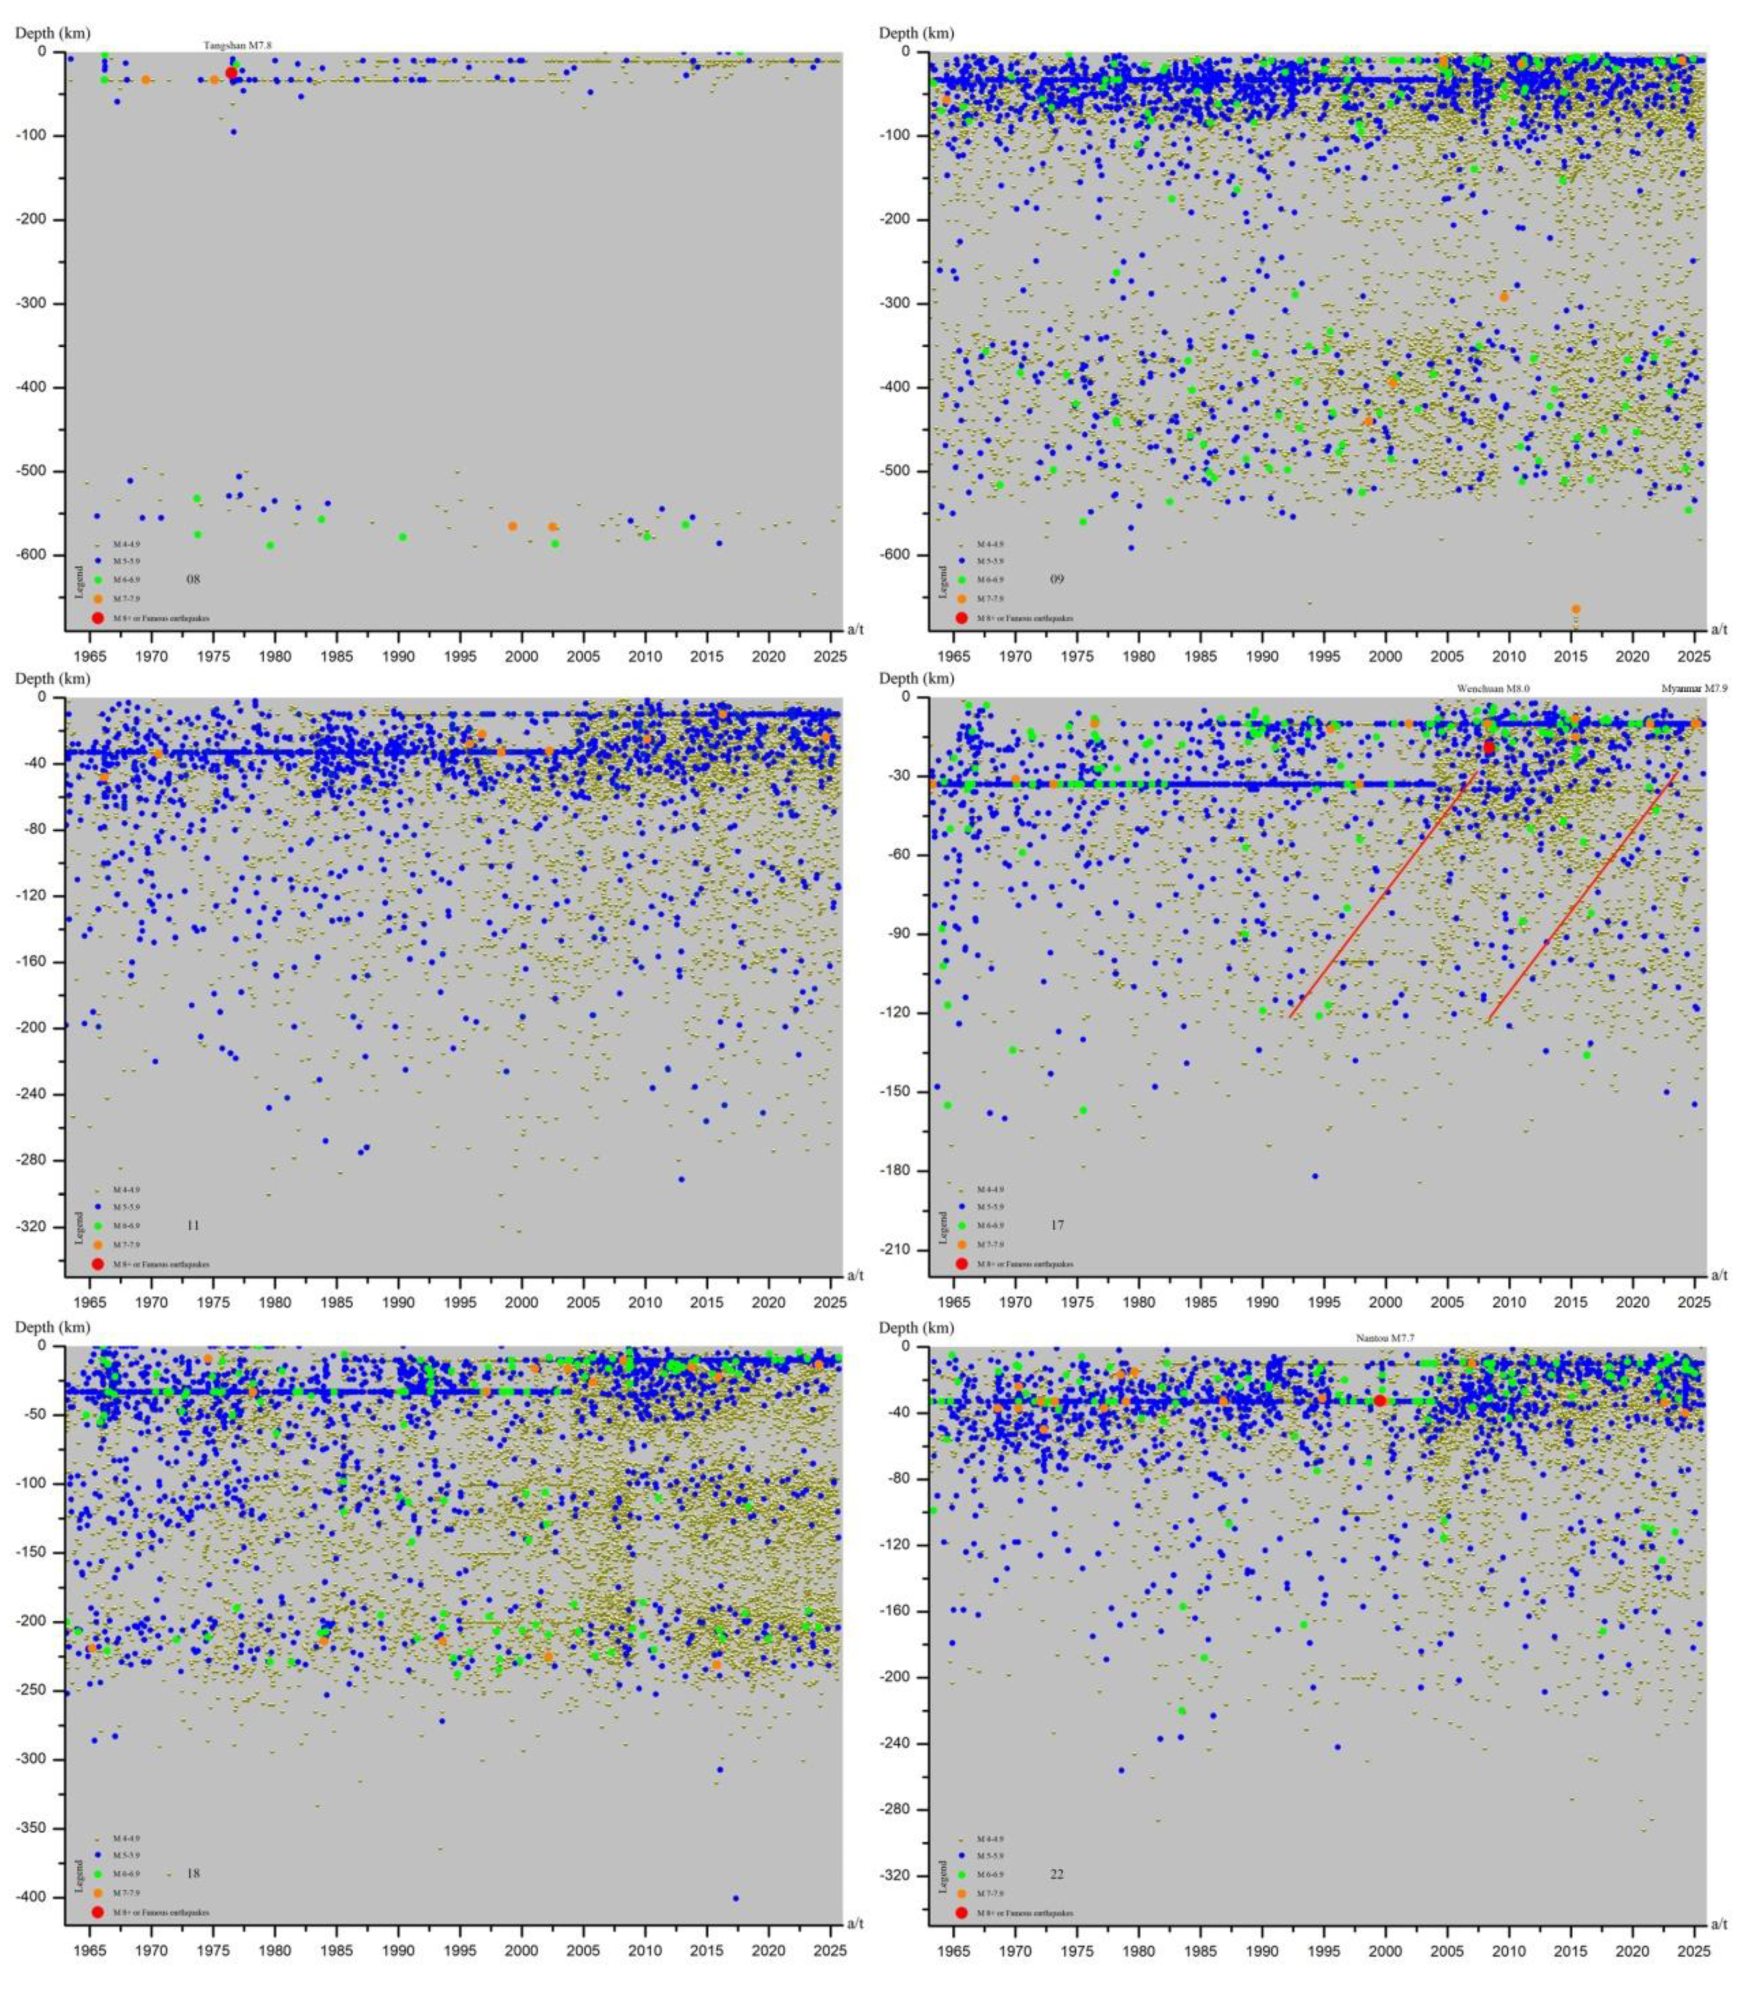
Figure 8.
Comparison Chart of Seismic Activity in Stratified Structures of Major Seismic Cones and Strong Intra-crustal Earthquakes in the Study Area. Explanation of Figure 8: The green bar chart in the figure represents intra-crustal strong earthquakes with magnitudes of M 6.5 or higher in the region from 1963 to 2025. The Tangshan Earthquake, the Wenchuan Earthquake, and the Taiwan Earthquake seem to have precursors.. #17 Myanmar SCT Both the 2008 Wenchuan earthquake and the 2025 Myanmar earthquake showed anomalies. The abnormal ε02 value of #18 Hindu Kush SCT in 2015 appears to constitute a precursor to the 2024 Xinjiang M 7 earthquake.
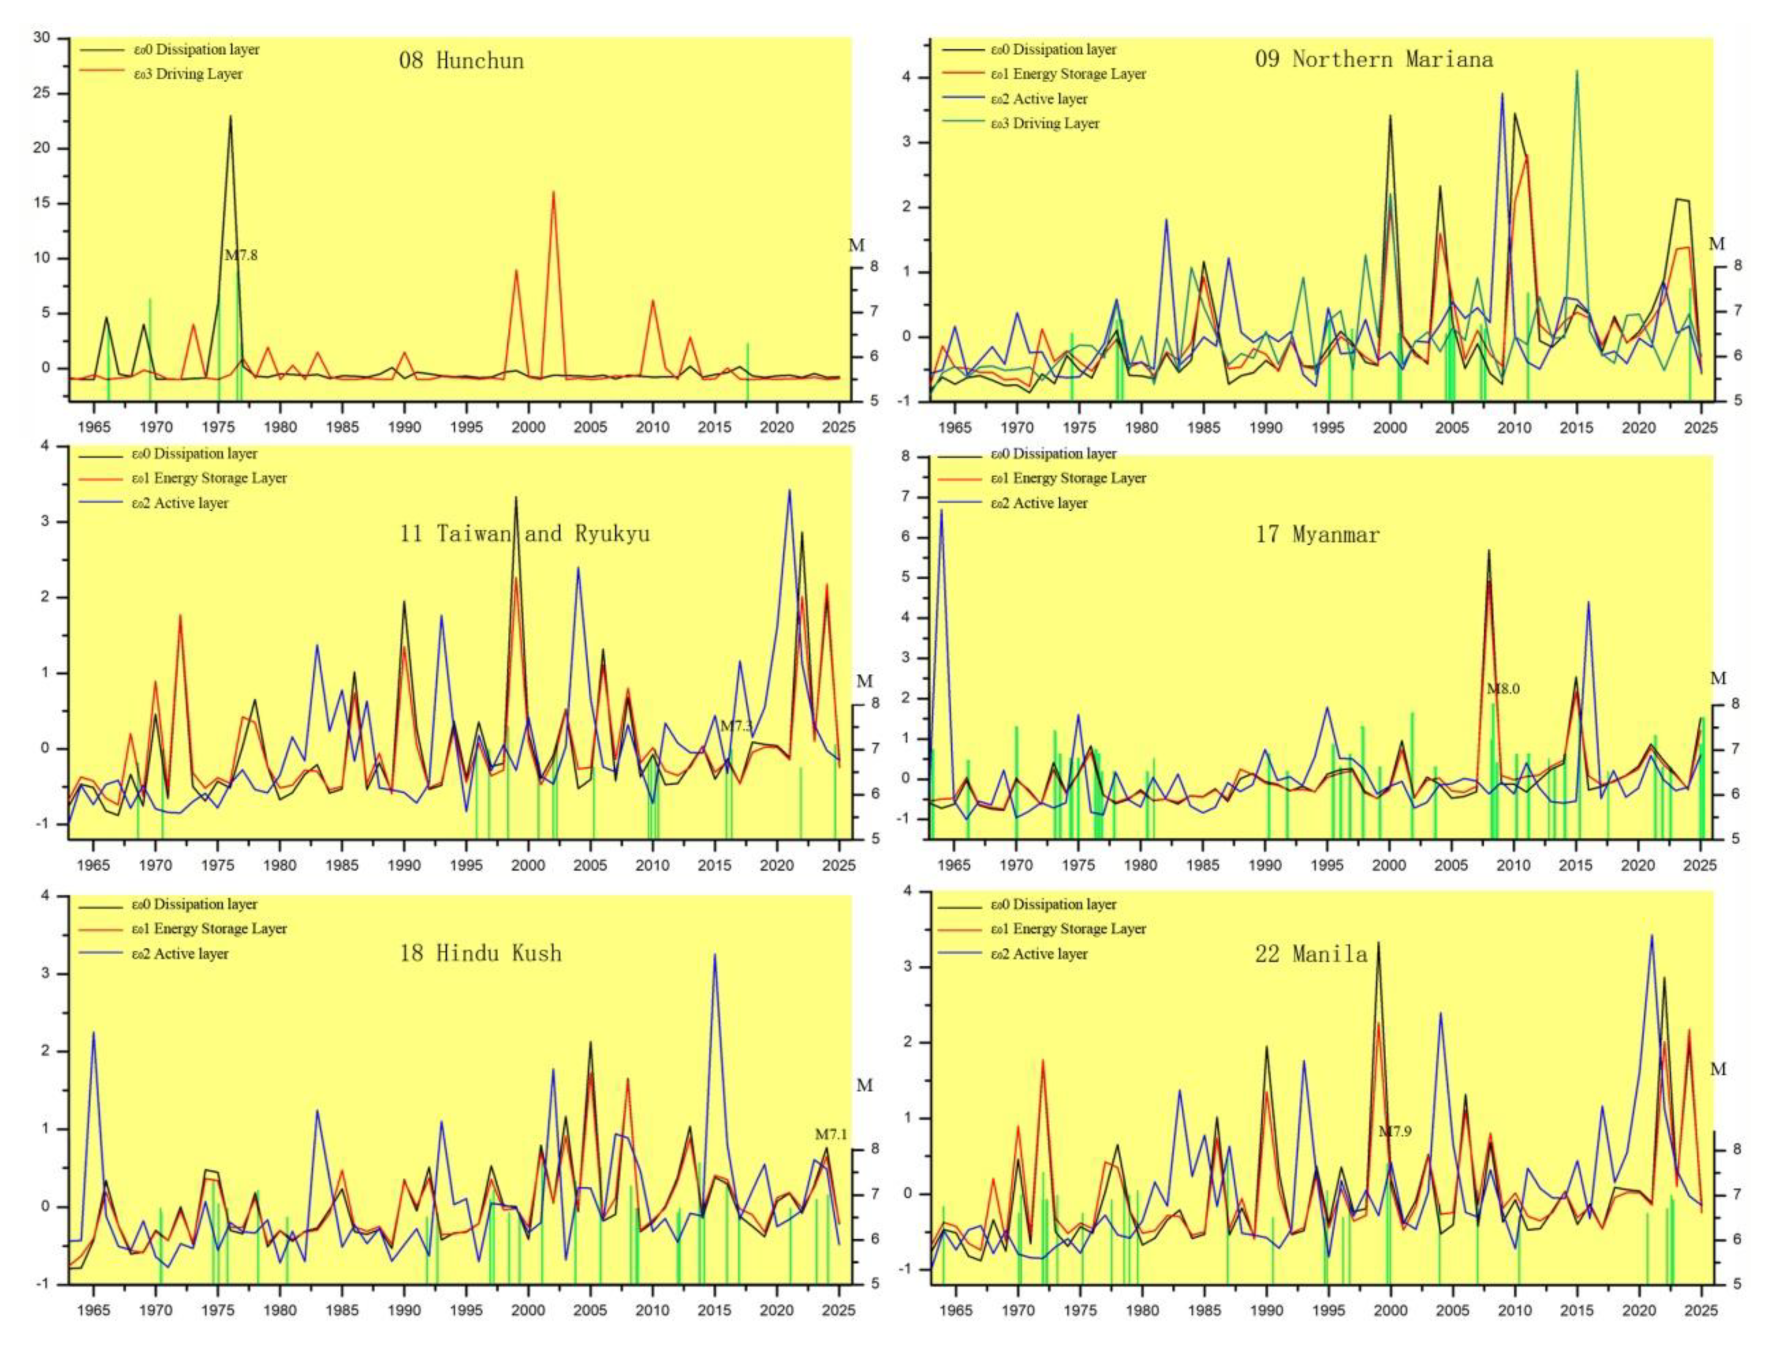
Figure 9.
Distribution Map of Sub-crustal Seismic Activity in the Study Area from 2020 to 2025 (Data from the US ANSS Earthquake Catalogue, 2020.1.1-2025.9.30 M 4.0+).
Figure 9.
Distribution Map of Sub-crustal Seismic Activity in the Study Area from 2020 to 2025 (Data from the US ANSS Earthquake Catalogue, 2020.1.1-2025.9.30 M 4.0+).
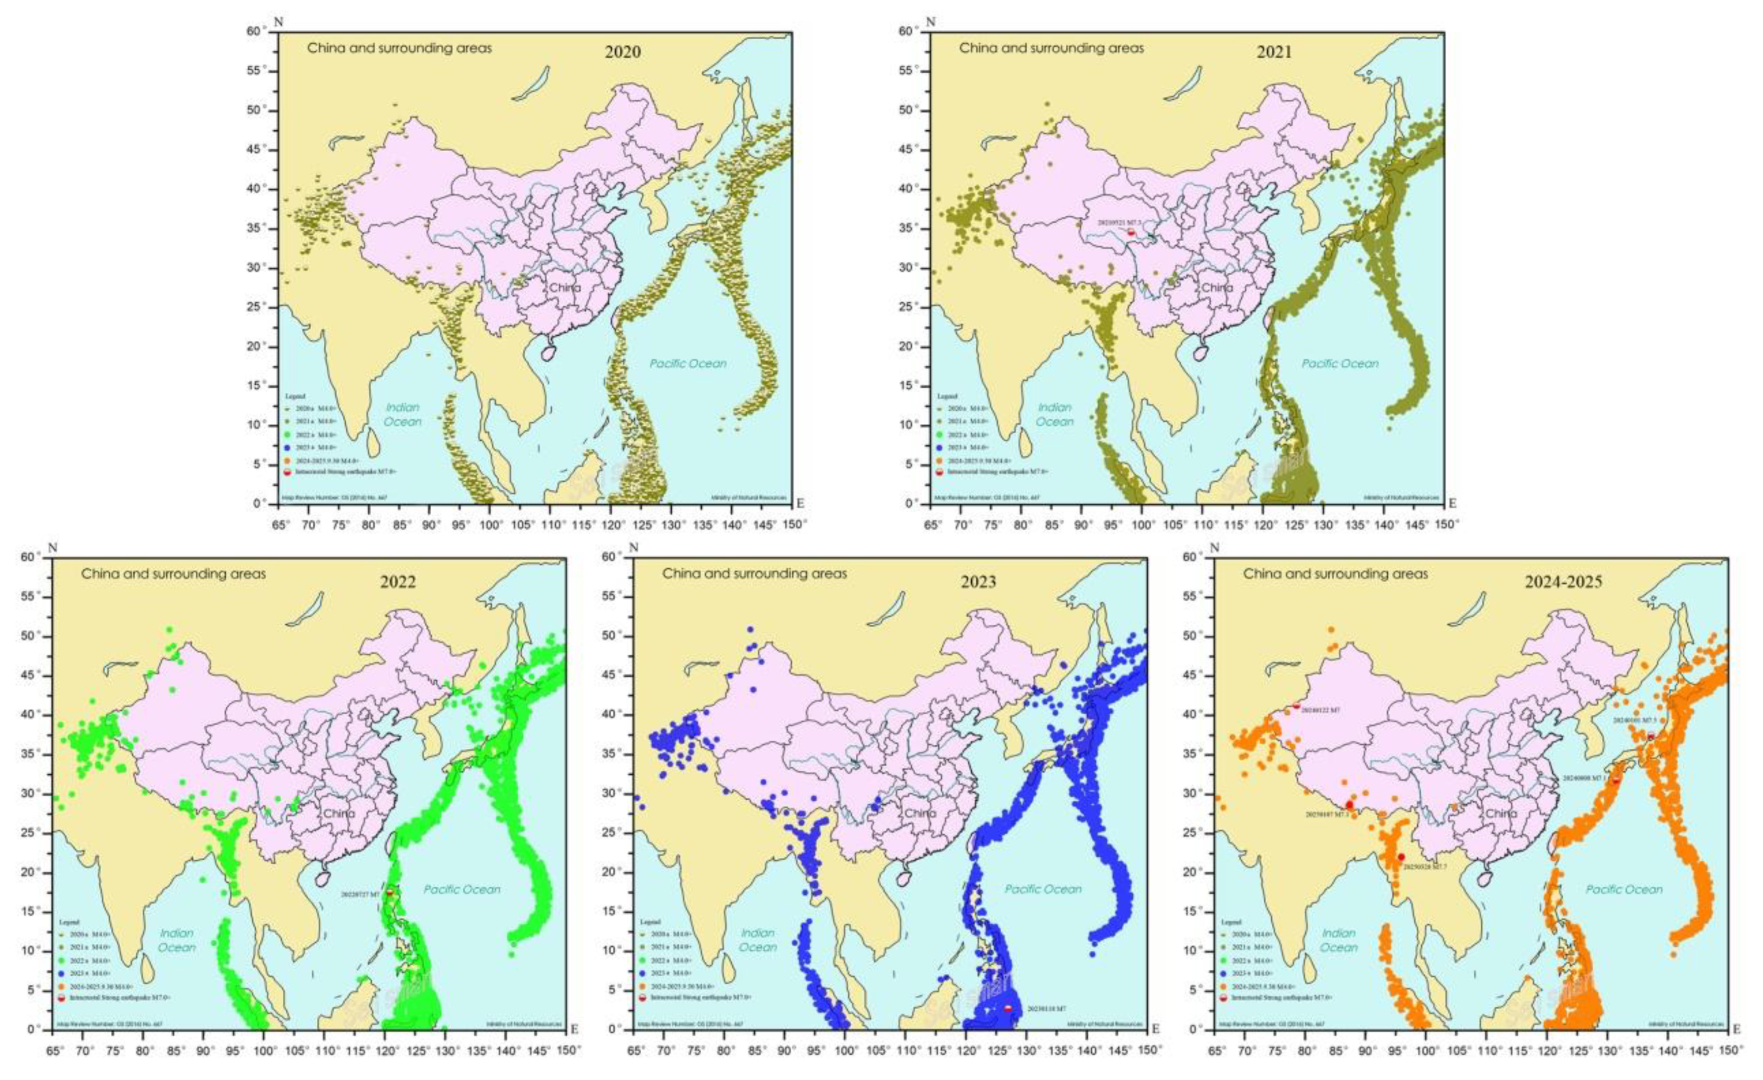
Figure 10.
Distribution of sub-crustal seismic activity in the study area in 2020-2025.9.30 (Data from the US ANSS Earthquake Catalogue, 2020.1.1-2025.9.30, M 4.0+) Explanation for Figure 10: Before the M 7.3 earthquake in Qinghai, China in 2021, no M 4.0+ sub-crustal seismic activities were observed in the ANSS catalog. It is recommended to improve the resolution of sub-crustal earthquakes in the local seismic catalog to supplement the deficiency of data on M 4.0- sub-crustal seismic activities.
3.1. 3D Stereoscopic Images of Major Seismic Cones in the Study Area
The dense seismic zone beneath the crust is an obvious sign of SCT. The Seismo-Geothermics believes that all global events, such as strong intra-crustal earthquakes, SCT-type volcanic eruptions, climate warming or cooling [13], and so on, are related to the thermal movement in the deep upper mantle. Therefore, it is very important to investigate the activity intensity of sub-crustal earthquakes within the deep seismic active structures.
It can be seen from Figure 6 that the #07 Japan seismic cone is located in the northern part of Honshu, Japan, showing a tripartite confrontation, with a maximum focal depth of 632 km, and an M 9.1 earthquake occurred in 2011; the #08 Hunchun seismic cone is located in Jilin, China, with a maximum focal depth of 645 km, in a dormant state, with no sub-crustal seismic activity observed in the active layer, and an M 7.8 Tangshan earthquake occurred in 1976; the #09 and 10# seismic cones are located at the northern and southern ends of the Mariana Trench respectively, in an ancient volcanic belt, where strong intra-crustal earthquakes are not very active; the #11 Taiwan and Ryukyu seismic cone is located on the eastern side of the East Sea, China, where strong intra-crustal earthquakes and volcanic eruptions are relatively frequent, especially in the Kyushu region of Japan; the center of the #17 Myanmar seismic cone is located in Myanmar, covering the entire Qinghai-Tibet Plateau and its northeastern edge, and an M 8.0 Wenchuan earthquake occurred in 2008; the 18# Hindu Kush seismic cone is located in the Pamirs, and its affected area can reach as far as beyond Lake Baikal to the north, with no M 8+ earthquakes observed; the #22 Manila seismic cone is located in southern Taiwan, China and the Manila area of the Philippines, and an M 7.9 Nantou earthquake in Taiwan occurred in 1999. The #23 Andaman SCT is not strongly active.
It can be seen from this that the seismic cones in China and its surrounding areas that strongly affect China’s seismic status are the six structures including #08, #09, #11, #17, #18, and #22, which are proposed to be the focus of research. To further clarify the activity patterns of these seismic cones, it is necessary to analyze the temporal progression of their sub-crustal earthquakes from a time dimension and explore the energy accumulation characteristics before the occurrence of strong earthquakes (see Section 3.2).
3.2. Temporal Process of Major Seismic Cone Tectonics in the Study Area
The temporal progression of the main seismic cone structures in the study area is shown in Figure 7, and the temporal progression of each sub-figure is described as follows.
According to the ANSS earthquake catalog, the #08 Hunchun (China) SCT is currently in a dormant state, with seismic activity only occurring near the surface and at depths below 500 km, and the intensity is not high. The surface activity shows no obvious periodicity, while the deep part exhibits slow movement with a long period of about 20 years. Before the 1976 Tangshan M 7.8 earthquake, there were 2 M 6+ seismic activities in the deep part, but around 2000, 2 M 7+ deep strong earthquakes occurred one after another, and only one North Korean M 6.3 earthquake on September 3, 2017, occurred in the crust. From 2004 to 2019, multiple M 5+ earthquakes occurred in the Songyuan area of Jilin Province [14], which may be a kind of reminder. At present, the second active phase of the driving layer below 500 km depth has not yet ended, so it seems that high vigilance should still be maintained. It is suggested to improve the resolution of sub-crustal seismic activity in the local earthquake catalog, in order to detect the possible signs of awakening of this seismic cone structure as early as possible. The day it awakens may be when volcanic activity in Northeast China begins.
The #09 Northern Mariana SCT is an extension of the Mariana Trench to the northwest. Both surface and deep seismic activities show short-term oscillations of ten to more than ten years, with comparable activity intensity, and volcanic activity is also well-developed. This seismic cone is relatively close to Northeast and North China, so its possible impact on seismic activities in China should be considered. The #07 Japan SCT is also relatively close to Chinese territory, but since the main activities of the #08 and #07 seismic cones are mainly in the cones inclined to the southeast, while the #07 seismic cone has an additional sub-cone structure extending westward, which may block the interaction between the two. Of course, the activities of seismic cone structures are inherently independent and do not interfere with each other.
The #11 Taiwan and Ryukyu SSCT: From Taipei, China, along the Ryukyu Islands to Kyushu, Japan, it expands in a wall-like shape in three dimensions, and is the seismic cone structure that has the greatest impact on seismic activities in eastern China. Intra-crustal strong earthquakes in the waters east of Hualien, Taiwan, have an impact on the southeast coastal areas of China. Even the 2016 M 7.3 Kumamoto earthquake in Japan triggered M 3+ earthquake responses in Zhejiang and Hunan, China. The deep activity status of this seismic cone is not very clear, and research using Japan’s M 1.0+ earthquake catalog may make it clearer.
The #17 Myanmar SCT: Centered in Myanmar, it is one of the 24 global seismic cone structures with the shallowest depth and extremely strong seismic activity. It covers intra-crustal strong earthquakes in the central, eastern, and northeastern edges of the Qinghai-Tibet Plateau, and is a major strong earthquake zone in western China. The status of its deep seismic activity is not very clear, somewhat similar to the Italian sub-cone structure of the #19 Mediterranean SCT and the #24 North America SCT. The latter two have been clarified thanks to the M 1.0+ earthquake catalogs of the Mediterranean Seismic Center [24,25] and the U.S. ANSS [21]. Unfortunately, the Myanmar Seismic Cone does not have such conditions.
The #18 Hindu Kush SCT is a standardized structure with 3 distinct stratigraphic layers: the dissipation layer from 0 to 70 km, the energy storage layer from 70 to 170 km, and the active layer below 170 km. These 3 layers have clear structures, distinct activity rhythms, and reasonably matched activity intensities, almost like man-made objects. Unfortunately, there is no complete seismic catalog data for M 1.0+ or M 2.0+ here, making it impossible to understand the operational status of the driving layer below 300 km, which is a pity.
The last M 7 intra-crustal strong earthquake in the 18th sub-figure of Figure 7, the Aksu earthquake in Xinjiang, the author once submitted a written prediction and suggestions to the relevant departments half a year in advance. The M 7 earthquake occurred in the Aksu area on January 23, 2024 (classified as M 7.1 by CENC), which can be regarded as a perfect test [8].
#22 Manila SCT, the most important part for China is the Tainan sub-SCT. In 1999, the Nantou earthquake with a magnitude of M7.9 (classified as M7.7 in the ANSS catalog) occurred here, which is the famous “921” earthquake. Fortunately, before the strong intra-crustal earthquake in the Tainan sub-SCT, there might seem to be a M5+ far-field precursory earthquake in Guangxi. The author argued for this possibility in an article in 2020 [10], which was verified by the M6.9 Taitung earthquake on February 19, 2022, a year later.
3.3. Relationship Between the Layered Seismic Activity ε0 Values of Major Seismic Cone Structures in the Study Area and Strong Intra-Crustal Earthquakes
The relationship between the stratified seismic activity ε0 values of the main SCT in the study area and strong intra-crustal earthquakes is shown in Figure 8. The stratification principle of SCT is divided according to the time sequence process in Figure 7, as shown in Table 3. Table 3 basically covers the classification properties of the global SCTs stratigraphic structure.
According to the understanding of the SGT, the study on the relationship between the stratified seismic activity ε0 value of SCT and strong intra-crustal earthquakes should be conducted with individual seismic sub-SCTs or seismic & volcanic disaster chain systems as statistical units. Additionally, in the decade or so before the occurrence of strong intra-crustal earthquakes, precursor information should be sought in the Driving Layer or Active Layer, and the initiation mechanism should be explored in the Energy Storage Layer. However, this paper is a large-scale regional study, making it inconvenient to delve into details. Therefore, statistics are conducted with SCT as the unit, which can still reveal some clues, such as the 1976 Tangshan earthquake, the 2008 Wenchuan earthquake, the 2022 Taitung earthquake, the 2024 Aksu earthquake in Xinjiang, and the 2025 Myanmar earthquake, among others.
If high-quality local seismic catalogs of M1.0+ or M 2.0+ are available, and comparisons and identifications are made using ε0 values of 0.5a or 0.1a, the effect should be better.

Table 3.
Stratigraphic Structure of Major Seismic Tectonics*.
| Classification | Dissipation Layer | Energy storage layer | Active layer | Driver layer | Adaptive construction | Calculation program |
|---|---|---|---|---|---|---|
| Dormancy | 0-150 | Non | Non | 150+km | #08SCT | yB25-2.bas |
| Missing nature of the driver layer | 0-35 | 35-100 | 100+km | Non | #11 #17 #22 | yB25-3.bas |
| Specificity | 0-70 | 70-170 | 170+km | Non | #18 | yB25-3a.bas |
| Integrity | 0-35 | 35-150 | 150-350 | 350+km | #07 #09 25cn | yB25-4.bas |
* In the table, “Non” indicates that no M4.0+ seismic activity was observed.
3.4. Distribution of sub-crustal earthquakes in the last five years of the main seismic cone tectonics in the study area
According to the principle of SGT, the distribution of sub-crustal earthquakes in the last 5 years of SCT is an important basis for finding possible locations of future strong earthquakes. Similarly, in the case of strong earthquake tracking, the distribution of sub-crustal earthquakes in the last 5 years before a strong earthquake is also a good method to verify the location of the strong earthquake. Of course, it is best to use earthquake data with a magnitude of M1.0+ and a depth of > 35 km.
The annual sub-crustal earthquake distributions in the study area from 2020 to 2023 and from 2024 to 2025 are shown in Figure 9 and the comprehensive distribution over these more than five years is shown in Figure 10.
As can be seen from the figure, the basic forms of these distribution maps are highly consistent, indicating that the seismic activity status in the study area is basically stable and has formed a normal state. Therefore, as long as their singular points are found, it is possible to find the precursors of future strong earthquake activities. However, the specific singular points need to be comprehensively evaluated based on the local earthquake catalog (M 1.0+, depth > 35 km), combined with active fault structures and the background of historical seismic activities.
The prediction of the M 7.0 intra-crustal strong earthquake in Aksu, Xinjiang on January 23, 2024, relied on finding the Aksu area through the distribution of sub-crustal earthquakes in the high-quality local M 1.0+ earthquake catalog of Xinjiang [8]. At that time, it was actually possible to determine the location of the future strong earthquake, but it was the first time the author had experienced such a prediction and did not dare to precisely specify the exact location.
3.5. Summary
3.5.1. Detailed Explanation of Typical Prediction Cases
Prediction of the M 7.0 earthquake in Aksu, Xinjiang: For the M 7 intra-crustal strong earthquake in Aksu, Xinjiang on January 23, 2024, the author once obtained 19,844 M 4.0+ earthquakes (with a maximum focal depth of 400 km) in the Hindu Kush SCT (60°~111° E, 15°~56° N) from 1963 to July 10, 2023 based on the ANSS earthquake catalog of the United States Geological Survey, California Earthquake Center, to study the temporal sequence of sub-crustal earthquakes in the Hindu Kush SCT. Based on the China Earthquake Catalog (CENC), 235,934 earthquakes with a magnitude of 1.0 or higher (with the maximum focal depth of 411 km) were obtained in the Xinjiang region from 1970 to June 29, 2023. Sub-crustal earthquakes account for 4.6% (overall low; the resolution of sub-crustal earthquakes in the regions north and south of the Tianshan Mountains is relatively high, while the resolution of sub-crustal earthquakes in the peripheral regions is relatively low). The author studied the spatio-temporal characteristics of sub-crustal earthquake distribution in the Xinjiang region, the distribution differences between the north and south of the Tianshan Mountains (the density of sub-crustal earthquakes on the southern side of the Tianshan Mountains is significantly higher than that on the northern side), and the tectonic background of historical seismic activities. On July 30, 2023, half a year in advance, a written prediction was submitted to the relevant departments: there might be M 6.5-7 intra-crustal strong earthquake activities in the Aksu region of Xinjiang within the next 1-2 years. On September 30, the analysis basis was published on the public network (Seisman.360doc.com) while excluding the prediction opinions, and the prediction opinions were reported verbally again on October 20. On January 23, 2024, an M 7 earthquake occurred in the Aksu region of Xinjiang (classified as M 7.1 by CENC) with a focal depth of 13/22 km, which can be regarded as a perfect test [8]. As can be seen from Figure 8, the ε02 value of #18 Hindu Kush SCT reached 3.26 times in 2015 which is the historical peak value of #18 SCT, showing a significant anomaly. In 2024, the value of ε00 is 0.76 and the value of ε01 is 0.64. They start simultaneously, and the expected earthquake duration is 9 years, which conforms to the theoretical logic of “abnormality under the crust → strong earthquake within the crust”. However, at that time, the predictive index for the value of ε0 had not yet been established.
Prediction of the M6.9 earthquake in Taitung: In 2020, the author, in the article “Seismic Activity Environment in Guangdong, Guangxi and Hainan Regions and the Beiliu 5.2-magnitude Earthquake - An Explanation from the Seismic Geothermal Theory”, based on the relationship between earthquakes in Guangxi and intra-crustal strong earthquakes in Taiwan, demonstrated that the Beiliu M 5.2 earthquake might be a far-field precursory earthquake of intra-crustal strong earthquakes in Taiwan, and made a theoretical explanation on the concept and possibility of far-field precursory earthquakes [10]. This was verified by the M 6.9 earthquake in Taitung on February 19, 2022, one year later.
3.5.2. Section Title
Based on the discussions in this section, a preliminary speculation and assessment can be made about the trend of strong earthquake activities in China within the next year, which is omitted in this article.
4. Discussion on the T-Type Tectonic Zone in the Upper Mantle of the Study Area
4.1. The Establishment of the T-Type Tectonic Zone in the Upper Mantle
In the catalog of M 4.0+ earthquakes in the study area, a strange phenomenon was discovered: M7.0+ deep-focus strong earthquakes below a depth of 500 km are distributed in a peculiar pattern, as detailed in Table 4 and Figure 11. As can be seen from the table and Figure 11, some of these deep-focus strong earthquakes are concentrated in the Mindanao region of the Philippines, while others are distributed in the Mariana Trench and northeastern China, forming a T-shaped structure.
There is a famous “Hu Huanyong Line” in Chinese geography, also known as the “Aihui-Tengchong Line”. It was first proposed by Chinese geographer Hu Huanyong in his 1935 article “The Distribution of China’s Population”. With a total length of approximately 4,000 kilometers, it is an important population density boundary in China, dividing Chinese geography into two major natural regions: east and west, and has significance in population geography, natural ecology, economic development, and historical and cultural studies.
In this article, the Hu Huanyong Line has evolved into a larger-scale T-shaped tectonic zone. One branch starts from the Sea of Okhotsk, extends southwestward through Hunchun, Jilin Province to western Myanmar, and the other branch extends southeastward from Hunchun along the Mariana Trench. The two form a T-shaped structure with an intersection angle of approximately 90 degrees. The T-shaped tectonic zone is the “main channel” for the migration of upper mantle thermal materials and thermal energy disturbances: the northeast branch (Sea of Okhotsk - Hunchun - western Myanmar) traverses the eastern and western parts of China, and the northwestern branch (Hunchun - Mariana Trench) extends along the Mariana Trench. The two channels converge in Hunchun to form a “T-shape”, and their thermal material activities directly control the energy supply for the surrounding SCT activities.
This T-shaped structure spans the junction of the Pacific Ocean and the Eurasian Continent, connecting 7 SCTs including #06 Okhotsk, #07 Japan, #08 Hunchun, 09 Northern Mariana, #10 Mariana, #11 Taiwan and Ryukyu, and #17 Myanmar. It exerts a strong control over intra-crustal strong earthquakes and volcanic activities in the northwestern Pacific Ocean and within China’s territory. Obviously, China’s modern strong earthquakes such as the 1920 Ningxia Haiyuan earthquake, the 1976 Tangshan earthquake, the 2008 Wenchuan earthquake, as well as the Changbai Mountain Tianchi Volcano, Wudalianchi Volcano in Northeast China, and the Tengchong Volcano in Yunnan are all under its control. Studies by Lü Zheng et al. (2003) have shown that the volcanic seismic activities recorded by the Changbai Mountain Volcano Observatory are related to the M5.0+ intermediate and deep-focus seismic activities in the northwestern Pacific Ocean [27].
It can be seen from Table 4 that the activity of the T-shaped tectonic belt has accelerated significantly since 1995, which will inevitably cause abnormalities within the controlled range of the T-shaped tectonic belt. Therefore, research on it is obviously crucial for geoscientific research in China and its surrounding areas. The following will combine typical strong earthquake cases (the 2008 Wenchuan M8.0 earthquake and the 2011 Japan M9.1 earthquake) to verify the control mechanism of the T-shaped tectonic belt on the energy supply of the earthquake column and the triggering of strong earthquakes (see Section 4.2).
The study of deep-source strong earthquake activities in Mindanao should be attributed to the Philippines. Due to incomplete data collection in this paper, it will be omitted.
4.2. Case of the T-Type Tectonic Zone in the Upper Mantle
Case 1: 2008 Wenchuan M8.0 Earthquake (#17 Myanmar SCT). The Wenchuan Earthquake is located in the eastern part of the Qinghai-Tibet Plateau covered by #17 Myanmar SCT and is energized by the northeast branch of the T-shaped tectonic belt. In the #17 subgraph of the time series diagram (Figure 7), the depth of M 6.0+ subcrustal earthquakes showed a trending increase from the late 1980s to the early 1990s, pointing directly to the time of the Wenchuan Earthquake; in the #17 subgraph of the seismic activity diagram (Figure 8), the ε₀2 value of the driving layer (active layer) in 1995 exceeded the historical average by 1.79 times. In 2008, after 14 years, the anomalies of the energy storage layer (ε₀1 value 4.92) and the dissipation layer (ε₀0 value 5.69) started simultaneously, eventually triggering the rupture of the escape layer (0-35 km) and causing an M 8.0 intra-crustal strong earthquake, which is consistent with the theoretical mechanism of “energy supply from the driving layer within SCT → accumulation in the energy storage layer → crustal rupture”. As for the triggering mechanism of the rupture, more detailed research is still needed.
Case 2: 2011 Japan M 9.1 Earthquake (#07 Japan SCT). Based on the parameters in Table 3, a supplementary study was conducted on the time series process, layered seismic activity of the earthquake column, and its correlation with M 6.5+ intra-crustal strong earthquakes, as shown in Figure 12. The statistical table of ε₀ values for layered seismic activity of sub-crustal earthquakes in the #07 Japan SCT (1990-2015) is shown in Table 5.
It can be seen from Figure 12 and Table 5 that the thickness of the driving layer reaches 350-632 km (Table 2). From 1990 to 2010, deep-focus earthquakes showed “intensive clustering”. In Table 5, the activity ε₀3 values showed two driving layer exceptions in 1994 (5.60) and 2003 (2.89). The 2003 Hokkaido M 8.3 earthquake failed to change the “clustering” trend of the driving layer. Coupled with the acceleration of the active layer in 2008 (ε₀2 value 1.22), the anomalies in the energy storage layer and the dissipation layer started simultaneously in 2011, with the ε₀0 value being 21.02 times and the ε₀1 value being 18.21 times, resulting in the huge disaster of the M 9.1 earthquake. This confirms the conduction relationship of “driving layer → active layer → energy storage layer → dissipation layer (surface strong earthquake) within the SCT”.
In Table 5, the ε03 value in 2012 was 11.48 times. Based on the energy accumulation cycle (17 years, consistent with the Earth’s nutation cycle) of the #07 Japan SCT from 1994 to 2011, it is a speculate that 2012-2030 will be the next energy accumulation stage, and special attention should be paid to the abnormal rise of the ε01 value in the energy storage layer.
Summary:
The occurrence of both cases is due to the simultaneous start of anomalies in the energy storage layer and the dissipation layer, indicating the suddenness and severity of intra-crustal strong earthquakes, which are difficult to prevent. Therefore, the research on the prediction of strong earthquakes is very difficult but necessary.
In addition to the prediction factors involved in this paper, ground light, ground sound, groundwater anomalies, animal anomalies, plant anomalies, celestial anomalies, the clustering locations of sub-crustal micro-earthquakes within 5 years before the earthquake [8], the pre-earthquake stress field fluctuations in the energy storage layer [26], etc., are all urgent characteristic precursors before an earthquake. However, it is necessary to carefully exclude false appearances and make a comprehensive evaluation.
5. Discussion and Conclusions
5.1. On the Relationship between the SGT and Other Geoscience Theories
Some people have proposed the integration of SGT with the theory of plate tectonics, but the author disagrees. On the global distribution map of seismic activities, it is natural for people to hypothesize plate tectonics. However, when earthquakes with a depth of less than 35 km are excluded, no trace of plates can be found (Figure 13) [7]. That is to say, the thickness of the plates is only 35 km. Moreover, no source of power for the plates has been found to this day. Figure 2 (three-dimensional distribution of seismic cones) shows that SCT has a depth of 35-700 km, and its activities do not depend on plate subduction; Figure 11 (T-type tectonic belt) further indicates that the thermal materials in the upper mantle directly supply energy to SCT through T-type channels, which contradicts the “collision and subduction-driven” logic of plate tectonics.
Just imagine, how can a hypothesis without an entity or a source of power explain the 24 independent SCTs worldwide that are hundreds of kilometers deep, stand upright like a forest, and operate independently? How can it explain the role and influence of the upper mantle T-type tectonic belt hundreds of kilometers deep in controlling multiple SCTs as shown in Figure 11? How can it explain the autonomous dissipation energy of deep strong earthquakes of magnitude 7.0+ that occur hundreds of kilometers deep?
The only way for the energy dissipation of deep strong earthquakes is to follow the theoretical mechanism of “energy supply from the driving layer within SCT → accumulation in the energy storage layer → crustal rupture”, with the energy surging upward and escaping to the surface. This process takes several years or even more than ten years.
However, Seismo-Geothermics was developed on the basis of a profound understanding of Geomechanics. When Mr. Li Siguang was alive, there was not such abundant data on medium and deep-focus seismic activities as there is today, so his research was limited to surface structures [14]. In 1999, at the Xiangshan Conference of the China Earthquake Administration in Beijing, the author first proposed the hypothesis of the “ Seismo-Ggeothermal theory” [1]. Academician Ding Guoyu, an authoritative expert in the field of earthquake geology in China, presided over the conference. When summarizing the conference, heacutely mentioned the concept of “the geothermal theory of earthquakes” three times, and after the conference, he kindly pointed out to the author that attention must be paid to “the study of mantle plumes (plume)”.. Academician Ding Guoyu, an authoritative expert in China’s seismic geology field, presided over the conference. During the concluding remarks, he acutely mentioned the concept of the “seismic geothermal theory” three times, and after the conference, he kindly pointed out to the author that attention must be paid to the “study of mantle plumes”. This guidance provided a direction for the subsequent discovery and establishment of SCT as well as research on its association with deep-seated thermal dynamics. The author’s “Simplified Map of Major Tectonic Zones Exposed on the Surface of the Northern Hemisphere and Seismic Cone Tectonics in the Upper Mantle — Explanatory Notes on Mapping for the Seismic Geothermal Theory” is an attempt to integrate with Geomechanics and mantle plumes [6], which may perhaps extend Chinese geology to the deep part of the upper mantle, with a view to carrying it forward.
If sub-crustal earthquakes can be explained by cavitation dynamics [15], they will shine even more brilliantly. The well-known “boiling water experiment” is a case in point. The temporal progression of sub-crustal earthquakes is completely analogous to the example of the boiling water experiment.
Sub-crustal earthquakes are often regarded by people as speculations or hypotheses, and are even ridiculed in the rejection letters sent to me. This is the mindset of the 1970s. SGT deeply believes that subshell earthquakes are an important geophysical parameter of the upper mantle that can currently be detected by humans using seismic instruments. A large number of the author’s tracking studies on global earthquake cases mostly point to changes in the state of subshell seismic activity [16,17,18,19,20,21,22,23,24,25,26]. Tracking the state parameters of subshell seismic activity may find a breakthrough for the prediction of strong sub-crustal earthquakes and volcanic eruptions. Therefore, SGT firmly believes that, at least within the thermal engine zone, strong sub-crustal earthquakes can be predicted, and volcanic eruptions can also be predicted. This can alleviate 90% of human earthquake and volcanic disasters.
According to the relevant statistics on M 7.0+ intra-crustal strong earthquakes and the layered activity ε₀ values of sub-crustal earthquakes disclosed in this article (Table 6), it can be seen that the magnitude of intra-crustal strong earthquakes is roughly proportional to the layered activity ε₀0, ε₀1, and ε₀3 (ε₀2), and also roughly proportional to the interval between the starting year and the earthquake occurrence year. Therefore, the preliminary results indicate that the layered activity ε₀ value of sub-crustal earthquakes may become a precursor index for intra-crustal strong earthquakes, but the mechanism before the impending earthquake remains to be further studied.
Strong intra-crustal earthquakes are constrained by the weak parts of active faults and may be far from the outcrop point of the SCT, even reaching the edge of the SCT impact area, while volcanic eruptions are mostly located near the SCT outcrop point. Both are caused by thermal disturbances in the upper mantle, where thermal energy is driven and accumulated layer by layer from bottom to top. Surface faults are only performers that release the thermal energy of the seismic cone, not the power source of intra-crustal strong earthquakes and volcanic eruptions.
5.2. Conclusions
Based on the author’s self-developed Seismo-Geothermal Theory system, this paper uses the M 4.0+ earthquake catalog of China and surrounding areas from the California Earthquake Center, USA, to determine the geographical distribution and three-dimensional spatial distribution characteristics of earthquakes in the study area, the temporal progression of sub-crustal earthquakes, and the relationship between SCT layered activity and strong intra-crustal earthquakes. It conducts detailed yet concise studies on 6 SCTs closely related to the study area, preliminarily depicting the surrounding macro-environment of China’s seismic activity, and introduces the concept of the upper mantle T-type tectonic belt, which spans the junction of the Pacific Ocean and the Eurasian Continent. Operating in the mode of “T-type tectonic belt providing energy for the SCT driving layer → active layer transformation → energy storage layer accumulation → dissipation layer rupture leading to intra-crustal strong earthquakes and/or volcanic eruptions”, it may become a powerful driver and root source of seismic activity in China and surrounding areas. Sub-crustal earthquakes are an important geophysical parameter of the upper mantle that can currently be detected by human seismic instruments, and the stratified activity ε₀ values of sub-crustal earthquakes may also become a predictive indicator for strong intra-crustal earthquakes. On this basis, it may be possible to use multiple precursor indicators to explore the possibility of future moderate to strong seismic activity in the study area, contributing to mitigating disasters caused by intra-crustal strong earthquakes and volcanic eruptions.
This study only uses M 4.0+ earthquake data. It is relatively difficult to obtain high-precision catalogs of small earthquakes (M 1.0-M 3.9) in surrounding areas, and precursor information from other disciplines has not been fully explored. Dynamic simulations of the T-type tectonic belt have not yet been carried out, and its controlling mechanism on strong earthquakes still needs numerical verification. In the future, we can combine GPS terrain deformation data, underground fluid data, and geomagnetic and electromagnetic data to construct a multi-precursor prediction model of “sub-crustal earthquake ε0 value + terrain deformation rate + fluid anomalies + geomagnetic and electromagnetic data + macro anomalies”; through numerical simulations (such as the finite element method), verify the thermal material migration process of the upper mantle T-type tectonic belt and the energy accumulation model within the SCT.
Acknowledgments
This article acknowledges the Ministry of Natural Resources of China for providing the map usage rights under GS (2016) No. 1760 (data link: http://bzdt.ch.mnr.gov.cn/); acknowledges the United States Geological Survey (USGS) for providing ANSS earthquake data (data access link: https://earthquake.usgs.gov/earthquakes/search); acknowledges Researcher Tsering Zhima from the China Institute of Disaster Prevention for her understanding, support, and assistance regarding the academic ideas in this article, and also acknowledges Senior Engineer Li Pinzhong for programming technical support and Master Tian Youping for their attention from the Hunan Earthquake Agency.
Conflicts of Interest
The author declares that there are no conflicts of interest in this article.
References
- Chen Lijun. Study on Earthquake Focus Depth and Strong Earthquake Activity Status in China [J]. Seismology and Geology, 2000, 22, 360–370. [CrossRef]
- Chen Lijun, Chen Xiaofeng, Li Pinzhong. Study on Spatiotemporal Characteristics of Strong Earthquakes in China [J]. South China Journal of Seismology, 2007, 27, 40–48. [CrossRef]
- Chen Lijun. Principles and Applications of the Seismo-Geothermal Theory [J]. Inland Earthquake, 2012, 26, 108–122. [CrossRef]
- Chen Lijun. The Concept of Earthquake Cone and Its Basic Characteristics [J]. South China Journal of Seismology, 2013, 33, 1–14. [CrossRef]
- Chen Lijun, Hu Fengxiang, Chen Xiaofeng. Seismic Tomography Evidence of Global Earthquake Cones [J]. South China Journal of Seismology, 2013, 33, 1–10. [CrossRef]
- Chen Lijun. Simplified Map of Major Tectonic Zones Exposed on the Surface of the Northern Hemisphere and Upper Mantle Earthquake Cone Structures: Explanation of Mapping Based on the Seismo-Geothermal Theory [J]. Natural Science, 2020, 8, 142–157. [CrossRef]
- Seisman. A Review of Research on Seismo-Geothermics [EB/OL]. 2025-7-7. http://www.360doc.com/content/25/0707/13/3572959_1156933208.shtml.
- Chen Lijun. The Dawn of Earthquake Prediction Research in China - A Case Study of Seismic Activity in the Tianshan Region [J]. Chinese Earth Science Review, 2024, 3, 52–66. [CrossRef]
- Chen Lijun. A Summary of the “3.28” M7.9 Earthquake in Mandalay, Myanmar [J]. Chinese Earth Science Review, 2025, 4, 28–36. [CrossRef]
- Chen Lijun. Seismic Activity Environment in the Guangdong-Guangxi-Hainan Region and the Beiliu M5.2 Earthquake - An Explanation from the Seismic Geothermal Theory [J]. Natural Science, 2020, 8, 112–135. [CrossRef]
- Chen Lijun. Research on the Earthquake and Volcanic Disaster Chain System in Indonesia [J]. Preprints.org, 2025.9.5. [CrossRef]
- Chen Lijun. A Brief Study on the M 8.7 Earthquake in Kamchatka Peninsula on July 29, 2025 [J]. 2025.9.17. [CrossRef]
- Chen Lijun. Analysis of the Seismic Geothermal Theory on Global Warming [J]. Chinese Earth Science Review, 2024, 3, 99–112. [CrossRef]
- Li Siguang. An Introduction to Geomechanics (2nd Edition) [M]. Beijing: Geological Publishing House, 1999.
- Brennen, C.E. (1995) Cavitation and Bubble Dynamics. Oxford University Press Inc., New York.
- Chen Lijun. Seismic Activity in Songyuan, Jilin and Hunchun Seismic Cone Tectonic [J]. Natural Science, 2019, 7, 429–438. [CrossRef]
- Chen Lijun. The 2013 Pakistan M 7.7 Earthquake and the Seismic cone of the Hindu Kush [J]. Inland Earthquake, 2015, 29, 15–27. [CrossRef]
- Chen Lijun (2015) A Comparative Study on Volcanic Activities in Global Heat Engine Zones and Cold Engine Zones—Also on the Improvement of Research Ideas for Volcano Prediction in Heat Engine Zones [J]. Frontiers of Earth Science 2015, 5, 334–357. [CrossRef]
- Chen Lijun. Seismic Activity and Seismic Cone Tectonic in Coastal Areas of the Northwest Pacific [J]. Frontiers of Earth Science, 2016, 6, 214–238. [CrossRef]
- Chen Lijun. Seismic Activity and Seismic Cone Tectonic in Iran [J]. Natural Science, 2019, 7, 494–514. [CrossRef]
- Chen, L.J. Seismic Activity and Seismic Cone Tectonic on the West Coast of the United States [J]. Journal of Geoscience and Environment Protection, 2019, 7, 92–112. [Google Scholar] [CrossRef]
- Chen, L.J. Study on the Seismogenic Mechanism of the Earthquake Mw 6.9 in 2014 in the Aegean Sea Seismic Cone. International Journal of Geosciences 2016, 7, 669–684. [Google Scholar] [CrossRef]
- Chen Lijun. Experimental Summary of the 2012-04-19 Prediction Card (3-year period)—Introduction to the Method for Predicting Strong Intra-crustal Earthquakes and Volcanoes Based on the Seismic Geothermal Theory [J]. Natural Science, 2015, 3, 147–164. [CrossRef]
- Chen, L.J.; Chen, X.F.; Shao, L. Method Research of Earthquake Prediction and Volcano Prediction in Italy. International Journal of Geosciences 2015, 6, 963–971. [Google Scholar] [CrossRef]
- Chen Lijun. The Seismogenic Process of the 6.9-Magnitude Earthquake in the Aegean Sea Seismic Cone in 2014 [EB/OL]. 2016.4.13. http://www.360doc.com/content/20/0712/23/3572959_923809635.shtml.
- Chen Lijun. A Study on the Structure of Ecuadorian Seismic Cone and the Prediction of Earthquakes and Volcanoes [J]. Natural Science, 2016, 4, 292–306. [CrossRef]
- Lü Zheng, Hong Hanjing, Wei Haiquan. Study on the Mechanism of Volcanic Seismic Activity in Tianchi Volcano, Changbai Mountain[J]. Journal of Northeast Seismological Research, 2003, 23, 40–48.
Figure 1.
Stratified distribution map of seismic activity in the study area. (Data from the US ANSS Earthquake Catalogue, 1963-2025.9.30, M 4.0+, The same below) Figure 1 Description: The base map is compiled according to the map with the number GS (2016) 1760 approved by the Ministry of Natural Resources of China. Provincial boundaries and rivers are referenced to the latest version of Baidu Maps. The nine-dash line is based on the latest version of Jilin-1 satellite maps.
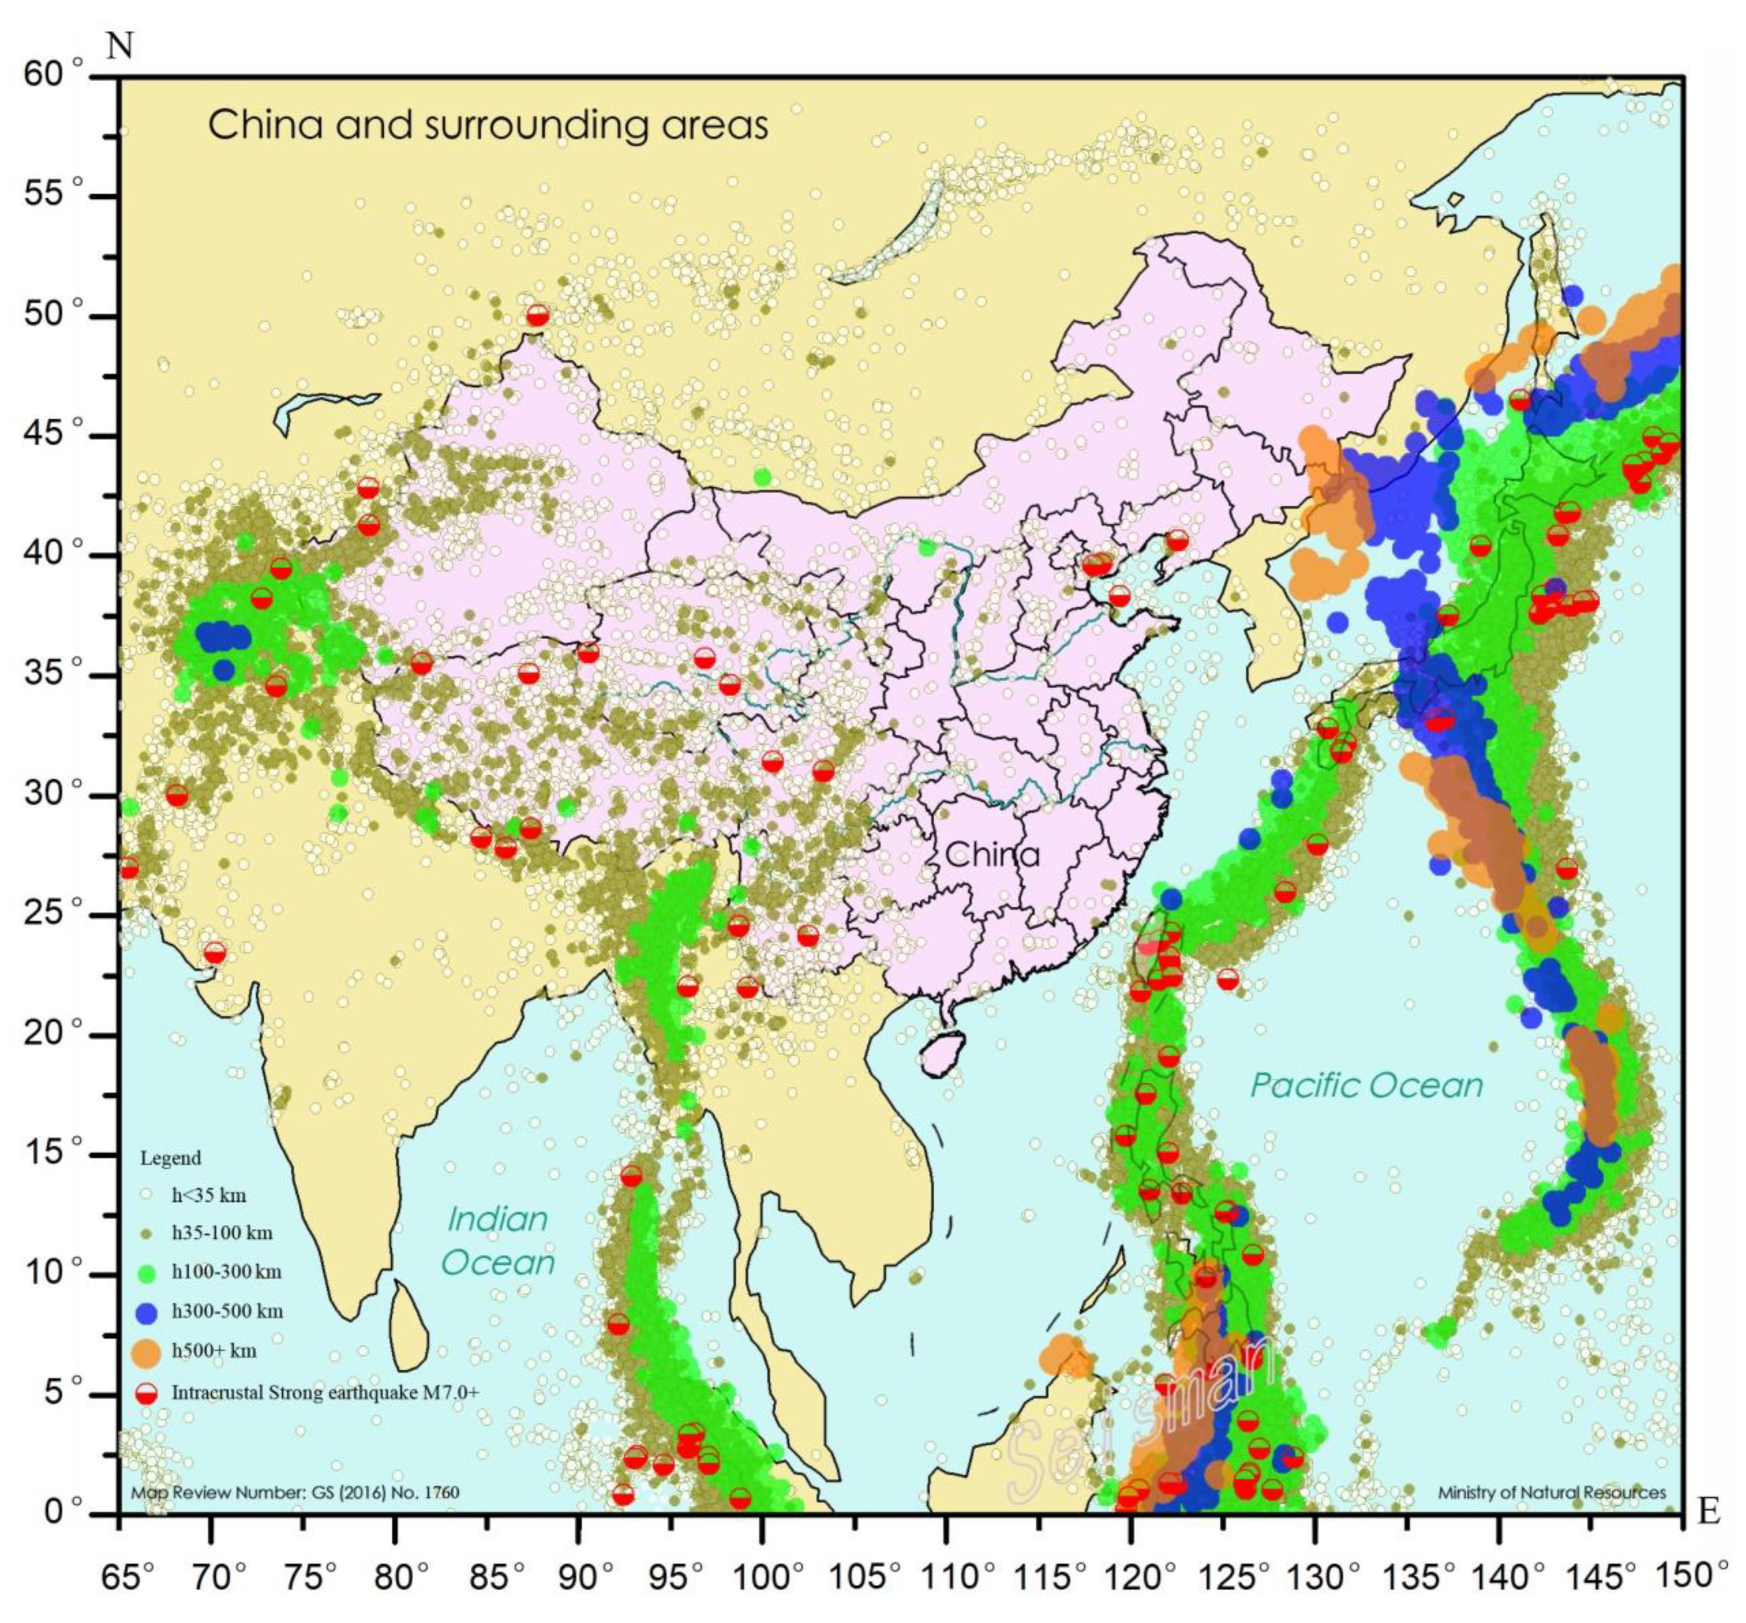
Figure 2.
Three-dimensional distribution map of seismic activity in the study area. Figure 2 Description: SCT is based on the globally unified numbering, namely #06 Okhotsk SCT (Mmax 8.3), #07 Japan SCT (Mmax 9.1), #08 Hunchun, China SCT (Mmax 7.8), #09 Northern Mariana SCT, #10 Mariana SCT, #11 Taiwan and Ryukyu SCT, #12 Philippines SCT, #16 Indonesia SCT, #17 Myanmar SCT (Mmax 8.0), #18 Hindu Kush SCT (Mmax 7.1), #22 Manila SCT (Mmax 7.9), #23 Andaman SCT.
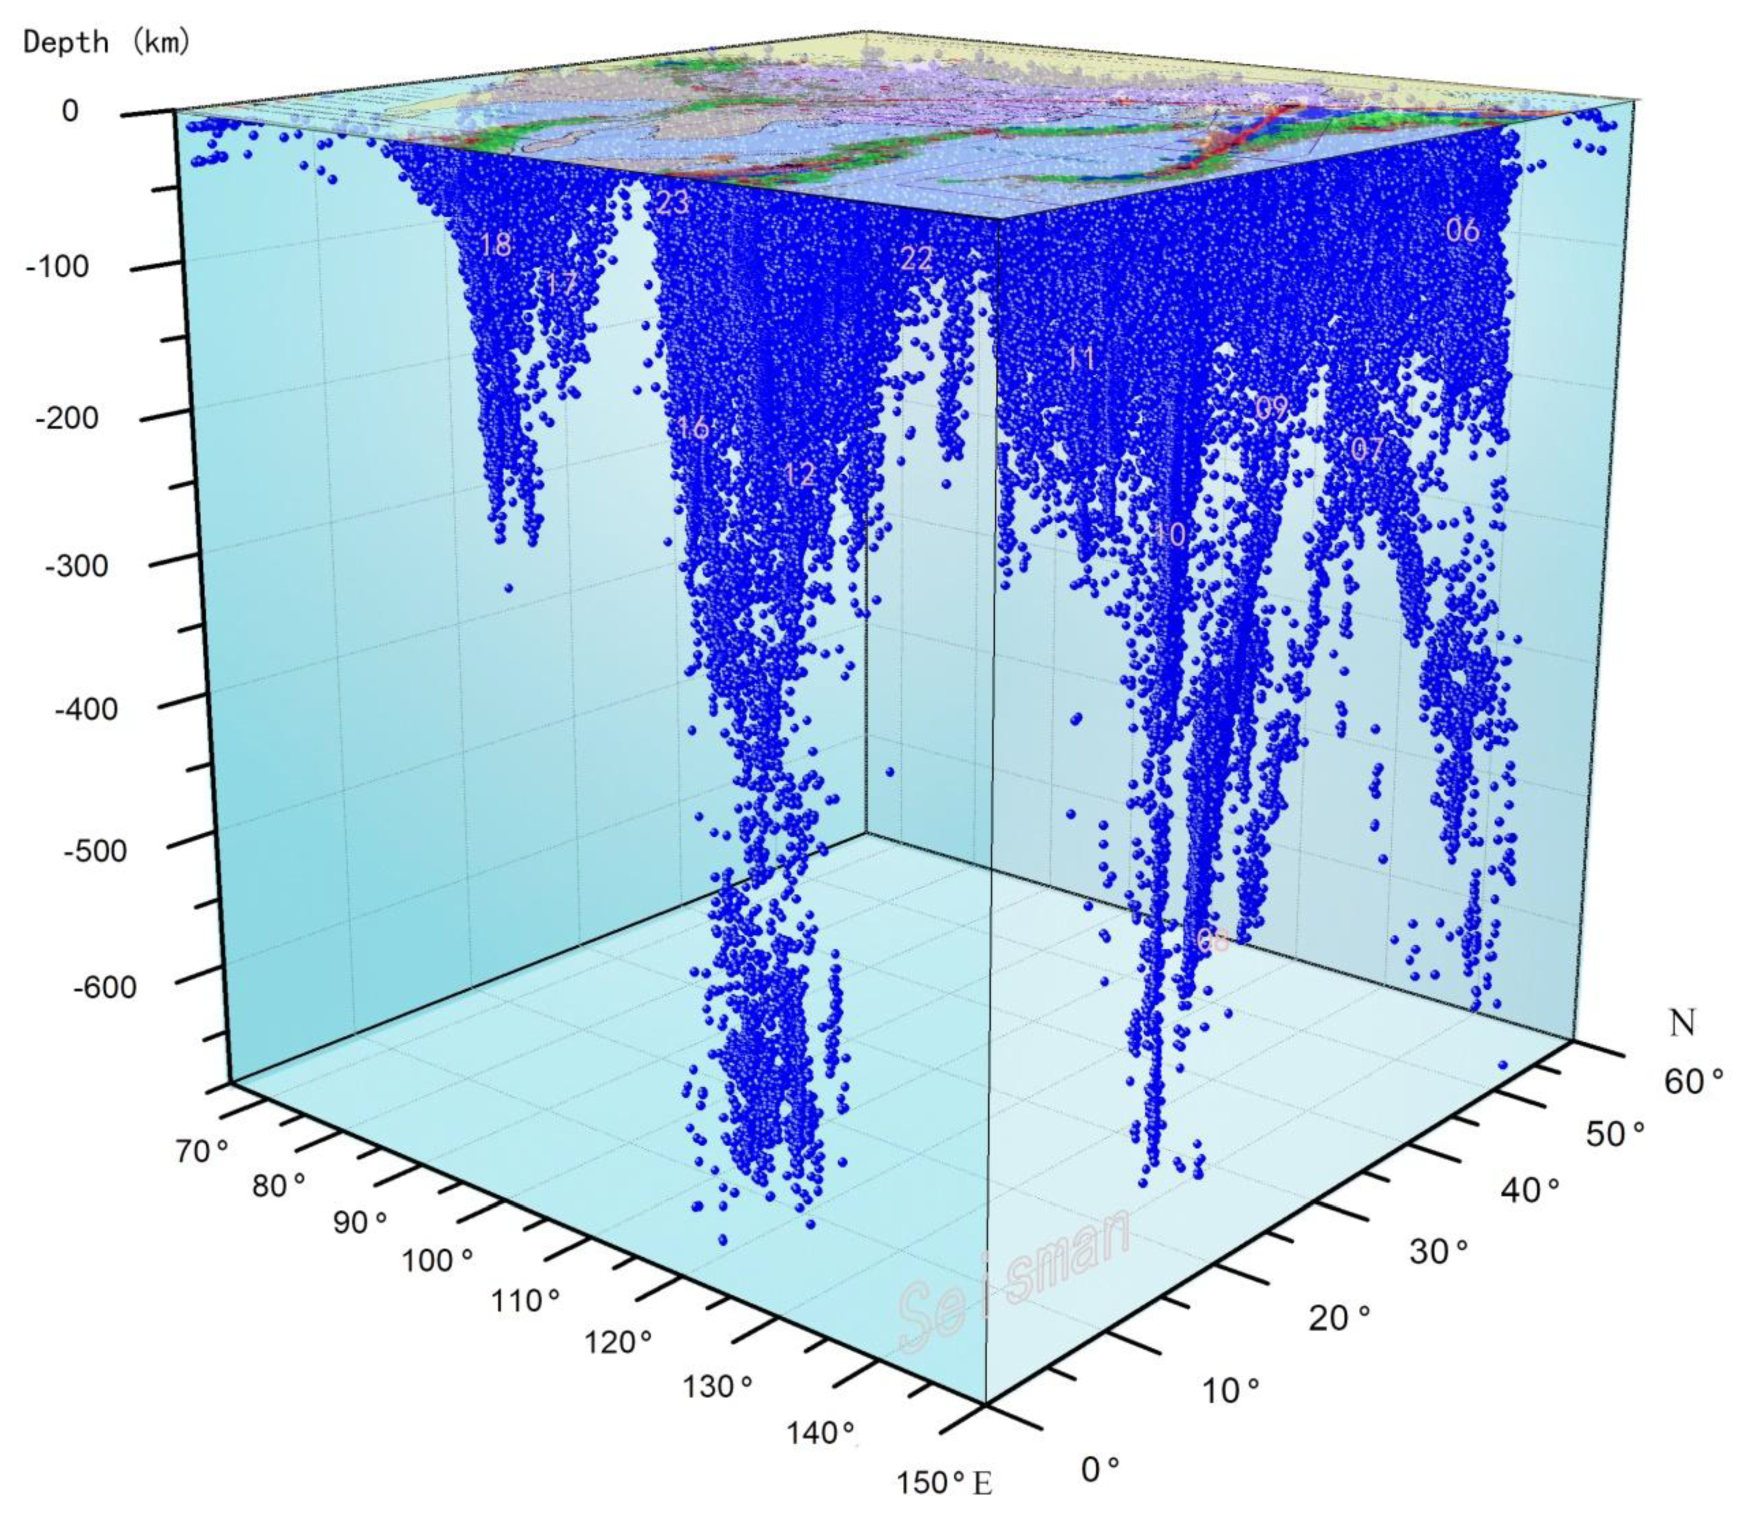
Figure 3.
Time-series distribution map of seismic activity in the study area.Figure 3 Description: Intra-crustal strong earthquake activity of M 8.0+ is particularly prominent.
Figure 3.
Time-series distribution map of seismic activity in the study area.Figure 3 Description: Intra-crustal strong earthquake activity of M 8.0+ is particularly prominent.
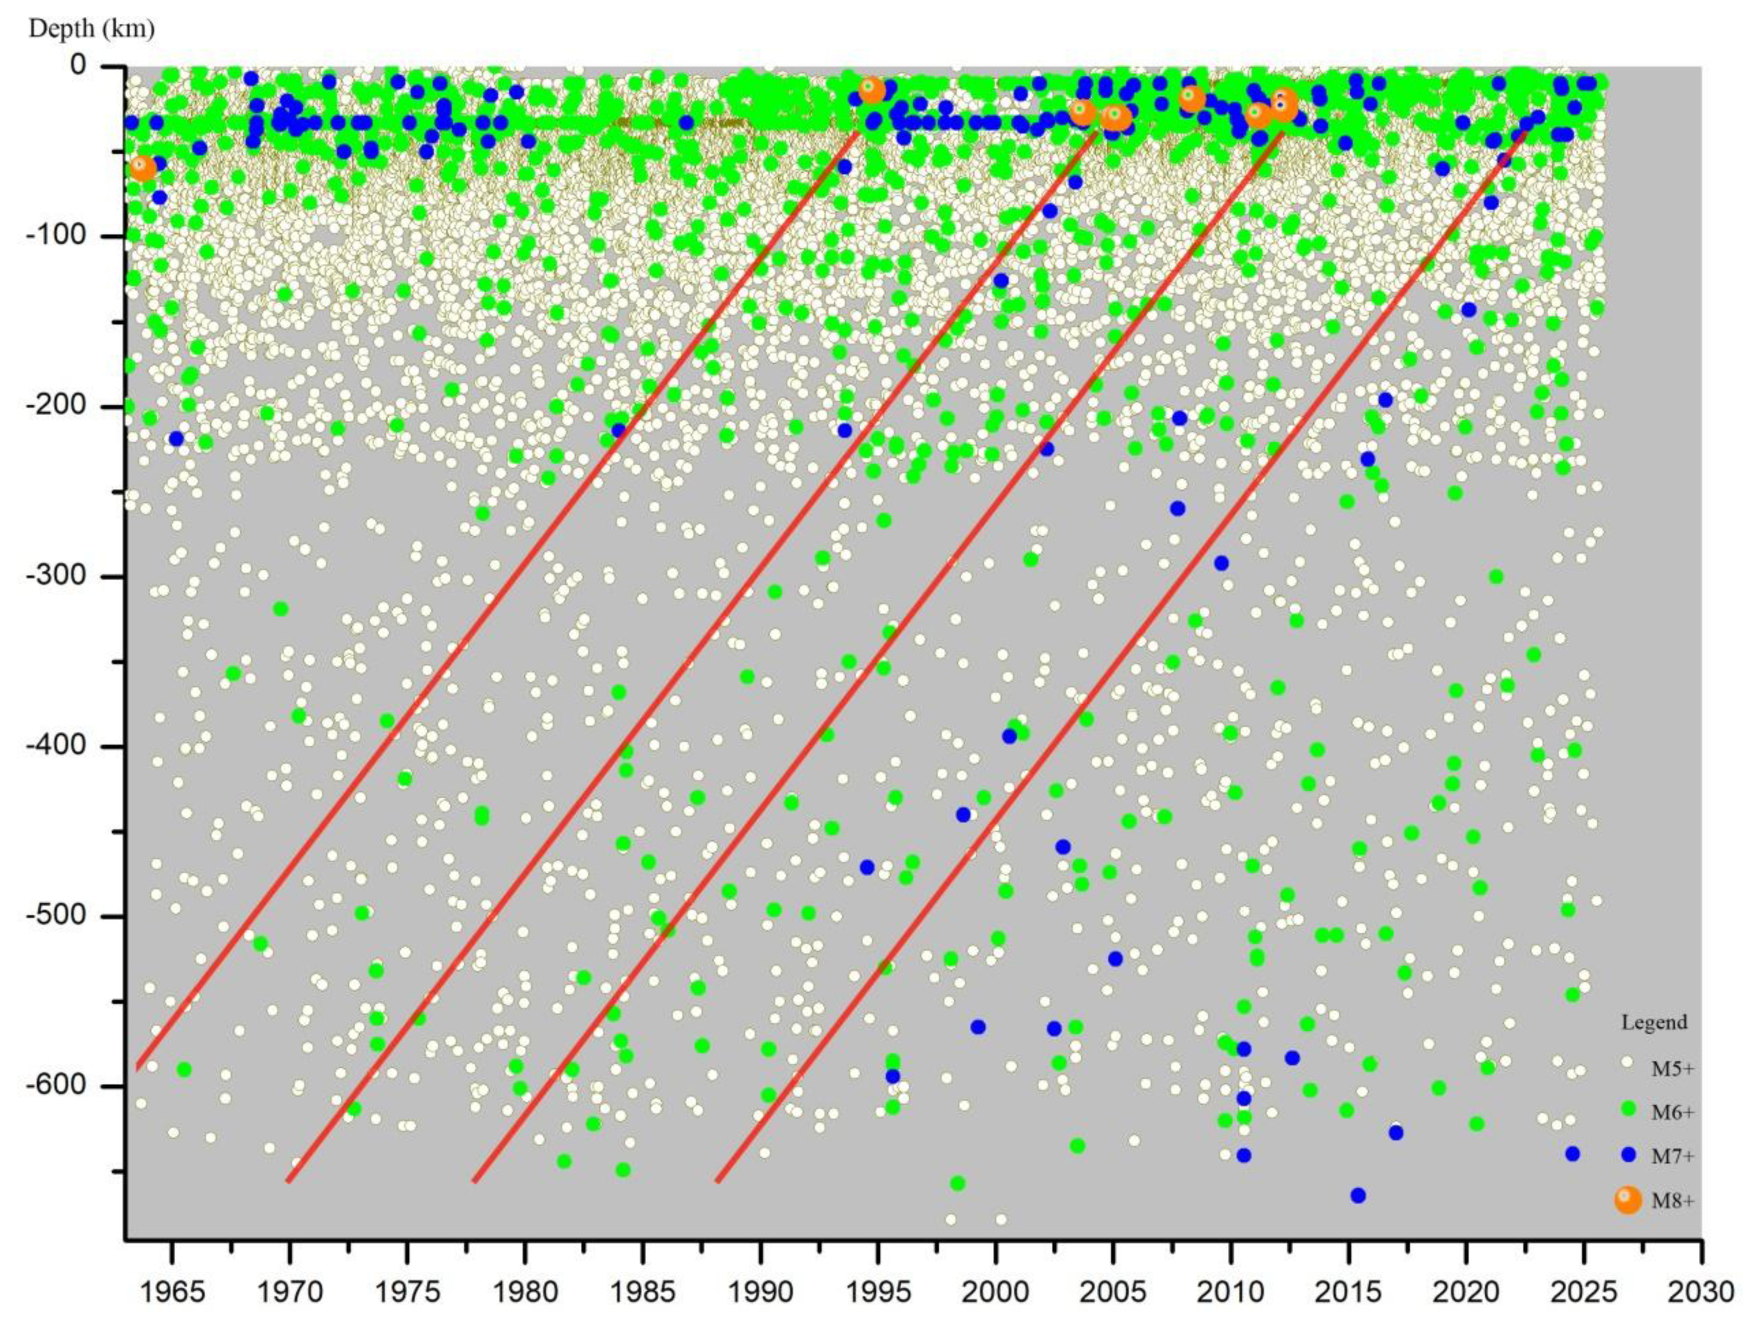
Figure 4.
Comparison Chart of Seismic Stratified Activity and M7.0+ Strong Intra-Crustal Earthquakes in the Study Area.Figure 4 Description: The continuous increase in the seismic stratification activity ε02 and/or ε03 values in the study area since the 1990s is related to the continuous and intense activity of strong intra-crustal earthquakes.
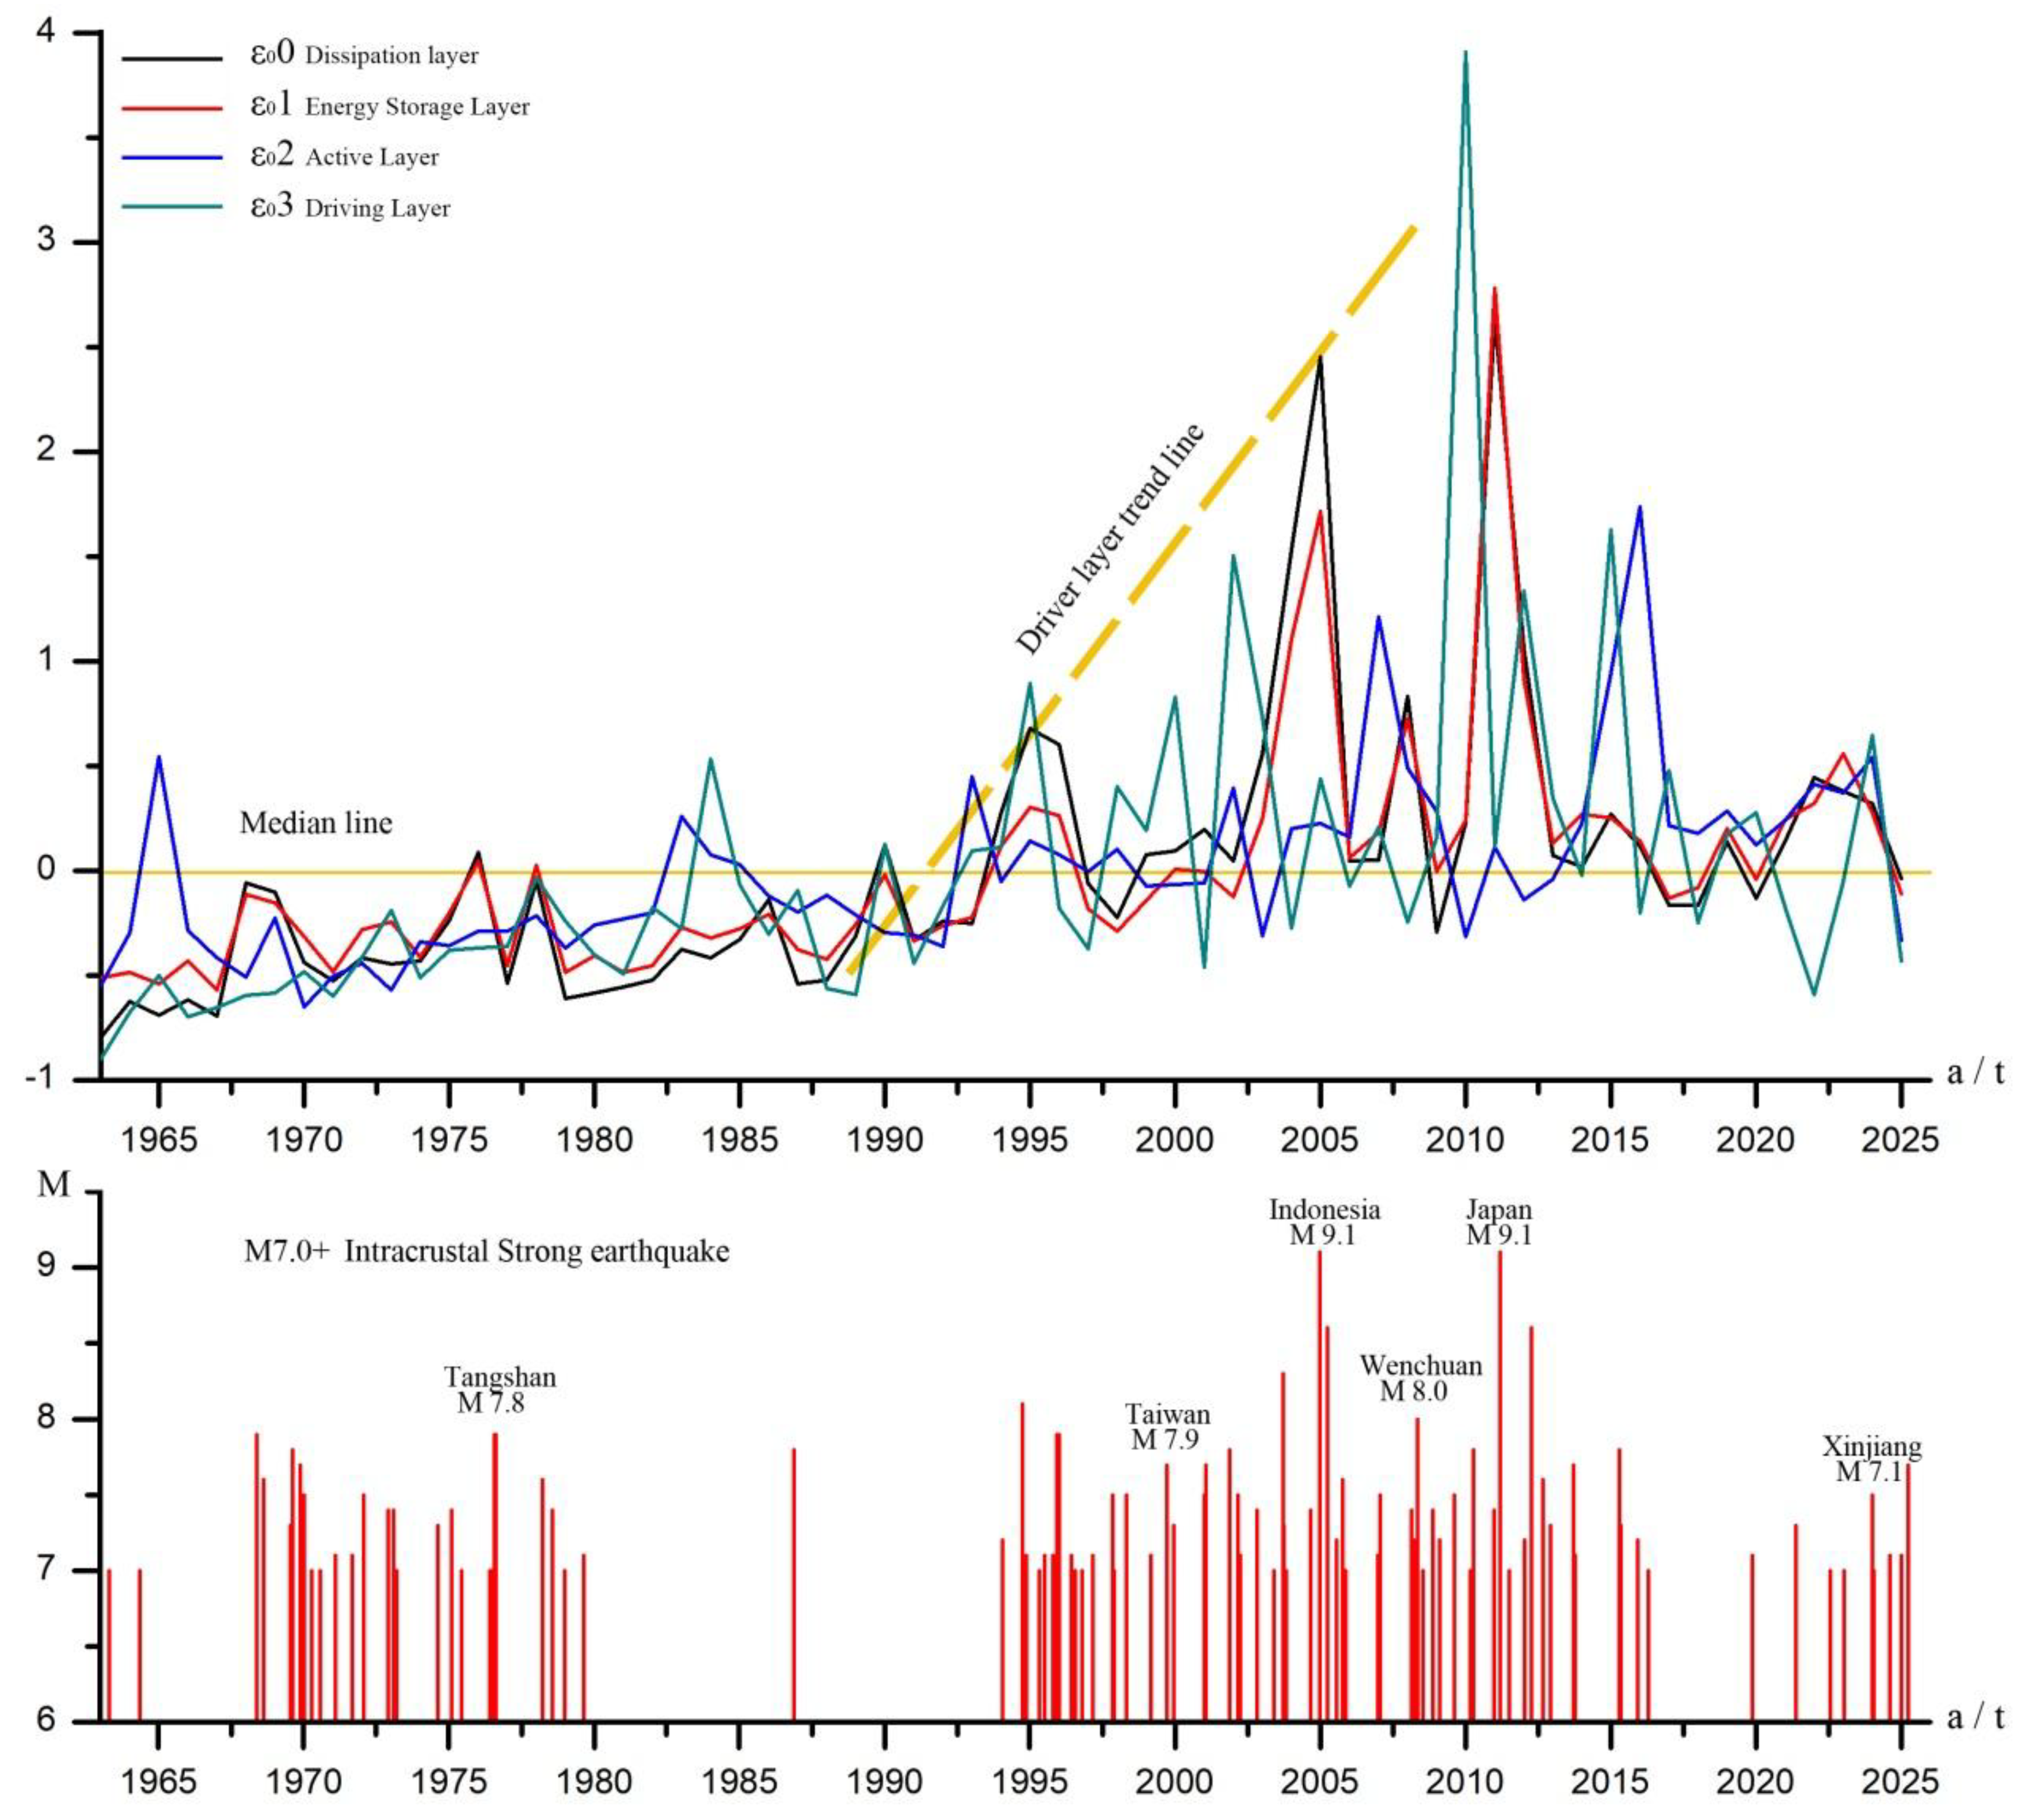
Figure 5.
Tectonic Zoning Map of Seismic Cones in the Study Area.Figure 5 Description: The affected area of SCT is not a fixed plot and can overlap, with sub-crustal seismic activity as the main indicator.
Figure 5.
Tectonic Zoning Map of Seismic Cones in the Study Area.Figure 5 Description: The affected area of SCT is not a fixed plot and can overlap, with sub-crustal seismic activity as the main indicator.
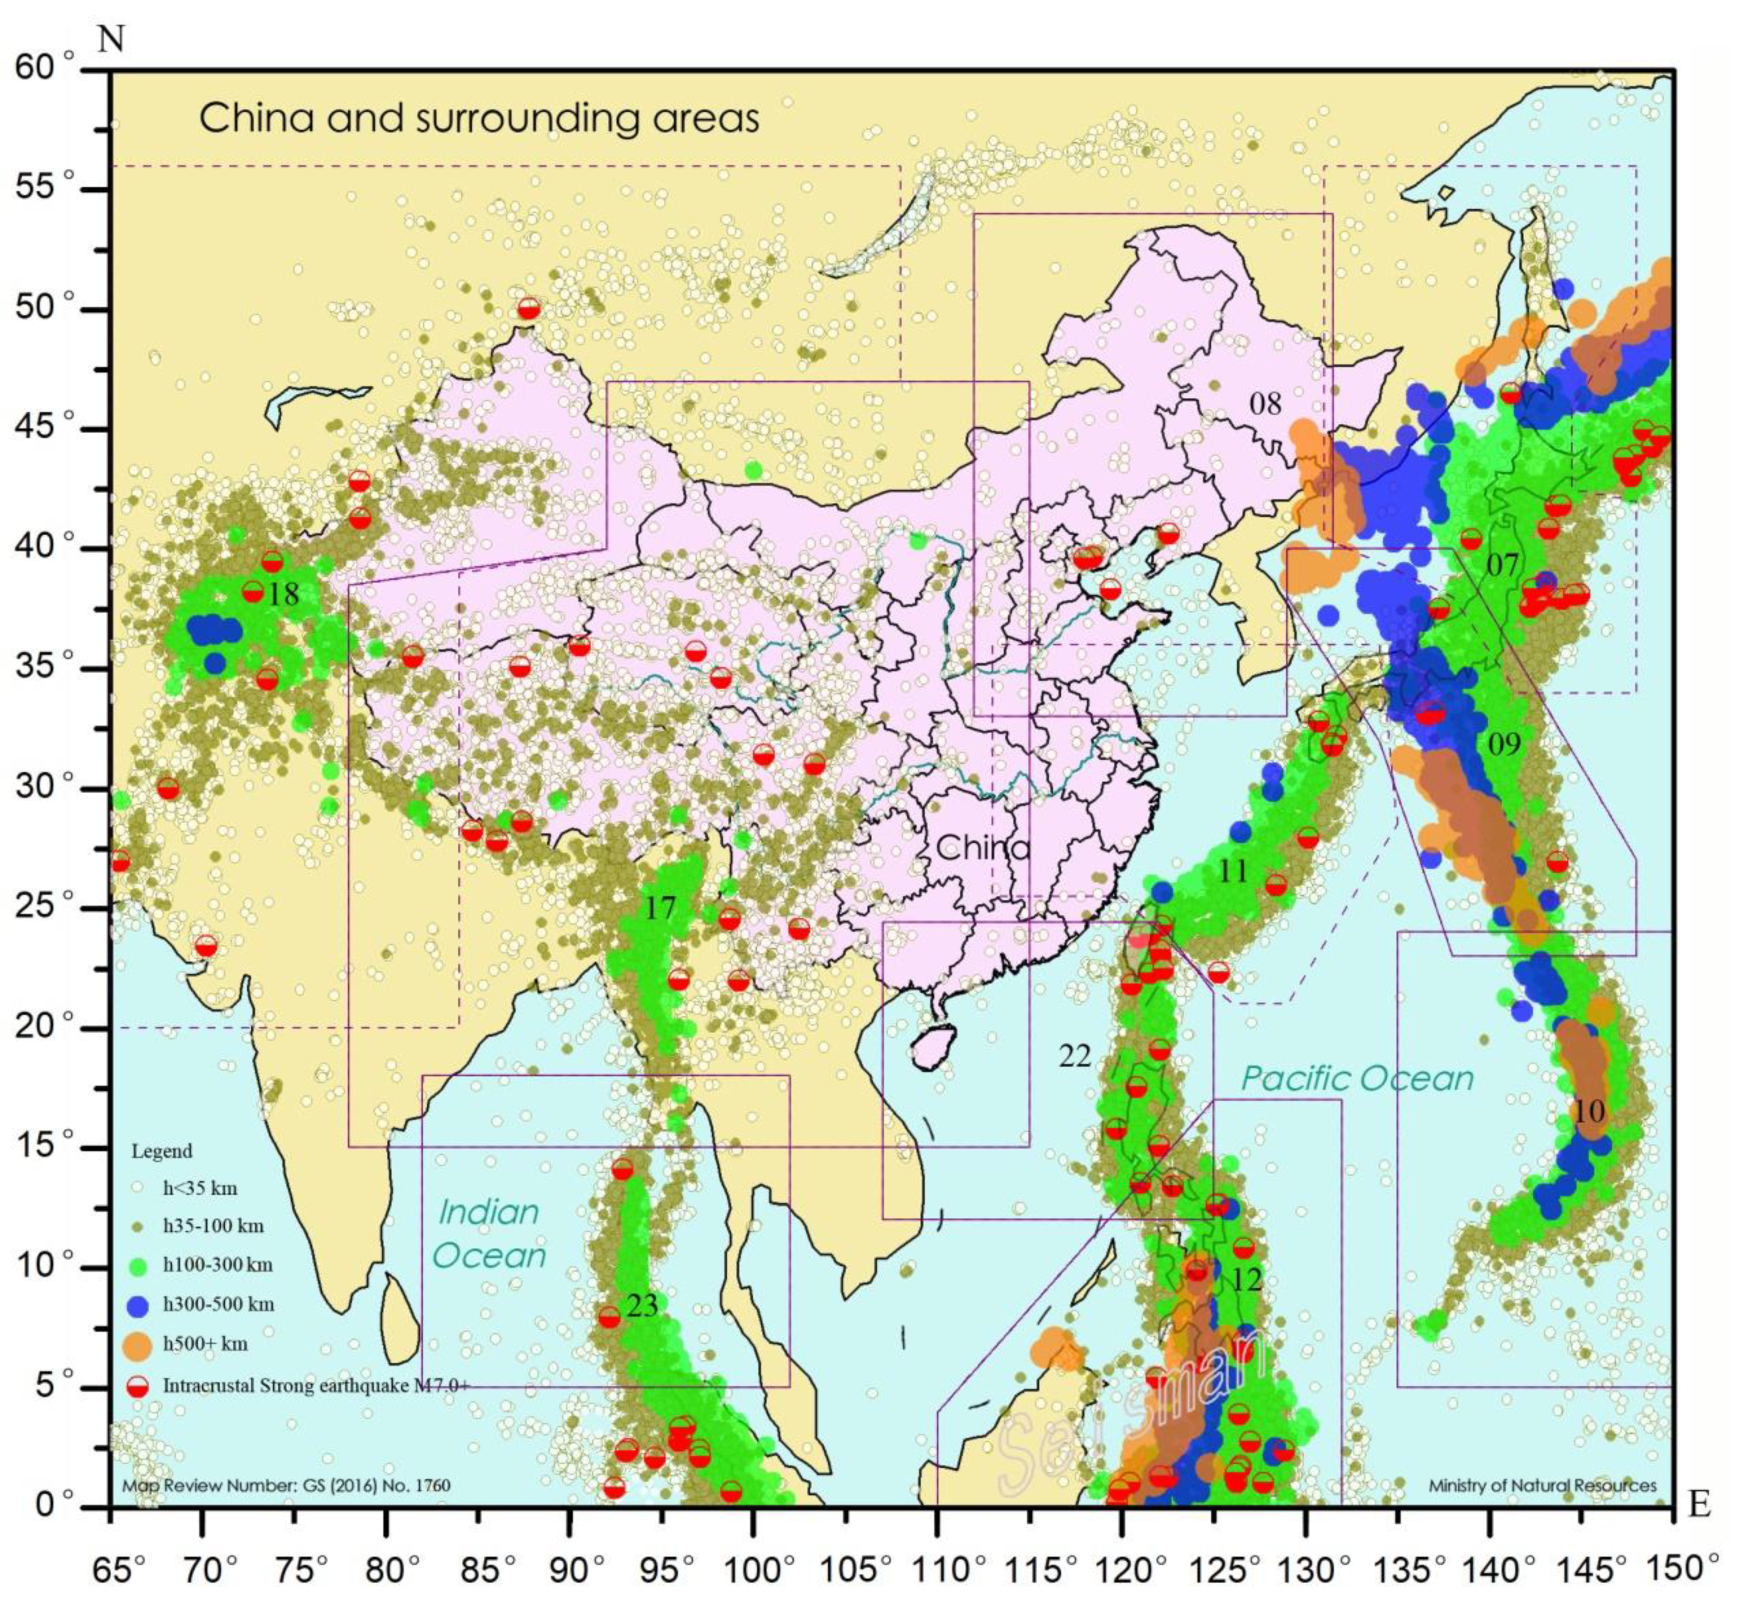
Figure 11.
Schematic Diagram of the Upper Mantle T-type Tectonic Zone in the Study Area. Explanation of Figure 11: The T-shaped structure connects seven SCTs, including #06 Okhotsk, #07 Japan, #08 Hunchun, #09 Northern Mariana, #10 Mariana, #11 Taiwan and Ryukyu, and #17 Myanmar. Obviously, China’s modern earthquakes such as the 1920 Ningxia Haiyuan M 8.5 earthquake, the 1976 Tangshan M 7.8 earthquake, the 2008 Wenchuan M 8.0 earthquake, the 2011 Japan M 9.1 earthquake, as well as volcanoes like the Changbai Mountain Volcano and Wudalianchi Volcano in Northeast China and the Tengchong Volcano in Yunnan, are all under its control.
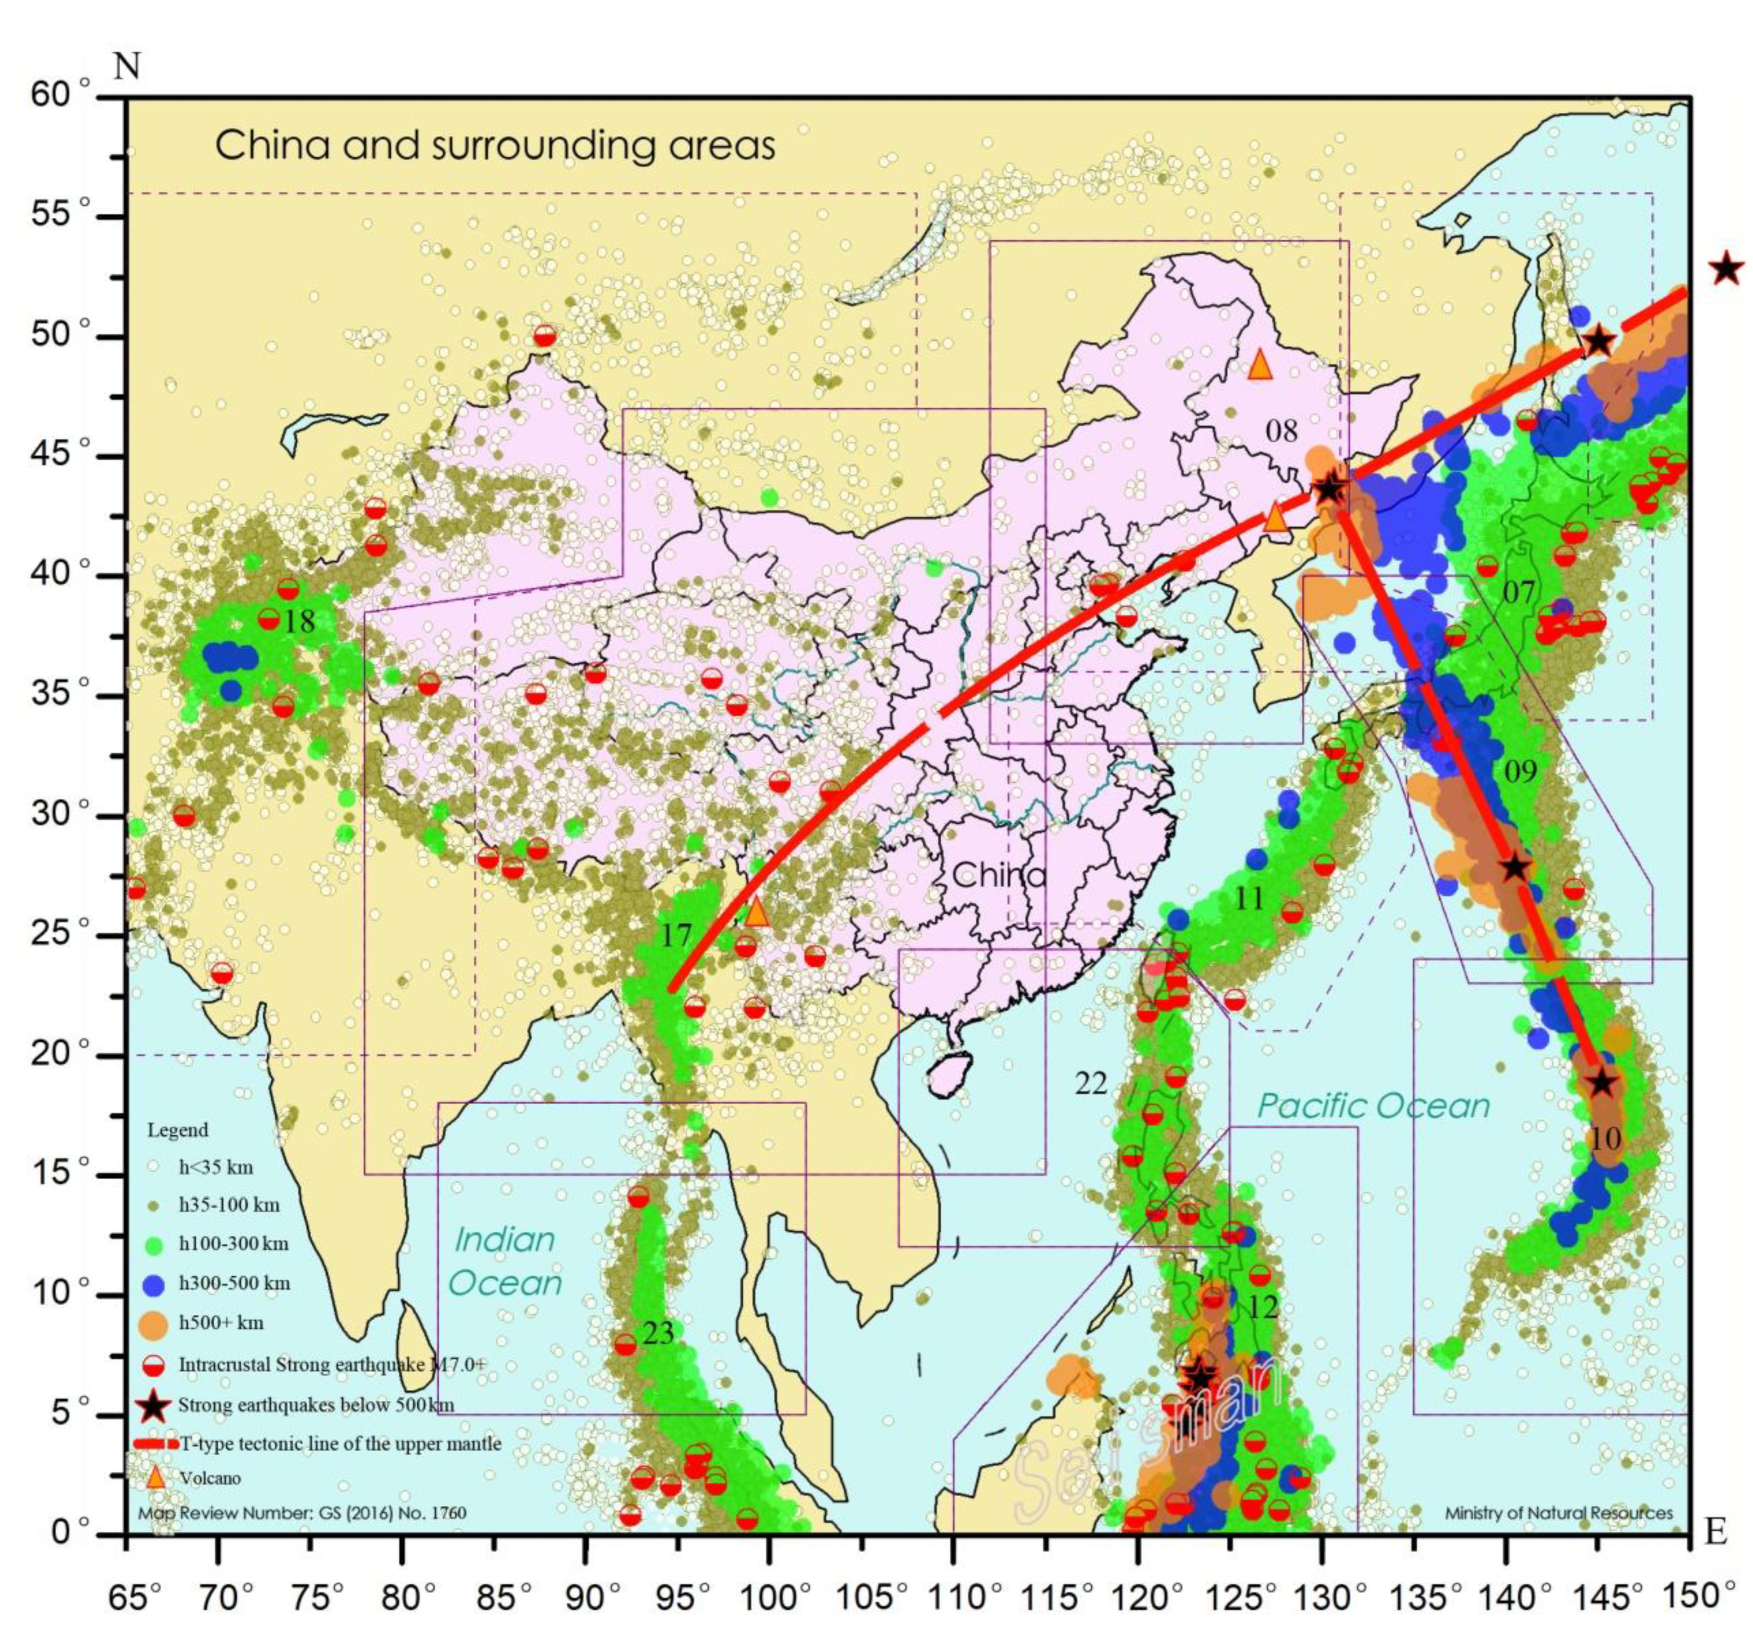
Figure 12.
Temporal process of the seismic cone in Japan, the stratified seismic activity degree and the correlation with M 6.5+ intra-crustal strong earthquakes in the #07 SCT. Explanation of Figure 12: The ochre dashed lines represent dense clustering areas, the sky-blue columns represent M 6.5+ strong intra-crustal earthquakes. In figure a), the white dots represent magnitude 4-5.9 earthquakes, the green dots represent magnitude 6-6.9 earthquakes, and the orange dots represent M 7.0+ earthquakes. The activity value ε₀ is closely related to M8.0+ intra-crustal strong earthquakes.
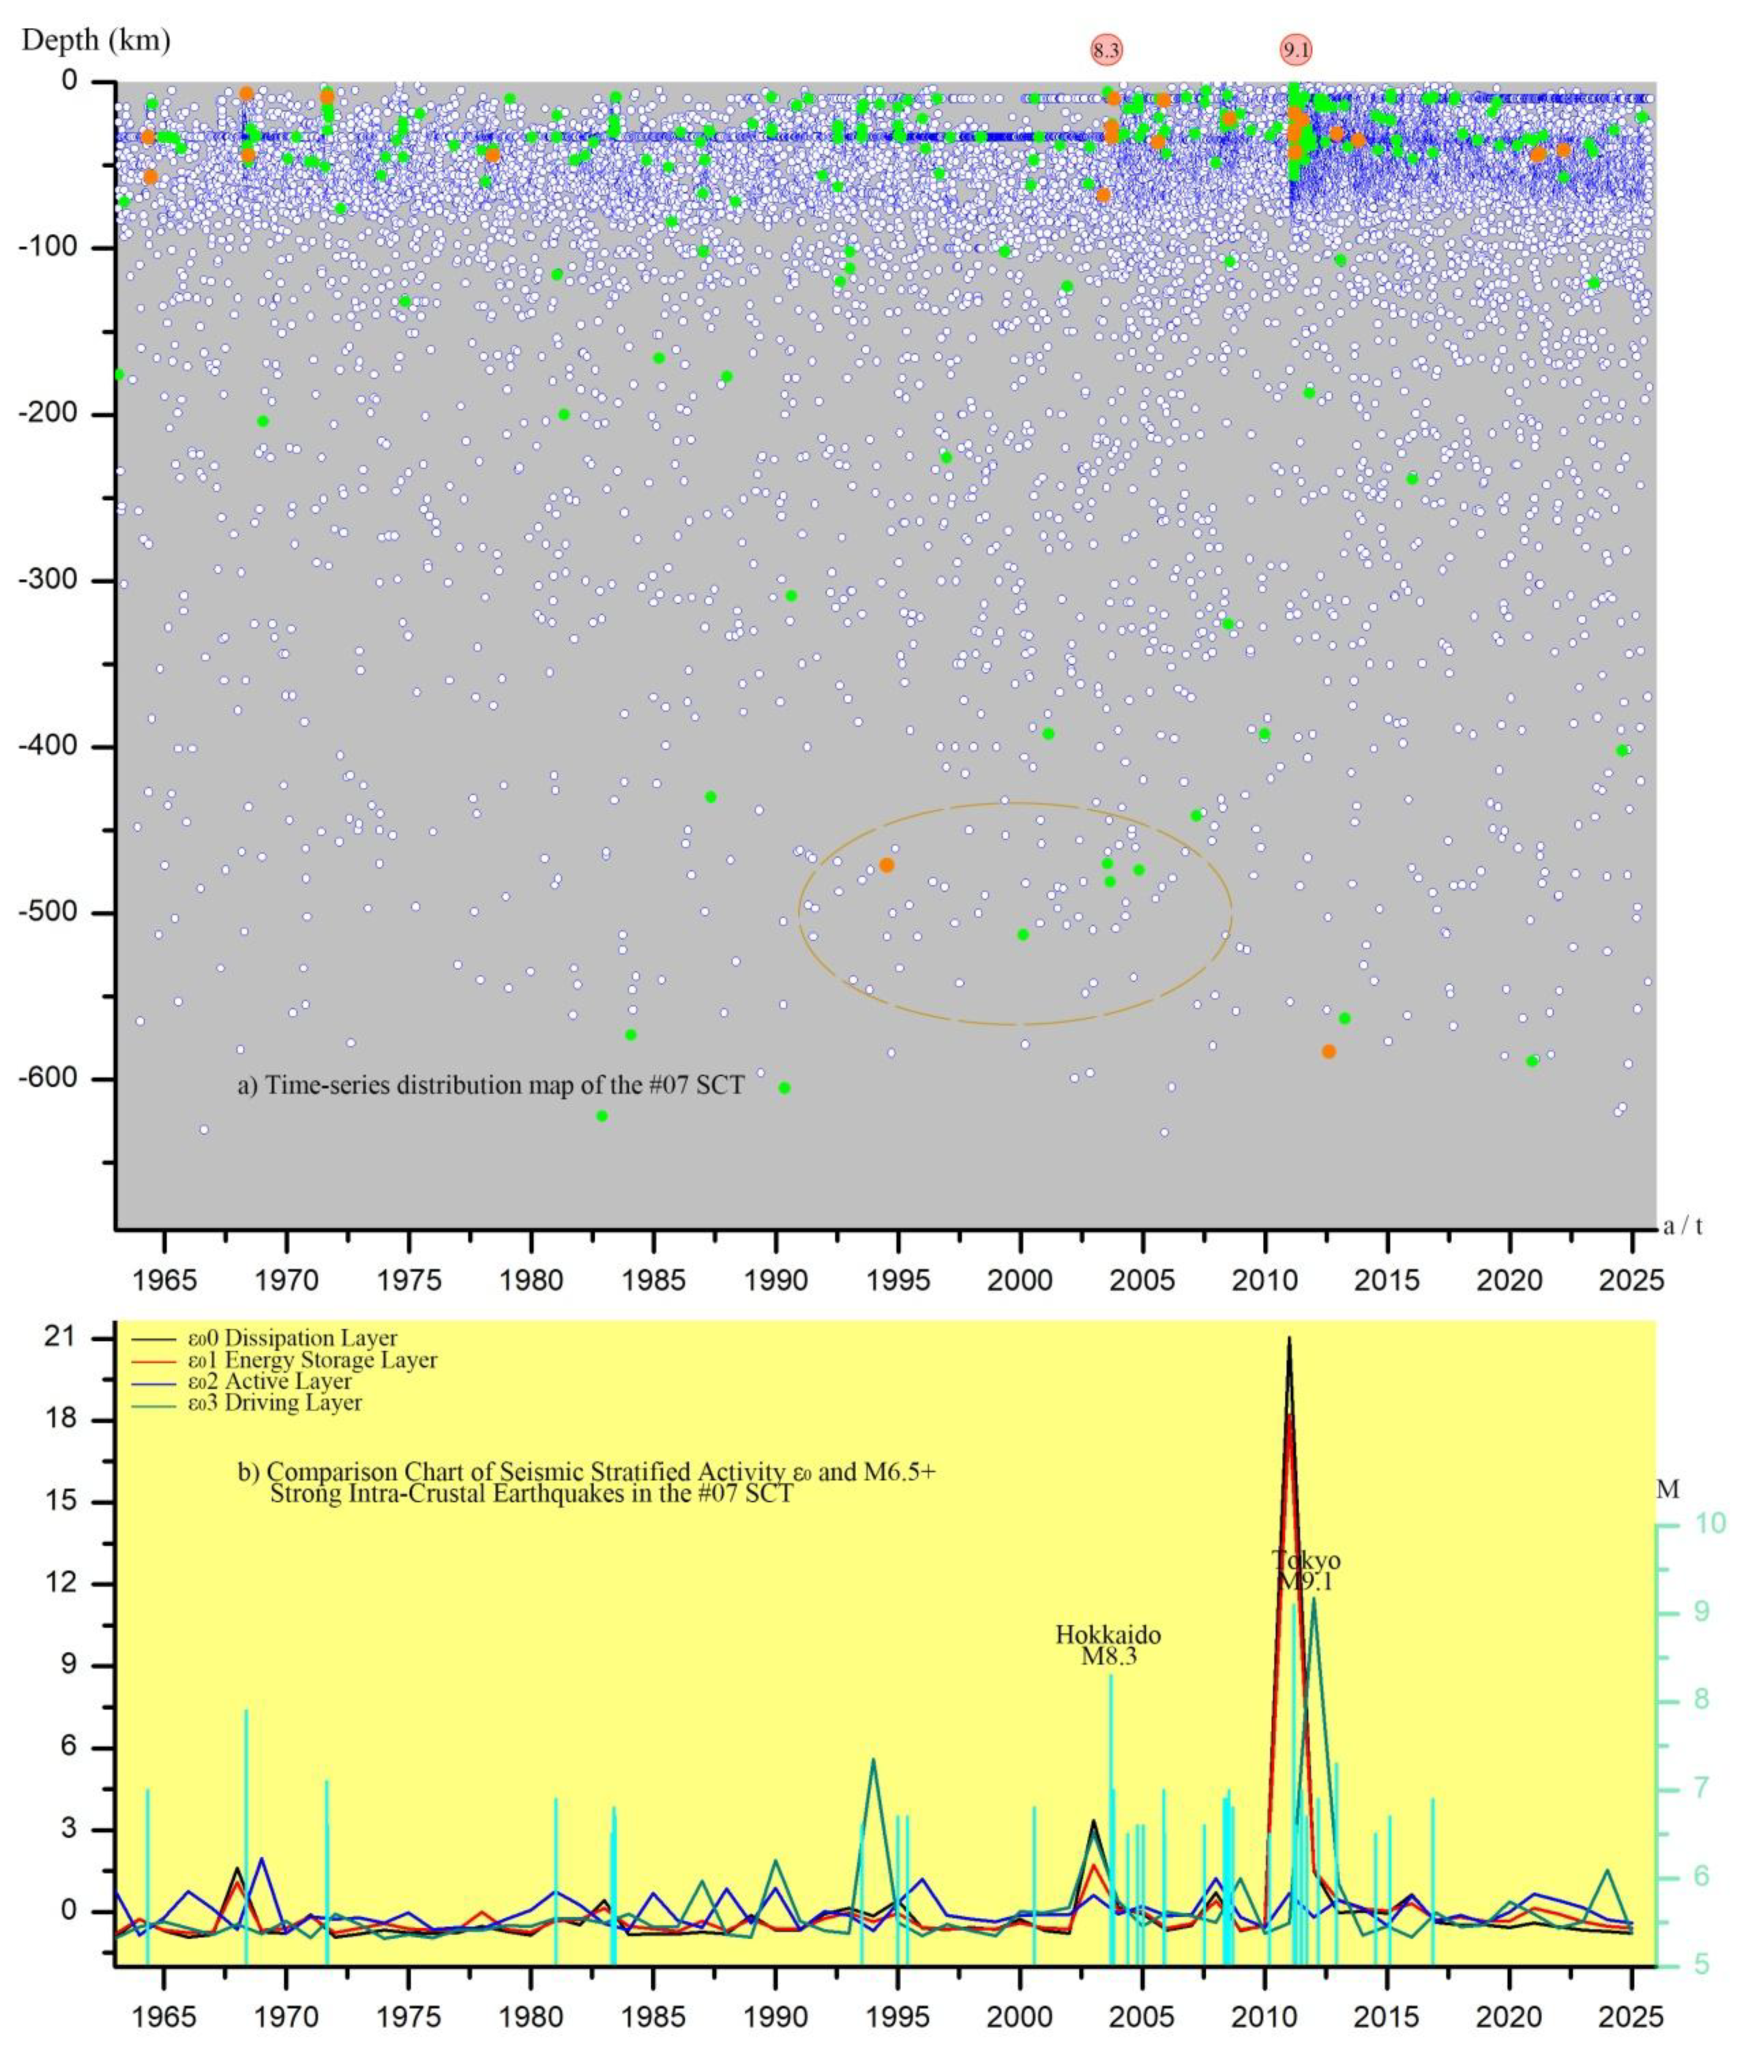
Figure 13.
Distribution map of global earthquakes, earthquake cones, and mantle plumes at 35-700 km (adapted from Chen Lijun, 2025) [7]. (According to the ANSS Seismic Catalog, M 4.0+, 1963-April 18, 2025) Explanation of Figure 13: The red dots represent M 7.0+ intra-crustal strong earthquakes from 1038 to 2025, totaling 919, including historical earthquakes in China and the United States. Only M 7.0+ intra- crustal strong earthquakes are retained within the depth range of 0-35 km, and all other earthquakes are excluded. Dark green dots represent sub-crustal earthquakes within the depth range of 35-100 km; sky blue dots represent earthquakes within the depth range of 100-300 km; blue dots represent earthquakes within the depth range of 300-500 km; orange dots represent earthquakes with a depth greater than 500 km, with the maximum sampling depth being approximately 700 km. Purple triangles represent volcanoes that erupted from 1963 to 2025, totaling 313. Purple hexagons with an “X” mark represent mantle plumes, with a total of 64 having coordinates worldwide. No traces of plate tectonics are visible in this figure.
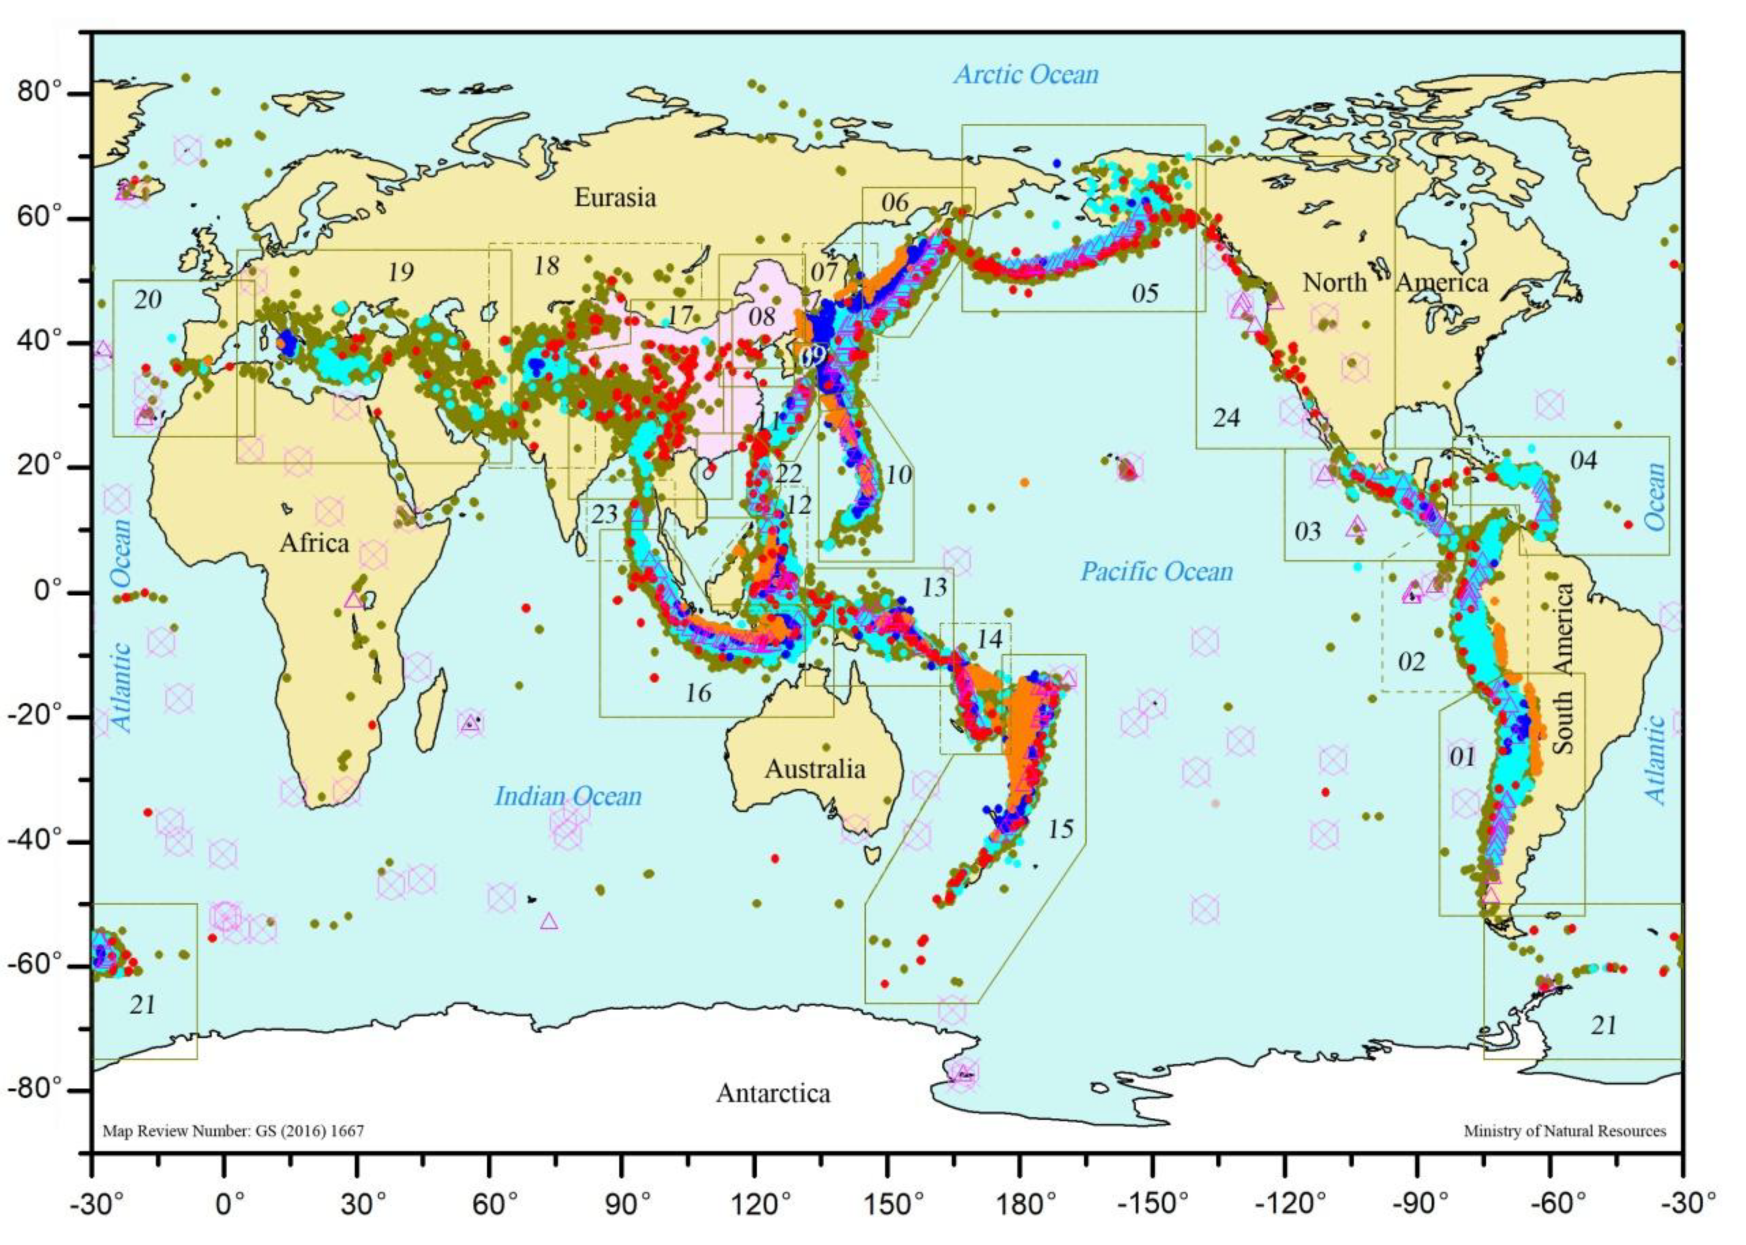
Table 1.
A table of the stratified state of seismic activity in the study area.
| Study area | Sum | Shell | Sub-crustal | Ratio % |
35-150 km |
150-350 km |
350+ km |
Depth km |
M max |
|---|---|---|---|---|---|---|---|---|---|
| 25Cn | 157,738 | 79,832 | 77,906 | 49.4 | 49,046 | 22,882 | 1,577 | -686 | 9.1 |
Table 2.
Table of Stratified States of Seismic Cone Tectonic Activities in the Study Area*.
| SCT | Sum | Shell | Subshell | Ratio % |
35-100 km |
100-300 km |
300-500 km |
500+ km |
Depth km |
M max |
|---|---|---|---|---|---|---|---|---|---|---|
| 07Jp | 21,584 | 8,676 | 12,908 | 59.8 | 10,943 | 1,430 | 436 | 99 | -631.9 | 9.1 |
| 08Hc | 602 | 513 | 89 | 14.8 | 19 | Non | 2 | 68 | -644.8 | 7.9 |
| 09Ma | 18,955 | 9,405 | 9,550 | 50.4 | 5,207 | 1,382 | 2,645 | 316 | -686.3 | 7.8 |
| 10Ma | 14,686 | 5,908 | 8,778 | 59.8 | 3,709 | 4,318 | 556 | 195 | -656 | 7.7 |
| 11Tq | 10,576 | 6,248 | 4,328 | 40.9 | 3,099 | 1,225 | 4 | Non | -322 | 7.63 |
| 17Bm | 12,481 | 9,653 | 2,828 | 22.7 | 2,304 | 524 | Non | Non | -184 | 8 |
| 18Hd | 18,877 | 9,972 | 8,905 | 47.2 | 3,257 | 5,638 | 10 | Non | -400.5 | 7.7 |
| 22Mn | 10,837 | 7,098 | 3,739 | 34.5 | 2,890 | 849 | Non | Non | -291.9 | 7.8 |
| 23Ad | 7,046 | 5,379 | 1,667 | 23.7 | 1,386 | 281 | Non | Non | -264 | 7.5 |
* In the table, “Non” indicates that no M4.0+ seismic activity was observed.
Table 4.
Deep-source strong earthquakes with M7.0+ in the Driving Layer in the study area.
| Date | Latitude | Longitude | Depth | Magnitude | M type | Temporal coordinates | Location |
|---|---|---|---|---|---|---|---|
| Upper mantle T-type tectonic belt | |||||||
| 19990408 | 43.60 | 130.35 | -565 | 7.1 | M | 1999.267258 | Hunchun |
| 20020628 | 43.75 | 130.66 | -566 | 7.3 | M | 2002.489649 | Hunchun |
| 20120814 | 49.8 | 145.064 | -583.2 | 7.7 | mww | 2012.617827 | Sea of Okhotsk |
| 20130524 | 54.892 | 153.221 | -598.1 | 8.3 | mww | 2013.392437 | Northern Okhotsk |
| 19950823 | 18.85 | 145.21 | -594 | 7.1 | M | 1995.641906 | Mariana Trench |
| 20150530 | 27.8386 | 140.4931 | -664 | 7.8 | mww | 2015.409519 | Northern Mariana |
| 20160413* | 23.0944 | 94.8654 | -136 | 6.9 | mww | 2016.283006 | (Myanmar) |
| Mindanao | |||||||
| 20050205 | 5.293 | 123.337 | -525 | 7.1 | mwc | 2005.097305 | Mindanao |
| 20100723 | 6.718 | 123.409 | -607.1 | 7.3 | mwc | 2010.558691 | |
| 20100723 | 6.497 | 123.48 | -578 | 7.6 | mwc | 2010.558773 | |
| 20100723 | 6.776 | 123.259 | -640.6 | 7.5 | mwc | 2010.558819 | |
| 20170110 | 4.4782 | 122.6171 | -627.17 | 7.3 | mww | 2017.025369 | |
| 20240711 | 6.0838 | 123.1503 | -639.503 | 7.1 | mww | 2024.524843 | |
* This earthquake is a medium-depth associated earthquake, not a core deep-source strong earthquake. Its activity is indirectly affected by the migration of thermal materials in the T-shaped tectonic belt, and it is listed here as a supplement to the T-shaped tectonic belt.
Table 5.
#07 Statistical Table of Seismic Activity ε₀ Values for Subcrustal Earthquake Stratification in Japan’s SCT (1990-2015).
Table 5.
#07 Statistical Table of Seismic Activity ε₀ Values for Subcrustal Earthquake Stratification in Japan’s SCT (1990-2015).
| Annual | Dissipation Layer | Energy Storage Layer | Active Layer | Driving Layer | Annotation |
|---|---|---|---|---|---|
| 1990 | -.6606 | -.614 | .8741 | 1.8824 | |
| 1991 | -.6612 | -.6176 | -.6357 | -.3399 | |
| 1992 | -.0834 | -.2275 | .0321 | -.6955 | |
| 1993 | .1276 | -.0204 | -.1286 | -.7823 | |
| 1994 | -.1476 | -.348 | -.6841 | 5.5956 | Driving Layer Exception |
| 1995 | .4315 | -.0436 | .3183 | -.3862 | |
| 1996 | -.5857 | -.5613 | 1.211 | -.8753 | |
| 1997 | -.646 | -.6164 | -.1241 | -.462 | |
| 1998 | -.558 | -.6175 | -.2545 | -.6882 | |
| 1999 | -.6468 | -.6187 | -.3647 | -.8742 | |
| 2000 | -.2666 | -.4025 | -.1103 | .0237 | |
| 2001 | -.6923 | -.599 | -.1065 | -.0274 | |
| 2002 | -.7722 | -.6088 | -.0956 | .1606 | |
| 2003 | 3.3589 | 1.7229 | .6194 | 2.8926 | Hokkaido M 8.3 |
| 2004 | .1722 | .0656 | -.0666 | .3929 | |
| 2005 | -.0829 | .0315 | .2124 | -.5114 | |
| 2006 | -.6714 | -.6036 | -.14 | .007 | |
| 2007 | -.4899 | -.4233 | -.1038 | -.1365 | |
| 2008 | .7167 | .4072 | 1.2248 | -.3722 | |
| 2009 | -.678 | -.6323 | -.203 | 1.2258 | |
| 2010 | -.4753 | -.5242 | -.5648 | -.7719 | |
| 2011 | 21.0249 | 18.2147 | .6717 | -.4006 | Tokyo M 9.1 |
| 2012 | 1.5184 | 1.5628 | -.2005 | 11.4812 | Driving Layer Exception |
| 2013 | -.0181 | .4185 | .4481 | 1.0626 | |
| 2014 | .0154 | .1234 | .1364 | -.8638 | |
| 2015 | -.0533 | .0522 | -.5086 | -.5193 |
Table 6.
Statistics of ε₀ values for the stratigraphic activity of known M7.0+ intra-crustal strong earthquakes and sub-crustal earthquakes.
Table 6.
Statistics of ε₀ values for the stratigraphic activity of known M7.0+ intra-crustal strong earthquakes and sub-crustal earthquakes.
| Driver layer ε₀3(ε₀2) value |
Dissipation Layer ε₀0 value |
Energy storage layer ε₀1 value |
M | Starting year | earthquake year | location |
|---|---|---|---|---|---|---|
| 5.5956+2.8926 | 21.0249 | 18.2147 | 9.1 | 1994 | 2011 | Tokyo |
| 5.5956 | 3.3589 | 1.7229 | 8.3 | 1994 | 2003 | Hokkaido |
| 1.79 | 5.69 | 4.92 | 8.0 | 1995 | 2008 | Wenchuan |
| 3.26 | 0.76 | 0.64 | 7.1 | 2015 | 2024 | Aksu |
Disclaimer/Publisher’s Note: The statements, opinions and data contained in all publications are solely those of the individual author(s) and contributor(s) and not of MDPI and/or the editor(s). MDPI and/or the editor(s) disclaim responsibility for any injury to people or property resulting from any ideas, methods, instructions or products referred to in the content. |
© 2025 by the authors. Licensee MDPI, Basel, Switzerland. This article is an open access article distributed under the terms and conditions of the Creative Commons Attribution (CC BY) license (http://creativecommons.org/licenses/by/4.0/).
Copyright: This open access article is published under a Creative Commons CC BY 4.0 license, which permit the free download, distribution, and reuse, provided that the author and preprint are cited in any reuse.


