Submitted:
08 November 2025
Posted:
11 November 2025
You are already at the latest version
Abstract
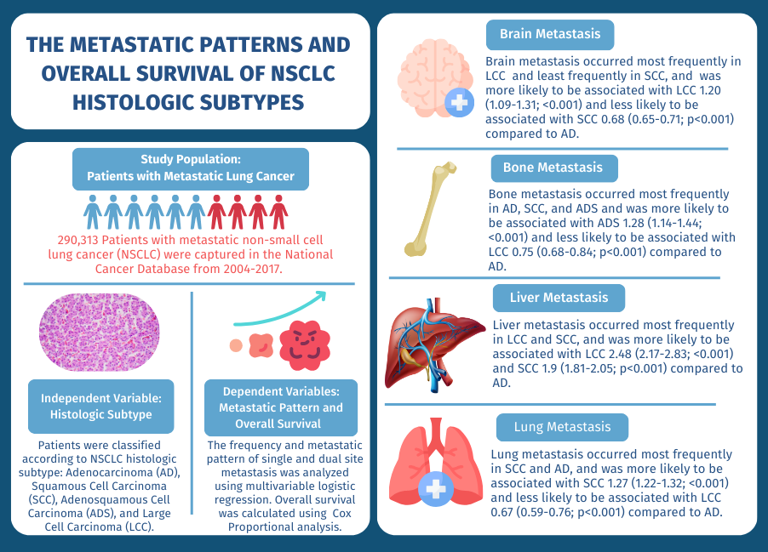
Background: It is unclear whether histologic subtypes are associated with site-specific metastases or impact overall survival. Thus, the objective of this study was to evaluate metastatic patterns according to four histologic subtypes of non-small cell lung cancer (NSCLC) and assess their impact on overall survival.
Study Design: In this observational study 290,313 patients from 2004 to 2017 with metastatic NSCLC were identified from the National Cancer Database and categorized by histologic subtype. Multivariable logistic regression was performed to assess the association between histologic subtype and specific single-site and multiple-site metastatic patterns. Multivariable Cox proportional hazard models were used in survival analysis.
Results: Metastatic site patterns and histologic subtypes significantly affected overall survival (OS). In multivariate analysis, histologic subtypes correlated with distinct metastatic patterns. In single site metastasis median survival time from longest to shortest was lung, brain, bone, and liver across adenocarcinoma (AD), squamous cell carcinoma (SCC), and adenosquamous cell carcinoma (ADS). In dual-site metastatic disease longest median survival time was brain and bone across AD and large cell carcinoma (LCC) and lung and bone across SCC and ADS.
Conclusion: NSCLC histologic subtypes are associated with distinct metastatic patterns and may confer prognostic importance.
Keywords:
non-small cell lung cancer
; metastatic lung cancer
; overall survival
; histologic subtypes
1. Introduction
Non-Small Cell Lung Cancer (NSCLC) is a heterogeneous group of malignant cancers that arise from the lung, with three major histologic subtypes recognized clinically. Consequently, NSCLC varies clinically, pathologically, and in regard to genetic properties. The most common histologic subtypes of NSCLC are adenocarcinoma (AD), squamous cell carcinoma (SCC), and large cell carcinoma (LCC). Recently molecular and genetic studies have shown that histologic subtypes have distinct genetic markers and biologic properties which may account for the heterogenous clinical and prognostic variance observed in NSCLC.[1,2,3]
Recent evidence in breast and renal cell carcinoma suggests that the genetic makeup of individual histologic subtypes affect metastatic spread in a non-random process and with a phenotypic predilection.[4,5] In NSCLC, the most common sites of metastases are brain, liver, and bone.[6] Still, the rate of site-specific occurrence has been shown to vary based off of histologic subtype in adenocarcinoma, specifically in terms of bone and liver metastasis.[6] Further, rates of involvement for other histologic subtypes are not well defined in the literature and whether or not metastatic patterns impact survival is unclear.
Lung cancer is the leading cause of cancer-related deaths worldwide[7] and 40% of patients present with distant metastasis at the time of diagnosis [8] conferring a dismal five-year survival rate of 1-6%. [9] Thus, understanding how metastatic patterns reflect unique biogenetic properties and their clinical and prognostic significance is of the upmost importance. We hypothesize that the clinical behavior for NSCLC may vary based on the pattern of metastasis across histologic subtypes but also, within a single histologic subtype which may have a profound impact on survival that is largely unrecognized.
Using the National Cancer Database (NCDB), a large national database containing more than 1,500 cancer sites and 30 million patient records, we sought to develop a deeper understanding of metastatic site involvement across four histologic patterns of distant metastasis in terms of site-specific frequency and overall survival (OS).
2. Patients and Methods
2.1. Study Design and Patient Selection
In this observational study we used the NCDB to perform an analysis on patients with metastatic NSCLC from 1,500 domestic cancer centers. Data were collected from the NCDB, containing approximately 70% of all newly diagnosed cases of cancer in the United States and Puerto Rico and includes over 30 million patient records. Clinical staging was recorded using the 8th edition Tumor, Node, Metastasis (TNM) classification system from the American Joint Committee on Cancer. All data in the NCDB are deidentified and managed by the American Cancer Society, American College of Surgeons, and Commission on Cancer. This study used publicly available, de-identified patient information. Therefore, our analysis is not considered to involve human subjects, constitute as human subject research, and is exempt from Institutional Review Board approval.
NSCLC patients with distant metastases were selected from all patients diagnosed with NSCLC from 2004-2017 and were identified using the International Classification of Diseases for Oncology, 3rd edition (ICD-O-3) histology and topography codes. Patients were then categorized by histologic subtype: adenocarcinoma (AD), squamous cell carcinoma (SCC), adenosquamous cell carcinoma (ADS), and large cell carcinoma (LCC). Single sites of metastatic involvement at diagnosis were collected as: bone, liver, lung, and brain. Dual sites of metastatic involvement were collected as: brain and lung, brain and liver, brain and bone, lung and liver, lung and bone, and liver and bone. The metastatic lung sites were all contralateral to the primary site. Patients were excluded if they exhibited non-malignant, non-invasive, non-metastatic disease, had any prior history of malignancy, an unknown metastatic site pattern or histology pattern, missing data, had two or more histologic subtypes on histopathologic examination and/or more than two sites of metastasis as represented in Figure 1.
2.2. Outcome Measurements
Data regarding sociodemographic characteristics (age, sex, race, median income, insurance status, and distance from treatment facility), baseline characteristics (Charlson Deyo Comorbidity (CDCC) Score and year of diagnosis), and prognostic characteristics (TN status, histologic grade, treatment, histologic subtype, site of metastasis, and survival) were extracted from the NCDB for analysis. The independent variable was histologic subtype and dependent variables of interest were prevalence of metastatic site involvement and OS. OS was calculated from the time of diagnosis of metastatic NSCLC cancer to death from any cause or censored at the time of last follow-up.
2.3. Statistical Analysis
The incidence proportion was defined as the percentage of patients with distant metastases at first diagnosis of lung cancer among the NSCLC cancer population. Patient demographic characteristics and baseline characteristics were described using proportions (%) for binary and nominal categorical variables and as means with standard deviation (SD) for continuous variables.
Differences in binary and nominal categorical variables were assessed using Chi-squared testing. Multivariable logistic regression, adjusted to control for imbalances in individual sociodemographic and prognostic risk factors, was performed to evaluate histologic subtypes that are predictive of the involvement of specific metastatic sites by calculating an odds ratio (OR) (OR > 1 denotes increased odds of occurrence). Multivariable logistic regression was also performed to evaluate the risk of metastatic cooccurrence based on initial metastatic site.
Kaplan-Meier analysis was used to evaluate OS and log-rank testing was used to assess for differences in OS. Survival time was expressed in months and was calculated from first diagnosis of metastatic disease to death from any cause or censoring at last known follow-up. Hazard ratios (HRs) were calculated with multivariable Cox regression and adjusted to control for imbalances in individual sociodemographic variables and prognostic risk factors. An overview of the study design and study cohort is represented in Figure 1. All OS HRs are reported comparing site-specific metastatic disease to non-metastatic disease for each histologic subtype (HR > 1 denotes worse OS).
A two-sided p <0.05 was considered significant. The case deletion method was used when missing data were encountered. STATA statistical software version 13 was used to perform statistical analyses from January to June 2021.
3. Results
3.1. Patients
Of 381,357 total patients, 290,313 were categorized by histologic subtype and 139,412 met study criteria and were used as the study sample. Of these, median age at diagnosis was 66.2 (SD 11.2) years, 45.1% were female, and 99.6% had not received any medical treatment (chemotherapy, radiation, or immunotherapy) palliative or otherwise at the time of diagnosis. There were 202,909 (69.9%) patients with AD, 71,622 (24.7%) with SCC, 4,471 (1.5%) with ADS, and 11,311 (3.9%) with LCC. Males were more frequently diagnosed with any histologic subtype, but this was most pronounced in SCC (64.5%; 46,163 patients). Most patients in the sample were white (82.2%; 238,520 patients) and had Medicare insurance (53.2%; 154,364 patients). The majority received care at a comprehensive community cancer program (43.5%; 118,717 patients) or academic program (32.5%; 89,363 patients). Across the entire cohort, CDCC score was most frequently 0 (61.9%; 179,703 patients) or 1 (24.9%; 72,283 patients), respectively indicating no other comorbidities or one comorbidity at the time of diagnosis. Patients were more likely to have a T stage of 3C (48.0%; 151,521 patients) at least N2 disease (45.1%; 169,130 patients) and single site metastasis at presentation (65.4%; 91,192 patients) compared to multi-site metastasis (34.6%; 48,220 patients). Baseline characteristics by histologic subtype are summarized in Table 1.
3.2. Sites of Metastasis
The most common sites of single metastasis across the entire population were bone (22.5%; 38,050 patients) and brain (20.0%; 33,926), whereas the least common single site was liver (6.0%; 10,103 patients). The most common sites of dual metastasis across the entire population were brain and lung (6.6%; 11,128 patients) and brain and bone (6.2%; 10,487 patients), whereas the least common dual site was liver and bone (1.8%; 3,119). Notably, patients that did not have metastasis on presentation may have developed metastatic disease but are not captured within this cohort.
Frequency of metastatic site was significantly distinct across histologic subtypes in single and dual site metastasis which is illustrated in Figure 2. Single site metastasis occurred in 65.4% of the population (91,192 patients) and the most common site of single metastasis was bone across AD, SCC, and ADS and brain for LCC. Dual site metastasis occurred in 26.2% of the population (36,555 patients) and the most common sites of dual metastasis were brain and bone for AD (7.8%; 7,843 patients) and ADS (7.2%; 169 patients) and liver and bone for SCC (6.5%; 2,099 patients) and LCC (8.3%; 315 patients).
3.3. Effect of Histologic Subtype
Site of metastasis had significantly different risk of occurrence across histologic subtype for single site metastasis, which agreed with frequency data and is summarized in Table 2. Squamous cell carcinoma had increased risk of single site liver metastasis 1.9 [p<0.0001; CI: 1.81-2.05] when compared to AD and increased risk of lung metastasis 1.27 [p<0.0001; CI: 1.22-1.32] when compared to AD, ADS, and LCC. Further SCC had significantly reduced risk of brain metastasis 0.68 [p<0.0001; CI: 0.65-0.71] compared to all other histologic subtypes. Adenosquamous cell carcinoma showed an increased risk in liver metastasis 1.49 [p<0.0001; CI: 1.21-1.80] compared to AD and increased risk of bone metastasis 1.28 [p<0.0001; CI: 1.14-1.44] compared to all other histologic subtypes. Large cell carcinoma showed a substantially increased risk of liver metastasis 2.48 [p<0.0001; CI: 2.17-2.83] compared to all other histologic subtypes with a reduced risk of lung 0.67 [p<0.0001; CI: 0.59-0.76] and bone 0.75 [p<0.0001; CI: 0.68-0.84] metastasis compared to all other histologic subtypes.
3.4. Dual Site Metastasis
Dual site metastasis demonstrated significantly distinct patterns of metastatic site cooccurrence and is summarized in Table 3. Initial metastatic bone disease was markedly more likely to develop concurrent liver metastasis 3.37 [p<0.0001; CI: 3.28-3.46] compared to lung metastasis 1.30 [p<0.0001; CI: 1.27-1.33] and least likely to co-occur with brain metastasis 0.95 [p<0.0001; CI: 0.93-0.97]. Initial metastatic brain disease was more frequently associated with concurrent liver metastasis 1.32 [p<0.0001; CI: 1.28-1.35] than lung metastasis 1.06 [p<0.0001; CI: 1.03-1.09]. Initial metastatic lung disease was more likely to concur with bone metastasis 1.27 [p<0.0001; CI: 1.24-1.30] compared to brain metastasis 1.03 [p=0.014; CI: 1.01-1.06]. Initial metastatic liver disease was strongly associated with concurrent metastasis across all sites but with over a two-time increased frequency in cooccurrence with bone metastasis 3.34 [p<0.0001; CI: 3.26-3.43].
3.5. Overall Survival
In single site metastatic disease, a pattern of survival from longest median survival to shortest, expressed in months, emerged as lung, brain, bone, and liver across AD, SCC, and ADS, whereas in LCC the pattern was brain, lung, bone, and liver. OS results by site of metastatic involvement for each histologic subtype are illustrated in Figure 3. Accordingly, the adjusted hazard ratio (aHR) was also significantly lower for lung metastasis across all histologic subtypes, including LCC, as the aHR for brain metastasis in LCC was insignificant. Likewise, the aHR was significantly higher for liver metastasis across all histologic subtypes, except ADS which was insignificant. OS and associated risk of metastatic site(s) based on histologic subtype are shown in Table 4.
In dual site metastatic disease, a pattern of longest median survival, expressed in months, emerged as brain and bone dual metastasis for AD and LCC and lung and bone dual metastasis for ADS and SCC. Further, shortest median survival was observed for brain and lung dual metastasis in AD and SCC and lung and liver dual metastasis for ADS and LCC which are also represented in Figure 3.
4. Discussion
To our knowledge, these results are representative of the largest cohort to characterize metastatic sites in terms of histologic subtype and report outcomes specific to metastatic AD, SCC, ADS, and LCC non-small cell lung cancer. The main finding observed in the observational study is that there are distinct single and dual site metastatic patterns among histologic subtypes of NSCLC which are associated with survival.
In single site metastatic disease bone metastasis was the most common and liver was the least common across histologic subtypes AD, SCC, and ADS. Striking risk patterns were observed in SCC, showing a reduced risk of metastatic brain disease but a substantial increased risk of liver metastasis when compared to all other histologic subtypes. Still, a common pattern of median survival was observed for single site metastasis in AD, SCC, and ADS from longest median survival to shortest as: lung, brain, bone, and liver.
In dual metastatic disease brain and bone metastasis was the most common while lung and liver was the least common across AD and ADS histologic subtypes. SCC and LCC also showed commonality, with liver and bone being the most frequent dual sites of involvement. OS was also distinct in dual metastatic disease across SCC and ADS which demonstrated superior survival in lung and bone metastasis, whereas AD and LCC had superior survival in brain and bone metastasis.
These results are largely consistent with international population-based data that suggest histology plays a unique role in metastatic patterns and survival of lung cancer[10] as well as corroborating smaller studies suggesting that the most common sites of metastasis in NSCLC are bone, lung, brain, and liver.[11,12,13] Minor differences are attributed to the larger sample size of our study, and the fact that only NSCLC histologic subtypes were analyzed instead of small cell and non-small cell lung cancer as examined by Riihimaki et al. Additionally, our data add to the granularity of prior work to refine our current understanding of metastatic patterns based on histologic subtype in terms of frequency, risks of association, and survival. To date, no study has reported on the unique interactions of metastatic patterns based on histologic subtype or provided as large as sample size in evaluating overall survival.
Indeed, underpinning histologic patterns are biomolecular drivers which have been shown to impact clinical outcomes and have a prognostic significance in lung cancer and may act as confounding variables in this study.[2,3] Elegant work in single-cell-RNA (scRNA) sequencing has revealed the unique impact of biomolecular drivers, interplay within an immunosuppressive tumor microenvironment, and observed novel malignant molecular features distinct from early-disease at a single-celled level that propagate metastasis.[14,15] As novel discoveries are made in scRNA-sequencing the inter and intra-heterogeneity of patients with lung cancer is anticipated to be unmasked, making oncologic treatment personalized on a cellular level. In the present study, biomolecular markers associated with lung cancer were not available for analysis and histologic subtype was used as a surrogate to frame the impact individual oncobiology may have on metastatic patterns.
There are several strengths of this study design which are largely attributable to the large sample size and multicenter nature of this study. Second, our results are consistent with previously reported international population-based data and smaller cohort data. Additionally, given the large cohorts attained we were able to report outcome data for rarer histologic subtypes such as ADS and LCC and rarer metastatic site patterns such as the liver. Lastly, to our knowledge, this is also the first study, that compares frequency of metastatic site involvement by histologic subtypes and OS from a single cohort and national database.
Important limitations of this study are realized. First, there is a potential for missing patients with metastatic NSCLC, as patients that developed metastasis over the course of treatment are not captured by these data. This implies that patients who had relatively indolent disease that later metastasized are missing from this dataset and a bias toward more aggressive disease may exist within our cohort. Further, this limitation may create a bias toward underestimating rates of survival for metastasis patterns. Another limitation is that despite our large sample size, cohorts with dual metastasis sites for ADS and LCC were small and may also lead to underestimating rates of survival for their associated dual metastatic patterns. Second, there are several metastatic sites that are not captured by this database for lung cancer and data were limited to lung, brain, bone, and liver. Additionally, although the percentage of those with single, dual, and triple metastatic disease was presented, the total number of metastatic lesions per patient could not be obtained. Lastly, these data do not capture baseline investigations performed for each patient which may skew the sites of metastasis diagnosed and accordingly presented in this dataset. This is especially true in NSCLC where a cross-sectional brain computed tomography (CT) is routinely performed for a new diagnosis of lung cancer, but patients may not always complete full work up for other areas of metastasis such as dedicated bone imaging, or cross-sectional liver imaging. This may have led to underestimating the frequency of certain metastatic sites.
5. Conclusions
In this observational study, sites of metastasis varied based on histologic subtypes for metastatic NSCLC and were associated with OS. Together, these data demonstrate the heterogeneous nature of NSCLC subtypes in terms of biologic properties and clinical prognosis. Single site metastasis has demonstrated a specific and consistent pattern of median survival across AD, SCC, and ADS histology (from longest to shortest: lung, brain, bone, and liver). Dual metastatic disease has also shown a specific and consistent pattern of superior median survival for brain and bone metastatic disease in AD and LCC and lung and bone disease in SCC and LCC. These results provide a useful benchmark for patient counseling in metastatic lung cancer. Additional research is needed to further characterize the immunopathologic and biomolecular profiles embedded within distinct histologic subtypes of NSCLC and their effect on metastatic patterns and OS.
Supplementary Materials
The following supporting information can be downloaded at the website of this paper posted on Preprints.org
Funding
The authors declare that they have no known competing financial interests or personal relationships that could have appeared to influence the work reported in this paper. The study was performed in accordance with ethical standards. No funding was received for this work.
Informed Patient Consent and Consent for Publication
This study used publicly available, de-identified patient information. Therefore, our analysis is not considered to involve human subjects, constitute as human subject research, and is exempt from Institutional Review Board approval.
Data Availability Statement
The data underlying this article are available from the National Cancer Database. The data were derived from sources in the public domain using deidentified Participant User Data Profiles that are compliant with the Health Insurance and Portability and Accountability Act and submitted to the Commission on Cancer’s National Cancer Database found at: https://www.facs.org/quality-programs/cancer-programs/national-cancer-database.
Conflicts of Interest Statement
The authors declare that they have no known conflicts of interest.
Glossary of Abbreviations
| AD | Adenocarcinoma |
| ADS | Adenosquamous cell carcinoma |
| aHR | Adjusted Hazard Ratio |
| CDCC | Charlson Deyo Comorbidity Score |
| CT | Computed Tomography |
| HR | Hazard Ratio |
| ICD-O-3 | International Classification of Diseases for Oncology, 3rd edition |
| LCC | Large Cell Carcinoma |
| NCDB | National Cancer Database |
| NSCLC | Non-Small Cell Lung Cancer |
| OR | Odds Ratio |
| OS | Overall Survival |
| SCC | Squamous Cell Carcinoma |
| scRNA | Single-Cell-RNA |
| SD | Standard Deviation |
| TNM | Tumor, Node, Metastasis |
References
- MacConaill, L. E. et al. Profiling critical cancer gene mutations in clinical tumor samples. PLoS ONE 4, (2009).
- Dang, A. T. H. et al. Actionable Mutation Profiles of Non-Small Cell Lung Cancer patients from Vietnamese population. Scientific Reports 10, 1–11 (2020).
- Questions, G. Lung Cancer Biomarkers Guideline. Hematol Oncol Clin North Am. 2017 31, 13–29 (2017).
- Xiao, W. et al. Breast cancer subtypes and the risk of distant metastasis at initial diagnosis: A population-based study. Cancer Management and Research (2018). [CrossRef]
- Dudani, S. et al. Evaluation of Clear Cell, Papillary, and Chromophobe Renal Cell Carcinoma Metastasis Sites and Association with Survival. JAMA Network Open 4, 1–11 (2021).
- Ren, Y. et al. Prognostic effect of liver metastasis in lung cancer patients with distant metastasis. Oncotarget (2016). [CrossRef]
- Siegel, R. L., Miller, K. D., Wagle, N.S., Jemal, A. Cancer statistics. CA: A Cancer Journal for Clinicians (2023). [CrossRef]
- Morgensztern, D., Ng, S. H., Gao, F. & Govindan, R. Trends in stage distribution for patients with non-small cell lung cancer: A national cancer database survey. Journal of Thoracic Oncology (2010). [CrossRef]
- Detterbeck, F. C., Boffa, D. J. & Tanoue, L. T. The new lung cancer staging system. Chest (2009). [CrossRef]
- Riihimäki, M. et al. Metastatic sites and survival in lung cancer. Lung Cancer 86, 78–84 (2014).
- Oikawa, A. et al. Application of conditional probability analysis to distant metastases from lung cancer. Oncology Letters 3, (2012).
- Quint, L. E. et al. Distribution of distant metastases from newly diagnosed non-small cell lung cancer. Annals of Thoracic Surgery 62, (1996).
- Hess, K. R. et al. Metastatic patterns in adenocarcinoma. Cancer 106, (2006).
- Kim, N. et al. Single-cell RNA sequencing demonstrates the molecular and cellular reprogramming of metastatic lung adenocarcinoma. Nature Communications 11, (2020).
- Weissleder, R. & Pittet, M. J. The expanding landscape of inflammatory cells affecting cancer therapy. Nature Biomedical Engineering 4, 489–498 (2020).
Figure 1.
An overview of the study design and study cohort is shown.
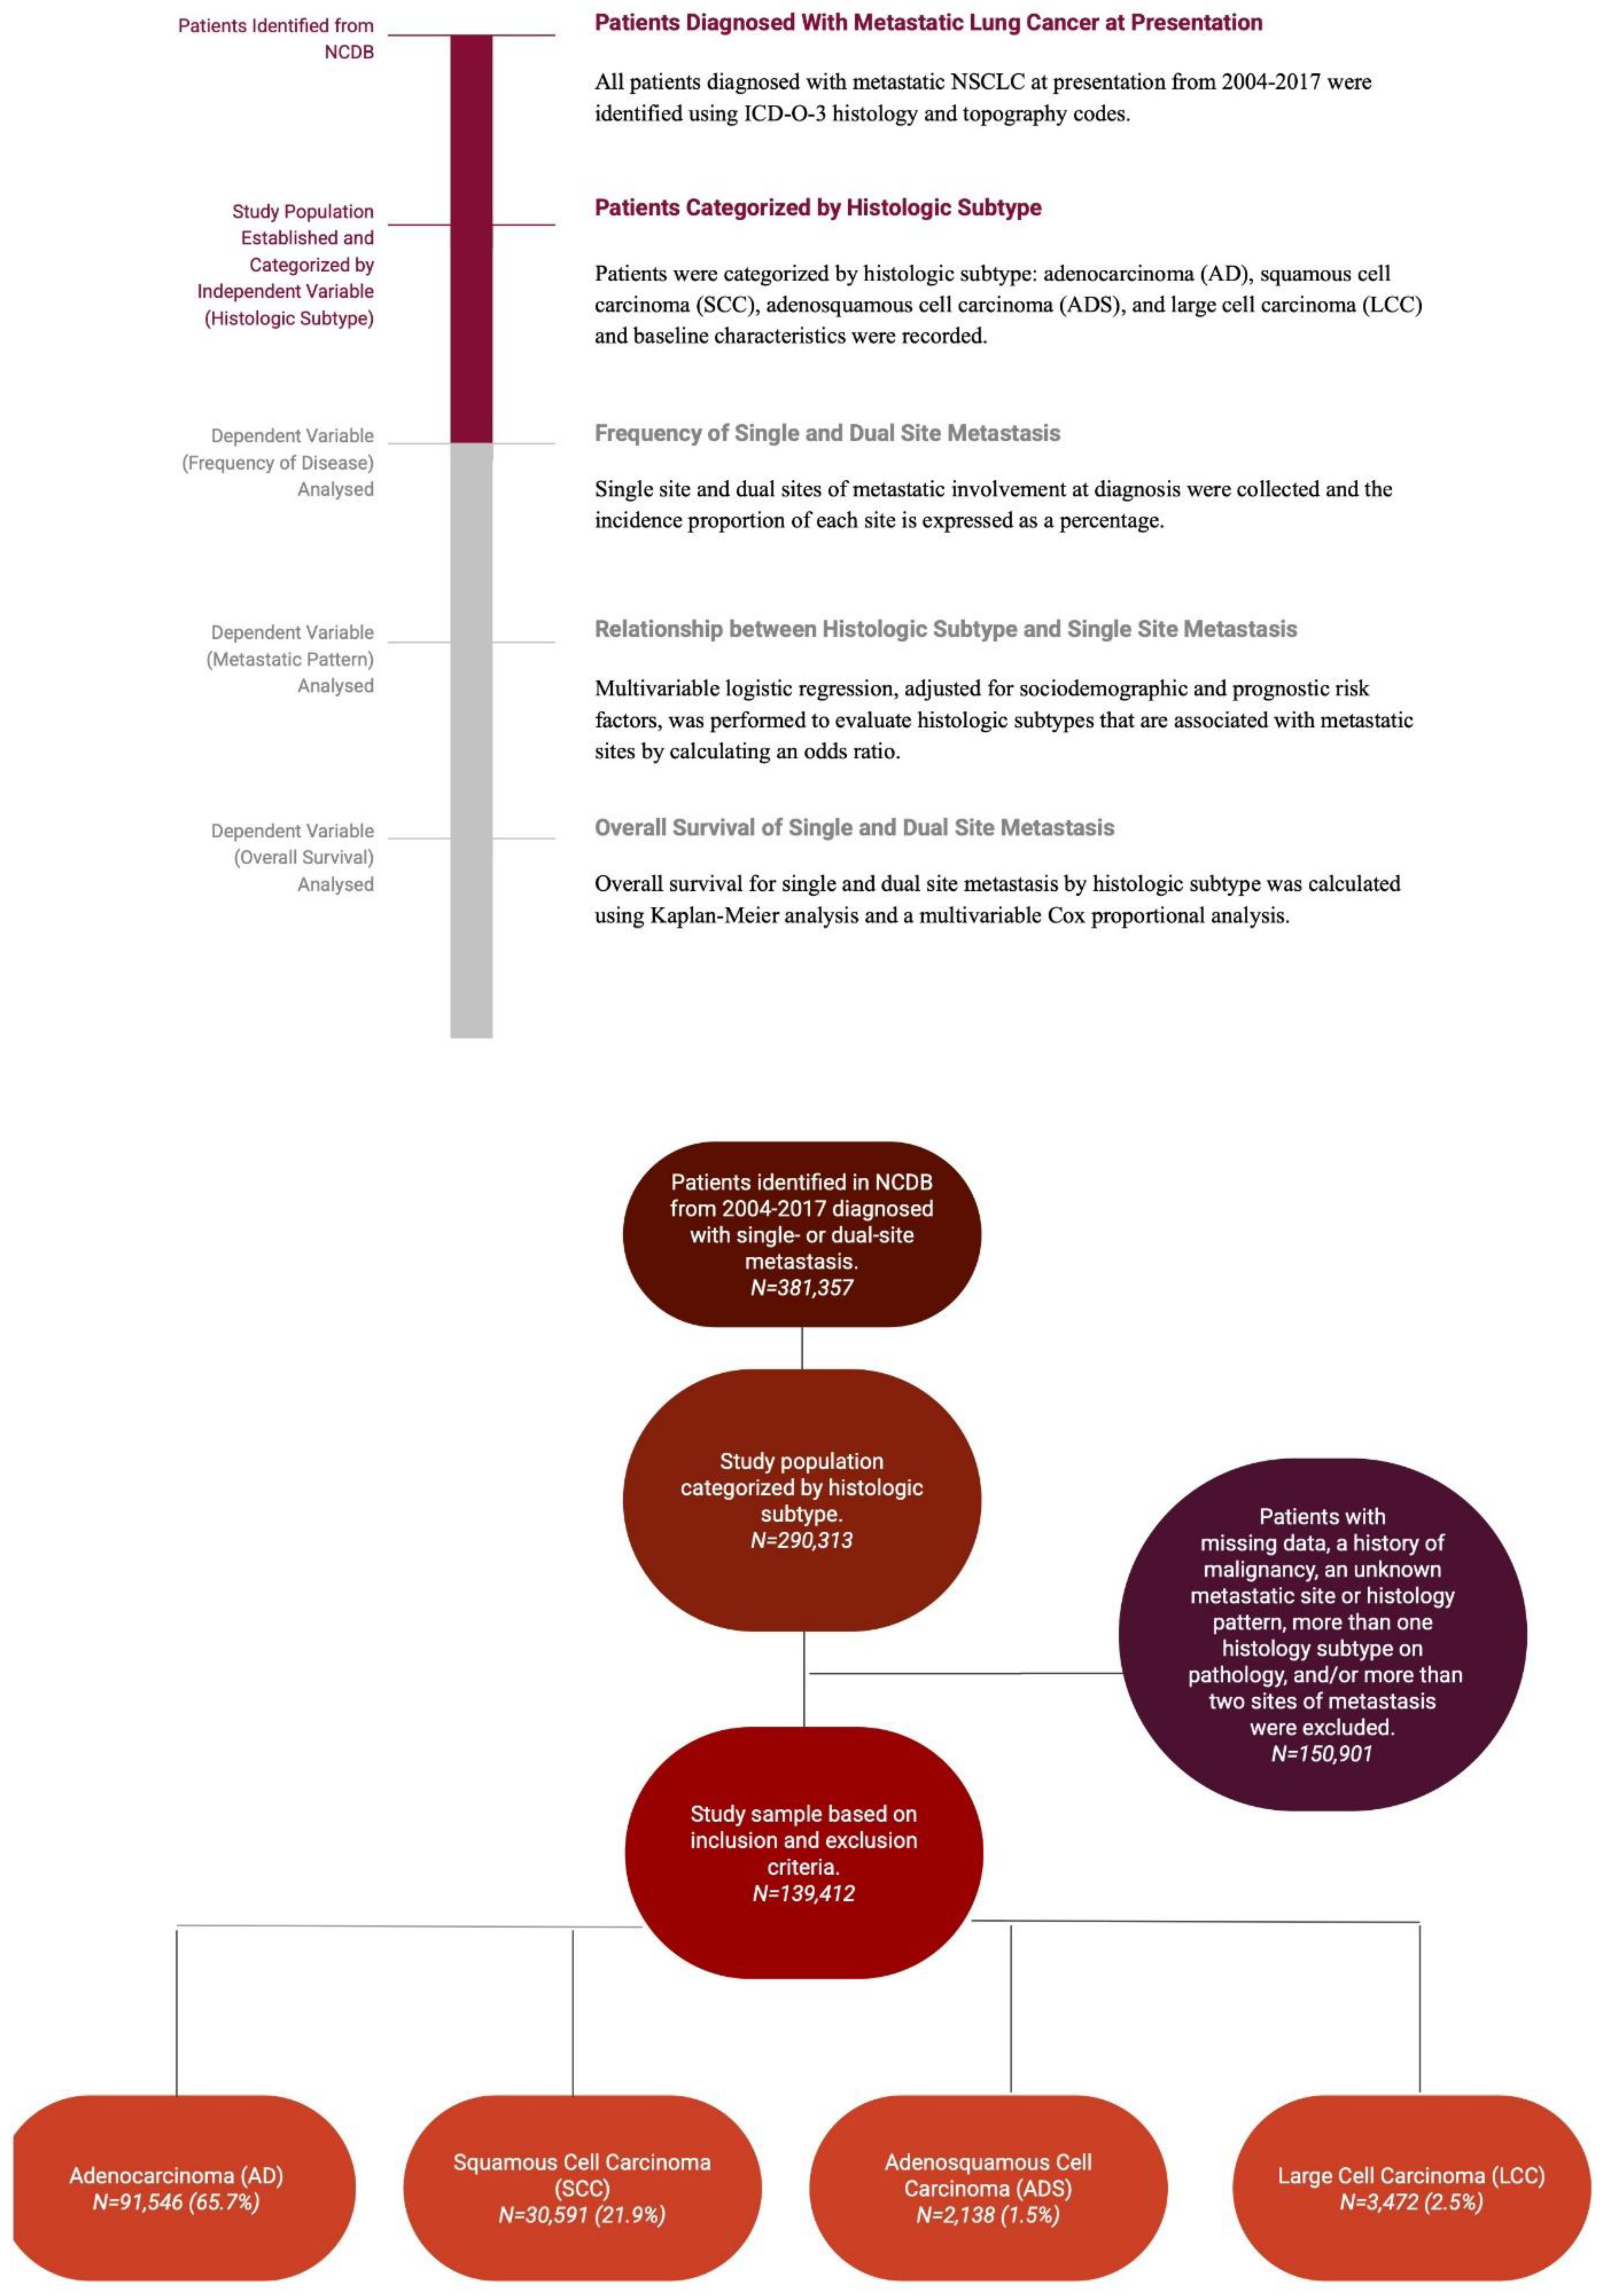
Figure 2.
Frequency of single and dual site metastasis in NSCLC by histologic subtype. The percentage of patients with specific site(s) of metastasis at first diagnosis are illustrated. The most frequent sites of metastatic involvement for each histologic subtype are in bold and an asterisk is used to denote a p-value <0.01.
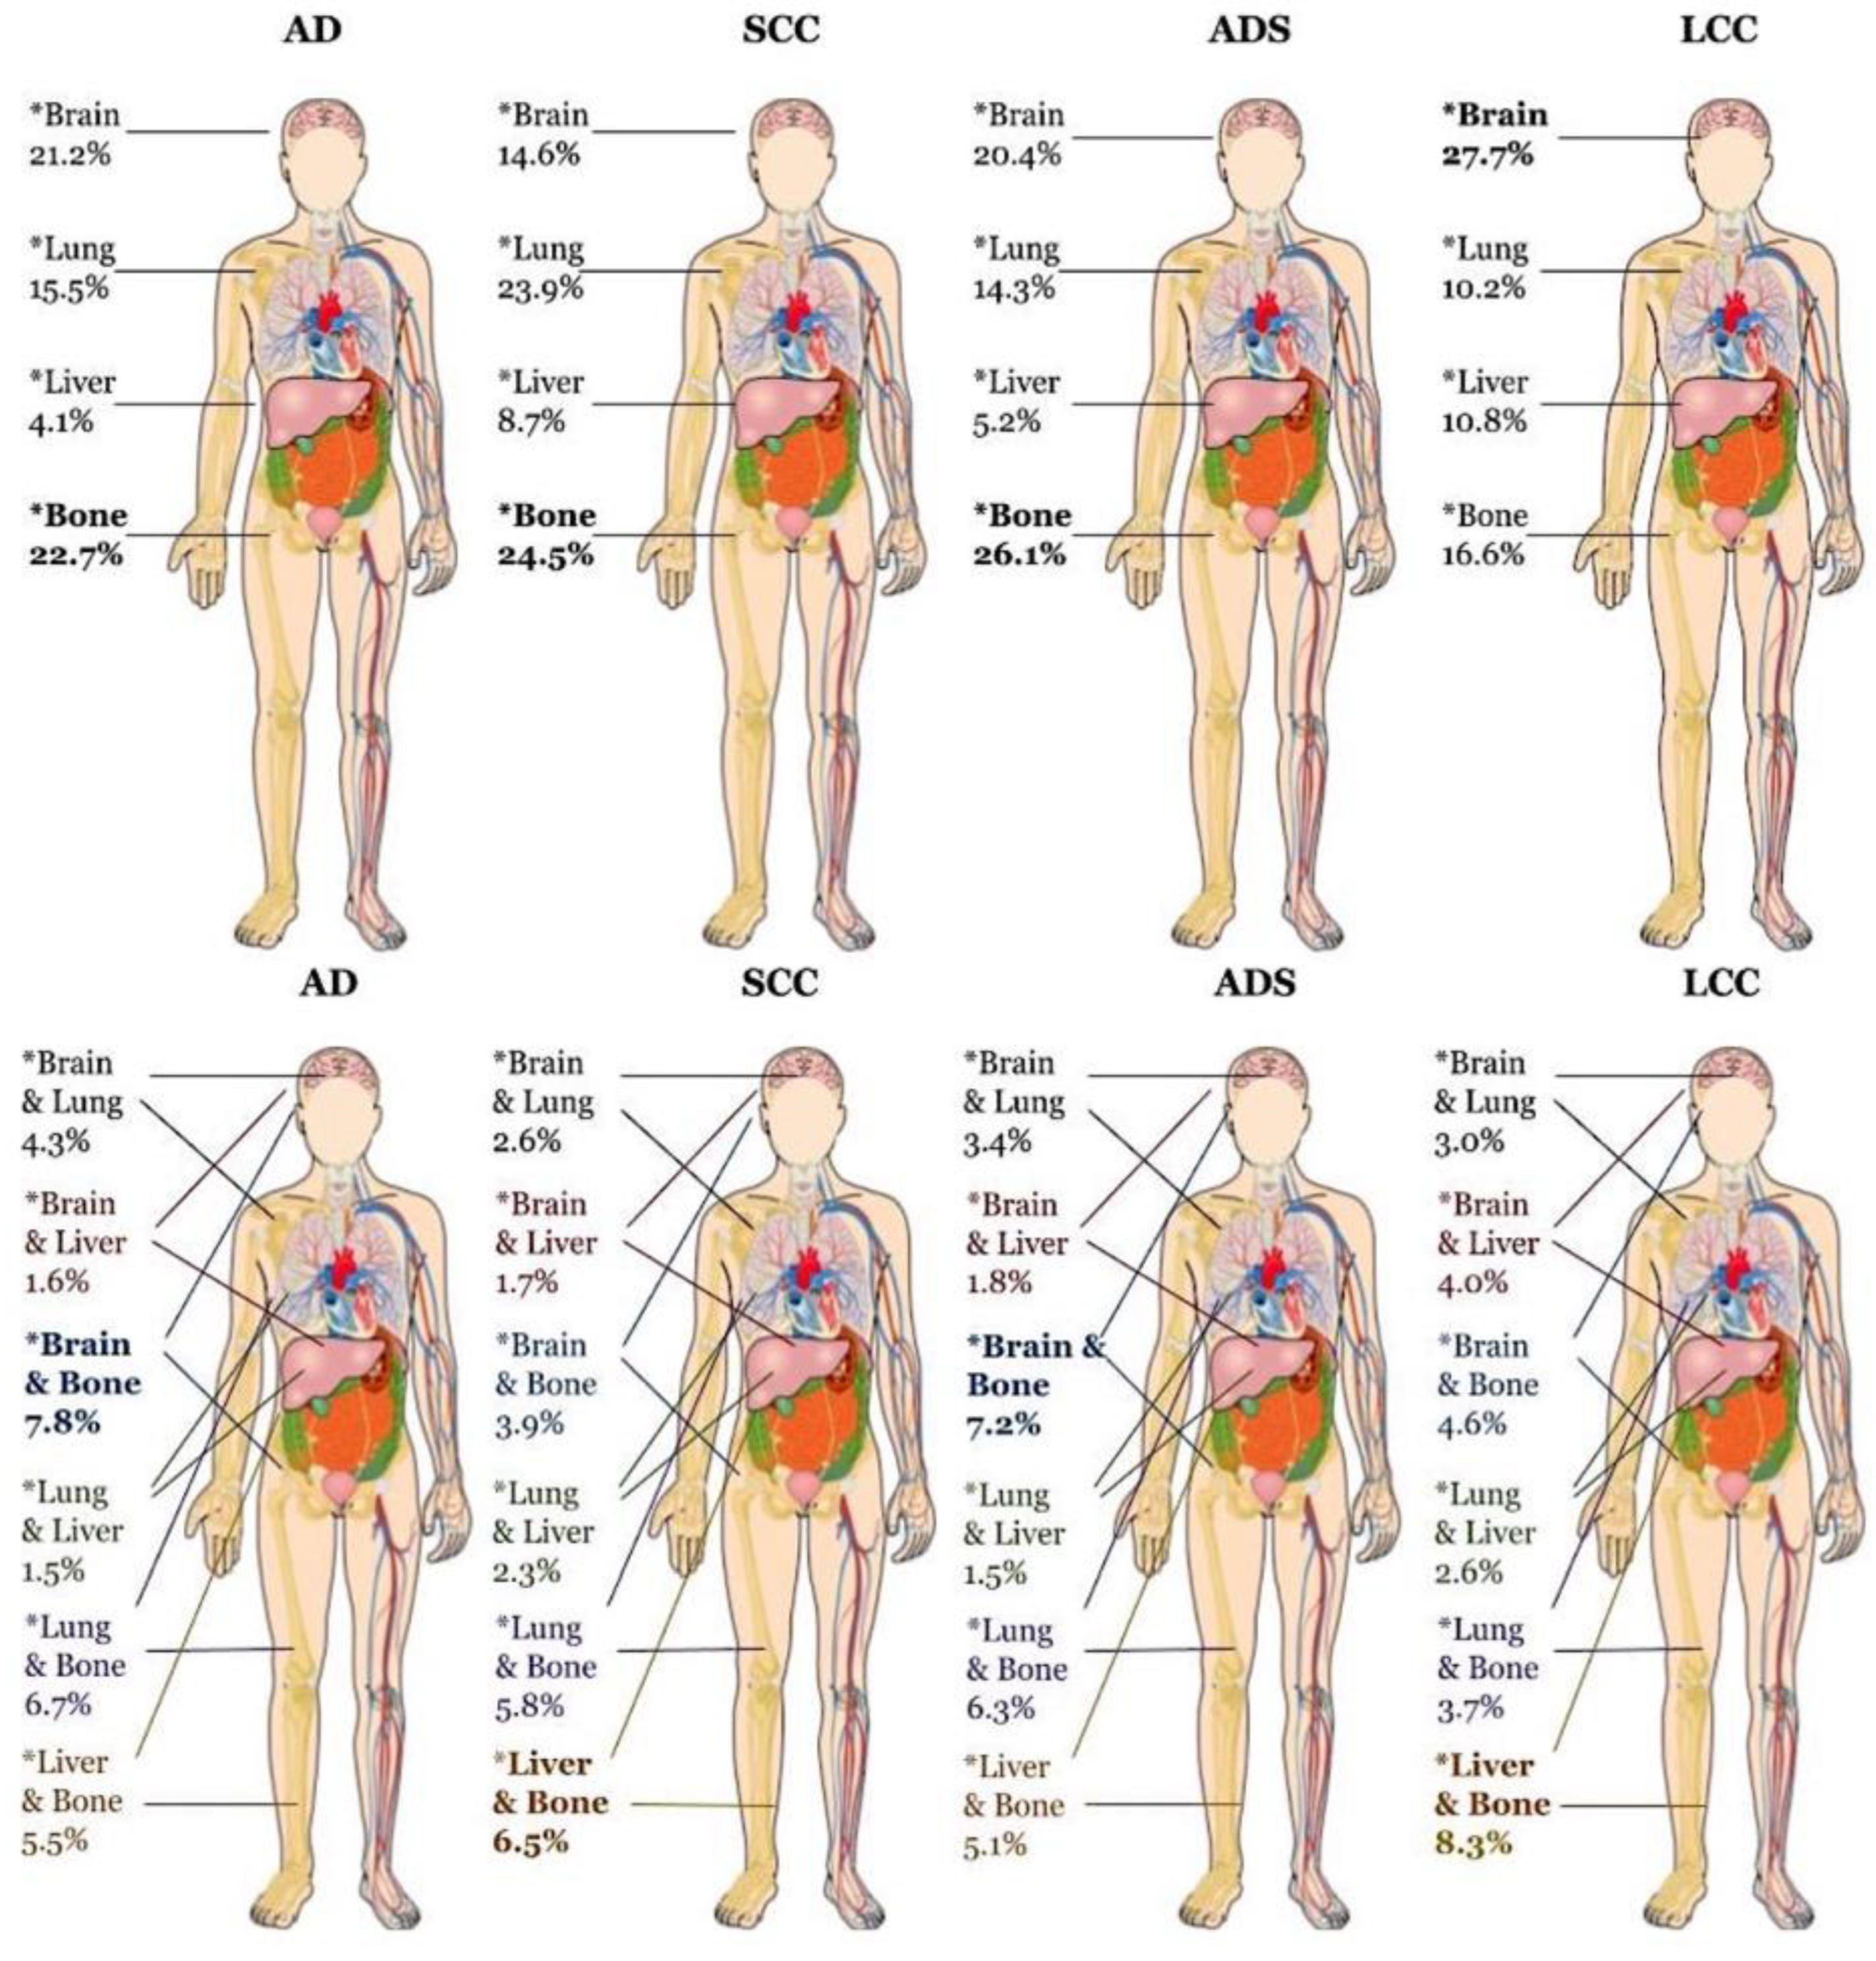
Figure 3.
Overall survival for single and dual site metastasis by histologic subtype. Survival time is expressed in months and was calculated from first diagnosis of metastatic disease to death from any cause or censoring at last known follow-up. Metastatic site(s) with longest survival is indicated in bold and shortest survival in italic font. An asterisk (*) is used to denote a p-value <0.01.
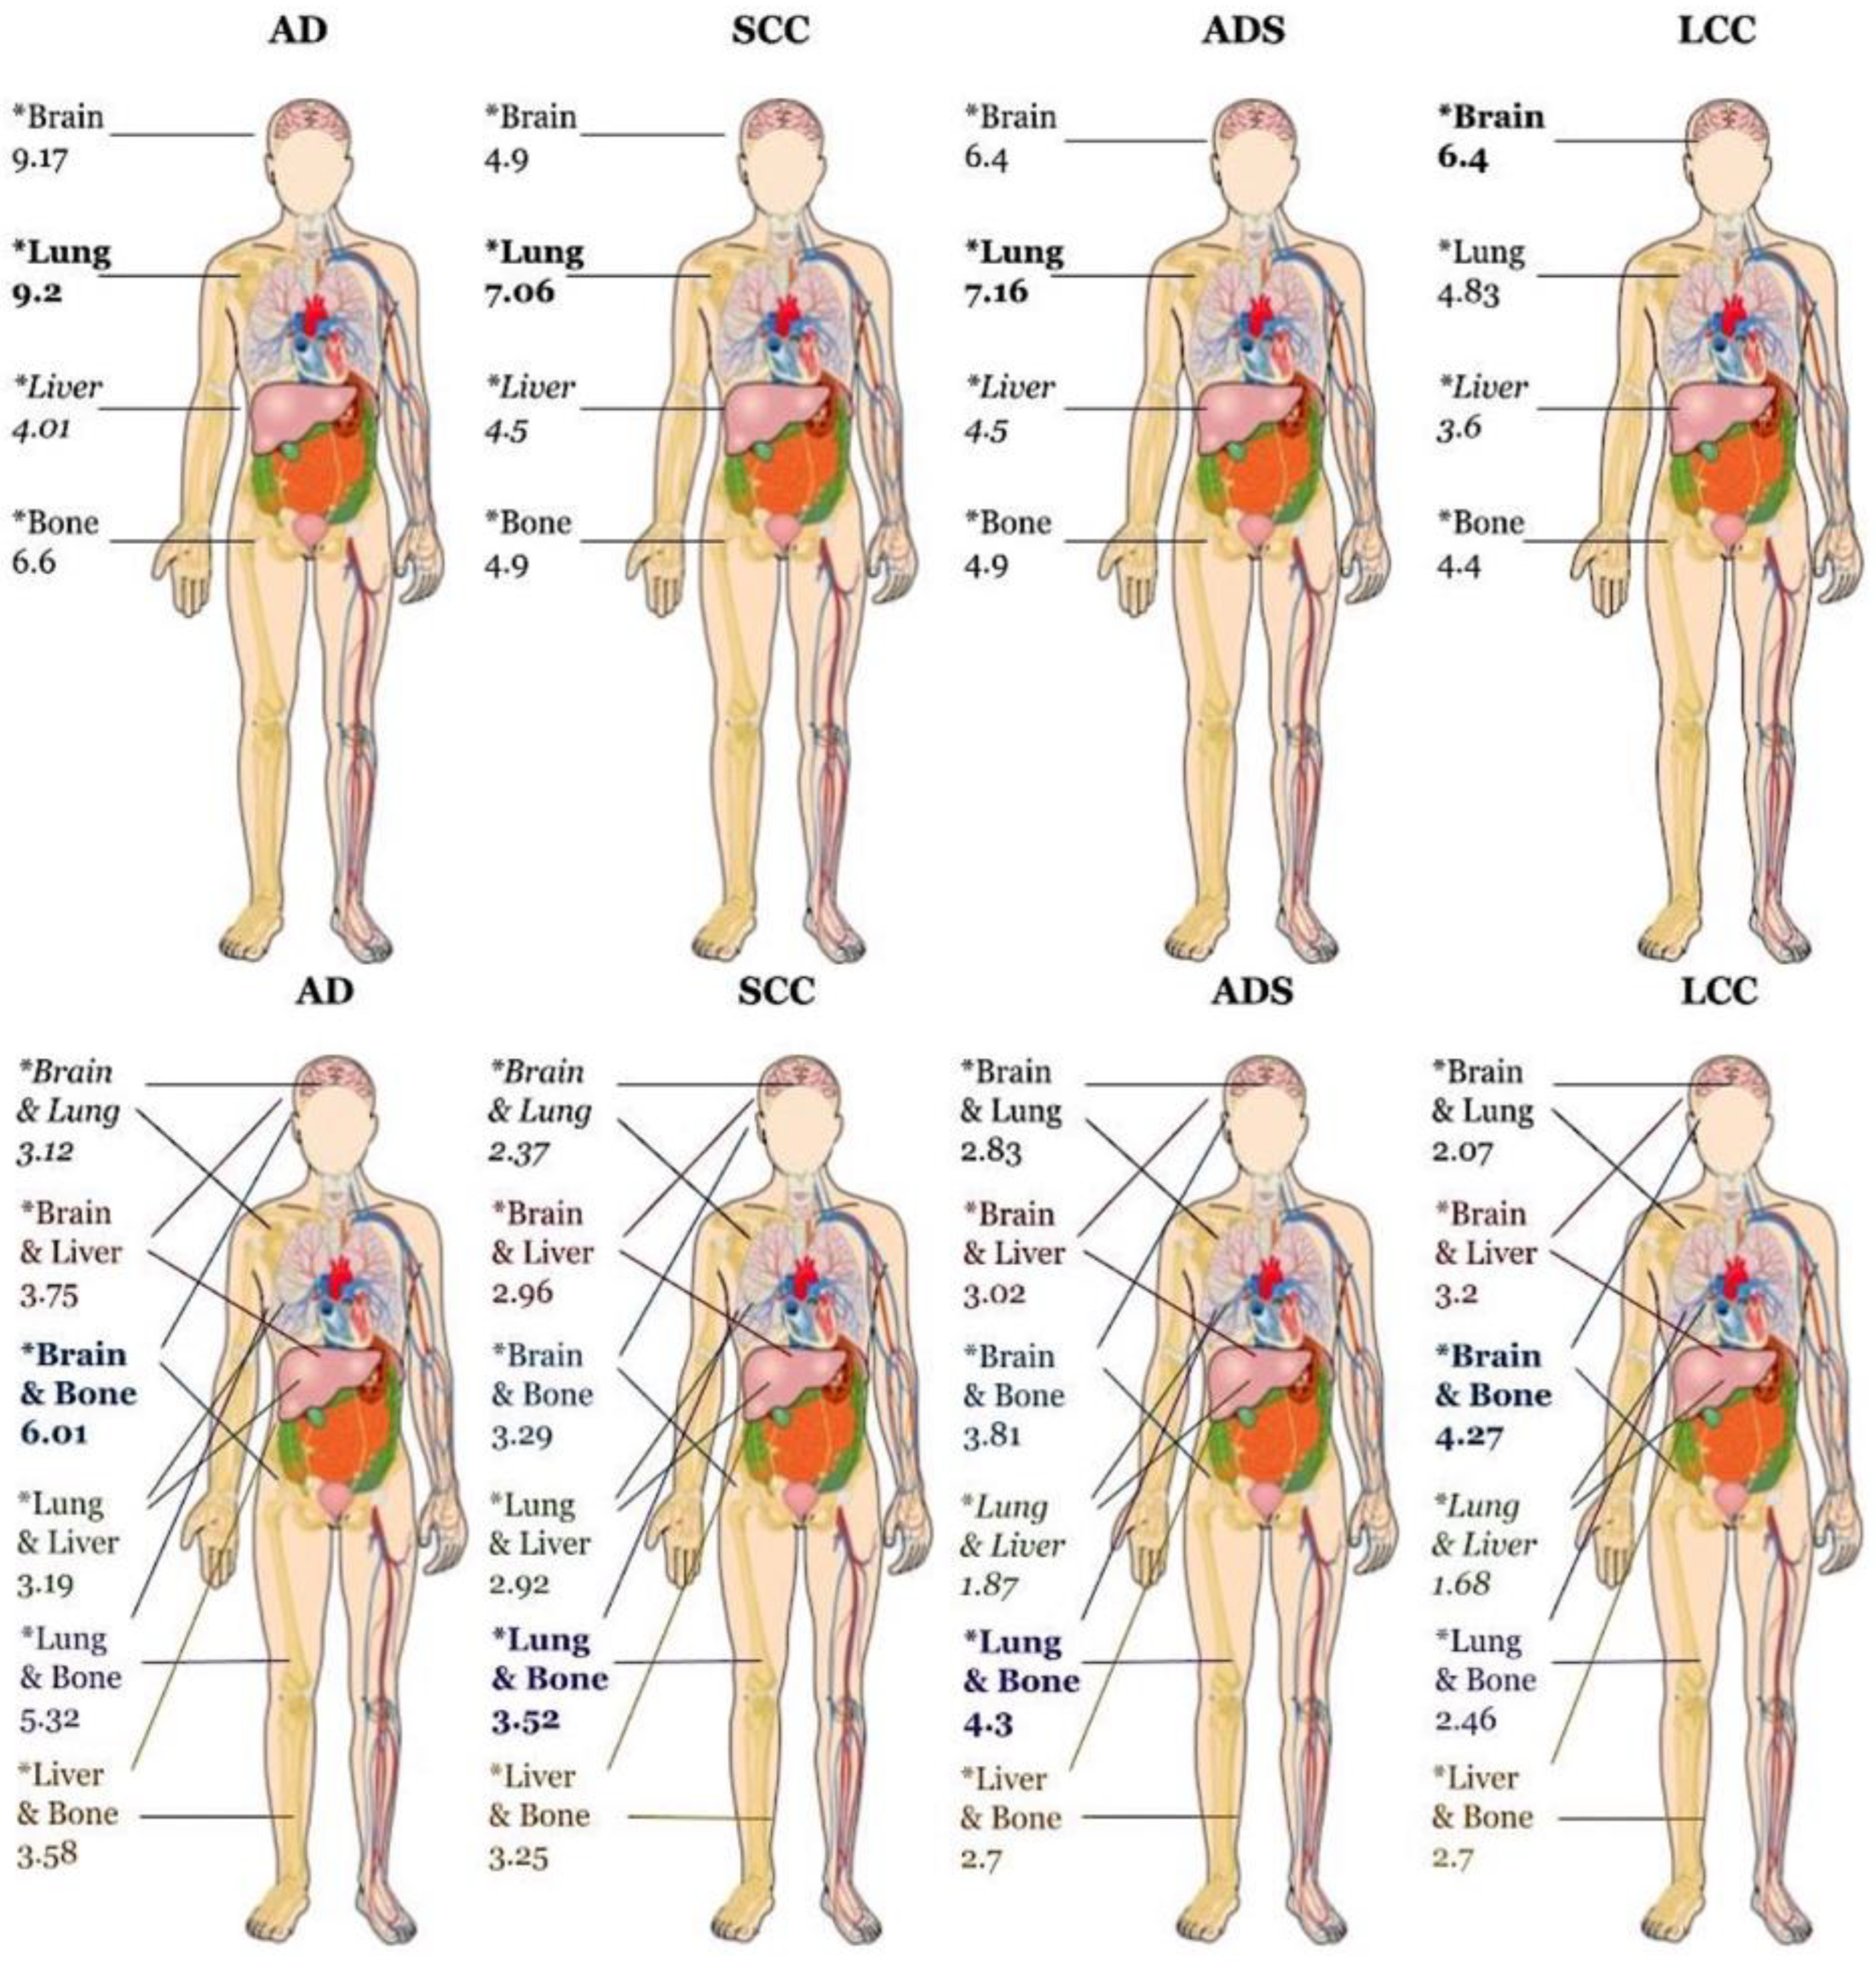

Table 1.
Baseline characteristics for study cohort by histologic subtype.
| Factor | Level | Adenocarcinoma (AD) | Squamous Cell Carcinoma (SCC) | Adenosquamous Carcinoma (ADS) | Large Cell Carcinoma (LCC) |
|---|---|---|---|---|---|
| N | 202,909 | 71,622 | 4,471 | 11,311 | |
| Age at Diagnosis, mean (SD) | 65.7 (11.4) | 68.0 (10.4) | 66.6 (11.2) | 65.1 (11.1) | |
| Sex | Male | 103,467 (51.0%) | 46,163 (64.5%) | 2,528 (56.5%) | 6,722 (59.4%) |
| Female | 99,442 (49.0%) | 25,459 (35.5%) | 1,943 (43.5%) | 4,589 (40.6%) | |
| Race | American Indian | 534 (0.3%) | 247 (0.3%) | 13 (0.3%) | 34 (0.3%) |
| Asian | 8,136 (4.0%) | 1,363 (1.9%) | 158 (3.5%) | 158 (1.4%) | |
| Black | 25,940 (12.8%) | 9,526 (13.3%) | 519 (11.6%) | 1,472 (13.0%) | |
| White | 165,586 (81.6%) | 59,687 (83.3%) | 3722 (83.2%) | 9,525 (84.2%) | |
| Other | 2,713 (1.3%) | 799 (1.1%) | 59 (1.3%) | 122 (1.1%) | |
| Median Income Quartile | 0-25th Percentile | 40,592 (21.3%) | 17,292 (25.6%) | 958 (22.6%) | 2,900 (26.8%) |
| 26-50th Percentile | 44,341 (23.2%) | 17,266 (25.5%) | 991 (23.3%) | 2,802 (25.9%) | |
| 51-75th Percentile | 44,887 (23.5%) | 15,784 (23.4%) | 1,006 (23.7%) | 2,488 (23.0%) | |
| 76-100th Percentile | 60,969 (32.0%) | 17,248 (25.5%) | 1,292 (30.4%) | 2,626 (24.3%) | |
| Insurance Status | Unknown | 3,401 (1.7%) | 1,172 (1.6%) | 88 (2.0%) | 208 (1.8%) |
| Not insured | 9,772 (4.8%) | 3,189 (4.5%) | 190 (4.2%) | 630 (5.6%) | |
| Private or Government Insurance | 68,154 (33.6%) | 17,989 (25.1%) | 1,398 (31.3%) | 3,636 (32.1%) | |
| Medicaid | 18,481 (9.1%) | 6,195 (8.6%) | 383 (8.6%) | 1,063 (9.4%) | |
| Medicare | 103,101 (50.8%) | 43,077 (60.1%) | 2,412 (53.9%) | 5,774 (51.0%) | |
| Facility Type | Community Cancer Program | 15,553 (7.7%) | 7,135 (10.0%) | 404 (9.1%) | 896 (8.0%) |
| Comprehensive Community Cancer Program | 80,972 (40.3%) | 30,510 (42.7%) | 2,094 (47.3%) | 5,141 (45.9%) | |
| Academic/Research Program | 65,426 (32.6%) | 20,160 (28.2%) | 1,216 (27.4%) | 2,561 (22.8%) | |
| Integrated Network Cancer Program | 38,806 (19.3%) | 13,582 (19.0%) | 717 (16.2%) | 2,613 (23.3%) | |
| Great Circle Distance, mean (SD) | 27.0 (108.1) | 23.8 (86.4) | 26.0 (100.9) | 24.9 (89.2) | |
| Charlson-Deyo Comorbidity Score | Total Score of 0 | 130,278 (64.2%) | 39,801 (55.6%) | 2,805 (62.7%) | 6,819 (60.3%) |
| Total Score of 1 | 48,076 (23.7%) | 20,076 (28.0%) | 1,094 (24.5%) | 3,037 (26.8%) | |
| Total Score of 2 | 16,222 (8.0%) | 7,870 (11.0%) | 388 (8.7%) | 999 (8.8%) | |
| Total Score ≥3 | 8,333 (4.1%) | 3,875 (5.4%) | 184 (4.1%) | 456 (4.0%) | |
| Year of Diagnosis | 2004 | 7,018 (3.5%) | 3,134 (4.4%) | 124 (2.8%) | 993 (8.8%) |
| 2005 | 7,374 (3.6%) | 3,260 (4.6%) | 133 (3.0%) | 966 (8.5%) | |
| 2006 | 7,680 (3.8%) | 3,317 (4.6%) | 141 (3.2%) | 859 (7.6%) | |
| 2007 | 8,430 (4.2%) | 3,562 (5.0%) | 172 (3.8%) | 916 (8.1%) | |
| 2008 | 10,922 (5.4%) | 4,454 (6.2%) | 234 (5.2%) | 990 (8.8%) | |
| 2009 | 12,756 (6.3%) | 5,157 (7.2%) | 301 (6.7%) | 920 (8.1%) | |
| 2010 | 15,134 (7.5%) | 5,629 (7.9%) | 373 (8.3%) | 905 (8.0%) | |
| 2011 | 16,057 (7.9%) | 5,669 (7.9%) | 365 (8.2%) | 796 (7.0%) | |
| 2012 | 17,256 (8.5%) | 5,884 (8.2%) | 452 (10.1%) | 728 (6.4%) | |
| 2013 | 18,823 (9.3%) | 6,210 (8.7%) | 442 (9.9%) | 684 (6.0%) | |
| 2014 | 19,645 (9.7%) | 6,397 (8.9%) | 441 (9.9%) | 692 (6.1%) | |
| 2015 | 20,121 (9.9%) | 6,351 (8.9%) | 437 (9.8%) | 651 (5.8%) | |
| 2016 | 20,728 (10.2%) | 6,241 (8.7%) | 468 (10.5%) | 624 (5.5%) | |
| 2017 | 20,965 (10.3%) | 6,357 (8.9%) | 388 (8.7%) | 587 (5.2%) | |
| T Stage | 1A | 3,545 (2.1%) | 595 (1.0%) | 46 (1.2%) | 185 (1.9%) |
| 1B | 11,439 (6.7%) | 1,752 (2.8%) | 177 (4.6%) | 555 (5.8%) | |
| 2A | 15,120 (8.9%) | 2,909 (4.7%) | 258 (6.7%) | 670 (7.0%) | |
| 2B | 22,249 (13.1%) | 5,888 (9.6%) | 476 (12.3%) | 1,129 (11.8%) | |
| 3A | 12,495 (7.4%) | 4,475 (7.3%) | 306 (7.9%) | 700 (7.3%) | |
| 3B | 28,709 (16.9%) | 12,517 (20.3%) | 832 (21.5%) | 1,648 (17.2%) | |
| 3C | 76,184 (44.9%) | 33,518 (54.4%) | 1,774 (45.9%) | 4,710 (49.1%) | |
| N Stage | N0 | 47,208 (23.3%) | 15,402 (21.5%) | 979 (21.9%) | 2,355 (20.8%) |
| N1 | 19,363 (9.5%) | 7,381 (10.3%) | 423 (9.5%) | 1,084 (9.6%) | |
| N2 | 89,248 (44.0%) | 33,615 (46.9%) | 2,012 (45.0%) | 5,328 (47.1%) | |
| N3 | 47,090 (23.2%) | 15,224 (21.3%) | 1,057 (23.6%) | 2,544 (22.5%) | |
| Tumor Grade | Well Differentiated | 5173 (2.5%) | 937 (1.3%) | 17 (0.4%) | 16 (0.1%) |
| Moderately Differentiated | 20,934 (10.3%) | 12,462 (17.4%) | 301 (6.7%) | 43 (0.4%) | |
| Poorly Differentiated | 48,835 (24.1%) | 22,411 (31.3%) | 1,723 (38.5%) | 3,161 (27.9%) | |
| Undifferentiated, Anaplastic | 891 (0.4%) | 433 (0.6%) | 52 (1.2%) | 2,069 (18.3%) | |
| Undetermined, High-Grade Dysplasia | 127,076 (62.6%) | 35,379 (49.4%) | 2,378 (53.2%) | 6,022 (53.2%) | |
| Treatment | Received Medical Treatment | 926 (0.5%) | 162 (0.2%) | 9 (0.2%) | 19 (0.2%) |
| No Medical Treatment Received | 201,983 (99.5%) | 71,460 (99.8%) | 4,462 (99.8%) | 11,292 (99.8%) | |
| Metastasis Pattern | Bone Only | 22,874 (22.7%) | 7,906 (24.4%) | 612 (26.1%) | 629 (16.6%) |
| Brain Only | 21,343 (21.2%) | 4,734 (14.6%) | 478 (20.4%) | 1,052 (27.7%) | |
| Liver Only | 4,115 (4.1%) | 2,820 (8.7%) | 121 (5.2%) | 409 (10.8%) | |
| Lung Only | 15,635 (15.5%) | 7,742 (23.9%) | 334 (14.3%) | 388 (10.2%) | |
| Brain & Lung | 4,329 (4.3%) | 853 (2.6%) | 80 (3.4%) | 115 (3.0%) | |
| Brain & Liver | 1,654 (1.6%) | 548 (1.7%) | 42 (1.8%) | 153 (4.0%) | |
| Brain & Bone | 7,843 (7.8%) | 1,249 (3.9%) | 169 (7.2%) | 174 (4.6%) | |
| Lung & Liver | 1,499 (1.5%) | 756 (2.3%) | 34 (1.5%) | 97 (2.6%) | |
| Lung & Bone | 6,737 (6.7%) | 1,884 (5.8%) | 148 (6.3%) | 140 (3.7%) | |
| Liver & Bone | 5,517 (5.5%) | 2,099 (6.5%) | 120 (5.1%) | 315 (8.3%) |
Table 2.
Patterns of single site metastasis by histologic subtype.
| *aOR (P-Value; 95% Confidence Intervals) | ||||
|---|---|---|---|---|
| Metastatic Site | ||||
| Histology Subtype | Bone | Brain | Lung | Liver |
| AD | 1.0 (Reference) | 1.0 (Reference) | 1.0 (Reference) | 1.0 (Reference) |
| SCC | 1.01 (0.76; 0.97-1.04) | 0.68 (<0.0001; 0.65-0.71) | 1.27 (<0.0001; 1.22-1.32) | 1.9 (<0.0001; 1.81-2.05) |
| ADS | 1.28 (<0.0001; 1.14-1.44) | 1.10 (0.16; 0.97-1.25) | 1.01 (0.84; 0.88-1.17) | 1.49 (<0.0001; 1.21-1.80) |
| LCC | 0.75 (<0.0001; 0.68-0.84) | 1.20 (<0.0001; 1.09-1.31) | 0.67 (<0.0001; 0.59-0.76) | 2.48 (<0.0001; 2.17-2.83) |
| *Adjusted for: age, sex, race, median income by quartile, insurance status, hospital facility type, living distance | ||||
| from hospital, CDCC score, year of diagnoses, t stage, n stage, and grade (medical treatment was excluded from | ||||
| model due to <0.5% of the population receiving any medical treatment) | ||||
Table 3.
Patterns of metastatic site cooccurrence by initial metastatic site.
| *aOR (P-Value; 95% Confidence Intervals) | ||||
|---|---|---|---|---|
| Initial Metastatic Site | ||||
| Concurrent Metastatic Site | Bone | Brain | Lung | Liver |
| Bone | -- | 0.95(<0.0001; 0.93-0.97) | 1.27 (<0.0001; 1.24-1.30) | 3.34 (<0.0001; 3.26- 3.43) |
| Brain | 0.95 (<0.0001; 0.93-0.98) | -- | 1.03 (0.014; 1.01-1.06) | 1.33 (<0.0001; 1.30-1.37) |
| Lung | 1.30 (<0.0001; 1.27-1.33) | 1.06 (<0.0001; 1.03-1.09) | -- | 1.56 (<0.0001; 1.52-1.61) |
| Liver | 3.37 (<0.0001; 3.28-3.46) | 1.32 (<0.0001; 1.28-1.35) | 1.51 (<0.0001; 1.47-1.56) | -- |
| *Adjusted for: age, sex, race, median income by quartile, insurance status, hospital facility type, living distance | ||||
| from hospital, CDCC score, year of diagnoses, t stage, n stage, and grade (medical treatment was excluded from | ||||
| model due to <0.5% of the population receiving any medical treatment) | ||||
Table 4.
Survival for single and dual site metastasis by histologic with associated adjusted hazard ratio.
Table 4.
Survival for single and dual site metastasis by histologic with associated adjusted hazard ratio.
|
*aHR (95% Confidence Intervals) Median Survival in Months (95% Confidence Intervals; Number of Patients) |
||||||||||||
|---|---|---|---|---|---|---|---|---|---|---|---|---|
| Metastatic Site and Overall Survival | ||||||||||||
| Histologic Subtype | Bone | Median Survival | Brain | Median Survival | Lung | Median Survival | Liver | Median Survival | ||||
| AD | 1.08* (1.06-1.10) |
6.6* (6.44-6.77; 22,872) |
0.95* (0.93-0.97) |
9.17* (8.9-9.43; 21,340) | 0.79* (0.77-0.81) | 9.2* (8.87-9.53; 15,635) | 1.28* (1.23-1.33) | 4.01* (3.68-4.27; 4,113) |
||||
| SCC | 1.17* (1.13-1.21) |
4.9* (4.44-4.8; 7,906) |
1.18 (1.14-1.23) |
4.9* (4.7-5.13; 4,732) |
0.82* (0.80-0.85) | 7.06* (6.8-7.36; 7,742) | 1.19* (1.24-1.25) | 4.5* (4.24-4.93; 2,819) | ||||
| ADS | 1.73** (1.04-1.33) |
4.9** (4.2-5.49; 612) |
0.97 (0.85-1.11) |
6.4** (5.16-7.4; 477) | 0.78** (0.67-0.91) | 7.16** (5.75-8.11; 344) | 1.10 (0.88-1.37) | 4.5** (3.06-6.64; 121) | ||||
| LCC | 1.03 (0.93-1.14) | 4.4* (3.84-5.06; 629) |
0.93 (0.86-1.03) |
6.4* (5.59-7.2; 1,052) | 0.81*** (0.72-0.93) | 4.83* (3.84-6.21; 387) | 1.20*** (1.06-1.36) | 3.6* (2.6-5.06; 409) | ||||
|
*aHR (95% Confidence Intervals) Median Survival in Months (95% Confidence Intervals; Number of Patients) |
||||||||||||
| Metastatic Sites and Overall Survival | ||||||||||||
| Histologic Subtype | Brain & Lung | Median Survival | Brain & Liver | Median Survival | Brain & Bone | Median Survival | Lung & Liver | Median Survival | Lung & Bone | Median Survival | Liver & Bone | Median Survival |
| AD | 0.89* (0.88-0.91) |
3.12* (2.76-3.52; 781) |
1.02 (0.99-1.04) |
3.75* (3.38-4.24; 1,654) |
1.05* (1.03-1.07) | 6.01* (5.78-6.28; 7,843) | 0.89* (0.88-0.91) | 3.19* (2.79-3.68; 1,499) | 0.97* (0.96-0.97) | 5.32* (4.99-5.55; 6,737) | 1.17* (1.15-1.19) | 3.58* (3.4-3.81; 5,517) |
| SCC | 0.96** (0.93-0.98) | 2.37* (1.91-2.79; 211) |
1.22* (1.18-1.26) |
2.96* (2.66-3.3; 548) |
1.21* (1.18-1.24) | 3.29* (3.09-3.55; 1,249) | 0.91* (0.89-0.94) | 2.92* (2.6-3.22; 755) | 0.99 (0.97-1.02) | 3.52* (3.35-3.81; 1,884) | 1.23* (1.20-1.26) | 3.25* (3.06-3.4; 2,099) |
| ADS | 0.93 (0.84-1.03) | 2.83** (1.31-6.47; 13) |
1.03 (0.91-1.16) |
3.02** 2.1-4.4; 42) |
1.13*** (1.02-1.24) | 3.81** (2.99-5.32; 169) | 0.89 (0.79-1.02) | 1.87** (1.48-4.3; 34) | 1.01 (0.91-1.12) | 4.3** (3.35-5.52; 148) | 1.21* (1.09-1.36) | 2.7** (2.3-4.37; 120) |
| LCC | 0.91**** (0.84-0.99) | 2.07*** (1.54-3.52; 43) |
1.04 (0.96-1.13) |
3.2*** (2.53-4.67; 153) | 0.99 (0.993-1.07) | 4.27*** (3.4-5.03; 174) | 1.03 (0.94-1.13) | 1.68*** (1.28-2.86; 97) | 0.97 (0.89-1.05) | 2.46*** (2.0-3.38; 140) | 1.16* (1.07-1.26) | 2.7*** (2.23-3.35; 315) |
|
Hazard ratio compares involved vs noninvolved site of metastasis and is adjusted for by: age, sex, race, median income by quartile, insurance status, hospital facility type, living distance from hospital, CDCC score, year of diagnoses, T stage, N stage, and grade. *p-value <0.0001, **p-value <0.001, ***p-value <0.01, **** p-value <0.05 |
||||||||||||
Disclaimer/Publisher’s Note: The statements, opinions and data contained in all publications are solely those of the individual author(s) and contributor(s) and not of MDPI and/or the editor(s). MDPI and/or the editor(s) disclaim responsibility for any injury to people or property resulting from any ideas, methods, instructions or products referred to in the content. |
© 2025 by the authors. Licensee MDPI, Basel, Switzerland. This article is an open access article distributed under the terms and conditions of the Creative Commons Attribution (CC BY) license (http://creativecommons.org/licenses/by/4.0/).
Copyright: This open access article is published under a Creative Commons CC BY 4.0 license, which permit the free download, distribution, and reuse, provided that the author and preprint are cited in any reuse.


