Submitted:
08 November 2025
Posted:
10 November 2025
You are already at the latest version
Abstract
This paper presents the development and evaluation of a simulation framework simV2X, designed to model the interaction between vehicles, roadside infrastructure, and network components within Intelligent Transportation Systems (ITS). The study focuses on the integration of fog and edge computing paradigms in V2X communication architectures to improve reliability, scalability, and responsiveness in urban environments. The modular architecture of simV2X, implemented in Python using FastAPI and OpenLayers, supports step-by-step simulation, data visualization, and real-time event logging via an SQLite database. Key performance indicators such as SNR, BER, PER, PDR are computed to evaluate communication quality under different propagation conditions. A specific simulation scenario examines the efficiency of a mobile fog node (mRSU) acting as a relay between an OBU and a stationary RSU. The results show that under non-line-of-sight (NLOS) conditions, direct OBU–RSU communication experiences rapid signal degradation, while the use of a mobile relay significantly extends the coverage area and maintains stable connectivity. The conducted experiments confirm that mobile fog nodes can enhance network reliability in dense urban environments, provided that line-of-sight connections are preserved. The proposed simV2X framework enables reproducible simulation of V2X communication and can serve as a foundation for developing adaptive algorithms for relay selection and predictive mobility management in cooperative, connected, and automated mobility (CCAM) systems.
Keywords:
vehicular communications
; vehicle-to-everything
; vehicular computing
; simulation system
1. Introduction
Intelligent Transportation Systems (ITS) have become an essential component in the organization of modern urban infrastructure. The main research objectives in the field of ITS include enhancing road safety, improving traffic management efficiency, and analyzing system resilience through the integration of communication, sensing, and computing technologies. In this context, the connection between vehicles and infrastructure objects (Vehicle-to-Everything, V2X) plays a crucial role, enabling real-time data exchange between vehicles (Vehicle-to-Vehicle, V2V), infrastructure (Vehicle-to-Infrastructure, V2I), pedestrians (Vehicle-to-Pedestrian, V2P), and networks (Vehicle-to-Network, V2N) [1]. The primary goal of developing V2X solutions is to provide vehicles with information about the current road situation and to create a platform for collaborative decision-making. V2X can be considered the foundation of Cooperative, Connected, and Automated Mobility (CCAM). At the same time, the increasing complexity and scalability of ITS require not only reliable wireless communication but also distributed computing architectures capable of processing massive data streams with low latency and high fault tolerance [2]. Edge Computing (EC) has become a key technological enabler for next-generation ITS, addressing the limitations of cloud-oriented architectures. In traditional cloud-based solutions, vehicle data is sent to remote data centers for processing, which introduces unacceptable latency for time-critical applications, such as collision avoidance systems, platooning, and real-time dynamic route optimization [3]. The use of edge computing eliminates these shortcomings by deploying computing and storage resources closer to data sources — in roadside units (RSU), base stations (BS), or even within the vehicles themselves (Onboard Unit, OBU). This paradigm enables decision-making within milliseconds, supports context-aware analytics, and reduces the load on the transit network [4].
In a V2X system, edge nodes (EN) act as local decision-making centers that aggregate sensor data from multiple vehicles and infrastructure elements. By performing primary data structuring and management, these nodes enable real-time coordination between vehicles, increase reliability under unstable connectivity conditions (for example, in urban environments), and facilitate scalability in high-traffic scenarios. Moreover, ENs often implement microservice-based architectures, allowing flexible reconfiguration according to network load and traffic dynamics. Several studies have shown that vehicular networks supported by edge devices can reduce end-to-end latency by up to 60% and improve reliability in high-mobility environments [5].
Additionally, recent studies [6] have shown that edge computing in V2X testbeds achieves over 95% packet delivery in simulated urban scenarios, although real-world performance is expected to decrease to 85–90% due to interference during data transmission. The use of EC improves scalability in noisy urban environments, where the high density of vehicles generates large volumes of data, and mitigates bandwidth limitations caused by heavy communication channel loads. However, employing edge computing in resource-constrained environments introduces several challenges, necessitating efficient resource allocation strategies to maintain computational balance.
To address these challenges, the Fog Computing (FC) paradigm has been proposed, serving as an intermediate layer between edge devices and the cloud and offering a distributed computational infrastructure. Fog nodes (FN), typically deployed on mobile roadside units (mRSU) or stationary roadside units (RSU), aggregate and process data collected from multiple edge devices, performing tasks such as traffic flow optimization, load balancing, and transmission or caching of critical system information.
While EC focuses on localized data processing, FC extends this concept by introducing a hierarchical and collaborative structure between EN and FN [7]. The multithreaded organization of FC enables precise control over where and when data is processed, supporting both global and local tasks [8].
The use of fog computing helps overcome several limitations of edge devices–for example, constraints related to computational capacity or energy resources.
Researchers in [9] describe a model utilizing fog-based visualization tools in the Smart Highway testbed, designed for monitoring hybrid V2X communications, demonstrating their functionality, and testing real-time performance. The application of FC enables a hierarchical data processing framework in which time-sensitive tasks are handled at the edge, while data analytics such as machine learning–based traffic prediction is performed at fog nodes. This organizational scheme enhances system resilience and supports hybrid V2X communication protocols.
A brief comparative analysis of the discussed paradigms is presented in Table 1.
Main advantages and disadvantages of using Fog Computing compared to Edge Computing presented in Table 2.
The conducted comparison allows us to conclude that the use of FC ensures the continuity of resource exchange among EN, FN, and the cloud, providing a flexible system management model for the joint deployment and coordination of vehicle interactions and traffic management in urban networks. In V2X systems, fog nodes often perform intermediate-level functions such as data aggregation, preprocessing, security analysis, and content distribution. They also act as coordinators for heterogeneous networks, ensuring seamless interaction among them [10]. Additionally, fog computing enhances the resilience and adaptability of ITS by providing local backup capabilities in the event of cloud outages or network integrity failures [11].
Intelligent Transportation Systems represent a multi-layered cyber-physical system that integrates vehicles, infrastructure, and control centers through advanced communication and computing technologies. Modern ITS architectures utilize V2X systems in conjunction with edge computing, machine learning, and predictive analytics to achieve the required level of control [12]. By combining local intelligence with global coordination, ITS can dynamically optimize traffic flow, reduce congestion, and improve road safety under complex urban conditions.
In modern environments, vehicles and infrastructure continuously exchange information about system states, enabling the formation of a comprehensive ecosystem view and supporting accurate and efficient decision-making. Applications related to adaptive traffic signal control, priority routing for emergency vehicles, and collision prediction rely on low-latency data exchange through V2X interfaces supported by edge and fog nodes [1].
The integration of Artificial Intelligence (AI) methods enables these systems to learn from traffic statistics, adapt to environmental changes, and construct predictive models in real time. For instance, study [12] analyzes an AI-based strategy for optimizing a V2X system, emphasizing the importance of data-driven resource allocation based on vehicle connectivity, position, and load.
To fully realize the potential of ITS, increasing attention is being given to integrated architectures that combine communication, computation, and control. These comprehensive approaches merge edge computing with traditional cloud paradigms to ensure scalability, interoperability, and Quality of Service (QoS). Such hybrid systems provide distributed management resources and coordinate actions between local vehicle clusters and global traffic management platforms [2,4,9].
To validate these integrated approaches, numerous experimental platforms and testbeds have been developed. Real V2X test sites such as SVEA, Smart Highway, and 5G-CCAM infrastructures provide valuable insights into latency, reliability, and scalability under real-world conditions. These environments demonstrate the interaction framework between EN and FN, support real-time safety applications, and enable model-based data management [5,7].
Despite significant progress in this field, several challenges remain unresolved. These include the development of a comprehensive real-time V2X management model incorporating fog and edge computing paradigms, secure data management with privacy preservation in heterogeneous networks, and efficient task offloading under dynamic mobility conditions. Addressing these issues requires advanced networking technologies as well as mathematical and algorithmic models capable of representing the interactions among communication, computation, and control layers within a unified framework.
The efficiency of such systems depends on their ability to manage distributed resources, ensure ultra-reliable low-latency communication, and coordinate decision-making between vehicles and infrastructure. The creation of software solutions that support simulation modeling is one of the main tools used to validate theoretical results. The high cost and complexity of real-world testing encourage researchers to develop testbeds instead. The need to incorporate the fog computing paradigm into the well-established edge–cloud architecture serves as additional motivation for designing new platforms and computational models capable of capturing the system’s real performance.
This study aims to describe the developed simulation model, its implementation, and the experimental verification of a system designed to support cooperative, connected, and automated mobility scenarios.
The remainder of this paper is structured as follows: Section 1 presents a review of the existing literature in the relevant research domain. Section 2 provides a brief description of the most widely used simulation models. Section 3 gives an overview of the simV2X software suite, describing its implementation structure, general framework, key simulation parameters, and main tasks and solution methods. Section 4 presents the simulation scenario, while Section 5 provides its analysis and numerical results aimed at validating theoretical findings under various system configurations. Finally, the concluding section offers several remarks and conclusions.
2. Related Works
In recent years, extensive research has been conducted on test platforms and experimental testbeds that enable real-time data exchange between vehicles. These efforts form the foundation for analyzing and validating the functionality of Cooperative, Connected, and Automated Mobility (CCAM) technologies. Current studies focus on addressing two key objectives: ensuring the reproducibility of experiments under controlled conditions, and transferring simulation results from testbeds to real-world driving environments with maximum accuracy.
Below are some of the most significant approaches implemented as hardware–software solutions for testing, visualization, and analysis of V2X systems and communications.
One of the most comprehensive approaches to solving these problems is described in [6]. The authors developed an integrated “simulation–field testing” model that enables a seamless transition from virtual scenarios to real-world autonomous driving system experiments. The system architecture includes a road environment simulator, a middleware layer for generating and routing V2X messages, and communication modules (OBU/RSU). Special attention is given to synchronizing the time scales between virtual and physical models. The software allows simulation-generated messages to be integrated into the radio channel in real time. The system is equipped with performance analysis tools (latency, packet loss rate), which make it possible to compare data obtained from simulation modeling with that from field trials. The results presented by the authors demonstrate that the simulated scenarios are reproducible. This reproducibility enables identification of discrepancies between simulated and real communication channels, including the effects of interference and jitter. Thus, the authors establish a foundation for developing hybrid testing methodologies that combine the advantages of testbed-based analysis and real-world data collection.
An alternative study [9] focuses on visualization and interactive monitoring of V2X messages. The approach taken in this work significantly facilitates debugging and verification of communication protocols. The authors present a universal software environment designed for analyzing and displaying V2X message flows within the Smart Highway infrastructure. The developed software solution can intercept, decode, and visualize in real time messages based on the ETSI ITS-G5 and C-V2X standards. Data visualization is carried out on a geographic map, with message filtering supported by type (CAM, DENM, SPAT/MAP). The system can replay message exchange sequences and detect inconsistencies between reported and actual GPS positions. The proposed flexible web interface and log export tools greatly enhance system observability and reduce diagnostic time. This approach is of significant importance for ensuring transparency and reproducibility of experiments on V2X testbeds.
A crucial contribution to the development of comprehensive V2X system evaluation methodology was made in [13]. The authors proposed a platform for analyzing the performance of network stacks implementing ITS-G5 and C-V2X protocols, with the ability to adjust physical and data-link layer parameters in a controlled manner. The system consists of real OBU/RSU devices, load generators, and automation tools for conducting experiments. The proposed method measures key performance metrics – packet delivery ratio (PDR), latency, jitter, and throughput – under various traffic and vehicle density scenarios. The results demonstrated a substantial impact of hardware limitations and radio channel characteristics on data transmission reliability and identified threshold parameter values required to ensure the desired Quality of Service (QoS) for different classes of applications. Notably, this study established a reproducible experimental framework for quantitative analysis of V2X system performance.
A number of studies have focused on supporting autonomous vehicles. For example, [14] describes a test platform designed to evaluate the interaction between autonomous vehicles and elements of road infrastructure. The architecture includes roadside units, edge computing servers, and interfaces for interaction with autonomous driving systems. Special attention is given to the use of SPAT and MAP messages to improve traffic signal phase prediction and vehicle movement control. Experimental results confirm the hypothesis that the presence of these messages reduces uncertainty in trajectory planning and increases maneuver safety. Unlike the experimental tests described in [13], this study focuses on the integration of communication and application layers, which is crucial for the comprehensive evaluation of autonomous driving systems.
Another important approach to evaluating interaction parameters in V2X systems involves the development of open and modular platforms. In [15], the authors proposed the SVEA universal experimental testbed, designed to assess typical scenarios for V2X communications. The platform supports multiple radio interfaces (ITS-G5, C-V2X), provides an API for rapid scenario configuration and automated data collection. One of SVEA’s key features is its focus on live experiment reproducibility and retrospective experiment analysis – all environmental parameters and configurations are stored for future comparisons. Several example scenarios are implemented to demonstrate how communication characteristics affect safety indicators. The study highlights the importance of developing universal methodologies and promoting open experimental data exchange to accelerate CCAM research.
The latest generation of testing frameworks is presented in [16]. The authors focused on evaluating the performance of next-generation wireless systems, including NR-V2X and hybrid 5G technologies, in cooperative driving applications. The developed system combines hardware components (OBU/RSU with modern PHY support) and software tools for channel characterization, interference analysis, and load monitoring. Tests were conducted both in laboratory settings and real urban environments. The obtained results provide a quantitative assessment of reliability and latency in high-traffic-density scenarios. The authors propose design recommendations for CCAM systems. This study stands out for its scope and relevance, demonstrating a transition from experimental prototypes to industrial standards for V2X communication testing.
A comparative analysis of these studies reveals the evolution of test platforms from localized, protocol-specific setups to comprehensive systems. Studies [6,14,16] emphasize transitioning models into physical environments, establishing the «simulation-to-road» practice. Tools discussed in [9] enable visualization, while research in [13,15] advances methods for quantitative performance evaluation and reproducibility. A common trend across all directions is the pursuit of standardized testing methodologies and expanded scenario coverage – from fundamental safety tasks to higher-level goals of autonomous planning and cooperative perception.
Despite considerable progress, challenges remain in scaling testbed experiments and adapting test environments to rapidly evolving radio standards (5G NR-V2X, 6G). The issue of data reproducibility across different system and equipment configurations also requires further attention. In this context, promising directions include the development of unified interfaces between simulators and real devices, the application of Digital Twin technologies, and the use of open platforms such as SVEA for cross-comparison of experimental results.
In conclusion, the modern V2X testbed ecosystem provides a foundation for reliable and standardized evaluation of CCAM systems. The evolution of tools from isolated laboratory experiments to fully integrated environments enables systematic analysis across all layers – from the physical channel to autonomous control applications. Such advancements pave the way for the development of unified testing standards and accelerate the transfer of research technologies into real transportation systems.
3. Overview of Simulation Models
Simulation modeling (SM) is a research method for studying complex systems by creating a model that reproduces their behavior over time under approximate or virtual conditions. In the context of communication systems and transport networks, simulation modeling makes it possible to study data transmission characteristics in dynamic scenarios (such as vehicle movement, varying distances, and communication interruptions), analyze network behavior under different parameters, and evaluate reliability, latency, and end-to-end throughput.
SM can be performed using either discrete-time modeling, where objects interact within a computational environment based on a time step, or real-time modeling, which proceeds without discrete time, i.e., synchronized with actual system time.
In discrete-time simulation, the model produces identical results for the same input data. It allows time scaling – speeding up or slowing down – to support large-scale scenarios involving hundreds or thousands of nodes, which would be impossible to simulate in real time.
Real-time modeling, in contrast, operates synchronously with system clocks – each event or frame is simulated on the fly in accordance with system time. This approach is used, for example, in testbeds and hybrid digital twins, where the simulator is directly connected to physical devices. Integration with RSUs, OBUs, mRSUs, sensors, and controllers is possible. This type of simulation is suitable for testing control systems that require immediate response to changing real-world conditions.
Modern simulation tools can be broadly classified into three groups:
- Universal platforms for system dynamics and agent-based modeling.
- Network simulators and frameworks for communication protocol modeling.
- Transportation simulators and hybrid interaction environments.
To the first group belongs software such as AnyLogic – a commercial multi-paradigm modeling environment that supports discrete-event simulation (DES), agent-based modeling (ABM), and system dynamics (SD). It can be used for simulating traffic flows, logistics processes, control systems, and urban infrastructures.
The second group includes modular libraries and frameworks such as OMNeT++ and the NS-3 network simulator. OMNeT++ is one of the most advanced platforms for modeling telecommunication systems. It implements a discrete-event architecture and a modular structure: each network entity (node, channel, packet) is represented as an independent module with configurable parameters. Several frameworks for V2X simulation have been developed based on OMNeT++:
- ○
- INET Framework – for modeling IP networks, Wi-Fi, LTE, and 5G NR;
- ○
- Veins – for integration with the transportation simulator SUMO to model vehicular movement.
These frameworks allow for high-fidelity modeling of network layers (MAC, PHY, IP, UDP/TCP) while accounting for precise delays, errors, and packet losses.
NS-3 is a tool for simulating network stacks. It includes models of physical layers (Wi-Fi, LTE, 5G NR), MAC protocols, routing algorithms, and transport layers. It can integrate with the Linux network stack, enabling realistic network interaction modeling. NS-3 is suitable for complex experiments at the physical and data-link layers, though it is less compatible with external traffic simulation systems and digital twin frameworks.
The third group, transportation simulators, includes SUMO and SVEA. SUMO (Simulation of Urban Mobility) is an open-source simulator focused on modeling traffic flows and vehicle routing. It is often used as a geometric foundation for network simulators, for example, in conjunction with OMNeT++ through the TraCI (Traffic Control Interface) protocol.
SVEA (Swedish Vehicle Electronics Architecture) is a hardware–software testbed developed at the KTH Royal Institute of Technology (Sweden) for experiments in V2X communications and autonomous driving. Unlike classical software simulators such as OMNeT++, NS-3, or SUMO, SVEA is a physical platform that enables highly realistic experiments with vehicles, RSUs, and communication modules.
The authors previously developed their own simulation tool, VANET 2.0.0 [17], which enabled real-time experimentation and comprehensive analysis of V2X system parameters, focusing on data transmission losses. However, this software module lacked integration capabilities with other platforms and databases.
4. The simV2X Software
Modern research in the field of Intelligent Transportation Systems (ITS) and V2X technologies requires flexible, scalable, and extensible simulation tools.
The presented software package, simV2X [18], has been developed to model interactions between vehicles, road infrastructure elements, and network components in an urban transportation environment. The program is implemented in Python, using FastAPI for server-side logic and OpenLayers for client-side visualization. The road network graph is generated using OpenStreetMap data. The software enables step-by-step simulation of a transportation network, the creation of vehicle movement scenarios, and the management of agent and infrastructure behavior [19,20].
An example of the implemented software visualization is shown in Figure 1.
The architecture of simV2X is modular, ensuring its extensibility and adaptability for various applications. Each key element of the model is represented by a separate software class that implements a specific layer or functional subsystem.
All entities are defined using Pydantic models, which provide strict data typing and serialization during WebSocket/REST communication. As an example, and for database operations, the AppStepSimulatorDB module has been implemented to perform calculations and record them in an SQLite database.
Table 3 presents the main classes implemented in the simV2X simulation module.
The schematic of the simulation model operation is shown in Figure 2.
The simulation results are stored in an SQLite database as tables (Figure 3):
1. packets – all transmitted packets;
2. receptions – reception results including SNR, success status, and airtime;
3. summary – aggregated metrics such as PDR, average SNR, and total airtime.
These data can be exported to CSV, visualized using Python libraries (pandas, matplotlib), or analyzed with third-party software.
Next, we turn to the main components implemented in simV2X.
Signal-to-Noise Ratio (SNR) – the ratio of the useful signal power to the noise power at the receiver, expressed in decibels (dB). In simV2X, this parameter serves as the primary criterion for evaluating radio channel quality and for calculating error probabilities (BER, PER).
The calculation formula is:
where – is the received signal power in dBm, and – is the noise power within the channel bandwidth, calculated as:
where – is the channel bandwidth in Hz.
When SNR > 15 dB, the channel is considered reliable (error probability is low); when SNR < 5 dB, the probability of errors and packet losses increases; and when SNR drops below the receiver sensitivity threshold for the given Modulation and Coding Scheme (MCS), transmission becomes impossible. SNR directly affects the Bit Error Rate (BER) and Packet Error Rate (PER), determining the probability of successful packet reception.
Bit Error Rate (BER) – the probability that an individual bit is received incorrectly when transmitted over a radio channel. In simV2X, this parameter is calculated based on the selected modulation scheme and the SNR value.
Packet Delivery Ratio (PDR) – the proportion of successfully delivered packets relative to the total number of transmitted packets during the simulation period.
Packet Error Rate (PER) – the probability that at least one bit in a packet is received in error, meaning the entire packet cannot be decoded correctly.
The calculation formula is:
where – is the duration of the preamble and service fields, – is the number of bits in the packet, – is the effective data rate (considering MAC and spectral efficiency).
Path Loss (PL) – the attenuation of radio signal power between the transmitter and receiver due to propagation effects. In simV2X, both 3GPP and standard logarithmic distance models are implemented. To determine PL, it is necessary to establish whether the communication is Line-of-Sight (LOS) or Non-Line-of-Sight (NLOS). The decision is made based on the spatial position and orientation of the vehicle.
The algorithm for determining device accessibility according to the signal-to-noise ratio and LOS/NLOS conditions is implemented in the simulation model as illustrated in Figure 4.
The algorithm determines which devices (OBU, RSU, mRSU) can “hear” a specific device within the network. Its operation is based on comparing the transmitted signal parameters with the receiver sensitivity thresholds of other devices, as well as considering the distance and angular orientation between objects. The input data for the algorithm are OBJ1, representing the device for which the audible range is being determined, the set NODES, containing all devices in the network, including OBJ1. The variable max defines the number of elements in NODES, while the variable CAN_HEAR is initialized as an empty set that will store all devices capable of receiving a signal from OBJ1, excluding OBJ1 itself.
The algorithm iterates over all elements of NODES. For each device, it checks whether the device coincides with OBJ1; if it does, the iteration is skipped, since a device cannot transmit to itself. Otherwise, an auxiliary function (denoted as func in Figure 4) is called to compute the signal level received by device OBJ2 from the source OBJ1. After obtaining the signal level, the algorithm evaluates the condition: if the sensitivity threshold of the receiver on OBJ2 is lower than the calculated signal level (i.e., the device can successfully receive the transmission), OBJ2 is added to the CAN_HEAR set. After the loop completes, the algorithm returns CAN_HEAR, which contains all devices within the audible range of OBJ1.
The func(OBJ1, OBJ2) function models signal propagation between two devices. It takes the same objects OBJ1 and OBJ2 as input. Inside the function, the distance (length) between the objects and the angle (deg) between their antenna orientations are calculated. Based on the angle value, the type of propagation is determined: if deg ≤ 40°, Line of Sight (LOS) propagation is assumed; otherwise, the signal is considered to experience obstacles, corresponding to Non-Line of Sight (NLOS) conditions. Next, the signal loss function PL corresponding to the selected propagation type is determined, and the resulting received signal level is computed as signal = PL(length), which is then returned to the main algorithm. For signal propagation modeling, additional parameters can be used besides distance (such as antenna gain or environmental factors), but in this scenario, distance alone is considered sufficient. The signal loss function may follow models such as 3GPP, Hata, or other standardized path loss models.
For each node (vehicle or infrastructure unit), the coordinates and the direction of movement (orientation vector, typically expressed as the angle heading_deg) are known. For a pair of nodes A (transmitter) and B (receiver), the direction vector from A to B is computed as:
Next, the deviation angle between the transmitter’s movement direction (vehicle orientation vector) and the direction toward the receiver is determined as:
where – is the unit vector of the transmitter’s movement direction, is the normalized direction vector toward the receiver.
After calculating the angle, it is compared with a predefined threshold value. It is assumed that for NLOS conditions, the deviation exceeds 40°. Thus, if the receiver is located within 40° in front of the vehicle’s direction of motion, the link is considered to have Line of Sight (LOS). If the receiver is positioned behind or at a greater angle, the channel is considered Non-Line of Sight (NLOS). This represents a simplified dynamic method for LOS/NLOS determination. An alternative approach could involve ray casting – tracing rays from the transmitter to the receiver. However, this would require knowledge of the coordinates of potential obstacles along the path.
5. Simulation Scenario
When conducting real-world experiments, it is often necessary to generate preliminary statistical information about various system parameters. For example, to determine the optimal density of RSU deployment at intersections, it is important to assess the impact of line-of-sight conditions on message processing performance.
A scenario was considered (Figure 5) in which the OBU does not have a direct line of sight (LOS) to the RSU, but is within the coverage area of an mRSU, which in turn has LOS connectivity to the RSU. Thus, the communication between OBU and RSU is NLOS (non-line of sight), between mRSU and RSU is LOS, and between OBU and mRSU is also LOS.
The underlying assumption is that data transmission through a LOS–LOS chain may result in lower latency compared to direct transmission over an NLOS link. The schematic of this scenario is shown in Figure 4. In this case, it is also assumed that the mRSU and RSU do not interact with other OBUs. The mRSU acts as a relay, forwarding the request to the RSU without storing any cached results. At the same time, the RSU already contains cached data, eliminating the need to wait for a response from an Edge Server (ES) or cloud infrastructure.
The OBU must be within the coverage area of the RSU, meaning the signal must be “heard” by the receiving unit. The simulation scenario uses the 3GPP urban propagation model to represent signal behavior in the city environment.
The speeds were assigned randomly at the beginning of each simulation run. The OBU speed ranged from 30 to 60 km/h, and the mRSU speed ranged from 20 to 45 km/h. The antenna heights were 1.5 meters for the OBU, 4 meters for the mRSU, and 10 meters for the RSU. The simulation was conducted using IEEE 802.11bd parameters at a 5.9 GHz frequency. The noise figure was set to 7.0 dB, and the calculated noise power was approximately –97 dBm.
6. Simulation Results
To verify the functionality of the proposed relay architecture, a simulation of the scenario described in Section 4 was conducted. The purpose of the simulation was to compare the communication quality (SNR) for direct data transmission from the OBU to the RSU and for transmission through a mobile relay mRSU. Two channel model configurations were used for the analysis:
- The OBU–RSU channel was statically assigned as NLOS, while the OBU–mRSU and mRSU–RSU channels were set as LOS, in accordance with the base hypothesis.
- The channel type (LOS or NLOS) for OBU–RSU and mRSU–RSU was determined dynamically.
Figure 6 presents the simulation results for the first configuration. The blue dashed line represents the SNR of the direct channel. The communication quality is nonlinear, reaching its peak at the point where the OBU is closest to the RSU. After this point, the SNR rapidly degrades, dropping below the operational threshold. The green solid line shows the SNR for the relay-based channel. Since both OBU and mRSU are moving (the OBU follows the mRSU), the SNR of this channel increases gradually. Although the direct channel (blue) temporarily provides higher SNR near the RSU, it completely loses operability at greater distances. In contrast, the relay channel (green) maintains a consistently high SNR across the entire simulated range, effectively extending the coverage area of the V2X network.
Figure 7 and Figure 8 present the second configuration, in which the channel model dynamically switches between LOS and NLOS when the OBU or mRSU moves away from the RSU. The blue line shows a peak within the LOS zone; however, as soon as the OBU loses line of sight with the RSU, the channel model switches to NLOS, leading to an instantaneous drop in SNR. After this point, the channel quickly degrades and becomes inoperative. The green line represents the relay SNR, which is determined by the weaker of the two link segments. In the graphs (Figure 7 and Figure 8), a sharp vertical drop in the green line is visible. This occurs when the mobile mRSU moves out of the RSU’s line of sight, causing its channel to degrade to NLOS and instantly become the bottleneck of the entire relay chain. Nevertheless, the relay signal degrades later than the direct connection.
In real conditions, the decline would be smoother; the abrupt drop here results from the model switching behavior. The relay via mRSU is effective only when both of its segments (OBU–mRSU, mRSU–RSU) maintain a high SNR. The benefits of using mRSU become evident at greater distances, where the direct NLOS channel rapidly attenuates and becomes nonfunctional, while mRSU continues to maintain connectivity. The mRSU thus extends the coverage area, though this coverage remains limited to the point at which the relay itself loses LOS connection with the RSU.
7. Conclusion
This study focused on the development of a V2X network simulation system and the evaluation of an architecture that employs a mobile fog computing node as a relay between an onboard unit and stationary roadside infrastructure [21].
The proposed simV2X environment, implemented in Python, features a modular and extensible architecture based on FastAPI for the server layer and OpenLayers for visualization. It supports flexible configuration of simulation scenarios, integration with external datasets, and automated logging of simulation results in SQLite. Such design ensures reproducibility, scalability, and ease of adaptation for various research tasks related to wireless communication and vehicular networking.
Simulation results under non-line-of-sight (NLOS) conditions showed that direct communication between the OBU and RSU is characterized by rapid nonlinear signal attenuation. The use of an mRSU provides stable transmission quality primarily at longer distances, where the direct link is already nonfunctional, while the benefits of relaying are marginal at short ranges.
Simulation modeling confirmed that the geometry and height of antennas are key factors in maintaining stable data transmission channels. The low antenna position of the OBU (around 1.5 m) leads to a rapid transition to NLOS conditions, causing an immediate SNR drop. In contrast, using an mRSU with an antenna height of approximately 4 m allows line of sight with the RSU to be maintained for a longer duration, effectively relaying data and extending the OBU’s operational coverage zone.
The overall performance of the OBU–mRSU–RSU system is determined by its weakest link – the mRSU–RSU channel. As the distance between them exceeds the LOS threshold, the channel degrades, leading to the loss of connectivity for the entire system. This highlights the need for developing algorithms for predicting connection loss and selecting optimal relays in dynamic environments.
The developed simulation system confirmed that the use of mobile fog computing nodes as relays is an effective method for improving communication reliability in urban environments. However, achieving maximum efficiency requires maintaining a stable channel between the relay and stationary infrastructure.
The next stage of research in this field will focus on developing adaptive relay selection algorithms that consider not only the SNR level but also the predicted duration of LOS connectivity in the mRSU–RSU channel. The implementation of Rayleigh and Rician multipath propagation models is planned to account for fading and reflections in urban environments. Future work will also evaluate the impact of mRSU use on overall throughput and transmission delay in a two-hop communication system.
Author Contributions
Conceptualization, A.V.; methodology, P.P. and A.V.; software, P.P. and G.T.; validation, P.P. and G.T.; formal analysis, P.P. and A.V.; data curation, G.T. and A.V.; writing—original draft preparation, P.P. and G.T.; writing—review and editing, A.V.; visualization, G.T.; project administration, A.V.; funding acquisition, A.V. All authors have read and agreed to the published version of the manuscript.
Funding
This research was funded by Russian Science Foundation, grant number 24-29-00304, https://rscf.ru/en/project/24-29-00304/
Conflicts of Interest
The authors declare no conflicts of interest.
References
- Wang, J.; Topilin, I.; Feofilova, A.; Shao, M.; Wang, Y. Cooperative Intelligent Transport Systems: The Impact of C-V2X Communication Technologies on Road Safety and Traffic Efficiency. Sensors 2025, 25, 2132. [Google Scholar] [CrossRef] [PubMed]
- Zhang, X.; Li, J.; Zhou, J.; Zhang, S.; Wang, J.; Yuan, Y.; Liu, J.; Li, J. Vehicle-to-Everything Communication in Intelligent Connected Vehicles: A Survey and Taxonomy. Automotive Innovation 2025, 8, 13–45. [Google Scholar] [CrossRef]
- Pawar, V.; Zade, N.; Vora, D.; Khairnar, V.; Oliveira, A.; Kotecha, K.; Kulkarni, A. Intelligent Transportation System With 5G Vehicle-to-Everything (V2X): Architectures, Vehicular Use Cases, Emergency Vehicles, Current Challenges, and Future Directions. IEEE Access 2024, 12, 183937–183960. [Google Scholar] [CrossRef]
- Khan, A.A.; Laghari, A.A.; Shafiq, M.; Awan, S.A.; Gu, Z. Vehicle to Everything (V2X) and Edge Computing: A Secure Lifecycle for UAV-Assisted Vehicle Network and Offloading with Blockchain. Drones 2022, 6, 377. [Google Scholar] [CrossRef]
- Rehman, M.A.U.; Salah ud Din, M.; Mastorakis, S.; Kim, B.-S. FoggyEdge: An Information-Centric Computation Offloading and Management Framework for Edge-Based Vehicular Fog Computing. IEEE Intelligent Transportation Systems Magazine 2023, 15, 78–90. [Google Scholar] [CrossRef]
- Elmoghazy, A.; Elgazzar, K.; Alwidian, S. A Real-World Testbed for V2X in Autonomous Vehicles: From Simulation to Actual Road Testing. In Proceedings of the IEEE 8th International Conference on Fog and Edge Computing (ICFEC), Philadelphia, USA, 2024; pp. 1234–1245. [Google Scholar] [CrossRef]
- Ning, Z.; Huang, J.; Wang, X. Vehicular Fog Computing: Enabling Real-Time Traffic Management for Smart Cities. IEEE Wireless Communications 2019, 26, 87–93. [Google Scholar] [CrossRef]
- Glazkov, R.; Moltchanov, D.; Srikanteswara, S.; Samuylov, A.; Arrobo, G.; Zhang, Y.; Feng, H.; Himayat, N.; Spoczynski, M.; Koucheryavy, Y. Provisioning of Fog Computing over Named-Data Networking in Dynamic Wireless Mesh Systems. Sensors 2024, 24, 1120. [Google Scholar] [CrossRef] [PubMed]
- De Britto e Silva, E.; Vranckx, J.; De Bruyn, T.; Charpentier, V.; Hadiwardoyo, S.A.; Marquez-Barja, J.M. A Toolkit for Visualizing V2X Messages on the Smart Highway Testbed. In Proceedings of the IEEE/ACM 25th International Symposium on Distributed Simulation and Real Time Applications (DS-RT), Valencia, Spain, 2021; pp. 1–4. [Google Scholar] [CrossRef]
- Thakur, A.; Malekian, R. Fog Computing for Detecting Vehicular Congestion: An Internet of Vehicles Based Approach—A Review. IEEE Intelligent Transportation Systems Magazine 2019, 11, 8–16. [Google Scholar] [CrossRef]
- Ma, H.; Wu, Y.; Tong, Y. Research on the Application and Optimization of V2X Communication Technology for Intelligent Transportation. International Core Journal of Engineering 2025, 11, 363–376. [Google Scholar] [CrossRef]
- Tong, W.; Hussain, A.; Bo, W.X.; Maharjan, S. Artificial Intelligence for Vehicle-to-Everything: A Survey. IEEE Access 2019, 7, 10823–10843. [Google Scholar] [CrossRef]
- Duan, X.; Yang, Y.; Tian, D.; Wang, Y.; Li, T. A V2X Communication System and Its Performance Evaluation Test Bed. In Proceedings of the IEEE 6th International Symposium on Wireless Vehicular Communications (WiVeC), Vancouver, Canada, 2014; pp. 1–2. [Google Scholar] [CrossRef]
- Bouchemal, N.; Kallel, S. Testbed of V2X Infrastructure for Autonomous Vehicles. Annals of Telecommunications 2021, 76, 731–743. [Google Scholar] [CrossRef]
- Jiang, F.J.; Al-Janabi, M.; Bolin, T.; Johansson, K.H.; Mårtensson, J. SVEA: An Experimental Testbed for Evaluating V2X Use-Cases. In Proceedings of the IEEE 25th International Conference on Intelligent Transportation Systems (ITSC), Macau, China, 2022; pp. 3484–3489. [Google Scholar] [CrossRef]
- Dakić, A.; Rainer, B.; Priller, P.; Nan, G.; Momić, A.; Ye, X.; Zemen, T. Wireless V2X Communication Testbed for Connected, Cooperative and Automated Mobility. In Proceedings of the IEEE Vehicular Networking Conference (VNC), Kobe, Japan, 2024; pp. 9–16. [Google Scholar] [CrossRef]
- Plotnikov, P.; Tambovtsev, G.; Vladyko, A. VANET Ver. 2.0.0—Software Module for Modeling the Interaction of Edge Devices; 2024. Available online: https://github.com/quanuhs/VANET (accessed on 01 November 2025).
- Tambovtsev, G.; Plotnikov, P.; Vladyko, A. SimV2X—Software Module for Modeling the Interaction of Edge and Fog Devices; 2025. Available online: https://github.com/quanuhs/simV2X (accessed on 01 November 2025).
- Vladyko, A.; Plotnikov, P.; Tambovtsev, G. Simulation-Based Evaluation of V2X System with Variable Computational Infrastructure. Network 2025, 5, 4 . [Google Scholar] [CrossRef]
- Plotnikov, P.V.; Tambovtsev, G.I.; Vladyko, A.G. The Balance Model for V2X System with Variable Infrastructure. In Proceedings of the Systems of Signals Generating and Processing in the Field of On Board Communications, Moscow, Russian Federation, 2025. pp. [Google Scholar] [CrossRef]
- Plotnikov, P.V.; Tambovtsev, G.I.; Vladyko, A.G. Performance Evaluation of V2X Model with Mobile Road Side Units. In Proceedings of the Intelligent Technologies and Electronic Devices in Vehicle and Road Transport Complex (TIRVED), Moscow, Russian Federation, 2023; pp. 1–4. [Google Scholar] [CrossRef]
Figure 1.
Visualization of the simulation model.
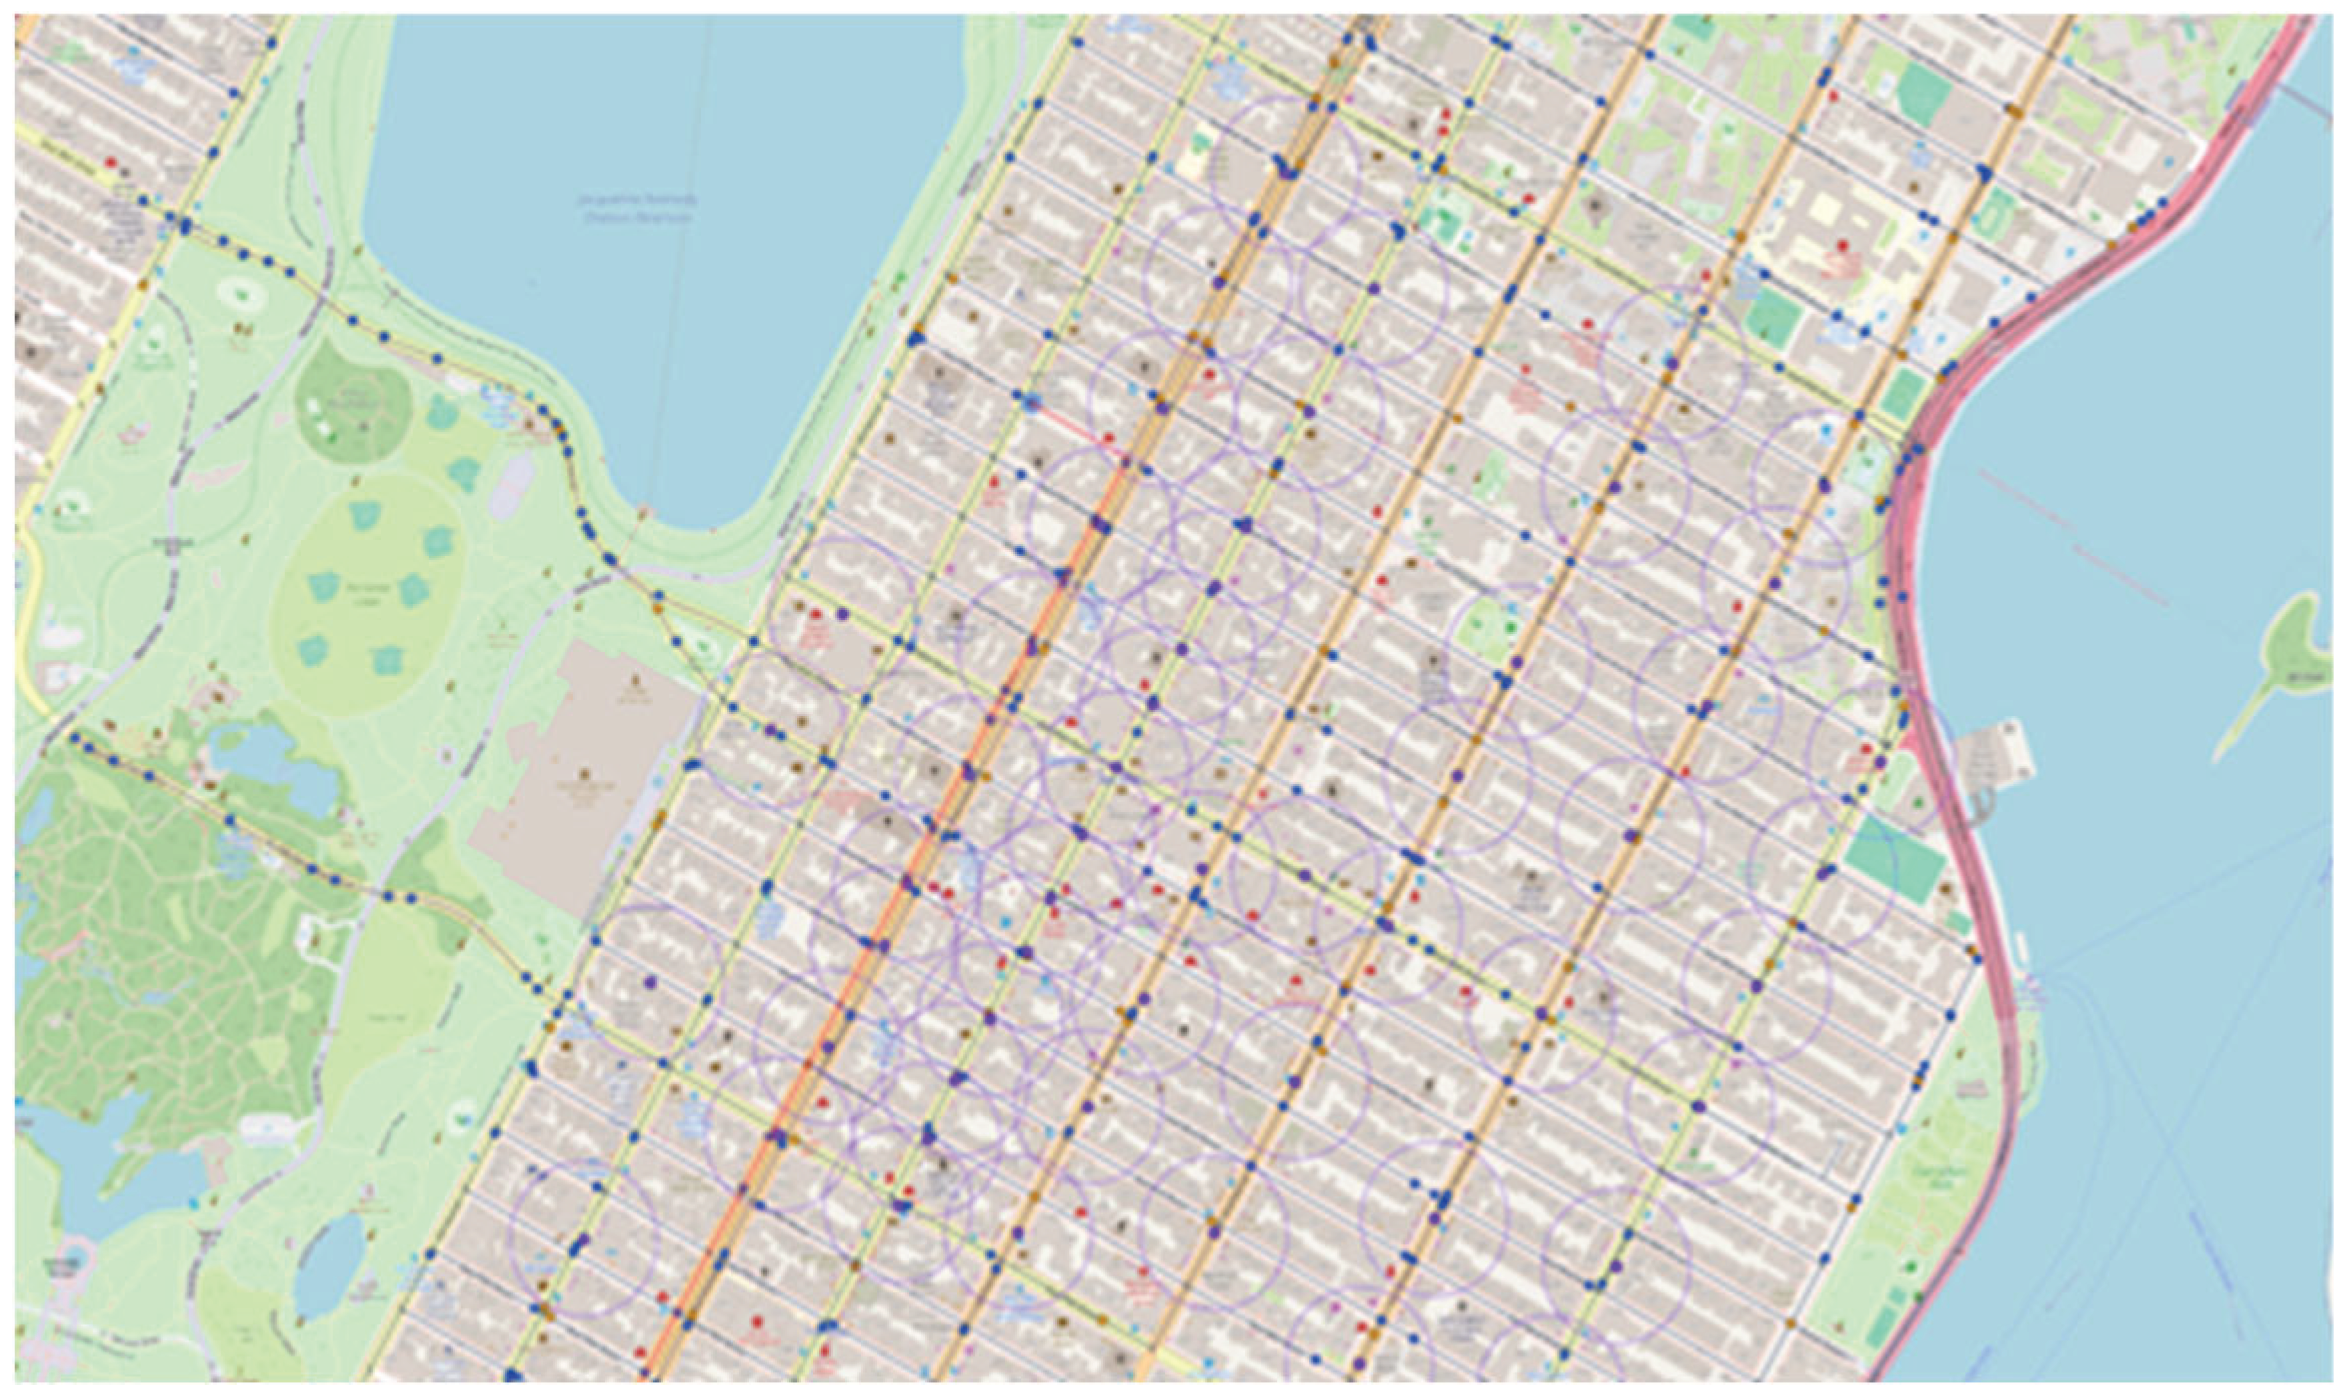
Figure 2.
Schematic of the simulation model operation.
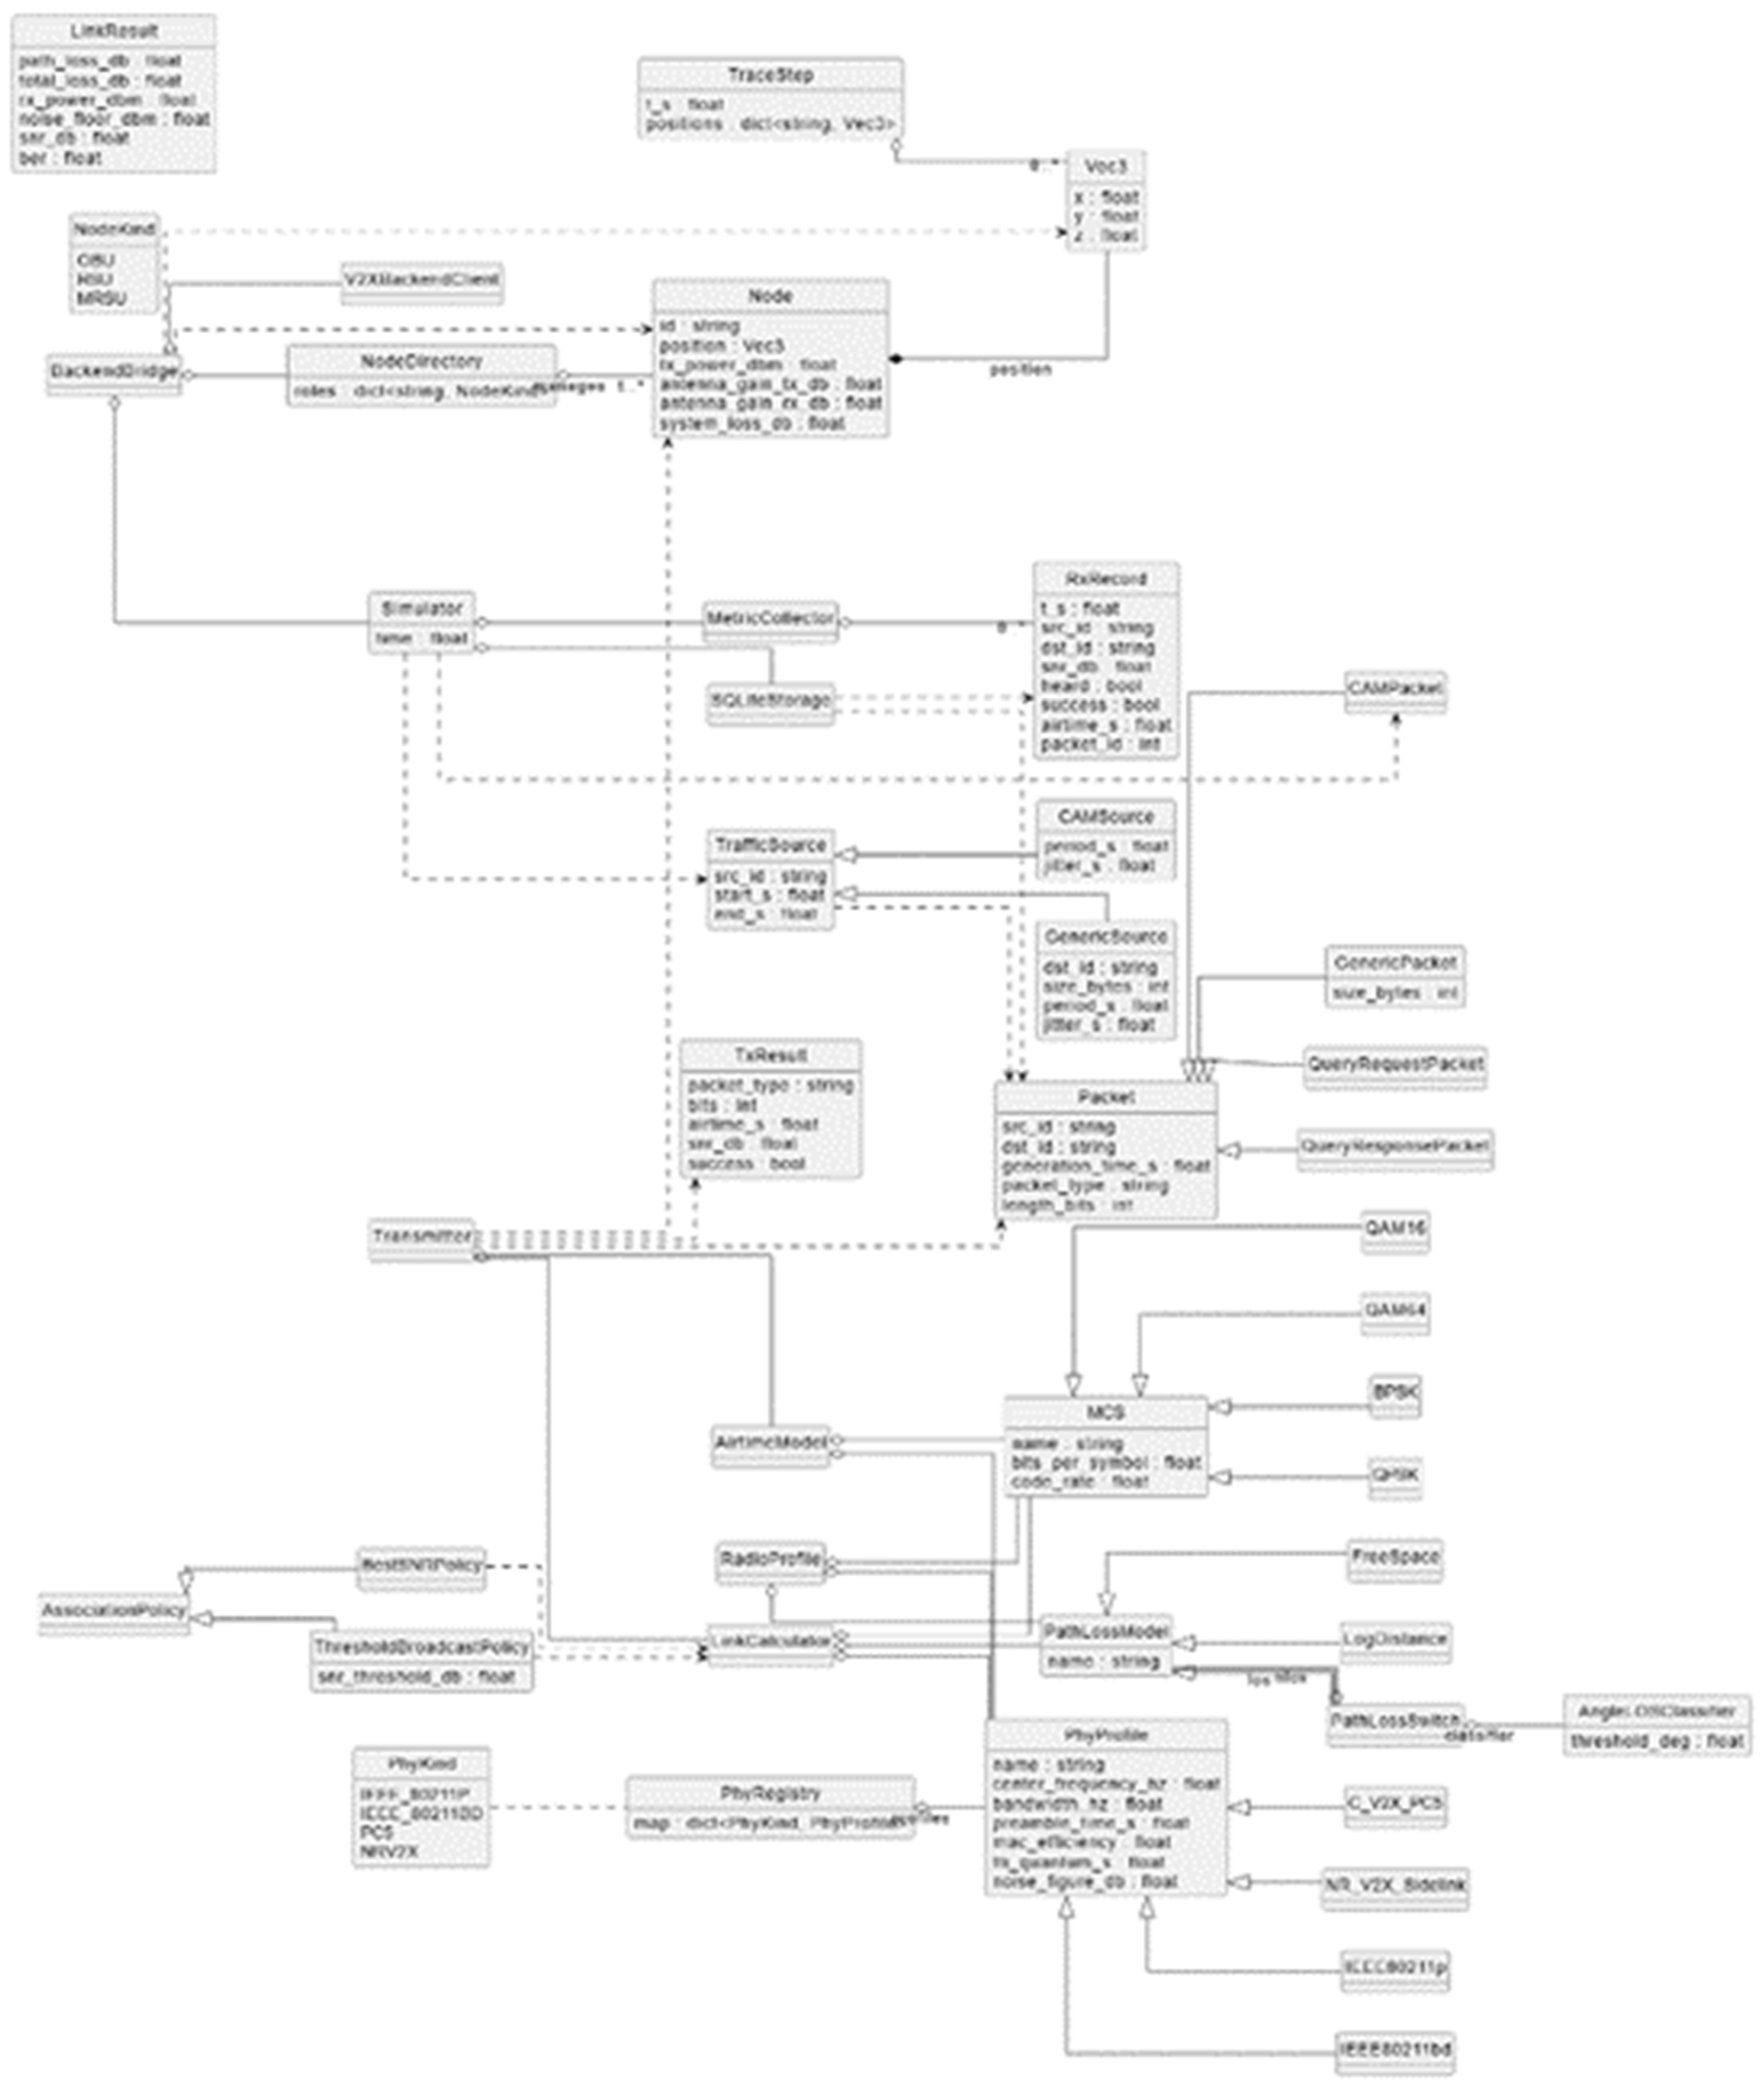
Figure 3.
Simulation results stored in SQLite.
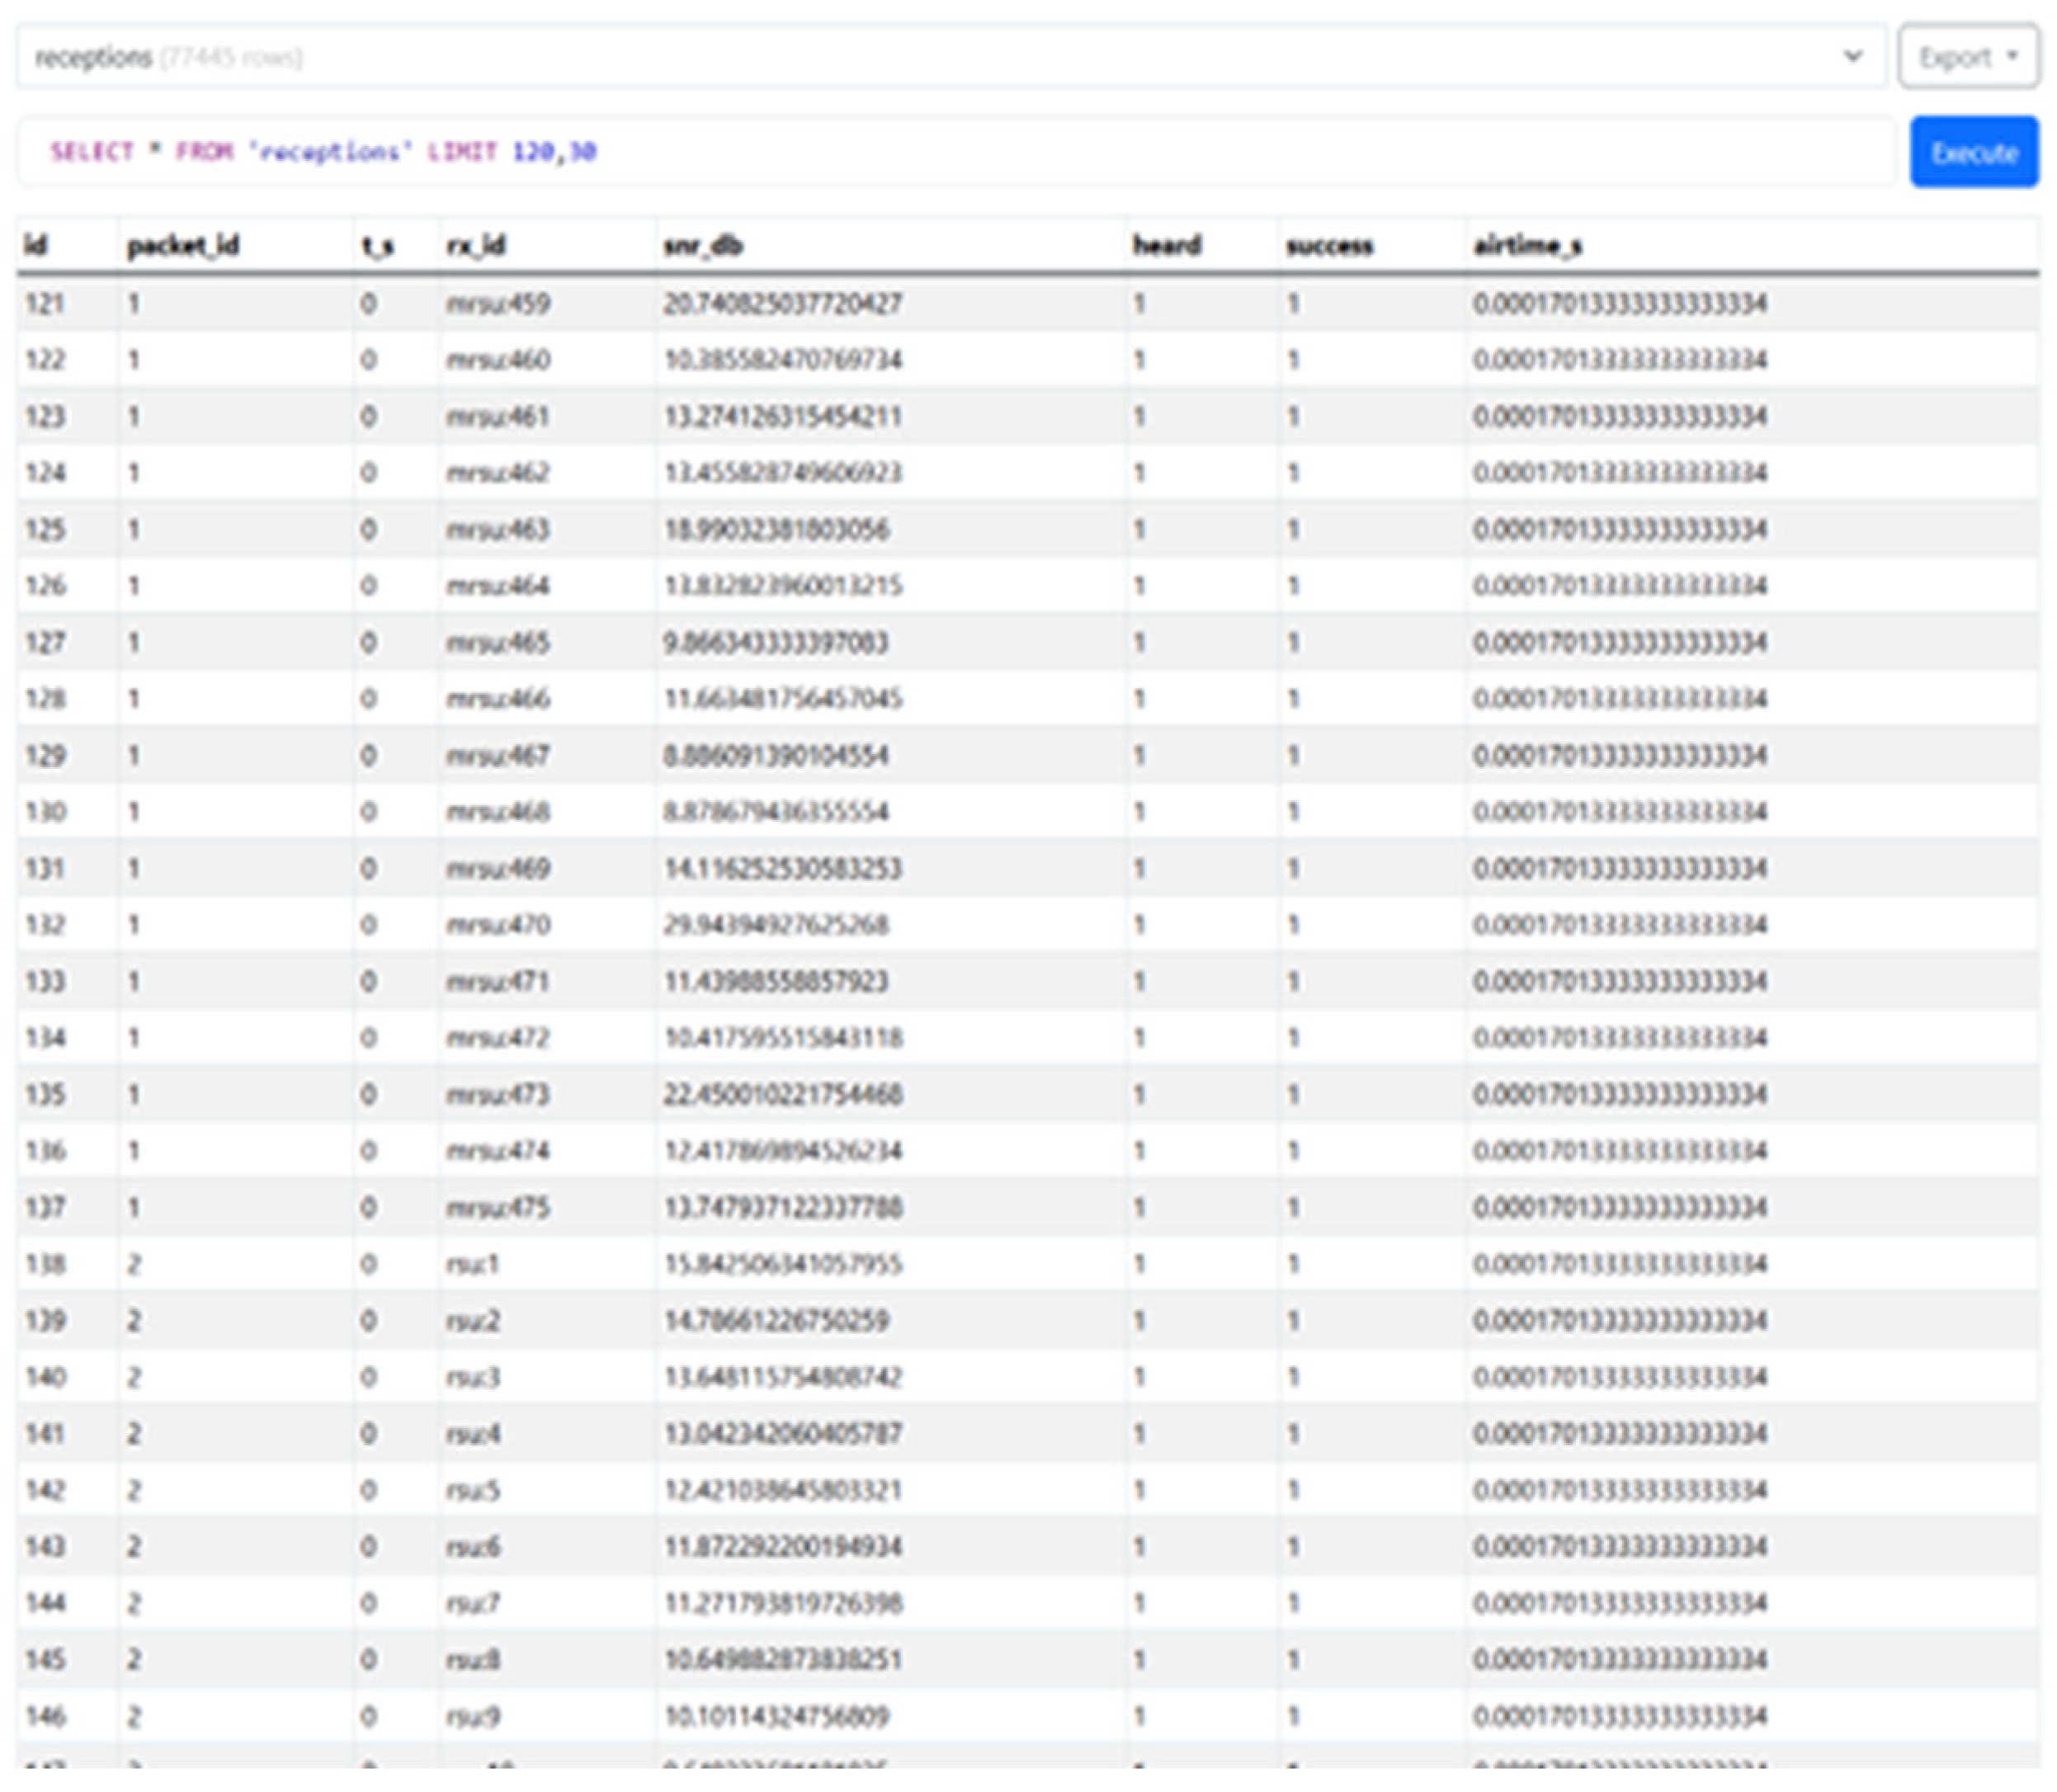
Figure 4.
Algorithm for determining device detectability.
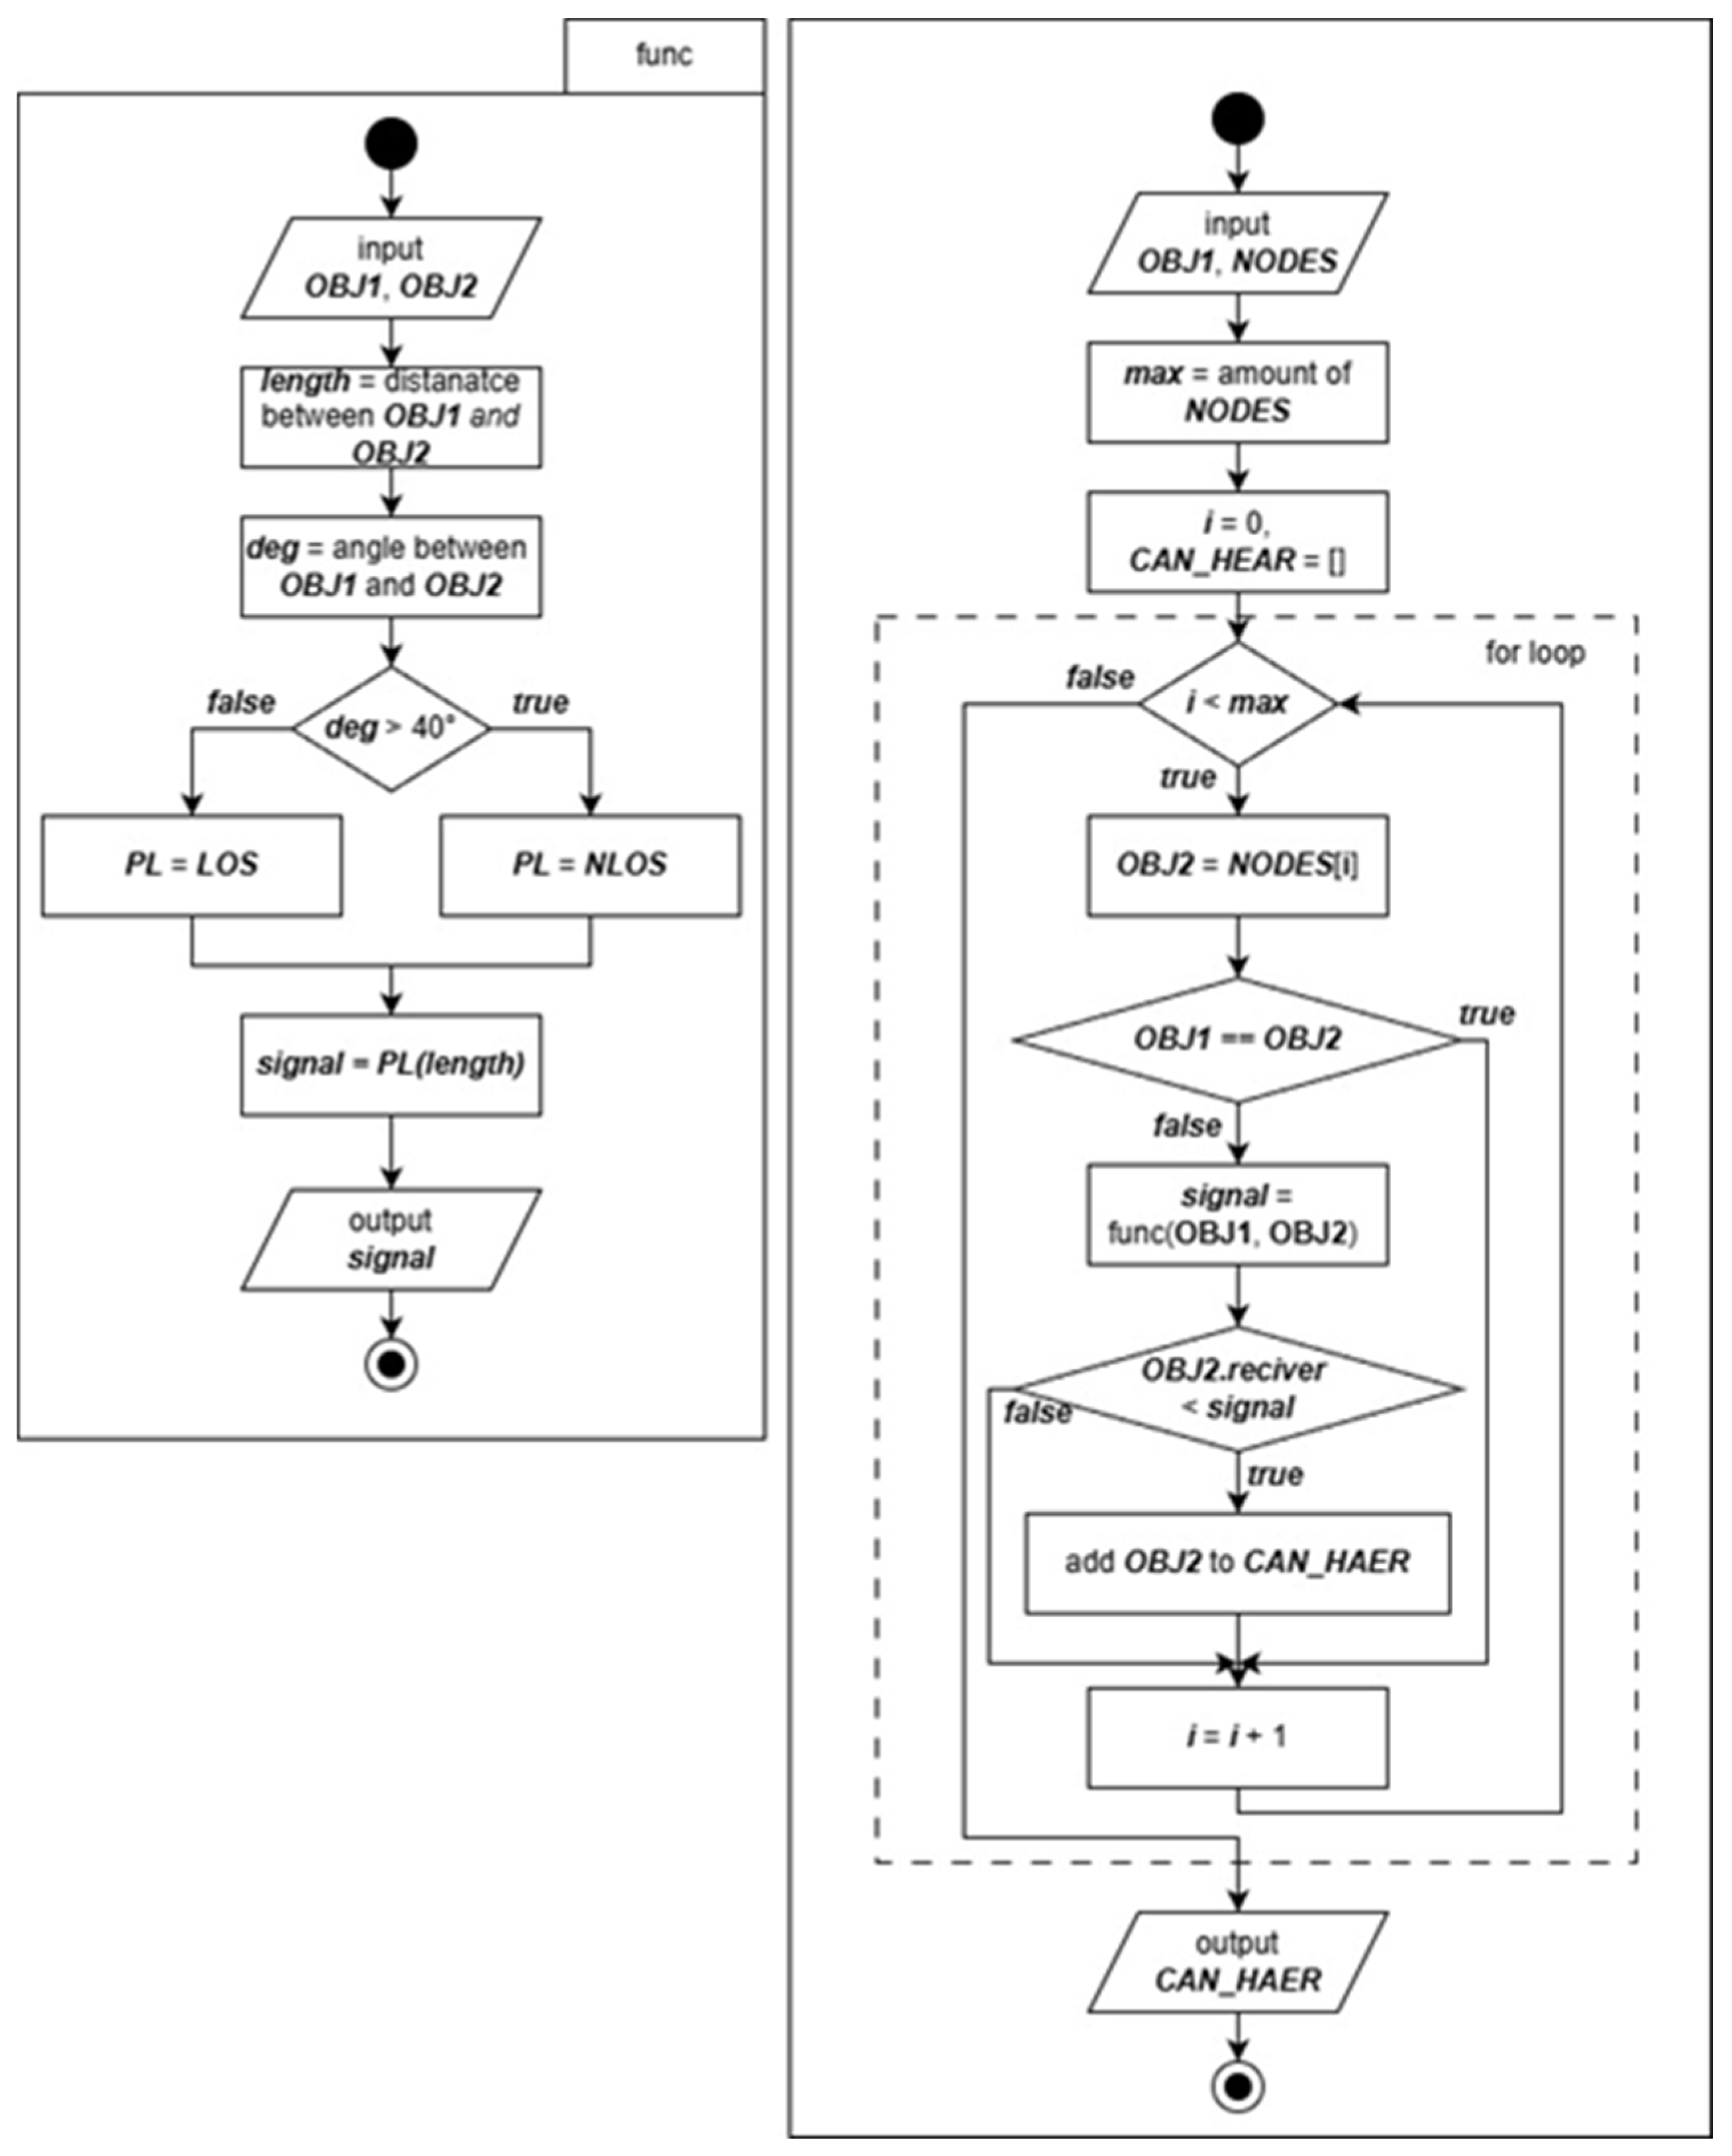
Figure 5.
Visualization of the simulation scenario.
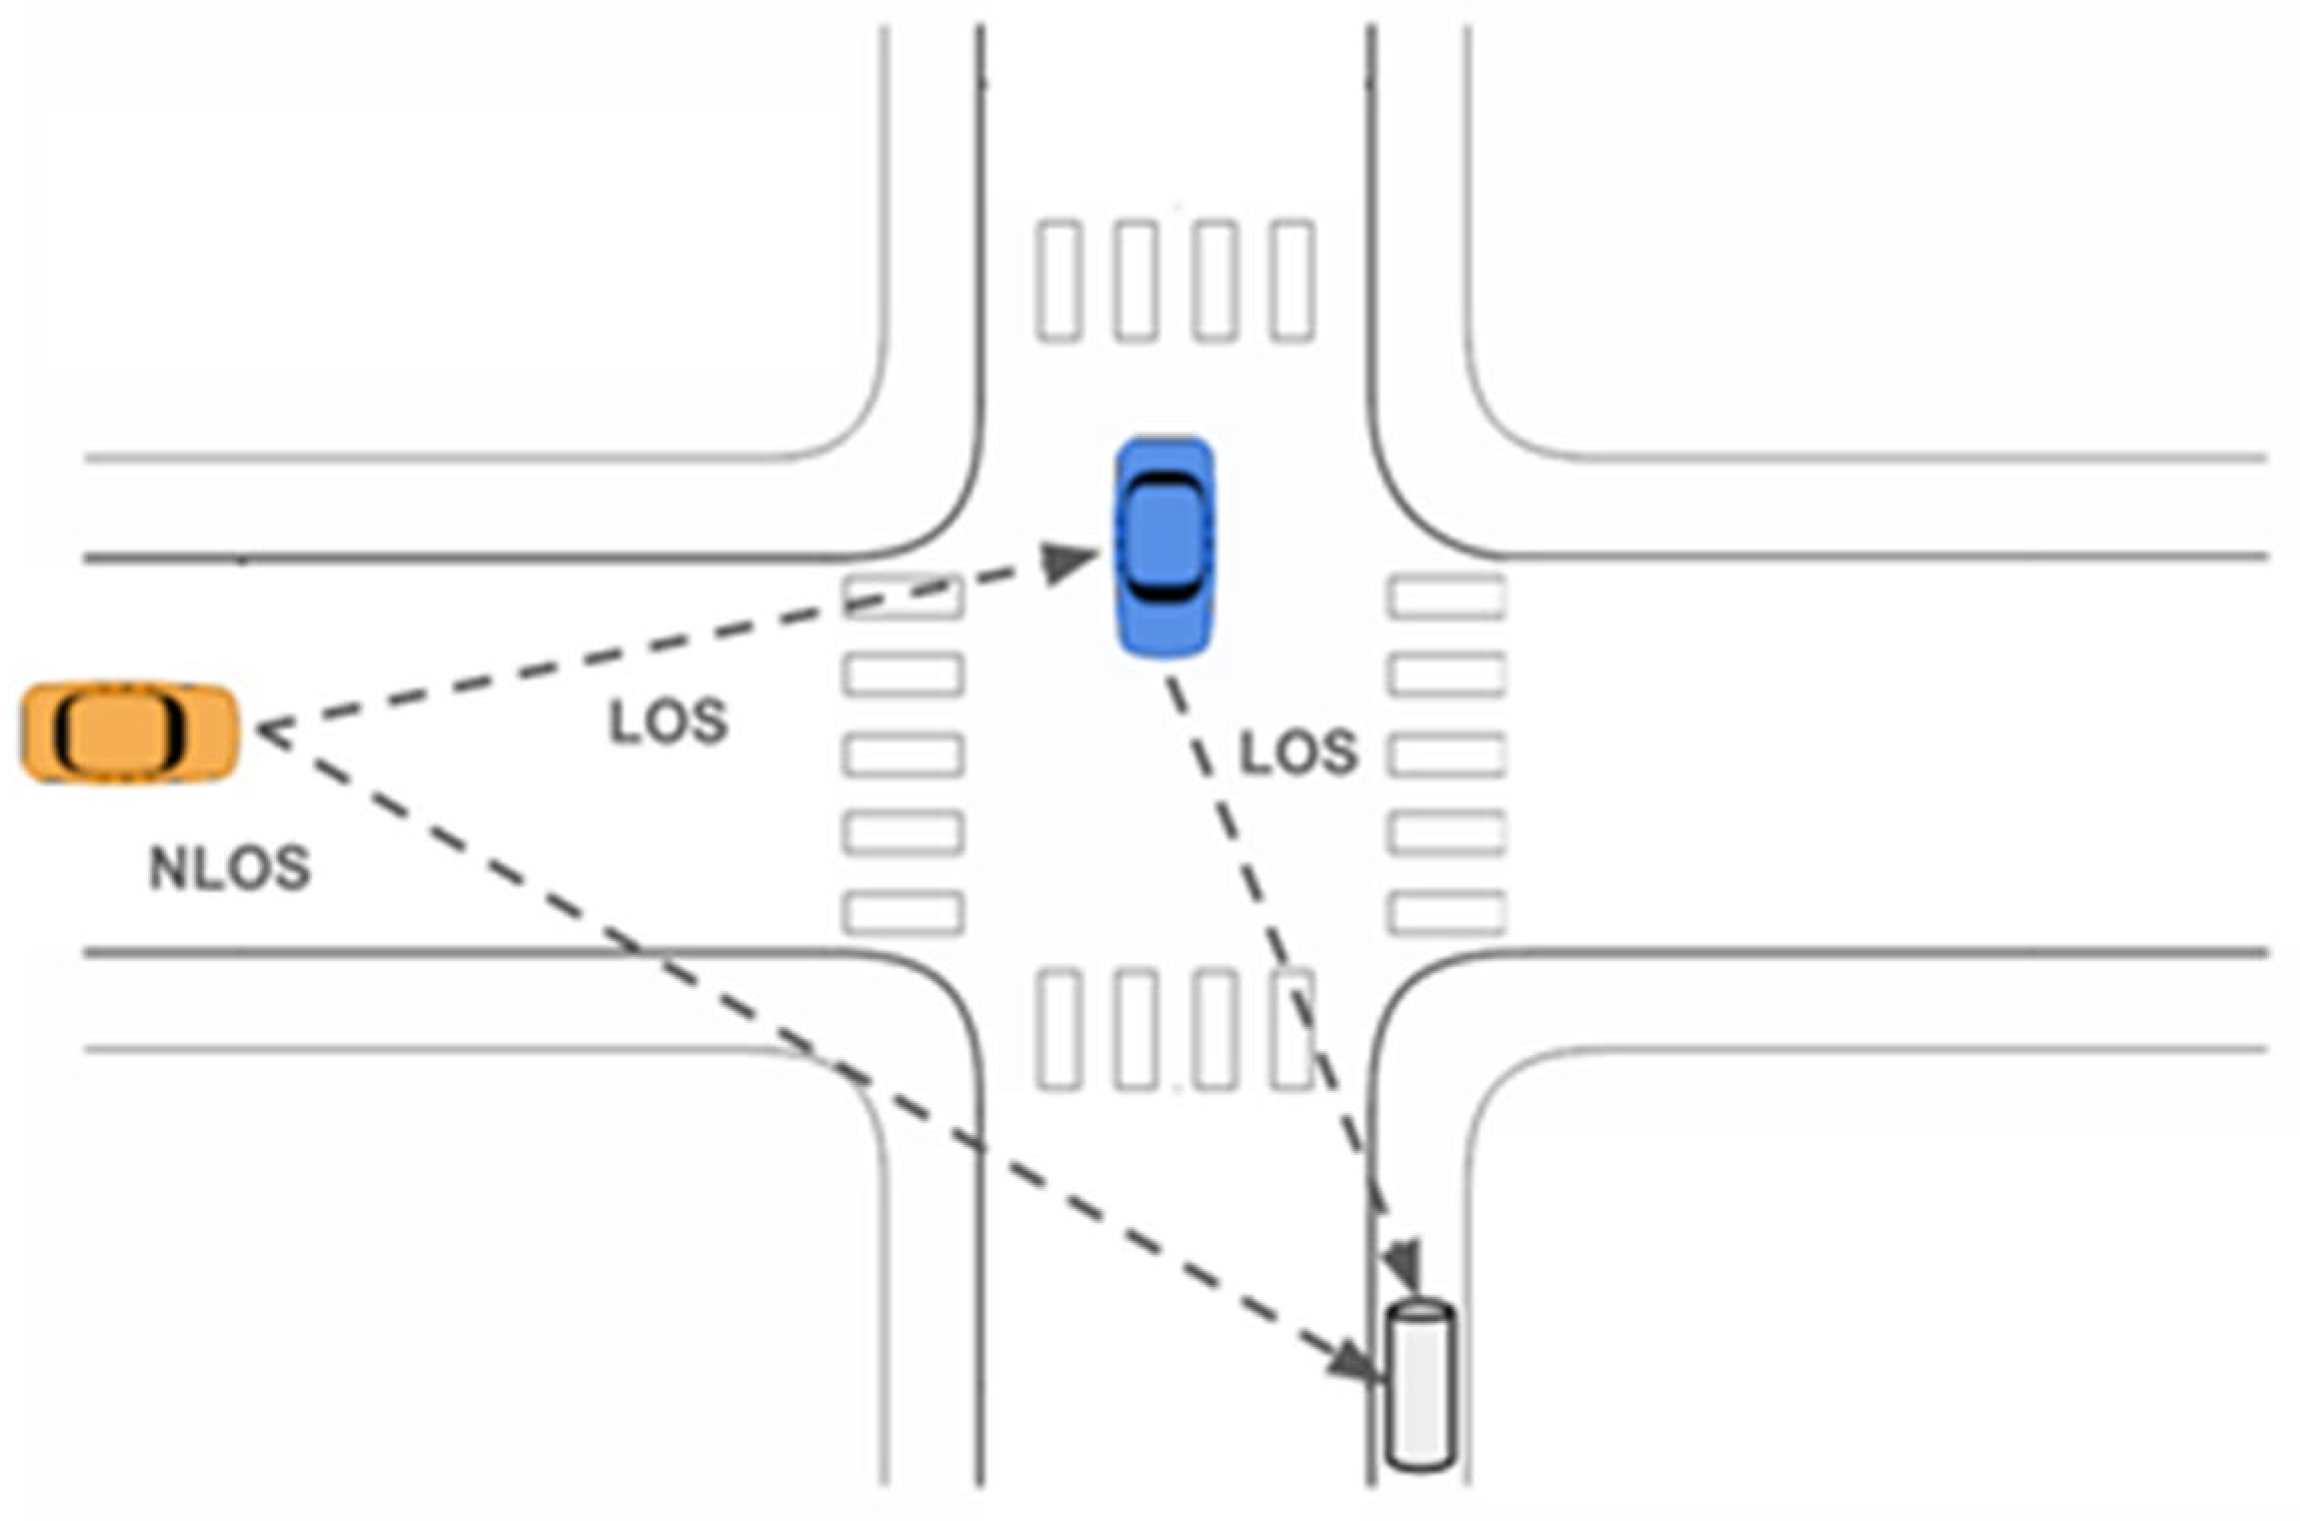
Figure 6.
Simulation results for the first configuration.
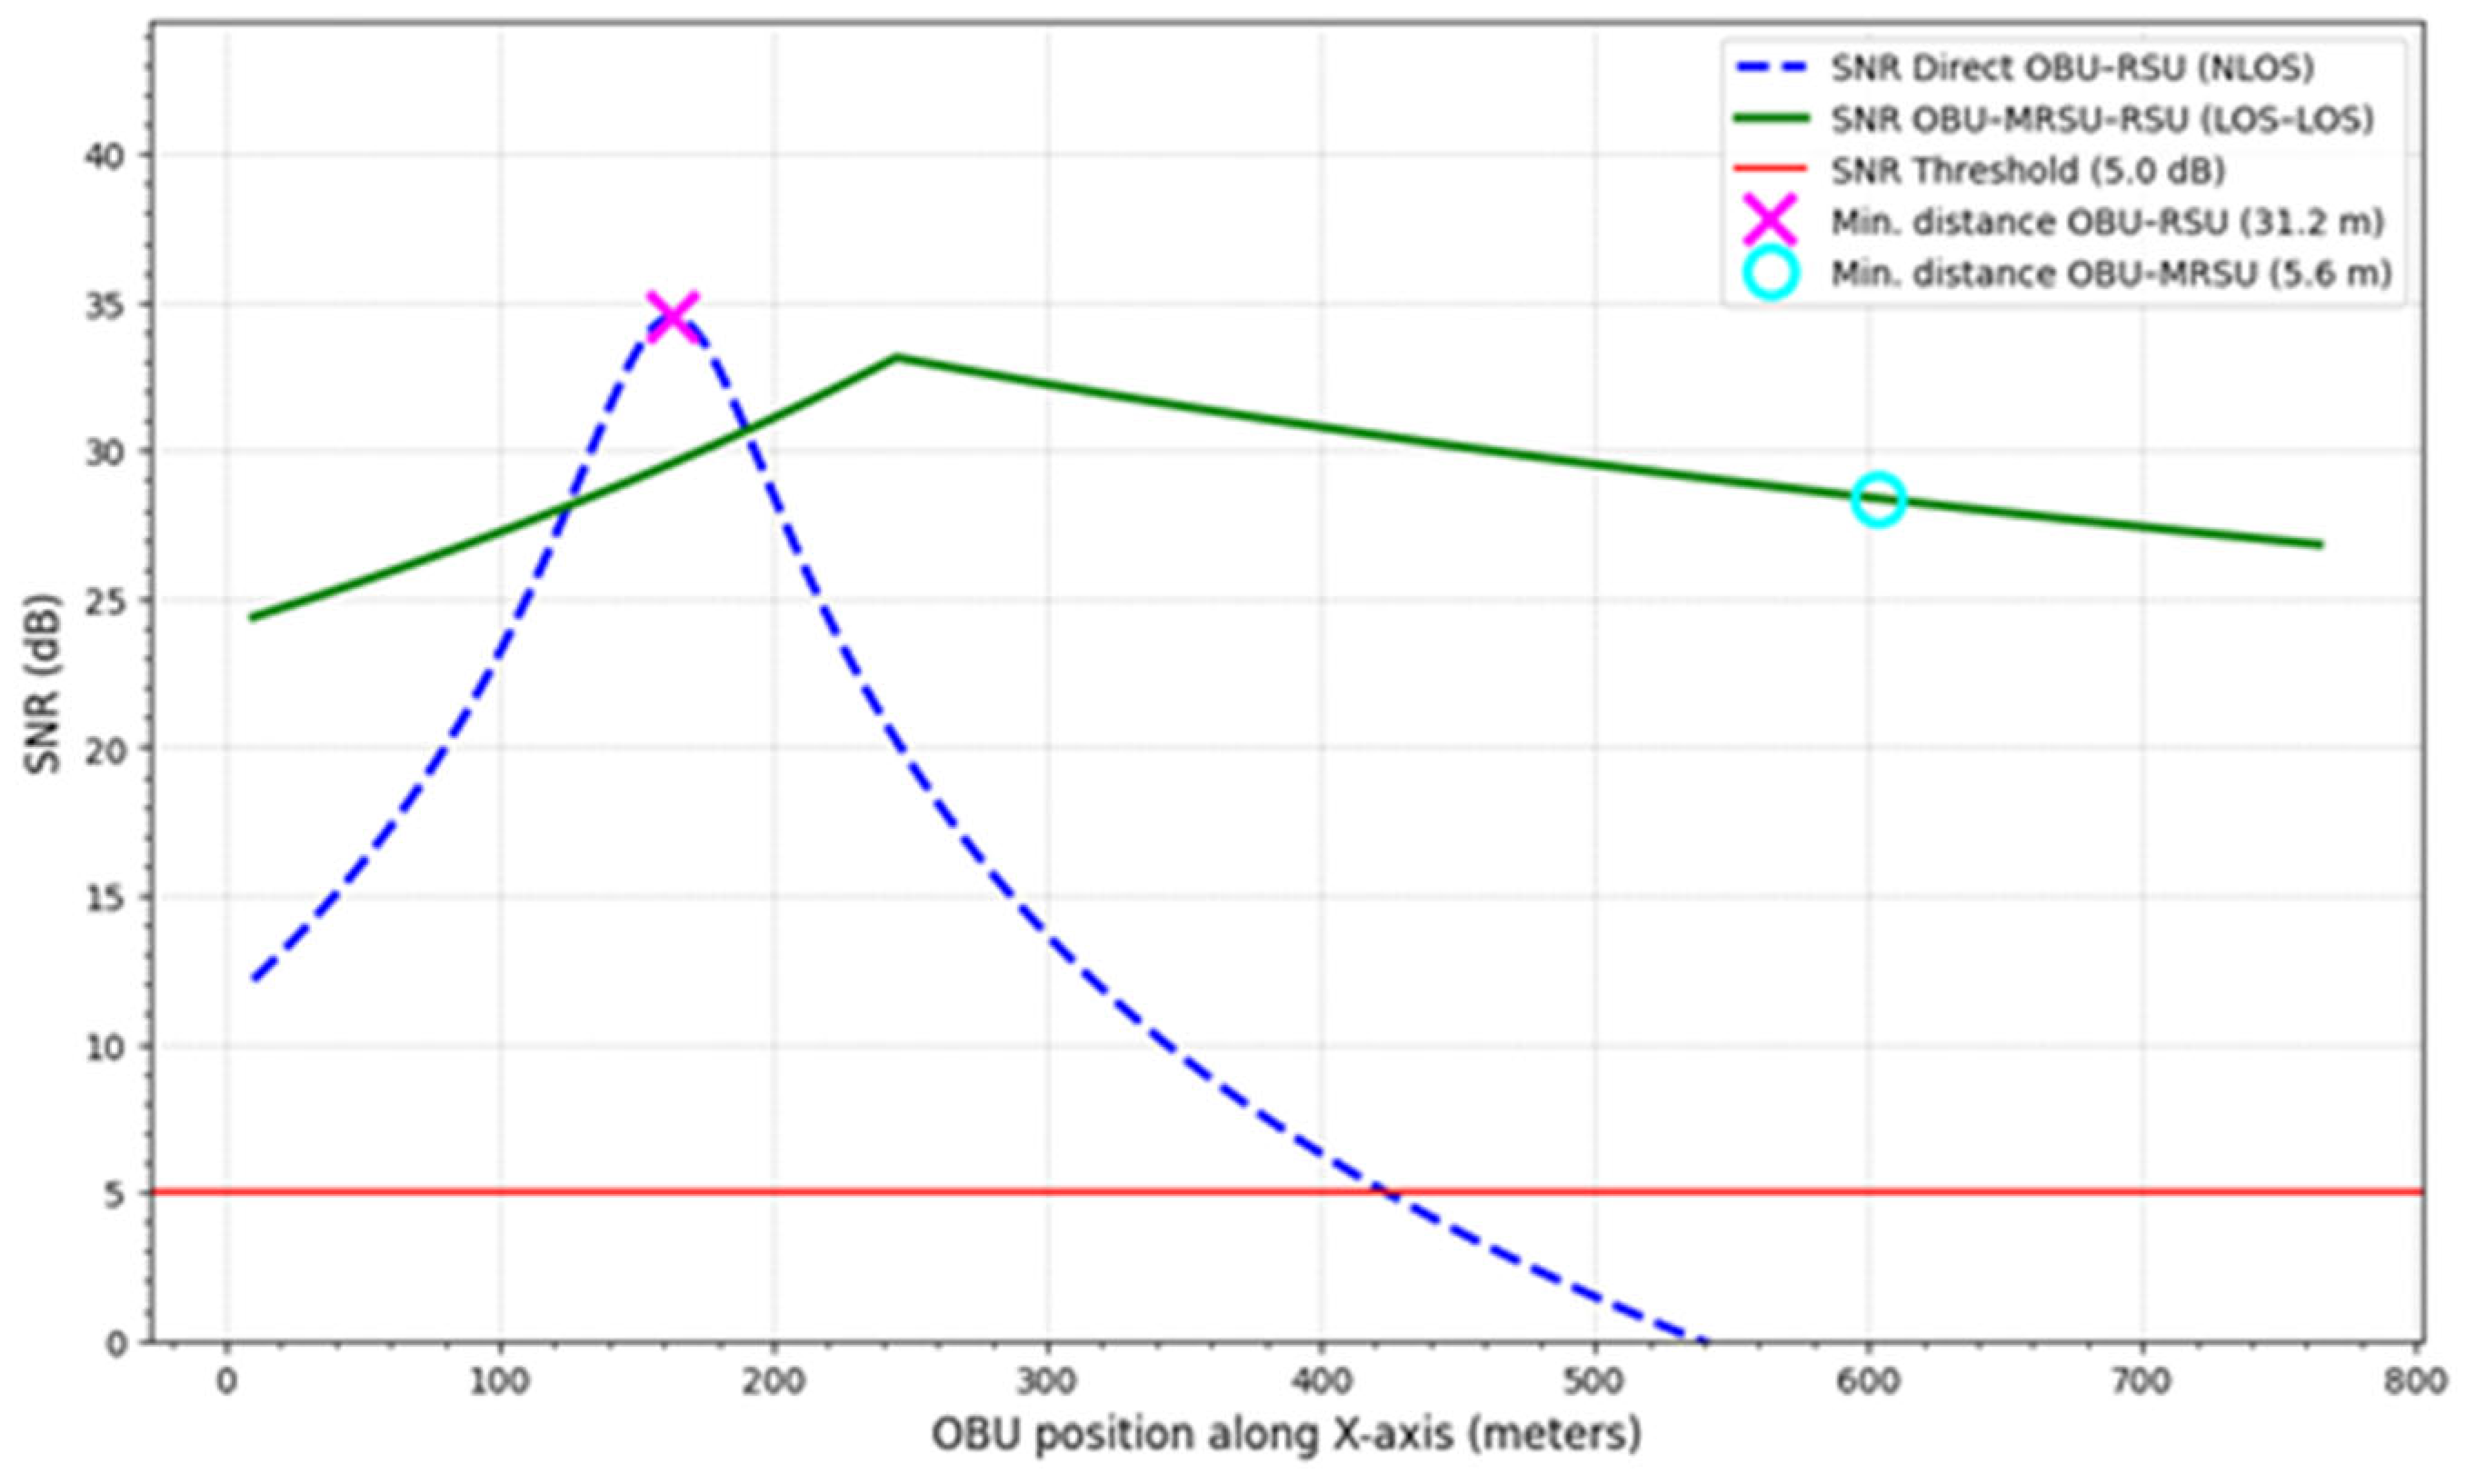
Figure 7.
Visualization of the simulation scenario.
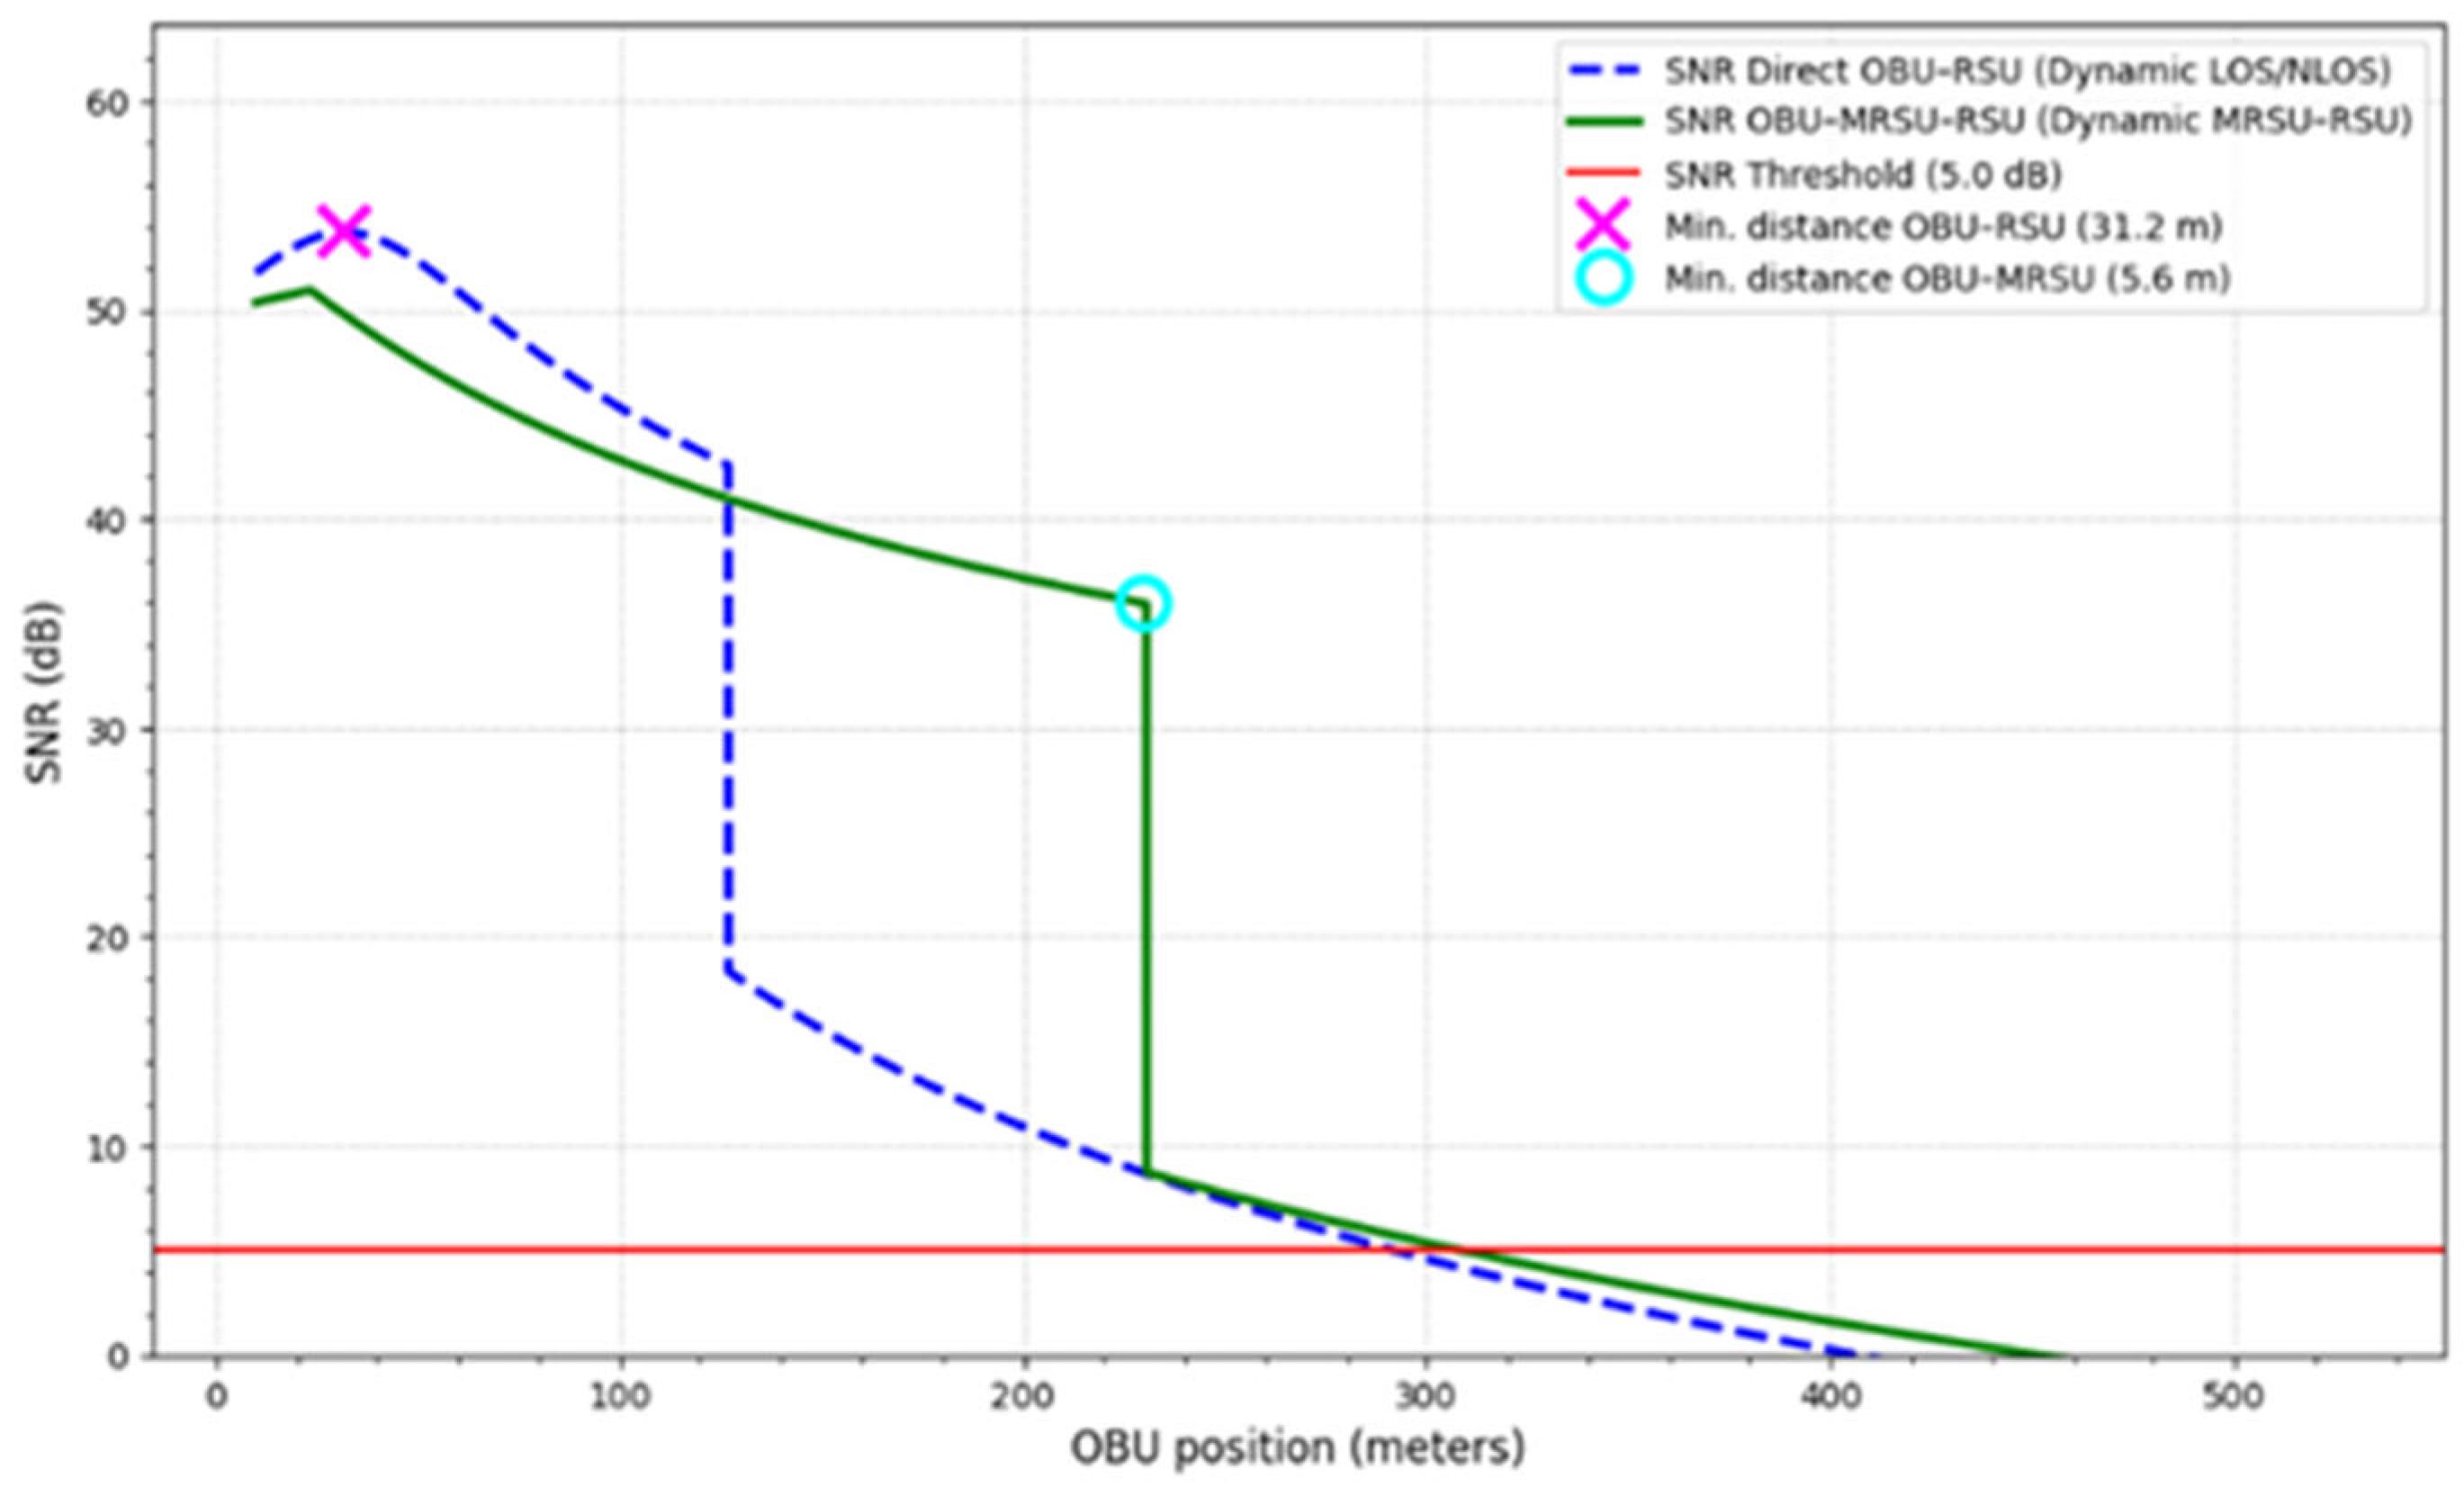
Figure 8.
Visualization of the simulation scenario.
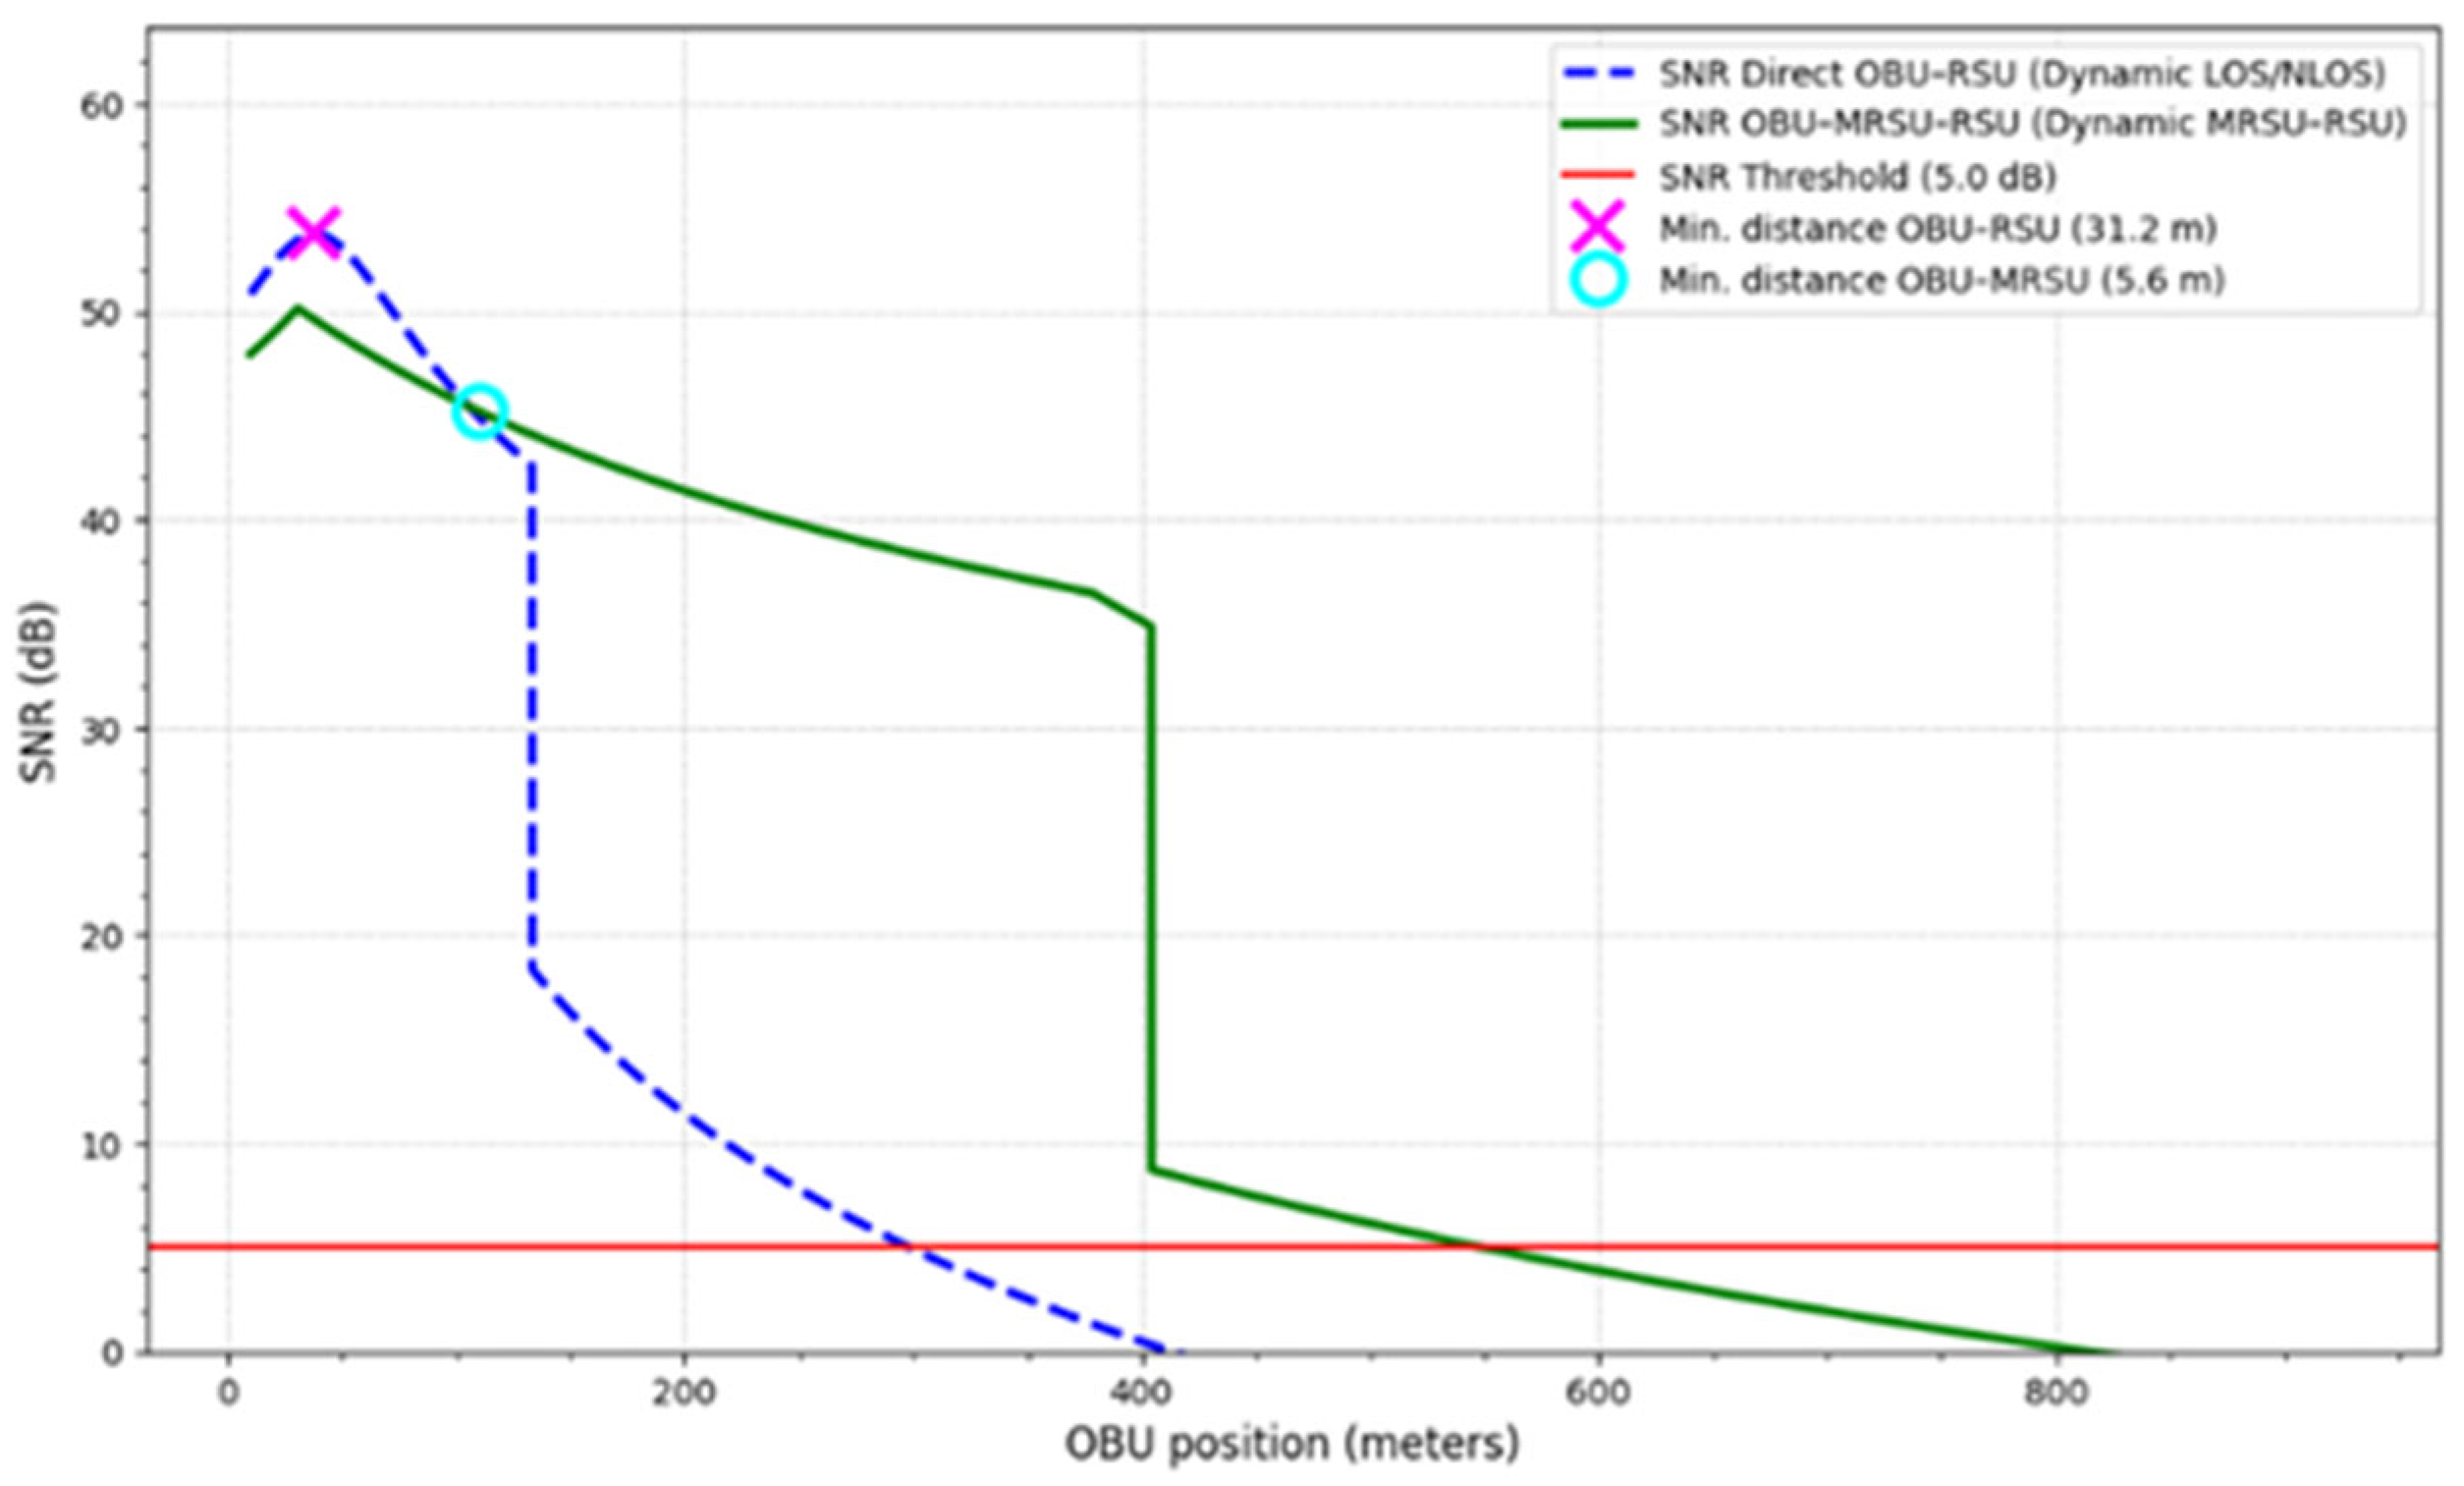

Table 1.
Comparative characteristics of cloud, fog, and edge computing.
| Characteristic | Cloud Computing | Fog Computing | Edge Computing |
|---|---|---|---|
| Location | Centralized cloud | Distributed nodes closer to devices | Directly on the device or gateway |
| Latency | High | Low | Very low |
| Management | Centralized | Distributed | Local |
Table 2.
Main advantages and disadvantages of using Fog Computing compared to Edge Computing.
| Criteria | Fog Computing | Edge Computing |
|---|---|---|
| Advantages | ||
| Scalability | More scalable architecture with intermediate layers between devices and the cloud | Limited by the resources of individual devices |
| Centralized management | Better suited for centralized administration and coordination among multiple edge nodes | Typically managed locally, harder to centralize |
| Distributed processing | Can redistribute load among multiple fog nodes | Strictly local processing – less flexibility |
| Support for more complex services | Suitable for applications with high computational complexity (e.g., predictive analytics) | Limited by device resources (CPU, memory) |
| Enhanced security (with proper implementation) | Enables pre-filtering and protection before sending data to the cloud | Provides only local protection with limited security features |
| Disadvantages | ||
| Infrastructure complexity | More complex architecture requiring deployment of intermediate nodes | Simple implementation – only the edge device is needed |
| Latency | Slightly higher latency due to the additional intermediate layer compared to EC | Minimal latency – data is processed «on-site» |
| Implementation and maintenance cost | Requires dedicated fog servers, specialized software, and administration | Lower-cost solution, especially for small systems |
| Power consumption | Additional nodes increase overall energy consumption | Typically energy-efficient operation of edge devices |
Table 3.
Main classes implemented in the simV2X simulation module.
| Class | Description | Key Attributes / Methods |
| Node | Base class for a network node. Contains general transmitter and antenna parameters. | id, position, tx_power_dbm, antenna_gain_tx_db, antenna_gain_rx_db, system_loss_db |
| Vehicle (OBU) | Mobile node representing a vehicle with a route and heading direction. | id, Coordinates, speed_mps, heading_deg, route_id |
| RSU | Fixed roadside infrastructure node that provides connectivity with OBUs. | id, Coordinates, range_m, antenna_gain_db |
| mRSU | Mobile infrastructure node mounted on a vehicle. | id, Vehicle, status, tx_power_dbm |
| Route | A route consisting of waypoints along which a vehicle moves. | id, path: List[Coordinates] |
| CurveRepositor | Repository of BLER curves for given combinations of (phy, mcs, channel). | register(), get() |
| AirtimeModel | Calculates packet transmission duration and PER from BER or BLER curves. | net_bitrate_bps(), payload_airtime_s(), total_airtime_s() |
| Simulator | Main simulator: stores nodes, creates channels, and performs simulation steps. | nodes, link_by_pair, default_link, summary() |
| AppStepSimulatorDB | Extended simulator that logs events into an SQLite database. | step(), _deliver_db(), max_range_friis_m() |
Disclaimer/Publisher’s Note: The statements, opinions and data contained in all publications are solely those of the individual author(s) and contributor(s) and not of MDPI and/or the editor(s). MDPI and/or the editor(s) disclaim responsibility for any injury to people or property resulting from any ideas, methods, instructions or products referred to in the content. |
© 2025 by the authors. Licensee MDPI, Basel, Switzerland. This article is an open access article distributed under the terms and conditions of the Creative Commons Attribution (CC BY) license (http://creativecommons.org/licenses/by/4.0/).
Copyright: This open access article is published under a Creative Commons CC BY 4.0 license, which permit the free download, distribution, and reuse, provided that the author and preprint are cited in any reuse.


