
Submitted:
07 November 2025
Posted:
10 November 2025
Read the latest preprint version here
Abstract
Lipoproteinassociated phospholipase A₂(Lp-PLA₂) connects oxidised lipid metabolism to vascular inflammation, however evidence of its role in Middle Eastern populations' cardiovascular disease (CVD) is lacking. We analysed circulating LpPLA₂, inflammatory markers, and mRNA expression in a Saudi population. To compare Lp-PLA₂, markers TNF α and IL 6, oxidised LDL, LP-a, and lipid profile between CVD patients and healthy controls, assess mRNA upregulation, and analyse correlations between Lp-PLA₂ and markers.30 healthy people and 30 people with CVD who had been diagnosed with atherosclerosis were compared in an investigation. Fasting blood plasma was analyzed via ELISA to determine hematological, biochemical, and cardiovascular biomarkers. Using quantitative reverse transcription polymerase chain reaction (RT-qPCR), whole blood messenger RNA (mRNA) was analyzed for Lp-PLA₂, TNF α and IL 6. Compared with Healthy, CVD patients showed higher LpPLA₂ (419 ± 188 vs 101 ± 32 ng/mL; P<0.001), IL6 (74 ± 17 vs 40 ± 19 pg/mL; P<0.001), TNFα (4.4 ± 0.9 vs 3.7 ± 0.8 pg/mL; P<0.01), oxLDL (430 ± 143 vs 242 ± 67 pg/mL; P<0.001), and LP-a (134 ± 31 vs 90 ± 33 ng/mL; P<0.001), with a more atherogenic lipid profile (LDL 3.02 ± 0.63 vs 1.72 ± 0.63 mmol/L; P<0.001; HDL lower: P<0.01). mRNA expression of LpPLA₂, IL6, and TNFα was upregulated in CVD. LpPLA₂ correlated with IL6 (r=0.75, P<0.001), TNFα (r=0.36, P<0.01), oxLDL (r=0.85, P<0.001), and LDL (r=0.80, P<0.001). CVD is associated with concordant proteinlevel elevations and mRNA upregulation of LpPLA₂, IL6, and TNFα, supporting a feedforward inflammatory–oxidative axis. These data from a Saudi cohort extend international evidence and support targeting the LpPLA₂ cytokine oxidative pathway in atherosclerosis.
Keywords:
lipoprotein-associated phospholipase A2
; lipid profile and inflammatory markers
; cardiovascular disease
1. Introduction
CVD remains the leading cause of death worldwide and is driven by the interplay between disordered lipid metabolism, chronic vascular inflammation, and maladaptive tissue remodeling [1]. Among circulating enzymes that sit at the interface of lipids and inflammation, Lp-PLA₂ also termed platelet-activating factor acetylhydrolase (PAF-AH) or group VIIA phospholipase A₂, encoded by PLA2G7—has attracted sustained interest as both a mechanistic mediator and a biomarker of vascular risk [2]. Lp-PLA₂ is a secreted, calcium-independent serine hydrolase produced primarily by macrophages and other inflammatory cells and circulates bound to lipoproteins—predominantly low-density lipoprotein (LDL) (~70–85%) and to a lesser extent high-density lipoprotein (HDL) [2,3,4]. It hydrolyzes oxidized phospholipids (oxPLs) on ox-low-density lipoprotein (ox-LDL) surfaces to generate lysophosphatidylcholine (LPC) and oxidized non-esterified fatty acids (oxNEFAs), bioactive lipids with recognized inflammatory potential [2,3]. Observational epidemiology—including large collaborative meta-analyses—has associated higher circulating Lp-PLA₂ mass and activity with subclinical atherosclerosis, adverse plaque characteristics, and increased risk of coronary heart disease and ischemic stroke, independent of traditional risk factors [5,6,7]. Although mass and activity are correlated, they capture non-identical biology and can diverge with changes in lipoprotein distribution, substrate burden, or inflammatory state [7,8]. Pathology and imaging studies further suggest that Lp-PLA₂ is enriched in macrophage-rich, lipid-laden regions of plaques and co-localizes with oxidatively modified LDL, consistent with a potential contribution to necrotic core formation and plaque vulnerability [9]. Despite these associations, causality remains debated. The selective Lp-PLA₂ inhibitor darapladib was vigorously inhibited in two large phase III outcome trials—STABILITY in patients with stable coronary disease and SOLID TIMI 52 after acute coronary syndrome—but failed to substantially decrease major adverse cardiovascular events on their primary endpoints [10,11]. Concurrently, investigations into human genetics (particularly those involving PLA2G7 loss-of-function alleles like the East Asian V279F null variation) have shown conflicting or no relationships with coronary risk, prompting enquiries over context-dependent biology vs marker status [12,13]. Mechanistic research highlights these potentialities. LPC and specific oxNEFAs can enhance the expression of endothelial adhesion molecules and cytokines, compromise endothelial barrier integrity and vasorelaxation, and affect macrophage and smooth muscle phenotypes—biologically plausible mechanisms through which Lp-PLA₂ may impact plaque formation and destabilisation [14,15,16]. The context of lipoproteins is simultaneously crucial. Lp-PLA₂ associated with LDL may selectively produce LPC within the arterial intima, while the enzyme linked to HDL has been suggested, under specific conditions, to aid in the detoxification of oxPLs; additionally, oxPLs are concentrated on lipoprotein (a) (LP-a), which may alter the subsequent inflammatory effects of Lp-PLA₂ activity [3,17,18]. As a result, significant knowledge deficiencies remain. This encompasses a restricted comprehension of (i) how the composition of lipoprotein carriers and substrates influences Lp-PLA₂ catalytic flux in vivo; (ii) the cell type-specific reactions to LPC and oxNEFAs within the plaque microenvironment; (iii) the spatial correlation between enzyme activity and characteristics of plaque vulnerability; and (iv) the circumstances under which the modulation of Lp-PLA₂ affects downstream inflammatory networks rather than simply mirroring them. Addressing these deficiencies is crucial to determine if Lp-PLA₂ serves as a viable therapeutic target, a risk stratification instrument, or both—potentially in certain patient subsets [2]. The reason for this work is because to understand past clinical results and develop precision treatments, we need a better understanding of the context-related effects of Lp-PLA₂, which is at the crossroads of lipid oxidative metabolism and vascular inflammation. Here, we investigate how Lp-PLA₂ activity and compartmentalization (by lipoprotein carrier and vascular niche) shape downstream lipid mediators and inflammatory signaling, and how genetic or pharmacologic modulation of the enzyme influences endothelial dysfunction, macrophage activation, and plaque biology.
2. Materials and Methods
2.1. Study Design and Participants
This comparative case–control study was conducted at King Abdulaziz Specialist Hospital, Sakaka, Saudi Arabia. The study population comprised of 30 patients with cardiovascular disease (CVD) (mean age 55 ± 8 years) and 30 healthy control subjects (mean age 53 ± 14 years). Plasma samples were collected from CVD patients at the Cardiology Center and from healthy volunteers at the Care Center. Samples obtained from participants who died during the study period prior to completion of laboratory analyses, or specimens exhibiting visible hemolysis, were excluded to ensure sample integrity. Ethical approval was granted by the Research Ethics Committee of the Ministry of Health, Al-Qurayyat Health Affairs and the study was registered with the National Committee for Bioethics and Medicine (H-13-S-071); IRB approval was issued for project #2023-127.
2.2. Blood Collection, Processing, and Storage
The patient was instructed to fast overnight before blood samples were taken from the veins and the plasma was separated by centrifugation in accordance with standard laboratory protocols. Separate samples of the plasma were prepared for regular haematological and biochemical analyses to be performed immediately and for storage at -80°C to be used for the subsequent examination of cardiovascular biomarkers.
2.3. Biochemical and Hematological Analyses
The hospital's clinical laboratories evaluated the lipid profile—which comprises total cholesterol (TC), triglycerides (TG), LDL, and HDL using enzymatic method spectrophotometric assays. Alanine aminotransferase (ALT), creatinine, and urea were all measured as further indications of renal and liver function, respectively. Comprehensive blood count (CBC) parameters and haemoglobin levels were also measured.
2.4. Cardiovascular, Inflammatory, and Oxidative Biomarkers
The parameters that were measured in the second plasma aliquot, which was kept at -80°C, included TNF- α, IL 6, fatty acid binding protein 3 (FABP3), ox-LDL), Lp PLA₂, and LP-a. The ELISA kits (Elabscience®, Houston, Texas, USA) were used to test all biomarkers according to the methods provided by the manufacturers. Intra- and inter-assay coefficients of variation were < 5%, supporting high analytical precision.
2.5. Lp-PLA₂ (PLA2G7) mRNA Expression by RT-qPCR
For gene-expression analyses, whole blood was collected in EDTA tubes. Total RNA was extracted using an RNA purification kit (Genaxxon bioscience, Germany). RNA concentration and purity were assessed by spectrophotometry (A260/A280 ratio); values within an acceptable range were required to proceed. First-strand cDNA was synthesized using the Scriptase RT cDNA kit (Genaxxon bioscience, Germany) in a 20 µL reaction with RNase-free water; reverse transcription was performed at 50 °C for 10 min, followed by 95 °C for 10 min to inactivate reverse transcriptase. Quantitative PCR was run on an AriaMx Real-Time PCR System (Agilent Technologies, Santa Clara, CA, USA) and the following primers:
| Title 1 | Title 2 | Title 3 |
| IL-6 | 5'- CAC CGG GAA CGA AAG AGA AG -3' 5'- GGG CGG CTA CAT CTT TGG AAT C -3 |
For Rev |
| TNF-α |
5'- AAG AAT TCA AAC TGG GGC CT -3' 5'- GAG GAA GGC CTA AGG TCC AC -3' |
For Rev |
| Lp-PLA₂ | 5'- CCA CCC AAA TTG CAT GTG C -3' 5'- GCC AGT CAA AAG GAT AAA CCA CA -3' |
For Rev |
| GAPDH | 5'- CAA GGT CAT CCA TGA CAA CTT TG -3' 5'- GTC CAC CAC CCT GTT GCT GTA G -3' |
For Rev |
All reactions were performed in duplicate using PCR master mix (Genaxxon Bioscience). GAPDH served as the reference gene for normalization and was included as a calibrator as specified. Relative expression was calculated by the 2^−ΔΔCt method.
All reactions were performed in duplicate using PCR master mix (Genaxxon Bioscience). GAPDH served as the reference gene for normalization and was included as a calibrator as specified. Relative expression was calculated by the 2^−ΔΔCt method.
2.6. Statistical Analysis
Excel served as a data management tool. If the variables are regularly distributed, the results are presented as the mean with ± standard deviation (SD), and a t-test is used. We used Spearman's rank correlation for non-parametric data and Pearson's correlation for parametric relationships. When controlling for possible confounders, multivariate linear regression revealed Lp-PLA₂ and LP-a as independent predictors of biochemical and inflammatory markers. We regarded a two-sided p-value of less than 0.05 as statistically significant.
3. Results
3.1. Study Population and Analysis Sets
We analyzed all uploaded datasets spanning clinical/biochemical panels, hematology, inflammatory/oxidative biomarkers, and paired gene-expression measurements. Complete-case numbers varied by endpoint: baseline and routine laboratory parameters (Tables 1 and 2) and biomarker panels (Table 3) included all available observations, and the paired protein–mRNA subset comprised 60 participants (healthy = 30; CVD = 30). Assay procedures and quality controls are detailed in the Methods (ELISA CVs < 5%; RT-qPCR normalized by GAPDH; 2^ΔΔCt).
3.2. Baseline Clinical, Biochemical and Hematological Characteristics
In Table 1 relative to healthy controls, individuals with CVD showed a more adverse metabolic profile: higher BMI (29 ± 5 vs 26 ± 1; P<0.01) and higher fasting glucose (6.8 ± 2 vs 5.8 ± 1.5 mmol/L; P<0.05). The lipid profile was distinctly atherogenic—total cholesterol 4.2 ± 0.6 vs 3.6 ± 0.5 mmol/L (P<0.001), LDL-C 3.0 ± 0.6 vs 1.8 ± 0.6 mmol/L (P <0.0001), and lower HDL-C 1.1 ± 0.1 vs 1.3 ± 0.3 mmol/L (P<0.001); triglycerides were similar between groups. Liver and kidney indices were modestly higher in CVD (ALT 38 ± 30 vs 22 ± 7 IU/L, P<0.05; creatinine 107 ± 24 vs 81 ± 12 μmol/L, P<0.001; urea 10 ± 5 vs 4.8 ± 1.2 mmol/L, P<0.01). In Table 2, CVD exhibited a pro-inflammatory blood profile with higher WBC (10.6 ± 5.0 vs 7.0 ± 1.6 ×10³/μL; P<0.001), neutrophilia (65 ± 11% vs 47 ± 11%; P<0.0001) and relative lymphopenia (22 ± 11% vs 40 ± 10%; P<0.0001). Red-cell indices differed (MCV, MCH higher; MCHC lower; all P ≤ 0.01), and MPV was reduced (8.0 ± 1.2 vs 10 ± 0.6 fL; P<0.001).
3.3. Inflammatory and Oxidative Biomarkers
In Table 3, across the full biomarker panel, CVD patients had higher IL-6 (74 ± 17 vs 40 ± 17 ng/mL; P<0.0001), higher TNF-α (4.3 ± 0.9 vs 3.6 ± 0.8 ng/mL; P<0.0001), higher ox-LDL (430 ± 147 vs 242 ± 66 nmol/mL; P< 0.0001), higher Lp(a) (134 ± 31 vs 90 ± 33 ng/mL; P< 0.0001), and markedly higher Lp-PLA₂ (419 ± 185 vs 101 ± 31 ng/mL; P< 0.0001). FABP3 trended higher without statistical significance (3.4 ± 1.0 vs 3.1 ± 0.1 ng/mL; p = 0.073).
3.4. Paired Protein–mRNA Analyses
Using the per-sample files (30 CVD; 30 healthy), we observed concordant differences at both the protein and transcript levels: Lp-PLA₂: protein 419 ± 185 vs 101 ± 31 ng/mL (P<0.0001); mRNA 1.243 ± 0.102 vs 1.021 ± 0.130 (P<0.0001). Within CVD, protein–mRNA correlation was significant (r = 0.627; P<0.001); no correlation in healthy (r = 0.197; P<0.297) (Figure 1-A). IL-6: protein 74 ± 17 vs 40 ± 17 ng/mL (P<0.0001); mRNA 1.920 ± 0.340 vs 1.213 ± 0.381 (P< 0.0001). Strong protein–mRNA coupling in CVD (r = 0.778; P< 0.0001), not in healthy (r = 0.249; p = 0.185) (Figure 1-B). TNF-α: protein 4.3 ± 0.9 vs 3.6 ± 0.8 ng/mL (P<0.01); mRNA 1.25 ± 0.10 vs 1.05 ± 0.15 (P< 0.0001). Protein–mRNA correlation in CVD was significant (r = 0.612; P<0.001) (Figure 1-C). The results of this study suggest that the alignment of transcription with circulating protein for IL 6, TNF α, and Lp-PLA₂ is dependent on the disease (Figure 1).
3.5. Associations Between Lp-PLA2 Concentration and Circulating Lipid Profiles, Inflammatory, and Oxidative Biomarkers
In pooled biochemical data (Figure 2), Lp-PLA₂ correlated strongly and positively with TNF-α (r = 0.36; p = 0.004) (Figure 2-A), IL-6 (r = 0.75; p = 2.24×10⁻¹²) (Figure 2-B), LP-a (r = 0.71; p = 1.04×10⁻¹⁰) (Figure 2-C), ox-LDL (r = 0.85; p = 2.60×10⁻¹⁸) (Figure 2-D), TC (r = 0.64; p = 2.09×10⁻⁸) (Figure 2-E), LDL (r = 0.80; p = 1.48×10⁻¹⁴) (Figure 2-F), TG (r = 0.19; p = 0.146) (Figure 2-G), and inversely with HDL (r = –0.44; p = 4.21×10⁻⁴) (Figure 2-H); no association with. This pattern links Lp-PLA₂ to both atherogenic lipoproteins and inflammatory activation.
3.6. Discrimination of CVD from Healthy
All analyses indicate that CVD is defined by an athero-inflammatory profile, which includes elevated body mass index (BMI) and glucose levels; a pro-atherogenic lipid profile characterized by increased TC and LDL, alongside decreased HDL; leukocytosis with neutrophilia; significant elevations in Lp-PLA₂, IL-6, TNF-α, ox-LDL, and LP-a; as well as a corresponding upregulation of IL-6, TNF-α, and Lp-PLA₂ mRNA. The correlations indicate a strong correlation between Lp-PLA₂ and atherogenic lipoproteins, as well as inflammatory mediators.
4. Discussion
Authors should discuss the results and how they can be interpreted from the perspective of previous studies and of the working hypotheses. The findings and their implications should be discussed in the broadest context possible. Future research directions may also be highlighted. This study provides biochemical and molecular evidence that cardiovascular disease (CVD) is characterized by a coordinated upregulation of inflammatory and oxidative pathways. Patients with CVD showed markedly elevated plasma levels and mRNA expression of lipoprotein-associated phospholipase A₂ (Lp-PLA₂), interleukin-6 (IL-6), and tumor necrosis factor-alpha (TNF-α) compared with healthy controls. These findings suggest that inflammatory cytokine activation and lipid oxidation act in synergy to promote vascular dysfunction and atherogenesis [19,20,21].
The pro-inflammatory cytokines IL-6 and TNF-α were significantly increased in both plasma concentration and mRNA expression among CVD patients, indicating transcriptional activation of these genes in circulating immune cells. Plasma IL-6 levels were nearly two-fold higher in CVD than in healthy subjects, whereas TNF-α levels were also elevated. Concurrent increases in IL-6 and TNF-α transcripts provide evidence of ongoing inflammatory activation caused by oxidative and metabolic stress [22,23]. According to research [24,25,26], these two cytokines have the following effects: they increase the expression of endothelial adhesion molecules, which in turn promotes the recruitment of leukocytes, and they activate the NF-κB and JAK/STAT pathways. These pathways accelerate future transcription of inflammatory genes and endothelial damage.
A dramatic rise in plasma Lp-PLA₂ levels compared to healthy controls and a corresponding upregulation of Lp-PLA₂ mRNA expression suggests that this increase is due to improved gene transcription rather than just post-translational modification for CVD patients. Lp-PLA₂ showed strong correlations with LDL cholesterol (r = 0.80; P< 0.001) and IL-6 (r = 0.75; P< 0.001), supporting its cytokine-driven induction [27,28]. Lysophosphatidylcholine and oxidized fatty acids are byproducts of the enzyme breakdown of ox-LDL; these substances have cytotoxic and pro-inflammatory effects on the endothelium lining the blood vessels [29]. Our findings support previous mechanistic investigations that found a reciprocal amplification loop between cytokine signaling and phospholipid degradation, as shown by the observed correlation between Lp-PLA₂ and TNF-α (r = 0.36; P< 0.01) [30,31].
The findings of ox-LDL levels of CVD patients were significantly higher than those of health controls, suggesting that oxidative stress was exacerbated. Lp-PLA₂ correlated strongly with ox-LDL (r = 0.85; P< 0.001), confirming their functional relationship [32]. Elevated LP-a concentrations (134.30 ± 30.94 ng/mL vs. 89.76 ± 33.12 ng/mL; P< 0.001) further reinforce the oxidative environment, as LP-a carries oxidized phospholipids that serve as substrates for Lp-PLA₂ [33]. In conjunction, these results indicate that lipid peroxidation not only enhances the availability of substrate for Lp-PLA₂ but also induces the expression of cytokines, thereby establishing a self-perpetuating inflammatory–oxidative cycle [34].
The pathogenic mechanism that is described by the combined biochemical and gene expression data is that oxidative stress triggers the release of cytokines (IL-6, TNF-α), which in turn upregulates Lp-PLA₂ transcriptionally. Enzymatic hydrolysis of oxidized phospholipids produces lipid mediators that stimulate inflammation and cytokine production, which in turn increases vascular inflammation [35,36]. Atherosclerotic illness is characterized by continuous inflammatory activation, which seems to be driven by this feed-forward loop [37]. The cycle is controlled by redox-sensitive transcription factors including NF-κB and STAT3.
The biochemical and transcriptional activation of Lp-PLA₂ underscores its promise as a biomarker for diagnosis and a target for treatment. Reduced lysophosphatidylcholine production and limited growth of the plaque necrotic core were seen after pharmacological inhibition with darapladib, a specific Lp-PLA₂ inhibitor [38,39]. While large-scale studies (STABILITY, SOLID-TIMI 52) found only small impacts on outcomes, targeting Lp-PLA₂ may provide a synergistic strategy by decreasing oxidative stress and inflammatory signaling at the same time, especially when combined with lipid-lowering or cytokine-directed therapy [40,41,42].
Furthermore, the close interaction between lipid metabolism and inflammation in the pathophysiology of cardiovascular disease underscores the concurrent increase in plasma and mRNA expression of Lp-PLA₂, IL-6, and TNF-α. The simultaneous measurement of these markers could improve cardiovascular risk prediction and early disease detection [43].
5. Conclusions
Essentially, this research demonstrates that CVD is characterized by an inflammatory-oxidative pathway, as evidenced by the mRNA and protein levels of Lp-PLA₂, IL-6, and TNF-α. Given the significant correlations between oxidized lipids and these markers, it is evident that Lp-PLA₂ is a critical mediator that links lipid oxidation to inflammation mediated by cytokines. An approach that directly inhibits Lp-PLA₂ or blocks cytokines may be a viable method to reduce inflammation in the blood vessels and delay the progression of atherosclerosis.
Author Contributions:Conceptualization: ZHA. Methodology: ZHA, FOA. Investigation: ZAA, RAA, FMA, AHA, ASA, FNA, SHA. Sample collection and clinical data: ZHA, ZAA, HMA, MMA, SMS, THN, NB. Formal analysis and data interpretation: ZHA, Writing – original draft preparation: ZHA. Writing – review and editing: ZHA, FOA, MS, NB. Supervision: ZHA. Project administration: ZHA. Funding acquisition: ZHA, FOA.
Disclosures: None.
Sources of Funding: This work was funded by the Deanship of Graduate Studies and Scientific Research, Jouf University under grant No. (DGSSR-2025-01-01573).
Institutional Review Board Statement
Ethical approval was granted by the Research Ethics Committee of the Ministry of Health, Al Qurayyat Health Affairs and the study was registered with the National Committee for Bioethics and Medicine (H 13 S 071); IRB approval was issued for project #2023 127.
Data Availability Statement
The original contributions presented in this study are included in the article/supplementary material. Further inquiries can be directed to the corresponding author(s).
Acknowledgments
This work was supported by the Deanship of Graduate Studies and Scientific Research at Jouf University under grant No. (DGSSR-2025-01-01573). The authors would like to express their sincere appreciation to the Secretariat of the Standing Committee for Studying Import and Clearance Requests for Research Materials at Educational Institutions in the Ministry of Education, as well as to the Central Laboratory at Jouf University.
References
- World Health Organization. Cardiovascular diseases (CVDs) Fact Sheet. 31 Jul 2025.
- Rosenson RS, Stafforini DM. Lipoprotein-Associated and Secreted Phospholipases A₂ in Cardiovascular Disease. Circulation. 2011;124:2749–2769.
- Tselepis AD, et al. Pathophysiological Role and Clinical Significance of Lp-PLA₂ bound to LDL and HDL. Curr Med Chem. 2014;20(40):6256–6269.
- O’Donoghue M, et al. Lp-PLA₂ in Acute Coronary Syndrome: distribution across lipoprotein classes. Can J Cardiol. 2013;29(10):1256–1262.
- The Lp-PLA₂ Studies Collaboration. Meta-analysis of observational studies of Lp-PLA₂ mass/activity and CVD risk. Eur J Cardiovasc Prev Rehabil. 2007;14(1):3–11.
- The Emerging Risk Factors Collaboration. Lp-PLA₂ and risk of coronary disease and stroke: collaborative analysis of 32 prospective studies. Lancet. 2010;375:1536–1544.
- The Emerging Risk Factors Collaboration. Lp-PLA₂ and risk of coronary disease and stroke: collaborative analysis of 32 prospective studies. Lancet. 2010;375:1536–1544.
- Chaudhary R, et al. Biochemical differences in the mass vs activity tests of Lp-PLA₂. Clin Chim Acta. 2017;471:32–37.
- Kolodgie FD, et al. Lp-PLA₂ protein expression in human coronary atheroma: association with high-risk lesions. Arterioscler Thromb Vasc Biol. 2006;26(7):e164–e171.
- The STABILITY Investigators. Darapladib for preventing ischemic events in stable CHD. N Engl J Med. 2014;370:1702–1711.
- O’Donoghue ML, et al. Effect of darapladib on major coronary events after ACS (SOLID-TIMI 52). JAMA. 2014;312(10):1006–1015.
- Holmes MV, Talmud PJ. Deciphering the causal role of sPLA₂s and Lp-PLA₂ in CHD (Mendelian randomization). Arterioscler Thromb Vasc Biol. 2015;35:2281–2289.
- Patel RS, et al. Carriage of the V279F null allele of PLA2G7 and coronary risk in East Asians. PLoS One. 2011;6(4):e18208.
- Wang L, et al. Mechanisms of lysophosphatidylcholine in atherosclerosis. Life Sci. 2020;247:117443.
- Ismaeel S, Qadri A. ATP release drives inflammation with lysophosphatidylcholine. ImmunoHorizons. 2021;5(4):219–233.
- Luigi M, et al. Role of free fatty acids in endothelial dysfunction. J Biomed Sci. 2017;24:50.
- van der Valk FM, et al. Oxidized phospholipids on Lp(a) elicit arterial wall inflammation in humans. Circulation. 2016;134:611–624.
- Tsimikas S, et al. Oxidized phospholipid modification of Lp(a): epidemiology, genetics, and pathophysiology. Atherosclerosis. 2022;349:76–86.
- Packard CJ, Libby P. Inflammation in atherosclerosis: from vascular biology to biomarker discovery and risk prediction. Clin Chem. 2008;54(1):24–38.
- Hansson GK, Hermansson A. The immune system in atherosclerosis. Nat Immunol. 2011;12(3):204–212.
- Libby P, Ridker PM, Hansson GK. Progress and challenges in translating the biology of atherosclerosis. Nature. 2011;473(7347):317–325.
- Ridker PM, Luscher TF. Anti-inflammatory therapies for cardiovascular disease. Eur Heart J. 2014;35(27):1782–1791.
- Ross R. Atherosclerosis—an inflammatory disease. N Engl J Med. 1999;340(2):115–126.
- Ridker PM, et al. Interleukin-6 signaling and the pathogenesis of cardiovascular disease. Atherosclerosis. 2018;269:203–209.
- Kishimoto T. IL-6: from its discovery to clinical applications. Int Immunol. 2010;22(5):347–352.
- Tzoulaki I, Murray GD, Lee AJ, Rumley A, Lowe GD, Fowkes FG. Inflammatory markers and the risk of coronary heart disease: prospective study and meta-analysis. Eur Heart J. 2007;28(22):2743–2749.
- Macphee CH, Moores KE, Boyd HF, et al. Lipoprotein-associated phospholipase A2, platelet-activating factor acetylhydrolase, generates two bioactive products during the oxidation of low-density lipoprotein. Biochem J. 1999;338:479–487.
- Wilensky RL, et al. Inhibition of lipoprotein-associated phospholipase A2 reduces complex coronary atherosclerotic plaque development. Nat Med. 2008;14(10):1059–1066.
- Tellis CC, Tselepis AD. The role of lipoprotein-associated phospholipase A2 in atherosclerosis may depend on its lipoprotein carrier in plasma. Biochim Biophys Acta. 2009;1791(5):327–338.
- Zalewski A, Macphee C. Role of lipoprotein-associated phospholipase A2 in atherosclerosis. J Clin Invest. 2005;115(12):3380–3387.
- Tsimikas S, et al. Lipoprotein(a): novel target and emerging biomarker in cardiovascular disease. J Am Coll Cardiol. 2018;71(2):177–192.
- Mehta JL, Chen J, Hermonat PL, Romeo F, Novelli G. Lectin-like, oxidized low-density lipoprotein receptor-1 (LOX-1): a critical player in the development of atherosclerosis and related disorders. Cardiovasc Res. 2006;69(1):36–45.
- Bergmark C, Dewan A, Orsoni A, et al. A novel function of lipoprotein(a) as a preferential carrier of oxidized phospholipids in human plasma. J Lipid Res. 2008;49(10):2230–2239.
- Tabas I, Garcia-Cardena G, Owens GK. Recent insights into the cellular biology of atherosclerosis. J Cell Biol. 2015;209(1):13–22.
- Libby P, Buring JE, Badimon L, et al. Inflammation and atherosclerosis: report from a scientific session. Atherosclerosis. 2019;283:91–100.
- Tedgui A, Mallat Z. Cytokines in atherosclerosis: pathogenic and regulatory pathways. Physiol Rev. 2006;86(2):515–581.
- Monaco C, Andreakos E, Kiriakidis S, et al. Canonical pathway of nuclear factor kappaB activation selectively regulates proinflammatory and prothrombotic responses in human atherosclerosis. Proc Natl Acad Sci U S A. 2004;101(15):5634–5639.
- White HD, Held C, Stewart R, et al. Darapladib for preventing ischemic events in stable coronary heart disease. N Engl J Med. 2014;370(18):1702–1711.
- O’Donoghue ML, Braunwald E, White HD, et al. Effect of darapladib on major coronary events after an acute coronary syndrome: the SOLID-TIMI 52 randomized clinical trial. JAMA. 2014;312(10):1006–1015.
- Packard CJ, et al. Lipoprotein-associated phospholipase A2 as an independent predictor of coronary heart disease. N Engl J Med. 2000;343(16):1148–1155.
- Mallat Z, Lambeau G, Tedgui A. Lipoprotein-associated and secreted phospholipases A2 in cardiovascular disease: roles as biological effectors and biomarkers. Circulation. 2010;122(21):2183–2200.
- Steg PG, Bhatt DL, Hamm CW, et al. Clinical outcomes with Lp-PLA2 inhibition after acute coronary syndromes. Atherosclerosis. 2019;286:1–9.
- Sabatine MS, et al. Lipid, inflammatory, and metabolic biomarkers and the risk of recurrent cardiovascular events. Circulation. 2012;125(4):450–458.
Figure 1.
Concordant protein–mRNA changes and within-group coupling for Lp-PLA₂, IL-6, and TNF-α.(A) Lp-PLA₂. Protein: 419 ± 185 vs 101 ± 31 ng/mL (CVD vs healthy; P < 0.0001). mRNA: 1.243 ± 0.102 vs 1.021 ± 0.130 (P < 0.0001), correlation: CVD r = 0.627; P < 0.001. (B) IL-6. Protein: 74 ± 17 vs 40 ± 17 pg/mL (P < 0.0001). mRNA: 1.920 ± 0.340 vs 1.213 ± 0.381 (P < 0.0001), correlation: CVD r = 0.778; P < 0.0001. (C) TNF-α. Protein: 4.3 ± 0.9 vs 3.6 ± 0.8 ng/mL (P < 0.01). mRNA: 1.25 ± 0.10 vs 1.05 ± 0.15 (P < 0.0001), correlation: CVD r = 0.612; P < 0.001. All P values two-sided; values shown as mean ± SD.
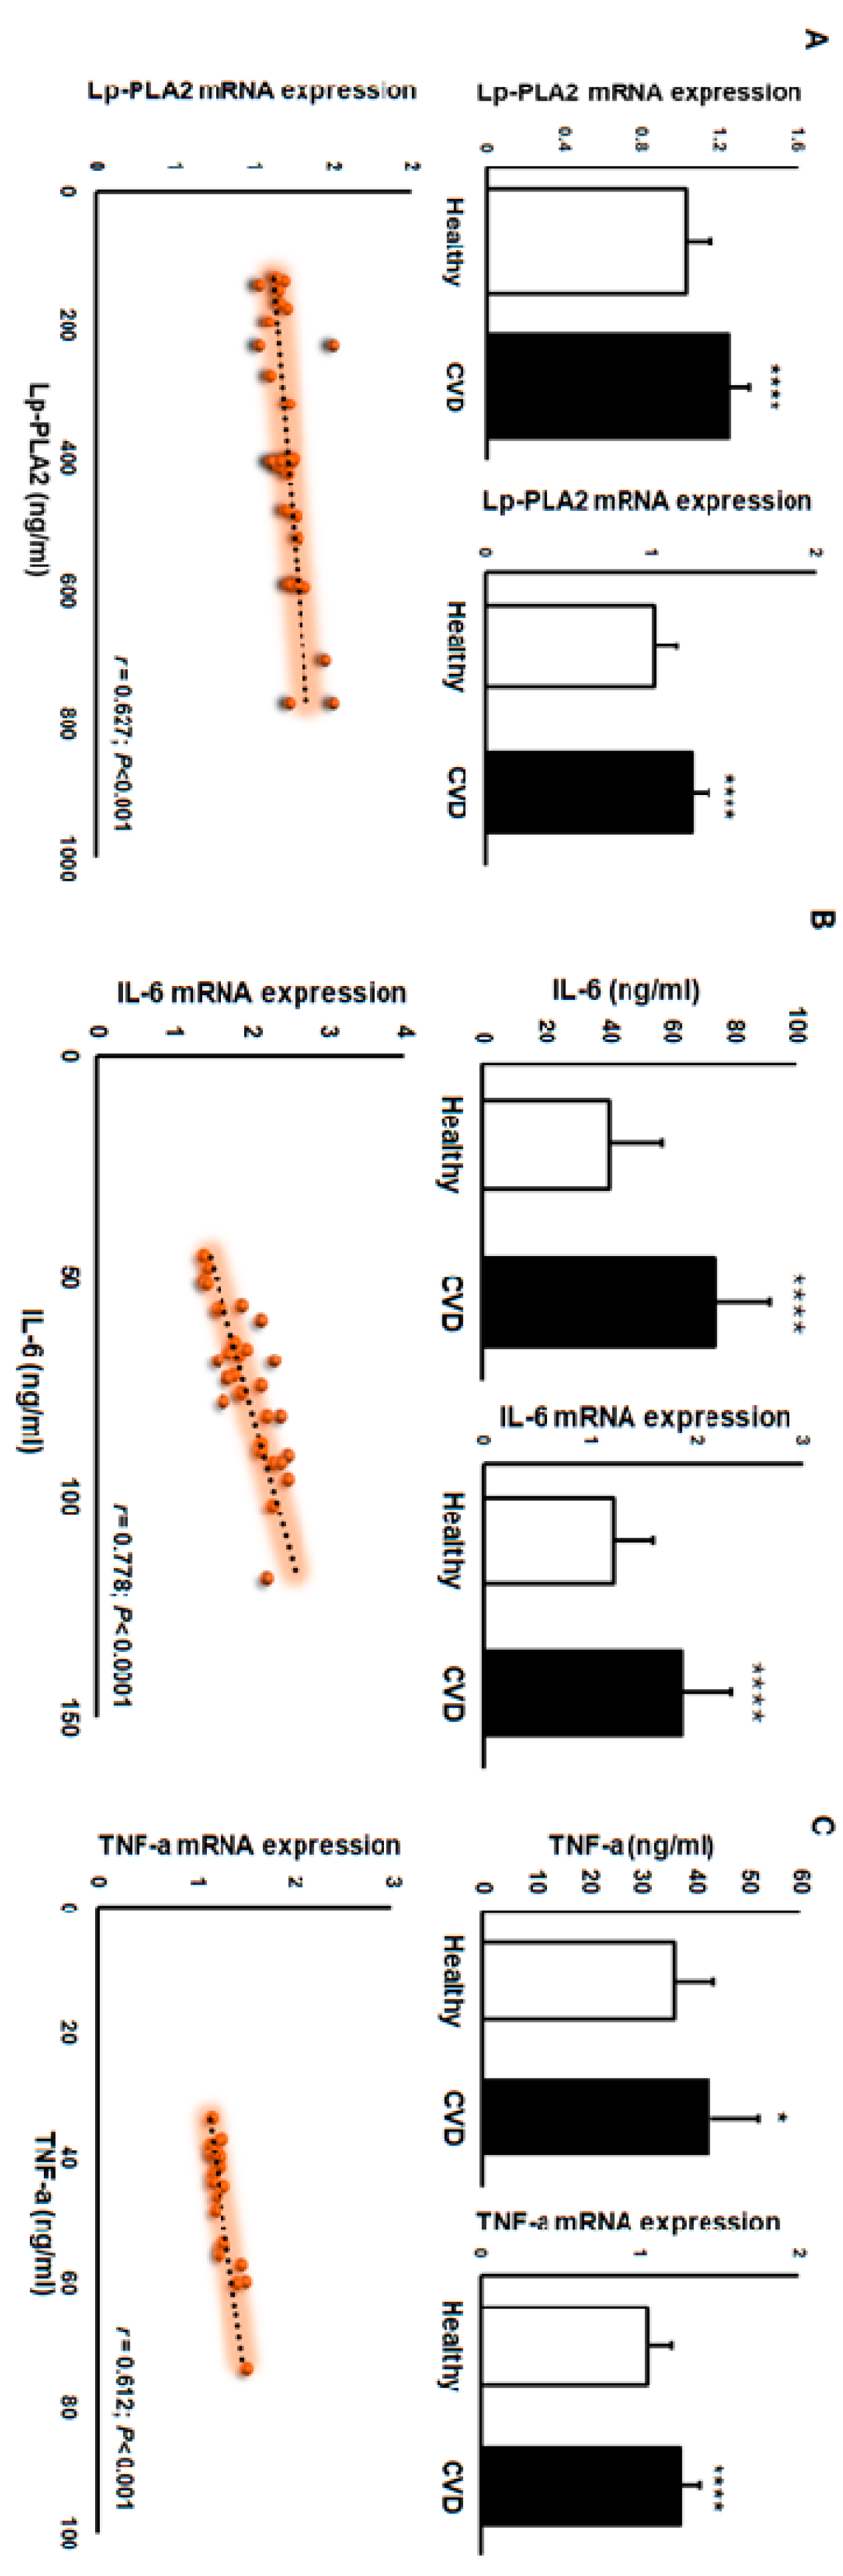
Figure 2.
Correlation of Lp-PLA₂ with inflammatory and lipid markers in pooled biochemical data. Panels show scatter plots of Lp-PLA₂ (x-axis) versus each marker (y-axis) with a least-squares regression line. Numbers on each panel are Pearson’s r and two-sided p-values. (A) TNF-α: r = 0.36; p<0.01, (B) IL-6: r = 0.75; p<0.0001 (C) LP-a: r = 0.71; p<0.0001, (D) ox-LDL: r = 0.85; p<0.0001, (E) TC: r = 0.64; p<0.0001, (F) LDL: r = 0.80; p<0.0001, (G) TG: r = 0.19; p = 0.146 (not significant), (H) HDL: r = −0.44; p<0.001 (inverse association).
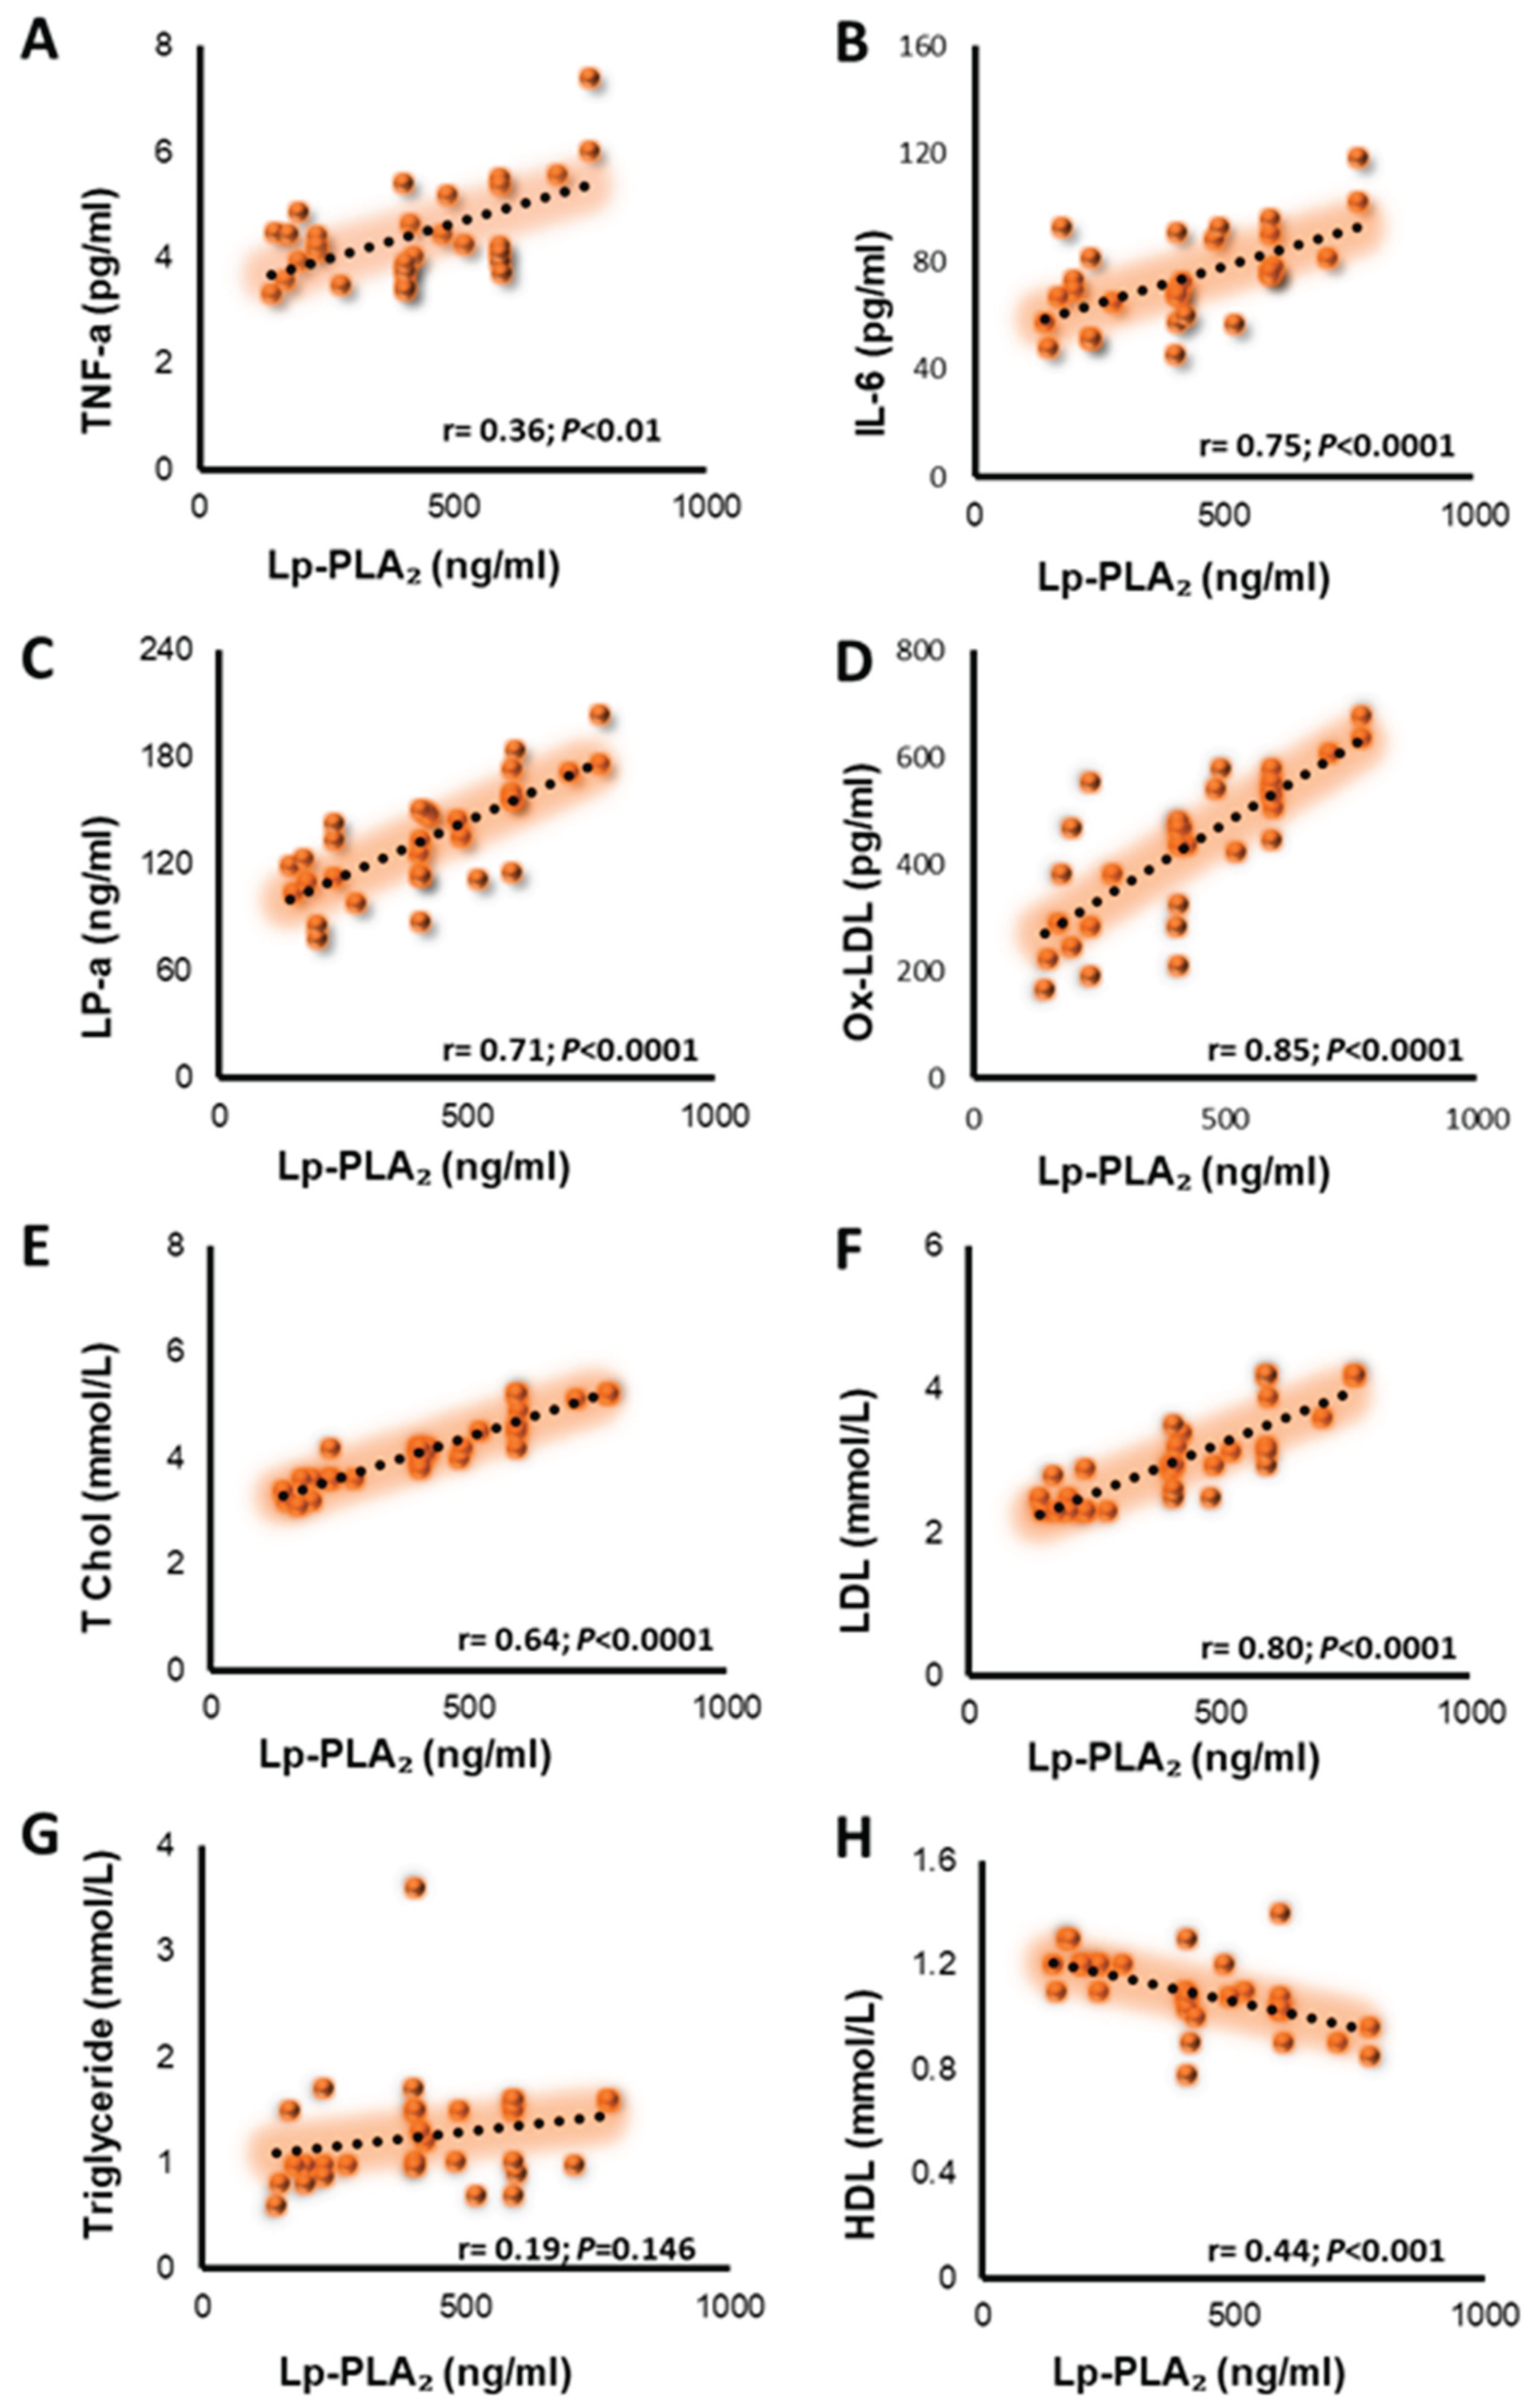

Table 1.
Clinical and biochemical characteristics of healthy and CVD participants.
| Healthy | CVD | P-value | |||||||
| Age | 53+14 | 55+10 | |||||||
| BMI | 26+1 | 29+5 | 0.01 | ||||||
| Hb (g/dL) | 14+1 | 14+3 | |||||||
| Glucose (mmol/L) | 5.8+1.5 | 6.8+2 | 0.05 | ||||||
| Cholesterol (mmol/L) | 3.6+0.5 | 4.2+0.6 | 0.001 | ||||||
| HDL (mmol/L) | 1.3+0.3 | 1.1+0.1 | 0.001 | ||||||
| LDL (mmol/L) | 1.8+0.6 | 3+0.6 | 0.00001 | ||||||
| Triglycerides(mmol/L) | 1.3+0.5 | 1.3+0.5 | |||||||
| ALT (IU/L) | 22+7 | 38+30 | 0.05 | ||||||
| Creatinine (umol/L) | 81+12 | 107+24 | 0.001 | ||||||
| Urea (mmol/L) | 4.8+1.2 | 10+5 | 0.01 | ||||||
Data are means +SD tested by t-test. P-value: p<0.05, 0.01, 0.001, 0.00001.
Table 2.
Hematology characteristics.
| Healthy(mean±SD) | CVD(mean±SD) | P-vaule | |||
| WBC (10e3/uL) | 7+1.6 | 10.6+5 | 0.001 | ||
| RBC (10e6/uL) | 5+0.35 | 4.7+0.9 | |||
| Hematocrit % | 43+3 | 43+8 | |||
| MCV (fL) | 83+4 | 90+3.7 | 0.0001 | ||
| MCH (pg) | 27+2 | 29+2 | 0.01 | ||
| MCHC (g/dL) | 33+1.2 | 32+1.3 | 0.01 | ||
| RDW-CV % | 13+1.5 | 12+2 | 0.05 | ||
| MPV (fL) | 10+0.6 | 8+1.2 | 0.001 | ||
| Platelets (10e3/uL) | 268+50 | 275+103 | |||
| Neutrophils % | 47+11 | 65+11 | 0.0001 | ||
| Lymphocytes % | 40+10 | 22+11 | 0.0001 | ||
| Monocytes % | 8+1.8 | 8.6+2.3 | |||
| Eosinophils % | 3+1.3 | 2.3+1.3 | 0.05 | ||
| Basophils % | 0.7+0.2 | 0.8+0.3 | 0.05 |
Data are means +SD tested by t-test. P-value: p<0.05, 0.01, 0.001, 0.00001.
Table 3.
Estimated levels of cardiovascular disease markers among patients and healthy individuals.
| Measure | Healthy (mean±SD) | CVD (mean±SD) | p-value |
| Lp-PLA2 (ng/ml) | 101+31 | 419+185 | 0.0001 |
| IL-6 (ng/ml) | 40+17 | 74+17 | 0.0001 |
| TNF-a (ng/ml) | 3.6+0.8 | 4.3+0.9 | 0.0001 |
| ox-LDL (nmol/ml) | 242+66 | 430+147 | 0.0001 |
| LP-a (ng/ml) | 90+33 | 134+31 | 0.0001 |
| FABP3 (ng/ml) | 3.1+0.1 | 3.4+1 | ns |
Data are means +SD tested by t-test. P-value: p<0.05, 0.01, 0.001, 0.00001.
Disclaimer/Publisher’s Note: The statements, opinions and data contained in all publications are solely those of the individual author(s) and contributor(s) and not of MDPI and/or the editor(s). MDPI and/or the editor(s) disclaim responsibility for any injury to people or property resulting from any ideas, methods, instructions or products referred to in the content. |
© 2025 by the authors. Licensee MDPI, Basel, Switzerland. This article is an open access article distributed under the terms and conditions of the Creative Commons Attribution (CC BY) license (http://creativecommons.org/licenses/by/4.0/).
Copyright: This open access article is published under a Creative Commons CC BY 4.0 license, which permit the free download, distribution, and reuse, provided that the author and preprint are cited in any reuse.


