
Submitted:
06 November 2025
Posted:
06 November 2025
You are already at the latest version
Abstract
Building energy consumption constitutes a major source of carbon emissions. The heating energy consumption of rural buildings in the Hot Summer and Cold Winter (HSCW) zone has increased 575-fold over the past 15 years due to many notable contrasts with northern cities in China. Thus, this research investigated the Solar-Air Source Heat Pump (SASHP) system to address the heating demands of rural residences in the HSCW zone. A model of the typical rural building in Hangzhou city was developed firstly, revealing an average heating load of 3.38 kW and a peak load of 5.9 kW. Then, the SASHP system was designed and subsequently optimized to minimize the annualized cost. The optimization yielded key parameters: a solar collector area of 15 m² with a 41° tilt angle, a water tank of 0.3m3 volume and an air source heat pump with a rated power of 10.125 kW. Concretely, the optimized system achieved a coefficient of performance of 3.67 for the overall system, while maintaining the indoor thermal comfort within ISO 7730 Category II standards. Compared to the designed system, the optimized configuration reduced the initial investment and the annual operating costs by 40.75% and 33.09% respectively. On the whole, the optimization significantly enhances the economic viability of SASHP systems, providing a sustainable pathway facilitating carbon neutrality in China.
Keywords:
TRNSYS
; residential heating
; solar
; air source heat pump
; hot summer and cold winter zone
1. Introduction
Currently, energy issues constitute a critical concern for socio-economic development and command significant international attention. This prominence stems from three primary challenges associated with fossil fuel dependence. Firstly, fossil fuel combustion drives substantial CO₂ emissions, exacerbating global warming. In response, China announced ambitious targets at the 75th UN General Assembly (2020) to peak CO₂ emissions by 2030 and achieve carbon neutrality by 2060 [1], reaffirming its commitment to green transition and the Paris Agreement at the 79th session (2024) [2]. Renewable energy development is a scientifically sound pathway to meet these goals, mitigating climate change impacts like extreme weather and biodiversity loss. Secondly, the finite nature and uneven geopolitical distribution of fossil fuels lead to supply insecurities and price volatility, as recent global conflicts underscore, highlighting the imperative for transitioning towards resilient and sustainable energy systems to ensure energy independence and security [3]. Thirdly, the use of fossil fuels produces harmful pollutants, resulting in severe air pollution and acid rain. Conversely, renewable energy sources generate near-zero emissions, which could significantly reduce public health issues, including an estimated five million annual deaths linked to air pollution.
In China, rapid economic growth and evolving consumption patterns have escalated energy demand, making it a major carbon emitter [4]. The building operations sector is a crucial focus, accounting for 30% of global final energy consumption [5]. Space heating alone represents 11% of global final energy consumption, with 63% of heat derived directly from fossil fuels [6]. Therefore, decarbonizing heating systems is crucial for achieving carbon neutrality ambitions [6,7,8].
Heating strategies in China exhibit strong regional disparities due to the historical ‘North-South Heating Divide’ policy in 1950, which limited centralized heating infrastructure largely to areas in the north of the Qinling-Huaihe line [4,9]. This policy aimed to conserve resources but resulted in lower winter thermal comfort, especially in the Hot Summer and Cold Winter (HSCW) zone [10], which experiences harsh, humid winters with indoor temperatures notably 6℃ lower than in climatically similar regions like the UK [9,11]. In China, given the enormous building stock, the operational carbon emissions of buildings in HSCW zones reached 650 million tons of CO₂ in 2020 [12], with rural residential buildings accounting for 20% of this total. Although traditionally classified as non-heating areas, HSCW zones experience prolonged cold and damp winters. In recent years, frequent freezing rain and snowstorms in southern China have led to record-low temperatures, significantly disrupting daily life and economic activities. As living levels improve, the demand for winter heating in these areas has become increasingly urgent [13], resulting in a 575-fold increase in residential heating energy consumption over 15 years [14]. However, due to distinct climatic conditions, building typologies, and lifestyle patterns, heating strategies used in northern rural areas or urban settings cannot be directly applied to southern rural China. In response, a growing number of households have adopted decentralized heating systems, which include individual household and district heating [6]. Currently, nearly 60% of heating in the zone relies on inefficient air conditioning units[15], leading to sharp rise in electricity consumption primarily generated from fossil fuels, thus being unable to meet the electricity supply-demand balance [16] and indirectly generating significant carbon emissions [5]. In addition, high operational costs also limit broader uptake [17]. All these underscore the potential of renewable-based heating to improve economic accessibility. Therefore, analyzing household heating energy use in China’s HSCW zones and identifying suitable heating methods are critical for supporting rural revitalization and achieving the nation’s dual carbon goals.
Additionally, China has steadily amplified its support for renewable energy, with the government actively promoting “Assessment Standard for Green Building” (GB/T 50378-2019) [18] and “Renewable Energy Law of the People’s Republic of China”. Furthermore, regional governments have rolled out energy-saving policies that encourage the utilization of solar energy not only for domestic hot water but also for space heating [17].
China’s solar energy resources are categorized into five zones according to solar radiation levels. Most cities in the HSCW zone belong to the medium resource category (Zone III), with some falling into the low-resource tier (Zone IV) [19]. While solar resources in the HSCW zone are less abundant relative to other parts of China, solar radiation intensity in the HSCW zone remains higher than in European nations such as Denmark, where solar heating is extensively utilized [20]. Consequently, despite comparative disadvantages, solar heating technologies can still fulfill winter heating requirements in the HSCW zone.
However, solar thermal systems often require auxiliary heat sources due to intermittency [21]. In the HSCW zone, electricity is commonly used for this purpose [19] via electric heaters, blankets, or AC units, etc. However, this approach is inefficient due to the exergy degradation involved in converting high-exergy electricity to low-exergy heat, in addition to being costly and slow-responding [22]. Gas boilers offer an alternative auxiliary source [8], but still contribute to CO₂ emissions. Comparative research indicates that Solar Air Source Heat Pump (SASHP) systems achieve significantly higher exergy efficiency (2-3 times) than solar-gas boiler systems [23]. By leveraging dual heat sources [24] and enabling multi-energy synergy [25], SASHP systems are especially suitable for the HSCW zone, where winter temperatures are moderate (0–10 °C). This configuration reduces frosting risks [26] and outperforms conventional Air Source Heat Pumps (ASHPs). Notably, SASHP systems have been deployed across multiple global applications [27]. For enhancing the system’s reliability, efficiency, and cost-effectiveness, the inherent challenges of solar intermittency and declining ASHP performance at lower temperatures can be mitigated by integrating thermal energy storage (TES) technologies, such as water storage tanks [21], phase change materials or sand-based floors [28]. Among these, the water storage tank, which is a widespread solution for sensible heat storage, has been demonstrated to substantially improve the system’s Coefficient of Performance (COP) [29]. Additionally, the size of the storage tank is a critical factor influencing energy efficiency, solar fraction, and overall energy consumption [21].
Above all, this study aims to provide a theoretical foundation for enhancing the energy efficiency of solar heating systems in rural residential buildings in China’s HSCW zone. Its findings are intended to support the widespread adoption of distributed solar heating technology, contributing significantly to the energy conservation and the facilitation of carbon neutrality goals. Thus, in Section 2, the building model and heat load are developed. Later, Section 3 introduces the design scheme of the SASHP heating system referencing to the standards in China. Subsequently, in Section 4, the performances of the optimized SASHP heating system are analyzed and compared with the results corresponding to the design proposal. Finally, Section 5 concludes this study.
2. Building Model and Heating Load
2.1. Parameters of Building
This project is located in Hangzhou, Zhejiang Province. The residential room dimensions are 14m (Length) × 7m (Width) × 3.5m (Height) with a building volume of 343m3. Additionally, the room features 3 south-facing thermally broken aluminum windows with each area of 3.2m×2.3m. Occupancy is 3 persons. A 3D model of the residence was developed using SketchUp as shown in Figure 1. As well, the enclosure structure and external window parameter settings of this residential building are shown in Table 1.
According to the local standard of China, “Energy Efficiency Design Standards for Residential Buildings in Zhejiang Province” (DB33/1015-2021) [30], the ventilation rate of the residence is 1 time/h, and the indoor design temperature in winter is 18℃. Hangzhou city is located in the northern zone of the Summer Hot and Winter Cold Zone. Its heating date is from December 15th to February 20th in the following year (a total of 68 days). The heating time of the building is set to 24 hours without interruption.
In terms of thermal comfort, according to the relevant provisions of the “Evaluation Standards for Indoor Thermal Environment of Civil Buildings” (GB/T50785-2012) [31], the thermal resistance of clothing is set to 1.3clo, and the common activities in this building are seated activities with a metabolic rate of 69.78W/m2.
Indoor heat sources include persons, lighting, and equipment. According to the national standard of China, “General Code for Building Energy Efficiency and Renewable Energy Utilization”(GB55015-2021) [32], the lighting power of residential buildings is set as 5W/m2, including 3W/m2 for radiant heat dissipation and 2W/m2 for convective heat dissipation. The power of equipment in the residential building is 3.8W/m2, of which the radiation heat dissipation is 2.28W/m2 and the convection heat dissipation is 1.52 W/m2. The heat dissipation of the human body is set to 100kJ/h.
Note that the hydraulic loss and the thermal resistance of the exterior wall coating are not taken into account in this study.
2.2. Parameters of Climate
Hangzhou city is located in a subtropical monsoon climate zone. The weather data is exported using Meteonorm8 software and transferred to the weather module in TRNSYS as an external file. The dry bulb temperature in Hangzhou is shown in Figure 2, from which it can be seen that the annual temperature in Hangzhou is within the range of -5℃~40℃. That is to say, there is quite a lot of heat that can be extracted for the ASHP.
Figure 3 shows the annual horizontal solar radiation distribution in Hangzhou. The annual average solar radiation is 494kJ/(h·m2). During the heating season from December 15th to February 20th of the next year, the solar radiation is roughly 1000-1500kJ/(h·m2). It can be seen that Hangzhou is rich in solar energy resources. Thus solar energy can effectively be used as a heating source.
2.3. Heating Load
The total heat load Q comprises three components,
where Qenvelope denotes the basic heat loss through the building envelope structure, W, and it meets
where K is the thermal transmittance of the envelope structure, W/(m2·℃); A represents the surface area of the envelope structure, m2; tin is the indoor design temperature, ℃; tw denotes the outdoor temperature of heating, ℃; α is the temperature difference correction factor.
In Equation (1), Qinfiltration denotes heat consumption for cold air infiltration, and it meets
where V refers to the air infiltration rate, m3/h; ρ is the air density, kg/m3; cp is the specific capacity of air, kJ/(kg·℃).
In addition, in Equation (1), Qintrusion denotes the heat loss from cold air intrusion through external doors, W, and it meets
where N is the additional coefficient of external door considering cold air intrusion; Qdoor is the basic heat loss of the external door, W.
The heat load simulation model is developed using TRNSYS as shown in Figure 4. To ensure calculation accuracy, a simulation time step of 0.125 hours is adopted. Consequently, the TRNSYS model successfully outputs hourly heating loads, with the corresponding results presented in Figure 5.
It is shown that the heating load profile of the single-unit small-scale building exhibits minimal variability during the heating season. All load values are negative, indicating consistent heating demand. The system achieves a peak heating load of 5.9 kW and an average load of 3.38 kW.
3. Design Scheme of the SASHP Heating System
3.1. SASHP System Model
Based on the integrated analysis, the building employs the SASHP system for heating applications. To simulate the system performance, the SASHP system was modeled in TRNSYS using a modular approach, with critical components such as the solar collector (Type1b) and ASHP (Type941) explicitly defined. For reproduction, a comprehensive list of TRNSYS modules is provided in Table 2. Furthermore, the full simulation architecture, which illustrates component interconnections, is detailed in Figure 6.
3.2. Control Strategy for the SASHP System
The hybrid heating system employs a dual-condition control strategy consisting of time-based control and temperature-difference control to optimize energy utilization. As shown in Figure 7, which illustrates the control logic, the solar collector operates diurnally (6:00–18:00), while the ASHP provides auxiliary heating during low-insolation periods. The temperature-difference threshold ΔT between the outlet of the solar collector and the heating system inlet (ΔT≥8 °C for solar-side pump activation; ΔT≤2 °C for ASHP activation) ensures efficient solar energy harvesting. Meanwhile, when the solar collector stops, the ASHP is dynamically activated based on tank temperature (<44 °C for activation; >45 °C for deactivation), achieving a balance between energy efficiency and thermal comfort.
3.3. Design Parameter Calculations for Equipment Selection
3.3.1. Solar Collector Area
As a core component of the heating system, the solar collector area directly impacts both energy collection efficiency and economic performance. The collector area Ac is calculated using the following formula,
where Qa refers to the building heating demand, Qa =5900 W; IT refers to the average solar irradiance on the tilted surface, Ac=12,371,970 J/(m²·h); f is the solar fraction, f =45%; η refers to the average collector efficiency during the heating period, η=60%; ξ is the heat loss coefficient of the thermal storage tank, ξ=0.2 here.
3.3.2. Nominal Heating Capacity of ASHP
The nominal heating capacity of the ASHP is adjusted according to outdoor design dry-bulb temperature, defrost frequency, and relative humidity as follows [33],
where Qactual refers to the actual heating capacity of the ASHP (kW); kt is the temperature correction factor (0.9 for Hangzhou, interpolated from “Design Code for Heating Ventilation and Air Conditioning of Civil Buildings” (GB 50736-2012) [34]; kd is the defrost correction factor (0.9 for once per hour; 0.8 for twice per hour); kh is the humidity correction factor (0.9 for Hangzhou). Note that the correction curves for ASHP performance (Type941) under varying ambient temperatures and supply water temperatures are provided in Figure 8~Figure 9. Lower ambient temperatures and higher outlet water temperatures significantly increase energy demand, highlighting the need for optimized control strategies in cold climates.
3.3.3. Thermal Storage Tank Volume
The thermal storage tank volume V is determined by balancing the peak heating demand and temperature differential, calculated as follows.
where Qmax is the daily peak heating load (5.9 kW); ρ is the water density, adopted as 1000 kg/m3; c is the specific heat capacity of water, adopted as 4.18 kJ/(kg·K); ΔT is the supply-return temperature difference, adopted as 10 °C.
3.3.4. Solar Collector Side Pump Flow Rate
According to the “Technical Standards for Solar Heating and Heating Engineering” (GB50495-2019) [35], the recommended flow rate per unit collector area ranges from 0.015 L/(s·m²) to 0.020 L/(s·m²). The solar collector side pump flow rate (kg/h) is calculated as follows.
3.3.5. ASHP Side Pump Flow Rate
The ASHP side pump flow rate GASHP is derived from the heat pump’s rated capacity and temperature difference, calculated as follows.
where Qhp refers to ASHP rated heating capacity, W; Tsupply refers to the supply water temperature, Tsupply=45 °C; Treturn denotes the return water temperature, Treturn=35 °C.
3.3.6. Pump Power
The pump power P is calculated considering the total head and efficiency, calculated as followed.
where G is the water flow rate, measuring in kg/h; H refers to the total head, adopted as 6 m based on building height 3.5m plus 2.5m safety margin; η is the pump efficiency, assumed as 70%.
Above all, the key parameters of the equipment for the SASHP system are shown in Table 3.
3.4. Design Scheme Results
3.4.1. Supply and Return Water Temperatures
The heating time is calculated as 1608 hours totally (from 8352h to 9960h). To balance computational accuracy and efficiency, a time step of 0.125h is adopted for this heating simulation. The temporal variations of supply and return temperatures are depicted in Figure 10. As illustrated in Figure 10, the system achieves stable hydronic temperature profiles post-equipment sizing. The supply water temperature remains within 45±1 °C, and the return water temperature consistently exceeds 35 °C, fully complying with the design requirement of 45/35 °C supply-return water temperatures. This validation confirms the robustness of component selection and control logic.
3.4.2. Energy Consumption Analysis
The cumulative energy distribution analysis is illustrated in Figure 11. During the heating season, the heating system consumed a cumulative total energy of 1,354.01kWh, with 1,252.80kWh from the ASHP, 18.45kWh from the heating water pump, and 82.77kWh from the circulating pump. Summarily, the ASHP dominates the total consumption (92.5%), while the solar collector pump accounts for only 6.1%. This underscores the importance of optimizing ASHP efficiency in hybrid heating systems.
Figure 12 presents the actual heating capacity of the ASHP. It can be shown that the coefficient of performance (COP) of the heat pump exhibits continuous variation due to multiple ambient factors, including outdoor temperature and humidity. Moreover, calculation results indicate an average COP of 2.43 for ASHP and 3.67 for the heating system, as shown in Figure 13. The higher COP of the overall system compared to that of a single heat pump unit indicates that an integrated designed system enhances comprehensive energy efficiency.
3.4.3. Thermal Comfort
The thermal comfort is calculated based on the room’s geometric center point, with coordinate parameter (x, y, z) = (18, 20.5, 1.7), at which the PMV-PPD curve is plotted in Figure 14. According to the Class C thermal comfort range specified in “Ergonomics of the Thermal Environment—Analytical Determination and Interpretation of Thermal Comfort Using Calculation of the PMV and PPD Indices and Local Thermal Comfort Criteria” (GB/T 18049-2017/ISO 7730:2005) [36], PMV ranges from -0.7 to +0.7 with corresponding PPD≤15%. Meanwhile, the system outputs in this study are PMV ranging from -0.09 to -0.79 with corresponding PPD ranging from 5% to 17%. That is to say that the room satisfies Level C thermal comfort conditions.
4. Optimization of the SASHP System
GenOpt, which is developed on the Java platform, couples with TRNSYS simulation software to address optimization challenges in complex system interactions. And the bridging interface between TRNSYS and GenOpt is the TRNOPT module, a component of the TESS library in TRNSYS. In this study, the GenOpt-TRNSYS framework employs the Hooke-Jeeves algorithm, which is known as the “pattern search method” or “step-size acceleration method” and is widely used in unconstrained optimization for non-differentiable functions.
4.1. Optimizing Configurations
The optimization objective is to minimize the annualized cost, considering four optimization variables, including collector area, rated heating capacity of the ASHP, ratio of storage tank volume to collector area, and the tilt angle of the solar collector. Afterward, the following parameters should be configured in TRNOPT: initial guess value, lower bound, upper bound, and step size for each optimization variable; selection of the annualized cost function as the target variable. To prevent temperature imbalance during optimization—where excessive focus on cost reduction might compromise heating performance—a penalty mechanism is introduced. If the storage tank temperature fails to reach 43 °C within two hours of system startup or drops below 43 °C during operation, an economic penalty is triggered. A fixed penalty of ¥5,000 per hour is added to the annualized cost for each hour of non-compliance. The significant disparity between penalty costs and normal operating expenses ensures the optimization process inherently to avoid situations below 43 °C.
where AEC is the annual equivalent cost, ¥/year;
C0 indicates the initial investment, ¥;
i is the interest rate, which is taken as 5.66% here;
m is the service life, taken as 15 years here;
C is the annual operating cost, ¥/year, including penalty fees and power consumption fees such as ASHPs.
The initial investment C0 includes investments in equipment such as solar collectors, ASHP, thermal storage water tanks, and water pumps. The initial investment calculation formula is as follows:
where ASS is the area of the collector, m2;
CSC indicates the cost per square meter of collector area, ¥/m2;
RHP represents the customized heat for ASHP, kW;
CHP denotes customized heat equipment cost per unit for ASHP, ¥/kW;
VST is the capacity of the hot water storage tank, m3;
CST represents the cost per cubic meter of a hot water storage tank, ¥/m3;
CFJ indicates the cost of the water pump, ¥.

Table 4.
System equipment price list.
| Device | Unit price |
| ASHP | =1000 yuan/kW |
| Solar collector | =300 yuan/m2 |
| Heat storage water tank | =600 yuan/m3 |
| Water pumps and other equipment | CFJ = 20% of the total price of the above three devices |
The operating cost C is the cost generated by the electricity consumption of the equipment, and its formula is as follows:
where WHP is the power consumption of the ASHP, kWh;
WJH indicates the power consumption of the heating pump, kWh;
WCH represents the power consumption of the heat pump, kWh;
MD denotes the electricity price, shown in Table 5.
4.2. Optimized Results
After determining the optimization variables and objective function, the initial value, minimum value, maximum value, and iteration step of the optimization variables are configured in GENOPT as shown in Table 6.
The comparisons before and after optimization are shown in Table 7 and Figure 15~Figure 16. It can be seen that the optimized collector area and heat pump rated heat output have significantly decreased. After optimization, the area of the collector was decreased by 23.63, with a decrease ratio of 61.17%. As well, the tilt angle of the collector was decreased by 4, with a decrease ratio of 8.89%. According to “Technical Standards for Solar Heating and Heating Engineering” (GB50495-2019)[35], the tilt angle of the solar collector used throughout the year should be the local latitude(30°15’ in Hangzhou) plus 10°, resulting in 40°15’, which is very close to the optimized result. And the rated heat output of the heat pump decreased by 0.875, with a decrease ratio of 7.95%; the volume of the thermal storage water tank was decreased by 0.86, with a decrease ratio of 74.14%. As a result, the initial investment was decreased by ¥9881, with a decrease ratio of 40.75%. AEC was decreased by ¥1006.06, with a decrease ratio of 33.09%. Above all, the optimized equipment parameters are more economical.
5. Conclusions
Through rigorous modeling, simulation, and optimization algorithms, this research validated the technical viability and economic attractiveness of the SASHP system for rural residential heating in the HSCW climate zone. The optimized system achieved significant reductions in capital and operational expenditures, positioning it as a competitive heating alternative. The main conclusions of this article are as follows:
- (1)
- The average building heat load during the heating season in Hangzhou is 3.38kW, with a maximum of 5.9kW.
- (2)
- In this design scheme, the supply and return water temperatures are generally within the range of 45/35 ℃. The cumulative total energy consumption of all equipment is 1,354.01kWh. The COP of the air source heat pump is 2.43, while the COP of the system is 3.67. The thermal comfort calculation is based on the center point of the room, and the results show that the room is in a C-level thermal comfort state.
- (3)
- After optimization using the Hooke-Jeeves algorithm, the collector area is 15m2, the collector water tank volume is 0.3m3, the tilt angle of the solar collector is 41°, and the rated heat of the ASHP is 10.125kW. Compared with the results before optimization, the initial investment of the heating system is reduced by 40.75%, and the annual cost is reduced by 33.09%.
Above all, the SASHP heating system directly addresses energy poverty and supports the carbon reduction objectives of China by boosting the integration of renewable energy.
Author Contributions
Conceptualization, Y.G.; methodology, Y.G. and L.F.; software, Y.G.; formal analysis, L.F.; writing—original draft preparation, L.F.; writing—review and editing, Y.G.; project administration, Y.G.; funding acquisition, Y.G. All authors have read and agreed to the published version of the manuscript.
Funding
This research was funded by the Fundamental Research Funds for the Hebei University of Water Resources and Electric Engineering (SYKY2103).
Data Availability Statement
The raw data supporting the conclusions of this article will be made available by the authors on request.
Conflicts of Interest
The authors declare no conflicts of interest.:
Abbreviations
The following abbreviations are used in this manuscript:
| ASHP | Air source heat pump |
| SASHP | Solar-air source heat pump |
| AEC | Annual economic cost |
| COP | Coefficient of Performance |
| HSCW | Hot Summer and Cold Winter |
References
- China. Statement at the general debate of the 75th session of the united nations general assembly. The 75th Session of the United Nations General Assembly. 2020, New York, USA, 22th September 2020.
- China. Statement at the general debate of the 79th session of the united nations general assembly. The 79th Session of the United Nations General Assembly. 2024, New York, USA, 19th September 2024.
- Bhadra, S.; Mwesigye, A. Influence of control strategy on the energetic performance of an air source heat pump coupled with a solar air collector for domestic hot water in a cold climate. Renew Energ 2025, 244: 122682.
- Qu, M.; Sang, X.; Yan, X.; Huang, P.; Zhang, B.; Bai, X. A simulation study on the heating characteristics of residential buildings using intermittent heating in hot-summer/cold-winter areas of china. Appl Therm Eng 2024, 241: 122360.
- Li, C.; Cheng, Y.; Kosonen, R.; Jokisalo, J.; Wu, Y.; Yuan, L.; Li, X.; Liu, H.; Li, B. Demand response control of heating system in office building based on adapted neutral temperature in hot summer and cold winter climate zone of china. Energy 2025, 332: 137156.
- Yang, Y.; Østergaard, P. A.; Wen, W.; Zhou, P. Heating transition in the hot summer and cold winter zone of china: District heating or individual heating? Energy 2024, 290: 130283.
- Liu, Y.; Zhou, Z.; Han, Y.; Wang, C.; Li, W.; Chen, Y.; Lian, Y.; Chen, H. Potential of carbon emissions from heating in hot summer and cold winter urban residential areas in china through 2050. Energ Buildings 2025, 341: 115790.
- Chen, Q.; Li, N. Energy, emissions, economic analysis of air-source heat pump with radiant heating system in hot-summer and cold-winter zone in china. Energy Sustain Dev 2022, 70: 10-22.
- Lin, B.; Wang, Z.; Liu, Y.; Zhu, Y.; Ouyang, Q. Investigation of winter indoor thermal environment and heating demand of urban residential buildings in china’s hot summer – cold winter climate region. Build Environ 2016, 101: 9-18.
- Wang, X.; Fang, Y.; Cai, W.; Ding, C.; Xie, Y. Heating demand with heterogeneity in residential households in the hot summer and cold winter climate zone in china -a quantile regression approach. Energy 2022, 247: 123462.
- Gao, Y.; Wu, J.; Cheng, Y. Study on the heating modes in the hot summer and cold winter region in china. Proce Eng 2015, 121: 262-267.
- Sun, Y. Hybrid prediction model of rural residential energy consumption in hot summer and cold winter zone, Master, Anhui University of Technology, Ma’anshan, 2023.
- Ye, X.; Lu, J.; Gong, Q.; Zhang, T.; Wang, Y.; Fukuda, H. Measuring effects of insulation renewal on heating energy and indoor thermal environment in urban residence of hot-summer/cold-winter region, china. Case Stud Therm Eng 2024, 61: 104982.
- Building Energy Efficiency Research Center, T. U. , 2024 annual report on the development research of building energy efficiency in china (special topic: Rural residential buildings). China Architecture & Building Press: Beijing, 2024; pp. 43-51.
- Jiang, H.; Yao, R.; Han, S.; Du, C.; Yu, W.; Chen, S.; Li, B.; Yu, H.; Li, N.; Peng, J.Li, B. How do urban residents use energy for winter heating at home? A large-scale survey in the hot summer and cold winter climate zone in the yangtze river region. Energ Buildings 2020, 223.
- Xu, C.; Li, S.; Zhang, X. Energy flexibility for heating and cooling in traditional chinese dwellings based on adaptive thermal comfort: A case study in nanjing. Build Environ 2020, 179: 106952.
- Li, T.; Liu, Q.; Wang, X.; Gao, J.; Li, G.; Mao, Q. A comprehensive comparison study on household solar-assisted heating system performance in the hot summer and cold winter zone in china. J Clean Prod 2024, 434: 140396.
- Ministry of Housing and Urban-Rural Development of the People’s Republic of China. Assessment standard for green building (GB/T 50378-2019), Beijing, 2019.
- Hu, S.; Yan, D.; Guo, S.; Cui, Y.; Dong, B. A survey on energy consumption and energy usage behavior of households and residential building in urban china. Energ Buildings 2017, 148: 366-378.
- Tschopp, D.; Tian, Z.; Berberich, M.; Fan, J.; Perers, B.; Furbo, S. Large-scale solar thermal systems in leading countries: A review and comparative study of denmark, china, germany and austria. Appl Energ 2020, 270: 114997.
- Ma, Y.; Xi, J.; Cai, J.; Gu, Z. Trnsys simulation study of the operational energy characteristics of a hot water supply system for the integrated design of solar coupled air source heat pumps. Chemosphere 2023, 338: 139453.
- Duan, M.; Wu, Y.; Sun, H.; Yang, Z.; Shi, W.; Lin, B. Intermittent heating performance of different terminals in hot summer and cold winter zone in china based on field test. J Build Eng 2021, 43: 102546.
- Salehi, S.; Yari, M.; Rosen, M. A. Exergoeconomic comparison of solar-assisted absorption heat pumps, solar heaters and gas boiler systems for district heating in sarein town, iran. Appl Therm Eng 2019, 153: 409-425.
- Li, H.; Zhang, K.; Fan, X.; Cheng, H.; Xu, G.; Suo, H. Effect of seawater ageing with different temperatures and concentrations on static/dynamic mechanical properties of carbon fiber reinforced polymer composites. Compos Part B-Eng 2019, 173: 106910.
- Ma, Y.; Xi, J.; Cai, J.; Gu, Z. The optimization and energy efficiency analysis of a multi-tank solar-assisted air source heat pump water heating system. Therm Sci Eng Prog 2024, 48: 102387.
- Wang, X.; Ding, C.; Zhou, M.; Cai, W.; Ma, X.; Yuan, J. Assessment of space heating consumption efficiency based on a household survey in the hot summer and cold winter climate zone in china. Energy 2023, 274: 127381.
- Yang, L. W.; Xu, R. J.; Hua, N.; Xia, Y.; Zhou, W. B.; Yang, T.; Belyayev, Y.; Wang, H. S. Review of the advances in solar-assisted air source heat pumps for the domestic sector. Energ Convers Manage 2021, 247: 114710.
- Yuan, P.; Huang, F.; Duanmu, L.; Zhu, C.; Zheng, H.; Li, P.; Cui, Y.; Li, H.; Du, Z. Performance analysis of solar-air source heat pump heating system coupled with sand-based thermal storage floor in rural inner mongolia, china. Case Stud Therm Eng 2025, 68: 105886.
- Wu, P.; Wang, Z.; Li, X.; Xu, Z.; Yang, Y.; Yang, Q. Energy-saving analysis of air source heat pump integrated with a water storage tank for heating applications. Build Environ 2020, 180: 107029.
- Zhejiang Provincial Department of Housing and Urban-Rural Development, Energy efficiency design standards for residential buildings in Zhejiang Province (DB33/1015-2021), Hangzhou, 2021.
- Ministry of Housing and Urban-Rural Development of the People’s Republic of China. Evaluation standards for indoor thermal environment of civil buildings (GB/T 50785-2012), Beijing, 2012.
- Ministry of Housing and Urban-Rural Development of the People’s Republic of China. General code for building energy efficiency and renewable energy utilization (GB 55015-2021), Beijing, 2021.
- Lu, Y., Practical handbook for heating and air-conditioning design, 2nd ed.; China Architecture & Building Press: Beijing, China, 2008; pp. 2347-2356.
- Ministry of Housing and Urban-Rural Development of the People’s Republic of China. Design code for heating ventilation and air conditioning of civil buildings (GB 50736-2012), Beijing, 2012.
- Ministry of Housing and Urban-Rural Development. Technical code for solar heating systems of buildings (GB 50495-2019), Beijing, 2019.
- General Administration of Quality Supervision, Inspection and Quarantine of the People’s Republic of China. Ergonomics of the thermal environment—analytical determination and interpretation of thermal comfort using calculation of the pmv and ppd indices and local thermal comfort criteria (GB/T 18049-2017/ISO 7730:2005), Beijing, 2017.
Figure 1.
3D model of the residence.
Figure 2.
Annual hourly outdoor dry bulb temperature in Hangzhou.
Figure 3.
Annual hourly horizontal solar radiation.
Figure 4.
Building load output model.
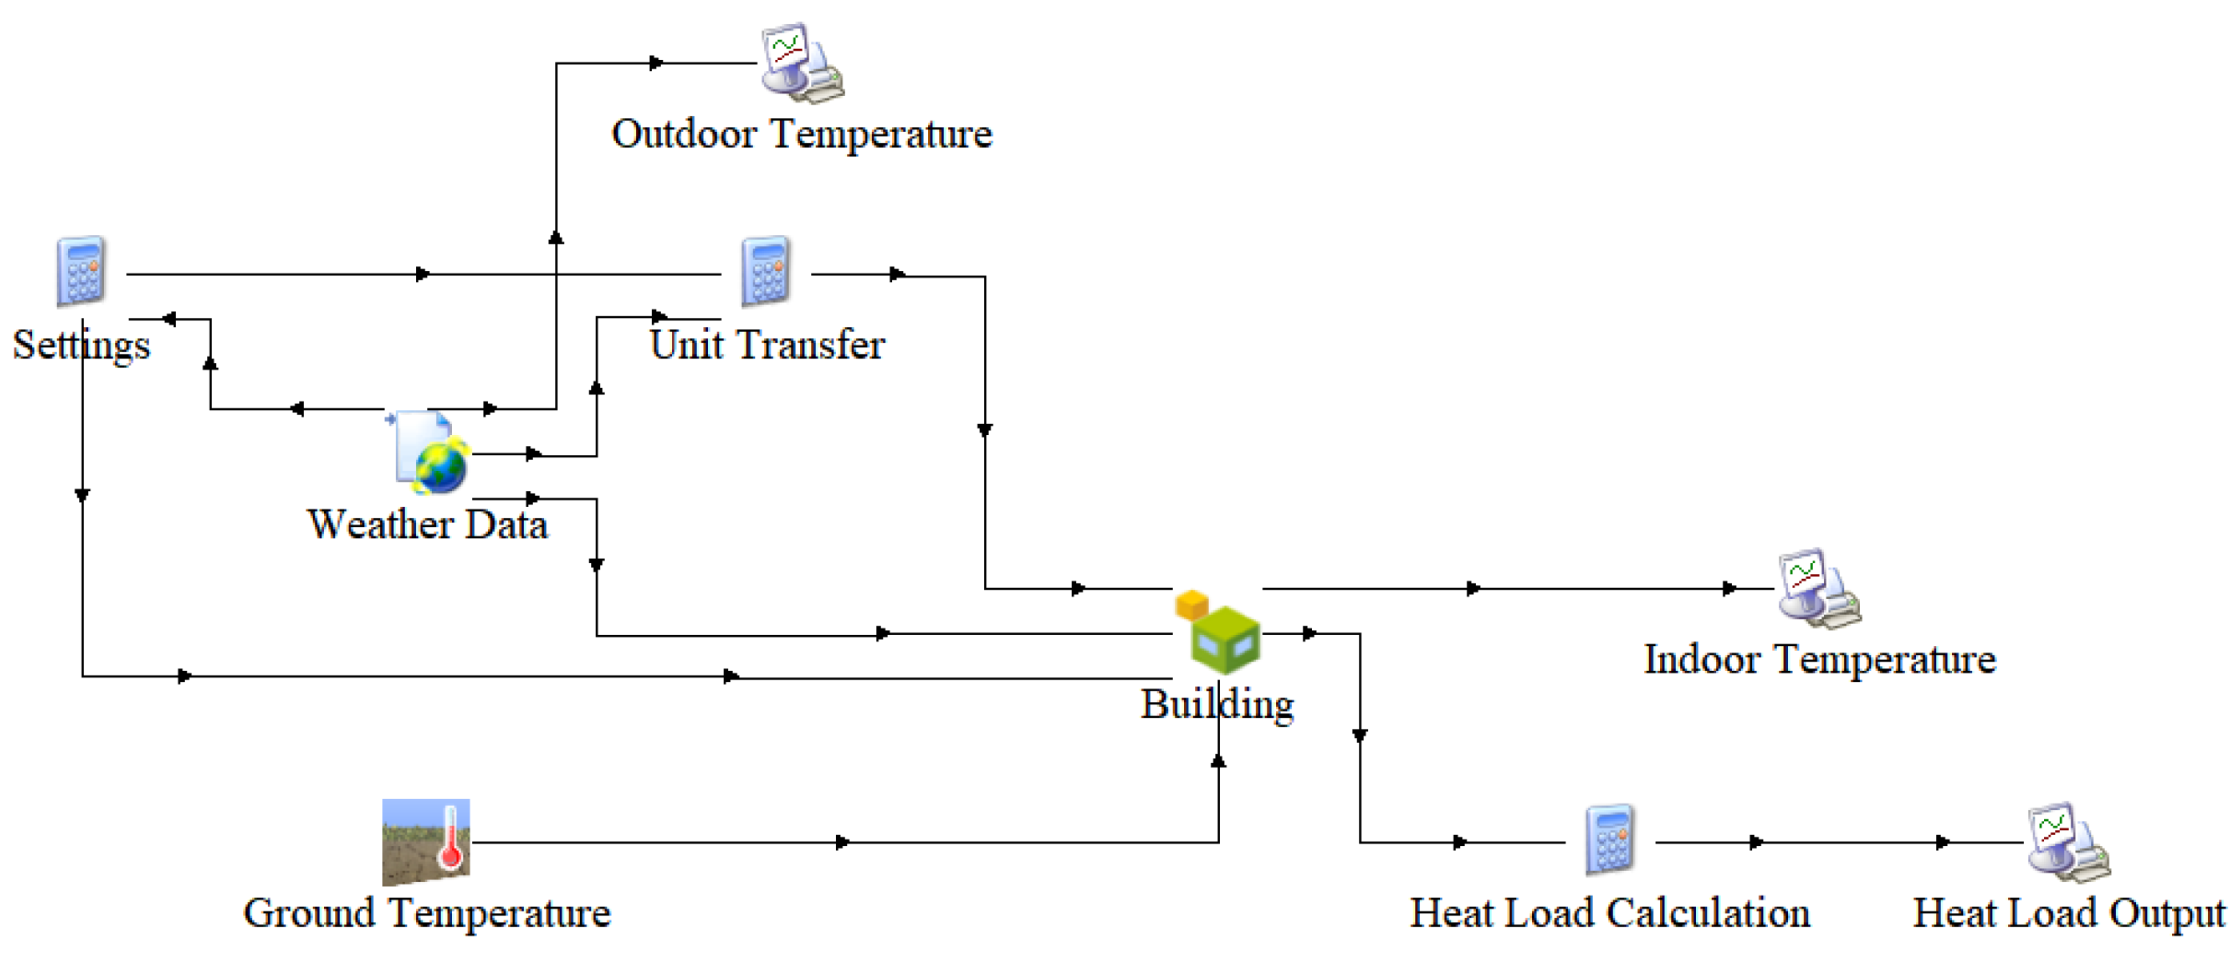
Figure 5.
Heat load output results.
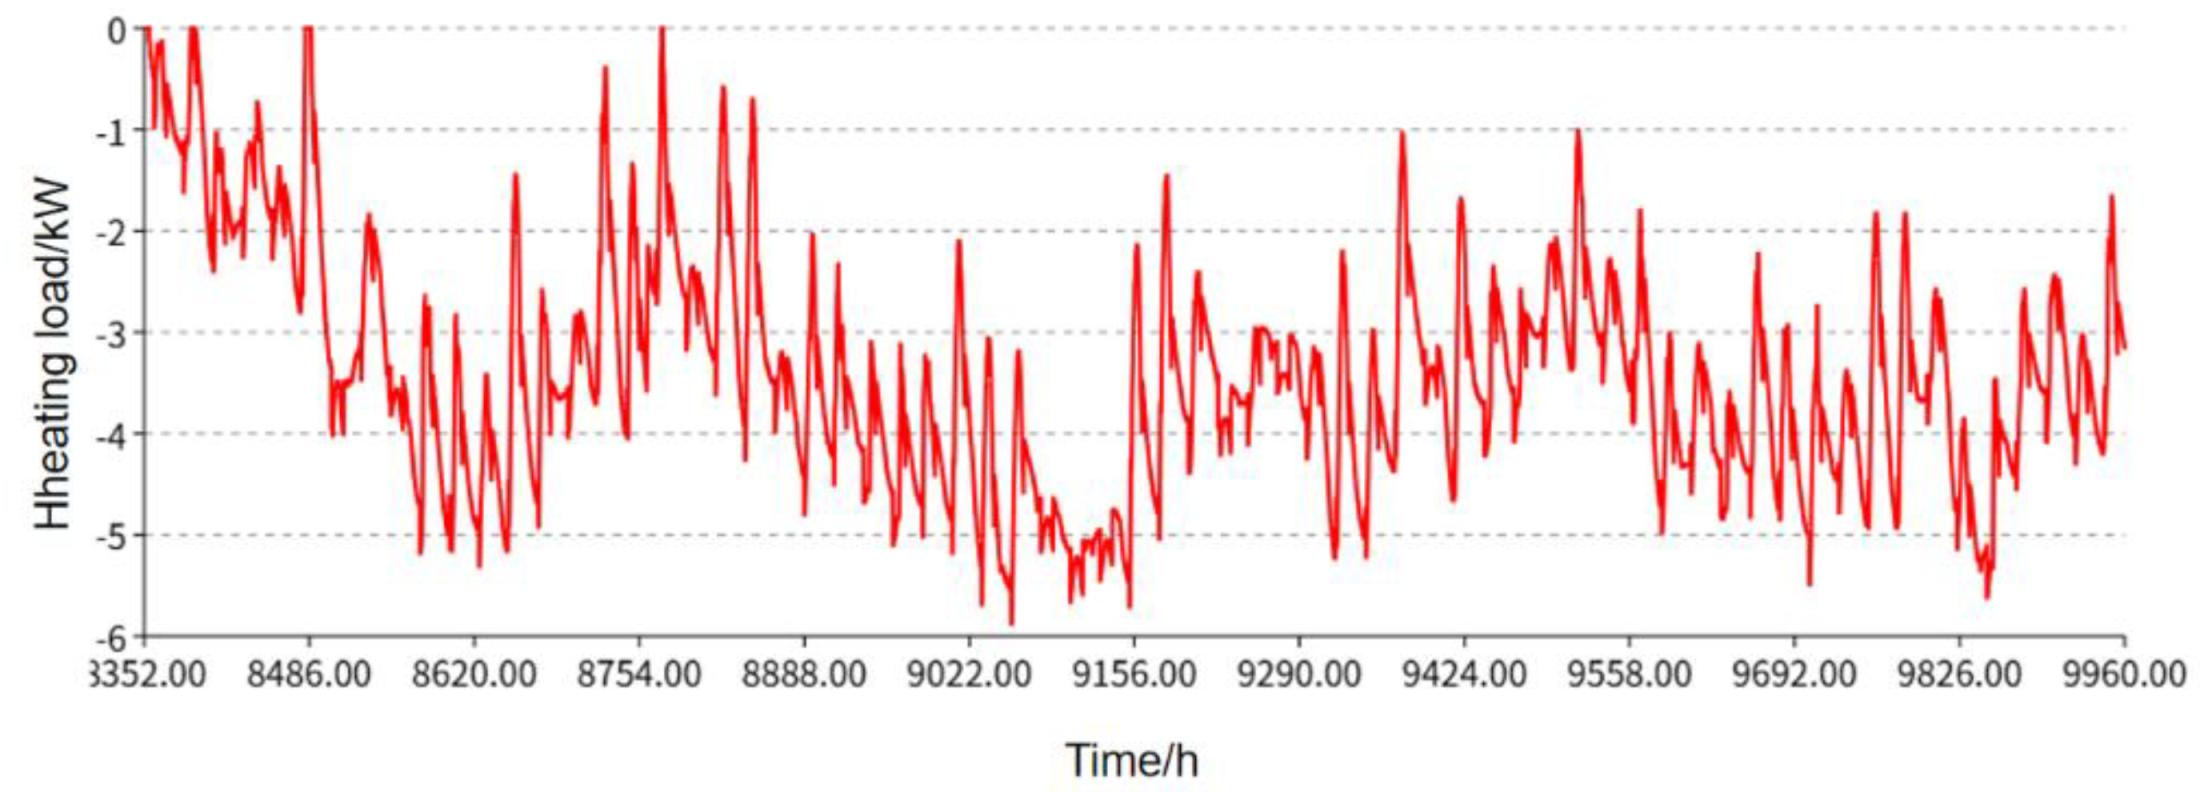
Figure 6.
Simulation model of the SASHP heating system.
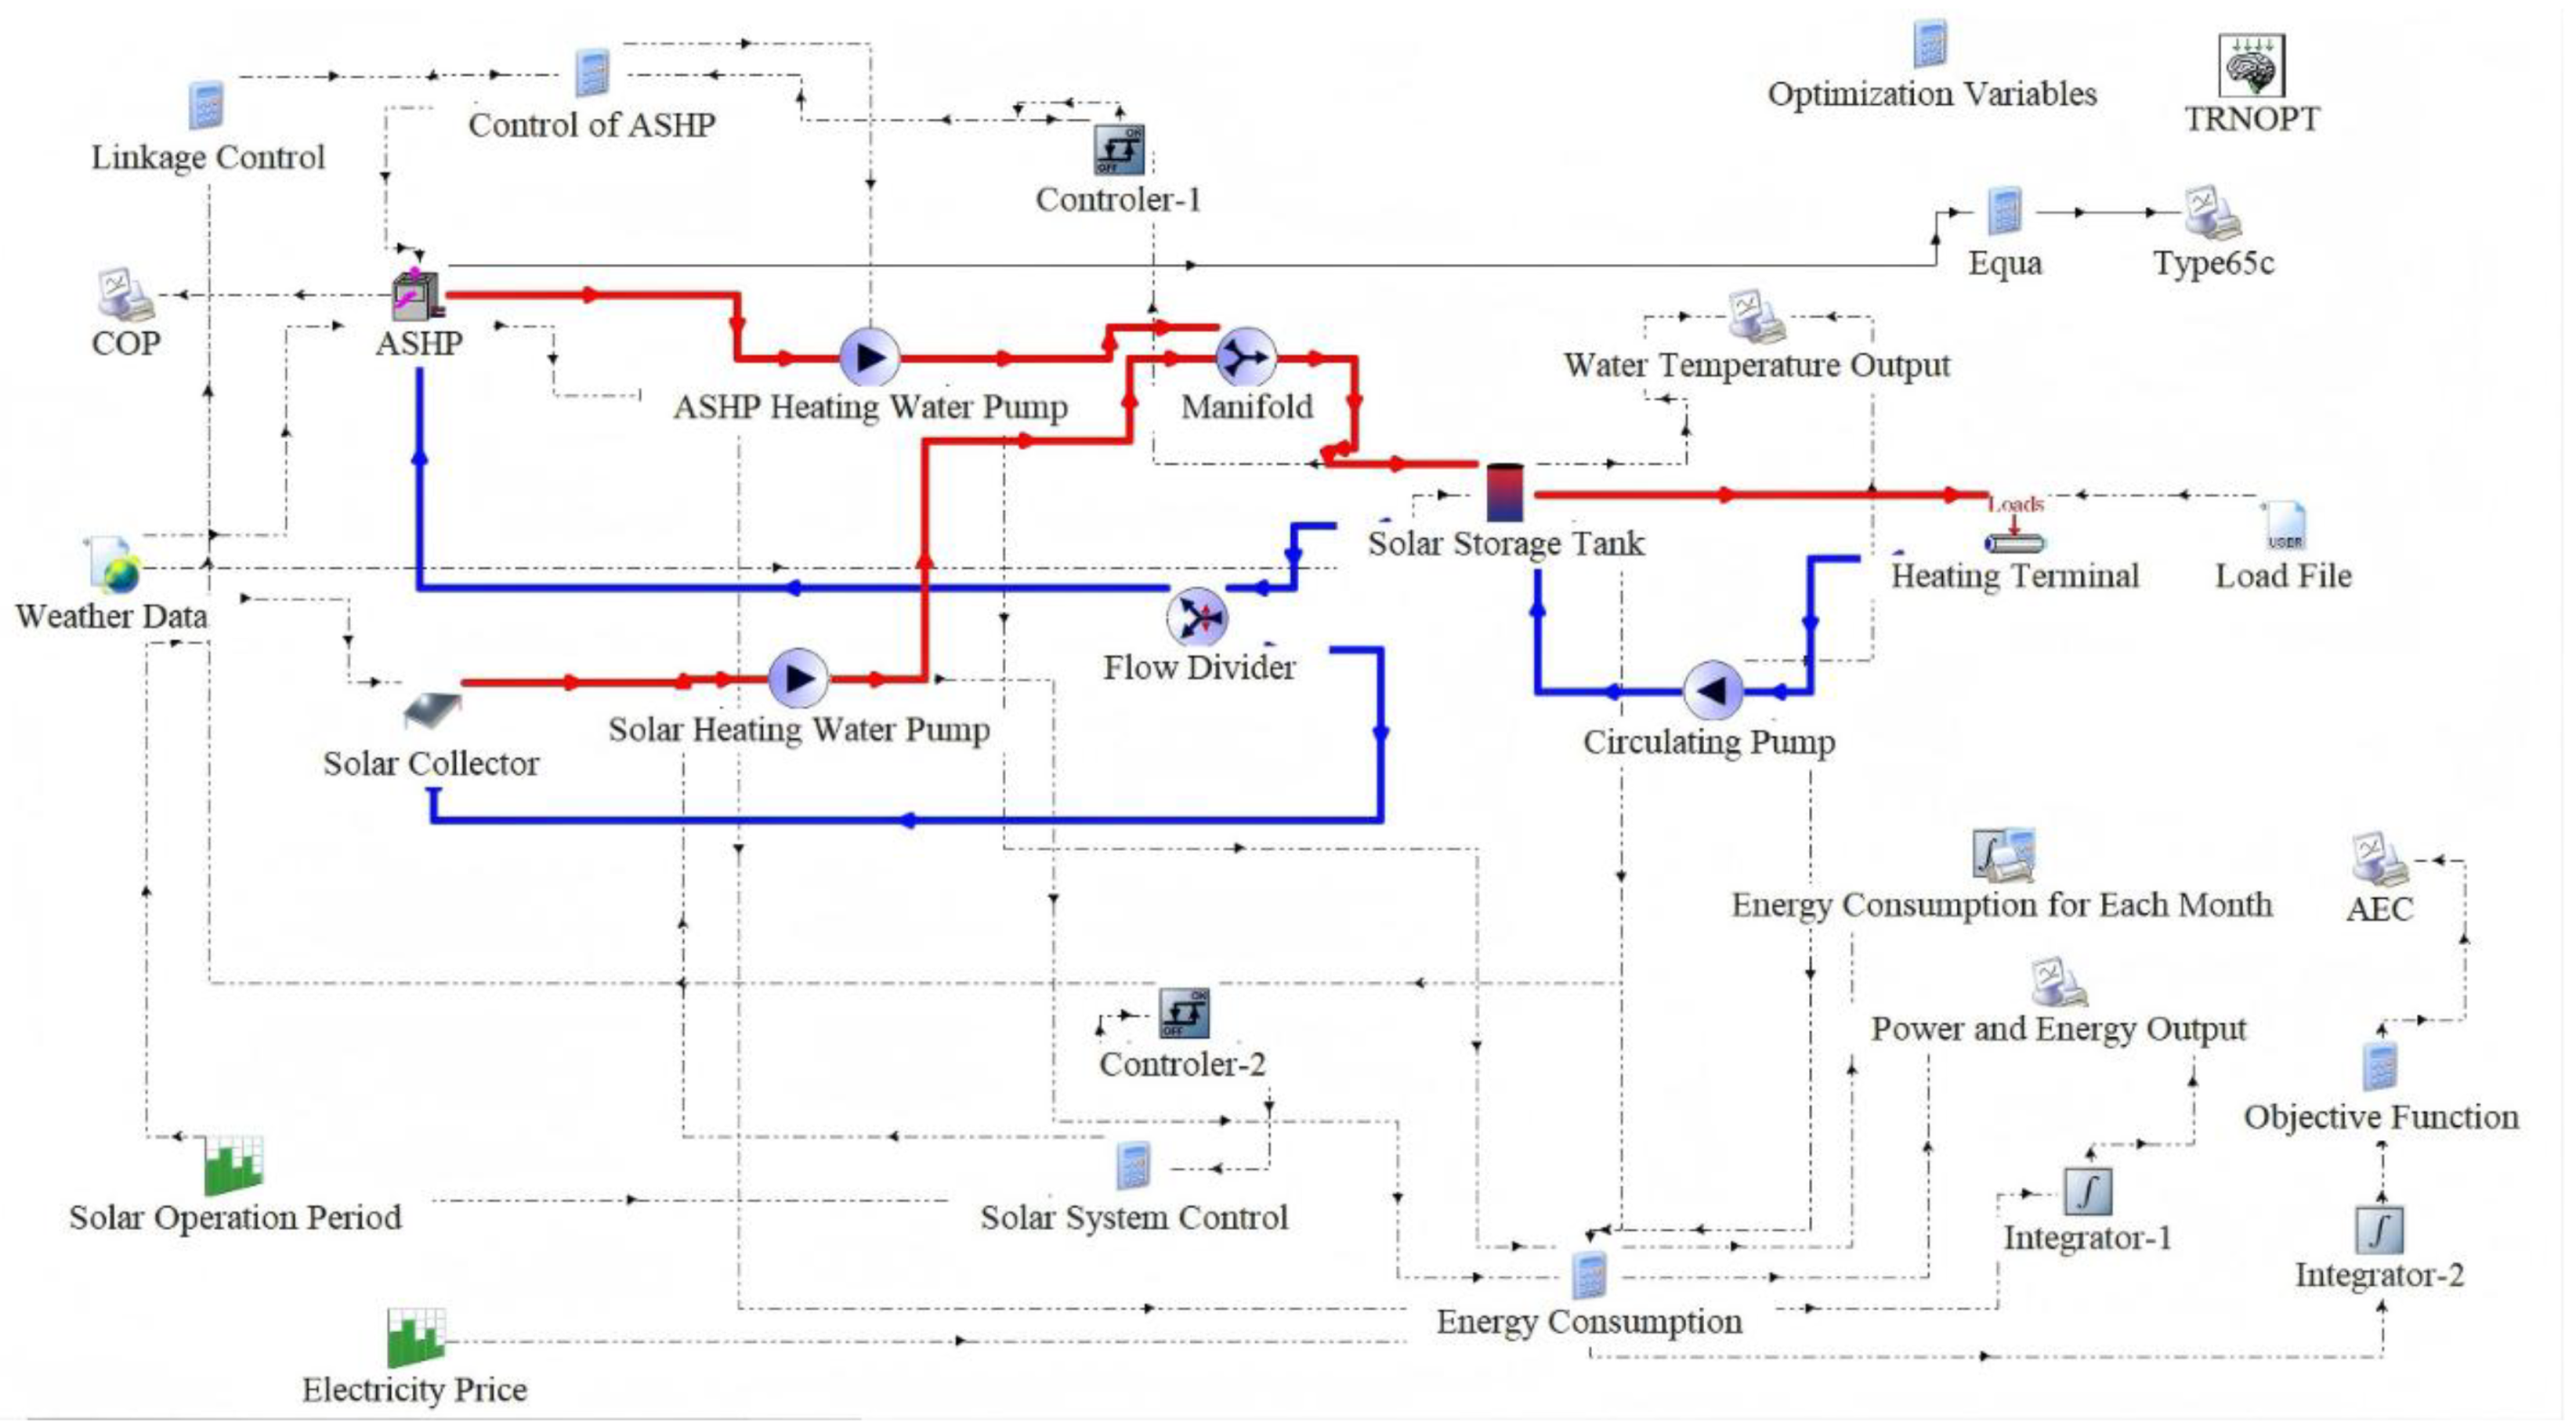
Figure 7.
Control strategy for the SASHP heating system.
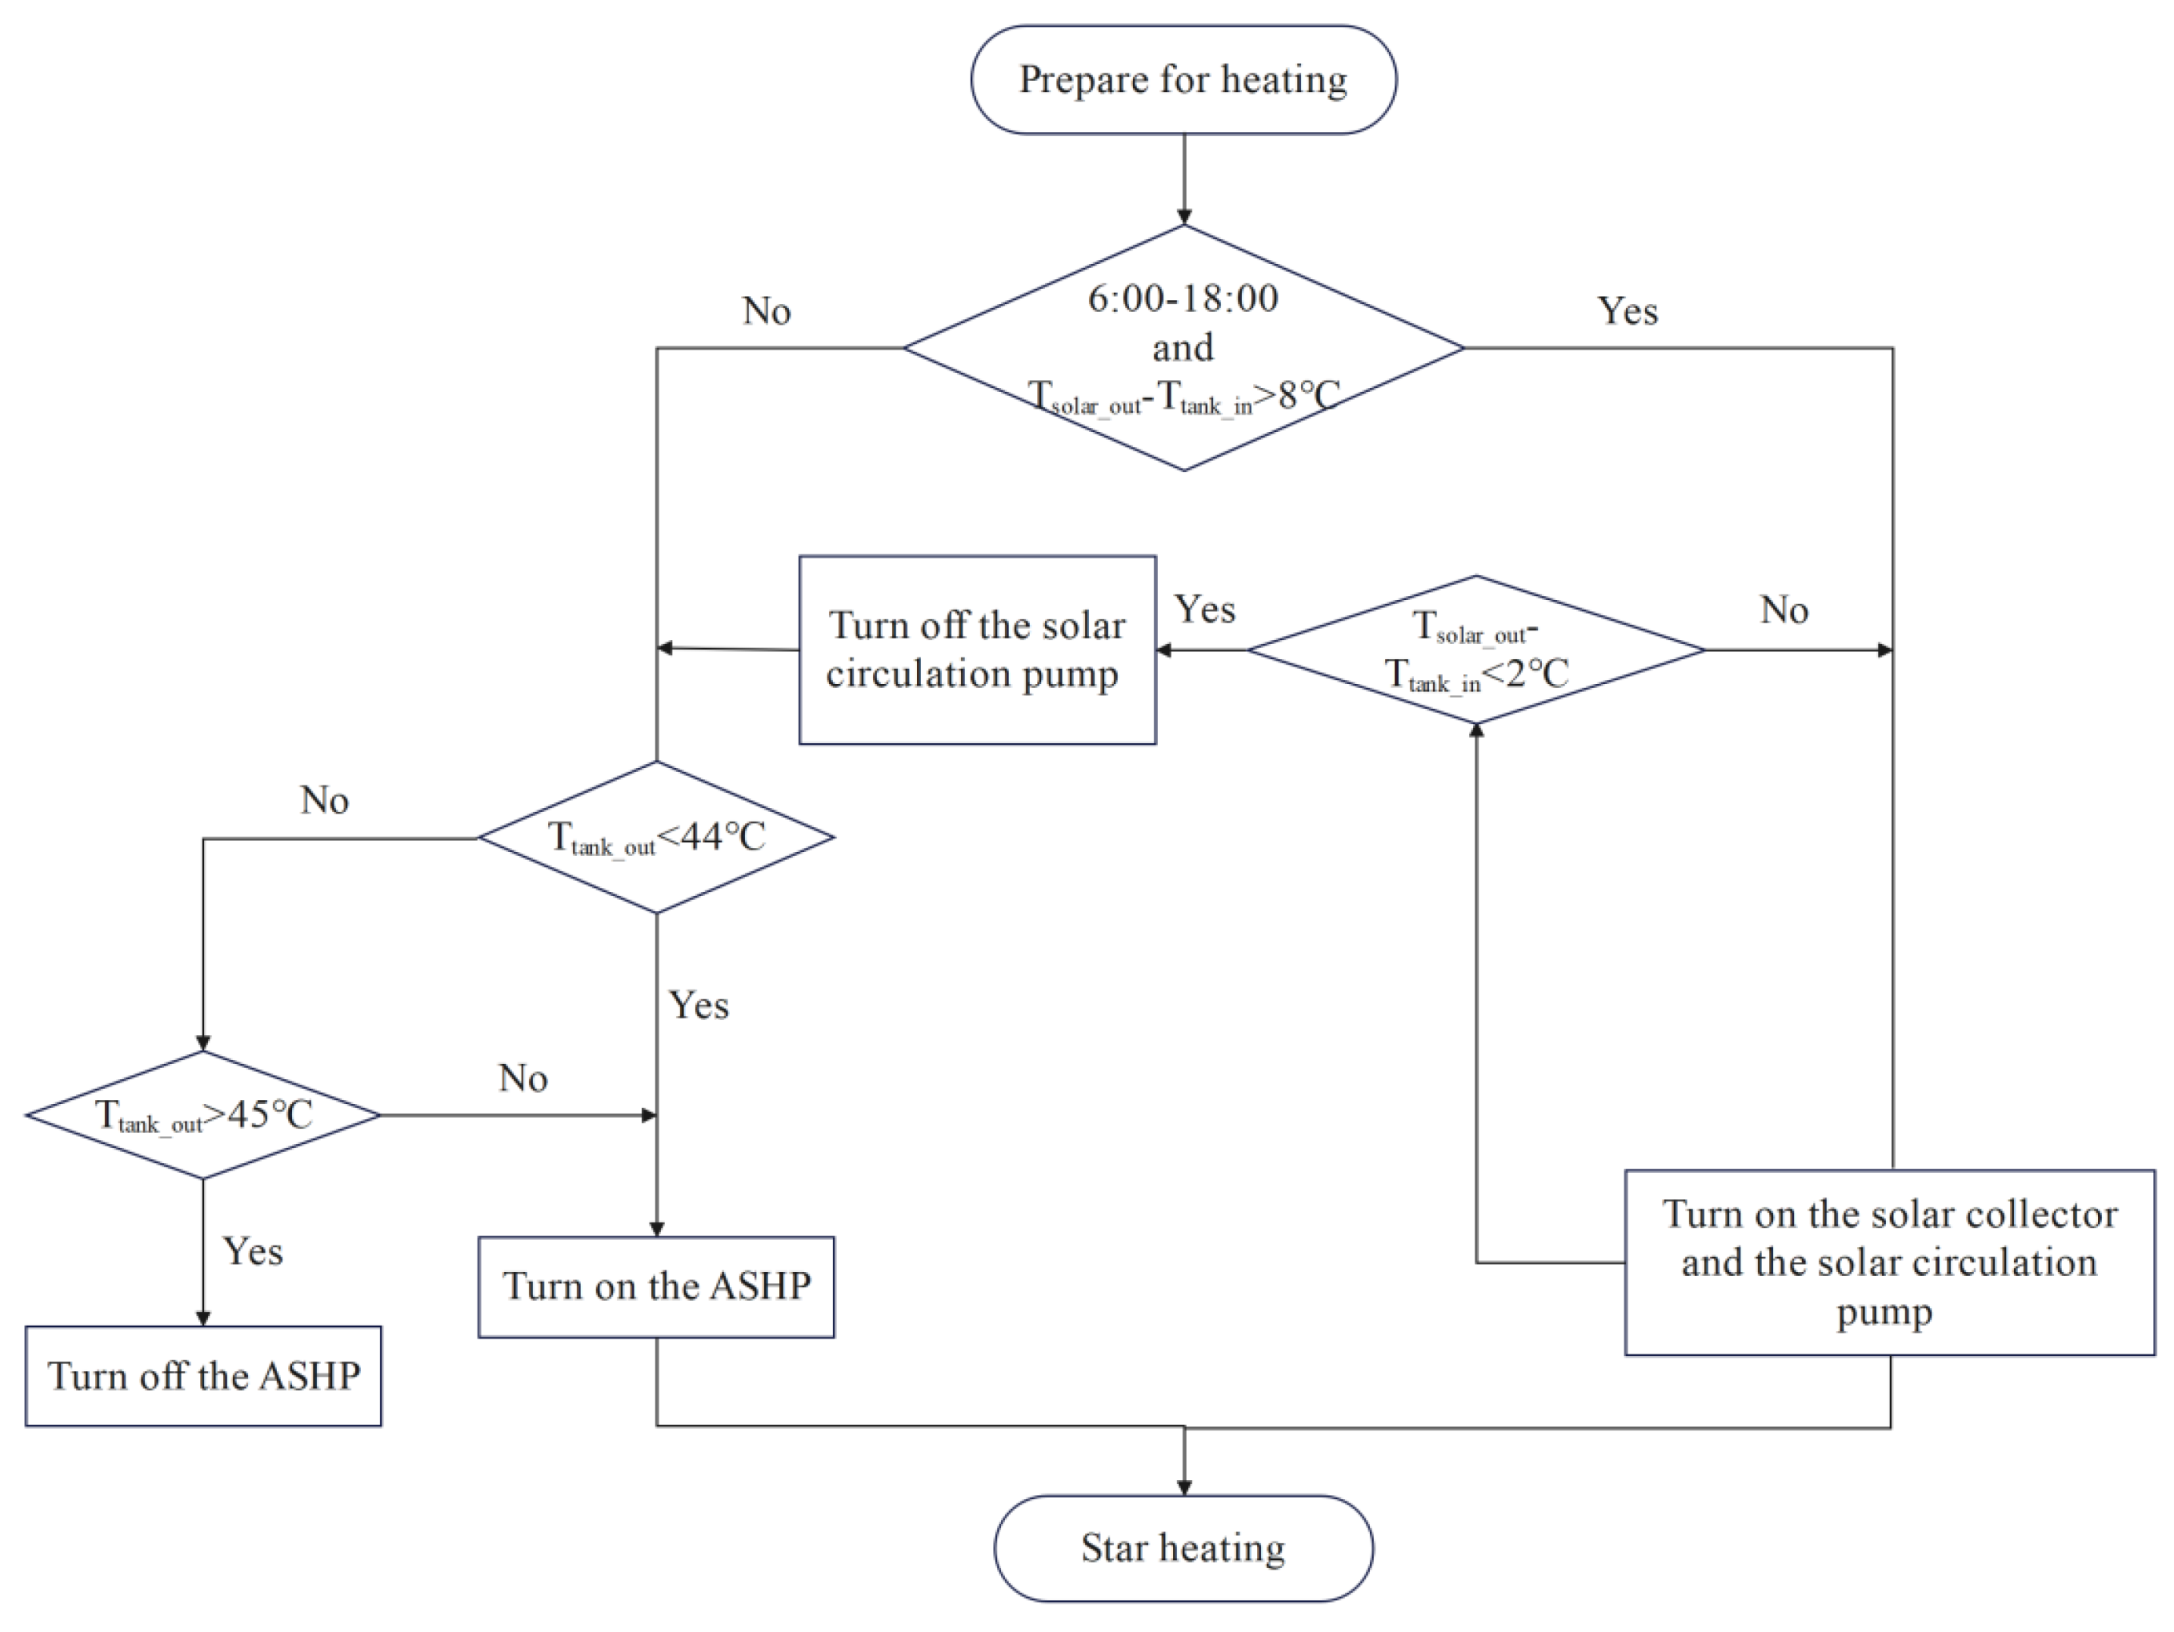
Figure 8.
Correction factor of heat pump heating capacity vs. ambient temperature and outlet water temperature.
Figure 8.
Correction factor of heat pump heating capacity vs. ambient temperature and outlet water temperature.
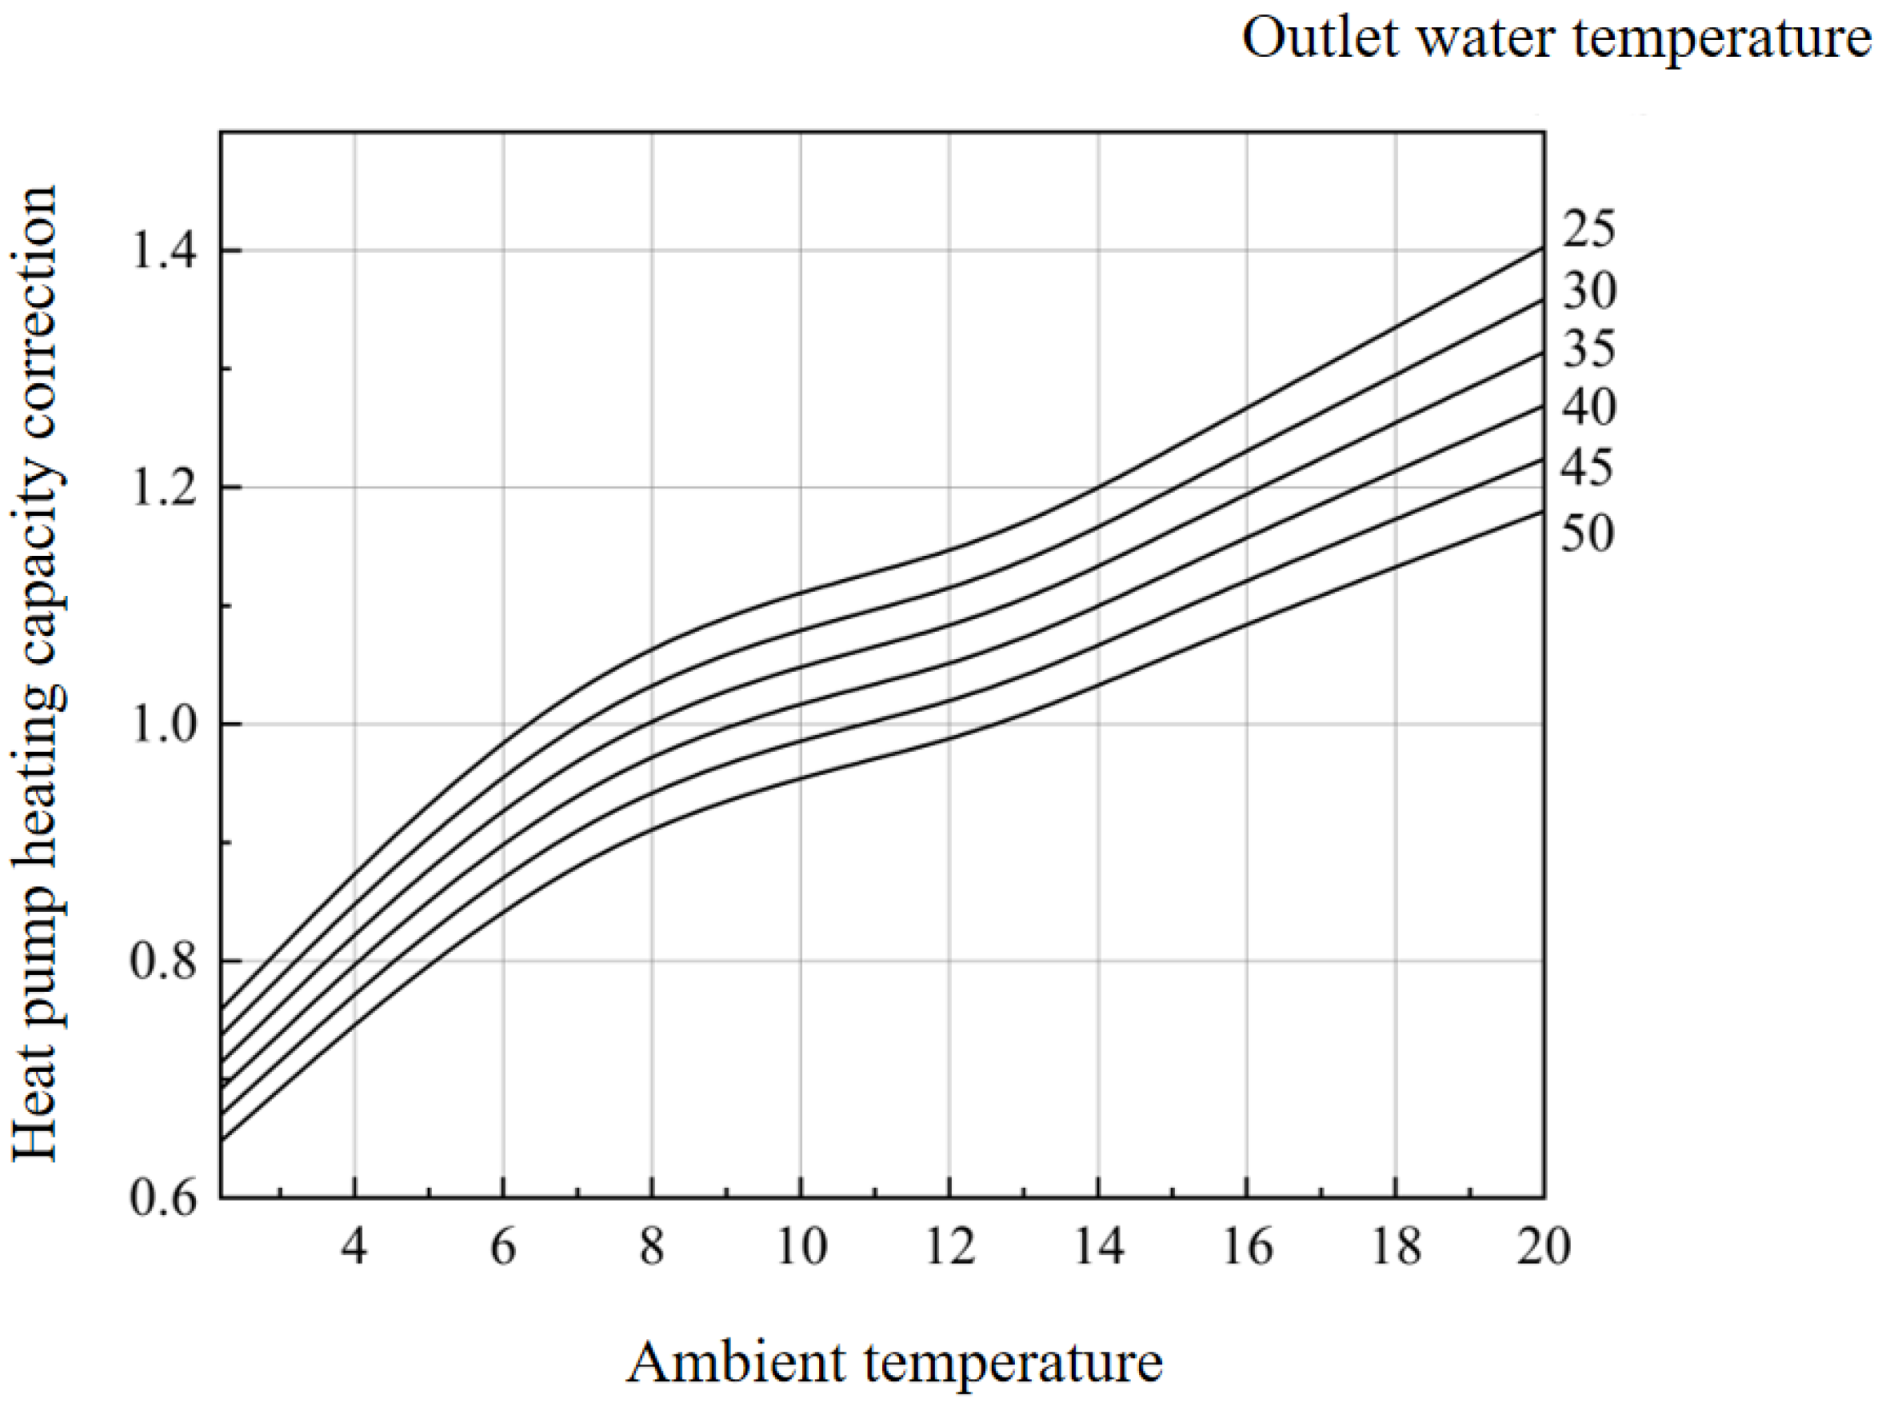
Figure 9.
Correction factor of heat pump power consumption vs. ambient temperature and outlet water temperature.
Figure 9.
Correction factor of heat pump power consumption vs. ambient temperature and outlet water temperature.
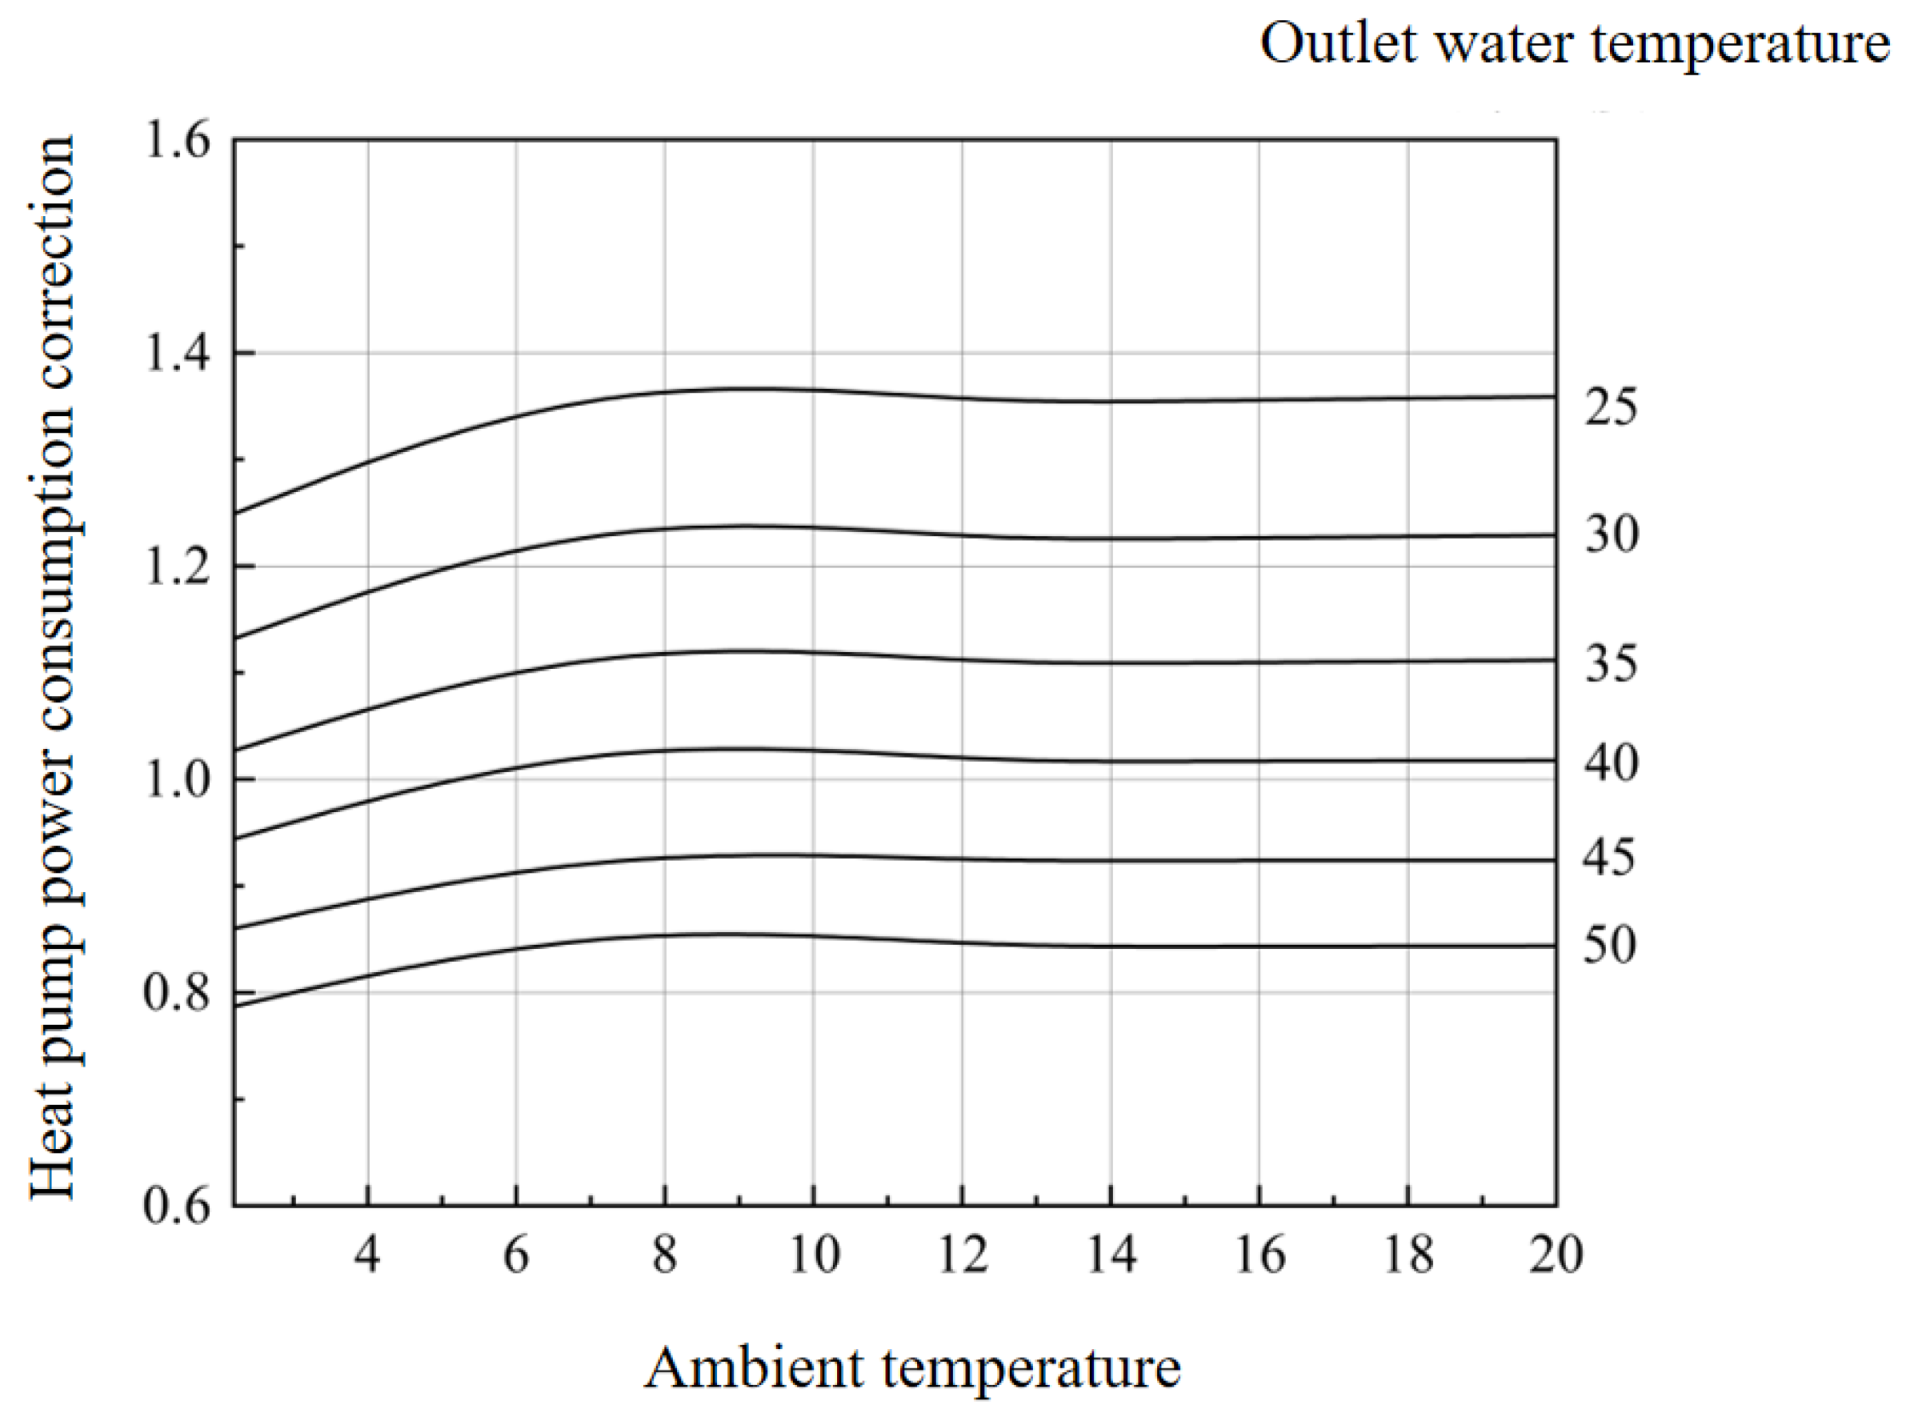
Figure 10.
Temporal variations of supply and return water temperatures.
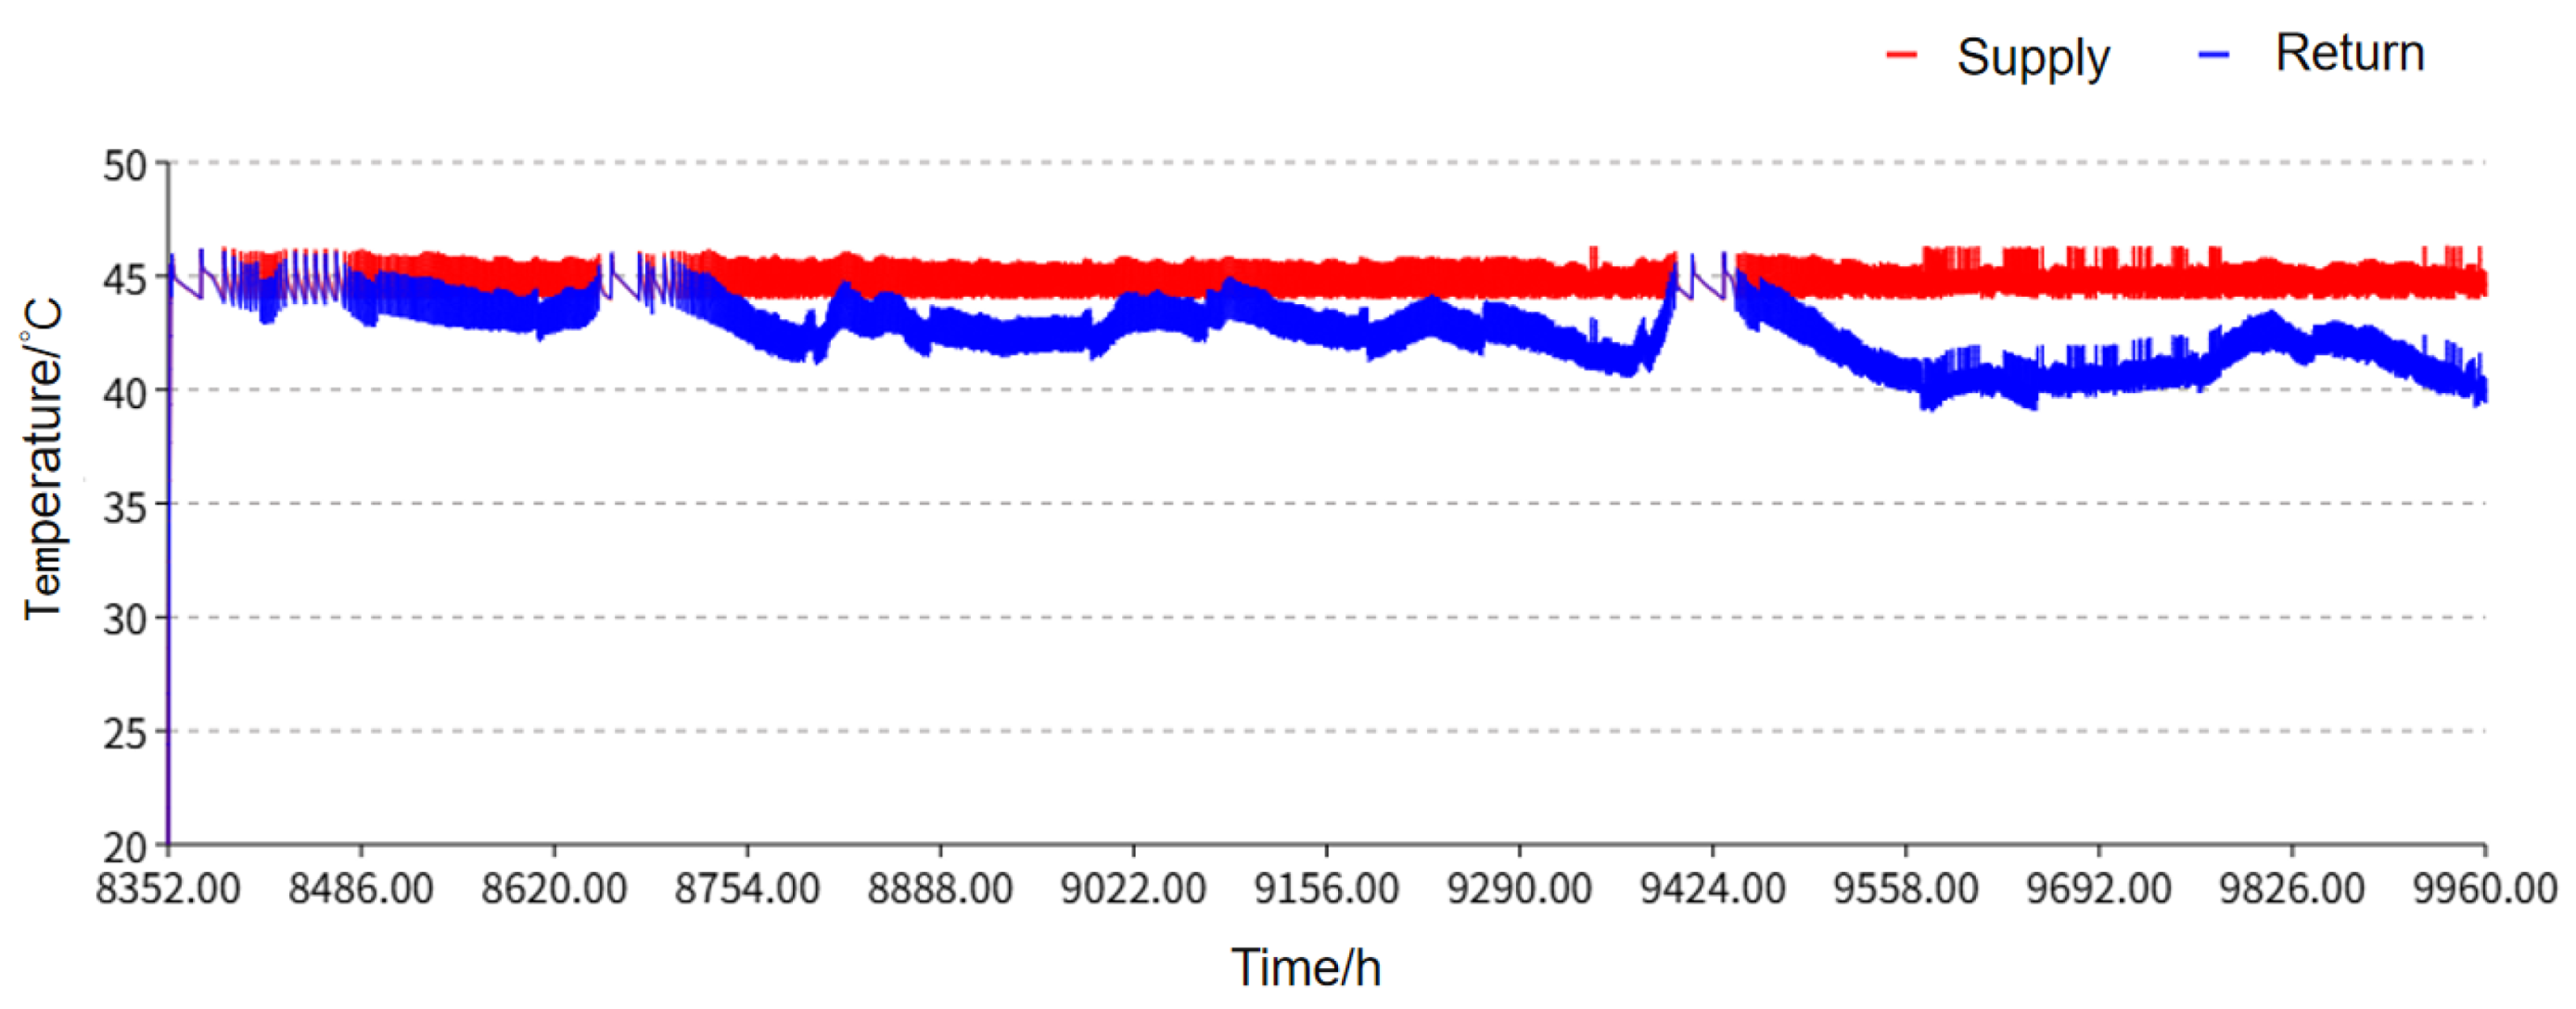
Figure 11.
Cumulative energy distribution.
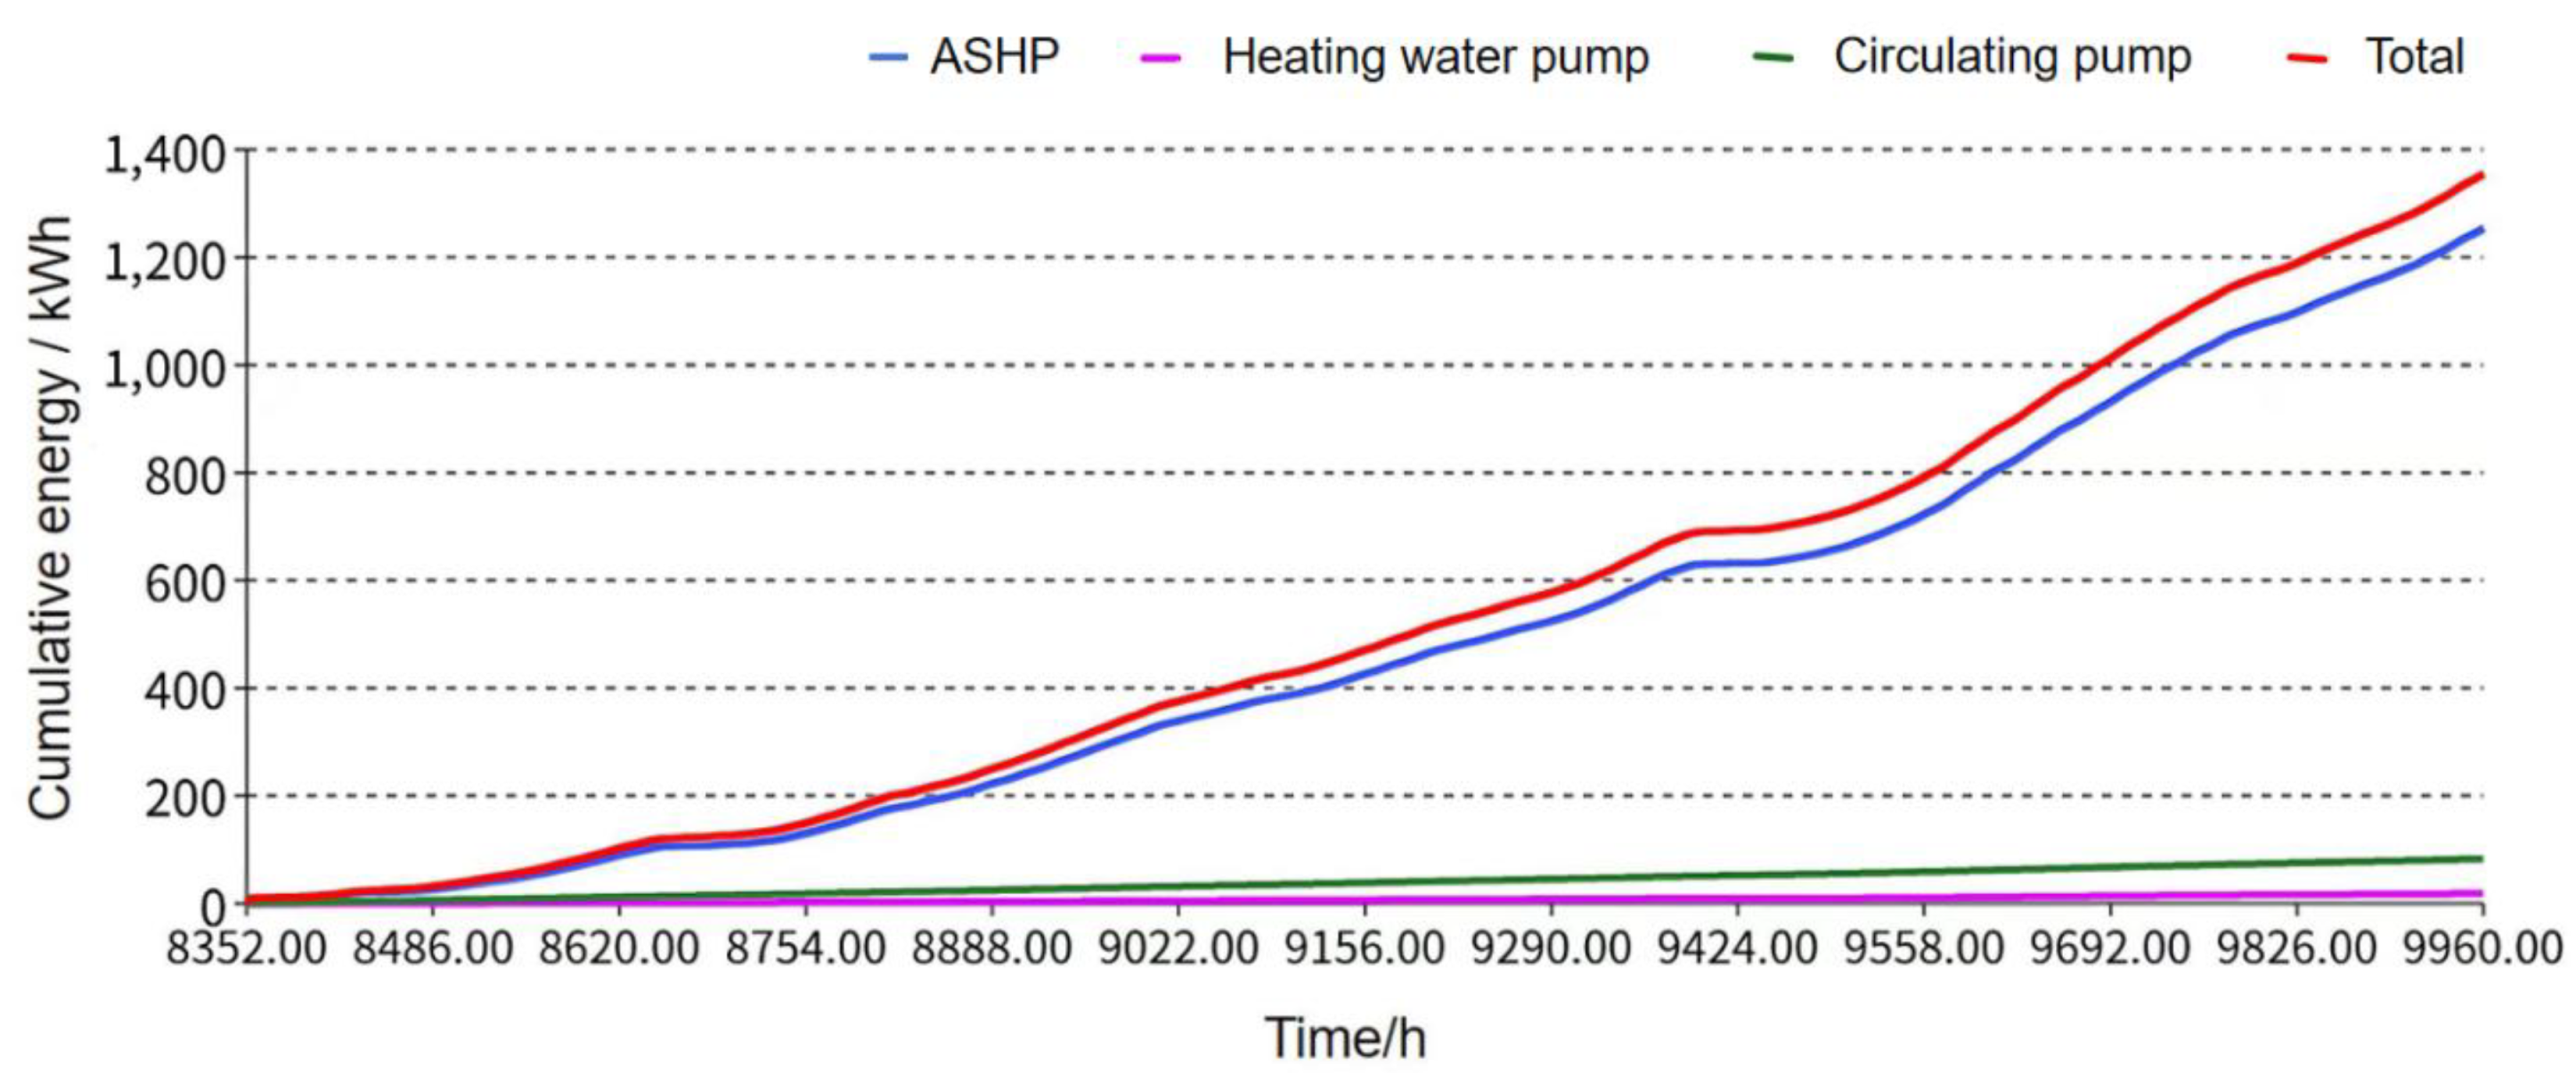
Figure 12.
COP of ASHP.
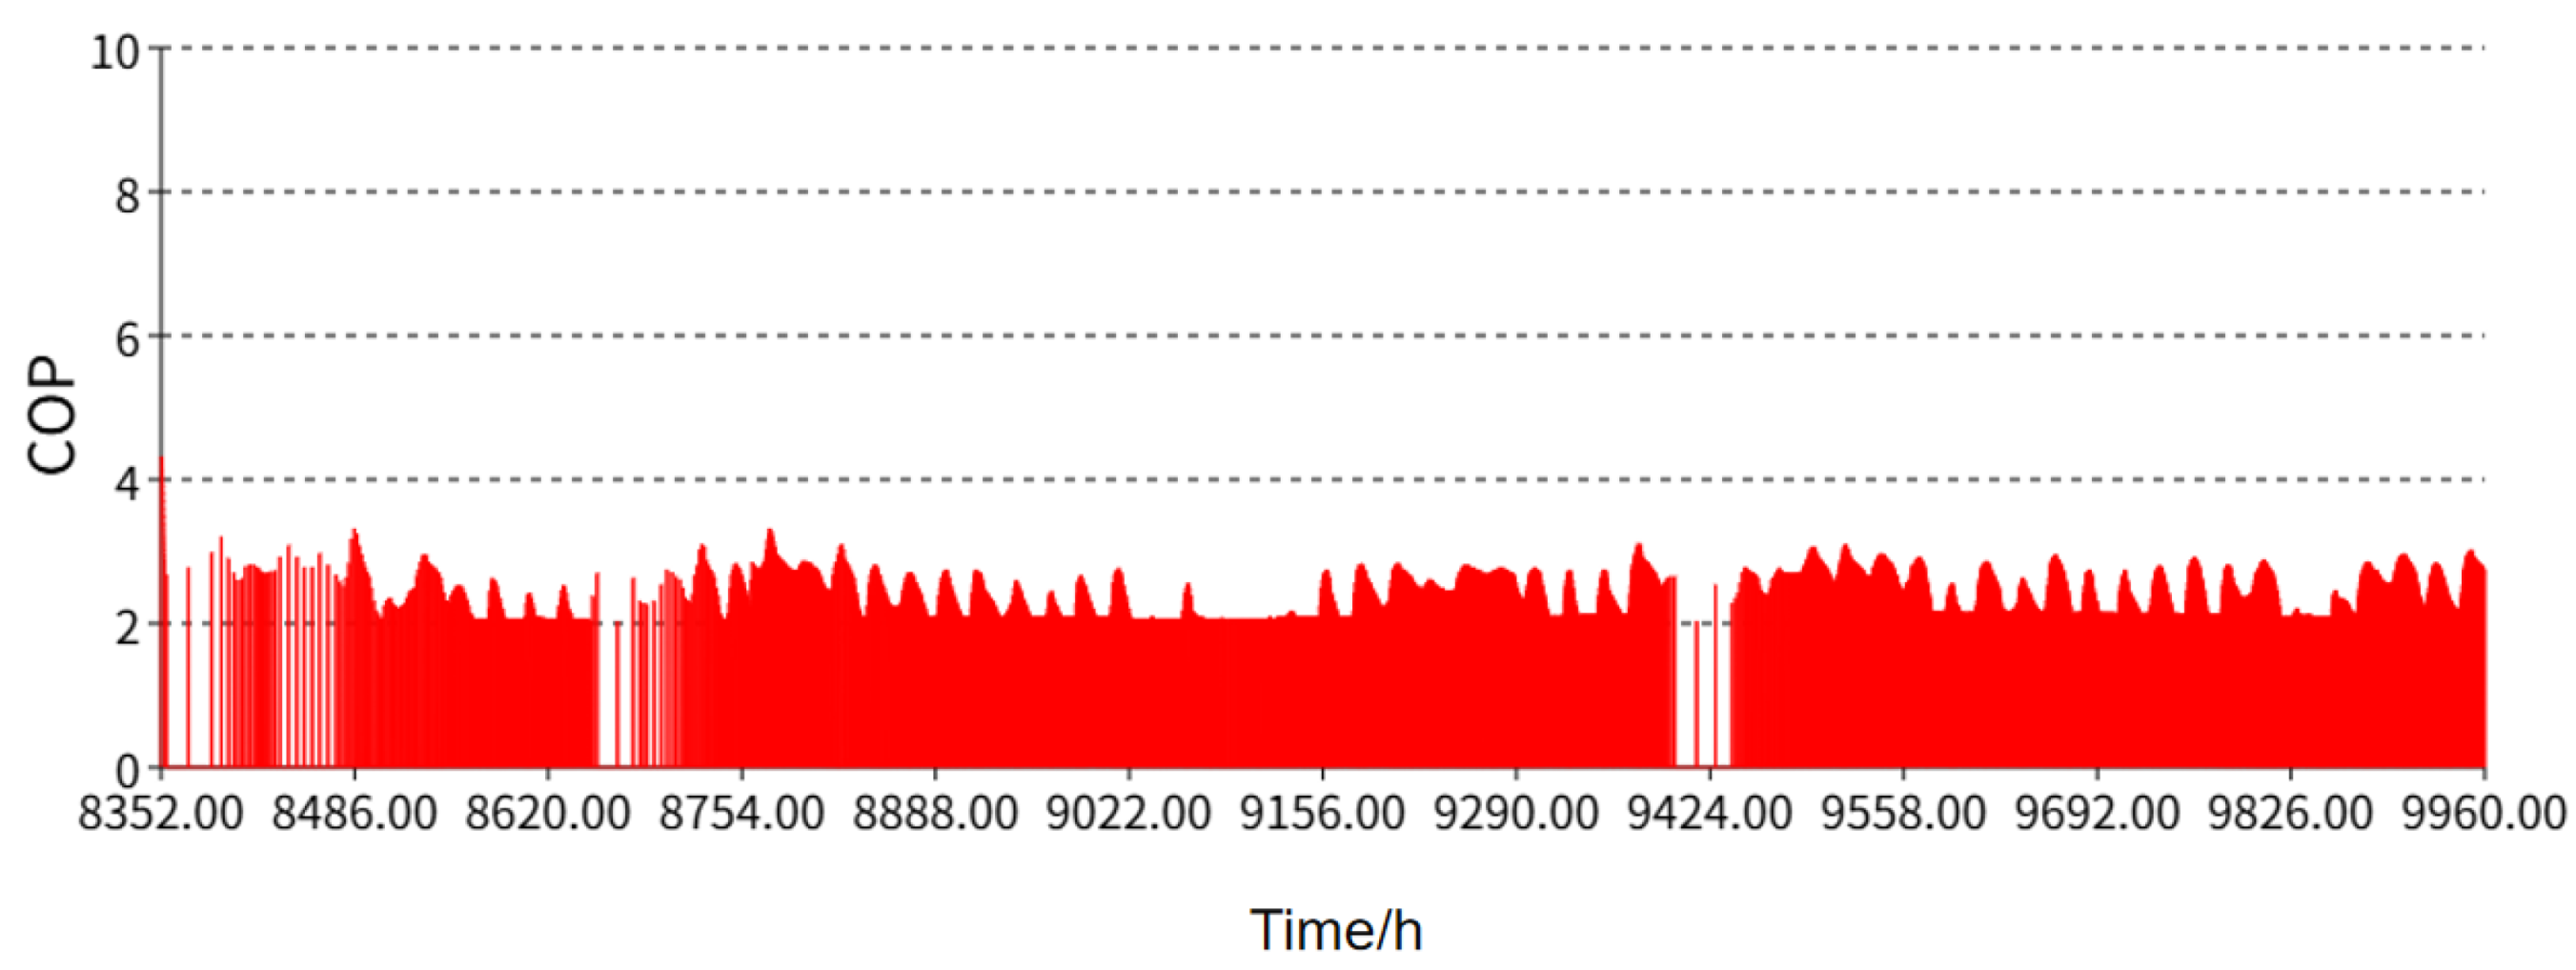
Figure 13.
Average energy efficiency comparison between ASHP and heating system.
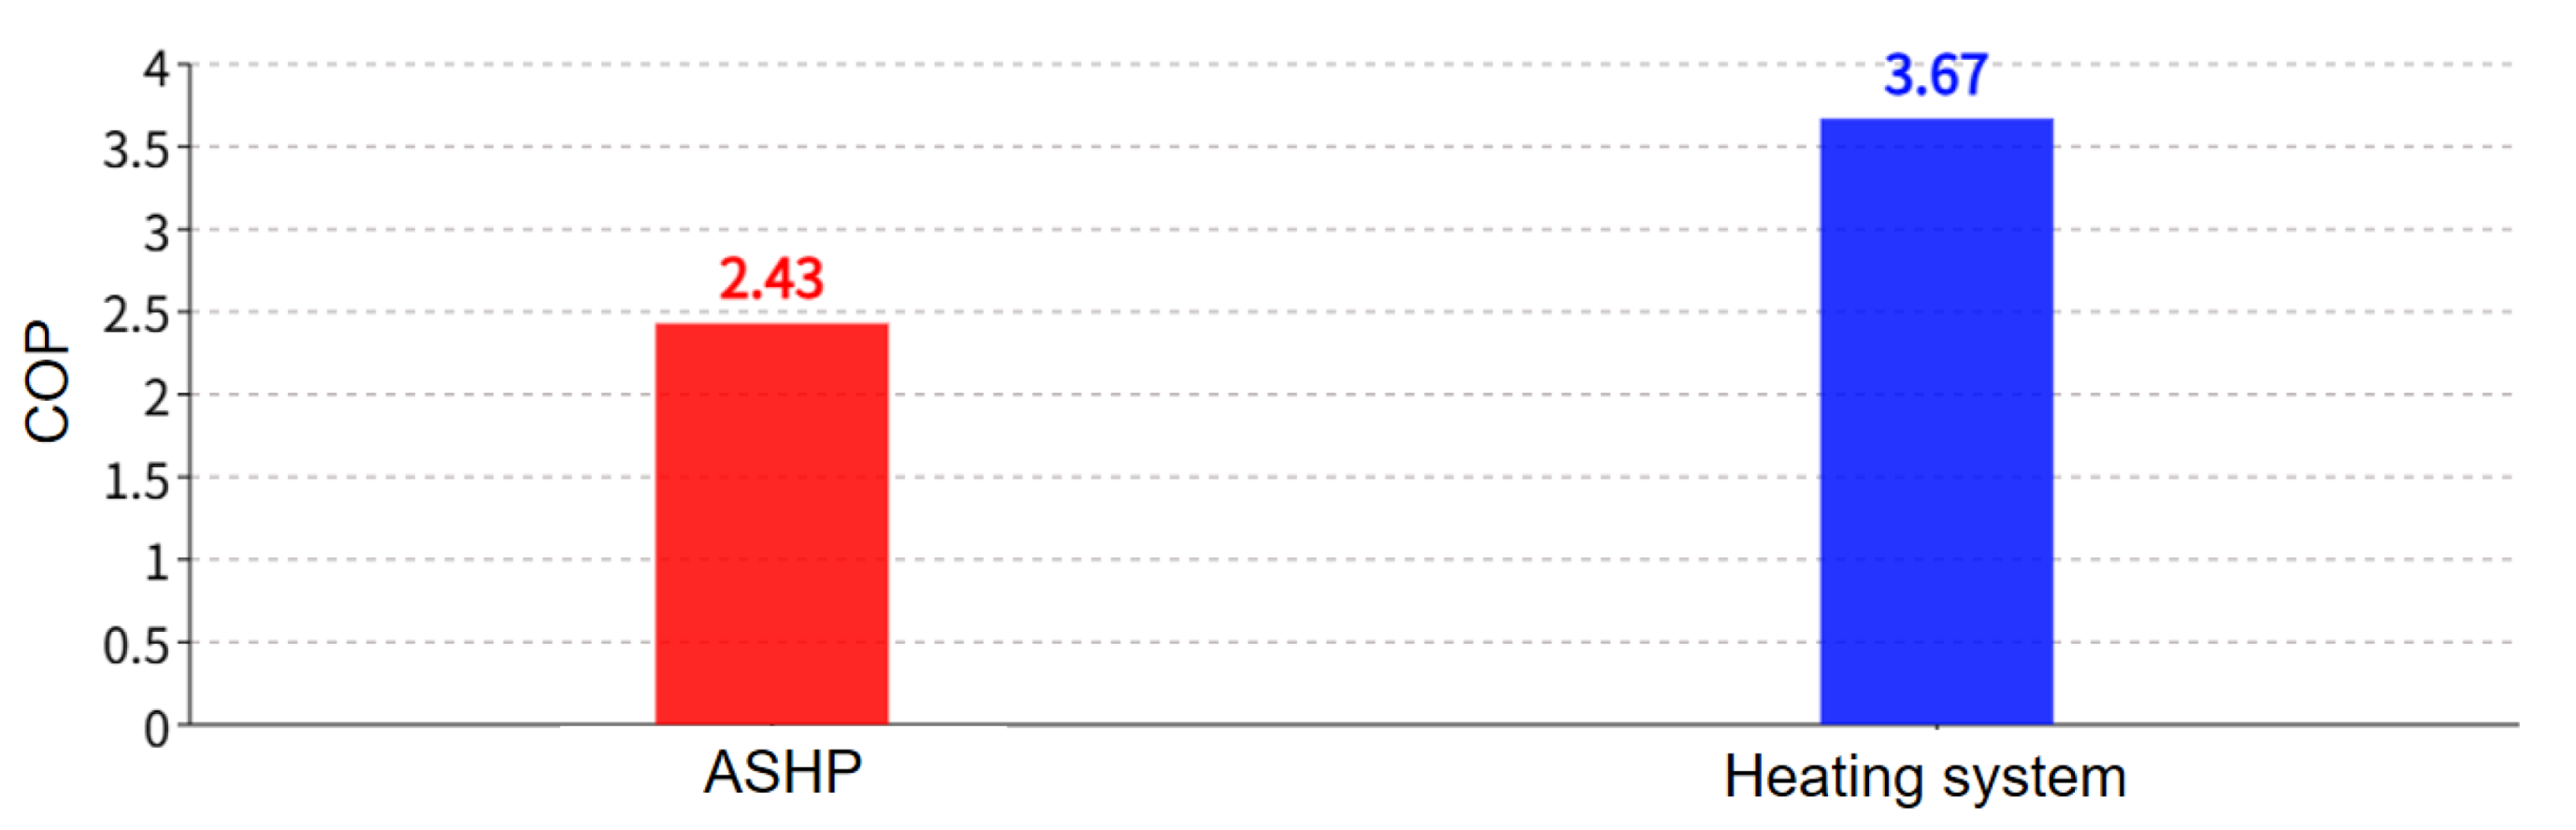
Figure 14.
Thermal comfort curve.
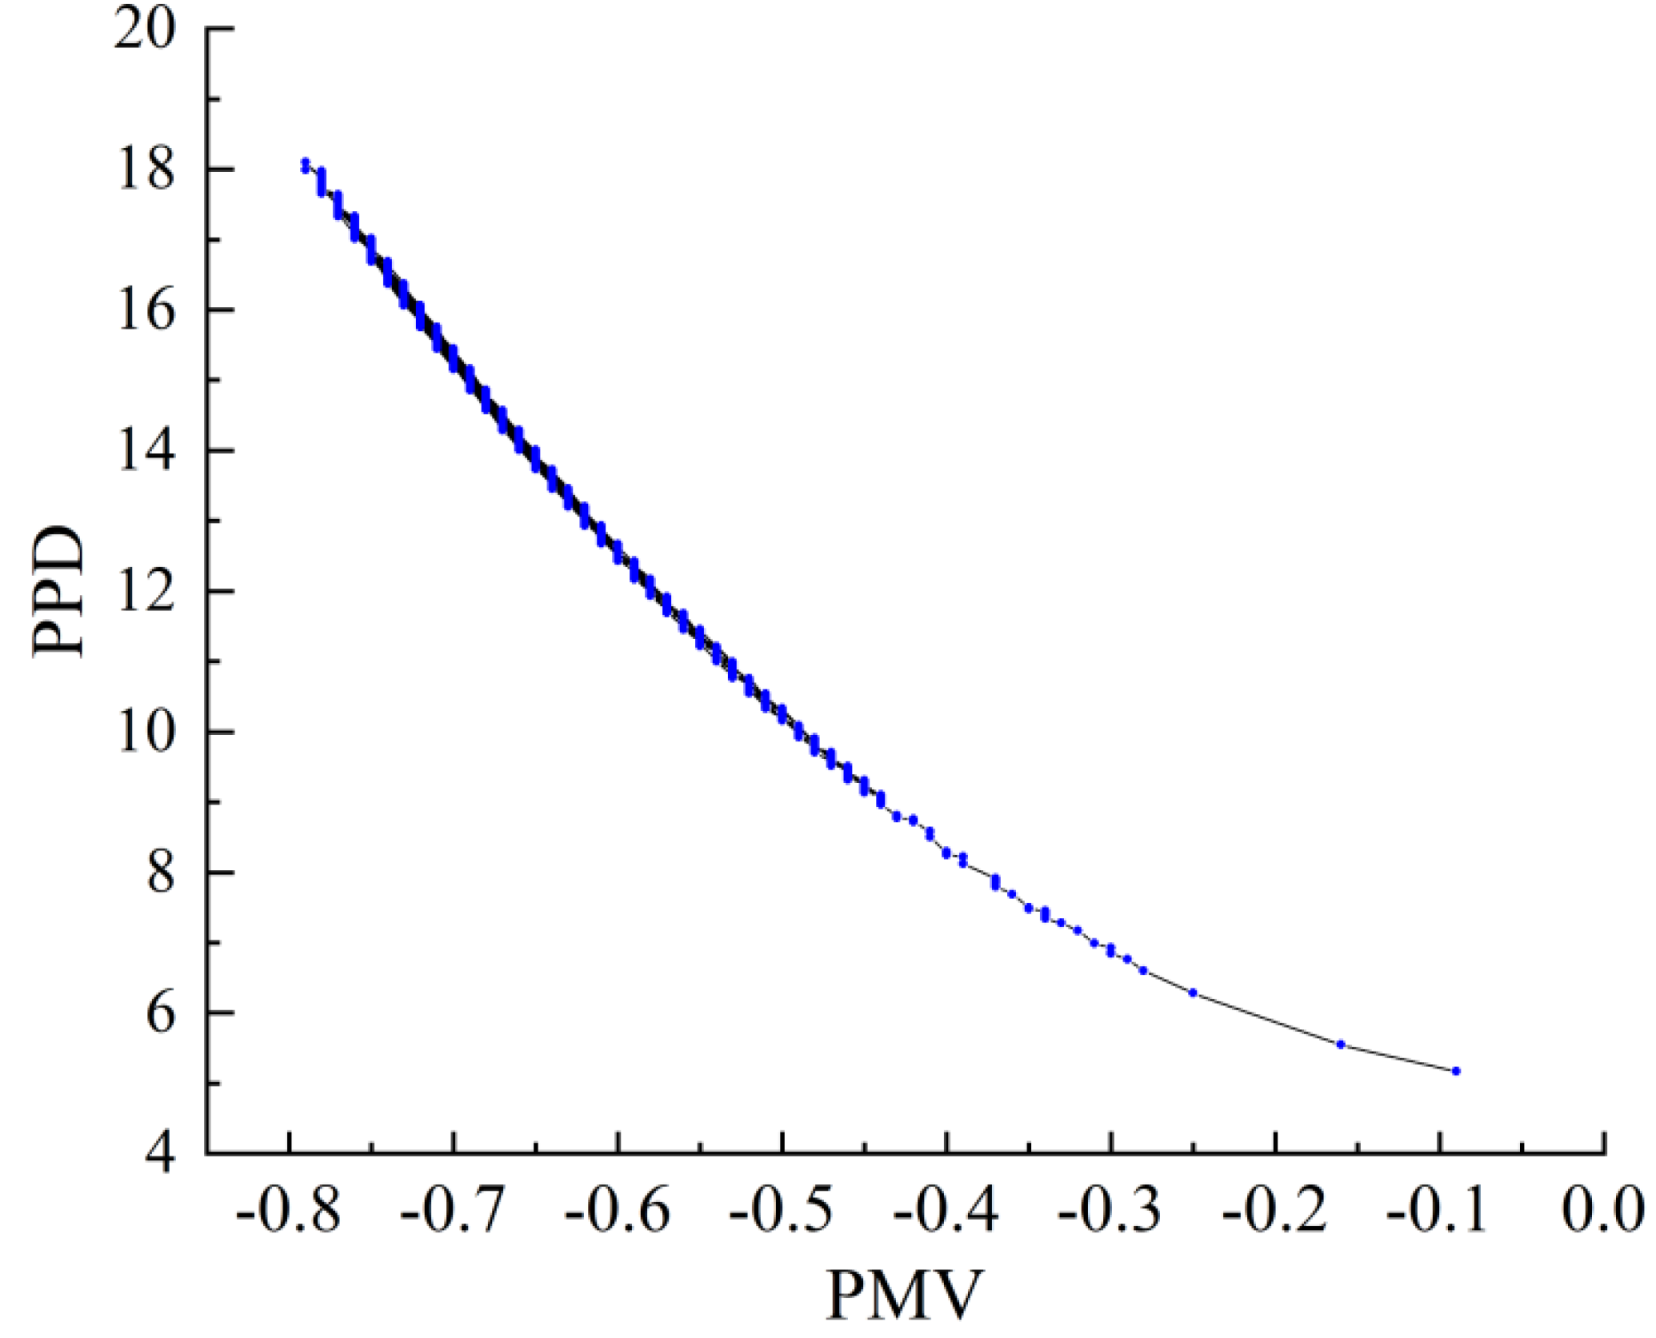
Figure 15.
Comparison of the optimization of four variables.
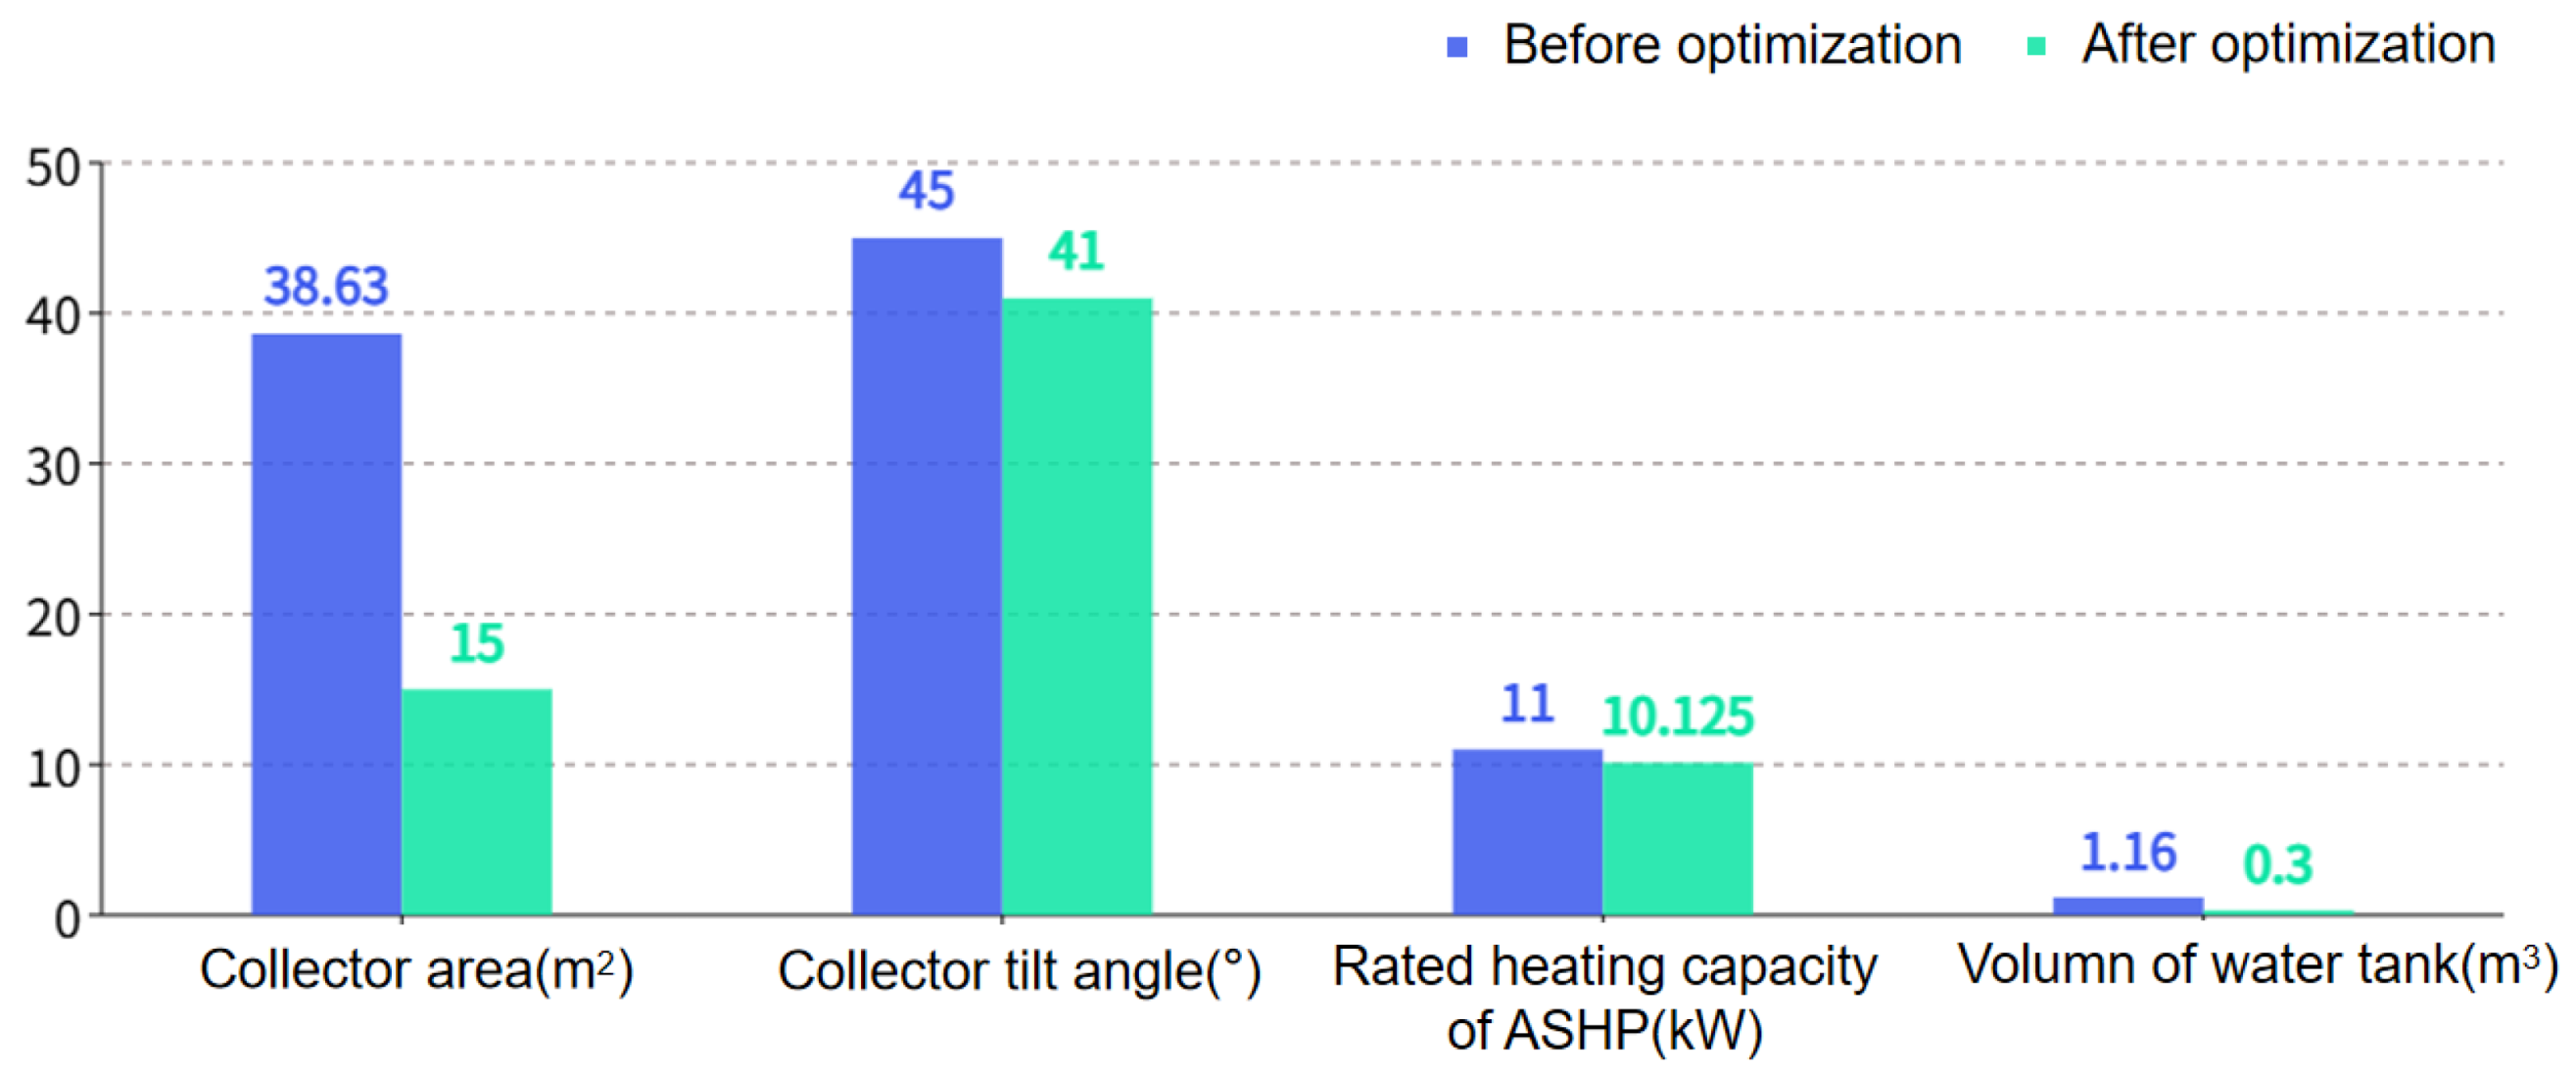
Figure 16.
Comparison of initial investment and annual cost before and after optimization.
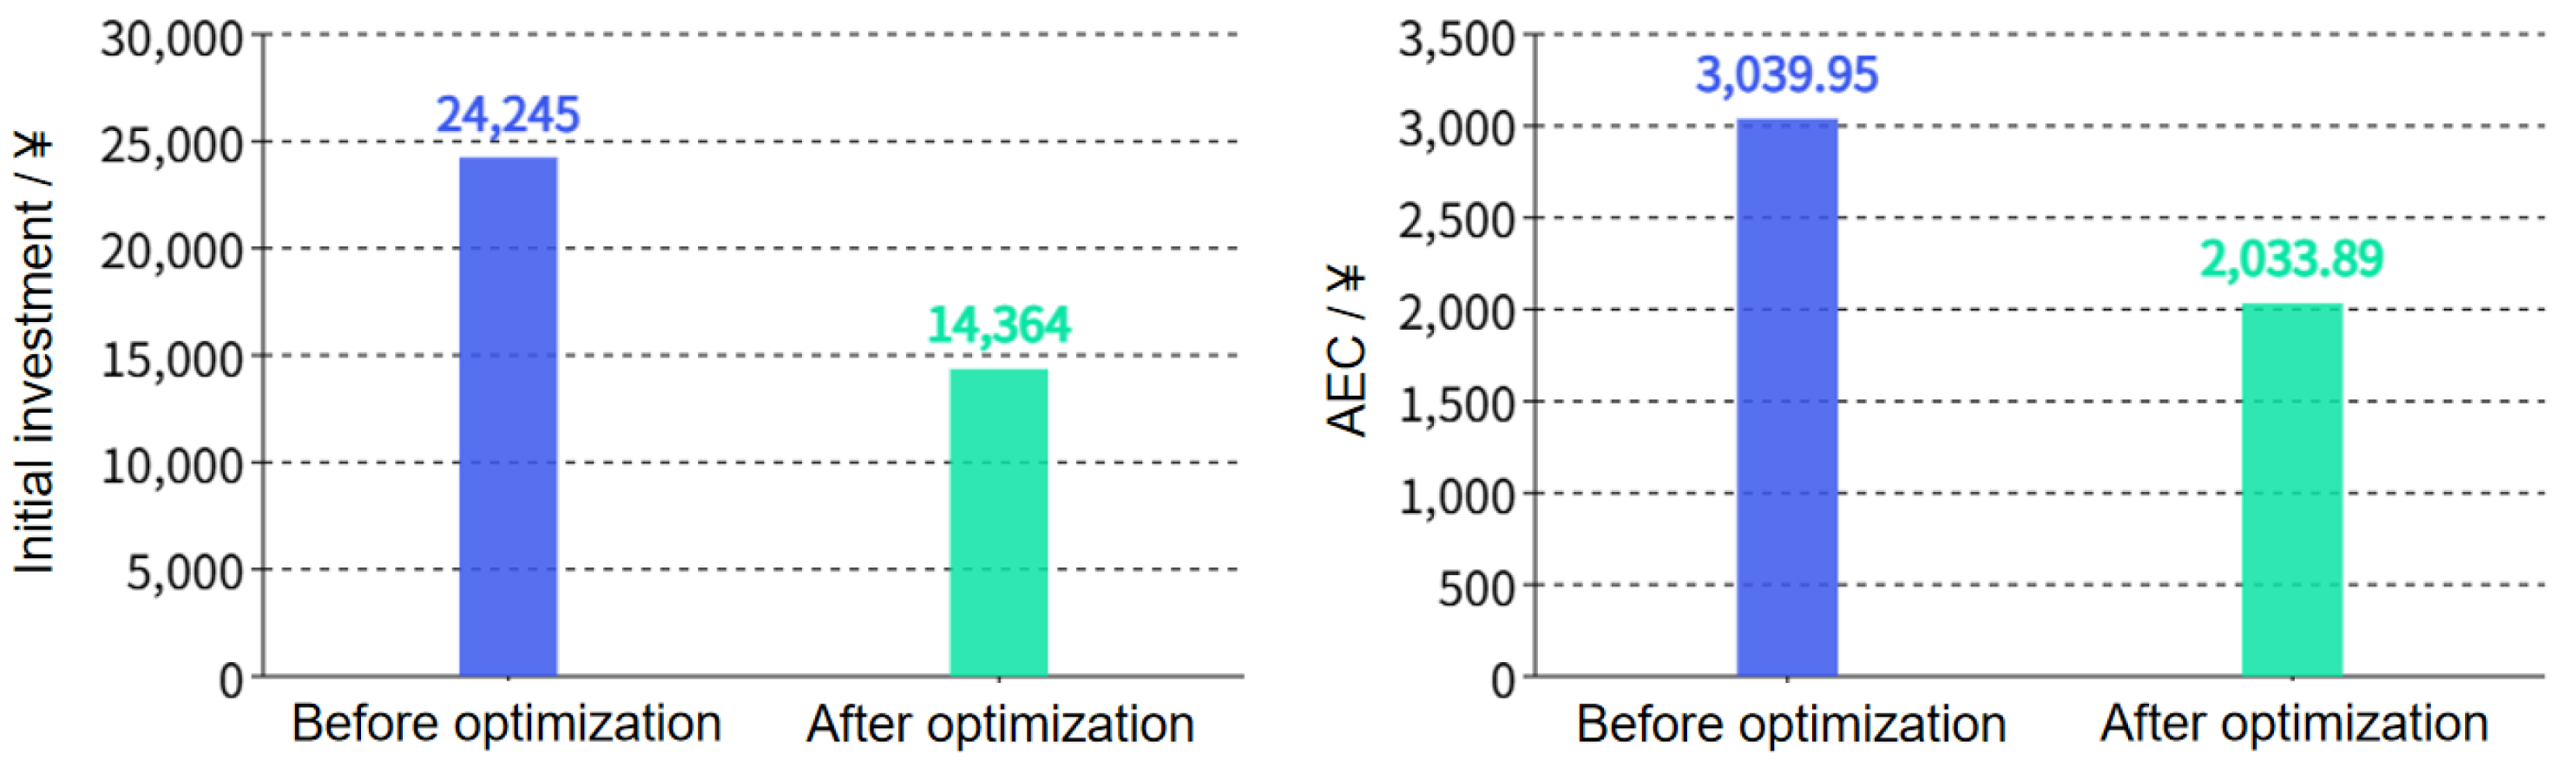
Table 1.
The enclosure structure and external window parameters.
| Enclosure Type | Composition | Heat transfer coefficient W/(m2·K) | Limit value of heat transfer coefficient W/(m2·K) | ||
| Construction material | Thickness (mm) | ||||
| External wall | Cement mortar | 20 | 0.467 | 0.5 | |
| Steel reinforced concrete | 165 | ||||
| Extruded polystyrene foam board | 55 | ||||
| Cement mortar | 20 | ||||
| Roof | Cement mortar | 20 | 0.196 | 0.2 | |
| Extruded polystyrene foam board | 75 | ||||
| Steel reinforced concrete | 80 | ||||
| Extruded polystyrene foam board | 70 | ||||
| Cement mortar | 20 | ||||
| External window | Broken bridge aluminum window | 1.690 | 1.8 | ||
| Floor | Cement mortar | 20 | 0.755 | - | |
| Aerated concrete | 200 | ||||
| Cement mortar | 20 | ||||
Table 2.
TRNSYS module configuration table.
| Module Name | Type | Quantity | Module Name | Type | Quantity |
| Meteorological data | Type15-2 | 1 | Controller | Type2b | 2 |
| Solar collector | Type1b | 1 | Data reader | Type9e | 1 |
| ASHP | Type941 | 1 | Calculator | Equation | 6 |
| Thermal storage tank | Type158 | 1 | Integrator | Type24 | 2 |
| Pump | Type114 | 3 | Printer | Type65c | 3 |
| Converging tee | Type11h | 1 | Integral printer | Type28b | 1 |
| Diverging tee | Type11f | 1 | Scheduler | Type14h | 2 |
| Heating terminal | Type682 | 1 | Optimizer | TRNOPT | 1 |
Table 3.
Key design parameters for the SASHP system in Hangzhou.
| Parameter | Value | Unit |
| Collector area (Ac) | 38.63 | m² |
| ASHP rated capacity (Qhp) | 11 | kW |
| ASHP rated power | 2.72 | kW |
| Thermal storage tank volume | 1.16 | m³ |
| Solar collector pump flow rate | 2086 | kg/h |
| ASHP pump flow rate | 945 | kg/h |
Table 5.
Electricity price.
| Period of time | Electricity price (¥/kWh) |
| 8:00-22:00 | 0.568 |
| 22:00-8:00 (the next day) | 0.288 |
Table 6.
Genopt variable parameter settings.
| Parameter | Collector area(m2) | Tilt of collector(°) | Rated heat capacity ofASHP(kW) | Water tank volume per unit heat collection area (m3) |
| Initial value | 38.63 | 45 | 10.5 | 0.2 |
| Minimum value | 15 | 20 | 5 | 0.2 |
| Maximum value | 80 | 80 | 12 | 0.6 |
| Iterative step | 5 | 2 | 1 | 0.2 |
Table 7.
Comparison of heating system variables before and after optimization.
| Parameter | Collector area(m2) | Tilt angle of collector(°) | Rated heat capacity of ASHP (kW) | Water tank volume per unit heat collection area (m3) | C0 | AEC(¥/year) |
| Before optimization | 38.63 | 45 | 11 | 1.16 | 24245 | 3039.95 |
| After optimization | 15 | 41 | 10.125 | 0.3 | 14364 | 2033.89 |
| Changing ratio | -61.17% | -8.89% | -7.95% | -74.14% | -40.75% | -33.09% |
Disclaimer/Publisher’s Note: The statements, opinions and data contained in all publications are solely those of the individual author(s) and contributor(s) and not of MDPI and/or the editor(s). MDPI and/or the editor(s) disclaim responsibility for any injury to people or property resulting from any ideas, methods, instructions or products referred to in the content. |
© 2025 by the authors. Licensee MDPI, Basel, Switzerland. This article is an open access article distributed under the terms and conditions of the Creative Commons Attribution (CC BY) license (http://creativecommons.org/licenses/by/4.0/).
Copyright: This open access article is published under a Creative Commons CC BY 4.0 license, which permit the free download, distribution, and reuse, provided that the author and preprint are cited in any reuse.


