
Submitted:
05 November 2025
Posted:
07 November 2025
You are already at the latest version
Abstract
This study investigates the classification of nine sitting postures using pressure distribution data from hard and soft seat surfaces. Three neural network architectures (FNN, CNN, ResNet) were evaluated under single-surface and mixed-domain training regimes. While all models achieved high accuracy (>96%) when trained on mixed-domain dataset, significant performance degradation occurred in cross-domain testing. CNN demonstrated superior capability in leveraging spatial pressure features under mixed training conditions, while FNN exhibited relatively better cross-domain robustness. Results indicate model performance highly depends on architectural inductive biases and training data diversity. These findings underscore the importance of employing representative multi-surface datasets for ensuring generalization in practical sitting posture recognition systems.
Keywords:
sitting posture
; hip pressure
; 2D pressure sensor array
; neural network
1. Introduction
Poor sitting posture has become a widespread health concern among various sedentary populations, including office workers, bus drivers, and students. Maintaining improper postures (i.e., slouching, asymmetrical shoulder alignment, or lumbar collapse) can lead to muscular strain and chronic conditions like low back pain and upper cross syndrome. [1,2] As a result, sitting posture recognition has gained increasing attention in ergonomics and healthcare due to its significant implications for musculoskeletal health in predominantly sedentary populations.
A variety of sensing technologies have been employed for posture monitoring, including vision-based systems [3,4], inertial measurement units [5,6], and pressure distribution sensors [7,8]. Among these, pressure-sensing mats offer a practical and unobtrusive solution for continuous posture assessment while preserving user privacy [9]. These cushions serve as an effective tool for data acquisition, maintaining direct and continuous contact with seated individuals. They can be seamlessly integrated into everyday environments without requiring wearable devices, thereby enhancing user comfort and compliance. Embedded sensor matrices enable real-time collection of pressure distribution data across the buttocks and thighs, which reflect postural variations intuitively. For example, posterior shifts in center of pressure during forward slouching, or left-right asymmetries resulting from uneven shoulder positioning. Through analysis of these pressure metrics, it becomes feasible to accurately evaluate sitting posture and provide reliable data for identifying poor postural habits [10,11].
Multiple machine learning algorithms have been successfully applied to sitting posture recognition, such as Support Vector Machines, Random Forests, k-Nearest Neighbors, Decision Trees, Naïve Bayes classifiers. [12] These approaches typically reported high classification accuracy based on pressure distribution data, though the number of recognized postures varies considerably across studies. Several investigations have focused on limited posture sets, such as four postures (e.g., upright, forward, backward, and lateral leans) classified using Support Vector Machines [13,14], or five postures (upright, forward, backward, left, and right leans) implemented with deep learning frameworks [15]. Other studies have expanded postures variety while maintaining moderate model complexity, developing six-posture systems that include categories such as “no user”, “normal posture”, “lateral leans”, and “leg extensions” [16], or distinguish between sitting with and without backrest support in various orientations [17]. A common limitation in these studies is the recognition of limited number of postures (typically fewer than six), with particular omission of contralaterally rotated or asymmetrical trunk postures that are clinically relevant due to their association with increased musculoskeletal loading and potential injury risk.
Some researchers have achieved more extensive posture classification through enhanced sensing capabilities. Katayama et al. [18] classified nine postures using LiDAR-generated point cloud data, achieving 87% accuracy. Zhang et al. [19] recognized ten posture using combined infrared and pressure array sensors, with accuracy ranging from 73.4% to 90.6% across different models. Ishac and Suzuki [20] expanded further to eleven postures using fabric sensors integrated into chair backrest, reporting 98.1% accuracy. Muppavram et al. [21] proposed a twelve-posture detection system using sensors installed in seat base, backrest, and arm supports. The most extensive system to date, developed by Bourahmoune et al. [22], recognized fifteen sitting postures with 98.82% accuracy using novel pressure sensing technology embedded in chair backrest. However, these high-posture-count systems invariably depend on multi-sensor configurations (i.e., combining seat and backrest pressure data or incorporating additional sensing modalities) rather then using only seat pressure distribution, thereby increase system cost and complexity.
More critically, current studies have not adequately addressed model performance across different seat conditions. Varying seat surface materials significantly alter pressure distribution characteristics under identical postures [23], yet it remains unknown whether classification models maintain consistent performance when applied across different seat conditions, particularly between hard and soft surfaces that represent common seat environments. This challenge is particularly evident in the context of soft seating substrates (i.e., sofas or cushioned office chairs), where material characteristics including foam density, elasticity, and structural configurations induce significant deformation under human load. This deformation substantially influences captured pressure distribution data. Compared to hard surfaces, soft seats tend to disperse pressure over broader areas, attenuate peak pressure values, and enlarge the overall pressure distribution footprint [24]. Consequently, posture recognition models trained exclusively on hard surface data may exhibit diminished performance when applied to soft seating contexts, highlighting the need for comprehensive investigation into cross-domain generalization capabilities.
This study aimed to address these research gaps by proposing three deep learning models for classifying nine sitting postures using only pressure distribution data from a single sensing mat. There were three specific objectives: (1) to develop and optimize deep learning architectures for accurate recognition of multiple sitting postures using minimal sensor requirements; (2) to evaluate and compare classification performance across two distinct seat condition (hard and soft surfaces) for assessing model robustness; and (3) to investigate model generalization capabilities through cross-domain prediction analysis, examining performance when models trained on one seat surface type are applied to the other. This study would advance the development of practical, unobtrusive sitting posture monitoring systems capable of operating effectively across diverse seating environments.
2. Materials and Methods
2.1. Participants
Eleven healthy male volunteers were recruited for this study. Their mean (± standard deviation, SD) age, height, body mass and body mass index were 26.64 ± 8.03 years, 1.77 ± 0.03 m, 69.73 ± 4.73 kg and 22.27 ± 1.65 kg/m2, respectively. None of the participants reported any known musculoskeletal disorders (i.e., low back pain) or other medical conditions (i.e., neurological disorders or cardiovascular diseases). Written informed consent was obtained from each participant prior to data collection. The study protocol was reviewed and approved by the Medical Ethical Review Committee (Reference number: NIOHP202326).
2.2. Data Collection
Each participant was instructed to maintain nine seated postures under two surface conditions: a hard seat and a soft seat. The postures included: natural upright posture (NUP), lean forward (LF), lean backward (LB), lean left (LL), lean right (LR), lean left anterior (LLA), lean right anterior (LRA), lean contralateral left anterior (CLA), and lean contralateral right anterior (CRA). These postures were selected because they are prevalent in daily activities and tightly related to low back pain [2,6,23,25]. Also, these postures are representative sitting postures being widely investigated in previous studies [12,15,17,26]. Detailed definition of each posture are presented in Table 1.
For each surface condition, the postures were assigned to each participant in a randomized order to counterbalance potential order effects. Each posture was maintained for 180 seconds of continuous data collection, followed by a 3-minute rest interval to minimize fatigue accumulation.
The two seating conditions were chosen to simulate common real-life scenarios. Hard Seat: A laboratory-standard rigid chair was used, featured a 5-cm thick solid wood seat with a surface flatness error ≤ 0.5 mm. The seat dimensions were 45 cm × 45 cm (length × width) with the backrest fixed at a 90° angle relative to the seat surface. The rigid construction ensured minimal elastic deformation, allowing direct and undispersed pressure transmission. Soft Seat: A commercially available soft car seat was selected, incorporating high-density foam padding (density: 35 kg/m³; elastic modulus: 2.5 N/mm) with a thickness of 10 cm, covered with a leather exterior. The seat dimensions matched those of the hard seat (45 cm × 45 cm), and the backrest-to-seat angle was 90°. This setup simulated realistic deformation behavior under load, representative of typical soft seating environments.
A self-developed pressure sensing mat system was employed to record pressure distribution data [27]. The system comprised a sensor matrix and an operating software. The sensor matrix consisted of a 16 × 16 array, totaling 256 sensing units (piezoresistive sensor) independently distributed across an active area of 340 mm × 337.5 mm. Each individual sensor had an active area of 10 mm × 10 mm. The system operated at a sampling frequency of 1 Hz, which was suitable for capturing static sitting postures while avoiding data redundancy. The pressure detection range was 0-50 kPa with an accuracy of ±3 kPa, and the raw signal output resolution was 0.01 V. Sensors were connected via a serial protocol to a host computer, which enables real-time data transmission for subsequent processing and feature extraction. This configuration allowed the system to accurately capture both the relative pressure magnitude and spatial distribution patterns corresponding to different seated postures.
The whole experiment procedure consist of preparation and data collection. During the preparation phase, the pressure sensing mat was placed flat and securely fastened onto the seat surface. Participants were informed of the purpose and procedures of the experiment, as well as standardized requirements for performing each of the nine seated postures. Subsequently, they were instructed to sit on the mat and were given 15 minutes to familiarize themselves with the seating conditions and practice all postures. Demonstrations and video materials were adopted to illustrate the required angles and movement specifications. The entire procedure was conducted with the assist of a research assistant. This practice session would reduce potential data errors resulting from incorrect execution.
Prior to data collection, the pressure sensing mat was connected to the operating software. The pressure sensing mat system was then calibrated by recording deviations between sensor outputs and reference pressure values. A linear correction algorithm was applied to adjust sensitivity and ensure measurement accuracy.
During data collection, participants initially adjusted their torso position to meet the requirements of the assigned posture and then maintained it statically until a stabilized pressure distribution was acquired. Subsequently, data were recorded continuously for 180 seconds before the trial was terminated. Throughout the process, participants were required to maintain the assigned posture without movement. The research assistant monitored torso angles in real time using a goniometer and provided immediate corrective feedback when deviations exceeded specified ranges.
For each seating condition, the testing order was predetermined according to a random number table. The two seating conditions were performed in a randomized order. Participants were provided with a 10-minute rest period between conditions, and they were encouraged to stand and move freely to alleviate muscle fatigue.
All acquired data were immediately labeled with subject ID, seat type, posture label, and timestamp, and stored in a dedicated database for analysis.
2.3. Data Processing and Analysis
For each participant under each seating condition, the raw pressure distribution data were preprocessed through the following sequential steps to remove invalid records and enhance data validity and reliability. First, the initial and final 10 frames of the recording segment for each posture were discarded to exclude transitional movements during sitting down or standing up. Second, frames with an effective sensing area covering less than half of the total sensor area were removed to eliminate incomplete posture records. Finally, data segments exhibiting total pressure deviations exceeding ±25% from the posture-specific average were excluded to minimize the impact of transient disturbances or measurement artifacts. This process yielded an average of 2497.4 ± 43.0 valid data frames for hard seat condition and 2241.3 ± 23.5 frames under soft seat condition. Finally, we obtained a total of 42,649 valid data frames, comprising 22,477 frames from the hard seat condition and 20,172 frames from the soft seat condition. Details for each posture were presented in Table 2. The retained data were then converted into pressure distribution matrices for subsequent feature extraction and model training.
The valid data frames were further filtered to remove rows or columns with all zeros. Thereafter, peak pressure, mean pressure and pressure variance were extracted for each frame [28,29,30]. Peak pressure was defined as the maximum value among all sensor units, reflecting the maximum load at the primary support region of the corresponding seated posture. Mean pressure was calculated as the average value across all sensor units, representing the overall load borne by the buttocks and thighs. Pressure variance was computed as the variance of all sensor values, indicating the uniformity of pressure distribution: higher variance suggests concentration in specific areas such as the ischial tuberosities, resulting in a less uniform profile, whereas lower variance reflects more even pressure dispersion. The peak pressure, mean pressure and pressure variance of all valid frames were averaged to represent pressure distribution of each seated posture. For each participant, the averaged values were used to characterize the overall pressure distribution under each seat condition.
2.4. Automatic Posture Classification
Given the strong performance of neural network models in predicting sitting postures, three classifiers, which are Feedforward Neural Network (FNN), Convolutional Neural Network (CNN) and Residual Neural Network (ResNet), were adopted to predict the nine sitting postures under two seat conditions. In comparison to FNN, CNN and ResNet are more complex models which allow to learn further complex hierarchical features through increasing network depth.
2.4.1. FNN Based Classifier
FNN employs adopts a standard fully-connected architecture specifically designed for processing flattened feature vectors. The network consists of four sequential linear layers, with nonlinear activation functions and regularization modules integrated between successive layers [31]. In this study, the input data (16×16 two-dimensional matrix) is flattened into a one-dimensional vector of 256 input nodes before being fed into the network. The first hidden layer projects the features into a 256-dimensional space, followed by a rectified linear unit (ReLU) activation function to introduce nonlinearity and a Dropout layer with a rate of 0.3 to mitigate overfitting. The second hidden layer reduces the feature dimension to 128, also followed by ReLU and Dropout. The third hidden layer further reduces the feature dimension to 64, and the final output layer maps the high-level representations to a nine-dimensional category space, corresponding to the nine posture categories. This model serves as a baseline for performance comparison. The overall network structure is illustrated in Table 3.
2.4.2. CNN Based Classifier
A deep CNN was designed to leverage the spatial structure of the input data. The architecture is specialized for extracting local spatial features from the 2D pressure matrix, capturing hierarchical patterns through successive convolution operations [15]. The input preserves the original 16×16 grid structure with an added channel dimension. Feature extraction is performed by three sequentially connected convolutional modules, each containing a convolutional layer, batch normalization, nonlinear activation, and down sampling operations. The first module uses 32 filters of size 3×3 convolution kernels with same padding to maintain spatial dimensions, followed by 2×2 max pooling that reduces the feature map 8×8. The second module increases the filter count to 64 for capturing more abstract feature, and the third further expands to 128 channels. Adaptive average pooling then reduces the output to a fixed 2×2 spatial size. The resulting 512-dimensional feature vector (128×2×2) passes through a dropout layer and is finally projected via two fully-connected layers into the nine-class output space. The overall network structure is presented in Table 4.
2.4.3. ResNet Based Classifier
A lightweight ResNet architecture was further developed to mitigate the gradient vanishing problem in deep network training. Inspired by the core design of ResNet, this model incorporates shortcut connections to enable identity mappings [32]. The input single-channel data first passes through a standard Convolutional layer with batch normalization, which projects the features into a 32-channel space. The core part of the network consists of two consecutive residual blocks. Each block contains two 3×3 Convolutional layers with batch normalization, and uses a skip connection to add the input of the block directly to its output, realizing residual learning. This structure allows the network to focus on learning the residual component between the target function and the identity mapping, significantly easing the optimization process. Following the residual feature extraction, adaptive average pooling is applied to reduce the feature maps to a fixed 4×4 resolution. The final classification is produced by a fully-connected layer. The overall network structure is displayed in Table 5.
2.4.4. Model Training and Testing
The three classifier were trained and evaluated based on three distinct datasets: hard seat, soft seat, and mixed (combined) seating condition. Each dataset was partitioned into five equal parts, with each fold maintaining the same proportional distribution of the nine posture categories. In each split, 20% of the data were allocated for testing, and the remaining 80% were used for training.
During training, all models were configured with identical hyperparameters: 50 training epochs (10 per fold in cross-validation), a batch size of 32, the Adam optimizer with a learning rate of 0.001, and cross-entropy loss. Training loss and validation accuracy were monitored in real-time for each epoch. A performance-based model selection strategy was employed, where only the model parameters achieving the highest validation accuracy were retained.
The overall experimental framework formed a 3×3 comparison matrix, comprising three seating conditions and three model architectures, resulting nine independent training and evaluation runs. All training processes were executed automatically, and key performance metrics were systematically recorded to support reliable model selection under different application scenarios.
2.4.5. Cross-Domain Prediction
To evaluate the generalization capability of the classifiers across different seating conditions, the best-performing model from each training dataset (hard seat, soft seat, and mixed) was selected for cross-domain validation.
Each complete dataset was systematically used as a test set to evaluate models trained under different seating conditions. Specifically, the model trained on hard seat dataset was used to predict soft seat dataset, and vice versa. The mixed training model was evaluated on both hard and soft seat datasets. Classification accuracy was calculated by comparing the model predictions with ground-true posture labels, and detailed confusion matrices were generated to analyze error patterns.
This evaluation scheme not only quantifies the performance degradation in cross-domain scenarios but, more importantly, reveals differences in generalization characteristics between network architectures (CNN/ResNet leverage local spatial features, while FNN relies on global statistical features) when facing variations in seat surface materials. The results provide empirical support for model selection in practical applications where seating conditions may vary.
2.5. Statistical Analysis
For the characteristics of pressure distribution (peak pressure, mean pressure and pressure variance), paired-sample t test was performed to examine whether there was any significant difference between hard and soft seat conditions. All statistical analyses were carried out with SPSS software (V26.0, SPSS Inc., Chicago, USA), with the significance level set at p < 0.05.
3. Results
3.1. Comparison of Pressure Distribution between Hard and Soft Seat Conditions
Pressure distribution was significantly different between hard and soft seat conditions (Table 3). Specifically, peak pressure and pressure variance were significantly greater in hard seat condition compared to soft seat condition (p < 0.001 and 0.03; Cohen’s d = 0.55 and 0.22 ), whereas mean pressure was significantly lower (p < 0.001; Cohen’s d = 2.94). Detailed characteristics of pressure distribution for each posture under both hard and soft seat conditions are shown in Table 6.
3.2. Classification Results
The classification accuracy of the three neural networks (FNN, CNN and ResNet) evaluated under three seating conditions is summarized in Table 7. All models achieved mean accuracy above 97% across all datasets in the 5-fold cross-validation.
On the soft seat dataset, the FNN classifier attained a mean accuracy of 97.73%, while CNN and ResNet achieved 98.30% and 98.35%, respectively. For the hard seat condition, the FNN classifier reached 96.97%, compared to 97.48% for CNN and 97.41% for ResNet. When trained and tested on the combined dataset, the FNN classifier achieved a mean accuracy of 97.27%, whereas CNN and ResNet obtained 97.70% and 97.75%, respectively.
Across all seating condition, both CNN and ResNet consistently outperformed the FNN classifier by a small margin. Between the two Convolutional architecture, ResNet showed slightly higher accuracy than CNN on the soft and combined datasets, while CNN performed marginally better on the hard seat dataset.
3.3. Cross-domain Prediction Results
The cross-domain prediction accuracy of the classifier is summarized in Table 8. When models trained exclusively on hard surface dataset were tested on soft surface data, the FNN classifier achieved 39.35% accuracy, while CNN and ResNet attained 38.33% and 29.26%, respectively. In the reverse scenario, models trained on soft surface dataset and tested on hard surface dataset resulted in 39.37% accuracy for FNN, 31.60% for CNN, and 35.00% for ResNet. In contrast, models trained on the mixed dataset, demonstrated consistently high accuracy across both surface conditions. The average accuracy was 97.15%, 97.97% and 97.73% for FNN, CNN and ResNet, respectively. The cross-domain performance of all models was notably lower than their within-domain accuracy, with no consistent advantage observed for Convolutional architectures over FNN in cross-surface generalization. Detailed confusion matrixes were presented in Appendix 1.
4. Discussion
This study developed and evaluated three deep learning models (FNN, CNN and ResNet) for classifying nine sitting postures using only pressure distribution data acquired from both hard and soft seat conditions. The results demonstrated that all three models achieved excellent prediction performance with overall accuracy exceeding 96% when models were trained and tested within the identical seat condition. However, significant performance degradation was observed in cross-domain scenarios, when models trained on one type of seat surface were applied to the other. Notably, models trained on the combined dataset exhibited robust performance on both hard and soft seats, with CNN demonstrating superior cross-domain robustness compared to both FNN and ResNet architectures.
Our findings aligned with and extended previous research in sitting posture recognition. The overall high accuracy (>96%) achieved by all three models was consistent with reported performance levels in studies utilizing pressure distribution data [15,18]. However, unlike previous investigations that typically focused on limited posture sets (4-6 postures) [13,14,15] or relied on multi-sensor configurations [18,19,20,21,22], our study successfully classified nine postures using only pressure distribution data, thereby addressing a significant methodological gap in current research. Moreover, the inclusion of contralaterally rotated and asymmetrical trunk postures represents an important advancement, as these clinically relevant postures have been largely overlooked in previous posture recognition research, despite their established association with increased musculoskeletal loading.
The comparative analysis of the three model architectures revealed distinct advantages and limitations for each model. The FNN served as an effective baseline, demonstrating reasonable classification accuracy despite its architectural simplicity. The CNN architecture, leveraging its inherent inductive bias for local spatial features, achieved superior performance in within-domain classification tasks by effectively capturing discriminate pressure distribution patterns such as gradient edges and pressure centers. This observation aligns with the fundamental advantage of convolutional networks in processing spatially correlated data [16,17].
The performance advantage of CNN in homogeneous domains can be attributed to its specialized capacity to detect localized pressure patterns that are highly consistent within the same seat condition. However, this strength become a limitation in cross-domain scenarios. The fundamental physical differences between seat surfaces, specifically, the higher compliance of soft seats that leads to more dispersed pressure distribution and significantly reduced pressure variance, directly undermine CNN’s core operational principle. The architectural bias of CNN toward local spatial correlations and salient features such as pressure centers and gradient edges is compromised when these features become less distinct due to surface deformation. In contrast, the FNN’s reliance on global, flattened statistical features provides a more stable foundation for cross-domain generalization, enabling relatively robust performance despite substantial discrepancies between source and target domain data distribution.
Interestingly, the ResNet architecture, while achieving comparable accuracy to CNN, did not provide significant performance improvements despite its greater depth and sophisticated residual connections. This suggests that for the 16×16 pressure matrix scale used in the present study, the additional complexity introduced by residual learning mechanisms may not be necessary for achieving optimal performance. From a computational efficiency perspective, both CNN and ResNet demonstrated substantial advantages over the FNN, reducing parameter counts by 62.6% and 76.6% respectively while maintaining or improving classification performance. This lightweight design is particularly beneficial for small-scale datasets, effectively mitigating overfitting risks while preserving representational capacity.
The substantial performance degradation observed in cross-domain scenarios (approximately 60% accuracy reduction) underscores the critical influence of seat surface characteristics on pressure distribution patterns. Our detailed pressure distribution analysis revealed fundamental physical differences between hard and soft seats: hard seat exhibited significantly higher peak pressure and pressure variance, indicating more concentrated pressure distributions, while soft surface showed higher mean pressure due to increased contact area from surface deformation.
The t-Distributed Stochastic Neighbor Embedding (t-SNE; [33,34] provided compelling evidence of the domain shift phenomenon, with data from the same posture forming distinct clusters based on surface type in the feature space (Figure 1). This pronounced separation explains the fundamental challenges in cross-domain generalization, as classifiers trained exclusively on one domain lack effective decision boundaries for effective classification in the other domain. Complementary random forest feature importance analysis (Figure 2; [35,36]) further revealed that classification models primarily relied on high-pressure concentrations in the ischial tuberosity area, the features that remain well-defined on hard seat but become dissipated and less discriminate on soft seat.
The superior cross-domain performance of FNN compared to CNN can be attributed to its reliance on global statistical features rather than localized spatial patterns. While CNN’s spatial inductive bias provides advantages in within-domain classification, it becomes a limitation when key spatial features are not preserved across domains. This explains why FNN maintained slightly better performance (around 40% accuracy) in cross-domain testing compared to CNN (around 35% accuracy).
The mixed training strategy effectively addressed these cross-domain challenges by providing diverse pressure distribution patterns across both seat surfaces. When trained on combined dataset, CNN’s performance significantly surpassed that of FNN, demonstrating that with sufficient data coverage that encompasses the full spectrum of pressure distribution variation, CNN’s superior feature extraction capability can be fully utilized. The mixed dataset provides rich and diverse local spatial features, ranging from concentrated high-pressure zones characteristic of hard seat to diffuse low-pressure areas typical of soft seat, enabling the CNN architecture to learn more discriminate, spatially hierarchical representations intimately related to the physical properties of different seat surfaces. Although FNN demonstrates slightly better robustness in extreme cross-domain scenarios, its inherent inability to leverage spatial structural information fundamentally limits its maximum achievable classification accuracy when dealing with complex, heterogeneous data environments.
From a practical implementation perspective, the observed trade-offs between model complexity and generalization capability have important implications for real-world deployment. The CNN architecture emerges as the most balanced choice for applications where training data can encompass the expected variety of seat conditions, offering an optimal combination of parameter efficiency (62.6% reduction compared to FNN), computational performance, and classification accuracy. For resource-constrained environments or applications requiring frequent cross-domain operation, the FNN architecture provides a computationally inexpensive alternative despite its lower peak accuracy. These findings strongly suggest that practical deployment strategies should prioritize comprehensive data diversity over over model complexity, ensuring training data adequately represents the target application environments.
5. Conclusions
This study demonstrated that pressure distribution data effectively differentiates between hard and soft seats through distinct patterns in peak pressure, mean pressure, and pressure variance. However, classification performance is highly dependent on model architecture and training data composition. No single model proved universally optimal; rather, model selection involves critical trade-offs. The FNN offered more stable cross-domain performance with lower peak accuracy, while the CNN achieved superior accuracy when trained on mixed data encompassing both seat types, though its performance remained sensitive to data coverage completeness. These findings underscore the importance of matching model architecture to application context, with data diversity being as crucial as model selection. For practical deployment, systems should be trained on dataset that adequately represent target seat environments. Future study will expand to dynamic siting posture analysis using nine-series pressure data, enabling more nuanced monitoring of posture transitions and real-world sitting behaviors across diverse seat conditions.
Supplementary Materials
The following supporting information can be downloaded at the website of this paper posted on Preprints.org, Figure S1: Confusion matrixes of FNN, CNN and ResNet across different dataset (hard, soft and mixed).
Author Contributions
Conceptualization, S.M.; methodology, S.M.; software, B.W.; validation, L.T., and Q.S.; formal analysis, B.W.; investigation, B.W., and L.T.; resources, S.M.; data curation, B.W.; writing—original draft preparation, B.W.; writing—review and editing, S.M.; visualization, B.W.; supervision, S.M.; project administration, L.T.; funding acquisition, S.M. All authors have read and agreed to the published version of the manuscript.
Funding
This research was funded by NATIONAL KEY RESEARCH AND DEVELOPMENT PROGRAM OF CHINA, grant number 2022YFC2503205.
Institutional Review Board Statement
The study was conducted in accordance with the Declaration of Helsinki, and approved by the Medical Ethical Review Committee of NATIONAL INSTITUTE FOR OCCUPATIONAL HEALTH AND POISON CONTROL CHINESE CENTER FOR DISEASE CONTROL AND PREVENTION (protocol code NIOHP202326; Sep. 27, 2023).
Informed Consent Statement
Informed consent was obtained from all subjects involved in the study. Written informed consent has been obtained from the subjects to publish this paper.
Conflicts of Interest
The authors declare no conflicts of interest. The funders had no role in the design of the study; in the collection, analyses, or interpretation of data; in the writing of the manuscript; or in the decision to publish the results.
Abbreviations
The following abbreviations are used in this manuscript:
| NUP | Natural upright posture |
| LF | Lean forward |
| LB | Lean backward |
| LL | Lean left |
| LR | Lean right |
| LLA | Lean left anterior |
| LRA | Lean right anterior |
| CLA | Lean contralateral left anterior |
| CRA | Lean contralateral right anterior |
| FNN | Feedforward Neural Network |
| CNN | Convolutional Neural Network |
| ResNet | Residual Neural Network |
| ReLU | Rectified linear unit |
| t-SNE | t-Distributed Stochastic Neighbor Embedding |
References
- Tinitali, S.; Bowles, K.A.; Keating, J.L.; Haines, T. Sitting posture during occupational driving causes low back pain; evidence-based position or dogma? A systematic review. Hum Factors 2021, 63(1), 111–123. [Google Scholar] [CrossRef]
- Zemp, R.; Fliesser, M.; Wippert, P.M.; Taylor, W.R.; Lorenzetti, S. Occupational sitting behaviour and its relationship with back pain—A pilot study. Appl Ergon 2016, 56, 84–91. [Google Scholar] [CrossRef]
- Guerra, B.M.V.; Ramat, S.; Beltrami, G.; Schmid, M. Recurrent network solutions for human posture recognition based on kinect skeletal data. Sensors 2023, 23, 5260. [Google Scholar] [CrossRef]
- Li, L.; Yang, G.; Li, Y.; Zhu, D.; He, L. Abnormal sitting posture recognition based on multi-scale spatiotemporal features of skeleton graph. Eng Appl Artif Intell 2023, 123, 106374. [Google Scholar] [CrossRef]
- Tang, H.-Y.; Tan, S.-H.; Su, T.-Y.; Chiang, C.-J.; Chen, H.-H. Upper body posture recognition using inertial sensors and recurrent neural networks. Appl Sci 2021, 11, 12101. [Google Scholar] [CrossRef]
- Tlili, F.; Haddad, R.; Bouallegue, R.; Shubair, R. Machine learning algorithms application for the proposed sitting posture monitoring system. Procedia Comput Sci 2022, 203, 239–246. [Google Scholar] [CrossRef]
- Wang, J.; Hafidh, B.; Dong, H.; El Saddik, A. Sitting posture recognition using a spiking neural network. IEEE Sens J 2020, 21, 1779–1786. [Google Scholar] [CrossRef]
- Zhao, L.; Yan, J.; Wang, A. A comparative study on real-time sitting posture monitoring systems using pressure sensors. J Electr Eng 2023, 74, 474–484. [Google Scholar] [CrossRef]
- Zhang, X.; Fan, J.; Peng, T.; Zheng, P.; Lee, C.K.; Tang, R. A privacy-preserving and unobtrusive sitting posture recognition system via pressure array sensor and infrared array sensor for office workers. Adv Eng Inform 2022, 53, 101690. [Google Scholar] [CrossRef]
- Liu, Y.; Han, Z.; Chen, X.; Ru, S.; Yan, B. Effects of different sitting postures on back shape and hip pressure. J Med Biomech 2023, 38, 756–762. [Google Scholar]
- Kamiya, K.; Kudo, M.; Nonaka, H.; Toyama, J. Sitting posture analysis by pressure sensors. In 2008 19th International Conference on Pattern Recognition, Tampa, FL, USA, 2008, pp. 1-4. [CrossRef]
- Nadeem, M.; Elbasi, E.; Zreikat, A.I.; Sharsheer, M. Sitting posture recognition systems: Comprehensive literature review and analysis. Appl Sci 2024, 14(18), 8557. [Google Scholar] [CrossRef]
- Ahmad, J. , Andersson, H., Sidén, J. Sitting posture recognition using screen printed large area pressure sensors. In 2017 IEEE Sensors 2017, pp. 1-3.
- Wan, Q.; Zhao, H.; Li, J.; Xu, P. Hip positioning and sitting posture recognition based on human sitting pressure image. Sensors 2021, 21(2), 426. [Google Scholar] [CrossRef]
- Fan, Z.; Hu, X.; Chen, W.-M.; Zhang, D.-W.; Ma, X. A deep learning based 2-dimensional hip pressure signals analysis method for sitting posture recognition. Biomed Signal Process Control 2022, 73, 103432. [Google Scholar] [CrossRef]
- Benocci, M.; Farella, E.; Benini, L. A context-aware smart seat. In 2011 4th IEEE International Workshop on Advances in Sensors and Interfaces (IWASI), 2011, pp. 104-109.
- Roh, J.; Park, H.; Lee, K.J.; Hyeong, J.; Kim, S.; Lee, B. Sitting posture monitoring systemm based on a low-cost load cell using machine learning. Sensors 2018, 18(1), 208. [Google Scholar] [CrossRef]
- Katayama, H.; Mizomoto, T.; Rizk, H.; Yamaguchi, H. You work we care: Sitting posture assessment based on point cloud data. In 2022 IEEE International Conference on Pervasive Computing and Communications Workshops and other Affiliated Events (PerCom Workshops) 2022, pp. 121-123.
- Zhang, X.; Fan, J.; Peng, T.; Zheng, P.; Lee, C.K.M.; Tang, R. A privacy-preserving and unobtrusive sitting posture recognition system via pressure array sensor and infrared array sensor for office workers. Adv Eng Inform 2022, 53, 101690. [Google Scholar] [CrossRef]
- Ishac, K.; Suzuki, K. Lifechair: A conductive fabric sensor-based smart cushion for actively shaping sitting posture. Sensors 2018, 18(7), 2261. [Google Scholar] [CrossRef]
- Muppavram, S.; Patel, N.; Nadeem, M. Posture alert. In 2018 IEEE Region Ten Symposium (Tensymp) 2018, pp. 213-218.
- Bourahmoune, K.; Ishac, K.; Amagasa, T. Intelligent posture training: machine-learning-powered human sitting posture recognition based on a pressure-sensing IoT cushion. Sensors 2022, 22(14), 5337. [Google Scholar] [CrossRef]
- Grandjean, E.; Hünting, W. Ergonomics of posture-Review of various problems of standing and sitting posture. Appl Ergon 1977, 8, 135–140. [Google Scholar] [CrossRef]
- Li, W.; Mo, R.; Yu, S.; Chu, J.; Hu, Y.; Wang, L. The effects of the seat cushion contour and the sitting posture on surface pressure distribution and comfort during seated work. Int J Occup Med Environ Health 2020, 33(5), 675–689. [Google Scholar] [CrossRef]
- Vergara, M.; Page, Á. System to measure the use of backrest in sitting-posture office tasks. Appl Ergon 2000, 31, 247–254. [Google Scholar] [CrossRef] [PubMed]
- Wan, Q.; Zhao, H.; Li, J.; Xu, P. Hip positioning and sitting posture recognition based on human sitting pressure image. Sensors 2021, 21(2), 426. [Google Scholar] [CrossRef]
- Ahn, S.; Jeong, Y.; Kim, D.; Kim, H. Development of the non-wearable system with FSR sensors for correction of sitting position. In 2015 Second International Conference on Computing Technology and Information Management (ICCTIM), Johor, Malaysia, 2015, pp. 140-143. [CrossRef]
- Anwary, A.R.; Bouchachia, H.; Vassallo, M. Real time visualization of asymmetrical sitting posture. Procedia Comput Sci 2019, 155, 153–160. [Google Scholar] [CrossRef]
- Krauter, C.; Angerbauer, K.; Calepso, A.S.; Achberger, A.; Mayer, S.; Sedlmair, M. Sitting posture recognition and feedback: A literature review. In Proceedings of the CHI Conference on Human Factors in Computing Systems, Honolulu, HI, USA, 11–16 May 2024; pp. 1–20. [Google Scholar]
- Scena, S.; Steindler, R. Methods for sitting posture evaluation: Static posture and applications. Strain 2008, 44, 423–428. [Google Scholar] [CrossRef]
- Zhang, X.; Fan, J.; Peng, T.; Zheng, P.; Zhang, X.; Tang, R. Multimodal data-based deep learning model for sitting posture recognition toward office workers’ health promotion. Sens Actuators A Phys 2023, 350, 114150. [Google Scholar] [CrossRef]
- Stern, L.; Fernie, G.; Roshan Fekr, A. A novel in-bed body posture monitoring for decubitus ulcer prevention using body pressure distribution mapping. BioMed Eng OnLine 2024, 23, 34. [Google Scholar] [CrossRef]
- Maaten, L.V.; Hinton, G. Visualizing data using t-SNE. J Mach Learn Res 2008, 9 (Nov), 2579–2605. [Google Scholar]
- Wattenberg, M.; Viégas, F.; Johnson, I. How to use t-SNE effectively. Distill 2016, 1(10), e2. [Google Scholar] [CrossRef]
- Kumar, R.N.; Surendran, R.; Madhusundar, N. An intelligent human pose detection comparing with random forest and recurrent neural network. In 2024 8th International Conference on Electronics, Communication and Aerospace Technology (ICECA), Coimbatore, India, 2024, pp. 915-921.
- Lee, J.; Choi, H.; Kim, J. Classification algorithm for sitting postures using weighted random forest. IET Image Process 2025, 19, e70126. [Google Scholar] [CrossRef]
Figure 1.
3D Visualization of pressure distribution features on hard seat (blue dot) and soft sear (red dot) by t-Distributed Stochastic Neighbor Embedding.
Figure 1.
3D Visualization of pressure distribution features on hard seat (blue dot) and soft sear (red dot) by t-Distributed Stochastic Neighbor Embedding.
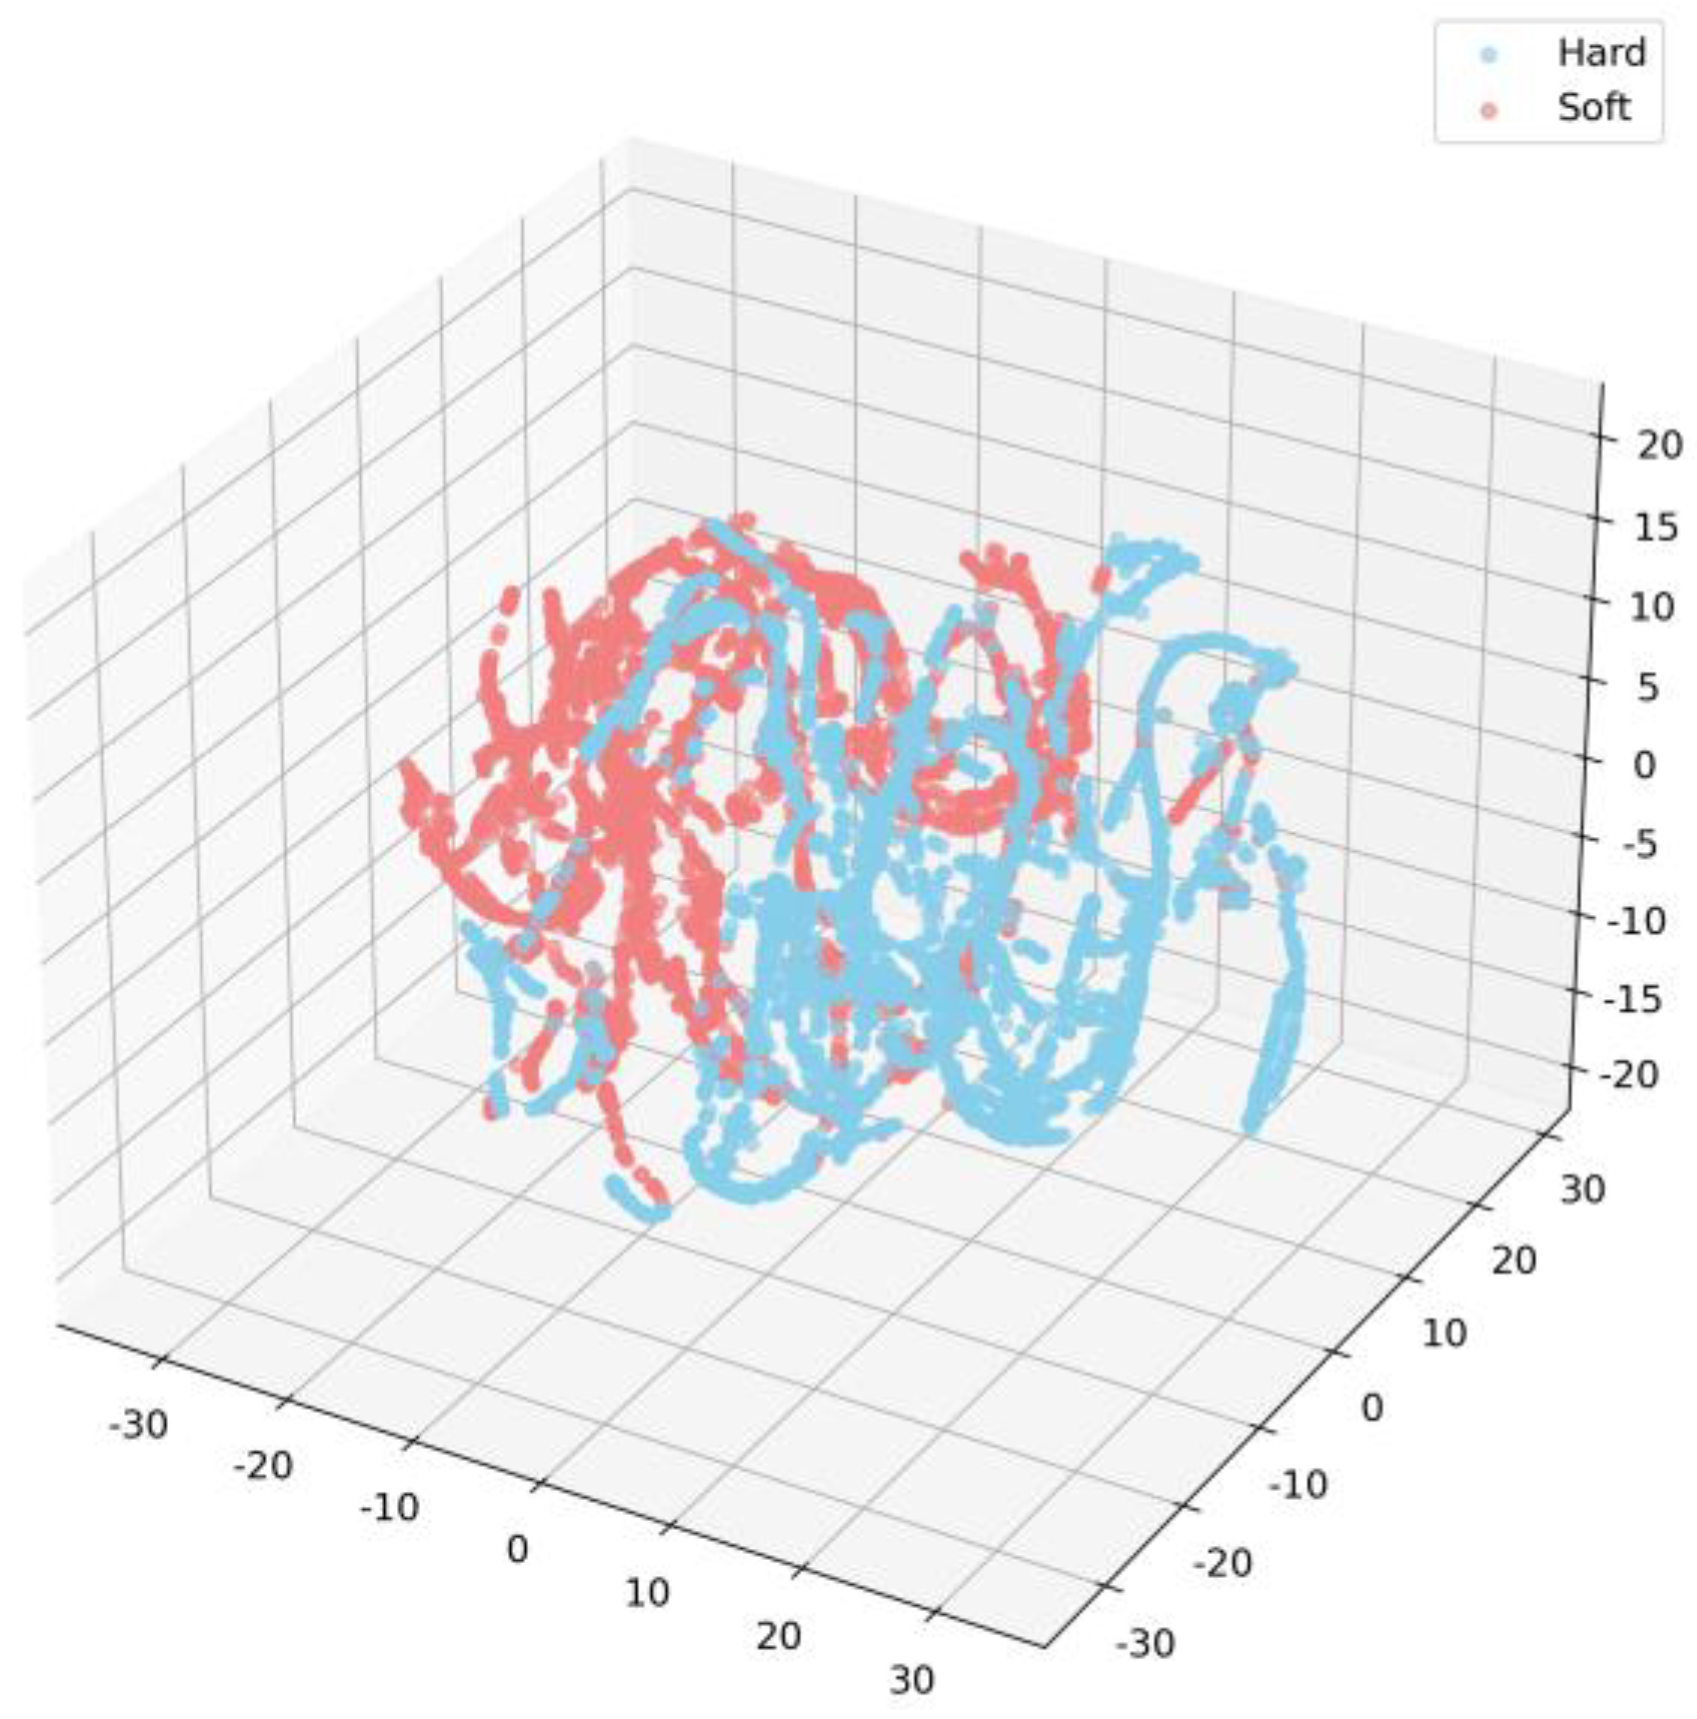
Figure 2.
Feature Importance Heatmap (a. Hard Seat, b. Soft Seat ).
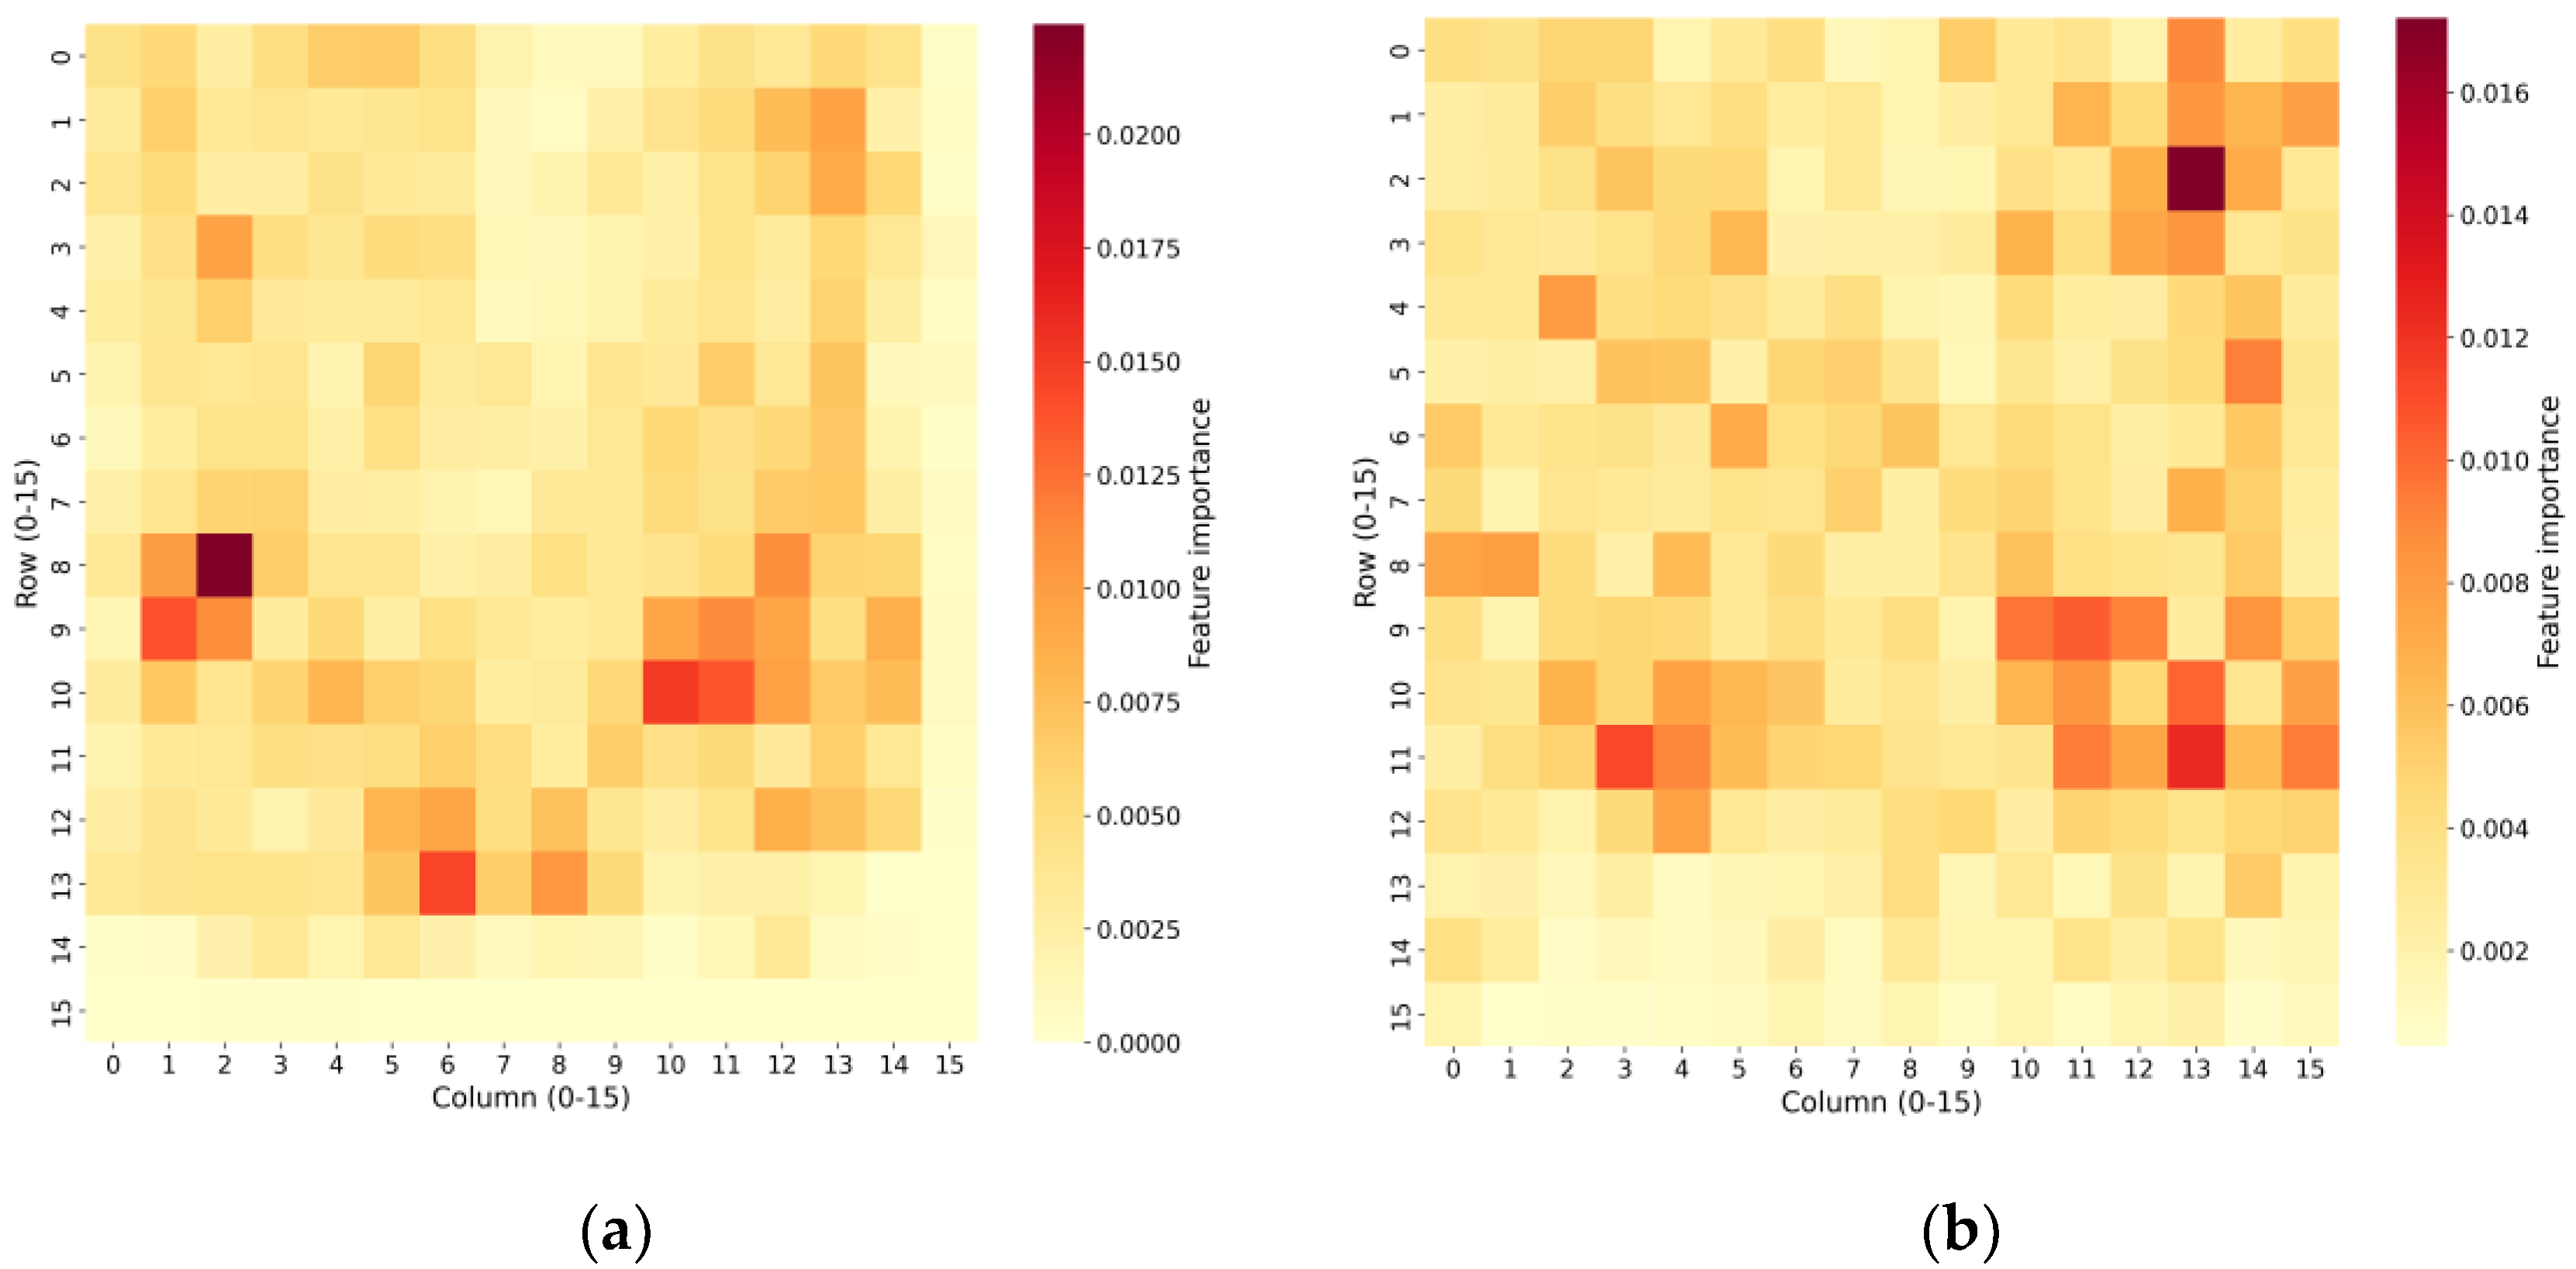

Table 1.
Definition of the nine seated postures.
| Posture | Definition |
|---|---|
| Natural Upright Posture (NUP) | The torso maintains in a natural, upright position without internal leaning or rotation. |
| Lean Forward (LF) | The torso leans forward by at least 30°, without lateral deviation or rotation. |
| Lean Backward (LB) | The torso leans backward by at least 10°, without lateral deviation or rotation |
| Lean Left (LL) | The torso leans laterally to the left by at least 20°, without forward or backward movement or rotation |
| Lean Right (LR) | The torso leans laterally to the right by at least 20°, without forward or backward movement or rotation |
| Lean Left Anterior (LLA) | The torso leans at least 20° toward the left-anterior 45° direction |
| Lean Right Anterior (LRA) | The torso leans at least 20° toward the right-anterior 45° direction |
| Lean Contralateral Left Anterior (CLA) | The torso rotates and leans at least 20° toward the left-anterior direction on the opposite side |
| Lean Contralateral Right Anterior (CRA) | The torso rotates and leans at least 20° toward the right-anterior direction on the opposite side |
Table 2.
Number of valid data frames for each posture under hard and soft seat conditions.
| Posture | Hard Seat | Soft Seat | Total |
|---|---|---|---|
| NUP | 2571 | 2273 | 4844 |
| LF | 2551 | 2246 | 4797 |
| LB | 2516 | 2225 | 4741 |
| LL | 2483 | 2217 | 4700 |
| LR | 2460 | 2286 | 4746 |
| LLA | 2510 | 2224 | 4734 |
| LRA | 2479 | 2240 | 4719 |
| CLA | 2463 | 2228 | 4691 |
| CRA | 2444 | 2233 | 4677 |
| Combined | 22477 | 20172 | 42649 |
Table 3.
The structure of four-layered FNN-based classifier.
| Layer | Type | Output Shape | Parameters | Activation | Regularization |
|---|---|---|---|---|---|
| 1 | Input | 16x16x1 | - | - | - |
| 2 | Flatten | 256 | 0 | - | - |
| 3 | Fully Connected | 256 | 65792 | ReLU | Dropout (0.3) |
| 4 | Fully Connected | 128 | 32896 | ReLU | Dropout (0.3) |
| 5 | Fully Connected | 64 | 8256 | ReLU | - |
| 6 | Output | 9 | 585 | Linear | - |
| Total | 6 layers | - | 107529 | - | - |
Table 4.
The structure of CNN-based classifier.
| Layer | Type | Output Shape | Parameters | Activation | Regularization |
|---|---|---|---|---|---|
| 1 | Input | 16x16x1 | - | - | - |
| 2 | Conv2D | 32@16x16 | 320 | ReLU | - |
| 3 | BatchNorm | 32@16x16 | 64 | - | - |
| 4 | MaxPool | 32@8x8 | 0 | - | - |
| 5 | Conv2D | 64@8x8 | 18496 | ReLU | - |
| 6 | BatchNorm | 64@8x8 | 128 | - | - |
| 7 | MaxPool | 64@4x4 | 0 | - | - |
| 8 | Conv2D | 128@4x4 | 73856 | ReLU | - |
| 9 | BatchNorm | 128@4x4 | 256 | - | - |
| 10 | GlobalAvgPool | 128@2x2 | 0 | - | - |
| 11 | Flatten | 512 | 0 | - | - |
| 12 | Fully Connected | 128 | 65664 | ReLU | Dropout |
| 13 | Output | 9 | 1161 | Linear | - |
| Total | 13 layers | - | 159945 | - | - |
Table 5.
The structure of ResNet-based classifier.
| Layer | Type | Output Shape | Parameters | Activation | Regularization |
|---|---|---|---|---|---|
| 1 | Input | 16x16x1 | 0 | None | None |
| 2 | Initial Conv | 32@16x16 | 320 | ReLU | None |
| 3 | Residual Block 1 | 32@16x16 | 18560 | ReLU | Skip Connection |
| 4 | Residual Block 2 | 32@16x16 | 18560 | ReLU | Skip Connection |
| 5 | GlobalAvgPool | 32@4x4 | 0 | None | None |
| 6 | Flatten | 512 | 0 | None | None |
| 7 | Output | 9 | 4617 | Linear | None |
| Total | 7 layers | - | 42057 | - | - |
Table 6.
Characteristics of pressure distribution for each posture under hard and soft seat conditions.
Table 6.
Characteristics of pressure distribution for each posture under hard and soft seat conditions.
| Posture | Hard Seat | Soft Seat | ||||
|---|---|---|---|---|---|---|
| Peak (mV) | Mean (mV) | Variance (mV2) | Peak (mV) | Mean (mV) | Variance (mV2) | |
| NUP | 2520.0±0.0 | 673.2±100.9 | 20072±10234 | 2300.9±311.7 | 889.8±78.0 | 23034±20584 |
| LF | 2519.1±3.0 | 643.6±90.4 | 24548±16382 | 2453.6±220.1 | 817.8±73.7 | 25710±16235 |
| LB | 2520.0±0.0 | 750.5±81.2 | 34277±17242 | 2316.4±252.4 | 882.5±80.8 | 20351±14854 |
| LL | 2508.2±39.2 | 567.3±93.6 | 23447±12157 | 2356.4±232.8 | 856.3±77.0 | 21873±16376 |
| LR | 2520.0±0.0 | 548.5±80.6 | 30782±13935 | 2484.5±117.6 | 800.7±119.2 | 17662±8252 |
| LLA | 2520.0±0.0 | 573.8±100.8 | 22114±11122 | 2457.3±130.4 | 826.7±69.4 | 23950±10476 |
| LRA | 2520.0±0.0 | 555.4±84.9 | 25859±10208 | 2338.2±297.7 | 774.6±127.3 | 20733±21716 |
| CLA | 2520.0±0.0 | 604.1±75.7 | 23274±11966 | 2441.8±150.9 | 834.4±90.6 | 20689±13814 |
| CRA | 2510.0±33.2 | 575.1±71.0 | 25299±14384 | 2356.4±313.1 | 791.0±82.4 | 20036±15290 |
| Combined | 2517.5±17.0* | 610.2±105.0* | 25519.2±13409.2* | 2389.5±236.1 | 830.4±94.8 | 21559.7±15320.8 |
| Key: *, paired-sample t test with p < 0.05. | ||||||
Table 7.
Prediction accuracy of FNN, CNN and ResNet classifiers with 5-fold cross-validation.
| Classifier | Dataset | 1 | 2 | 3 | 4 | 5 | Mean Accuracy |
|---|---|---|---|---|---|---|---|
| FNN | Soft | 97.65% | 97.55% | 97.84% | 97.72% | 97.92% | 97.73% |
| Hard | 97.22% | 97.09% | 96.62 | 96.35% | 97.55% | 96.97% | |
| Combined | 97.65% | 97.55% | 97.84 | 97.72% | 97.92% | 97.27% | |
| CNN | Soft | 98.31% | 97.84% | 98.61 | 98.44% | 98.29% | 98.30% |
| Hard | 97.64% | 97.64% | 97.04 | 97.13% | 97.93% | 97.48% | |
| Combined | 97.60% | 97.70% | 97.54 | 97.87% | 97.81% | 97.70% | |
| ResNet | Soft | 98.34% | 98.19% | 98.49 | 98.26% | 98.49% | 98.35% |
| Hard | 97.51% | 97.33% | 97.17 | 97.09% | 97.95% | 97.41% | |
| Combined | 97.56% | 97.71% | 97.78 | 97.88% | 97.82% | 97.75% |
Table 8.
Cross-domain prediction accuracy of FNN, CNN and ResNet classifier.
| Classifier | Training Dataset | Testing Domain | Accuracy |
|---|---|---|---|
| FNN | Hard | Soft | 39.35% |
| Soft | Hard | 39.97% | |
| Combined | Soft | 97.61% | |
| Hard | 96.69% | ||
| CNN | Hard | Soft | 38.33% |
| Soft | Hard | 31.60% | |
| Combined | Soft | 98.22% | |
| Hard | 97.72% | ||
| ResNet | Hard | Soft | 29.26% |
| Soft | Hard | 35.00% | |
| Combined | Soft | 97.93% | |
| Hard | 97.52% |
Disclaimer/Publisher’s Note: The statements, opinions and data contained in all publications are solely those of the individual author(s) and contributor(s) and not of MDPI and/or the editor(s). MDPI and/or the editor(s) disclaim responsibility for any injury to people or property resulting from any ideas, methods, instructions or products referred to in the content. |
© 2025 by the authors. Licensee MDPI, Basel, Switzerland. This article is an open access article distributed under the terms and conditions of the Creative Commons Attribution (CC BY) license (http://creativecommons.org/licenses/by/4.0/).
Copyright: This open access article is published under a Creative Commons CC BY 4.0 license, which permit the free download, distribution, and reuse, provided that the author and preprint are cited in any reuse.


