
Submitted:
04 November 2025
Posted:
07 November 2025
You are already at the latest version
Abstract
A critical obstacle in cardiac cell therapy is the unpredictable and poorly understood initial electrophysiological integration of grafted cardiomyocytes into the host tissue, a process that dictates therapeutic success and arrhythmic risk. Current models fail to capture the earliest stages of functional coupling formation. Here, we employed a tailored bioengineering platform, where single cardiomyocytes were stabilized on minimalist electrospun polycaprolactone (PCL) nanofibers, to model the "graft-host" interface and study the dynamics of excitation wave transmission in real-time. Using high-speed optical mapping enhanced by a custom SUPPORT neural network, we achieved the first quantitative insights into the efficiency of nascent intercellular contacts. We determined that within the first 3 hours, these initial connections are 39-44 times less effective at conducting excitation than mature contacts within the native monolayer, explaining the observed partial (46%) synchronization of grafted cells. This work provides the first direct measurement of the functional deficit during the initial minutes and hours of graft integration. It establishes that simple, inert polymer fibers can act as a catalytic scaffold to enable this fundamental biological process, offering a powerful strategy to deconstruct and ultimately control the integration of engineered tissues (or cells) for safer cell therapies.
Keywords:
cardiac cell therapy
; electrophysiological integration
; polycaprolactone nanofibers
; optical mapping
; intercellular coupling
; tissue engineering
; neural network
1. Introduction
Myocardial regeneration represents a formidable challenge in contemporary biomedical science, with cell-based therapeutic strategies offering promising avenues for addressing ischemic cardiomyopathy and associated cardiac pathologies[1,2]. Сlinical translation of cardiomyocyte transplantation remains constrained by suboptimal engraftment efficiency and proarrhythmic complications stemming from impaired electromechanical integration [3,4,5]. Current cell delivery methods, including direct intramyocardial injection and intracoronary infusion, result in substantial cell loss and poor graft retention.
The electrophysiological integration of grafted cardiomyocytes presents particularly complex challenges. Successful engraftment requires not only cell survival and structural incorporation but also establishment of functional electromechanical coupling with host tissue. The fundamental prerequisite for successful graft-host integration involves establishment of functional intercellular coupling through both gap junction-mediated and potential mechanisms. The former relies on connexin-based channels (predominantly Cx43 in ventricular myocardium) forming pathways for intercellular current flow [6,7]. The latter, termed ephaptic coupling, involves electric field interactions in nanoscale extracellular clefts without direct cytoplasmic continuity [8,9,10]. Contemporary models suggest these mechanisms may operate synergistically, with ephaptic coupling potentially providing compensatory conduction pathways during gap junction remodeling [11,12,13].
Critical to understanding graft integration dynamics is the recognition that functional maturation of intercellular connections requires a protected period of several hours post-transplantation, during which mechanical stabilization is essential for structural and electrophysiological recovery [14]. This vulnerable period is characterized by dynamic reorganization of intercellular junctions, membrane polarization establishment, and calcium handling system maturation. Previous investigation established that polymer microcarriers effectively maintain cardiomyocyte structural integrity during this vulnerable period[15], providing a stable platform for initial graft-host interaction [16].
The nanofiber carrier approach represents a significant advance in cell delivery technology [17,18]. The controlled dimensionality of these carriers allows for the creation of a suitable environment for studying the mechanisms of intercellular interaction. Another significant advantage of such carriers is that the cells attached to them are not in a suspended state. The nanofibers provide an adhesive surface for the cells in the solution. As a result, the cells do not remain spherical but instead envelop the nanofibers [15] and undergo spreading. This process allows the cells to complete a preparatory stage before forming intercellular contacts (a suspended cell cannot engage in electrophysiological interactions with other cells, making this step essential [19]).
However, there is currently no data on how cardiomyocytes initiate electrophysiological contact with each other. Thus, this investigation aims to evaluate the electrophysiological integration of carrier-stabilized cardiomyocytes (graft) with the recipient monolayer (host) during the early engraftment phase. The study will determine the time constraints for the integration of single cardiomyocytes into a confluent monolayer, as well as limitations in the propagation of excitation waves through newly formed connections to the recently integrated cardiomyocytes from the synchronized monolayer.
2. Materials and Methods
2.1. Rat Neonatal Cardiomyocytes Isolation Protocol
Rat neonatal cardiomyocytes were isolated using a standard two-day protocol adapted from the Worthington-Biochem protocol for the isolation of neonatal rat cardiomyocytes and fibroblasts (http://www.worthingtonbiochem.com/NCIS/default.html). Hearts were harvested from 1–4 day-old neonatal rats (Rattus norvegicus, Sprague Dawley breed) and immediately placed in ice-cold Ca²⁺- and Mg²⁺-free Hank’s Balanced Salt Solution (HBSS; Gibco, 14170112). The hearts were then cleared of blood, atria, and major vessels, retaining only the ventricles.
The ventricular tissue was minced into 0.5–1 mm fragments and digested in a solution of 0.25% Trypsin-EDTA (Gibco, 25200056) for 16 hours at 4°C. The following day, the tissue fragments were subjected to enzymatic digestion with Collagenase type II (2.25 μg/mL; Gibco, 17101015) for 1 hour at 37°C with constant agitation. The resulting cell suspension was filtered through a 100 μm cell strainer and centrifuged at 90g for 5 minutes.
The cell pellet was gently resuspended in Dulbecco's Modified Eagle Medium (DMEM; Paneco, С410п) by dropwise addition over a 10-minute period to prevent calcium shock. To separate cardiomyocytes from fibroblasts, the cell suspension was subjected to a pre-plating step by incubation in a T75 flask for 1 hour in a CO₂ incubator. After this period, the supernatant, enriched with cardiomyocytes, was collected.
The cardiomyocytes were then plated either:
- onto 13 mm fibronectin-coated (Paneco, H Fne-C) glass coverslips at a density of 100,000 cells per coverslip to obtain confluent monolayers, or
- onto pre-conditioned polymer fiber scaffolds at a density of 50,000 cells per scaffold to obtain isolated cells on fibers.
2.2. Preparation of PDMS Scaffolds for Electrospinning of Polymer Fibers
Polydimethylsiloxane (PDMS) molds served as rigid scaffolds for polymer fiber deposition. The PDMS was prepared by thoroughly mixing the two liquid components, Sylgard 184 Silicone Elastomer Base and Sylgard 184 Curing Agent (Dow Corning), at a 10:1 mass ratio for 10 minutes. The resulting mixture was poured into a 10 cm diameter Petri dish to form a layer approximately 3 mm thick. The PDMS was subsequently cured in an oven at 70°C for 24 hours. Finally, scaffolds of the desired shape were cut from the cured PDMS slab.
2.3. Electrospinning of Polymer Fibers onto PDMS Scaffolds
A polycaprolactone (PCL) solution was prepared by dissolving PCL powder (440744, Sigma-Aldrich, USA) in hexafluoroisopropanol to a concentration of 15% w/v. The prepared solution was loaded into a 3 mL syringe fitted with a 20-gauge blunt-end needle and electrospun using a Nanon-01 apparatus (MECC Co., Ltd). Electrospinning was performed at an applied voltage of 7 kV between the syringe needle and a grounded collector, with a solution flow rate of 0.5 mL/h maintained by a programmable Fusion 100 syringe pump. The fibers were directly deposited onto the pre-fabricated PDMS scaffolds. Subsequently, the entire construct was coated with fibronectin (Paneco, H Fne-C) to enhance the adhesive properties of the polymer fibers.
2.4. Optical Mapping
Both cell monolayers and cells on fibers were stained using Fluo-4 AM (Lumiprobe, 1892-500ug). A fiber scaffold with cells was then placed atop a cell monolayer, and the resulting construct was immersed in Tyrode’s salt solution (pH 7.25–7.4) for optical mapping, as previously described [20].
The fluorescence signal was recorded at a resolution of 512 × 512 pixels and a sampling rate of 34.6 frames per second using an Olympus MVX-10 Macro-View fluorescent microscope (Olympus Co., Tokyo, Japan) equipped with a high-speed Andor iXon-3 EMCCD camera (Andor Technology Ltd., Belfast, UK).
The experiment was conducted at 37°C to maintain physiological conditions. Electrical field stimulation was applied via an inert platinum electrode. Stimulation pulses had a duration of 20 ms, an inter-pulse interval of 1000 ms, and an amplitude of 5 V. These electrical pulses were generated by a 2 MHz USB PC function generator (PCGU100, Velleman, Gavere, Belgium)..
Data processing was fulfilled using the ImageJ (v1.54p). program and the associated plugins (http://rsbweb.nih.gov/ij/ (accessed on 5 May 2023)). ImageJ plugin (time-lapse color-coder) was used to build pseudo-3D images and activation maps.
2.5. SUPPORT Neural Network
Recorded optical mapping videos were denoised using a SUPPORT neural network. The training dataset comprised the very first control optical mapping recording, which was subsequently used to denoise all other recordings. The network input consisted of an image stack of 280 frames with a resolution of 512 × 512 pixels.
The same neural network was also applied to denoise confocal microscopy data. Since such data typically constitute very small stacks (10 images per stack), the stack size was artificially increased to 100 images using bilinear interpolation. This augmentation enhanced the network's processing efficiency even with a limited amount of input data.
2.6. Data Processing and Statistical Analysis
Preliminary processing of optical mapping and confocal microscope data was performed using ImageJ (v1.54p). To construct activation maps, background subtraction was applied to the videos, followed by SUPPORT neural network noise reduction and Gaussian blurring. The activation map generation algorithm was implemented in Python (v3.11.13) using the following libraries: Matplotlib (v3.10.0), NumPy (v2.0.2), SciPy (v1.15.3), and Pandas (v2.2.2). The algorithm is based on increasing the glow intensity of each pixel by a certain percentage of its average brightness. This principle provides increased sensitivity of the method in comparison with the standard approach, in which a single absolute threshold is applied to all pixels.
To analyze the fluorescence intensity, plots were generated with preliminary processing in ImageJ (by using SUPPORT neural network for noise reduction), followed by data processing in Microsoft Excel and further plot generation and statistical analysis in SciDAVis (v2.7).
Spatio-temporal maps were constructed using the Stacks/Reslice function in ImageJ. To further reduce noise, a stack of spatio-temporal maps was generated within a user-defined rectangular region of interest. The height of the rectangle (in pixels) corresponded to the number of images in the resulting stack, effectively representing the spatial axis of the map. The length of the rectangle corresponded to the number of frames in the original image sequence, representing the temporal axis. Subsequent averaging of all frames along the height of the spatio-temporal map stack produced a final, significantly cleaner spatio-temporal map with reduced noise. When the longitudinal axis of the rectangle is oriented perpendicular to the wavefront (i.e., aligned with the direction of wave propagation), the tangent of the angle of the bright line (corresponding to the wavefront) in the spatio-temporal map defines the conduction velocity of the excitation wave.
3. Results
3.1. Description of the Developed Model for Studying Intercellular Contact Formation
The developed model is designed to study the rate of intercellular contact formation by seeding isolated rat neonatal cardiomyocytes onto a pre-established monolayer of the same cells. This approach enables the observation of excitation wave propagation across the monolayer and its subsequent transmission to the individual cells residing on polymer fibers.
To facilitate rapid and effective electrophysiological coupling between the seeded cells and the monolayer, the cells required a solid substrate rather than being in suspension. To this end, cells were plated on thin, biocompatible polycaprolactone (PCL) fibers. These fibers were fabricated using an electrospinning apparatus and deposited onto a scaffold made of polydimethylsiloxane (PDMS). The entire construct was coated with human fibronectin to enhance its adhesive properties (Figure 1a).
Following a 4-day cultivation period, both the cells on the fibers and the monolayer cells were stained with the calcium-sensitive dye Fluo-4 AM, which visualizes the propagation of excitation waves within the model system. The fiber scaffolds with cells were then carefully placed directly onto the ready-made cell monolayer. At this point, the seeded cells began to integrate electrophysiologically into the existing monolayer.
Representative confocal microscopy images of the assembled model are shown in Figure 1b,c. The color scale indicates the height along the z-axis. The orange color of the cell on the fiber confirms its position above the monolayer, which is predominantly blue. The fibers themselves also appear orange, indicating they are located at the same height level as the seeded cell, above the monolayer.
3.2. Results of Optical Mapping of the Developed Model
Following the seeding of cells on fibers onto the monolayer, the propagation of excitation waves within the culture was recorded during stimulation of the monolayer via a platinum electrode. Figure 2b shows the normalized fluorescence intensity trace recorded 15 minutes after the experiment onset, a time point at which the cells had not yet established functional contacts.
The blue trace represents the excitation profile of the cell monolayer (mean fluorescence intensity measured near the target cell on the fiber, indicated by the blue circle in Figure 2a). As shown, the peaks of maximum fluorescence in the monolayer correspond to the 1 Hz stimulation frequency applied via the platinum electrode.
In contrast, the fluorescence trace from the cell on the fiber (red trace) shows no synchronization with the monolayer. The peaks of maximum intensity occur either randomly, coincidentally with the monolayer, or with a variable delay. This indicates that the excitation in the fiber cell is driven by its intrinsic pacemaker activity and is not yet coupled to the monolayer.
Figure 2d displays a similar fluorescence intensity trace recorded 176 minutes after the experiment began. By this time, the cells on the fibers had begun to establish electrophysiological coupling with the monolayer cells. The graph again shows that the fluorescence peaks of the monolayer cells (blue trace) align with the external stimulation (green trace).
The red trace represents the fluorescence intensity of the cell on the fiber (marked by the red arrow in Figure 2c). In this case, partial synchronization of the fiber cell's activity with the monolayer is observed. Every second excitation wave is successfully transmitted from the monolayer to the single cell. A significant delay in excitation transmission to the fiber cell is also evident, which we attribute to an insufficient number of established intercellular contacts.
Several fiber cells exhibiting a similar level of synchronization with the monolayer were identified across multiple experiments after approximately 3 hours. Out of 42 waves propagating through the monolayer, these cells fired synchronously (with a similar transmission delay as described) in 20 instances. Thus, the excitation wave was transmitted from the monolayer to the seeded cells in 46% of cases. This indicates successful, yet incomplete, integration of the cells into the monolayer, with nearly every second wave propagating to the cells on the fibers.
3.3. Evaluation of the Pre-trained Neural Network for Noise Removal
To ensure the highest accuracy in measurements, it is essential to remove extraneous noise from optical mapping recordings, as noise can significantly distort the results. Figure 3 shows frames from optical mapping videos: Panel 3a displays the raw video, 3b shows the result after applying a Kalman filter, and 3c demonstrates the output after processing with the SUPPORT neural network.
As evident in the magnified insets, the application of the neural network substantially reduces noise levels. This improvement is further quantified in Figure 3d. The signal intensity (range 230–280 arbitrary units) increases progressively in the sequence: raw image → Kalman filter → neural network. Conversely, the noise intensity (ranges 150–230 and 280–400 arbitrary units) decreases in the same sequence.
Quantitative assessment of the signal-to-noise ratio (SNR) yielded the following values: 0.61 for the raw image, 1.70 for the Kalman filter, and 3.55 for the neural network. These results demonstrate that the implemented neural network significantly enhances the SNR, thereby facilitating data analysis and improving the accuracy of subsequent measurements.
3.4. Evaluation of Excitation Wave Transmission Time Between Monolayer Cells and Through Newly Formed Intercellular Contacts
As demonstrated in Section 3.2, a significant delay exists in the transmission of excitation waves from the monolayer to cells on fibers. Since the formation of electrophysiological coupling between cells requires time, the speed of intercellular wave transmission is expected to increase over time (toward its normal value). Consequently, as the density of intercellular contacts increases, the efficiency of excitation wave transmission to the seeded cells improves. For simplicity, the term "intercellular contacts" is used here, though this may include both gap junctions and ephaptic coupling. Thus, the inverse of the wave transmission time across these contacts serves as a reasonable measure of transmission efficiency.
Figure 4a shows the averaged spatio-temporal map of cell fluorescence intensity along the wave propagation path (illustrated in Figure 4b). The α-angle marked in Figure 4a reflects the conduction velocity of the excitation wave across the monolayer. This angle is relatively small due to the inherent trade-off between spatial and temporal resolution; the wave propagates across the entire field of view within 2-3 frames. Nevertheless, with sufficient data, the wave conduction velocity can be estimated. The blue marking in Figure 4a indicates the delay in wave transmission from the monolayer to the fiber cell, averaging approximately 10 frames (more precise calculations are provided below).
Figure 4c presents an activation map of excitation wave propagation across the monolayer. Region 1 appears brighter blue than Region 2, confirming left-to-right wave propagation (as shown in Figure 4b). The target cell on the fiber is marked in orange, indicating significantly delayed activation compared to adjacent monolayer cells.
Due to the small α-angle and brief overall propagation time, which are challenging to measure accurately, an alternative method was employed: the time difference between fluorescence peaks in Region 1 (wave initiation) and Region 2 (wave termination near the fiber cell) in Figure 4a,b was calculated. We model action potential propagation along a cell chain, assuming the intercellular transmission time dominates the intracellular conduction time. Thus, knowing the number of cells traversed by the wave allows estimation of the intercellular transmission time within the monolayer. This can then be compared to the wave transmission time from the monolayer to the fiber cell, which solely depends on trans-contact propagation.
Figure 4d shows the calculated average excitation wave transmission times across intercellular contacts. Plots 1 and 2 represent the estimated intercellular transmission time within the monolayer. Since cell boundaries are indistinct in optical mapping videos, two methods were used: Plot 1 – direct cell counting from videos; Plot 2 – estimating cell count based on the distance between Regions 1 and 2 (Figure 4b) and the average spread cell size in the monolayer (100 μm). The results from both methods agree within error margins. Plot 3 in Figure 4d shows the transmission time across newly formed contacts between the fiber cell and the monolayer, which significantly exceeds the intracellular transmission time within the monolayer.
The efficiency ratio of newly formed contacts (over 3 hours) to monolayer contacts can thus be estimated as the inverse ratio of the transmission times shown in Figure 4d. The results are:
(44 ± 11) – using optical mapping-based cell counting
(39 ± 10) – using distance and average cell size-based estimation
4. Discussion
In this study, we developed and validated a novel experimental model that leverages advanced polymer materials to dissect the early stages of electrophysiological integration in cardiac tissue engineering. The core of our approach was a minimalist scaffold made from PCL nanofibers on a PDMS frame, which provided critical mechanical stabilization for single cardiomyocytes during the vulnerable period following their grafting onto a host monolayer.
Our findings yield two major conclusions. First, we successfully quantified, in real time, the formation of the minimal functional intercellular units required for excitation wave transmission. The calculated 39-44-fold lower efficiency of these nascent contacts compared to mature monolayer junctions provides a fundamental, previously unmeasured benchmark for the early phase of graft-host integration. This quantitative insight is vital for predicting and mitigating arrhythmogenic risks in cell-based therapies.
Second, and most significantly from a materials science perspective, we observed a paradoxical "catalytic" function of the biologically inert PCL fibers. By offering a simple, minimalistic, and sufficient physical support, the fibers enabled the cardiomyocytes to autonomously establish functional electromechanical couplings without the need for a complex, naturally mimetic substrate. This underscores a key engineering principle: rather than attempting to fully replicate the native extracellular matrix, a minimalist synthetic polymer scaffold can be sufficient to catalyze and support the innate biological capacity of cells for self-organization and integration. This work establishes a robust polymer-based platform for future investigations into the fundamental mechanisms of intercellular communication and for the preclinical optimization of engineered tissue constructs.
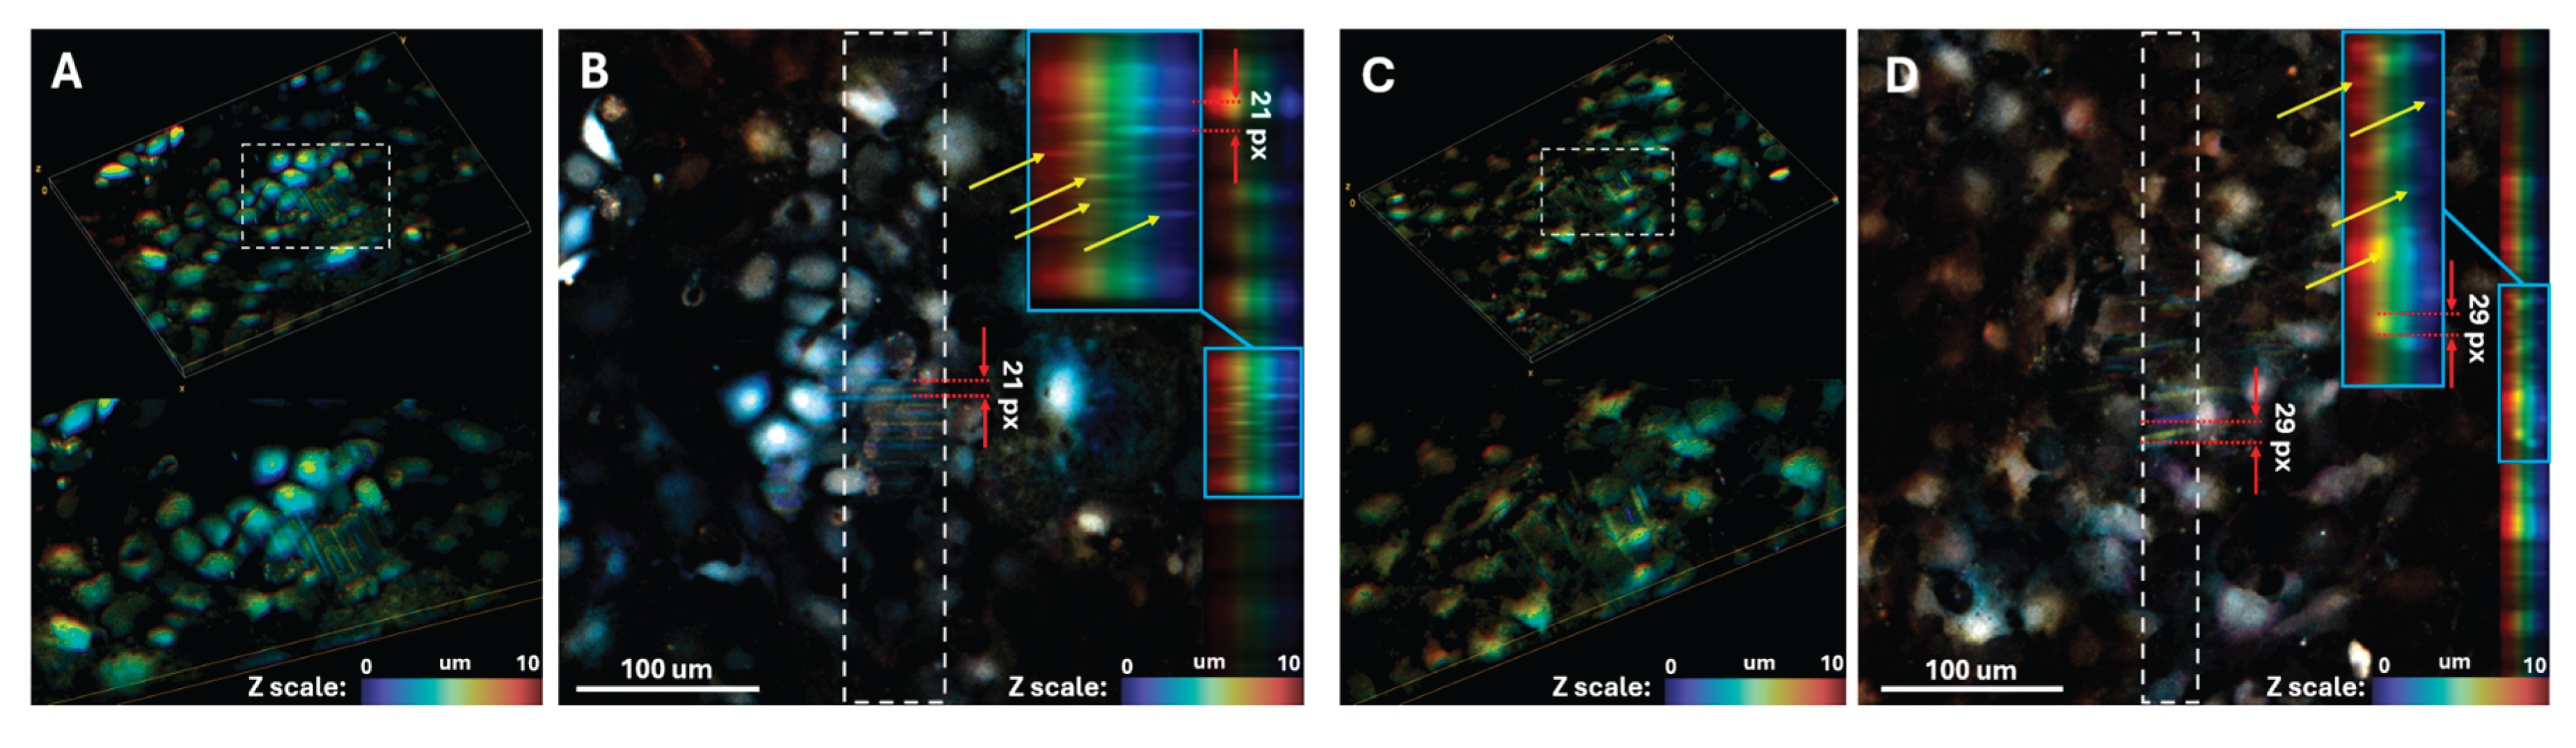
To further investigate the formation of electrophysiological contacts between cells, we developed a confocal microscopy-based optical mapping approach. Following staining with a calcium-sensitive dye, the cell monolayer is scanned using a confocal microscope. As the scanning proceeds layer-by-layer from top to bottom, cells fluoresce multiple times during a single frame acquisition, resulting in distinct bright bands in the final image (Figure 5a).
Knowing the confocal microscope scanning speed enables calculation of the time interval between successive excitation waves in the monolayer. In Figure 5b, the 21-pixel distance between adjacent bands (red arrows), combined with the image resolution (1024 × 1024 pixels) and frame acquisition time (36 seconds), yields an excitation wave period of 0.74 seconds in the monolayer. This approach thus provides 3D optical mapping data with both high spatial and temporal resolution.
Another advantage of this method is its capacity for 3D mapping. In Figure 5b, yellow arrows indicate bands corresponding to excitation waves at different depths, demonstrating the potential for studying excitation wave synchronization across different cell layers. By stimulating the bottom cell layer at a fixed frequency, we can investigate how and when excitation waves propagate to upper cell layers - in this case, single cells on polymer fibers.
This method also enables investigation of intracellular calcium dynamics. Figure 5c,d show curved rather than straight fluorescence patterns, indicating longer intracellular fluorescence duration compared to wave propagation. This measured duration is 1.0 seconds.
For future studies of cardiomyocyte integration into confluent monolayers, this confocal optical mapping method will be employed to achieve enhanced spatial and temporal resolution.
This study has several limitations. The quantitative assessment of contact efficiency was derived from 2D optical mapping data. While SUPPORT neural network significantly enhance signal quality, the complex three-dimensional nature of the interaction between the grafted cell on the fiber and the host monolayer may introduce variables not fully captured in a 2D projection. Furthermore, while we established the formation of functional electrical coupling, the specific contributions of gap junctional versus ephaptic mechanisms to these nascent contacts remain to be elucidated. However, the confocal optical mapping methodology we have begun to develop and present here offers a direct pathway to address these limitations in future work. This 3D approach will allow for precise spatial resolution of excitation wave propagation across different Z-planes, enabling us to validate the current model and dissect the mechanistic underpinnings of the integration process with greater fidelity
5. Conclusions
In conclusion, by employing a minimalist polycaprolactone nanofiber platform, we have provided the first direct quantitative assessment of the initial functional integration between grafted and host cardiomyocytes. Our key finding is that nascent intercellular contacts formed within the first hours are 39-44 times less efficient in conducting excitation than mature counterparts, establishing a fundamental benchmark for this critical period. This work underscores that simple polymer scaffolds, by providing essential mechanical stabilization, can act as catalytic enablers of biological processes, thereby offering a powerful and necessary tool to deconstruct the mechanisms of cardiac tissue engineering for safer therapeutic applications.
Author Contributions
Conceptualization, K.A. and V.T.; methodology, M.S., A.E., I.A. and V.T.; software, M.S.; validation, K.A. and V.T.; formal analysis, V.D. and M.S.; investigation, V.D., E.T., D.K., E.I. and M.S.; resources, V.D., E.T., K.D., E.I., A.E., I.A., A.R. and M.S.; data curation, V.D., M.S. and V.T.; writing—original draft preparation, V.D., M.S. and E.T.; writing—review and editing, K.A., A.R. and V.T.; visualization, V.D. and M.S.; supervision, K.A. and V.T.; project administration, M.S.; funding acquisition, A.R. and V.T. All authors have read and agreed to the published version of the manuscript.
Funding
The study was carried out within the framework of project No. 25-65-00037 dated 22.05.2025 with the Russian Science Foundation (RSF).
Institutional Review Board Statement
The study was approved by the Ethics Committee of M.F. Vladimirsky Moscow Regional Clinical Research Institute (protocol №7 from 18.04.2024) and by the Moscow Institute of Physics and Technology Life Science Center Provisional Animal Care and Research Procedures Committee (Protocol No. A2-2012-09-02).
Data Availability Statement
Raw data (optical mapping and confocal microscopy) could be found at Data Repository: https://doi.org/10.5281/zenodo.17497440
Acknowledgments
The authors thank Anastasia Dubrovskaya for accompanying the experiments. Also, we would like to thank the Applied Genetics Resource Facility of MIPT for providing the necessary equipment for the experiments. We would like to express special gratitude to the administration of the MIPT, M.F. Vladimirsky Moscow Regional Clinical Research Institute, and E. Meshalkin National Medical Research Center of the Ministry of Health of the Russian Federation. The study was carried out within the framework of project No. 25-65-00037 of 22.05.2025 with the Russian Science Foundation (RSF).
Conflicts of Interest
The authors declare no conflicts of interest.
Abbreviations
The following abbreviations are used in this manuscript:
| PDMS | Polydimethylsiloxane |
| PCL | Polycaprolactone |
References
- Zou Y, Li L, Li Y, Chen S, Xie X, Jin X, et al. Restoring cardiac functions after myocardial infarction-ischemia/reperfusion via an exosome anchoring conductive hydrogel. ACS Appl Mater Interfaces. 2021 Dec 8;13(48):56892–908. [CrossRef]
- George JC, Goldberg J, Joseph M, Abdulhameed N, Crist J, Das H, et al. Transvenous intramyocardial cellular delivery increases retention in comparison to intracoronary delivery in a porcine model of acute myocardial infarction. J Interv Cardiol. 2008 Oct;21(5):424–31. [CrossRef]
- Joseph K. Yu, Jialiu A. Liang, Seth H. Weinberg, Natalia A. Trayanova. Computational modeling of aberrant electrical activity following remuscularization with intramyocardially injected pluripotent stem cell-derived cardiomyocytes. Journal of Molecular and Cellular Cardiology. 2022 Jan 1;162:97–109. [CrossRef]
- Chen HSV, Kim C, Mercola M. Electrophysiological Challenges of Cell-Based Myocardial Repair. Circulation [Internet]. 2009 Dec 15 [cited 2025 Oct 31]; Available from: https://www.ahajournals.org/doi/10.1161/CIRCULATIONAHA.107.751412. [CrossRef]
- Mayourian J, Savizky RM, Sobie EA, Costa KD. Modeling electrophysiological coupling and fusion between human mesenchymal stem cells and cardiomyocytes. PLoS Comput Biol. 2016 Jul;12(7):e1005014. [CrossRef]
- Severs NJ, Bruce AF, Dupont E, Rothery S. Remodelling of gap junctions and connexin expression in diseased myocardium. Cardiovasc Res. 2008 Jun 2;80(1):9–19. [CrossRef]
- Agladze NN, Halaidych OV, Tsvelaya VA, Bruegmann T, Kilgus C, Sasse P, et al. Synchronization of excitable cardiac cultures of different origin. Biomater Sci. 2017 Aug 22;5(9):1777–85. [CrossRef]
- Lin J, Abraham A, George SA, Greer-Short A, Blair GA, Moreno A, et al. Ephaptic Coupling Is a Mechanism of Conduction Reserve During Reduced Gap Junction Coupling. Front Physiol. 2022 May 5;13:848019. [CrossRef]
- Lin J, Keener JP. Ephaptic coupling in cardiac myocytes. IEEE Trans Biomed Eng. 2013 Feb;60(2):576–82. [CrossRef]
- Gourdie RG. The cardiac gap junction has discrete functions in electrotonic and ephaptic coupling: Gap junction function in cardiac conduction. Anat Rec (Hoboken). 2019 Jan;302(1):93–100.
- Haraguchi Y, Shimizu T, Yamato M, Kikuchi A, Okano T. Electrical coupling of cardiomyocyte sheets occurs rapidly via functional gap junction formation. Biomaterials. 2006 Sep;27(27):4765–74. [CrossRef]
- Veeraraghavan R, Lin J, Hoeker GS, Keener JP, Gourdie RG, Poelzing S. Sodium channels in the Cx43 gap junction perinexus may constitute a cardiac ephapse: an experimental and modeling study. Pflugers Arch. 2015 Oct;467(10):2093–105. [CrossRef]
- Kucera JP, Rohr S, Rudy Y. Localization of sodium channels in intercalated disks modulates cardiac conduction. Circ Res. 2002 Dec 13;91(12):1176–82. [CrossRef]
- Slotvitsky MM, Tsvelaya VA, Podgurskaya AD, Agladze KI. Formation of an electrical coupling between differentiating cardiomyocytes. Sci Rep. 2020 May 8;10(1):7774. [CrossRef]
- Balashov V, Efimov A, Agapova O, Pogorelov A, Agapov I, Agladze K. High resolution 3D microscopy study of cardiomyocytes on polymer scaffold nanofibers reveals formation of unusual sheathed structure. Acta Biomater. 2018 Mar 1;68:214–22. [CrossRef]
- Aitova A, Scherbina S, Berezhnoy A, Slotvitsky M, Tsvelaya V, Sergeeva T, et al. Novel molecular vehicle-based approach for cardiac cell transplantation leads to rapid electromechanical graft-host coupling. Int J Mol Sci. 2023 Jun 20;24(12):10406. [CrossRef]
- Pina S, Ribeiro VP, Marques CF, Maia FR, Silva TH, Reis RL, et al. Scaffolding strategies for tissue engineering and regenerative medicine applications. Materials (Basel). 2019 Jun 5;12(11):1824. [CrossRef]
- Li WJ, Laurencin CT, Caterson EJ, Tuan RS, Ko FK. Electrospun nanofibrous structure: a novel scaffold for tissue engineering. J Biomed Mater Res. 2002 Jun 15;60(4):613–21. [CrossRef]
- Folkman J, Moscona A. Role of cell shape in growth control. Nature. 1978 Jun 1;273(5661):345–9. [CrossRef]
- Kudryashova N, Tsvelaya V, Agladze K, Panfilov A. Virtual cardiac monolayers for electrical wave propagation. Sci Rep. 2017 Aug 11;7(1):7887. [CrossRef]
Figure 1.
Experimental design and seeding of fiber-cultured cells onto a synchronized monolayer: a) Schematic of the developed model for studying the formation of electrophysiological contacts between cells; (b) 2D confocal image of the cell monolayer with fibers seeded on top; (c) 3D confocal image of the cell monolayer with fibers seeded on top. Panels (b) and (c) share a common height (z-scale) color bar.
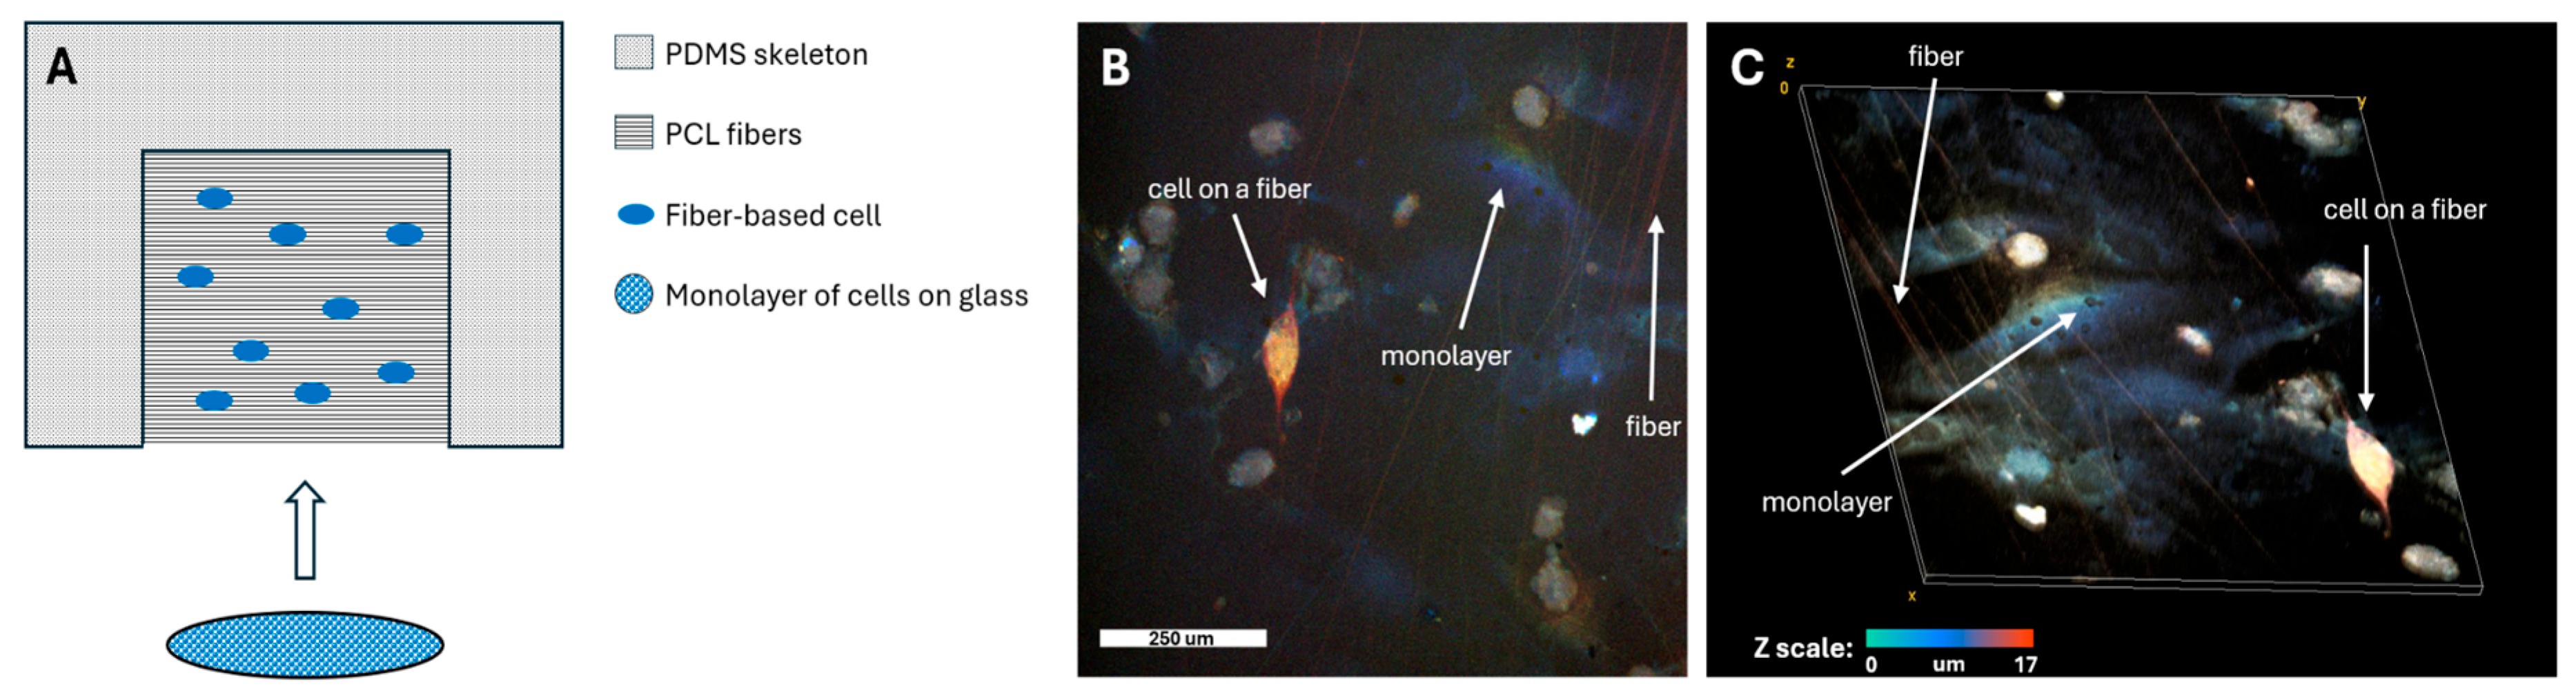
Figure 2.
Optical mapping of fiber-cultured cells following their seeding onto a cell monolayer: (a) Optical mapping image of cells 15 minutes after seeding the fiber-cultured cells onto the monolayer. The right panel shows a magnified view of the target cell on the fiber. The blue circle on the left image indicates the region from which fluorescence intensity was measured to plot the monolayer cell activity below; (b) Normalized fluorescence intensity of the cells (which correlates with contractile activity, as the propagation of action potentials increases intracellular calcium concentration, triggering fluorescence). The blue trace corresponds to monolayer fluorescence, the red trace shows fluorescence of the cell on the fiber (indicated by the red arrow in the image above), and the green trace indicates the stimulation frequency applied to the monolayer via a platinum electrode (the electrode is not visible in the frame due to high magnification; it was located to the left of the shown cells, resulting in excitation wave propagation from left to right across the monolayer); (c) Optical mapping image of cells 176 minutes after seeding the fiber-cultured cells onto the monolayer. The right panel shows a magnified view of the target cell on the fiber. The blue circle on the left image indicates the region from which fluorescence intensity was measured to plot the monolayer cell activity below; (d) Normalized fluorescence intensity of the cells. The blue trace corresponds to monolayer fluorescence, the red trace shows fluorescence of the cell on the fiber (indicated by the red arrow in the image above), and the green trace indicates the stimulation frequency applied to the monolayer via a platinum electrode (the electrode is not visible in the frame due to high magnification; it was located to the left of the shown cells, resulting in excitation wave propagation from left to right across the monolayer).
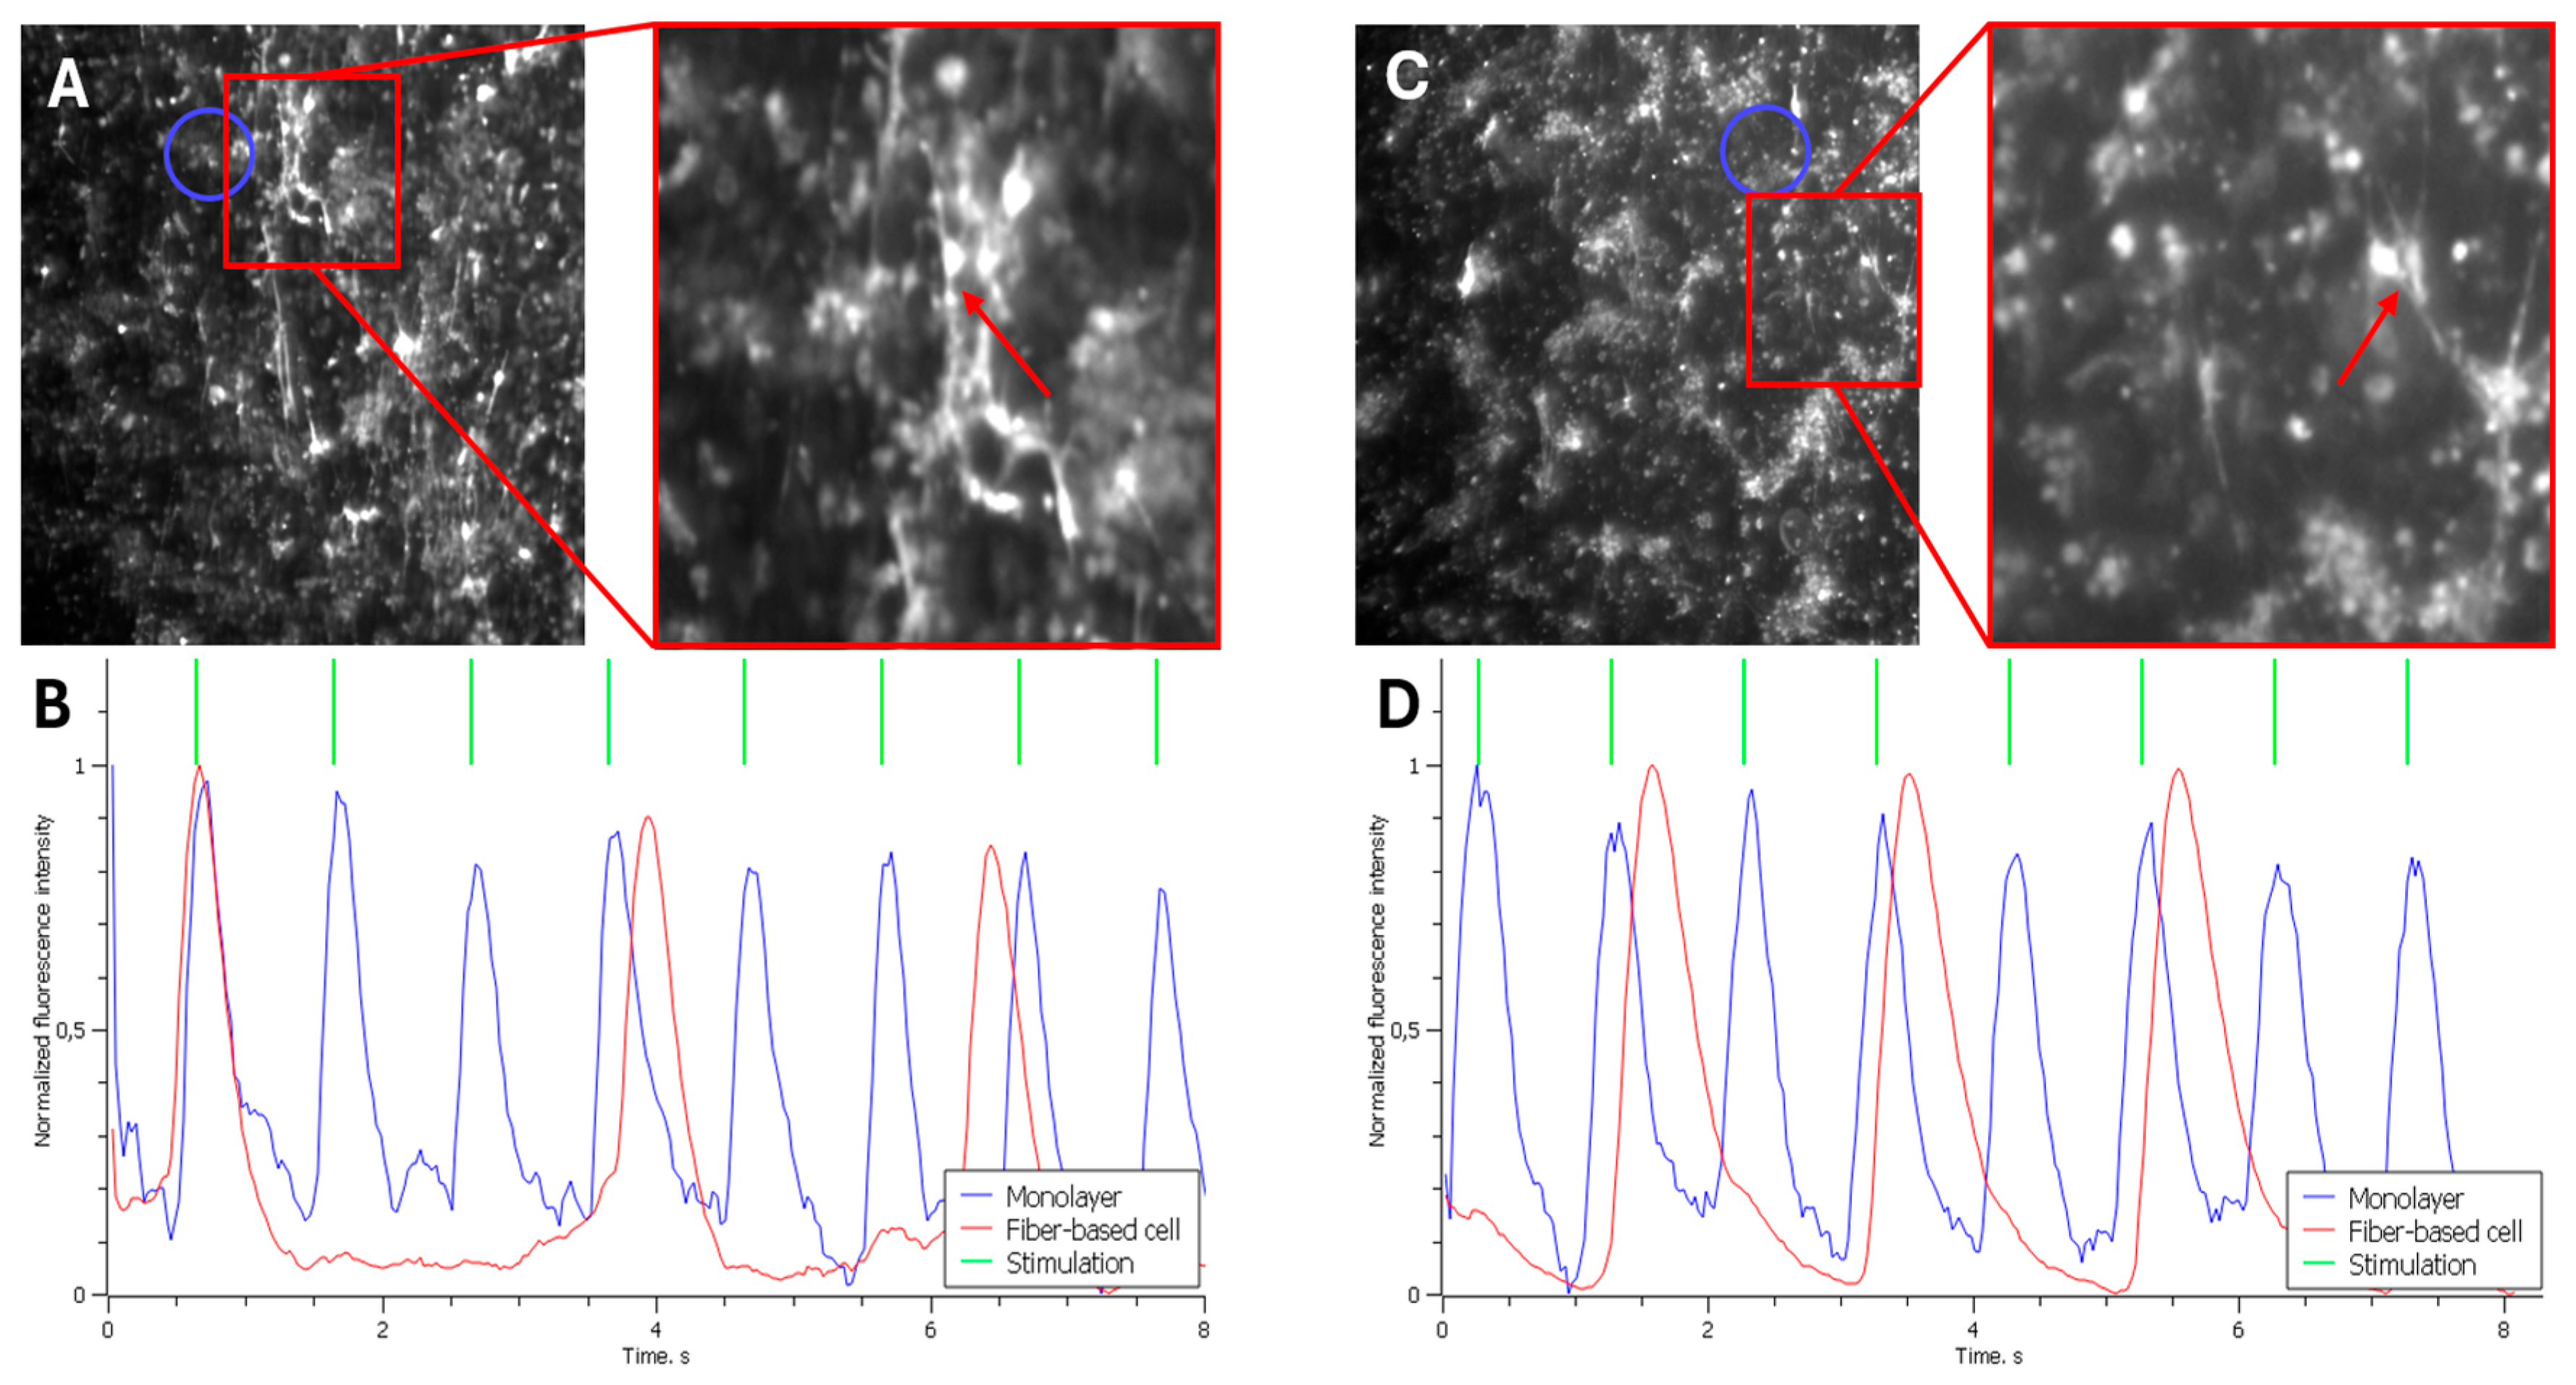
Figure 3.
Performance evaluation of the developed neural network for noise removal and signal-to-noise ratio determination: (a) Top: Frame from a raw optical mapping recording. Bottom: Magnified view of the region within the red square; (b) op: Frame from an optical mapping recording processed with a Kalman filter. Bottom: Magnified view of the region within the red square; (c) Top: Frame from an optical mapping recording processed with the developed neural network. Bottom: Magnified view of the region within the red square; (d) Intensity histogram of frames (a), (b), and (c), indicating noise and signal regions.
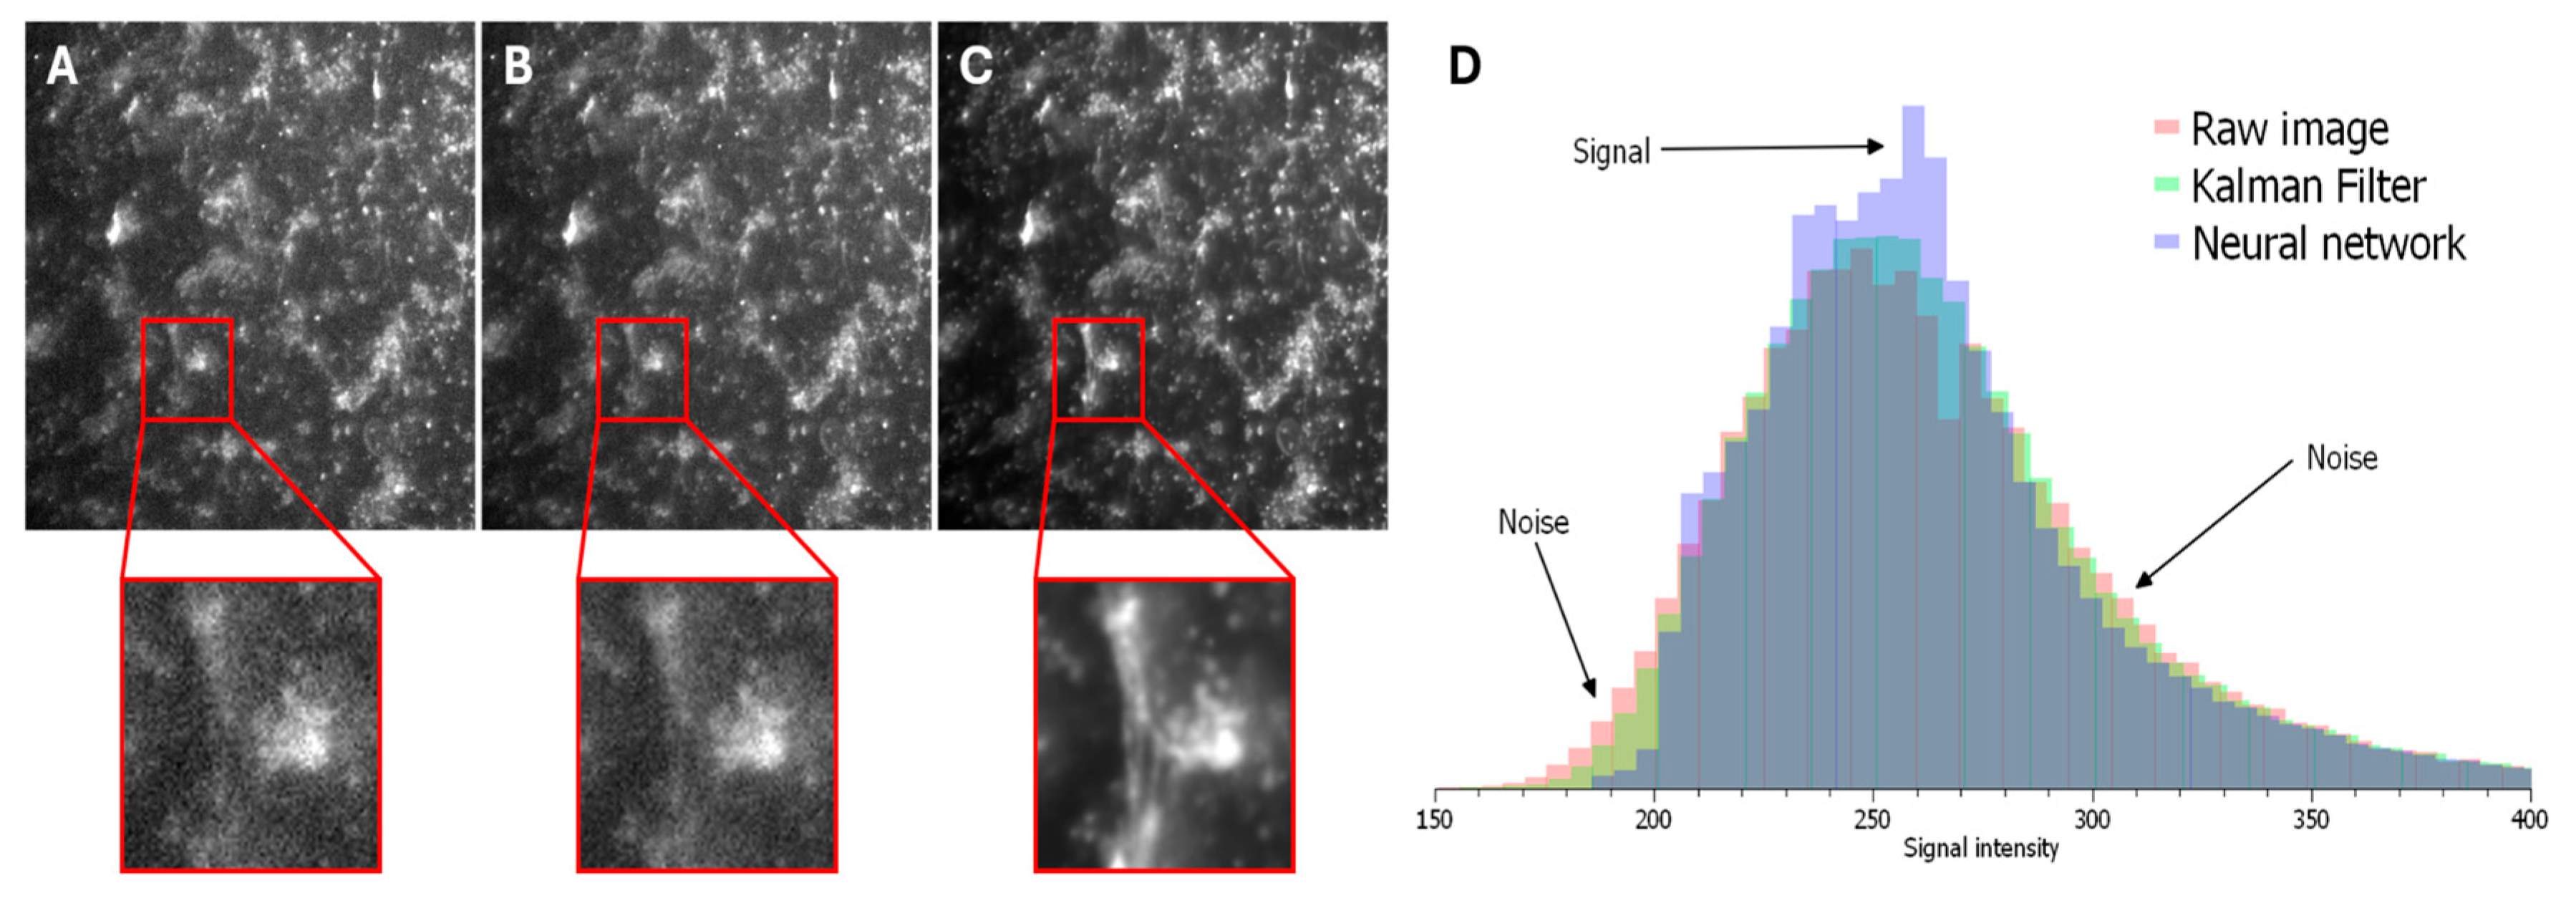
Figure 4.
Determination of excitation wave propagation velocity in the monolayer and its transmission time to the fiber-cultured cell: (a) Averaged (across the green rectangle in Figure 4b) spatio-temporal map (kymograph) of fluorescence intensity. Red dashed lines indicate excitation wave propagation across the monolayer. The black dashed line is an isochrone showing the slope of the red dashed line (tan(α-angle) corresponds to the wave propagation velocity through the monolayer). The blue marking indicates the delay in excitation wave transmission from the monolayer to the fiber cell. Regions 1 and 2 represent the initiation and termination points of wave propagation through the monolayer, respectively; (b) Optical mapping result of the monolayer with seeded fiber-cultured cells. The green rectangle marks the region used for averaging the spatio-temporal map above. Regions 1 and 2 indicate the initiation and termination points of wave propagation through the monolayer, respectively (the stimulating platinum electrode is not visible in the frame due to high magnification but was positioned to the left of the shown cells, resulting in left-to-right wave propagation as indicated by the arrow); (c) Activation map of excitation wave propagation for this optical mapping experiment. Regions 1 and 2 are marked to demonstrate the color difference in the activation map between these regions and to determine the direction of wave propagation through the monolayer; (d) Transmission times of excitation waves: (1) through intercellular contacts within the monolayer (cell count determined from optical mapping videos), (2) through intercellular contacts within the monolayer (cell count estimated from distance between Regions 1 and 2 in Figure 4b and average monolayer cell size), and (3) through newly formed intercellular contacts between monolayer cells and the fiber-cultured cell.
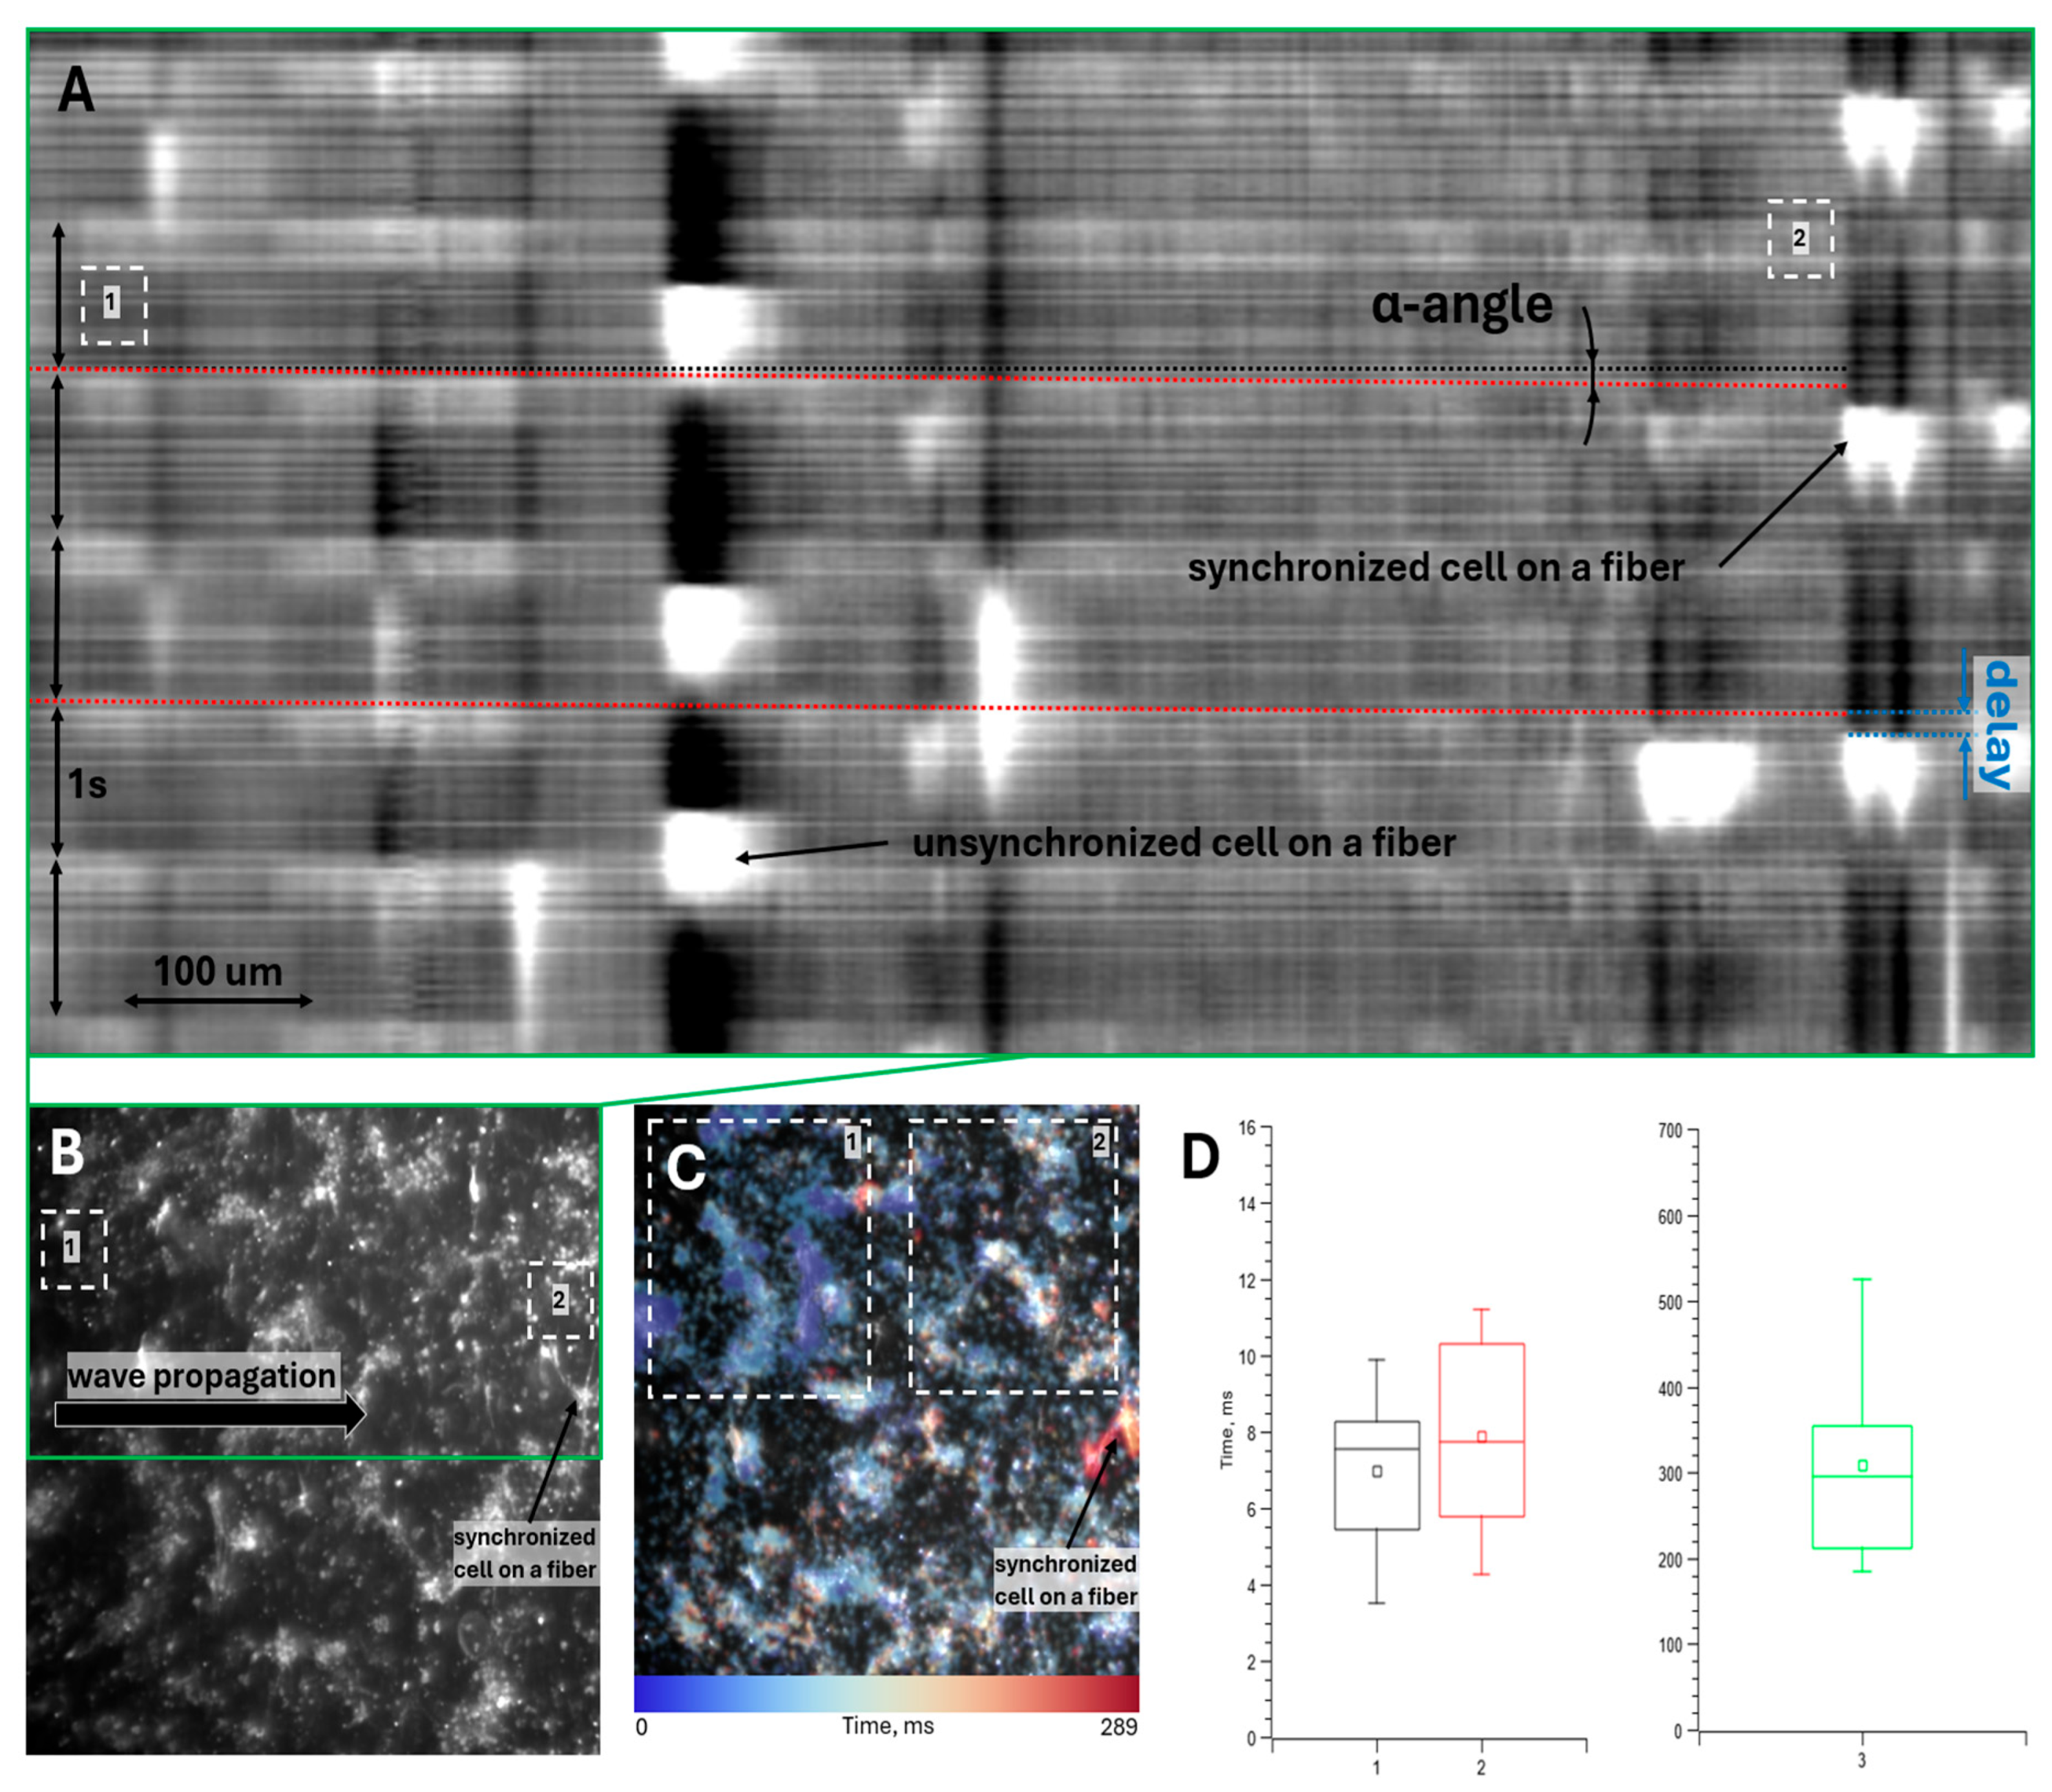
Figure 5.
Application of confocal microscopy-based optical mapping: (a) Top: 3D confocal image of a cell monolayer. Bottom: Magnified view of the region indicated by the white rectangle above; (b) Confocal image of a cell monolayer (top view). Right: Averaged side-projection of the image, with the averaging region marked by a white rectangle. The area within the blue rectangle shows a magnified view of the side projection. Yellow arrows indicate bands of increased fluorescence intensity resulting from confocal scanning of fluorescing cells (conducting excitation waves). Red arrows mark the distance between two adjacent bands (in pixels), used to determine the monolayer contraction period; (c) Top: 3D confocal image of a cell monolayer. Bottom: Magnified view of the region indicated by the white rectangle above; (d) Confocal image of a cell monolayer (top view). Right: Averaged side-projection of the image, with the averaging region marked by a white rectangle. The area within the blue rectangle shows a magnified view of the side projection. Yellow arrows indicate bands of increased fluorescence intensity resulting from confocal scanning of fluorescing cells (exhibiting intracellular calcium dynamics). Red arrows mark the width of a single band (in pixels), used to determine the period of intracellular calcium dynamics.
Disclaimer/Publisher’s Note: The statements, opinions and data contained in all publications are solely those of the individual author(s) and contributor(s) and not of MDPI and/or the editor(s). MDPI and/or the editor(s) disclaim responsibility for any injury to people or property resulting from any ideas, methods, instructions or products referred to in the content. |
© 2025 by the authors. Licensee MDPI, Basel, Switzerland. This article is an open access article distributed under the terms and conditions of the Creative Commons Attribution (CC BY) license (http://creativecommons.org/licenses/by/4.0/).
Copyright: This open access article is published under a Creative Commons CC BY 4.0 license, which permit the free download, distribution, and reuse, provided that the author and preprint are cited in any reuse.


