

Submitted:
04 November 2025
Posted:
05 November 2025
You are already at the latest version
Abstract
Financial report question answering (FRQA) presents unique challenges due to the need for precise numerical reasoning, complex table structures, and multi-table associations. Existing approaches often overlook the domain-specific complexities of financial reports and struggle with accurate numerical computation, leading to suboptimal performance in real-world financial intelligence applications.
In this study, we propose FinQA-PKD, a framework designed to mitigate these challenges through a novel integration of progressive knowledge distillation and numerical reasoning enhancement. Our method introduces a difficulty-aware curriculum learning strategy that organizes training into two progressive stages, facilitating more effective and stable model learning. To address the limitations of large language models in numerical reasoning, we develop a numerical reasoning enhancement module that automatically decomposes calculation chains, augments numerical tokens, and validates results using a financial formula library. Furthermore, we implement a domain-adaptive selective knowledge distillation strategy, which evaluates teacher model outputs based on numerical accuracy, calculation correctness, and terminology precision, and selectively distills knowledge from high-quality samples.
Experimental results in benchmark datasets demonstrate that FinQA-PKD improves numerical and calculation accuracy, achieving competitive performance with reduced computational resources. This framework provides a robust and efficient solution for answering financial report questions in practical financial analysis scenarios.
Keywords:
financial report question answering
; curriculum learning
; knowledge distillation
; numerical reasoning
; table understanding
1. Introduction
Financial report question answering (FRQA) has emerged as a cornerstone of financial intelligence, facilitating the automated analysis of complex financial documents for critical applications such as investment decision-making, risk assessment, and regulatory compliance. As the volume and complexity of financial reports increase, the ability to accurately extract, interpret, and reason over the contents becomes paramount. Unlike general table-based QA, FRQA operates in a high-stakes domain where the requirements for accuracy and interpretability are absolute. The task is distinguished from open-domain QA with three fundamental challenges. First, FRQA demands strict numerical precision, as reasoning often involves multi-step calculations such as deriving financial ratios or year-over-year growth rates, where minor computational errors can result in significant misjudgments. Second, FRQA requires navigating the complicated and structural financial tables, which are dense with hierarchical headers, merged cells, and critical footnotes that alter data semantics. Third, FRQA requires reliable reasoning across multiple documents and time periods, forcing the model to connect and combine information from different sources. Due to the difficulty, financial reports are not only the collections of data, but also the structured narratives that follow strict accounting principles, such as Generally Accepted Accounting Principles (GAAP) or International Financial Reporting Standards (IFRS). Under this background, the meaning behind a number is just as important as the number itself. Consequently, any failure to grasp these details can lead to costly misinterpretations which may impact everything from market valuations to strategic corporate planning.
Traditional approaches to table-based question answering, harnessing the power of large language models (LLMs) and pre-trained table encoders, have achieved considerable strides in structured data understanding. The emergence of models such as FinQA [1] and innovative techniques like Chain-of-Thought prompting [2] has highlighted the remarkable potential of LLMs to reason over combined tabular and textual data. These models often generate impressively fluent and human-like explanations, creating a compelling semblance of deep comprehension and providing a strong foundation for automated data analysis in general-purpose contexts. However, the generalist nature of these models becomes a significant drawback in the specialized financial domain. Since they are trained on vast open-domain datasets, they lack the ability to understand the implicit rules and conventions. This deficiency creates a fundamental semantic gap: LLMs often process numbers as simple text, failing to grasp their quantitative properties such as scale, units, and financial significance. For instance, they may fail to distinguish between "$1.5M" (million) and "$1.5B" (billion) in a calculation, an error that is incorrect in this context. Consequently, these models can produce reasoning that appears logical but is factually incorrect, lacking the step-by-step logic required in regulated financial environments. This inherent weakness in the numerical reasoning frequently leads to subtle but significant errors in multi-step calculations, which undermines the trustworthiness of any downstream application. This makes LLMs unsuitable for complicated financial systems, where deterministic and verifiable logic is an essential requirement.
To address these deficiencies, researchers have begun developing more specialized strategies. One key approach involves creating more challenging datasets to better evaluate model capabilities. For instance, the TAT-QA benchmark [3] was specifically designed to test the complex, multi-step arithmetic and temporal reasoning that general models struggle with [4]. Other strategies focus on refining the training process itself. Some works in selective knowledge distillation have shown that simply mimicking a teacher model is insufficient. Instead, filtering the output of teacher model for quality is necessary to improve the performance of student model, especially in the high-stakes domain like finance where accuracy is essential [5]. This finding reveals that even state-of-the-art teacher models are often unreliable in this domain, reinforcing the need for more robust and specialized architectures.
Despite these progress, previous methods suffer from a fundamental limitation: they address individual parts of the FRQA challenge in isolation. They tend to focus on solving one specific task at a time, such as improving table parsing or refining calculation accuracy, without fully considering that these skills must work together in a real-world financial analysis. This creates a disconnect between the model’s abilities and the practical demands of this task. For instance, the ability to correctly read a complex table is deeply connected to the ability to perform accurate calculations with the corresponding data. A model that can perfectly identify all the numbers in a table is of little practical use if it fails a basic percentage-change calculation with the same numbers. This example indicateds the need for a new approach, requiring a shift away from developing separate, specialized models. The focus should instead be on building comprehensive frameworks that address these interconnected challenges in a unified way. A system built from individually optimized but poorly integrated parts is inherently unreliable becaues a single mistake at any point, whether in reading the table or performing the calculation, can render the entire final answer incorrect. Therefore, creating a truly comprehensive framework that systematically integrates solutions for complex reasoning, numerical accuracy, and model efficiency remains a key challenge for research in FRQA.
To mitigate the challenges previously discussed, we propose FinQA-PKD, a comprehensive framework designed to integrate solutions for the interconnected problems inherent to financial analysis. While prior works often address issues like table parsing and numerical reasoning in isolation, our framework is founded on a principled, multi-stage methodology that systematically builds these skills together. This approach is designed to construct a model that is not only highly accurate and efficient but also produces the interpretable, step-by-step reasoning that is essential for the financial domain. By directly mitigating the limitations of existing methods in a unified manner—ensuring that strong table understanding is paired with reliable calculation—FinQA-PKD offers a robust and practical solution. The main contributions of this study are as follows:
- We propose a novel, multi-stage framework, FinQA-PKD, that systematically integrates curriculum learning, numerical reasoning enhancement, and selective knowledge distillation. This integrated approach provides a solution to the challenges of reasoning complexity, numerical precision, and model efficiency in FRQA.
- A key innovation is a complexity-aware curriculum learning strategy that quantitatively assesses the difficulty of financial queries. This strategy organizes the training process to move from simple to complex examples, ensuring stable and efficient learning by progressively building the model’s reasoning capabilities.
- The design and integration of a dedicated numerical reasoning enhancement module improves both accuracy and interpretability. This module leverages computation chain decomposition, numerical token augmentation, and formula-based verification to mitigate the numerical errors in LLMs, ensuring the model’s reasoning is factually correct and easy to follow.
- Finally, extensive experiments on benchmark financial QA datasets validate the framework’s effectiveness. The results confirm the contribution of each individual component and demonstrate that FinQA-PKD achieves high performance on high-precision numerical reasoning tasks.
2. Related Work
2.1. Table-Based Question Answering
Table-based question answering (QA) has become a key area in natural language processing, especially for fields that require understanding structured data. The ability to reason over data in tables is essential in finance, where reports like balance sheets and income statements are common. Early research highlighted the importance of using datasets specific to the domain, which led to the creation of important benchmarks like FinQA [1], TabFact [6], and ConvFinQA [7,8]. At the same time, advances in pre-trained models such as TAPAS [9] and TaBERT [10], along with models that can reason over both tables and text [11], improved the ability that systems can understand and work with tabular data.
More recently, the field has seen new methods [12,13,14] designed to handle more complex and varied challenges. Zhang et al. [15] proposed SynTQA, an approach that combines Text-to-SQL for accuracy in calculations with end-to-end methods that are better for less clear questions. To handle different kinds of table layouts, Cao et al. [16] introduced a method using API-assisted code generation for QA on various table types, including relational, multi-table, and even complex hierarchical tables. To handle large tables, TableRAG [17] has become a major step, using retrieval-augmented generation for reasoning over tables with millions of tokens. Beyond the models themselves, a great deal of research has also focused on data quality. Studies have shown how critical data preparation is for performance [6], and techniques like data augmentation [9] and special table-focused embeddings [18] have been shown to make QA models more robust.
In this study, we build upon the above foundations to create a comprehensive and robust system for financial QA. Our implementation introduces the FinancialQADataLoader class, which is engineered to support the loading and preprocessing of the FinQA dataset which is designed to handle various financial data formats like JSON and CSV, ensuring consistency and usability for downstream reasoning tasks.
2.2. Curriculum Learning
Curriculum learning, a training paradigm which is inspired by the progressive learning strategies of humans has been effectively applied to improve machine learning model training. The core idea, first systematically explored by Bengio et al. [19], is to present training data to a model in a meaningful order, starting with simpler examples and gradually increasing the complexity. Previous foundational works have demonstrated that such approach can accelerate convergence and improve the model’s generalization capabilities. The benefits and adaptability of curriculum learning have since been explored in a variety of domains, as highlighted by works from Soviany et al. [20].
The field has continued to evolve with more sophisticated and automated techniques. For instance, recent studies proposed by Graves et al. [21] introduced adaptive curriculum learning, where the curriculum is dynamically adjusted based on the model’s performance to further enhance training efficiency. The optimization of the curriculum itself has also been a subject of research, including the use of reinforcement learning. To support more rigorous research, CurBench [22] has been developed as the first comprehensive benchmark for the systematic evaluation of these methods. In specific application areas, novel approaches have emerged, such as diffusion-based curriculum learning in reinforcement learning contexts [23] and the Curriculum Masking paradigm for pretraining versatile skills [24]. These advancements have shown that curriculum learning can be effectively applied across diverse domains, from sequential decision making to tabular data understanding.
In this study, we apply above principles to tackle the unique challenges of financial question answering. This study introduces the CurriculumDataSelector, a component that implements a custom curriculum by sorting training samples according to their difficulty. The CurriculumDataSelector uses thresholds to classify samples into easy, medium, and hard levels. A sample’s difficulty is determined by factors such as the complexity of the table structure, the number of numerical operations needed, or the presence of ambiguous language in the question. By dynamically adjusting the training data presented to the model, this approach ensures a smoother learning curve and mitigates the risk of overfitting to challenging samples early in training. To further enhance learning, the CurriculumDataSelector also incorporates a replay mechanism, which periodically revisits previously seen samples to reinforce learning of recurring patterns or concepts common in financial datasets. The integration of curriculum learning in our system ensures that models are trained efficiently, even on complex financial reasoning tasks.
2.3. Numerical Reasoning
Numerical reasoning is a key technique of financial QA, requiring models to perform arithmetic operations and interpret numerical data with high accuracy. The complexity of financial analysis, which often involves multi-step calculations such as computing profit margins, growth rates, or financial ratios, necessitates robust numerical reasoning capabilities. The development of challenging datasets like DROP [25] and MathQA [26] has been important in providing benchmarks to evaluate and advance these capabilities. Research in this area has highlighted the importance of structured reasoning in QA systems [25] and the benefits of integrating external knowledge to enhance performance [27]. Furthermore, the use of symbolic reasoning frameworks and neural-symbolic integration has been shown to be effective for handling more complex mathematical expressions .
Recent works have introduced several innovative approaches designed for complex reasoning. Case-based reasoning has been applied to financial QA, where models retrieve similar questions and their corresponding logical programs to guide the problem-solving process for new queries [28]. Additionally, multi-agent reflection frameworks have demonstrated remarkable effectiveness in multi-step reasoning for financial tasks by incorporating critic agents that validate the reasoning steps and final answers [29]. These approaches offer powerful perspectives on how to structure and verify numerical reasoning processes in financial contexts.
Another key component of the study is the NumericalReasoner, designed to enhance numerical reasoning through a structured and interpretable process. The core of this component is a chain-of-calculation mechanism, which decomposes complex calculations into a sequence of more manageable steps. This process leverages predefined financial formulas, such as those for gross profit margin, return on equity, and asset-liability ratios. For instance, to compute the gross profit margin, the system identifies the necessary variables from the data and then performs the calculation step-by-step. This stepwise approach not only improves the interpretability of the reasoning process but also reduces the likelihood of computational errors. To further bolster accuracy, the NumericalReasoner incorporates numerical token enhancement techniques, which identify and tag entities like percentages, currency values, and ratios in the input data. Finally, the component includes a validation mechanism that verifies the correctness of computed results, ensuring overall robustness in financial computations.
2.4. Model Distillation
Model distillation is a powerful technique for knowledge transfer, where a student model is trained to replicate the performance of a teacher model. This approach which was introduced by Hinton et al. [30], typically involves training the student on the teacher’s softened probability distributions, which provide richer supervisory signals than hard labels. While a primary application of distillation is to compress large models into smaller, more efficient ones, the technique is also highly effective for transferring nuanced knowledge between models of the same size. In the context of financial QA, this allows a student model to learn the complex reasoning patterns developed by a more extensively trained teacher, thereby improving the robustness and accuracy of its predictions.
The field has since seen numerous advancements in recent years. While techniques like TinyBERT [31] and DistilBERT [32] have demonstrated the potential for significant model size reduction, other research has focused on improving the quality of knowledge transfer. Innovations include task-specific strategies [33], and layer-wise distillation [34]. More recent works have enhanced the reliability of distillation for large language models. This includes methods like dual-space knowledge distillation (DSKD) such as dual-space knowledge distillation (DSKD) [35], DocKD [36], and FIRST [37], which focusdels through trustworthy distillation.
In this study, knowledge distillation is employed not for model compression, but to refine the reasoning capabilities of the final model. The teacher and student models share the same architecture. The teacher model is a version that has already undergone the full training pipeline, including curriculum learning and numerical enhancement. The key insight is to leverage the structured outputs from our system’s components as rich, intermediate supervision signals for the student. For example, the chain-of-calculation logs from the NumericalReasoner and the difficulty-stratified data from the CurriculumDataSelector are used to train the student to learn not just the final predictions, but also the stepwise reasoning process of the teacher. This approach enhances the model’s final accuracy and the logical coherence of the generated reasoning paths, resulting in a more robust and interpretable financial QA system.
2.5. Summary
The techniques including table-based reasoning, curriculum learning, numerical reasoning, and knowledge distillation are powerful by themselves, but their true potential for financial question answering (FRQA) is unlocked when they are combined. Financial reasoning is complex due to a model must be able to understand difficult tables, perform accurate multi-step calculations, and grasp specific financial terms all at once. Tackling these problems separately often creates models that are good at one thing but poor at another, making them unreliable overall.
For example, a model that is excellent at calculations is not useful if it cannot extract the correct numbers from a complex financial table. Similarly, a model trained on the entire difficult dataset from the start may fail to learn basic skills, which is the problem curriculum learning is designed to address. Therefore, this study aims to create a single framework that intelligently combines these techniques. The proposed approach views these methods not as separate components, but as connected steps in a complete training process, with the goal of building a financial reasoning model that is both reliable and accurate.
3. Methodology
3.1. Problem Formulation
Financial Report Question Answering (FRQA) aims to answer a natural language question Q, based on the structured and unstructured data in a financial report, which typically includes one or more tables T, and surrounding textual context C. Due to the complexity of financial queries that often require multi-step numerical calculations and compositional logical reasoning, we formulate this task as a program synthesis problem. This approach is chosen for several key advantages over direct answer generation: it provides interpretability by exposing the exact reasoning steps, offers verifiability as the program can be executed and its logic audited, and naturally handles the compositionality of complex financial queries. Rather than generating a textual answer directly, our model is trained to generate an intermediate, executable program, P, that represents this reasoning process. This program, when executed, produces the final numerical or textual answer.
Formally, given a question Q, tables T, and context C, the model’s objective is to find the optimal program that maximizes the conditional probability:
where represents the parameters of the proposed model.
3.2. Overall Framework
As illustrated in Figure 1, to address the aforementioned challenges, we propose FinQA-PKD, a comprehensive framework for Financial Report Question Answering based on Progressive Knowledge Distillation and numerical reasoning enhancement. Our approach is not a single model architecture but rather a holistic, learning-centric methodology designed to build a robust and specialized reasoning agent through strategic training orchestration. As illustrated in Figure 1, the framework comprises three components that work together to progressively develop financial reasoning capabilities: a learning path structurer that organizes training samples by difficulty, a reasoning correctness module that ensures numerical precision and logical validity, and a knowledge transfer optimizer that selectively distills expertise from a trained teacher model.
The framework’s core philosophy follows how human financial analysts develop expertise: starting with foundational concepts and gradually progressing to more complex analytical tasks. This principle is implemented through the first component, the Finance-aware Difficulty Evaluator, which serves as the learning path structurer. Unlike generic curriculum learning approaches that rely on superficial heuristics such as question length or answer type frequency, our evaluator quantifies sample complexity across four dimensions specifically tailored to financial reasoning: structural complexity , computational complexity , temporal complexity , and semantic complexity. This multi-dimensional assessment provides a principled and robust foundation for organizing the training process, ensuring that the model encounters samples in an order conducive to effective learning.
The second component, the Numerical Reasoning Enhancement Module, builds upon the structured learning path to ensure both precision and interpretability in numerical computations. While the curriculum learning strategy determines what samples to learn and in what order, this module defines how the model should reason about numerical values and arithmetic operations. This module mitigates the fundamental limitations of pre-trained language models in handling financial numerical reasoning through three complementary mechanisms: 1)computation chain decomposition, which breaks multi-step calculations into atomic operations with explicit supervision at each intermediate step to prevent error accumulation; 2)numerical token enhancement, which augments token representations with triplet embeddings encoding textual form, actual numerical value, and format type to enable value-aware reasoning; 3)and financial formula verification, which applies rule-based validation to ensure generated programs adhere to domain-specific logical patterns. Together, these mechanisms ensure the generation of auditable, logically sound, and numerically accurate reasoning chains.
The third component, Domain-adaptive Selective Knowledge Distillation, ensures that the reasoning capabilities developed through curriculum learning and numerical enhancement are efficiently transferred to a refined student model. Unlike standard knowledge distillation that indiscriminately applies soft supervision from the teacher to all training samples, our selective mechanism evaluates two quality-gating criteria for each sample: teacher confidence and student-teacher disagreement. Knowledge transfer occurs only when both criteria are satisfied, ensuring that distillation focuses on cases where the teacher provides high-quality, informative guidance while avoiding propagation of teacher errors on low-confidence predictions or redundant supervision on samples where the student already matches the teacher. This selectivity yields a more reliable and efficient student model that inherits the teacher’s strengths.
The synergy of these three components is realized through a two-stage progressive training curriculum. Stage 1 (Foundation Building) trains the model on a substantial subset of easier-to-moderate samples (80.5% of the training data). These samples involve straightforward table lookups, basic arithmetic, and common financial terminology. This allows the model to establish robust table understanding and fundamental reasoning patterns before encountering the full complexity of the dataset. Stage 2 (Full Data Mastery) initializes from the best checkpoint of Stage 1 and continues training on the complete dataset, which now includes the remaining 19.5% of challenging samples. These samples demand multi-step nested calculations, synthesis across multiple tables, and deep contextual understanding. With foundational skills acquired in Stage 1 and 2, the model can now effectively integrate the numerical reasoning enhancement and selective knowledge distillation mechanisms to tackle the most complex cases. This two-stage approach systematically builds the model’s capabilities from a solid foundation to full mastery, improving both learning efficiency and final performance.
3.3. Complexity-Aware Curriculum Learning
The foundation of our progressive learning framework is a multi-dimensional difficulty evaluator designed for financial question answering. Previous curriculum learning approaches almost rely on superficial heuristics, such as question length, which are inadequate for the financial domain. In the financial domain, complexity is often independent of question length. For instance, a question such as "What is the debt-to-equity ratio?" can be substantially more demanding than a lengthy lookup query because it requires multi-table navigation, division operations, and a structural understanding of balance sheets. This disparity highlights the need for a multi-dimensional assessment that moves beyond surface-level features to effectively guide the learning process.
3.3.1. Finance-Aware Difficulty Evaluator
To capture these nuances, we propose a multi-dimensional difficulty scoring function that quantifies the complexity of each training sample based on four key aspects about financial reasoning:
Structural Complexity (): This metric measures the intricacy of the table structures involved in answering the question. Financial tables often contain hierarchical headers, merged cells, nested categories, and critical footnotes that fundamentally alter data semantics. We formalize structural complexity as:
where is the number of tables required, , , and represent the table dimensions, and denotes the maximum hierarchical depth of headers. The weights are empirically set to based on validation set analysis.
Computational Complexity (): Financial queries often necessitate multi-step arithmetic operations, ranging from simple additions to complex financial ratio calculations. We quantify computational complexity by analyzing the gold-standard program :
where represents the maximum depth of the calculation chain, is the total count of arithmetic operations in the program, and is a binary indicator that equals 1 if the program involves division or financial ratio calculations. The weights prioritize sequential reasoning depth.
Temporal Complexity (): Financial analysis requires temporal reasoning, such as comparing year-over-year growth, computing quarterly trends, or identifying fiscal period changes. We measure temporal complexity as:
where is the number of distinct time periods mentioned in the question or required from the table, and represents the maximum temporal span. The weights emphasize the number of periods over the span.
Semantic Complexity (): Beyond structural and computational challenges, financial questions often employ domain-specific terminology and require multi-hop reasoning across tables and text. Therefore we approximate semantic complexity using:
where indicates the presence of financial terminology, counts the number of reasoning hops, and is the normalized question length. The weights prioritize multi-hop reasoning.
Overall Difficulty Score: The final difficulty score for each sample is computed as a weighted combination of these four dimensions:
where are hyperparameters that balance the importance of each dimension. Through empirical tuning on the FinQA development set, we set , prioritizing computational complexity as it directly impacts answer correctness.
3.3.2. Two-Stage Progressive Curriculum
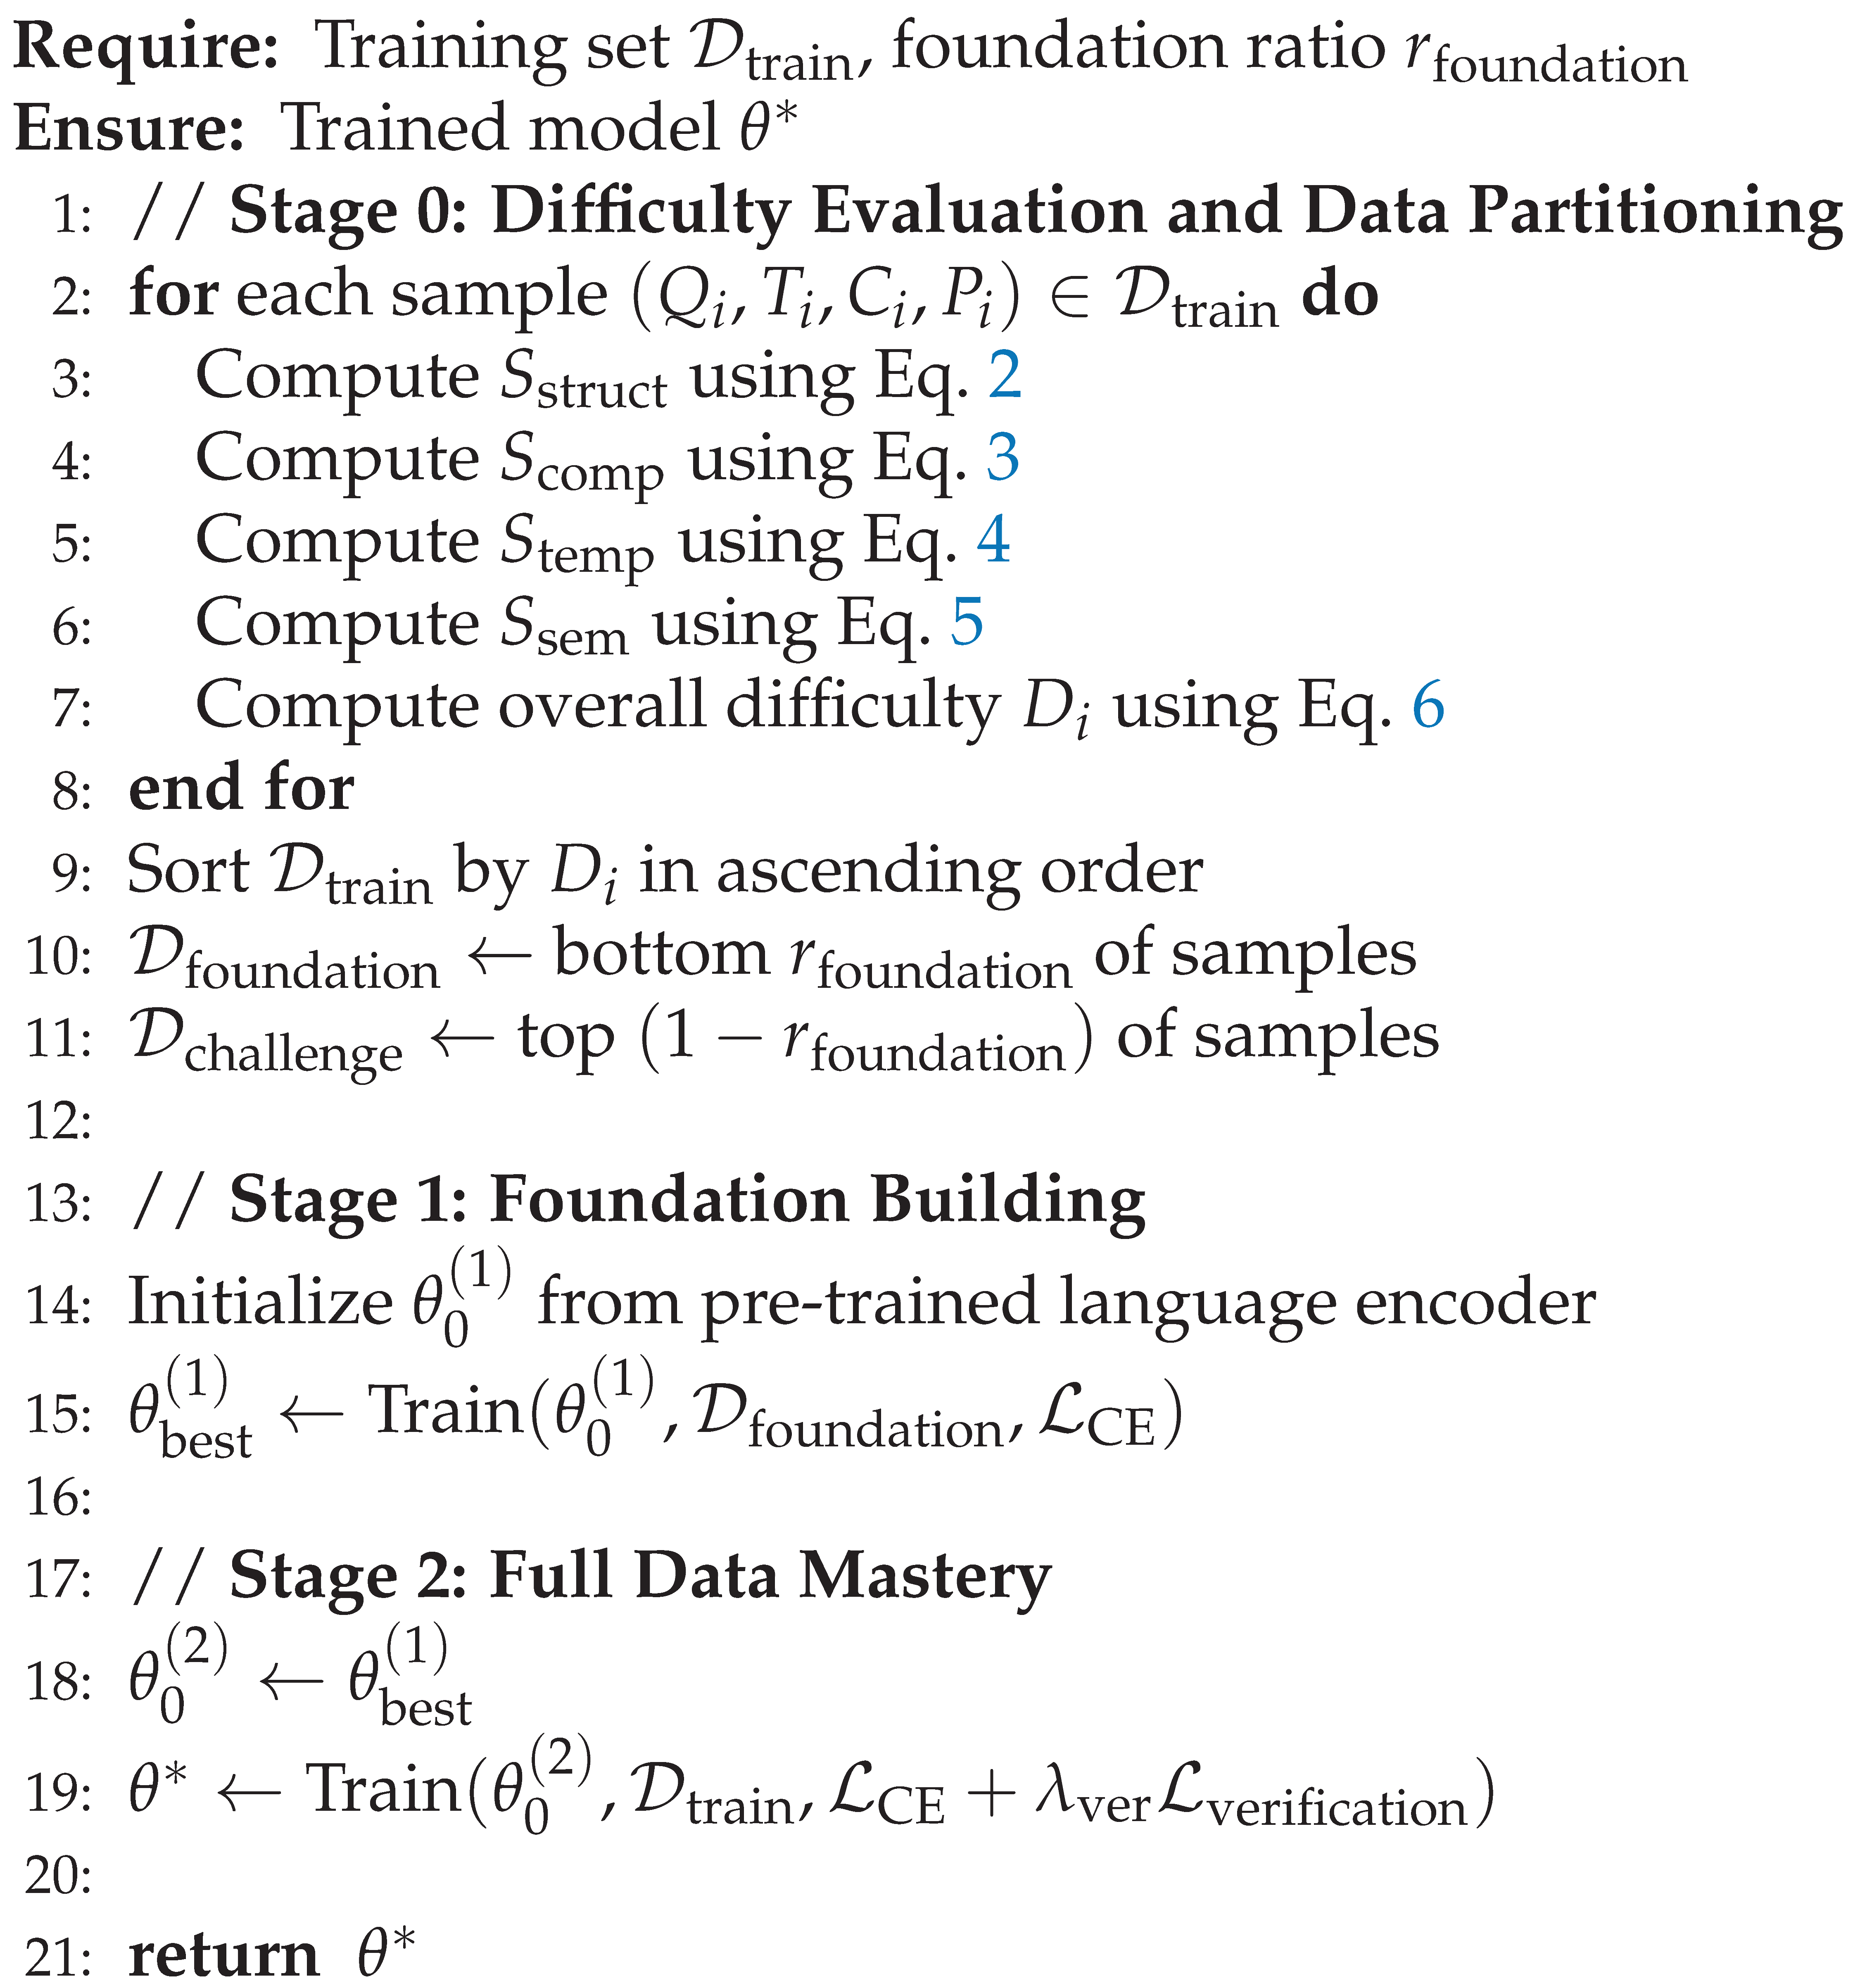
Using the multi-dimensional difficulty scores, we partition the training data into two subsets: , containing the easier 80.5% of samples, and , comprising the remaining 19.5% of hard samples. The model is then trained progressively through two designed stages:
Stage 1: Foundation Building (). The objective of this stage is to establish robust table understanding, basic arithmetic operations, and single-to-moderate step reasoning capabilities. In this stage, the model is trained on , which consists of questions from the easy and medium difficulty ranges. These samples typically require simple to moderate lookup operations and aggregations, involve single-table access with relatively clear table structures, necessitate one to two arithmetic operations, demand basic temporal comparisons, and employ common financial terminology without excessive domain complexity. The model is initialized from a pre-trained language encoder and optimized using standard cross-entropy loss over program tokens.
Stage 2: Full Data Training (). The objective of this stage is to enhance the model’s capability to handle the most complex scenarios involving deep multi-hop reasoning, intricate financial calculations, and challenging table structures. Building upon the best checkpoint saved from Stage 1, denoted as , the model continues training on the complete training set , which now includes the harder samples from . These additional samples introduce multi-step calculations with nested operations, advanced temporal reasoning , questions requiring synthesis across multiple tables or intricate table structures, heavy use of domain-specific financial terminology, and ambiguous phrasing requiring deep contextual understanding. The model is initialized from Stage 1’s best checkpoint . A reduced learning rate is employed to ensure stable fine-tuning and prevent catastrophic forgetting of foundational skills.
3.3.3. Training Algorithm
Algorithm 1 summarizes the complete two-stage curriculum learning procedure. The key insight is that by first establishing a strong foundation on a substantial subset of easier-to-moderate samples, the model builds robust reasoning patterns before being exposed to the full complexity of the dataset. This progressive approach not only accelerates convergence but also improves generalization and reduces the risk of overfitting to difficult, potentially noisy samples early in training.
| Algorithm 1 Two-Stage Finance-Aware Curriculum Learning |
 |
3.4. Numerical Reasoning Enhancement with Financial Formula Verification
While the curriculum learning strategy establishes a solid training foundation, financial question answering presents unique challenges in handling numerical values and arithmetic operations. Traditional pre-trained language models like RoBERTa excel at understanding text semantics but struggle to distinguish between numerically similar yet semantically distinct values such as "$100 million" versus "100%" or "100 employees." Moreover, financial reasoning requires not only accurate numerical computation but also adherence to domain-specific formula patterns. To address these challenges, we propose a comprehensive Numerical Reasoning Enhancement framework comprising three synergistic mechanisms: computation chain decomposition for multi-step reasoning, numerical token enhancement for value-aware representations, and financial formula verification for domain-constrained program generation.
3.4.1. Computation Chain Decomposition
Financial questions frequently demand multi-step calculations where errors in early steps propagate and amplify through subsequent operations. For instance, computing the "year-over-year profit margin growth" involves a sequence of four dependent operations: calculating profit margins for two years, finding the differences, and normalizing by the base year’s margin. An error at any point in this chain invalidates the final result. To mitigate error accumulation, we introduce a Computation Chain Decomposition mechanism that breaks complex calculations into atomic operations and provides explicit supervision for intermediate steps.
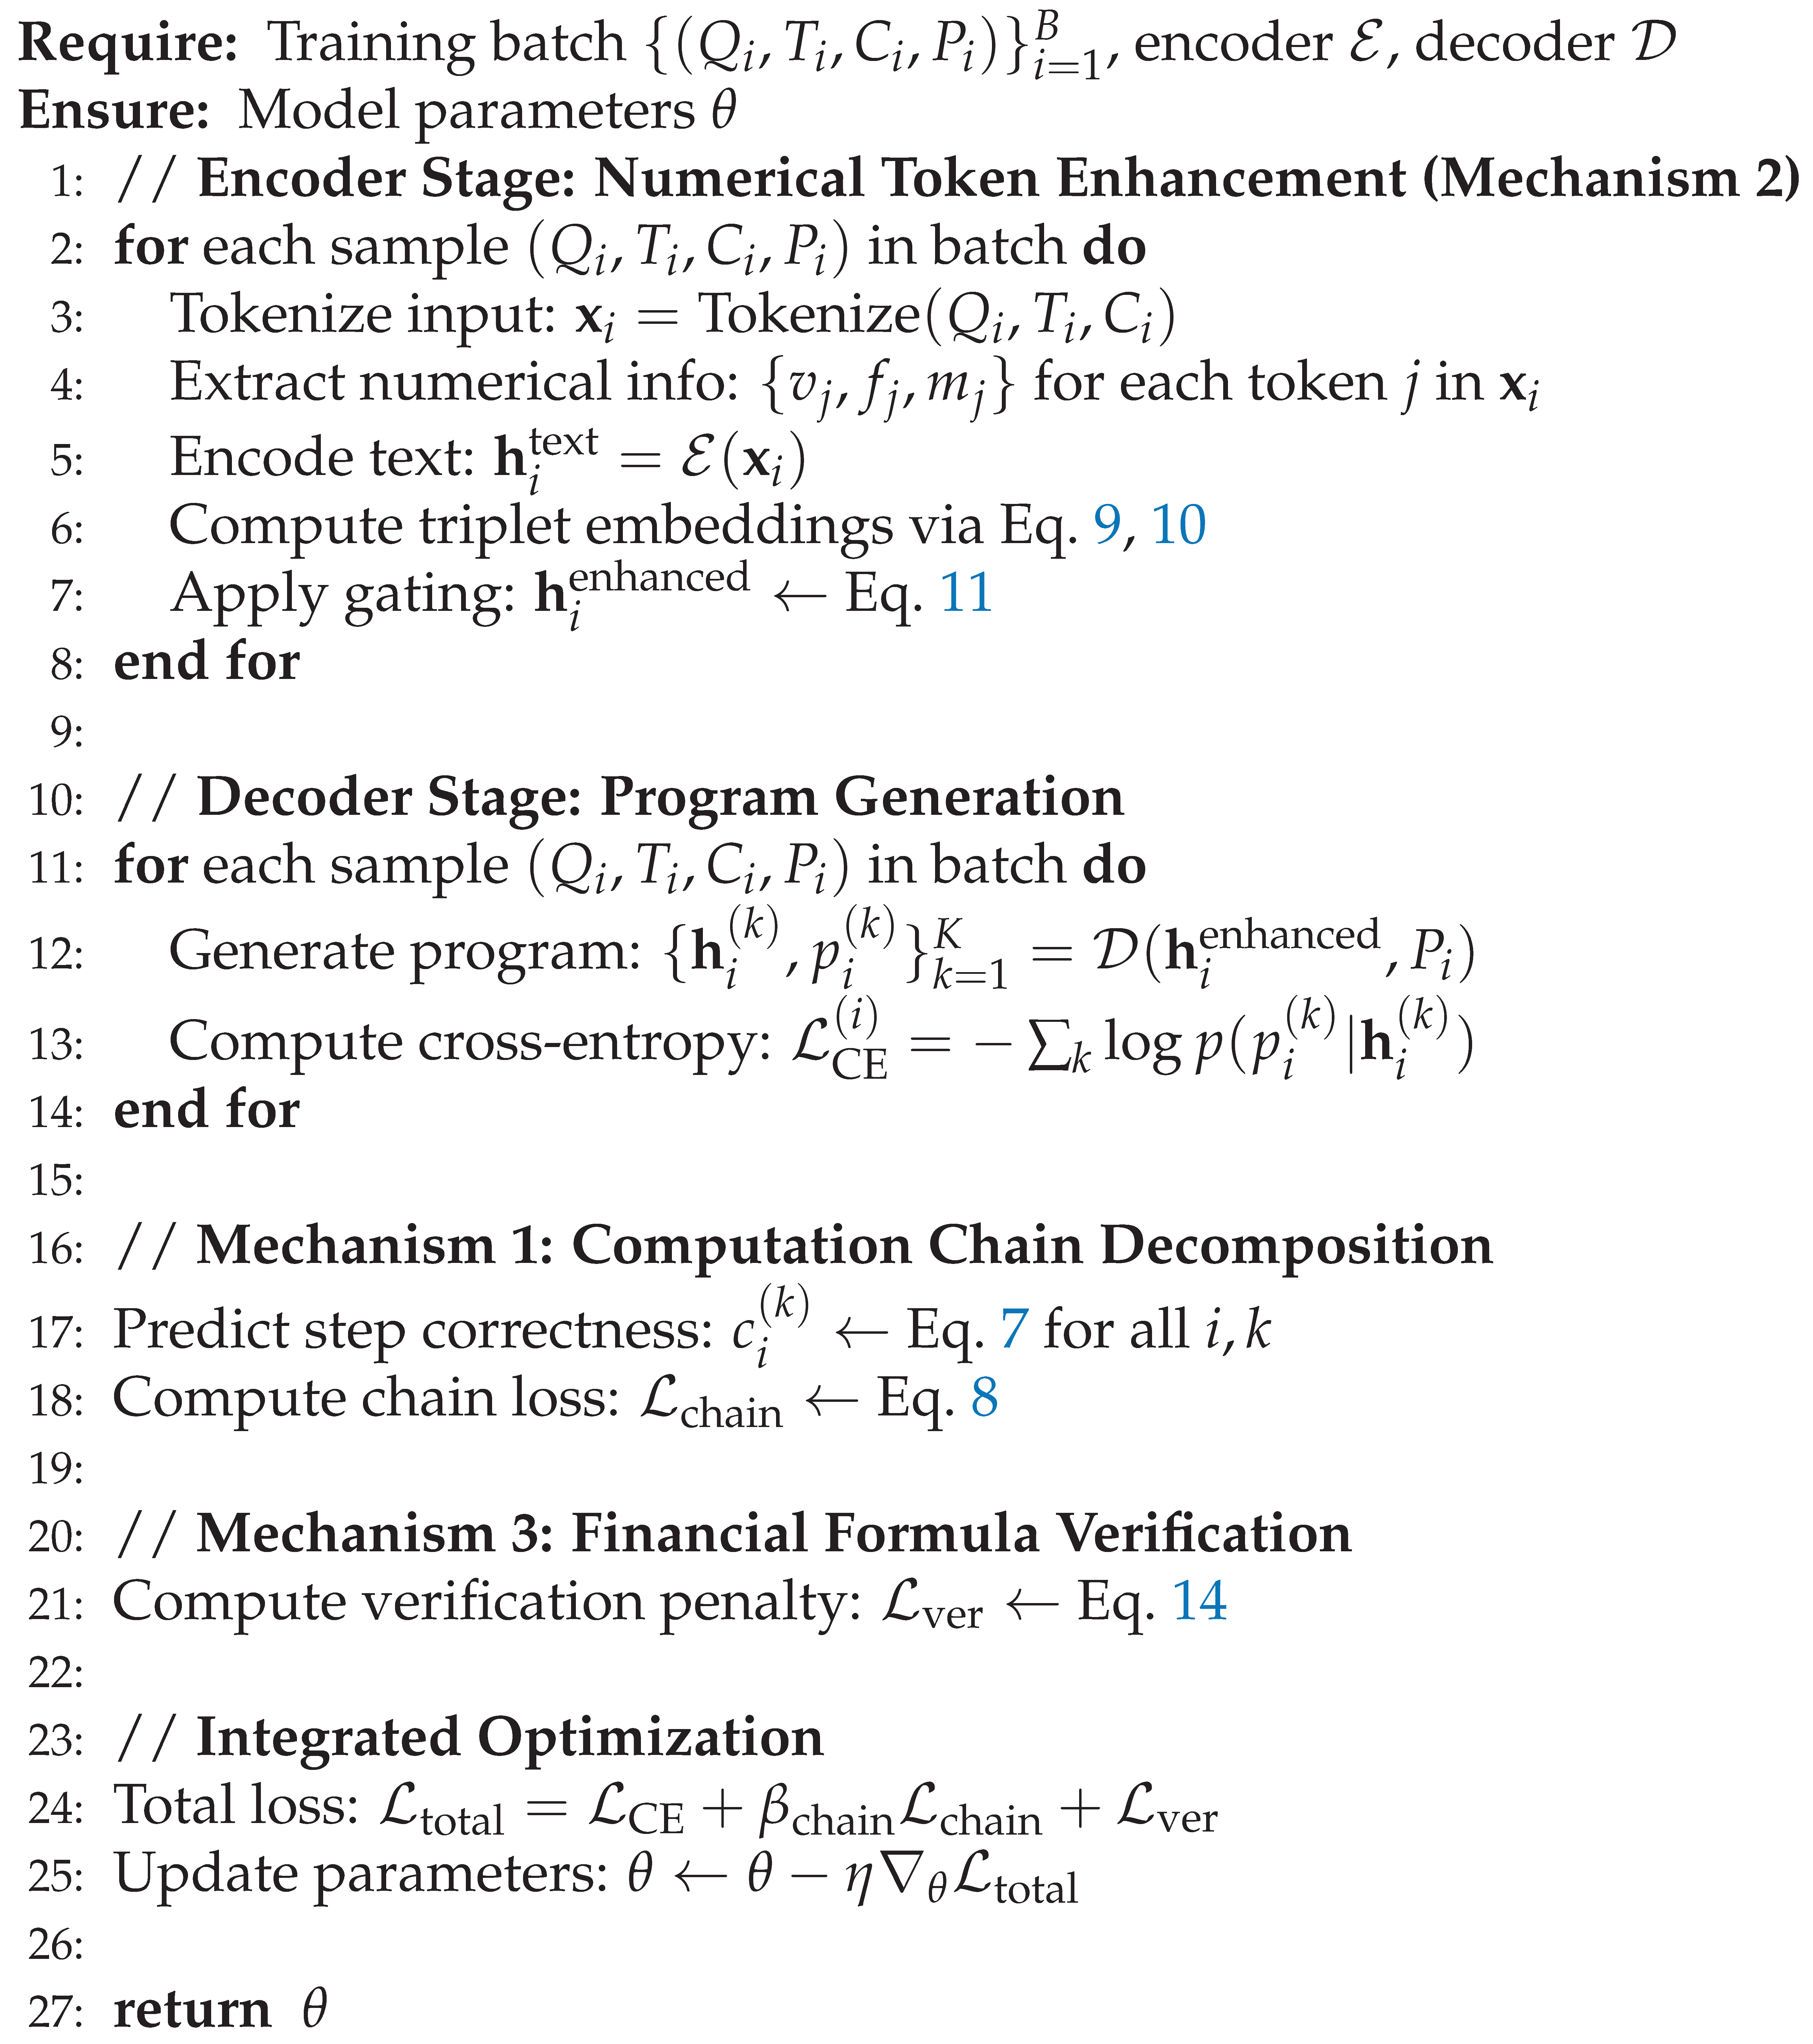
Given a program consisting of K operations, the decoder produces hidden states at each decoding step. We model each step’s correctness via a step-level predictor:
where is a linear encoder mapping hidden states to step embeddings, is a two-layer predictor network, is the sigmoid function, and represents the predicted correctness probability for step k. During training, we compare predicted correctness against ground-truth step labels via binary cross-entropy:
where is a mask indicating valid computation steps (excluding padding). This step-wise supervision encourages the model to maintain correctness throughout the entire reasoning chain rather than optimizing solely for the final answer.
3.4.2. Numerical Token Enhancement
A key limitation of pre-trained language models is their reliance on subword tokenization for numerical inputs, a process that fused a number’s textual form with its underlying value and format. For example, the tokens "$1,000,000", "1000000", and "1 million" represent the same quantity yet produce entirely different embeddings. To enable value-aware and format-aware reasoning, we introduce a Numerical Token Enhancement mechanism. This approach enriches the representation of each numerical mention using a triplet embedding that encodes three complementary facets: the original textual representation, the normalized numerical value, and the format type.
Specifically, for each token in the input sequence, we first detect whether it represents a numerical value and extract its semantic attributes. If is numerical, we parse its value and format type . The numerical value is encoded via log-scale normalization to handle the extreme range of financial figures:
where prevents numerical instability, the centering constant 5.0 corresponds to a magnitude of , and the scaling factor 14.0 accommodates financial values ranging from (percentages) to (large corporate revenues). The normalized value is then projected to a dense embedding using a learned transformation with tanh activation ensuring bounded outputs.
Concurrently, the format type is mapped to a learnable embedding where is an embedding matrix covering the six format categories plus padding. These three representations, the original contextual embedding from RoBERTa, the value embedding , and the format embedding are concatenated and fused through a triplet fusion layer:
where and are learnable parameters, and denotes concatenation along the feature dimension.
To control the strength of numerical enhancement and preserve the pre-trained model’s linguistic knowledge, we apply a learned gating mechanism that selectively combines the original and enhanced representations:
where is the gate vector, ⊙ denotes element-wise multiplication, is a binary mask indicating whether token i is numerical, and is a scaling factor initialized to a small value to ensure conservative enhancement that gradually adapts during training. The gate bias is initialized with negative values, allowing the model to start with minimal perturbation to the pre-trained representations and progressively learn when and how much to incorporate numerical enhancements.
3.4.3. Financial Formula Verification
Beyond accurate numerical understanding, financial reasoning demands adherence to domain-specific formula conventions and logical constraints. For example, profit margins are invariably computed via division, not multiplication or addition; growth rates require computing a difference followed by normalization; and balance sheet equations mandate that assets equal liabilities plus equity. Traditional sequence-to-sequence models, trained solely on input-output pairs, lack explicit guidance to respect these domain rules and may generate syntactically correct but semantically nonsense programs.
To address this, we introduce Financial Formula Verification, a rule-based mechanism that provides soft supervision by penalizing programs that violate common financial logic patterns. Unlike existing approaches that require additional annotations for intermediate reasoning steps, our verification module operates purely through pre-defined rules, making it a zero-cost augmentation requiring no extra labeled data.
We define two categories of verification rules: financial formula rules and operation pattern rules. Financial formula rules encode common domain equations such as:
Operation pattern rules capture general computational best practices, such as encouraging subtraction for difference calculations, division for rate computations, and addition for total aggregations, while discouraging illogical operation choices like multiplication for percentages.
For a generated program P with token sequence and the corresponding question Q, we compute a violation penalty score by checking each applicable rule:
where is the set of all verification rules, is the penalty weight for rule r, and is a binary indicator that equals 1 if the rule’s conditions are triggered by question Q but the required operations are absent in program P. The total verification loss over a training batch is:
where B is the batch size, and is a hyperparameter controlling the strength of verification penalty.
3.4.4. Integrated Training Objective
The three mechanisms are integrated into a unified training objective that combines standard program generation loss with numerical reasoning enhancements:
where is the standard cross-entropy loss over program tokens, is the computation chain decomposition loss (Equation 8), is the financial formula verification loss (Equation 14), and is a balancing coefficient. In practice, the numerical token enhancement (Mechanism 2) operates at the encoder stage, modifying the input representations fed to the decoder, while the chain decomposition and formula verification provide auxiliary supervision during decoder training. Algorithm 2 summarizes the complete training procedure.
| Algorithm 2 Numerical Reasoning Enhanced Training |
 |
3.5. Domain-Adaptive Selective Knowledge Distillation
While curriculum learning and numerical reasoning enhancement substantially improve the model’s foundational capabilities and computational accuracy, performance can be further enhanced by transferring knowledge from a well-trained teacher model. However, standard knowledge distillation (KD) uniformly applies soft supervision from the teacher to all samples. This indiscriminate approach can inadvertently propagate the teacher’s weaknesses, especially when it makes confident yet incorrect predictions on difficult samples. This issue is particularly acute in specialized domains like financial QA, where samples vary in their need for guidance: some require correction for systematic errors, while others only need confirmation of correct reasoning.
3.5.1. Motivation and Challenges
Standard knowledge distillation transfers knowledge from a complex teacher model to a simpler student model by training the student to mimic the teacher’s softened probability distributions. The core intuition is that the teacher’s full output distribution encodes valuable knowledge about inter-class relationships that a standard hard-target cross-entropy loss cannot capture. For financial question answering, where programs consist of sequences of discrete operations and numerical arguments, this soft supervision can guide the student toward more robust decision boundaries and reduce sensitivity to spurious correlations in the training data.
However, applying distillation indiscriminately to all training samples introduces several risks. First, when the teacher makes low-confidence predictions, its soft distribution is almost uninformative noise, and forcing the student to mimic teacher model wastes training capacity without providing meaningful guidance. Second, when the teacher is confidently wrong, distilling these incorrect predictions actively misleads the student, potentially degrading performance below the baseline. Finally, when the student already produces similar predictions, redundant distillation provides no incremental learning signal and merely reaffirms existing knowledge, inefficiently using computational resources.
To overcome these limitations, we introduce a Selective Distillation Mechanism that evaluates two complementary criteria, teacher confidence and student-teacher disagreement to determine whether each sample should undergo distillation. This adaptive approach ensures that knowledge transfer occurs only when the teacher provides high-quality, informative supervision that genuinely benefits the student’s learning trajectory.
3.5.2. Selective Distillation Criteria
Given a trained teacher model with parameters (frozen during student training) and a student model with trainable parameters , we define two selection criteria to identify samples suitable for distillation:
Criterion 1: Teacher Confidence. We compute the teacher’s average confidence across the output sequence as a measure of prediction reliability. For a program sequence of length L, let denote the teacher’s softmax probability distribution over program tokens at position l:
where is the teacher’s raw logits at position l, and T is the temperature hyperparameter that controls the smoothness of the distribution. The teacher’s confidence for the entire sequence is:
where is the probability of the k-th token at position l. A sample is selected for distillation based on teacher confidence only if:
where is a confidence threshold. This criterion ensures that we only distill from teacher predictions that demonstrate high certainty, filtering out low-confidence cases where the teacher itself is uncertain.
Criterion 2: Student-Teacher Disagreement. While teacher confidence ensures prediction quality, it does not capture whether the student actually needs guidance. If the student already produces predictions highly similar to a confident teacher, distillation provides minimal learning signal. To address this, we measure the divergence between student and teacher distributions using the Kullback-Leibler (KL) divergence:
where is the student’s softened probability distribution. The average disagreement across the sequence is:
A sample is selected for distillation based on disagreement only if:
where is a disagreement threshold. This criterion ensures that distillation focuses on samples where the student’s predictions diverge from the teacher, indicating potential for learning from the teacher’s perspective.
Combined Selection Strategy. We adopt a conjunction strategy that requires both criteria to be satisfied simultaneously:
where is a binary selection mask for sample i, and ∧ denotes logical AND. This conservative strategy ensures that distillation occurs only when the teacher is both confident and the student disagrees, maximizing the informativeness of each distillation instance while avoiding misleading supervision from low-confidence or redundant teacher predictions.
3.5.3. Distillation Loss Formulation
For samples selected by the criteria, we compute a hybrid distillation loss that balances learning from ground-truth labels and teacher predictions:
Hard Loss (Ground Truth Supervision). The hard loss enforces agreement with the gold-standard program labels , ensuring that the student maintains fidelity to the training data:
where is the ground-truth at position l, and the probability is computed from the student’s raw logits to preserve sharp decision boundaries.
Soft Loss (Teacher Distillation). The soft loss encourages the student to match the teacher’s smoothed probability distribution, transferring the teacher’s understanding of inter-class relationships:
where the temperature scaling factor compensates for the gradient magnitude reduction caused by softening the distributions. This ensures that the soft loss and hard loss contribute at comparable magnitudes.
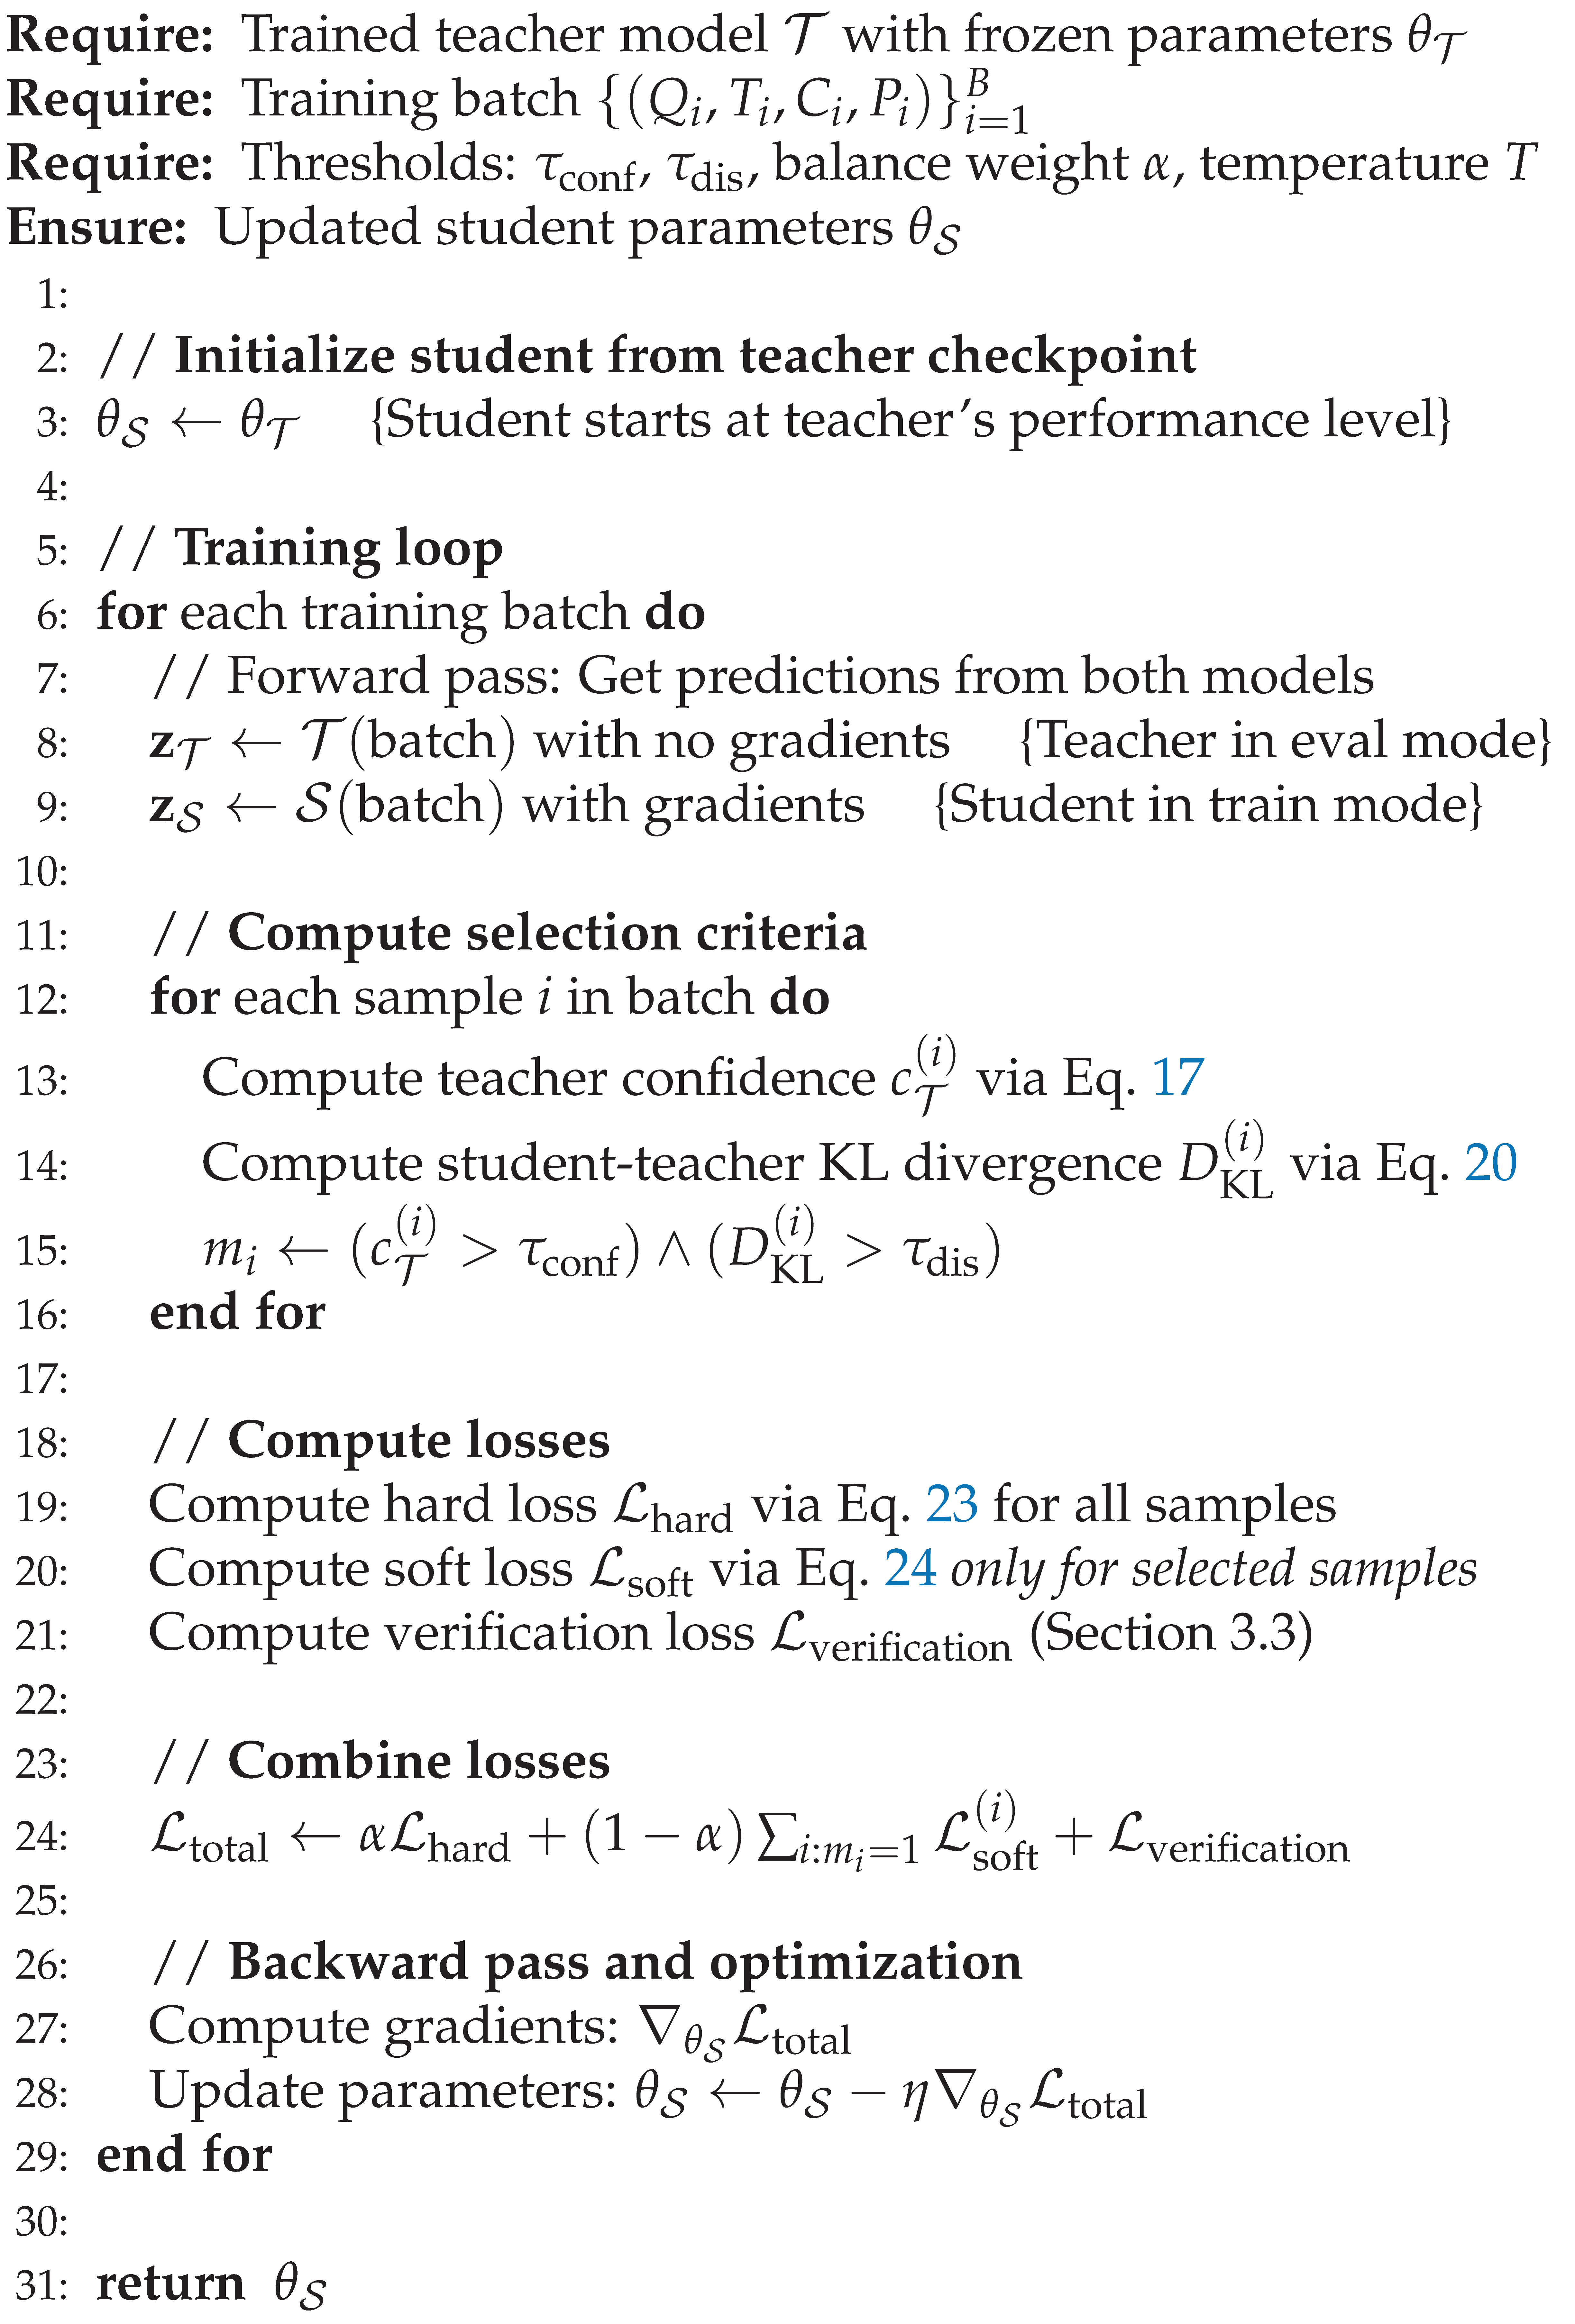
Combined Distillation Loss. For a training batch of size B, the final loss combines hard and soft components only for selected samples, while non-selected samples use standard supervised learning:
where is a hyperparameter balancing hard and soft losses, and the selection mask ensures that soft loss is computed only for selected samples. For non-selected samples (), the loss degenerates to pure hard supervision, equivalent to standard cross-entropy training.
Integrating with the numerical reasoning enhancement, the total training objective becomes:
where is the financial formula verification loss from Mechanism 3 (Equation 14).
3.5.4. Training Procedure
The distillation process follows a carefully designed procedure to ensure effective knowledge transfer. Algorithm 3 outlines the complete training workflow.
| Algorithm 3 Domain-Adaptive Selective Knowledge Distillation |
 |
4. Experiments
4.1. Experimental Setup
4.1.1. Dataset
We conduct experiments on the FinQA benchmark [1], a large-scale dataset specifically designed for financial report question answering. The dataset contains 8,281 financial questions collected from earnings reports of S&P 500 companies, covering fiscal years from 1999 to 2019. Each example consists of a natural language question, one or more financial tables with hierarchical headers, surrounding textual context, and an annotated program representing the gold-standard reasoning process. Following the standard split [1], the dataset comprises 6,251 training examples, 883 development examples, and 1,147 test examples.
Questions in FinQA require diverse reasoning capabilities across multiple complexity levels. The dataset distribution includes single-step arithmetic operations (23%), multi-step calculations (45%), table aggregations (18%), and complex financial ratio computations (14%). The program vocabulary comprises nine arithmetic operations (add, subtract, multiply, divide, exp, greater, table_sum, table_average, table_max,table_min) along with numerical arguments extracted from tables and context. On average, each reasoning program contains 5.3 operations per question, reflecting the substantial computational complexity required for financial question answering.
4.1.2. Baselines
We compare FinQA-PKD against several categories of state-of-the-art methods as shown in Table 1:
FinQA Baseline Models: We include the original FinQA benchmark baselines [1]: combines neural module networks with retrieval, and FinQANet (355M parameters) employs RoBERTa-Large with LSTM decoder for program generation.
Ensemble Methods: TabT5 Ensemble [11] ( 770M parameters) and APOLLO Ensemble [38] ( 710M parameters) leverage multiple models or reasoning strategies. Ant Risk AI represents the FinQA challenge winner with proprietary techniques.
Large Language Models: We evaluate GPT-3.5-turbo and GPT-4 [39] with various prompting strategies, including Program-of-Thought [40] which augments GPT-3 with explicit program generation.
All baselines use the same data split and evaluation metrics. Our FinQA-PKD (357M parameters) is comparable in size to single-model baselines (355M-550M).
4.1.3. Evaluation Metrics
We employ two metrics to evaluate both answer quality and reasoning correctness. Given a test set with N examples, where each example consists of question , context , gold program , and gold answer , our model generates program and executes it to produce .
Primary Metrics:
Execution Accuracy measures the proportion of correctly answered questions:
where is the numerical tolerance and is the indicator function. This is our primary metric as it directly measures task success regardless of the reasoning path.
Program Accuracy measures exact program match:
This stricter metric evaluates whether the model learns the canonical reasoning patterns annotated by humans.
4.1.4. Implementation Details
Model Architecture: Our implementation uses RoBERTa-Large as the base encoder with 355M parameters and hidden dimension 1024. The program decoder employs a single-layer LSTM with hidden size 1024. For curriculum learning, we implement a finance-aware difficulty evaluator that computes four complexity scores covering structural, computational, temporal, and semantic aspects. The evaluator assigns weights , , , and , prioritizing computational complexity as the primary difficulty indicator. The numerical reasoning enhancement module adds 2.1M trainable parameters, including format embeddings for seven types, value encoder using log-scale normalization, and triplet fusion layers with gate mechanisms. To ensure conservative initialization that prevents early disruption of pre-trained representations, we set gate bias to and scaling factor to .
Training Configuration: Training follows a two-stage progressive curriculum. The Foundation Building stage trains on 5,034 samples comprising 80.5% of the training data with easy-to-medium difficulty. This stage runs for 12 epochs with learning rate , batch size 16, and gradient accumulation steps 2, yielding an effective batch size of 32. The Full Data Mastery stage initializes from the best checkpoint of Stage 1 and trains on all 6,251 samples for 20 epochs. To prevent catastrophic forgetting, we reduce the learning rate to . For models with numerical reasoning enhancement, we apply differential learning rates: for new numerical reasoning parameters and for pre-trained encoder parameters. We apply warmup for the first 500 steps with linear schedule from 1% to 100% of the target learning rate.
Knowledge Distillation Configuration: For selective distillation experiments, the teacher model is loaded from the best checkpoint of Stage 2 with numerical reasoning enhancement. The student model uses the same architecture. Distillation hyperparameters are configured as follows: temperature softens the probability distributions for smoother knowledge transfer, balance weight provides equal weighting of hard labels and soft teacher distributions. Teacher confidence threshold filters low-confidence predictions, and student-teacher disagreement threshold identifies informative samples with meaningful prediction divergence. The selection strategy requires both confidence and disagreement criteria to be satisfied simultaneously, preventing error propagation while maximizing learning efficiency.
Numerical Reasoning Configuration: The numerical token enhancement module processes input tokens to extract and encode numerical information. For each numerical token, we compute log-scale normalized value as where prevents undefined logarithms. Each token is assigned one of seven format types: PLAIN, PERCENTAGE, CURRENCY_USD, CURRENCY_OTHER, YEAR, OTHER, or PAD. Format embeddings have dimension 384. The triplet fusion layer combines three complementary representations: 1024-dimensional text embeddings from RoBERTa, 384-dimensional value embeddings encoding magnitude information, and 384-dimensional format embeddings capturing type information, producing enhanced 1024-dimensional representations. Financial formula verification applies nine rules covering profit calculation, growth rate, margin, balance sheet, difference, ratio, total, average, and percentage patterns. Rule-specific penalty weights range from 0.5 to 1.2 based on pattern importance, and the verification penalty weight balances guidance strength without overwhelming the primary cross-entropy loss.
Computational Resources: All experiments are conducted on two NVIDIA RTX 4090 GPUs with 24GB memory each, using PyTorch DataParallel for multi-GPU training. Inference uses a single GPU with batch size 8.
4.2. Main Results
Table 1 compares the FinQA-PKD framework with other models on the FinQA test set. Performance is measured using Execution Accuracy (Exe Acc) and Program Accuracy (Prog Acc).
First, we consider the original FinQA Baselines. The FinQANet model, which has the same parameter count to our model, achieves an Execution Accuracy of 61.24% and serves as a basic reference point. State-of-the-art performance is set by much larger models. For example, in Ensemble Methods, APOLLO reaches 71.07% Exe Acc. Among Large Language Models (LLMs), GPT-4 and Program-of-Thought (GPT-3) score 68.79% and 68.10%, respectively. While effective, these models rely on significantly more parameters.
Our approach shows clear, step-by-step performance increments. The FinQA-PKD (Stage 1) model, trained only on the easier 80.5% of the data, scores 58.15%. This is below the FinQANet baseline, which highlights the need for training on the complete, more difficult dataset. After adding the remaining hard samples in the second stage, the FinQA-PKD (Stage 1+2) model’s performance increases to 61.81%, surpassing the FinQANet baseline.
The complete framework, FinQA-PKD (Full), which uses curriculum learning, numerical reasoning enhancement, and selective knowledge distillation, achieves 62.68% Execution Accuracy and 59.72% Program Accuracy. The proposed model exhibits better performance compared to the FinQANet baseline. This advancement is achieved with only a marginal increase in parametric overhead, thereby underscoring the effectiveness of our novel components.
4.3. Ablation Studies
4.3.1. Component-Wise Ablation
To evaluate the individual contribution of each key component within the proposed framework, we conduct a thorough ablation study, with the results presented in Table 2. The study starts with the full FinQA-PKD model and systematically removes one major component at a time to observe the impact on performance.
Our full model, FinQA-PKD (Full), achieves an Execution Accuracy of 62.68% and Program Accuracy of 59.72%. When Curriculum Learning is removed (w/o Curriculum Learning), the model is trained on the entire dataset from the beginning without any difficulty-based ordering. This change results in the performance degradation, with Execution Accuracy dropping to 61.81% and Program Accuracy dropping to 58.85%. This result shows the critical role of the progressive, two-stage training strategy in building a robust foundational understanding before tackling more complex financial reasoning tasks.
Removing the Numerical Reasoning enhancement module (w/o Numerical Reasoning) leads to a decrease in Execution Accuracy to 62.07% which confirms the module’s effectiveness in improving the model’s ability to handle precise numerical computations and adhere to financial logic.
Lastly, removing the Selective Knowledge Distillation step (w/o Selective Distillation) results in an Execution Accuracy of 62.25%. This indicates that while the model has already become quite strong through the first two stages, the selective distillation process provides a final layer of refinement, effectively transferring nuanced knowledge from the teacher model to further boost performance.
Collectively, the ablation study demonstrates that each of the three proposed component contribute to the final performance of the FinQA-PKD framework. The removal of any single component leads to a decline in both Execution Accuracy and Program Accuracy, validating the proposed integrated design.
4.3.2. Training Stage Analysis
To provide a clear view of how performance evolves throughout the proposed training pipeline, Table 3 details the incremental gains achieved at each step. This analysis demonstrates the effectiveness of our progressive methodology, where each stage builds upon the capabilities developed in the previous one.
The process begins with the Stage 1 only (Foundation) model, which is trained exclusively on the 80.5% of samples identified as easy-to-medium difficulty. The initial model establishes a foundational understanding of basic table lookup and simple arithmetic, achieving an Execution Accuracy of 58.15% which is below that of a fully trained baseline, indicating that exposure to the full range of data complexity is necessary.
Next, we complete the two-stage curriculum by introducing the remaining difficult samples in Stage 1+2 (no NR). This step alone yields a substantial performance increase, boosting the Execution Accuracy to 61.81%. This improvement highlights the power of the curriculum learning strategy, allowing the model to effectively generalize to complex problems after having first built a robust foundation.
Building on this improved model, we then integrate the numerical reasoning enhancement module (Stage 1+2 + NR) which provides a further lift in performance to 62.25% Execution Accuracy. This demonstrates the value of specialized components designed to address the unique challenges of numerical precision in the financial domain.
Finally, the full framework (Stage 1+2 + NR + Distill (Full)) is assembled by applying selective knowledge distillation as a final refinement step. This process fine-tunes the model, resulting in the best performance of 62.68% Execution Accuracy. The analysis clearly illustrates a consistent improvement at each stage, validating the structured and progressive design of our FinQA-PKD framework.
4.4. Hyperparameter Sensitivity Analysis
4.4.1. Distillation Hyperparameters
We also investigated the sensitivity of our selective knowledge distillation process to the four key hyperparameters, with the results detailed in Table 4, Table 5, Table 6 and Table 7.
Temperature T. As shown in Table 4, the temperature T controls the smoothness of the teacher model’s probability distribution. A low temperature results in a sharp, confident distribution, while a high temperature creates a softer, less certain one. Our experiments show that performance peaks at , achieving 62.68% Execution Accuracy. Both lower values and higher values lead to a decline in performance, indicating that a moderately softened distribution provides the most effective supervisory signal for the student model.
Balance Weight . The balance weight , presented in Table 5, modulates the contribution between the hard loss and the soft loss. The results indicate that the best performance is achieved with , which gives a slightly greater weight to the teacher’s softened probabilities. As increases, giving more emphasis to the hard labels, the benefits of distillation diminish.
Confidence . Table 6 examines the impact of the teacher confidence threshold, , which is a critical part of our selective mechanism. This threshold filters out samples where the teacher model is uncertain, preventing the propagation of low-quality guidance. The performance peaks at . A lower threshold hurts performance because it includes the teacher’s low-confidence predictions, which can be unreliable while a higher threshold also leads to a small drop in accuracy because it is too restrictive and filters out many useful training examples.
Disagreement . The student-teacher disagreement threshold, , ensures that distillation focuses on informative samples where the student’s predictions diverge from the teacher’s. As shown in Table 7, the model achieves the best performance at . A lower threshold might waste resources on samples the student already knows, while a higher threshold could miss important learning opportunities where the student’s errors are more subtle.
4.5. Case Study and Qualitative Analysis
Table 8 presents a qualitative analysis of representative examples from the FinQA test set, categorized by difficulty, which is used to illustrate the reasoning capabilities of our FinQA-PKD framework. The generated programs demonstrate the model’s ability to interpret complex questions and translate them into correct, executable steps.
Easy Samples: In the easy cases, the model demonstrates its mastery of foundational skills. For instance, to answer “what is the change in net income from cumulative effect of adoption?”, the model correctly identifies the two relevant numerical values from the source and generates a simple add(30, 1) program. Similarly, for the “what is the net change in the balance of employee separations liability during 2004? ” question, it correctly interprets “net change” as a subtraction, producing subtract(665, 2239). These examples show that the model has successfully learned to perform basic arithmetic operations and ground them in the context of the financial query, validating the effectiveness of the “Foundation Building” stage of our curriculum learning.
Medium Samples: The medium complexity examples highlight the model’s ability to handle compositional reasoning and more nuanced semantics. To calculate the “what was the average cost per share for the share repurchases in 2012?”, the model correctly deduces that a division operation is required, generating divide(92, 1). More impressively, when asked for the “what is the total research and development for the year 2014 through 2016 in millions”, the model generates a multi-step program: add(78, 119), add(#0, 86). This demonstrates its capacity to chain operations, using the result of the first addition (#0) as an input for the second, thereby correctly aggregating values across multiple periods.
Hard Samples: The hard examples showcase the full power of the proposed framework in tackling multi-step, dependent reasoning. The question regarding the projected “cash expense for product warranties” requires a two-step calculation: first, determining the percentage increase from the previous year, and second, applying that same increase to the current year’s value. FinQA-PKD successfully deconstructs this logic into the program divide(5, 4), multiply(#0, 5), where it first calculates the growth factor and then uses that result (#0) for the final projection. The second hard example, concerning the “vivo acquisition”, involves aggregating multiple figures to determine a final percentage. The model correctly generates a complex, four-step program add(800, 700), add(#0, 192), add(#0, 300), divide(#1, #2) that first sums up the components for the numerator and denominator and then performs the final division.
In summary, these examples show that FinQA-PKD constructs transparent and logically sound reasoning paths, rather than just finding answers. The ability to deconstruct complex questions into accurate, multi-step programs, particularly in the hard cases, highlights the benefits of our Numerical Reasoning Enhancement and Computation Chain Decomposition modules.
4.6. Failure Cases
To better understand the limitations of the proposed model, we performed a qualitative analysis of failure cases, with examples chosen to represent different failure modes. The results which are presented in Table 9 reveal that while our framework is robust, it still struggles with specific, high-level reasoning tasks.
Scaling and Unit Conversion Errors. Financial reports are full with numbers reported “in millions” or “in thousands,” alongside percentages and basis points. The first case exemplifies a failure to handle these units correctly. The model’s program correctly identifies the interest rate difference (‘subtract(4.50, 4.25)’) and multiplies it by a principal amount. However, the final result is off by a factor of 100. This is likely due to a misinterpretation of how to apply the percentage difference to the principal, which is stated “in millions”. The model struggles to correctly chain the scaling factors, leading to a large magnitude error despite the underlying logic being correct. This indicates a weakness in reasoning about the interplay between numerical values and the associated units.
Errors in Complex Aggregation. The second example reveals a persistent difficulty with multi-step aggregation tasks. The question asks for a simple ”average” over a three-year period, which requires summing three numbers and dividing by three. The generated program fails on both counts. First, the aggregation logic is flawed, incorrectly adding constants to the sum. Second, and more critically, it divides the final sum by ’const_2’ instead of the correct count of three. This shows a fundamental failure to infer the scope of the aggregation and to apply the correct, complete procedure for a common operation like “average”.
In summary, these distinct failure modes demonstrate that the remaining challenges in financial question answering are deeply rooted in reasoning, not just retrieval. Future work should focus on improving the model’s ability to handle reason about numerical scaling and units, and reliably execute complex, multi-step procedures like aggregation.
5. Conclusion
In this study, we present FinQA-PKD, a framework for financial report question answering that combines curriculum learning, numerical reasoning enhancement, and selective knowledge distillation. Our approach introduces a finance-aware complexity evaluator that organizes training into two progressive stages, a numerical reasoning module that improves computational accuracy through chain decomposition and triplet embeddings, and a selective distillation mechanism that filters teacher predictions based on confidence and disagreement criteria. Experiments on the FinQA benchmark demonstrate that our framework achieves improvements in execution accuracy compared to baseline approaches, validating the effectiveness of progressive training and numerical enhancement strategies. The modular design allows individual components to be evaluated and adapted independently.
However, several limitations still remain. The difficulty evaluator relies on manually designed heuristics that may not generalize beyond FinQA. The conservative initialization of numerical reasoning modules limits their initial contribution. Selective distillation requires a high-quality teacher model, and performance depends heavily on teacher accuracy. Future work could explore learned difficulty metrics, adaptive initialization strategies, and extension to multi-lingual financial reports or other structured reasoning tasks.
References
- Chen, W.; et al.. FinQA: A Dataset of Numerical Reasoning over Financial Data. In Proceedings of the Proceedings of the 2021 Conference of the North American Chapter of the Association for Computational Linguistics: Human Language Technologies. Association for Computational Linguistics, 2021, pp. 3699–3711.
- Wei, J.; Wang, X.; Schuurmans, D.; Bosma, M.; Ichter, B.; Xia, F.; Chi, E.H.; Le, Q.V.; Zhou, D. Chain-of-Thought Prompting Elicits Reasoning in Large Language Models. Advances in neural information processing systems 2022, pp. 24824–24837.
- Zhu, L.; et al.. TAT-QA: A Question Answering Benchmark on Tabular and Textual Data for Real-World Financial Analysis. In Proceedings of the Proceedings of the 2021 Conference on Empirical Methods in Natural Language Processing, 2021, pp. 3277–3290.
- Yuan, L.; Tay, F.E.H.; Li, G.; Wang, T.; Feng, J. Revisiting Knowledge Distillation via Label Smoothing Regularization. In Proceedings of the 2020 IEEE/CVF Conference on Computer Vision and Pattern Recognition, CVPR 2020, Seattle, WA, USA, June 13-19, 2020. IEEE, 2020, pp. 3903–3911.
- Sun, Z.; et al.. Selective Knowledge Distillation for Deep Neural Networks. In Proceedings of the Proceedings of the AAAI Conference on Artificial Intelligence, 2020, Vol. 34, pp. 4722–4729.
- Chen, W.; Wang, H.; Chen, J.; Zhang, Y.; Wang, H.; Li, S.; Zhou, X.; Wang, W.Y. TabFact: A Large-scale Dataset for Table-based Fact Verification. In Proceedings of the International Conference on Learning Representations, 2020.
- Pasupat, P.; Liang, P. Compositional semantic parsing on semi-structured tables. In Proceedings of the Proceedings of the 53rd Annual Meeting of the Association for Computational Linguistics and the 7th International Joint Conference on Natural Language Processing (Volume 1: Long Papers). Association for Computational Linguistics, 2015, pp. 1373–1383.
- Zhong, V.; et al. Seq2SQL: Generating Structured Queries from Natural Language Using Reinforcement Learning. In Proceedings of the EMNLP, 2017.
- Herzig, J.; et al.. TaPas: Weakly supervised table parsing via pre-training. In Proceedings of the Proceedings of the 58th Annual Meeting of the Association for Computational Linguistics. Association for Computational Linguistics, 2020, pp. 9262–9274.
- Yin, P.; Neubig, G.; Yih, W.; Riedel, S. TaBERT: Pretraining for Joint Understanding of Textual and Tabular Data. In Proceedings of the Proceedings of the 58th Annual Meeting of the Association for Computational Linguistics, ACL 2020, Online, July 5-10, 2020; Jurafsky, D.; Chai, J.; Schluter, N.; Tetreault, J.R., Eds. Association for Computational Linguistics, 2020, pp. 8413–8426.
- Andrejczuk, E.; Eisenschlos, J.; Piccinno, F.; Krichene, S.; Altun, Y. Table-To-Text generation and pre-training with TabT5. In Proceedings of the Findings of the Association for Computational Linguistics: EMNLP 2022; Goldberg, Y.; Kozareva, Z.; Zhang, Y., Eds., Abu Dhabi, United Arab Emirates, 2022; pp. 6758–6766. https://doi.org/10.18653/v1/2022.findings-emnlp.503. [CrossRef]
- Zhao, Y.; Li, Y.; Li, C.; Zhang, R. ELASTIC: Numerical Reasoning with Adaptive Symbolic Compiler. In Proceedings of the Proceedings of the 2022 Conference on Empirical Methods in Natural Language Processing, EMNLP 2022, Abu Dhabi, United Arab Emirates, December 7-11, 2022; Goldberg, Y.; Kozareva, Z.; Zhang, Y., Eds. Association for Computational Linguistics, 2022, pp. 9912–9926.
- Miao, S.; Hu, Y.; Cheng, S.; Li, Y.; Lin, F.; Wan, X. DyRRen: A Dynamic Retriever-Reranker-Generator Model for Numerical Reasoning over Tabular and Textual Data. In Proceedings of the Thirty-Seventh AAAI Conference on Artificial Intelligence, AAAI 2023, Thirty-Fifth Conference on Innovative Applications of Artificial Intelligence, IAAI 2023, Thirteenth Symposium on Educational Advances in Artificial Intelligence, EAAI 2023, Washington, DC, USA, February 7-14, 2023; Williams, B.; Chen, Y.; Neville, J., Eds. AAAI Press, 2023, pp. 13283–13291.
- Jiang, J.; Wang, Y.; Mi, B.; Niu, T.; Hu, Z.; Chen, W. UniRPG: Unified Discrete Reasoning over Table and Text as Program Generation. In Proceedings of the Proceedings of the 2022 Conference of the North American Chapter of the Association for Computational Linguistics: Human Language Technologies, NAACL-HLT 2022, Seattle, WA, USA, July 10-15, 2022. Association for Computational Linguistics, 2022, pp. 1692–1706.
- Zhang, S.; et al. SynTQA: Synergistic Table-based Question Answering via Mixture of Text-to-SQL and E2E TQA. In Proceedings of the Findings of the Association for Computational Linguistics: EMNLP 2024, 2024, pp. 2352–2364.
- Cao, Y.; et al. API-Assisted Code Generation for Question Answering on Varied Table Structures. In Proceedings of the Proceedings of the 2023 Conference on Empirical Methods in Natural Language Processing, 2023, pp. 14536–14548.
- Si, S.; et al. TableRAG: Million-Token Table Understanding with Language Models. In Proceedings of the Advances in Neural Information Processing Systems, 2024, Vol. 37. [CrossRef]
- Chen, W.; et al.. HybridQA: A Dataset of Multi-Hop Question Answering over Tabular and Textual Data. In Proceedings of the Proceedings of the 2020 Conference on Empirical Methods in Natural Language Processing (EMNLP). Association for Computational Linguistics, 2020, pp. 7460–7473.
- Bengio, Y.; et al.. Curriculum Learning. In Proceedings of the Proceedings of the 26th Annual International Conference on Machine Learning, 2009, pp. 41–48.
- Soviany, P.; et al. Curriculum Learning: A Survey. International Journal of Computer Vision 2022, 130, 1526–1565. [CrossRef]
- Graves, A.; et al. Automated curriculum learning for neural networks. In Proceedings of the Proceedings of the 34th International Conference on Machine Learning - Volume 70. JMLR.org, 2017, ICML’17, p. 1311–1320.
- Zhang, X.; et al. CurBench: Curriculum Learning Benchmark. In Proceedings of the Proceedings of the 41st International Conference on Machine Learning, 2024.
- Chen, Y.; et al. Diffusion-based Curriculum Reinforcement Learning. In Proceedings of the Advances in Neural Information Processing Systems, 2024, Vol. 37.
- Zheng, Y.; et al. Learning Versatile Skills with Curriculum Masking. In Proceedings of the Advances in Neural Information Processing Systems, 2024, Vol. 37.
- Dua, D.; et al. DROP: A Reading Comprehension Benchmark Requiring Discrete Reasoning Over Paragraphs. In Proceedings of the NAACL, 2019.
- Amini, A.; Gabriel, S.; Lin, S.; Koncel-Kedziorski, R.; Choi, Y.; Hajishirzi, H. MathQA: Towards Interpretable Math Word Problem Solving with Operation-Based Formalisms. In Proceedings of the Proceedings of the 2019 Conference of the North American Chapter of the Association for Computational Linguistics: Human Language Technologies, Volume 1 (Long and Short Papers); Burstein, J.; Doran, C.; Solorio, T., Eds., Minneapolis, Minnesota, 2019; pp. 2357–2367.
- Geva, M.; Gupta, A.; Berant, J. Injecting Numerical Reasoning Skills into Language Models. In Proceedings of the Proceedings of the 58th Annual Meeting of the Association for Computational Linguistics; Jurafsky, D.; Chai, J.; Schluter, N.; Tetreault, J., Eds., Online, 2020; pp. 946–958.
- Shi, Y.; et al. Case-Based Reasoning Approach for Solving Financial Question Answering. arXiv preprint arXiv:2405.13044 2024.
- Li, S.; et al. Enhancing Financial Question Answering with a Multi-Agent Reflection Framework. In Proceedings of the Proceedings of the 5th ACM International Conference on AI in Finance, 2024, pp. 481–489.
- Hinton, G.; Vinyals, O.; Dean, J. Distilling the knowledge in a neural network, 2015, [1503.02531].
- Jiao, X.; et al. TinyBERT: Distilling BERT for Natural Language Understanding. In Proceedings of the Findings of the Association for Computational Linguistics: EMNLP 2020; Cohn, T.; He, Y.; Liu, Y., Eds., Online, 2020; pp. 4163–4174.
- Sanh, V.; Debut, L.; Chaumond, J.; Wolf, T. DistilBERT, a distilled version of BERT: smaller, faster, cheaper and lighter. CoRR 2019, abs/1910.01108, [1910.01108].
- Li, M.; et al. Task-Specific Generative Dataset Distillation with Difficulty-Guided Sampling. CoRR 2025, abs/2507.03331.
- Sun, S.; et al. Patient Knowledge Distillation for BERT Model Compression. In Proceedings of the Proceedings of the 2019 Conference on Empirical Methods in Natural Language Processing and the 9th International Joint Conference on Natural Language Processing (EMNLP-IJCNLP); Inui, K.; Jiang, J.; Ng, V.; Wan, X., Eds., Hong Kong, China, 2019; pp. 4323–4332.
- Zhang, S.; et al. Dual-Space Knowledge Distillation for Large Language Models. In Proceedings of the Proceedings of the 2024 Conference on Empirical Methods in Natural Language Processing, 2024, pp. 18164–18182.
- Kim, S.; et al. DocKD: Knowledge Distillation from LLMs for Open-World Document Understanding Models. In Proceedings of the Proceedings of the 2024 Conference on Empirical Methods in Natural Language Processing, 2024, pp. 3167–3193.
- Shum, K.; et al. FIRST: Teach A Reliable Large Language Model Through Efficient Trustworthy Distillation. In Proceedings of the Proceedings of the 2024 Conference on Empirical Methods in Natural Language Processing, 2024, pp. 12609–12622.
- Sun, J.; Zhang, H.; Lin, C.; Su, X.; Gong, Y.; Guo, J. APOLLO: An Optimized Training Approach for Long-form Numerical Reasoning. In Proceedings of the Proceedings of the 2024 Joint International Conference on Computational Linguistics, Language Resources and Evaluation (LREC-COLING 2024); Calzolari, N.; Kan, M.Y.; Hoste, V.; Lenci, A.; Sakti, S.; Xue, N., Eds., Torino, Italia, 2024; pp. 1370–1382.
- OpenAI. GPT-4 Technical Report. CoRR 2023, abs/2303.08774.
- Chen, W.; Ma, X.; Wang, X.; Cohen, W.W. Program of Thoughts Prompting: Disentangling Computation from Reasoning for Numerical Reasoning Tasks. Transactions on Machine Learning Research 2023. [CrossRef]
Figure 1.
Overview of the FinQA-PKD framework. The system comprises three synergistic components: (1) Finance-Aware Difficulty Evaluator quantifies sample complexity across four dimensions to organize progressive training; (2) Numerical Reasoning Enhancement Module improves computational precision through triplet embeddings, chain decomposition, and formula verification; (3) Domain-Adaptive Selective Knowledge Distillation transfers teacher knowledge based on confidence and disagreement criteria. Training proceeds in two stages: Stage 1 builds foundation on 80.5% easier samples, and Stage 2 achieves full mastery on complete data with numerical enhancement and optional distillation.
Figure 1.
Overview of the FinQA-PKD framework. The system comprises three synergistic components: (1) Finance-Aware Difficulty Evaluator quantifies sample complexity across four dimensions to organize progressive training; (2) Numerical Reasoning Enhancement Module improves computational precision through triplet embeddings, chain decomposition, and formula verification; (3) Domain-Adaptive Selective Knowledge Distillation transfers teacher knowledge based on confidence and disagreement criteria. Training proceeds in two stages: Stage 1 builds foundation on 80.5% easier samples, and Stage 2 achieves full mastery on complete data with numerical enhancement and optional distillation.
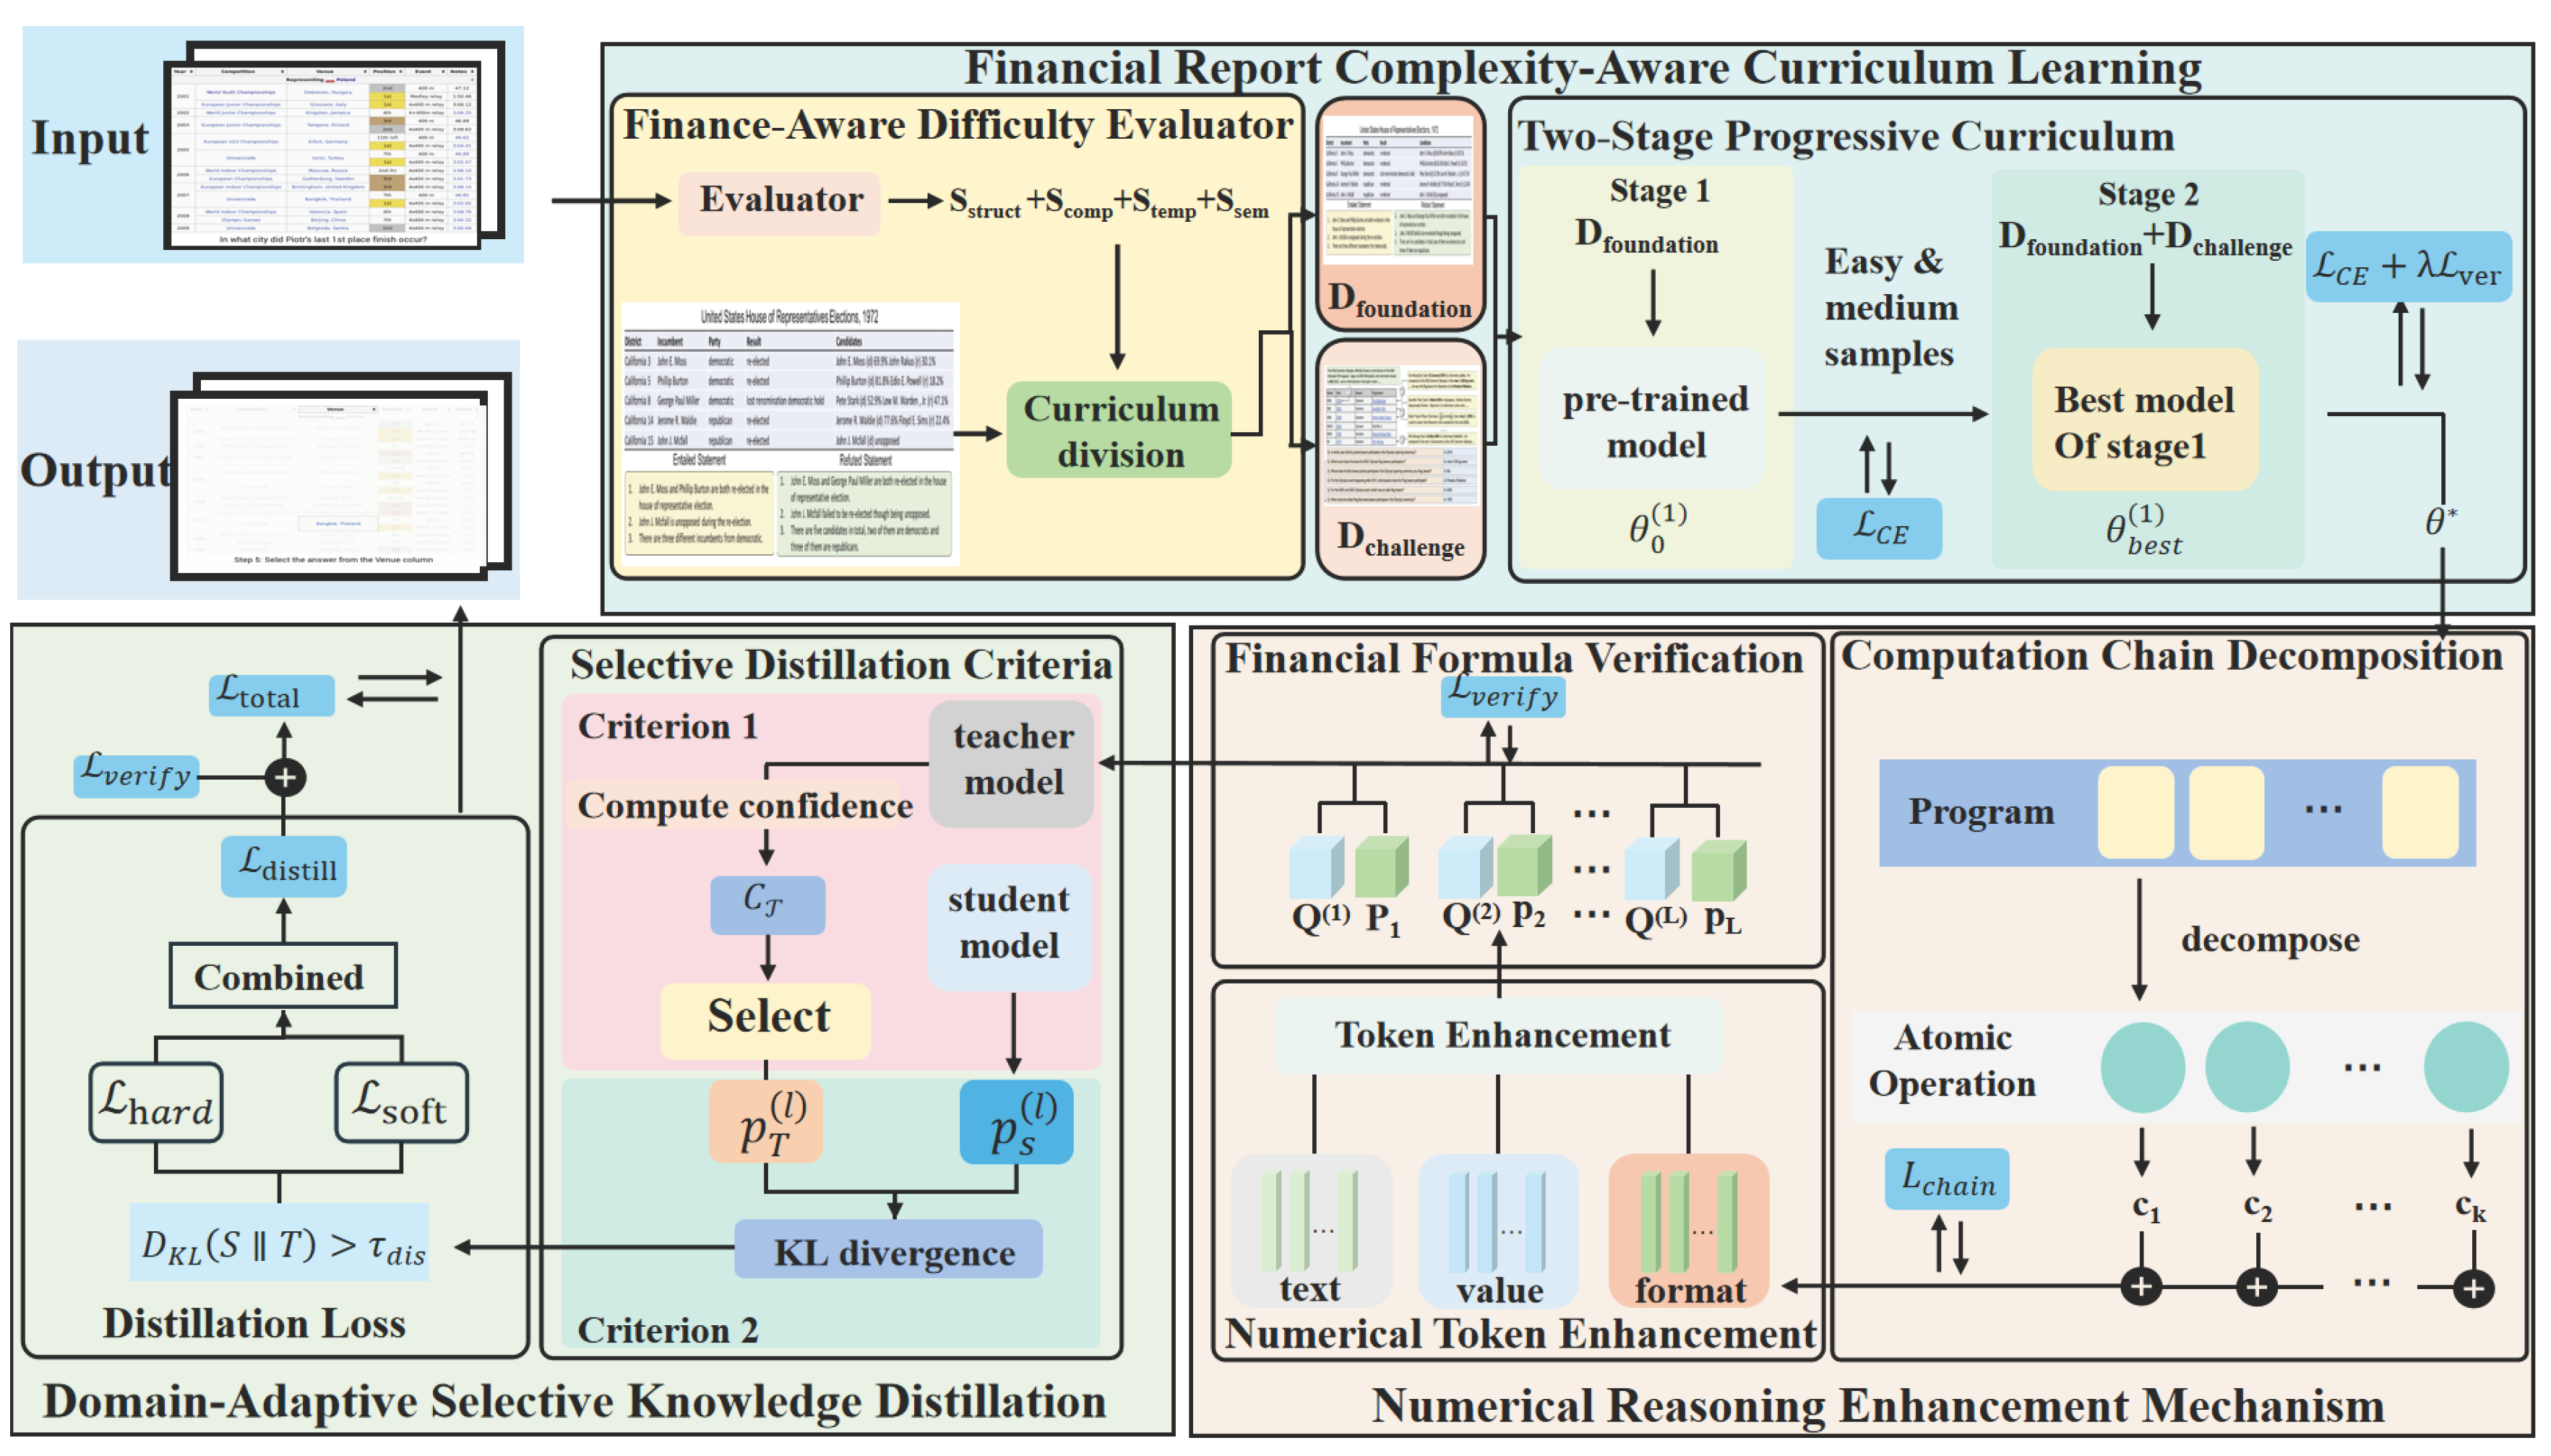

Table 1.
Main results on the FinQA test set. Accuracy is reported as a percentage (%). Bold indicates the best performance within each category.
Table 1.
Main results on the FinQA test set. Accuracy is reported as a percentage (%). Bold indicates the best performance within each category.
| Method | Params | Exe Acc | Prog Acc |
|---|---|---|---|
| FinQA Baselines | |||
| Retriever + NeRd | 110M | 48.57 | 46.76 |
| FinQANet (RoBERTa-large) | 355M | 61.24 | 58.86 |
| Ensemble Methods | |||
| TabT5 | ~770M | 70.79 | 68.00 |
| APOLLO | ~710M | 71.07 | 68.94 |
| Large Language Models (LLMs) | |||
| GPT-3.5-turbo | 175B | 48.56 | - |
| Program-of-Thought (GPT-3) | 175B | 68.10 | - |
| GPT-4 | ~1.7T | 68.79 | - |
| Our Approach | |||
| FinQA-PKD (Stage 1) | 355M | 58.15 | 55.45 |
| FinQA-PKD (Stage 1+2) | 355M | 61.81 | 59.55 |
| FinQA-PKD (Full) | 357M | 62.68 | 59.72 |
Table 2.
Ablation study on FinQA test set
| Configuration | Exe Acc (%) | Prog Acc (%) |
|---|---|---|
| FinQA-PKD (Full) | 62.68 | 59.72 |
| w/o Curriculum Learning | 61.81 | 58.85 |
| w/o Numerical Reasoning | 62.07 | 59.02 |
| w/o Selective Distillation | 62.25 | 59.20 |
Table 3.
Performance progression across training stages on FinQA test set
| Training Configuration | Exe Acc | Prog Acc |
|---|---|---|
| Stage 1 only (Foundation) | 58.15 | 55.45 |
| Stage 1+2 (no NR) | 61.81 | 59.55 |
| Stage 1+2 + NR | 62.25 | 59.20 |
| Stage 1+2 + NR + Distill (Full) | 62.68 | 59.72 |
Table 4.
Knowledge distillation sensitivity to Temperature T
| Temperature T | Exe | Rate |
|---|---|---|
| 2.0 | 62.42 | 59.45 |
| 4.0 | 62.68 | 59.72 |
| 6.0 | 62.16 | 59.29 |
| 8.0 | 61.46 | 58.24 |
Table 5.
Knowledge distillation sensitivity to Balance Weight
| Balance Weight | Exe | Rate |
|---|---|---|
| 0.3 | 62.68 | 59.72 |
| 0.4 | 61.55 | 59.11 |
| 0.5 | 61.81 | 59.02 |
| 0.6 | 61.73 | 58.67 |
Table 6.
Knowledge distillation sensitivity to Confidence
| Confidence | Exe | Rate |
|---|---|---|
| 0.5 | 62.42 | 59.46 |
| 0.6 | 62.34 | 59.20 |
| 0.7 | 62.68 | 59.72 |
| 0.8 | 62.17 | 59.98 |
Table 7.
Knowledge distillation sensitivity to Disagreement
| Disagreement | Exe | Rate |
|---|---|---|
| 0.1 | 61.46 | 58.85 |
| 0.2 | 61.99 | 59.02 |
| 0.3 | 62.68 | 59.72 |
| 0.4 | 61.38 | 58.33 |
Table 8.
Case study examples from FinQA test set showing generated programs
| Complexity | Question | FinQA-PKD |
|---|---|---|
| Easy | what is the change in net income from cumulative effect of adoption? | add(30, 1) |
| Answer: 31 | Result: 31.0 | |
| Easy | what is the net change in the balance of employee separations liability during 2004? | subtract(665, 2239) |
| Answer: -1574 | Result: -1574.0 | |
| Medium | what was the average cost per share for the share repurchases in 2012? | divide(92, 1) |
| Answer: 92 | Result: 92.0 | |
| Medium | what is the total research and development for the year 2014 through 2016 in millions | add(78, 119), add(#0, 86) |
| Answer: 283 | Result: 283.0 | |
| Hard | what would the cash expense for product warranties be in 2007 if the amounts increased the same percentage as in 2006 ( in millions ) ? | divide(5, 4), multiply(#0, 5) |
| Answer: 6.25 | Result: 6.25 | |
| Hard | for the vivo acquisition how many of the allowed towers were actually purchased under the final amended purchase agreement? | add(800, 700), add(#0, 192), add(#0, 300), divide(#1, #2) |
| Answer: 94% | Result: 0.94 |
Table 9.
Error analysis on failed cases from the FinQA test set, highlighting distinct failure modes.
Table 9.
Error analysis on failed cases from the FinQA test set, highlighting distinct failure modes.
| Error Type | Question | FinQA-PKD |
|---|---|---|
| Scaling & Unit Error | what amount of interest expense was avoided per year by switching the 4.50% notes with the 4.25% notes? Gold Answer: 1,000,000 | subtract(4.50, 4.25), multiply(#0, 400.0), multiply(#1, const_1000000)Our Result: 100,000,000.0 |
| Aggregation Error | what was the average basic net income available for common shareholders from 2006 to 2008 in millions? Gold Answer: 139,801 | add(56616, 217692), add(145095, #0), add(#1, const_3), divide(#2, const_2)Our Result: 209,703.0 |
Disclaimer/Publisher’s Note: The statements, opinions and data contained in all publications are solely those of the individual author(s) and contributor(s) and not of MDPI and/or the editor(s). MDPI and/or the editor(s) disclaim responsibility for any injury to people or property resulting from any ideas, methods, instructions or products referred to in the content. |
© 2025 by the authors. Licensee MDPI, Basel, Switzerland. This article is an open access article distributed under the terms and conditions of the Creative Commons Attribution (CC BY) license (http://creativecommons.org/licenses/by/4.0/).
Copyright: This open access article is published under a Creative Commons CC BY 4.0 license, which permit the free download, distribution, and reuse, provided that the author and preprint are cited in any reuse.