Submitted:
05 November 2025
Posted:
06 November 2025
You are already at the latest version
Abstract
In the following we integrate and place in cutting-edge, scientific and technological contexts, the approaches and discoveries of our collaboratory, a meta-laboratory comprising cross-disciplinary collaborations across laboratories at fourteen different universities and clinics in seven different countries with a shared lead investigator. By integrating insights from four decades of research and discovery, applied across cell types and different tissues, organ systems and organisms, we have aimed to elucidate the interplay between movement of organisms and physiology of their tissues, organs and organ systems’ resident cells. We highlight the promise of increasing imaging and computing power as well as machine learning/artificial intelligence approaches, to delineate the Laws of Biology. Codifying these laws will provide a foundation for the future, to promote not only discovery of underpinning mechanisms but also sustainability of our natural resources, from our brains to our bones, which serve as veritable “hard drives”, physically rendering a lifetime of cellular experiences and millennia of evolution.
Keywords:
cell biophysics
; tissue genesis
; ontogeny and phylogeny
; multiscale mechanophysiology
; physiology models
; development
; evolution
1. Tissue Genesis as a Biological Scaling Algorithm
Remarkable spatial and temporal biological scaling algorithms present throughout the lifecycle of cells and the organisms they inhabit (typically, 80 days–400 years, depending on vertebrate species), as well as the evolution of those organisms over millennia [1]. Cells do the work of postnatal healing, which itself recapitulates prenatal development; both cellular processes recapitulate evolutionary biological algorithms to create, pattern and scale up tissue templates [1,2,3,4,5]. In a skeletal context, in utero bone formation and postnatal bone healing occur either indirectly via endochondral ossification, where a cartilage template (Anlage) forms and mineralizes to form skeletal elements, i.e., “inside—out”, or directly via intramembranous ossification, i.e., “outside—in” and remodeling (osteoclastic resorption followed by osteoblastic infilling of the resulting cutting cones, Figure 1A,B) [3].
The algorithms for prenatal skeletal development recapitulate throughout postnatal healing, although at diminished capacity. For example, tendons cut in utero retain the capacity to heal before but not after birth. In contrast, the bridging of large bony defects due to trauma can occur both via postnatal endochondral ossification, where a soft callous forms and mineralizes over time, or via direct intramembranous bone formation (Figure 1C) [2,3,4,5,6,7,8,9]. The mode and spatiotemporal patterns of bone healing and ossification underpin the emergence of tissue architecture, from the molecular to the cellular and tissue length scales, in health and disease [2,3,4,5,6,7,8,9].
2. Lifecycle of the Organism and Its Inhabitant Cells
2.1. Interdependence of Movement, Growth, Remodeling and Life
Throughout life, movement ties directly to cell viability and tissue growth/remodeling and vice versa. Lack of appropriate biophysical cues can result in devastating congenital defects such as hypoplastic left heart syndrome, where half of the heart does not develop, due to putative lack of mechanical input (flow) at earliest stages of heart and circulatory system development [4,11,12]. The mechanoadaptation feedback loop comprises force balances and mechanotransduction linking organismal scale events such as movement to cell scale events of detecting matrix damage, as well as tissue building and remodeling (Figure 2A) [8]. As organisms age, this feedback loop becomes less efficient as do the cellular builders and adaptors of tissue and the cellular modulators of metabolic function. Hence, effects of aging and disease become apparent at all physiological length scales (Figure 2B).
2.2. Epidemiology of Cell|Tissue|Organ|Human|Population Health
Ultimately, we aim to predict changes in health and emergence of disease at earliest possible timepoints, both to prevent disease onset as well as to ensure best possible therapeutic outcomes. At the start of our collaboratory’s work, our goal was to tie organism level physical loading and physiology to cell scale events, but many methods needed to be developed and computational as well as imaging power were at the time in their nascency. It would take decades of technological developments, in parallel with novel experimental and computational approaches, to begin to reach our goal of establishing a new cell epidemiology approach to understanding human health and disease.
3. Movement-Induced Deformation of Tissues and Their Resident Cells Drives Growth and Adaptation
3.1. Pioneering Studies on the Cellular Strain of Mechanical Loading
In the 1970s Lanyon and his protegé Goodship‡led the field by implementing experimental mechanics approaches in in vivo human (single subject), porcine and ovine models. Their early pioneering studies were designed to measure for the first time loading-induced bone surface deformations in situ and to probe effects of mechanical loading in functional adaptation of bone [15,16,17]. A decade later, Lanyon and Rubin developed the so-called “functionally isolated turkey ulna model”, the first in a series of experimental models designed to elucidate loading “doses” which could be prescribed to prevent disuse osteopenia or to accrue bone in a directed way. A compelling aspect of the turkey ulna model data was that as few as four cycles per day of a compressive load imbuing circa 2000 microstrain could maintain bone (prevent loss of bone due to disuse), with increasing cycles up to 36 or more per day increasing bone mass over time. [18,19] These compelling studies inspired a generation of scientists to seek out cellular mechanisms of bone density maintenance and bone growth as well as to define exercise protocols to maintain bone and prevent disuse osteopenia.
‡Professor Allen Goodship passed in April 2025.
3.2. Mechanical Loading-Enhanced Perfusion of Bone and Its Resident Cells
Indeed, movement induces both volume- (dilatational) and shape-changing (deviatoric) stresses across length scales, effectively pumping fluids through poroelastic tissues while also straining the tissues themselves. At the start of our collaboratory’s studies, little was known about the fluid component of bone nor the role of mechanical loading in enhancing fluid flow and thereby mechanical cues as well as (convective) molecular transport to and from osteocytes. Piekarski and Munro proposed the concept that physiological loading would likely increase molecular transport to and from osteocytes embedded in mineralized matrix, using a highly idealized two-dimensional schematic of an osteon to demonstrate their hypothesis [20]. Only through integration of data from different experimental, physical and computational models could a more comprehensive picture of fluid flow in porous bone be discovered.
Hence, inspired by the work of Lanyon and colleagues, as well as Piekarski and Munro, our collaboratory developed and tested different, intersecting in vivo, ex vivo, and in vitro experimental models and computational approaches to link organism- to organ- to tissue-scale movement and forces and induced strains to those experienced at the cell scale. While we highlight some of our collaboratory’s studies here, the field has grown into a robust and rich area of research which goes beyond the scope of this paper.
3.2.1.“. Top—Down” Experimental Mechanics Approaches—In Vivo to Ex Vivo and In Vitro
Top-down approaches start with the entire system (“top” level, maximal complexity), e.g., the organism, working “down” to separate subsystems to address specific components of the whole, allowing for stepwise refinement of understanding with the goal to decipher the complexity. Often, this approach offers a “first pass” to measure unknown parameters and to prioritize hypotheses in otherwise highly complex systems. [21].
We used “top-down” experimental mechanics approaches, guided by Lanyon and collaborators’ fundamental studies [15,16,17,18,19], developing a series of ovine models to test interdependent effects of mechanical loading-induced deformations at organ-tissue-cellular length scales and mechanical loading-enhanced perfusion of bone. Although quadripedal (compared to bipedal humans), sheep (ovine model) share similar anatomy and physiology to humans, across organ systems. Several interlinked models linked mechanical loading effects on tissue deformation to load-induced fluid flow through tissues. First, to understand baseline loading conditions during normal gait, sheep were trained to walk on a treadmill while strains were measured on the anterior surface of the middiaphyseal metacarpus of the forelimb (Figure 3A,D) [22]. These measurements informed the development of two related ex vivo perfusion models where in vivo loading conditions could be replicated while controlling perfusion to the forelimb using microsurgical protocols akin to ex vivo large animal organ/limb transplant models [23,24].
In the first loading—perfusion model, we (Figure 3B) applied compressive loads via Schanz screws inserted proximal and distal to the metaphysis, while perfusing the forelimb with Ringer’s solution and procion red, a fluorescent, small molecular weight tracer [23]. The load application mode of this model mimicked that used by Lanyon and Rubin in their turkey ulna model [18,19], with magnitudes tuned to mimic in vivo walking gaits. We showed, for the first time to our knowledge, that cyclic compressive loading during perfusion enhances molecular transport from the blood supply to osteocytes [23].
In a second ex vivo compression model designed to study mechanotransduction and transport through the synovial joint (radius—metacarpus, Figure 3C), we again applied load mimicking physiological conditions, via the radius, with the hoof fixed in place. Perfusion was controlled in a manner analogous to the previous preparation [23]. We demonstrated that endoprosthetic implantation creates a cell-scale insurmountable gap in transport to the synovial joint and that mechanical loading increases transport beyond baseline diffusion. [24]
Finally, we implemented a novel in vivo imaging model designed to image cell-scale remodeling events in situ using a hollow threaded cylindrical implant designed to offload the bone within while maintaining the blood supply. The implant design allowed for imaging from above using a long working distance lens and a confocal microscope (Figure 4). Osteoclastic resorption was observed in areas predicted using finite element modeling to correspond to areas of bone off-loaded by the surrounding titanium implant ring. While pioneering, the approach proved impractical and the lack of appropriate controls prevented its further development.
3.2.2.“. Bottom-Up” Approaches Using Physical, Virtual and In Silico Models of Pericellular Flow Mechanics and Cell Health
In contrast to the top-down approaches (see above), “bottom-up” approaches start with smaller, less complex components (subsystems) of the larger complex system, such that new understanding of each subsystem can be pieced together to form a basis of understanding for the entire complex system. The bottom-up approach lends itself for mechanistic hypothesis testing, since system components and relevant independent and dependent variables can (typically) be directly measured and/or described, though they often require development and/or application of innovative methods. [21] Indeed, the conceptual jump from organismal movement to tissue to cell-scale elucidation of nano-microscale flow fields and associated drag forces on cell surfaces, as well as convective transport modulated by mechanical loading, necessitated the use of bottom-up approaches.
We developed and validated novel physical and in silico models to understand nano-microscale flow fields around osteocytes in situ. High resolution imaging of osteocyte network volumes, from healthy, osteoporotic and osteoarthritic patients, provided submicron resolution datasets from which we could rapid-prototype inverse physical models from photopolymerizable resins (note: this is now referred to as 3D printing) [25]. In fluid dynamics, similitude theory allows for measurement of flow properties by scaling up of system length scales if fluid viscosity is scaled up by the same amount. By creating inverse physical prototypes 1000 times the size of the microscopic osteocyte network volumes, we could drop a pressure gradient across the volume; using a fluid with 1000 times the viscosity of bone fluid, we could measure permeability of the cellular networks, a critical unknown parameter of the system that had not been measured previously (Figure 5, A1 and A2).
Using the same cellular network datasets, we predicted signal transmission efficiency through the respective cellular networks using both stochastic models (A3,B) and virtual parametric models that enabled assessment of the effect of pericellular matrix (Figure 5, A4). Combined with live-dead assays for cells in live sections of bone, we could predict network transport efficiency loss in transport with loss in cell viability. (Figure 5, A5). [25]
To understand mechanical effects of flow, e.g., fluid drag at osteocyte processes, we needed ultra high resolution (sub-nm) images of the flow channels of the pericellular network. Importing actual 3D geometries from electron microscopy proved ideal for the approach; using nano-microfluidics computational models, we simulated and predicted flow around osteocytes. Interestingly, naturally occurring constrictions in pericellular spaces amplified predicted flow velocities and associated drag on osteocytes, like narrowings in a stream (Figure 5, B) [26].
More recently we used episcopic correlative imaging modalities to image volumes of tissue, from organ to sub-cell length scales in osteoarthritic guinea pig knees. By delivering a mixed molecular weight bolus of molecular tracers via the heart, we discovered that the respective tissues comprising the knee joint act as a molecular sieve. Further, we showed that barrier function at tissue interfaces and transport through the joint was disrupted by co-delivering molecular tracers with tight junction permeability-modulating cytokines. This provided compelling evidence for systemic impacts of immune function on molecular transport between the circulatory and musculoskeletal systems and within the tissue compartments of the synovial joint, both in response to chronic elevation of cytokines (e.g., with osteoarthritis) and in response to acute spikes in cytokines typical of cytokine storms during acute illnesses (Figure 5C). [27,28,29]
3.3. Mechanical Triggers for Stem Cells to Home in on and Heal Injured Tissue After Trauma
In the aforementioned one-stage bone transport surgical procedure developed by Knothe, we tested the capacity of resident stem cells in the periosteum to generate new bone and bridge critical sized bone defects (2.54 cm, considered too large to bridge without surgical intervention) in an ovine femur model. [8,9] Such defects result from trauma, infection and tumor resection.Sheep loaded their bones (stance shift loading) immediately upon recovery from anaesthesia and surgery. We observed an astonishing early activation (within days) of and tissue neogenesis by stem cells which moved from the periosteum to the defect, completely bridging the defect within 16 weeks.
We then aimed to understand the interplay between early mechanical signals, associated with stance shift loading and those associated with periosteal lifting, with the goal to decipher the remarkable intrinsic capacity of periosteum’s resident cells to heal bone. Again, we created an ex vivo loading model to replicate stance shift loading after the one stage bone transport procedure (Figure 6). To measure cell scale strains in resident cells of lifted periosteum during stance shift loading, we rented ultra-high resolution television lenses to record displacements of miniscule markers (spray paint) and to calculate strains at cell length scales using digital image correlation, the first such study of its kind to our knowledge. [30] In parallel we carried out mechanics of materials studies on periosteum (Figure 6D) to measure its modulus of elasticity in the toe region (1.93 MPa) and in the longitudinal (25.67 MPa) and circumferential (4.41 MPa) directions [31] and to measure its shrinkage upon severing Sharpey’s fibers that attach periosteum to all bone surfaces [31,32,33]. With this data, we could calculate the endogenous prestress in periosteum, where the periosteum from the anterior of the skeletally mature ovine femur exhibits 12.06–0.40 MPa longitudinal prestress and 0.77–0.43 MPa circumferential prestress [31,32,33]. To better understand the mechanistic interplay between cellular and biochemical modulating factors in periosteum-mediated tissue genesis and healing, we developed a mathematical model, coupling finite element methods (mechanics) with cell dynamics modeling to simulate the clinical scenario and to predict parameters which promote healing [34].
These cell-tissue experimental and computational mechanics studies yielded unprecedented insights into the intrinsic pre-/residual stresses in periosteum. This knowledge, together with a later live imaging study of periosteum, was essential to understand how the stress state of periosteum could trigger resident, quiescent stem cells to detach from the cambium layer to home in on and heal critical sized bone defects (Figure 6). In the latter study, we prepared samples of ovine periosteum analogous to the in vivo one stage bone transport surgery and the ex vivo mechanical testing studies, either retaining the intrinsic prestress with Sharpey’s fibers intact or severing those fibers for periosteal lifting. Using multiphoton imaging at high resolution, we measured the crimp of the collagen to which quiescent mesenchymal stem cells of the periosteum adhere, before and after periosteal lifting (severing of the Sharpey’s fibers that attach periosteum to bone surfaces like velcro). In this way we showed, for the first time to our knowledge, that the collagen crimp increased with release of the Sharpey’s fibers (Figure 6C1, intact—Figure 6C3, severed), and that the release of prestress resulted in a physical rounding up of the cells themselves, a trigger to detach and ingress into the defect to initiate regeneration and healing. [35]
4. Work and Energy Transfer of Development and Healing
4.1. The Work of Living, from Organisms to Cells
Every movement of the human body and every process within the body recycles (transfers) energy in a(n imperfectly) sustainable way, across length and time scales, until end of the life cycle (Figure 2A) [11]. While work is defined as the energy transferred to or from an object as a force is exerted over a distance, only recently has the concept been applied to cells and cellular work of mechanoadaptation [2], where the term virtual work has been introduced.
During movement, internal and external forces are transferred across multiple length scales (left, Figure 2A) while tissues adapt to the dynamic mechanical environment (right, Figure 2A). Together, the transfer of force from the environment, and subsequent structure-function adaptation of the system constitute the dynamic process of functional adaptation, also referred to as mechanoadaptation. In an engineering context, a control volume delimits the system of interest to enable, e.g., the tracking of work done on the control volume and energy crossing system boundaries. At each relevant length scale, i.e., cell to tissue to organ to system, energy is transferred. At the length scale of the organism and its organ systems, exercise regimes represent a form of work to train the cardiovascular and musculoskeletal systems. At the length scale of, e.g., a stem cell, work deforms the cell and entrains the cell over time, resulting in lineage commitment [2].
Interestingly, adaptive responses to decrease and increased loading, i.e., below and above baseline, also cross length scales. For example, offloading an area of tissue with a relatively stiffer implant (e.g., stainless steel has a higher elastic modulus than bone) results in not only a change to the mechanical milieu of cells residing in the tissue but also to the local perfusion of the tissue, e.g., via obstruction of blood vessels via the impland and/or via reduced load-induced fluid flow. In contrast “overloading” over baseline, e.g., of the radius by resecting the ulna in adult sheep [16], has the opposite effect, resulting in increased density and girth of the radius. Recent studies demonstrate similar effects in stem cells, where “offloading of cells”, e.g., via stiffer local substrates or gels, results in mechanoadaptation at matrix (tissue genesis by cells), cell and subcellular length scales. Similarly, hindering the cells’ capacity to polymerize tubulin, the compression bearing elements of the cytoskeleton, drives mechanoadaptation at the length scale of the cell (Figure 7, see animated version [30]).
Cellular 7. Early cell studies from our collaboratory demonstrated that seeding at increased density (as opposite to proliferating cells to the same density) exerts local compressive forces on cells [40,41,42]. Under such local compression, cell volume could decrease either passively or through activation of ion channels, releasing intracellular fluid to the extracellular matrix. Another alternative via active cell division, the total cellular surface area effectively increases to balance forces once steady state is reached. Alternatively, the cytoskeleton could stiffen, effectively increasing the cell’s capacity to resist compression, thereby balancing forces to reach steady state. If forces are balanced at the cell boundary, even in the presence of local compression, no adaptation is required (Figure 7).
In contrast, under local tension, expansion of cell volume, either passively or through activation of ion channels, provides a mechanism to balance forces. Based on results of the recent experiments [36,37,38,39] carried out in collaboration with protegé, Dr. Vina Putra, this volume expansion leads to nuclear fragmentation due to tension transduced through the cell to the nuclear envelope. A further adaptation alternative is cell division, which provides a means to increase total cell surface area and distribute the forces over a greater area. An additional alternative is for the cytoskeleton to soften, effectively increasing the cell’s capacity to expand under tension and balance forces.
4. Discussion
A series of studies conducted over several decades by a collaboratory including diverse, global university, medical clinic and research institutes demonstrates the power of convergent, interdisciplinary research to understand mechanoadaptation, of organisms, organs, and tissues by their inhabitant cells. The remarkable conservation of adaptation across length scales points to emergent codification of Laws of Biology that will enable future, prospective prescription of exercise regimes, as well as wearable and implantable devices to augment cell to organismal health throughout life.
Intrinsic limitations of each experimental model alone necessitate multipronged approaches, where even the “ideal” approach to image events across length scales in real time (Figure 5) shows limitations with respect to lack of standard scientific controls for all independent variables. Nonetheless, integrating across related studies provides a nuanced perspective of adaptation under conditions significantly more controlled than “real life”, giving a lens through which to reduce complexity.
During the time period of the studies depicted in this paper, ethical considerations and the evolution of science itself have significantly reduced the use and societal acceptance of animal models. Indeed, technological advances may provide superior alternatives going forward where organismal to cell-scale events will be observable in real-time and throughout life. Certainly, with rapid developments in machine learning and artificial intelligence, more practical limitations of the scientific and experimental approaches are being recognized, which also will increase efficiency and decrease intrinsic (and until recently underappreciated) bias going forward, e.g., of in vitro approaches [43].
5. Conclusions
Examination of a series of independent yet related studies carried out by a meta-laboratory with a shared lead investigator (MLKT) and lead surgeon (Dr. Ulf Knothe) demonstrates the interplay between movement of organisms and physiology of their tissues, organs and organ systems’ resident cells. Taken together, the work highlights the promise of increasing imaging and computing power as well as machine learning/artificial intelligence approaches, to predict emergent behavior and thereby delineate the Laws of Biology. Codifying these laws will provide a foundation for the future, to promote not only discovery of underpinning mechanisms but also sustainability of our natural resources, from our brains to our bones, which serve as veritable “hard drives”, physically rendering a lifetime of cellular experiences and millennia of evolution.
6. Patents
[A] Knothe Tate, M.L.; Lin, M. Priority 2021-04-22, Filed 2022-04-22, Published 2024-06-27. Dynamic body part simulator. US AU US20240212526A1.
[B] Knothe Tate, M.L. Priority 2020-03-03, Filed 2021-03-03, Published 2023-01-11. Mechanoactive materials and uses thereof. US AU US20240212526A1.
[C] Knothe Tate, M.L. Priority 2018-05-04, Filed 2019-05-07, Published 2021-03-10. Smart composite textiles and methods of forming. EP US AU EP3787893A1.
[D] Knothe Tate, M.L. Priority 2015-06-15, Filed 2021-08-27, Published 2021-09-23. Engineered materials and methods of forming.
[E] Knothe Tate, M.L. Priority 2013-08-16, Filed 2014-08-15, Published 2016-08-24. A substrate. WO EP US AU EP3033057A4
[F] Knothe Tate, M.L.; Knothe, U. Priority 2010-03-05, Filed 2011-03-07, Published 2012-01-12. Granted 2015-03-17. Multilayer surgical membrane. US8979942.
[G] Knothe Tate, M.L.; Anderson, E.J. Priority 2007-04-20, Filed 2008-04-21, Granted 2013-12-17, Published 2013-12-17. Flow directing materials and systems. US8609132B2
[H] Knothe Tate, M.L.; Knothe, U. Priority 2005-05-19, Filed 2003-02-20, Published 2011-02-01. Composition and method for inducing bone growth and healing. US7879107B2.
Funding
This research was funded by the Swiss National Science Foundation, the AO ASIF Research Fund, the Whitaker Foundation, the Wallace H. Coulter Foundation, the Christopher Columbus U.S. Chamber of Commerce, the U.S. National Science Foundation, the National Institutes for Health, the Alexander von Humboldt Foundation, the National Health and Medical Research Council (Australia), and the Paul Trainor Foundation.
Data Availability Statement
Data archives are available on blueinnovations.org. Datasets can be made available upon request to the corresponding author.
Acknowledgments
I am grateful for the international education and training and collaboration opportunities I have had, at the intersection of engineering and medicine and science, as well as the liberal arts. My appreciation for my mentors (in chronological order), Frau Ellen McQueary, Mrs. Jewell West Alexander, Professor Dennis Carter, Professor Stephan Perren, Professor Peter Niederer, Professor Hunter Peckham, Professor Chris Roberts, and for my protegés, in particular those who contributed to the work presented in this manuscript—in order of presentation, Dr. Joanna Ng, Dr. Roland Steck, Dr. Christian Gatzka, Professor Sara McBride-Gagy, Ms. Sarah Evans (whose masters project constituted a Ph.D. worth of work), Professor Eric J. Anderson, Dr. Lucy Ngo, Dr. Nicole Yu, Dr. Shannon Moore, and Dr. Vina Putra), and for the lab technicians and imaging center staff and colleagues at Zeiss Microscopy GmBH (Dr. Dirk Zeidler in particular). Finally, I am thankful to the purpose that pursuit of discovery has given me and to the doors that science has opened for me. Discovery requires openness to new ideas and people and places and ways of thinking—at the same time, discovery provides a key to open all doors, to tear down all barriers to independent thought and freedom, free from bias and preconceived notions.
Conflicts of Interest
The author is a director, founder, and co-founder of several start-up companies and a not-for-profit research and development institute. The data and concepts presented in the current manuscript are fundamental in nature. They underpin numerous intellectual property (patent) applications (see above, 6. Patents). The patents are listed as per MDPI guidelines, but are not described in the manuscript.
References
- Knothe Tate, M.L.; Srikantha, A.; Wojek, C.; Zeidler, D. Connectomics of Bone to Brain-Probing Physical Renderings of Cellular Experience. Front Physiol. 2021, 12, 647603. [CrossRef]
- Knothe Tate, M.L.; Gunning, P.W.; Sansalone, V. Emergence of Form from Function—Mechanical Engineering Approaches to Probe the Role of Stem Cell Mechanoadaptation in Sealing Cell Fate. Bioarchitecture 2016, 6, 85-103. [CrossRef]
- Evans, S.F.; Docheva, D.; Bernecker, A.; Colnot, C.; Richter, R.P.; Knothe Tate, M.L. Solid-supported lipid bilayers to drive stem cell fate and tissue architecture using periosteum derived progenitor cells. Biomaterials 2013, 34, 1878-1887. [CrossRef]
- Knothe Tate, M.L.; Falls, T.D.; McBride, S.H.; Atit, R.; Knothe, U.R. Mechanical modulation of osteochondroprogenitor cell fate. Int J Biochem Cell Biol 2008, 40, 2720-38. [CrossRef]
- Mishra, S.; Knothe Tate, M.L. (2003) Effect of lacunocanalicular architecture on hydraulic conductance in bone tissue: implications for bone health and evolution. Anat Rec A Discov Mol Cell Evol Biol. 273(2):752-62. [CrossRef]
- Knothe Tate, M.L. Multi-scale computational engineering of bones: state of the art insights for the future. In: Bronner, F.; Farach-Carson, C.; Mikos, A., editors. Engineering of functional skeletal tissues, 10. London: Springer-Verlag; 2007. p. 141e60 [Chapter 10].
- Knothe Tate, M.L.; Tami, A.E.G.; Bauer, T.W.; Knothe U. (2002) Micropathoanatomy of Osteoporosis—Indications for a Cellular Basis of Bone Disease, Advances in Osteoporotic Fracture Management, 2(1): 9-14.
- Knothe Tate, M.L.; Ritzman, T.F.; Schneider, E.; Knothe, U.R. (2007) Testing of a new one stage bone-transport surgical procedure exploiting the periosteum for the repair of long-bone defects. J Bone Jt Surg Am 89, 307e16.
- Knothe, U.R.; Springfield, D.S. (2005) A novel surgical procedure for bridging of massive bone defects. World J Surg Onc.
- Knothe, U.R.; Dolejs, S.; Miller, R.M.; Knothe Tate, M.L. Effects of mechanical loading patterns, bone graft, and proximity to periosteum on bone defect healing. J Biomech 2010, 43, 2728e37.
- Ng J.L.; Kersh, M.E.; Kilbreath, S.; Knothe Tate, M. Establishing the Basis for Mechanobiology-Based Physical Therapy Protocols to Potentiate Cellular Healing and Tissue Regeneration. Front Physiol 2017, 6, 8:303. [CrossRef]
- Grossfeld, P. (2007) Hypoplastic left heart syndrome. Circulation Research 100(9). [CrossRef]
- Knothe Tate, M.L.; Zeidler, D.; Pereira, A.F.; Hageman, D.; Garbowski, T.; Mishra, S.; Gardner, L.; Knothe, U.R. (2016) Organ-to-Cell-Scale Health Assessment Using Geographical Information System Approaches with Multibeam Scanning Electron Microscopy, Advanced Healthcare Materials 5, 1581-87. [CrossRef]
- Knothe Tate, M.L. (2017) in A new age in scanning electron microscopy: Applications in the life sciences (Science/ AAAS, Washington, DC, 2017), p. [34-42]. Science. https://www.science.org/do/10.1126/resource.2380976/full/zeiss_booklet_2017_12_05-1714066887033.pdf.
- Lanyon, L.E.; Hampson, W.G.J.; Goodship, A.E.; Shah, J.S. (1975) Bone deformation recorded in vivo from strain gauges attached to the human tibial shaft. Acta orthop. Scand. 46, 256-268.
- Goodship, A.E.; Lanyon, L.E.; McFie, H. (1979) Functional adaptation of bone to increased stress. An experimental study. J Bone Joint Surg Am. 61(4):539-46. [CrossRef]
- Lanyon, L.E.; Goodship, A.E.; Pye, C.J.; MacFie, J.H. (1982) Mechanically adaptive bone remodelling. J Biomech. 15(3),141-54. [CrossRef]
- Lanyon, L.E., Rubin, C.T. (1984) Regulation of bone formation by applied dynamic loads. J Bone Joint Surg Am. 66(3),397-402. https://pubmed.ncbi.nlm.nih.gov/6699056/.
- Rubin, C.T.; Lanyon, L.E. (1985) Regulation of bone mass by mechanical strain magnitude. Calcif Tissue Int. 37(4),411-7. [CrossRef]
- Piekarski, K.; Munro, M. (1977) Transport mechanism operating between blood supply and osteocytes in long bones. Nature 269(5623), 80-2. [CrossRef]
- Knothe Tate, M.L. (2011) Top down and bottom up engineering of bone. J Biomech 44(2):304-12. [CrossRef]
- Steck, R.; Gatzka, C.; Schneider, E.; Niederer, P.; Knothe Tate, M.L. (2003) Measurement of bone surface strains on the sheep metacarpus in vivo and ex vivo. VCOT Archive, 16(1), 38–43. [CrossRef]
- Knothe Tate, M.L.; Knothe, U. (2000) An ex vivo model to study transport processes and fluid flow in loaded bone. J Biomech. 33(2), 247-54. [CrossRef]
- Gatzka, C.; Schneider, E.; Knothe, U.; Niederer, P.; Knothe Tate, M.L. (1999) A novel ex vivo model for investigation of fluid displacements in bone after endoprosthesis implantation. J Mater Sci Mater Med. 10(12), 801-6. [CrossRef]
- Anderson, E.J.; Kreuzer, S.M.; Small, O.; Knothe Tate, M.L. (2008) Pairing computational and scaled physical models to determine permeability as a measure of cellular communication in micro- and nano-scale pericellular spaces . Microfluid Nanofluid 4, 193–204. [CrossRef]
- Anderson, E.J.; Knothe Tate, M.L. (2008) Idealization of pericellular fluid space geometry and dimension results in a profound underprediction of nano-microscale stresses imparted by fluid drag on osteocytes,.
- Journal of Biomechanics, 41, 1736-1746. [CrossRef]
- Ngo, L.; Knothe, L.E.; Knothe Tate, M.L. (2018) Knee Joint Tissues Effectively Separate Mixed Sized Molecules Delivered in a Single Bolus to the Heart. Sci Rep 8, 10254. [CrossRef]
- Ngo, L.; Knothe Tate, M.L. A spike in circulating cytokines TNF-α and TGF-β alters barrier function between vascular and musculoskeletal tissues. Sci Rep 13, 9119 (2023). [CrossRef]
- Ngo, L.; Knothe Tate, M.L. (2025) TGF-beta Increases Permeability of 70 kDa Molecular Tracer from the Heart to Cells of the Osteoarthritic Guinea Pig Knee Joint, Cells 2025, 14(19), 1524. [CrossRef]
- McBride, S.H.; Dolejs, S.; Brianza, S.; Knothe, U.R.; Knothe Tate, M.L. (2011) Net change in periosteal strain correlataes to rapid de novo bone generation in critical sized defects. Annals of Biomedical Engineering 39(5), 1570–1581. [CrossRef]
- McBride, S.H.; Evans, S.F.; Knothe Tate, M.L. (2011) Anisotropic mechanical properties of ovine femoral periosteum and the effects of cryopreservation. J Biomech. 44(10), 1954-9. [CrossRef]
- Evans, S.F.; Parent, J.B.; Lasko, C.E.; Zhen, X.; Knothe, U.R.; Lemaire, T.; Knothe Tate, M.L. (2013) Periosteum, bone’s “smart” bounding membrane, exhibits direction-dependent permeability. J Bone Miner Res. 28(3), 608-17. [CrossRef]
- Evans, S.F.; Chang, H.; Knothe Tate, M.L. (2013) Elucidating multiscale periosteal mechanobiology: a key to unlocking the smart properties and regenerative capacity of the periosteum? Tissue Engineering Part B: Reviews 19.2, 147-159. [CrossRef]
- Moore, S.R.; Saidel, G.M.; Knothe, U.; Knothe Tate, M.L. (2014) Mechanistic, Mathematical Model to Predict the Dynamics of Tissue Genesis in Bone Defects via Mechanical Feedback and Mediation of Biochemical Factors. PLoS Comput Biol 10(6): e1003604. [CrossRef]
- Yu, N.Y.; O’Brien, C.A.; Slapetova, I.; Whan, R.M.; Knothe Tate, M.L. (2017) Live Tissue Imaging to Elucidate Mechanical Modulation of Stem Cell Niche Quiescence. Stem Cells Transl Med. 6(1):285-292. [CrossRef]
- Putra, Vina; Kilian, Kristopher; Knothe Tate, Melissa (2025). Animation 1. AIP Publishing. Media used with permission under original copyright of M.L. Knothe Tate 2023. [CrossRef]
- Putra, V.D.L.; Kilian, K.A.; Knothe Tate, M.L. (2025) Stem cell mechanoadaptation. I. Effect of microtubule stabilization and volume changing stresses on cytoskeletal remodeling, APL Bioengineering, 9. [CrossRef]
- Putra, V.D.L.; Kilian, K.A.; Knothe Tate, M.L. (2025) Stem cell mechanoadaptation. II. Microtubule stabilization and substrate compliance effects on cytoskeletal remodeling’, APL Bioengineering, 9. [CrossRef]
- Putra, V.D.L.; Kilian, K.A.; Knothe Tate, M.L. (2023) Biomechanical, biophysical and biochemical modulators of cytoskeletal remodelling and emergent stem cell lineage commitment, Communications Biology, 6. [CrossRef]
- McBride, S.H.; Knothe Tate, M.L. (2008) Modulation of stem cell shape and fate A: the role of density and seeding protocol on nucleus shape and gene expression. Tissue Eng Part A. 14(9), 1561-72. [CrossRef]
- McBride, S.H.; Falls, T.; Knothe Tate, M.L. (2008) Modulation of stem cell shape and fate B: mechanical modulation of cell shape and gene expression. Tissue Eng Part A 14(9),1573-80. [CrossRef]
- Zimmermann, J.A.; Knothe Tate, M.L. (2011) Structure-function relationships in the stem cell’s mechanical world A: seeding protocols as a means to control shape and fate of live stem cells. Mol Cell Biomech. 8(4):275-96.
- Mansoury M, Hamed M, Karmustaji R, Al Hannan F, Safrany ST. The edge effect: A global problem. The trouble with culturing cells in 96-well plates. Biochem Biophys Rep. 2021 Mar 25;26:100987. [CrossRef]
Figure 1.
Postnatal bone remodeling and healing. In contrast to prenatal bone formation, via an endochondral template (Anlage) that mineralizes over time or via direct intramembranous bone formation, remodeling and postnatal healing of bone depends on formation of space where new infilling can commence, enabling a reweaving of the bone without formation of mechanically inferior scar tissue. (A,B) Laser confocal imaging of bone remodeling in an adult long (cortical bone) demonstrates an osteoclastic cutting cone in the plane of focus (upper half, left to right), where osteoclasts cut through the dense cortex and osteoblasts (white arrows, B) are in the process of infilling the cone, from the outside inwards. Tissue neogenesis is evident, as the osteoblasts produce new bone matrix, layer by layer, filling inwards like tree rings (see infilled osteon in orthogonal plane, B); the unmineralized bone matrix fluoresces under laser light excitation (A). [6,7] (C) In a one stage bone transport surgical model of a critical sized defect of the femur [8,9], intramembranous bone formation starts nearly immediately in haematoma filled defects. This process is retarded if the defect is packed with cancellous bone graft, because the additional osteoclastic resorption step must take place before osteoblastic infilling can commence. (C, inset) Within three weeks, cambium cells from the periosteum migrate inwards (arrow) from the periosteum, toward the intramedullary nail that stabilizes the bone. First, a disorganized matrix is laid down (red), after which osteoblasts fill in layer by layer (first green, then blue), filling the defect within 16 weeks. [8,9,10] Scale bars indicate 50 microns.
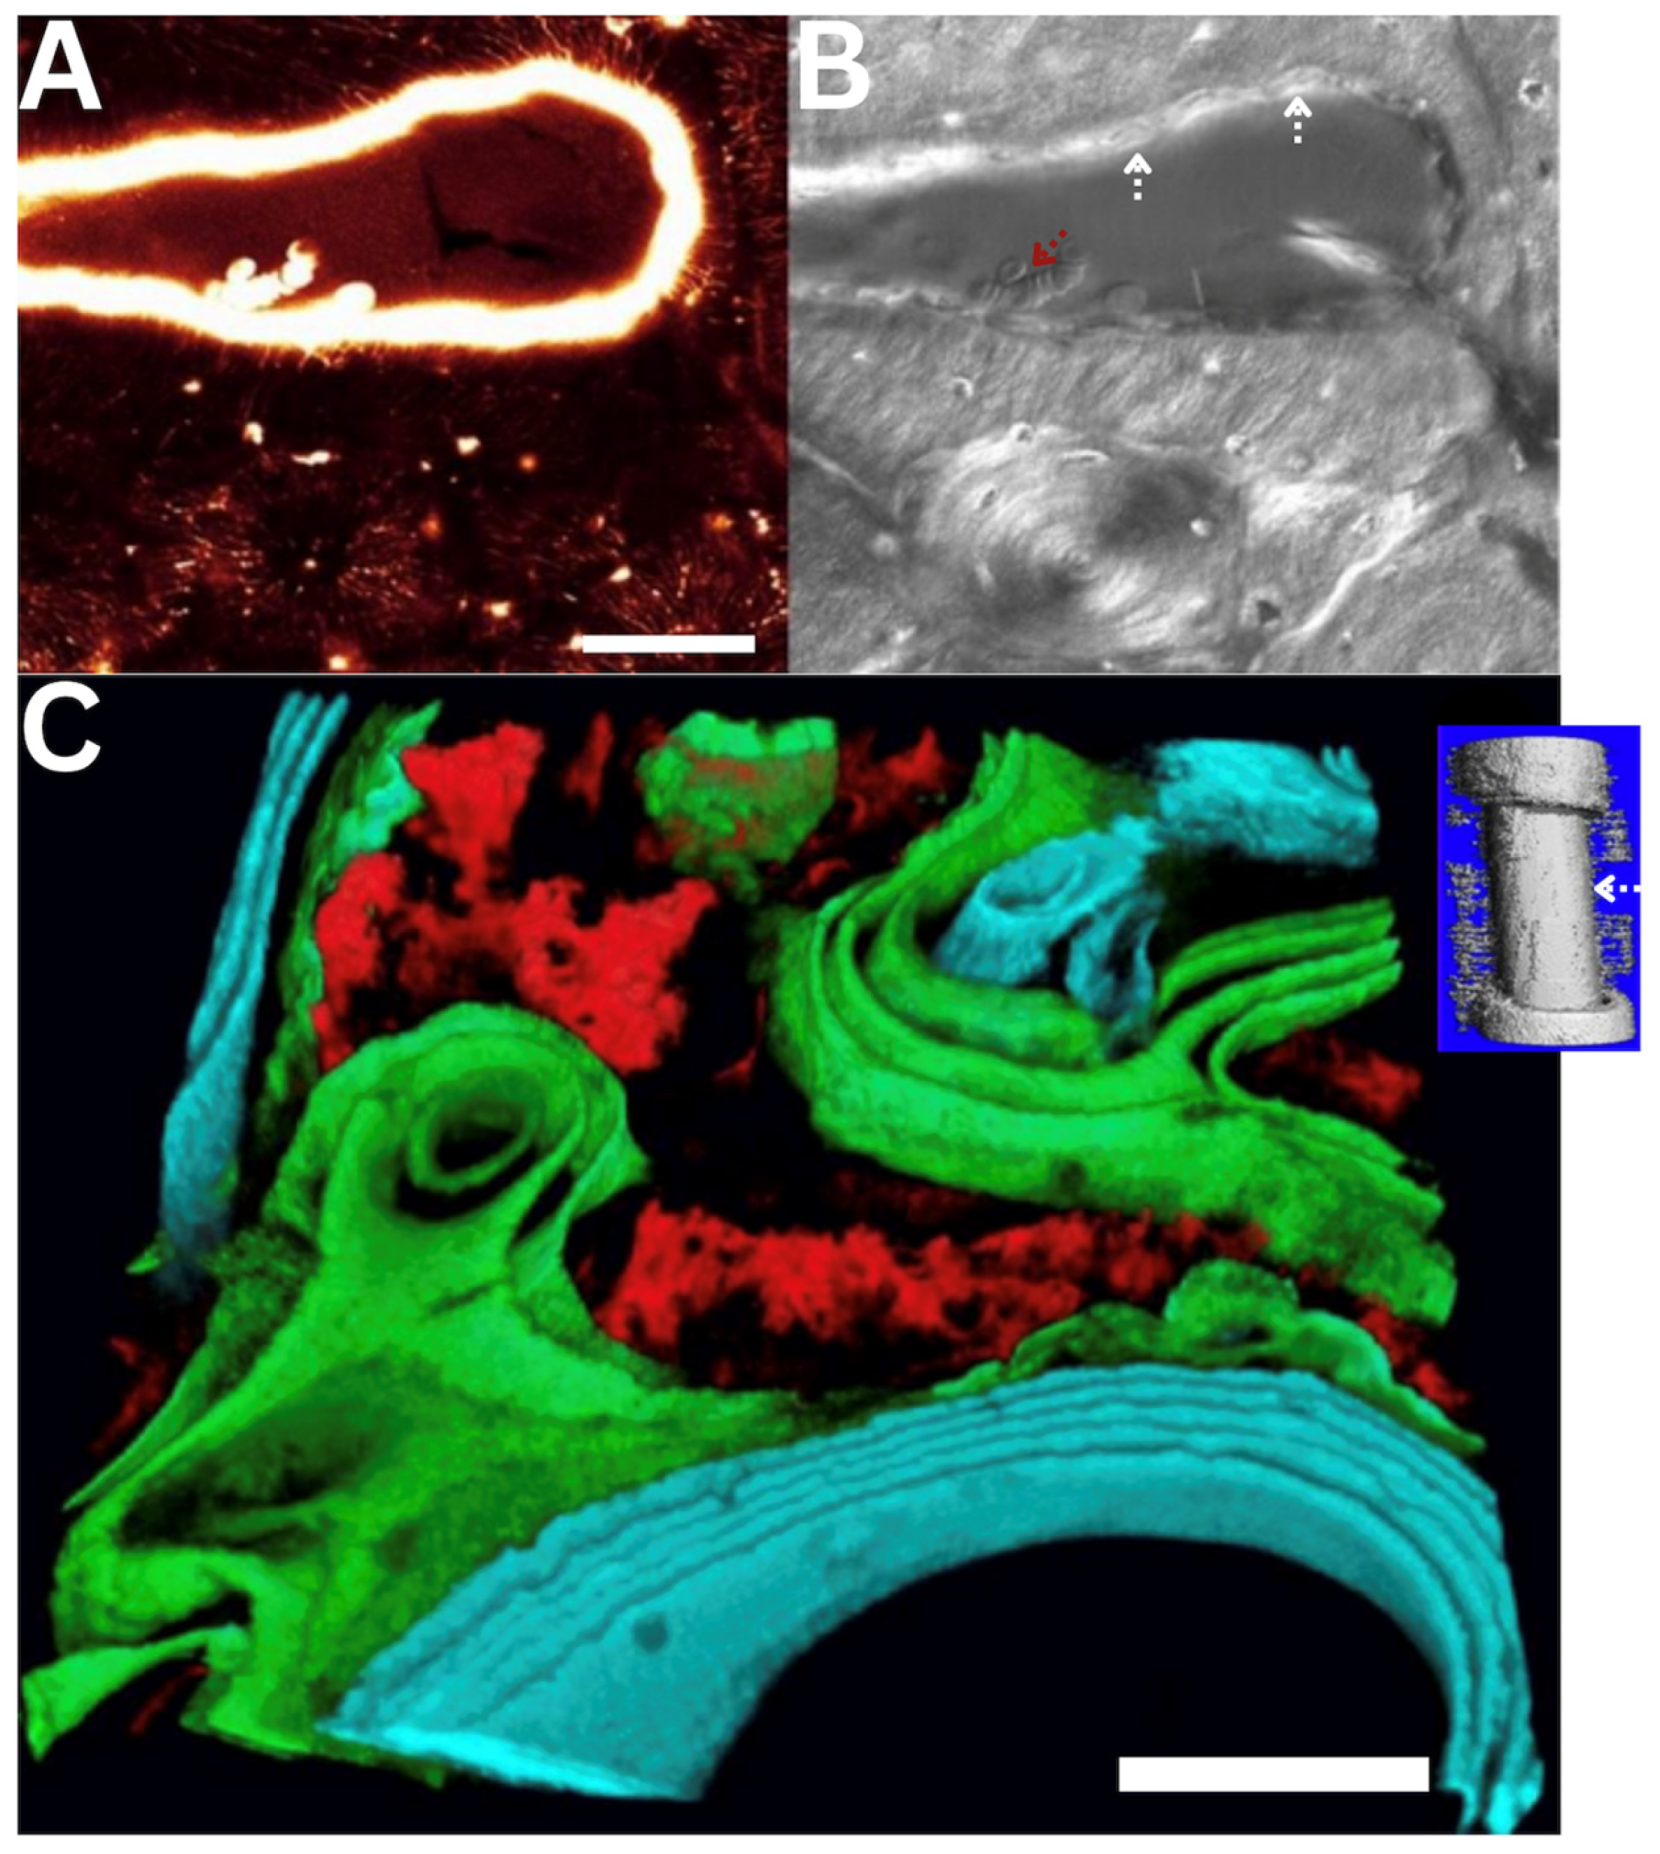
Figure 2.
At different physiological length and time scales of the life cycle, starting with human conception, followed by in utero development, birth and postnatal healing until end of life, work and energy can be considered from the outside—in and the inside—out, from system to organ to tissue to cell. Similarly, novel epidemiological approaches are being applied to predict emergence of disease at earliest stages, in cellular populations within the ecosystems of the organs and tissues making up e.g., skeletal to brain-nervous systems. These interdisciplinary approaches cross length and time scales seamlessly to predict emergent behavior and to probe tissue as a physical rendering of cellular experience throughout the life cycle. [1] (A) Figure adapted from collaboration with Dr. Joanna Ng [11], at University of New South Wales. Epidemiology of cellular health in the osteoarthritic hip of human patients, in collaboration with Dr. Dirk Zeidler at Zeiss Microscopy, Oberkochen, Germany [12,13,14].
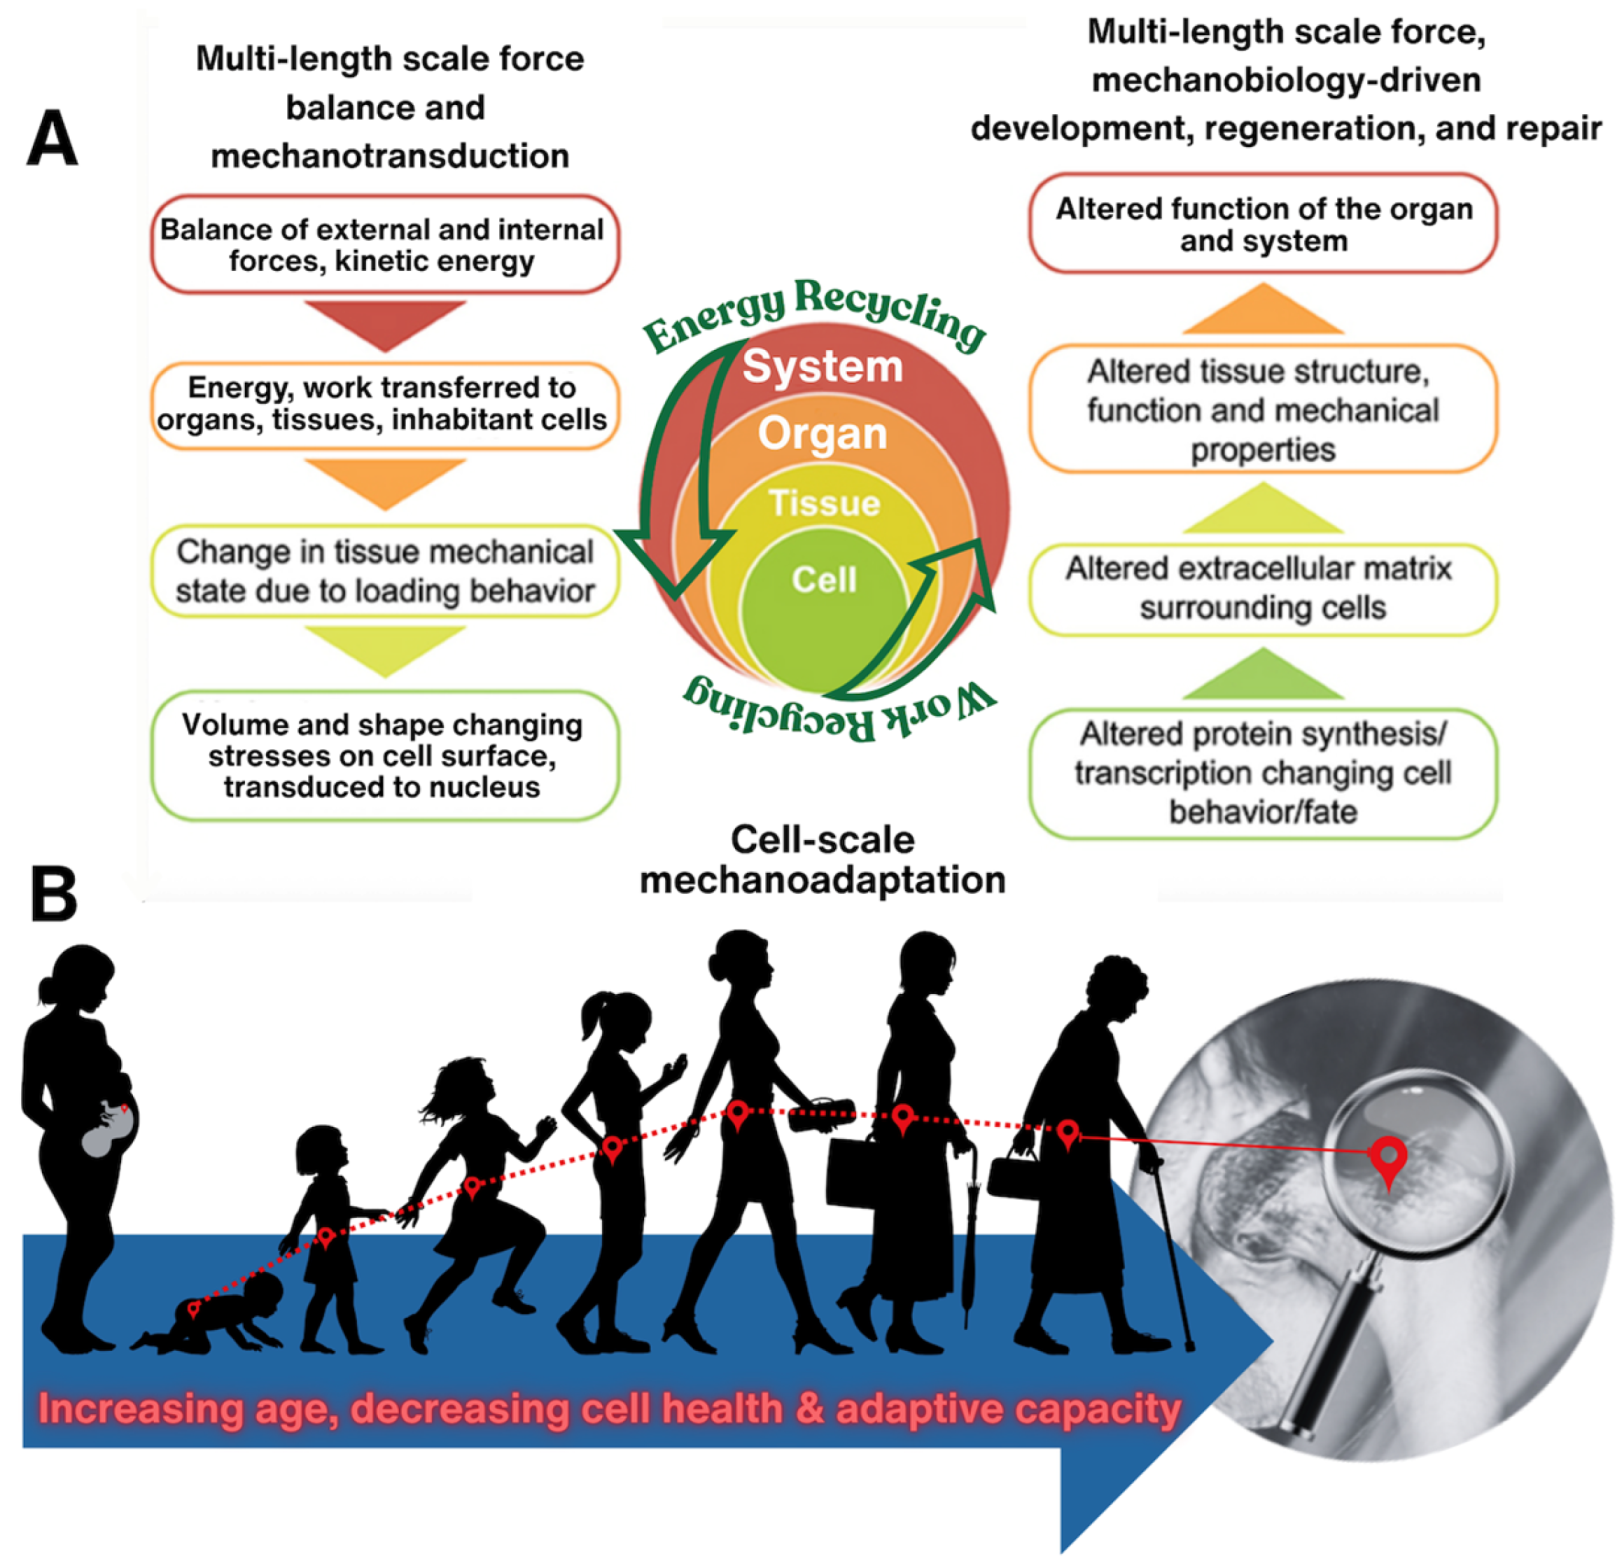
Figure 3.
Tying together mechanical loading effects on tissue deformation to load-induced fluid flow through tissues. (A) Through surgical placement of strain gauges, e.g., on the anterior aspect of the sheep metacarpus, in vivo measurements of strains (D1-D3) induced during normal gait can be measured with minimal confounding factors (in collaboration with Dr. Roland Steck). (B,C) Ex vivo perfusion models enable close replication of in vivo loading condition while allowing for control of perfusion rates and post hoc monitoring of tracer transport at organ to subcellular length scales. Such intertwined approaches have been applied for human transplant medicine as well as to elucidate mechanotransduction and load-induced transport (convection) across length scales. (B) In a compression model designed to study mechanotransduction and transport in the middiaphysis of the metacarpus (compact bone), loading is applied via Schanz screws inserted through the proximal and distal entheses of the metacarpus while perfusion is controlled using microsurgical preparation of a closed loop perfusion system (in collaboration with Dr. Ulf Knothe). (C) In a compression model designed to study mechanotransduction and transport through the synovial joint (radius—metacarpus), load is applied mimicking physiological conditions, via the radius, with the hoof fixed in place. Perfusion is controlled in a manner analogous to the previous preparation (B). (D) The in vivo model provides “near real world” measures of strains (principal strain [D1] and directions [D2] over the gait cycle (time). In general, compressive strain increaases with increasing body mass and rate of walking (D3, negative strain indicative of compression). All experiments depicted in this figure were conducted at the AO Research Institute in Davos, Switzerland, with IACUC approvals under the guidance of the Canton of Grisons, 1989–2009.
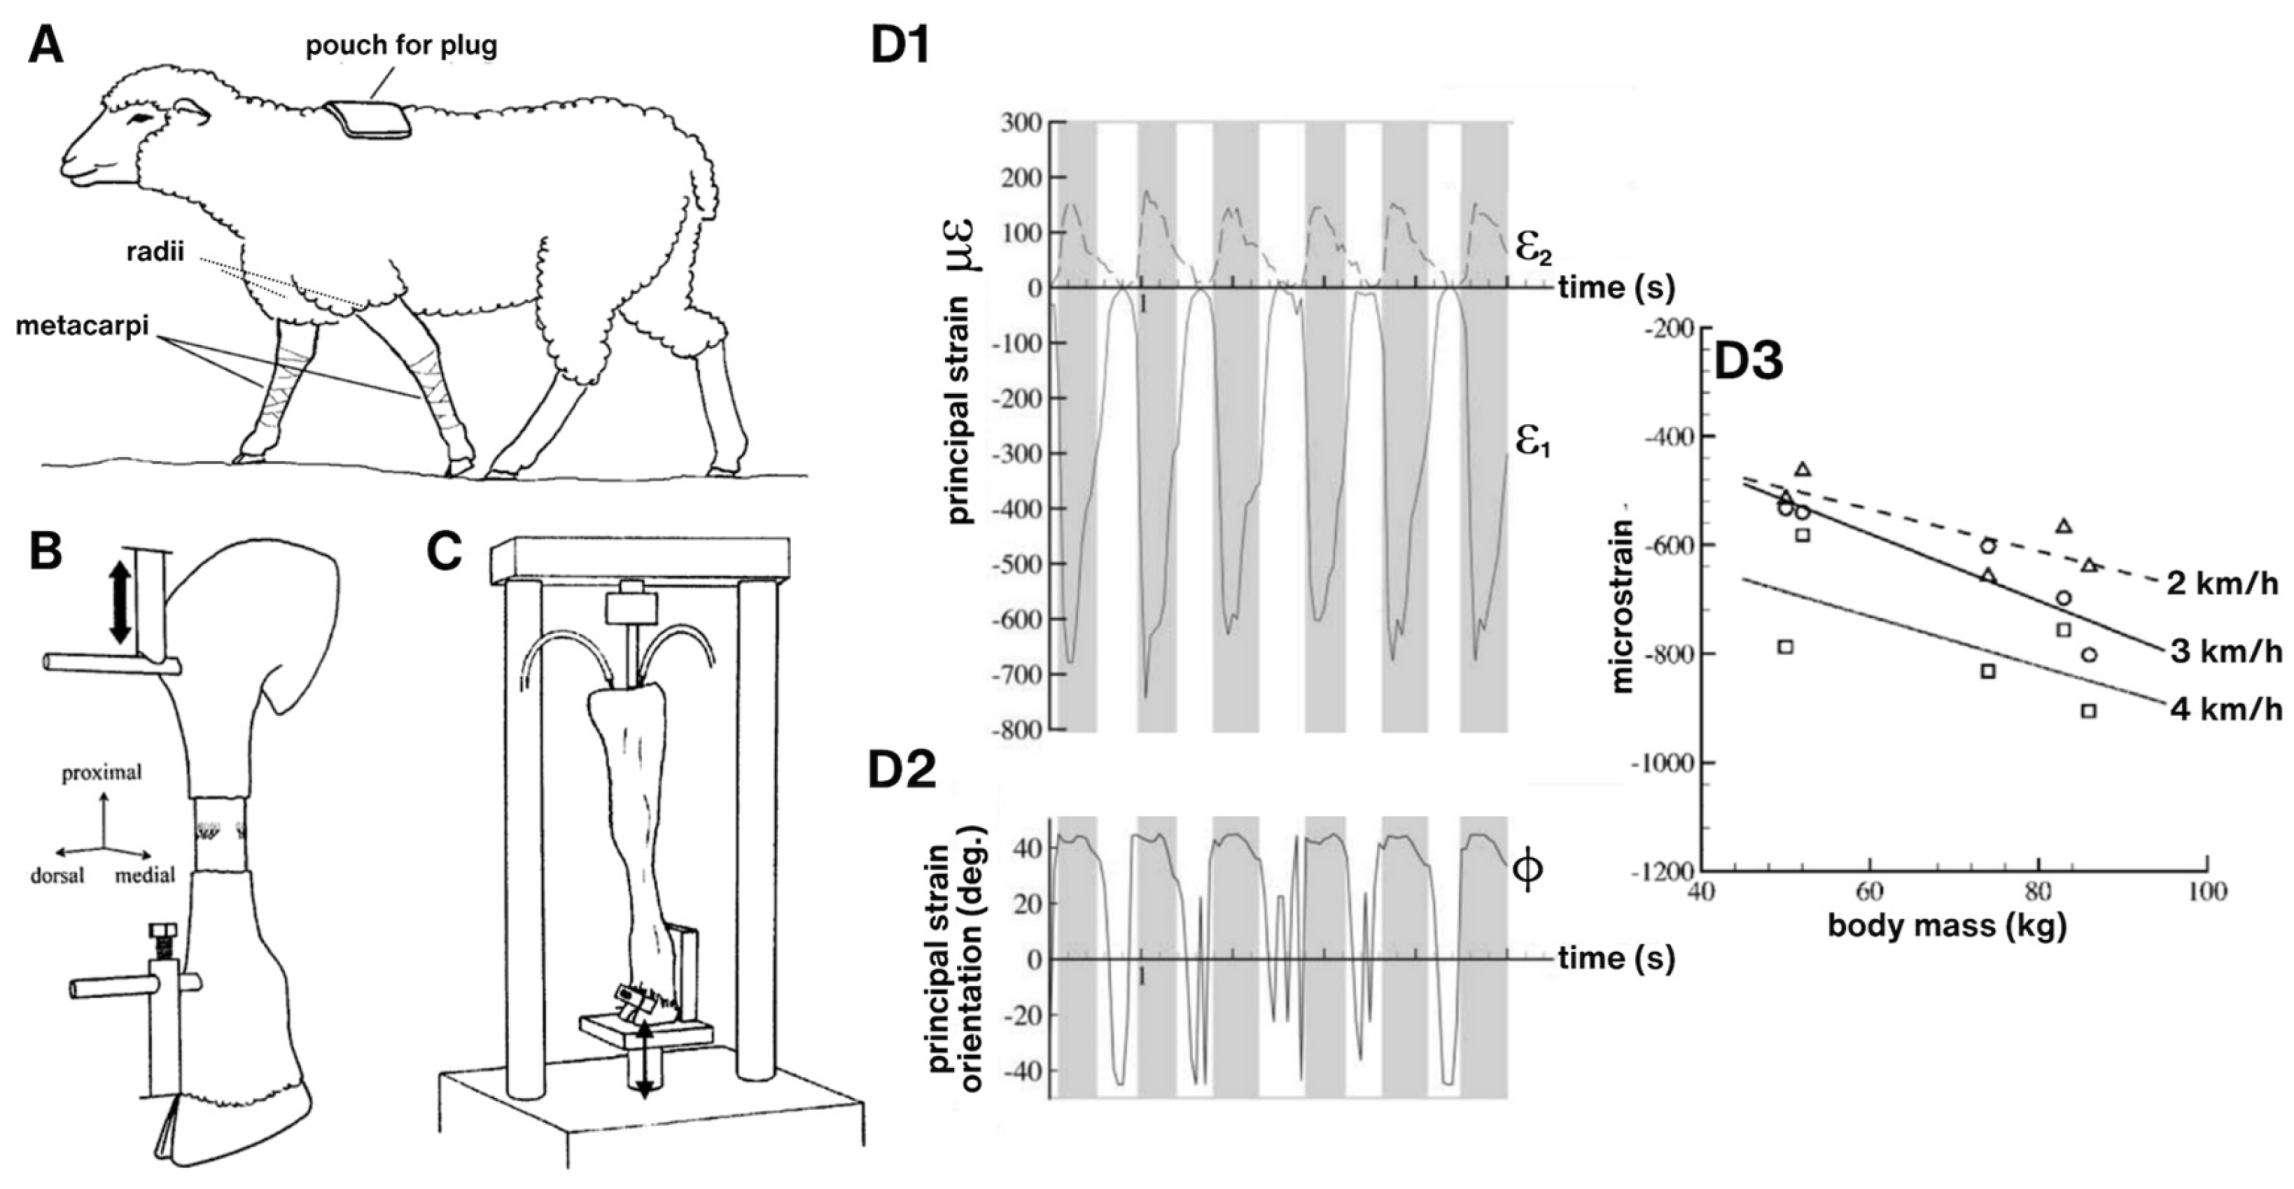
Figure 4.
Implant design and implementation with microscope imaging in situ of cell-scale remodeling within a threaded ring titanium implant on the surface of the sheep metacpus. (A) Finite Element (FE) modeling prediction of loading within the ring shows a reduction in strain in tissues offloaded by the titanium implant, i.e., within the ring. Bone surface strains are displayed for the entire model of the metacarpus without and with the implant, for the region of interest, and for a cut through the metacarpus at the location of the implant (top). Physiological loading induces compressive strains on the dorsal surface of the metacarpus in physiological loading conditions. Maximal compressive strains (dark blue) up to approximately 900 microstrain (0.09% strain) are found near the distal diaphysis. At the region of interest, the surface strains are reduced from 500-600 microstrain to about 200-400 microstrain, due to the presence of the implant. (B-C) Correlative imaging in reflection and using laser scanning confocal microscopy enabled concomitant imaging of bone resorption and local perfusion of a fluorescent tracer. (B) Collage of histological micrographs showing resorption spaces (black arrows) and blood vessels (appear as vertically orientation striations, referred to as Haversian canals, indicated by arrowheads) in tissue within the implant ring. (C1) Raw (no post-processing or other image modification/enhancement) confocal image taken in vivo and in situ. Red blood cells moving through capillaries (double arrows) as well as individual osteocytes and their nuclei (single arrows) are observable. (C2) Osteocyte viewed in situ (left), and (right) magnified 100% to visualize the nucleus and pericellular domain. (C3) Osteoclastic cutting cone in vivo and in situ outlined for visual clarity. This IACUC approved study was carried out at the Cleveland Clinic Lerner Research Institute and involved moving an anaesthetized sheep into the imaging facility, for in vivo imaging, which was unprecedented at the time.
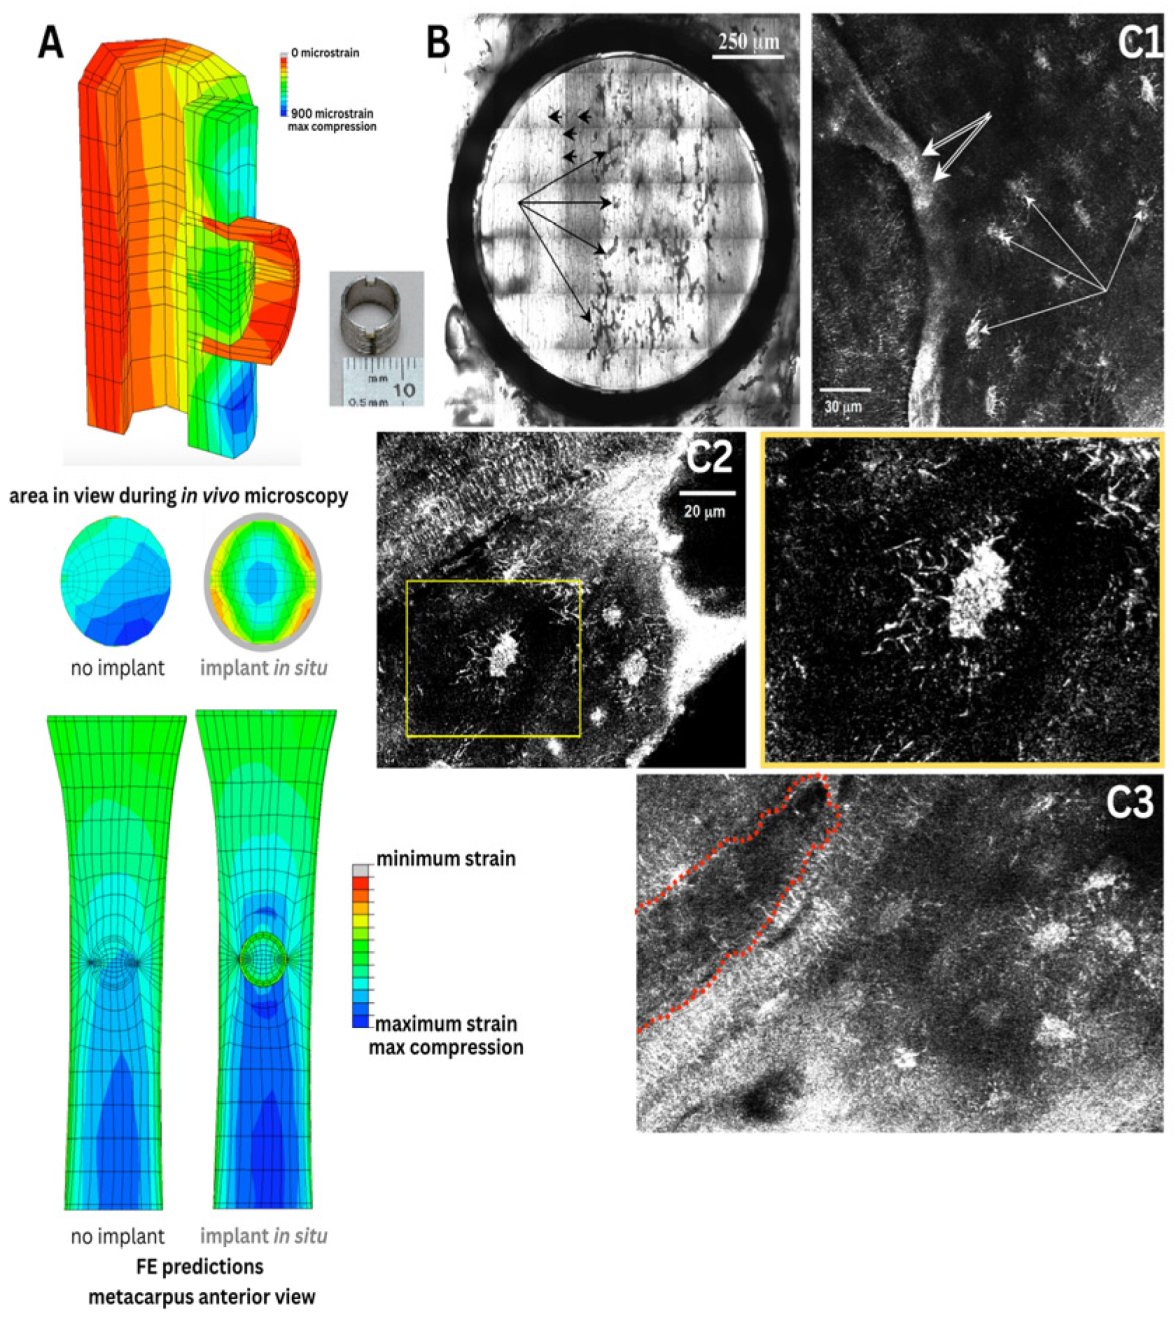
Figure 5.
(A) We used novel physical and in silico models to understand nano-microscale flow fields around osteocytes in situ. Based on high resolution confocal image stacks (volumes) of osteocyte networks from healthy, osteoporotic and osteoarthritic human bone biopsies (A2), we 3D-printed inverse physical models, where the osteocyte network created voids in the resin blocks (A1) which were scaled up by 1000x. Using similitude theory, we could then measure the permeability of the blocks with a fluid of viscosity 1000x that of bone fluid. We predicted signal transmission efficiency through the respective cellular networks using stochastic models (A3,B) and virtual parametric models of cells and their networks (A4), where we could probe the respective effects of live cells in situ as well as pericellular matrix on signaling efficiency around cells. (A5) Using nano-microfluidics computational models, we could import actual 3D geometries from electron microscopy to simulate and predict flow around osteocytes, showing that natural constrictions in pericellular spaces would be predicted to amplify drag on osteocytes, like narrowings in a stream. (B) These could then be tied to in situ measures of cell viability in preserved slices of bone (B1), where effects of cell death on signal transmission efficiency could be predicted (B2,B3). (A-B) In collaboration with Professor Eric J. Anderson [25,26]. (C) State-of-the-art episcopic correlative imaging studies enable cell to organ scale high resolution imaging of tracer transport from the heart to cells of the different tissues comprising the synovial joint, in healthy and osteoarthritic animals, and subjected to spikes in cytokines delivered as a bolus to the heart. This work was carried out in collaboration with Dr. Lucy Ngo [27,28,29].
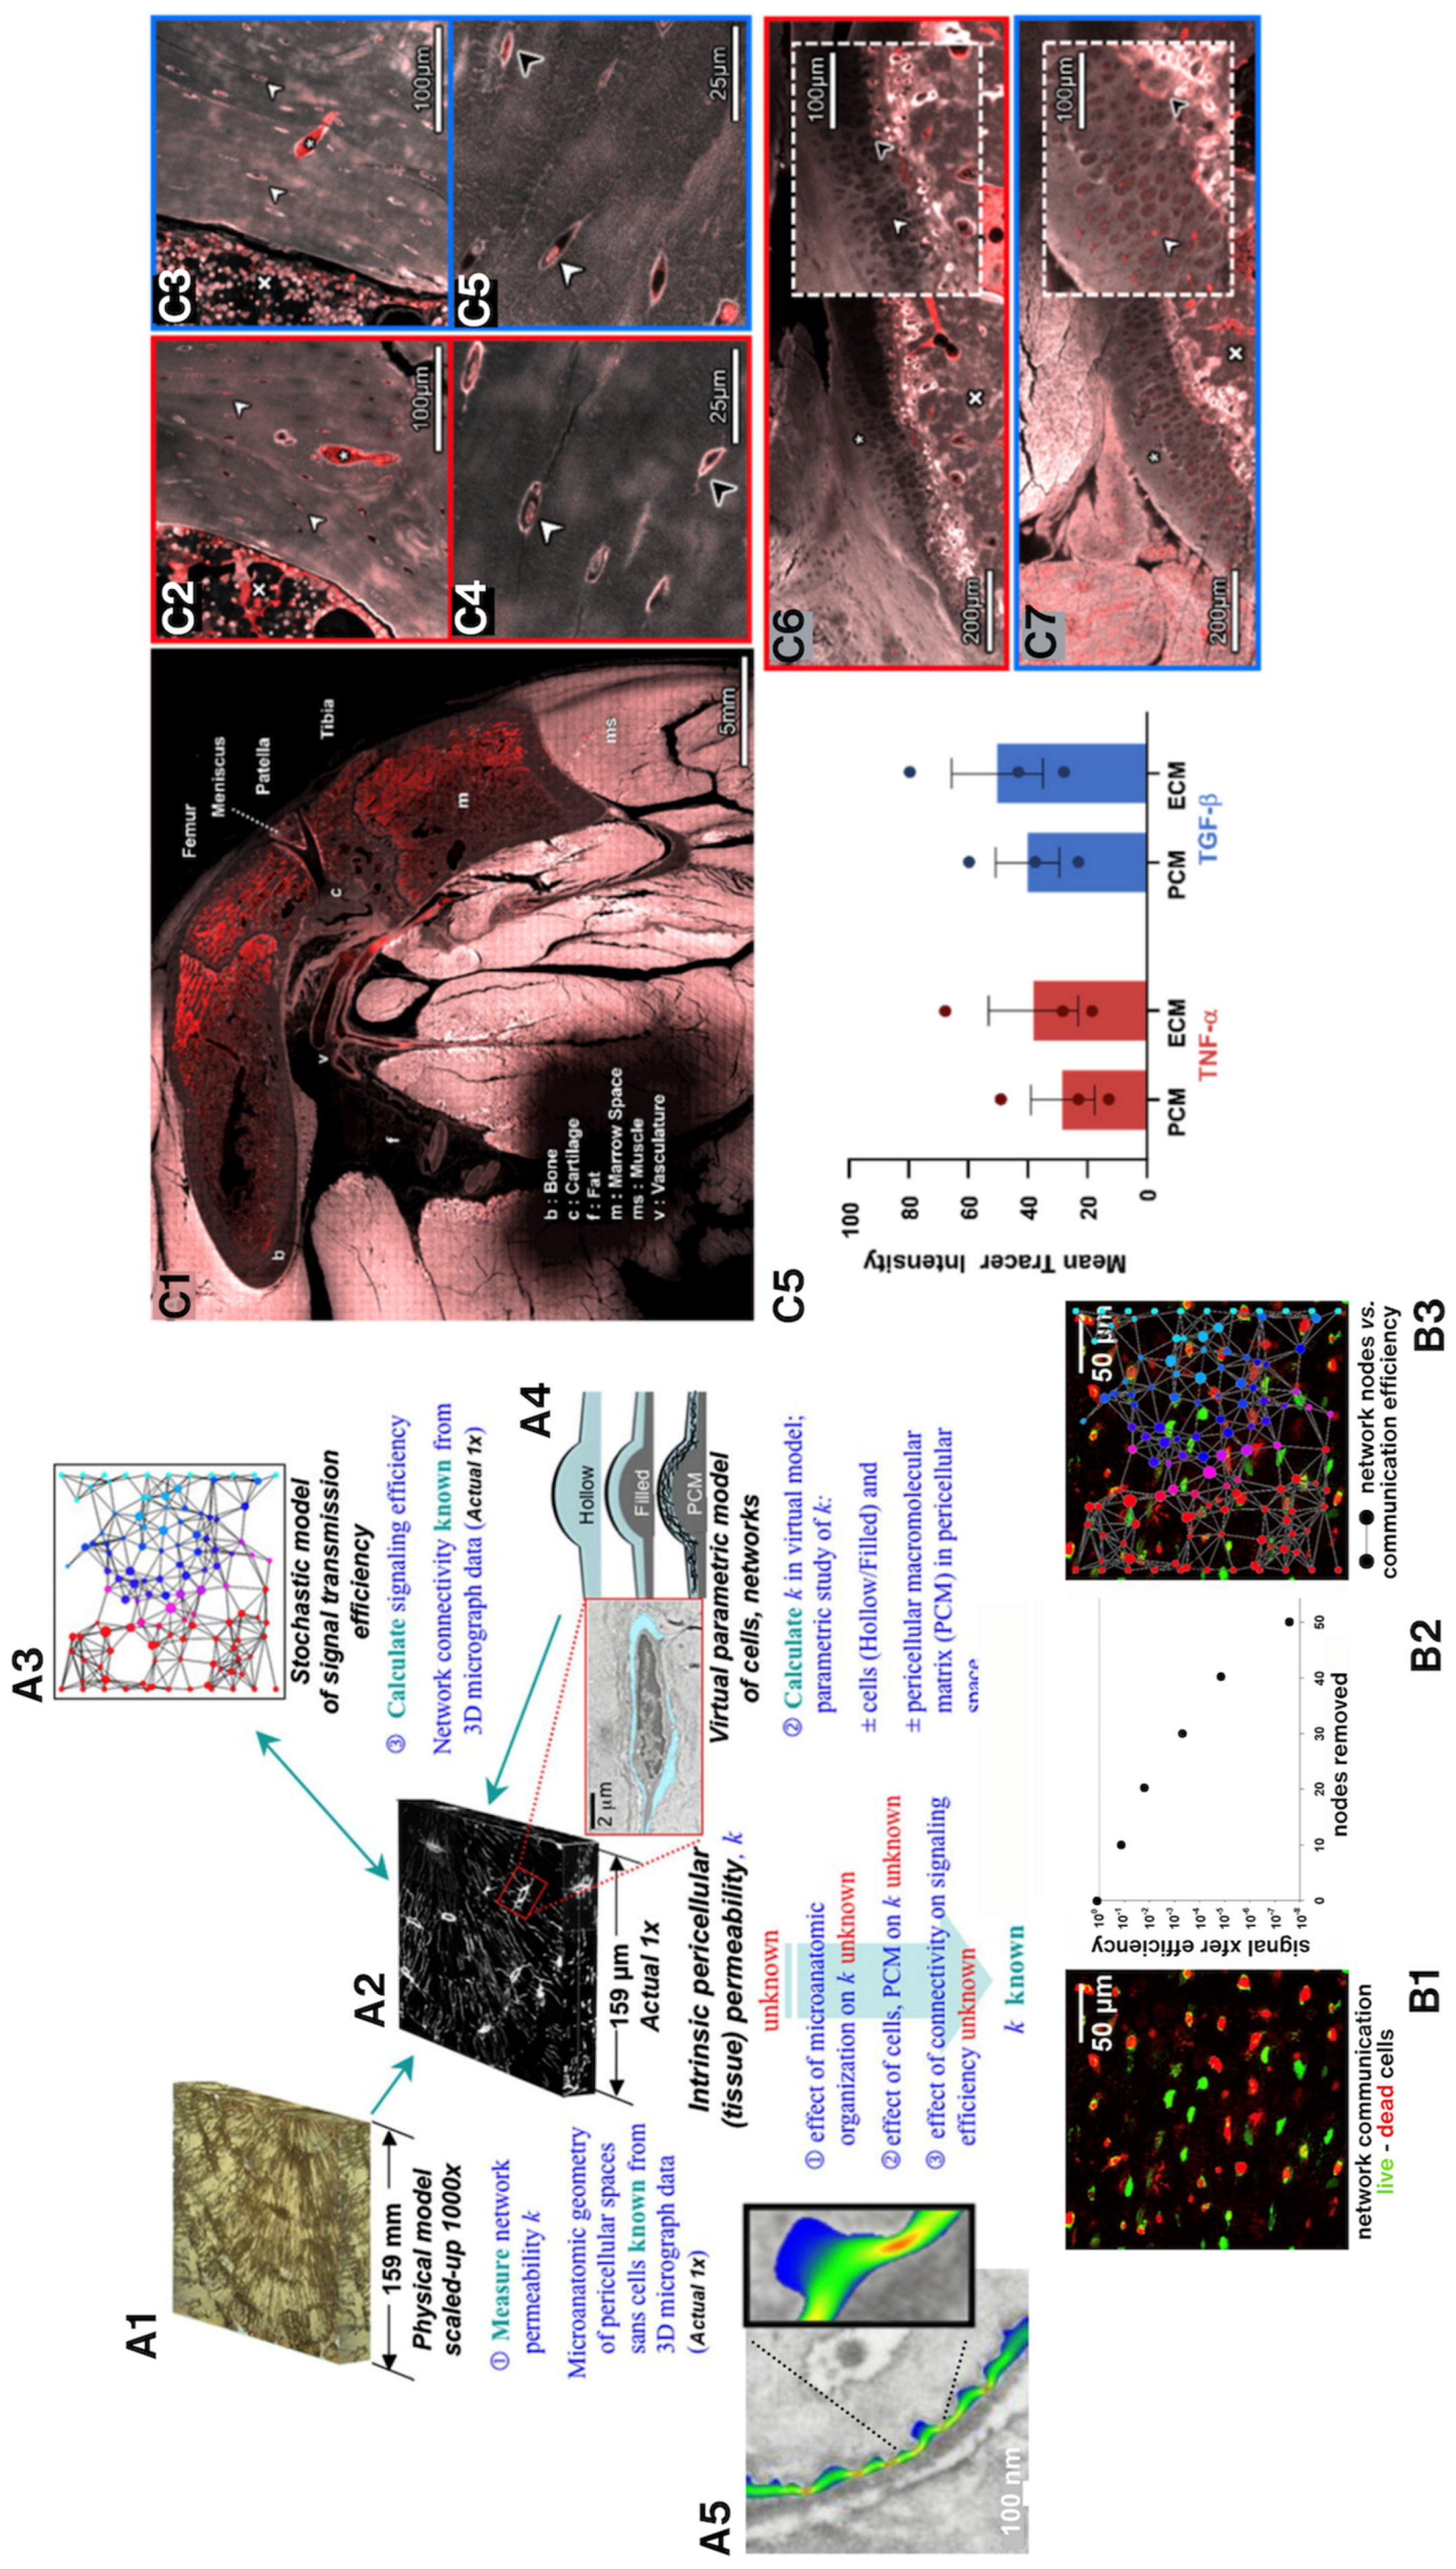
Figure 6.
To understand the role of biophysical factors in the surprising rate and volume of new osteogenesis observed in the one-stage bone transport procedure (developed by Dr. U. Knothe), we needed to elucidate of the mechanical milieux of mesenchymal stem cells residing in the periosteum via ex vivo (A,B—in collaboration with Professor Sara McBride-Gagy [30]), in vitro (C—in collaboration with Dr. Nicole Yu and Dr. Renee Whan [35]; D—in collaboration with Professor Sara McBride-Gagy [31]), and in silico (not shown—in collaboration with Dr. Shannon Moore [34]) models. (A) After surgical preparation for the one-stage bone transport procedure, the femur was resected and placed in a loading rig to mimic stance shift loading in vivo, the condition under which in vivo studies demonstrated robust intramembranous infilling of the defect within 16 weeks of surgery. To measure cell-scale microstrains at high resolution during stance shift loading, we videotaped the surface of the periosteum from different angles using ultra-high-definition television lenses (A, upper left) and (B) carried out digital image correlation (DIC) to calculate strains in the vicinity of quiescent stem cells during loading. Statistical analysis of strains to osteogenesis patterns revealed that change in baseline strains showed greater correlation to tissue genesis than strain magnitudes per se or particular thresholds [30]. (C) To determine whether periosteal lifting, which attaches the periosteum in a pre-stressed state to the surfaces of bone via collagenous Sharpey’s fibers, we carried out live imaging protocols on ex vivo periosteal preparations to measure the change in volume and shape of periosteal cells with (C1) and without (C3) pre-stress in situ. Imaging showed that cutting of Sharpey’s fibers to lift the periosteum increases crimping of the collagen to which periosteal cells attach, and subsequent rounding of quiescent stem cell nuclei; hence, cutting of the Sharpey’ fibers acts as a mechanical trigger for the cells to migrate to sites of injury and initiate tissue genesis [35]. (D) Mechanical testing and shrinkage (not shown) studies of ovine periosteum enable measurement of periosteum’s anisotropy and prestress [31,32,33]. Experiments depicted in this figure were conducted at the AO Research Institute in Davos, Switzerland (A,B), the Biomedical Imaging Facility of the University of New South Wales (C) and the Experimental and Computational Mechanobiology Labs of Case Western Reserve University (D), with IACUC approvals under the guidance of the relevant local committees.
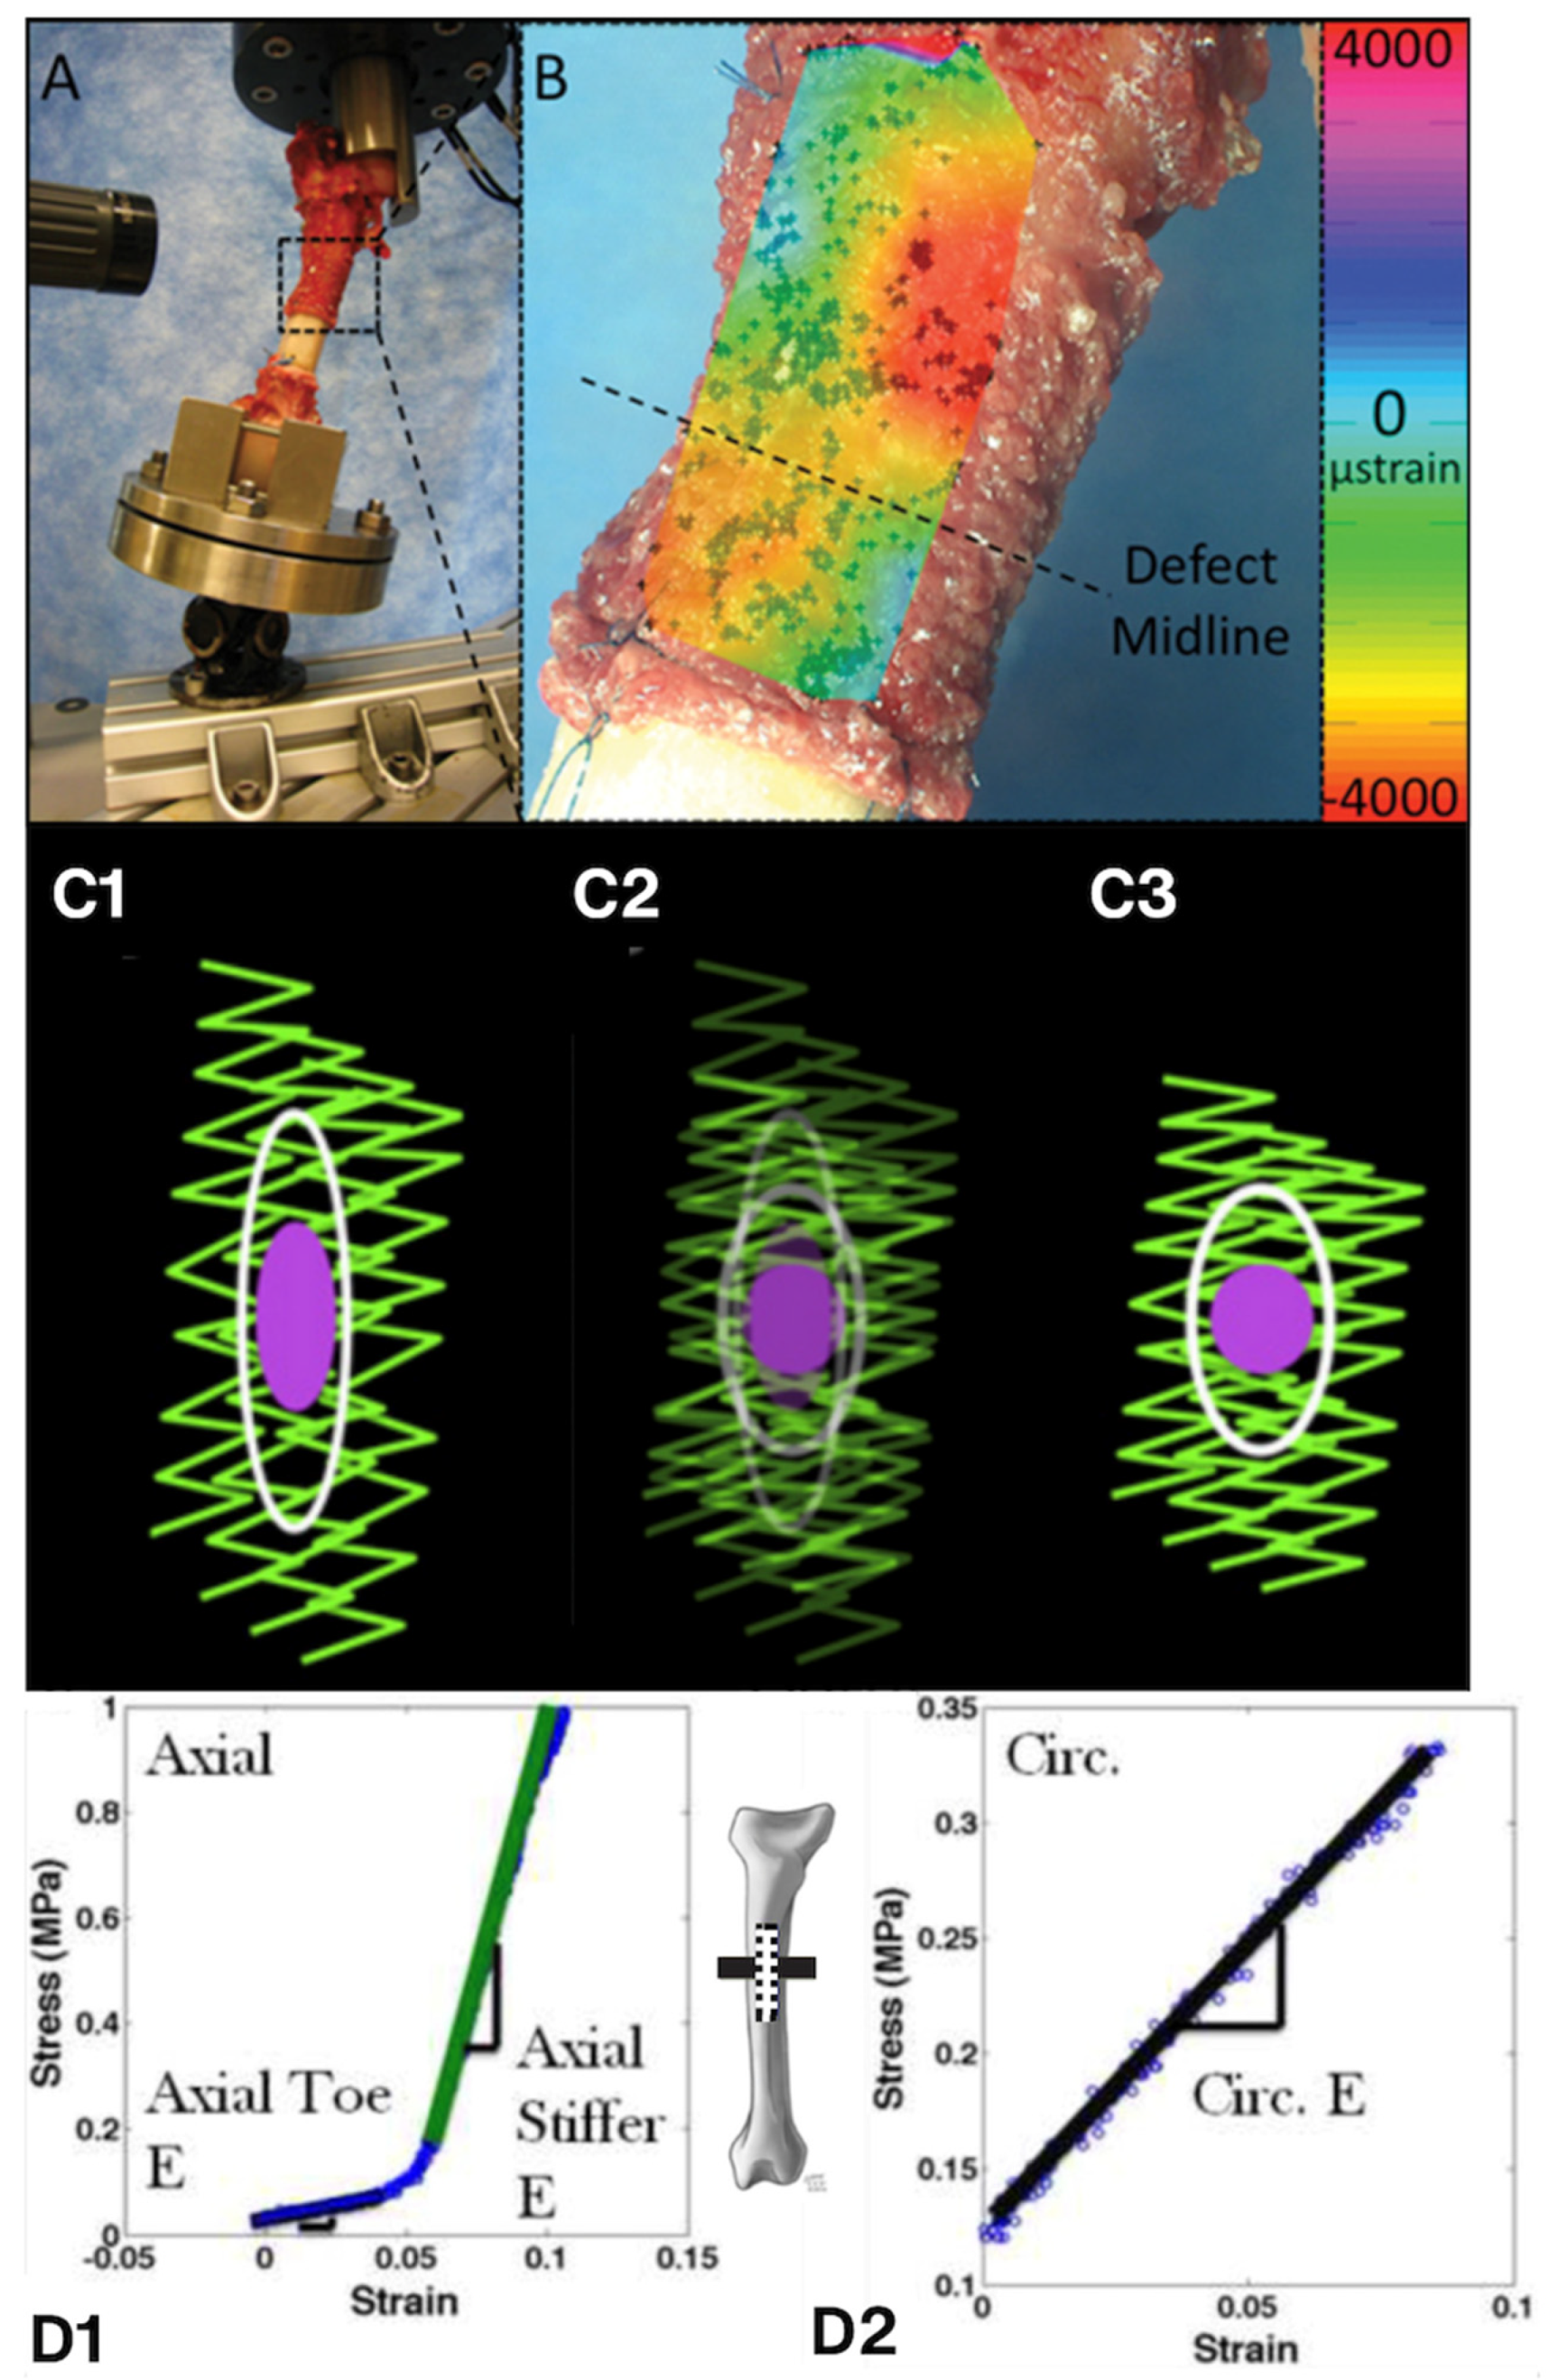
Figure 7.
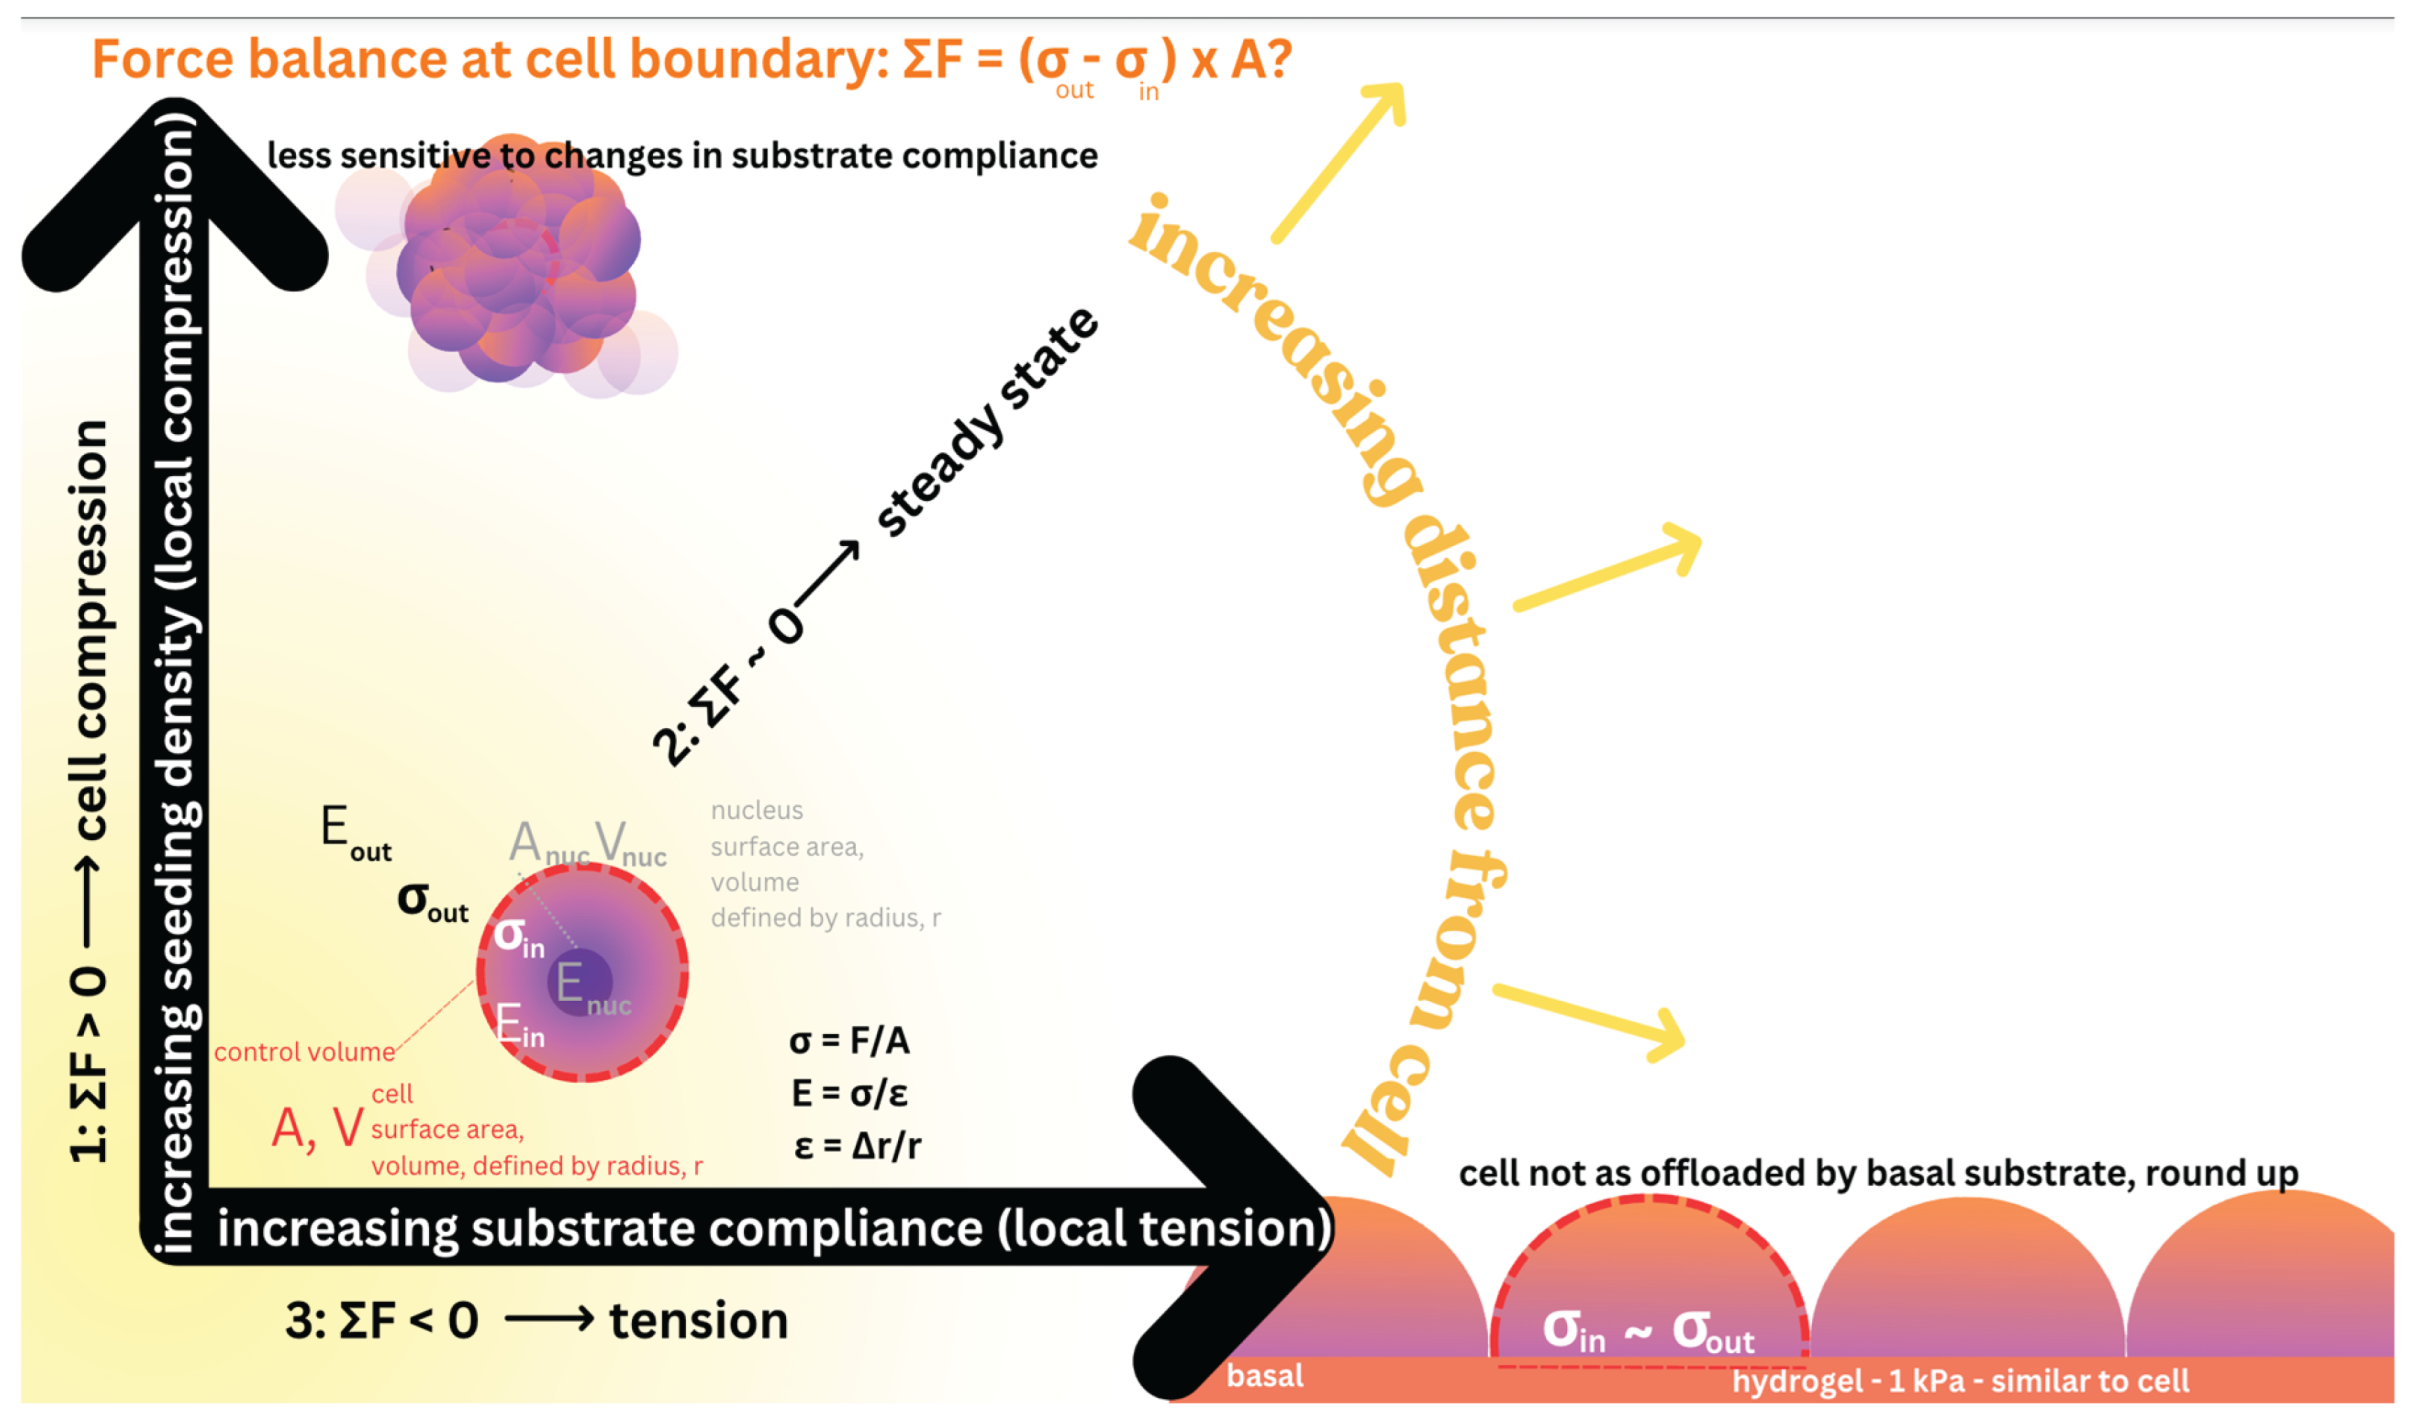
At cell boundaries force balances modulate stem cells’ mechanoadaptation to their dynamic, local mechanical environment. The force balance at the cell boundary is defined by the control volume (indicated by red dashed circle, with A—Area, and V—volume, and surface area of the cell) delineating the border between the outside of the cell (matrix and/or substrate in cultured cells, “out”), including the nucleus. The stress (σ) and strain (ε) relationships are delineated by theory of elasticity and plasticity, and theory of virtual work [2]. If the force balance (ΣF) is greater than zero (1), the cell experiences local compression. If the force balance (ΣF) is around zero (2), the cell is at steady state. If the balance (ΣF) is less than zero (3), the cell experiences local tension. Animated version of figure [36]: https://figshare.com/articles/media/Animation_1/27936261.
Figure 7.
At cell boundaries force balances modulate stem cells’ mechanoadaptation to their dynamic, local mechanical environment. The force balance at the cell boundary is defined by the control volume (indicated by red dashed circle, with A—Area, and V—volume, and surface area of the cell) delineating the border between the outside of the cell (matrix and/or substrate in cultured cells, “out”), including the nucleus. The stress (σ) and strain (ε) relationships are delineated by theory of elasticity and plasticity, and theory of virtual work [2]. If the force balance (ΣF) is greater than zero (1), the cell experiences local compression. If the force balance (ΣF) is around zero (2), the cell is at steady state. If the balance (ΣF) is less than zero (3), the cell experiences local tension. Animated version of figure [36]: https://figshare.com/articles/media/Animation_1/27936261.
Disclaimer/Publisher’s Note: The statements, opinions and data contained in all publications are solely those of the individual author(s) and contributor(s) and not of MDPI and/or the editor(s). MDPI and/or the editor(s) disclaim responsibility for any injury to people or property resulting from any ideas, methods, instructions or products referred to in the content. |
© 2025 by the authors. Licensee MDPI, Basel, Switzerland. This article is an open access article distributed under the terms and conditions of the Creative Commons Attribution (CC BY) license (http://creativecommons.org/licenses/by/4.0/).
Copyright: This open access article is published under a Creative Commons CC BY 4.0 license, which permit the free download, distribution, and reuse, provided that the author and preprint are cited in any reuse.


