Submitted:
04 November 2025
Posted:
06 November 2025
You are already at the latest version
Abstract
Atomic force microscopy is a powerful tool for imaging and characterizing micro and nano-structures, particularly in the realm of biological membranes and model systems such as cells and supported lipid bilayers. The lateral resolution of AFM in liquid environments, necessary for studying membrane interactions, poses a challenge. In this study, we explore the imaging of freeze-dried supported lipid bilayers allowing for the topographical imaging of supported lipid bilayers in air with higher resolution as well as the use of Kelvin Probe Force Microscopy to measure electrical properties. Despite non-physiological conditions, this technique offers unprecedented insights into the study of lipid bilayer structures, bridging the gap between resolution and experimental feasibility. This process underscores the potential of freeze-dried supported lipid bilayers in advancing our understanding of complex membrane dynamics and membrane interactions in diverse experimental settings. The ability to measure the electrical properties of lipid bilayers will greatly advance our understanding and determination of membrane properties and their interactions with proteins, drugs and toxins. A more complete understanding of the factor intervening in the interactions would lead to, for example, better drug development.
Keywords:
supported lipid bilayer
; atomic force microscopy
; kelvin probe force microscopy
; bilayer surface potential
1. Introduction
The study of biological membranes is crucial for understanding cell behavior, responses to external stimuli, and interactions with various compounds, including pharmaceutical drugs and toxins [1,2,3,4]. Advanced imaging techniques play a central role in unraveling the complex dynamics of cellular membranes. Among these advanced imaging techniques, Atomic Force Microscopy (AFM) and Kelvin Probe Force Microscopy (KPFM), sometimes referred to as just Kelvin Force Microscopy, have emerged as powerful tools, offering nanoscale resolution and unique capabilities to probe the mechanical and electrical properties of biological specimens [5,6,7].
AFM, with its ability to provide high-resolution topographical images and mechanical maps of biological samples, has been widely employed to investigate the surface morphology of cells and lipid bilayers [8,9]. This technique enables the exploration of the nanoscale structure of membranes, offering insights into their organization and mechanical properties. Meanwhile, KPFM, a variant of AFM, introduces the capability to map the surface potential of samples with high sensitivity by measuring the work function difference between the AFM tip and the sample surface [10], and if adequately implemented KPFM could provide valuable information about the local electronic properties of biological membranes. However, KPFM faces challenges related to its application in liquid environments due to the presence of water layers that can affect the accuracy of potential measurements [11,12]. Because of this, the available studies of biological samples scanned using KPFM have been in air instead of liquid environments [13].
Other techniques like quantitative surface conductivity microscopy (QSCM), a variation of Scanning Ion Conductance Microscopy (SICM) [14], and Vibrational Stark Effect (VSE) Spectroscopy [15], have circumvented the problem of imagining and measuring electrical properties of lipid bilayers in liquid environments but have complications of their own. For instance, QSCM requires a precise modeling of the nanopipette tip-surface interaction through a Poisson–Nernst–Planck analysis, however the tip radius needed for the SICM imaging is not as reproducible during nanopipette fabrication which causes a mismatch between experiment and modeling. On the other hand, VSE relies on the sensitivity of the probe used and the assumption that the probe responds only to the local electrical environment [16]. With all the above limitations in mind, we believe that KPFM could very nicely complement our understanding of electrical properties and interactions of lipid and living membranes, in synergy with the above mentioned techniques and their valuable contributions.
Despite the limitations of KPFM, Drolle et al. were able to measure air-dried monolayers with and without cholesterol and were able to correlate height differences, or topographic domains, with electrostatic domains by using AFM and KPFM [17]. These results help advance the understanding of the effect of cholesterol on the interaction of model lipid membranes with amyloid-β peptide. The use of monolayers limits the applicability of the results as the exposed region of the monolayer is the hydrocarbon tails of the lipids, not the headgroups which are the exposed region in a cell or liposome that interacts with external agents like toxins.
This work focuses on the combined use of AFM and KPFM to investigate supported lipid bilayers (SLB) imaged both in aqueous and air environments. For imaging in air, we make use of SLBs that have undergone a freeze-drying process. Supported lipid bilayers serve as model systems that enable controlled studies of model membrane structure and dynamics [18,19]. Freeze-drying, a widely utilized preservation technique, offers an innovative approach to investigate lipid bilayer structure in air, improving the lateral resolution. The choice of freeze-drying instead of air-drying or even heat-drying is to minimize violent processes, such as boiling, and have a better control of the water removal. The importance of conducting KPFM imaging in air lies in the potential to explore the electrical properties of lipid bilayers, whereas for AFM, the lack of an aqueous environment could lead to an increased imaging resolution. This experimental setup will add to the battery of tools for the study of the interactions of lipid bilayers with pharmaceutical drugs and toxins from the perspective of electrical and electrostatic interactions by means of AFM. The integration of AFM and KPFM in the study of freeze-dried or lyophilized supported lipid bilayers (F-SLB) represents a cutting-edge approach to elucidate the nanoscale structure as well as mechanical and electronic properties of biological membranes. This research not only contributes to our fundamental understanding of cell membrane dynamics but also holds promise for applications in drug development and toxicology.
2. Materials and Methods
Chemicals
1,2-dipalmitoyl-sn-glycero-3-phosphocholine (DPPC) and cholesterol (Chol) from Avanti and ergosterol (Ergo) from Sigma were purchased from Sigma-Aldrich (Toluca, Mexico). Chloroform and methanol from Meyer were purchased from Química Sefir (Mexico City, Mexico). The lipids in powder form and their stock solutions in chloroform were kept at -20 °C.
Liposome preparation
Liposomes were prepared with the thin film hydration method [20]. In brief, required amounts of lipids in chloroform solution were deposited into a round-bottomed flask. Solvent was evaporated using an R-II rotary evaporator (Büchi, Flawil, Switzerland) for 45-60 min at 40 °C and 300 mBar followed by another 45-60 min at 72 mBar. The dry lipid film was hydrated using distilled water with conductivity lower than 2 μS/cm (Purific, Cuernavaca, Mexico), mixed using a Vortex-Genie 2 vortex generator (Scientific Instruments, Bohemia, USA) and placed in an ultrasonication bath at 50 °C for 60 min (SONICA 3300 ETH S3 from SOLTEC, Milan, Italy). Liposomes were used within the next 5 days and stored in a refrigerator at 2-4 °C. The final lipid concentration was 250 μM.
Supported lipid bilayers
Lipid bilayers supported on mica substrate were prepared using the vesicle fusion method [21]. Briefly, 20 μl of 4 mM CaCl2 solution followed by 80 μl of liposome solution were placed on freshly cleaved mica grade V-4 substrate (SPI Supplies, West Chester, USA) inside of a 3 ml Nunclon™ Delta Petri dish (Thermo Scientific, Waltham, USA). The mica was placed on a heating plate and heated at 50 °C for 5-8 min with the lid on the dish (depending on the lipid mixture). The droplet was washed by replacing 50 μl of volume with water at 40°C 10 times. The droplet was left to cool to room temperature (21 °C) for at least 45 min before imaging. These are referred to as SLB throughout the text.
Freeze-drying of supported lipid bilayers
Supported lipid bilayers in liquid were frozen by storage at -20 °C for at least 20 min. After freezing, the samples were placed on a FreeZone 2.5 freeze-drier from Labconco at -50 °C and 0.200 - 0.140 mBar for 1-2 hours depending on the number of samples freeze-dried at once. These samples are referred to as F-SLB throughout the text.
Atomic Force and Kelvin Probe Force Microscopies
Atomic force microscopy (AFM) measurements in liquid were performed using an XE-Bio system from Park Systems in Tapping/Intermittent mode and the XEP acquisition software also from Park Systems. The liquid cell accessory was used as well as an All-in-One cantilever of nominal spring constant of 7.4 N/m from BudgetSensors. AFM measurements in air were performed using a Solver Nano system from NT-MDT Spectrum Instruments (Phoenix, USA) and the Nova Px 3.5.0 acquisition software, also from NT-MDT. For topographical measurements a NSC15 (Mikromasch) cantilever of nominal spring constant of 40 N/m was used. Meanwhile for KPFM an NSC18/Pt (Mikromasch) of nominal spring constants of 2.8 was used. For KPFM the mica substrates were placed on top of a steel disc by means of a 12 mm conductive adhesive carbon disc (Ted Pella, Inc, Redding, USA) before proceeding to the elaboration of SLBs followed by the freeze-drying process. Measurements were made using the I Pass Phase Modulating Scanning Kelvin Microscopy mode. All cantilevers were purchased from Nano and More USA Corp. (CA, USA). All scanning probe microscopy images were processed with the free and open source software Gwyddion v2.68 [22]. Height and surface potential point-data and line profiles were extracted from images using Gwyddion for further analysis. Line profiles were then plotted using XmGrace. An offset was applied to the complete topographic point-data in order to center the response of the mica substrate as a reference point (height ~ 0 nm or surface potential ~ 0 mV). Height and surface potential histograms were obtained from the accumulated data. The thickness and electrical response of the bilayers were obtained by fitting double- or triple-peak gaussian functions to the corresponding accumulated height or surface potential histograms of at least 5 topographic images from at least two different preparations.
3. Results
Firstly, it is important to note that SLB structures withstand the freeze-drying process. Although there is removal of the bilayer, as can be seen from the height histograms in Figure 1, there is still a significant amount of bilayer (from ~ 80% to ~40%). Bilayer coverage, computed from the fitted gaussian functions, is high in all liquid samples whereas in air sampled SLBs the bilayer coverage drops significantly. Bilayer coverage drops from 88% to 38% for DPPC SLBs, 73% to 37% for DPPC-Chol SLBs and from 91% to 38% for DPPC-Ergo SLBs. F-SLBs present similar structure as SLBs obtained in water. The thickness of DPPC SLBs is around 4.7 nm and the thickness of DPPC F-SLBs are around 5.5 nm, see Figure 1D and Figure 1J. The thickness of F-SLBs was confirmed using both AFM systems (data not shown).
For DPPC-Chol SLB, the thickness histogram presents two peaks, one around 3 and the other at 4 nm. Once freeze-dried and imaged in air, DPPC-Chol F-SLBs present one single clear peak around 5.5, similar to DPPC F-SLB. This is a considerable difference that seems to arise from the freeze-drying process and could be due to the lack of water in and around the bilayer, increasing the order of the lipids within the bilayer, particularly the lipid head groups, and thus, increasing the bilayer thickness. In the case of DPPC F-SLBs, there is an interesting effect from the lyophilization process, the single bilayer stacks into a multilayer that can be clearly seen in the height histogram shown in Figure 1J where there is a population of data points with height around 11-12 nm, double the height of the bilayer. This effect is different for the DPPC-Sterol F-SLBs, where there are no multilayered structures but rather lipid aggregates or large debris, seen in Figure 1H as white spots and whose height is greater than 12 nm.
The topographic results obtained from DPPC-Erg SLBs and F-SLBs are shown in Figure 1C, Figure 1F, Figure 1I and Figure 1L. Similarly to DPPC-Chol SLBs, the height histogram of DPPC-Erg SLBs shows 2 peaks. However, these are closer to each other with one around 2.9 and one around 3.2 nm. There is high coverage in liquid environment, similar to the other two lipid mixtures. When freeze-dried, the bilayer coverage drops considerably and the histogram shows only one peak for the bilayer thickness. The DPPC-Erg F-SLBs show aggregates, much like the case for DPPC-Chol and, notably, the thickness for Ergo containing F-SLBs rose to 5.7 nm.
For Kelvin Probe Microscopy the setup must allow for conductivity from the sample to the system. For this, as was mentioned in the methods section, the mica substrate is attached to a steel disc by means of carbon tape. The electric contact between the mica and the system is enough to detect an electrical potential difference between the cantilever tip and the bilayer surface. Still, care must be taken to ensure that the mica surface is in contact with the carbon tape. The results of KPFM imaging using this setup are shown in Figure 2, Figure 3 and Figure 4. There is a clear electrical signal that correlates closely with the bilayer structure, as can be seen from the height and surface potential profiles, see for example in Figure 2B and Figure 2D.
4. Discussion and Conclusions
The increase in bilayer thickness observed for the F-SLBs compared to the SLBs in is a notable finding from this study. This considerable difference in thickness is likely due to the lack of water surrounding the bilayer in the freeze-dried samples, which may have increased the order of the lipids within the bilayer, particularly the lipid head groups, and thus resulted in the increased bilayer thickness. A similar effect has been seen for 14:1 PC systems as they become dehydrated and measured using Laurdan [23]. This ordering effect induced by dehydration is an important consideration when studying phenomena that may be influenced by changes in bilayer structure or properties. Moreover, the thickness values between 5.5 and 5.7 nm for F-SLBs, which seems quite thick for a bilayer, has been observed in other AFM measurements of DPPC and DPPC/Chol (7/3 mol/mol) supported lipid bilayers [24]. Albeit, their measurements in liquid are more in correspondence with our results in air. This could be due to the difference in the assay buffer used, 150 mM NaCl PIPES buffer vs distilled water, given that ion-lipid networks could form and make the bilayer more ordered [25]. The same work also shows two different mechanical responses for the DPPC/Chol system, suggesting that there is a phase segregation, possibly liquid-ordered and liquid-disordered phase coexistence. However, they did not observe topographical evidence for these phase segregations, whereas we do in the height histograms corresponding to SLBs shown in Fig 1. These phase coexistence should exist for DPPC/Chol 7/3 as a solid/liquid-ordered according to Almeida [26]. The difference with our data could be explained by the phase diagram presented in this latter work by Almeida. It shows that at low temperatures, there is solid/liquid-ordered (Lo) phase separation. Above 25°C, the system becomes entirely in the Lo phase, with no phase separation. García-Arriba et al [24] performed their measurements at 23°C, close to the phase transition temperature, whereas we performed our experiments 5°C lower, at 18°C and at 25 mol% of Chol. This could account for the difference in observing or not these phase separations events.
The bilayer stacking observed in the height histogram of DPPC F-SLBs suggests that the lyophilization process may have induced some delamination or "peeling" of the bilayer, resulting in a multilayer structure with the supported bilayer. Despite this potential complication introduced by the freeze-drying approach, the F-SLB system still offers the advantages of good resolution and allows for the measurement of electrical properties, such as surface potential, via Kelvin Probe Force Microscopy. As mentioned, the setup for these KPFM measurements must ensure proper conductivity from the sample to the system. The results of KPFM are noteworthy, especially considering that DPPC is a zwitterionic lipid, being neutral at physiological pH. However, the lack of bulk water, and thus lack of meaning of pH, could influence the electrical properties of lipids.
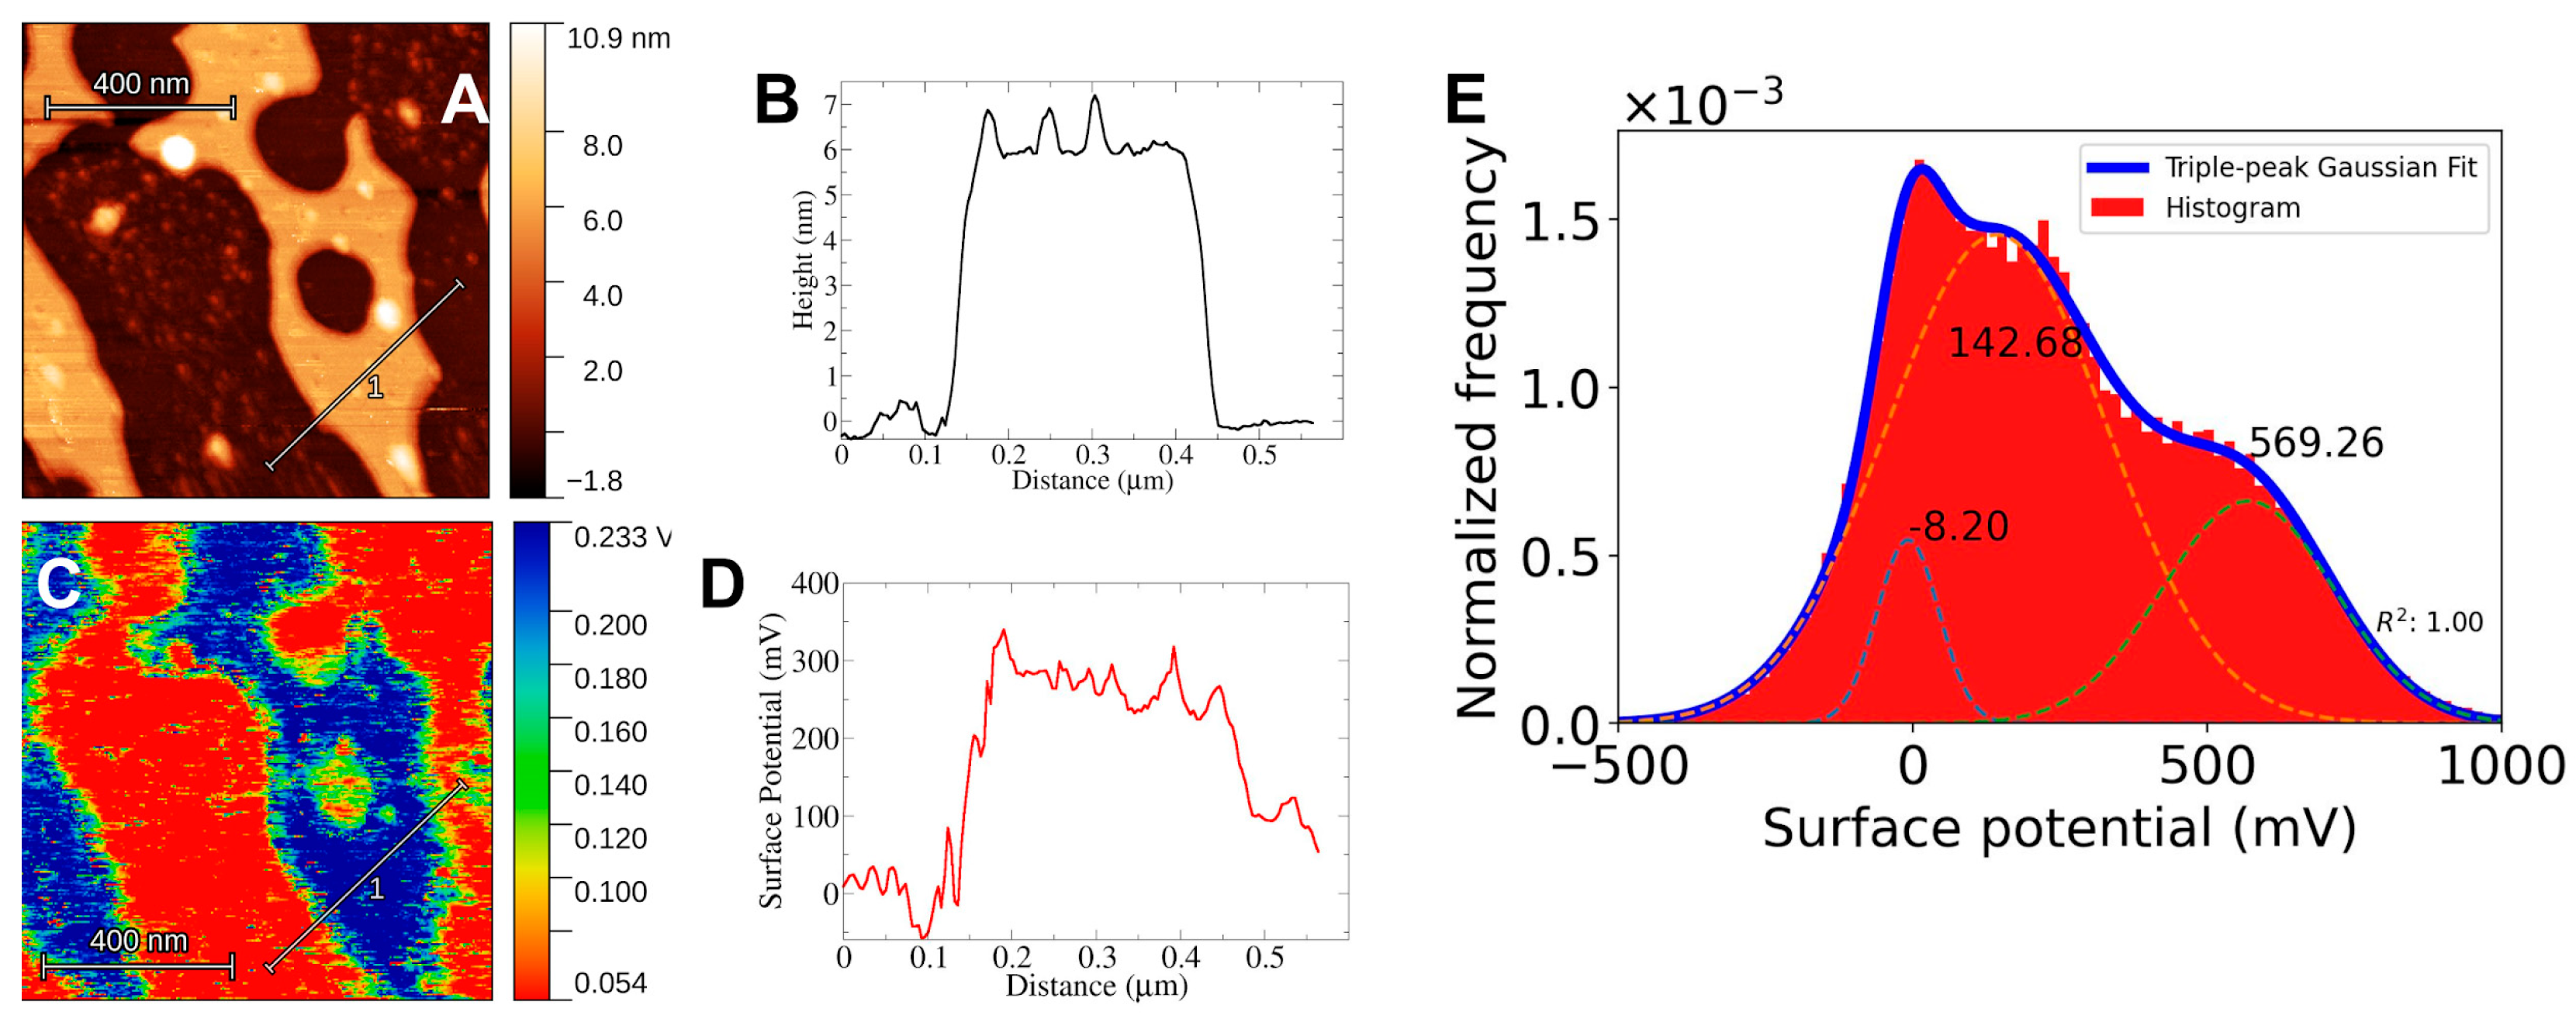
In all cases, the mica surface has a lower electric potential than the bilayer structures. Taking the potential difference as ΔV=Vbilayer - Vmica the values obtained are ΔVDPPC = 427 mV, ΔVchol = 609 mV and ΔVerg = 578 mV. In the case of DPPC-Sterol F-SLBs the electrical response clearly shows a three-peak distribution, in these cases, the response of the mica was taken as the lowest value and the response from the bilayer was taken as the highest peak in correspondence to the height profiles, 500 mV or 600 mV for either Chol or Erg. The appearance of three peaks could be due to the presence of what appears to be bilayer debris on the mica surface (data not shown) probably left behind during the freeze-drying process.
The above results suggest that there is a change in the electrostatic surface potential of DPPC bilayers due to the presence of sterol. This varies slightly depending on the sterol used. This could influence the interaction between bilayers and drugs and/or toxins, for example polyene antimycotics, that have distinct activity on model membranes with or without sterol [27]. Another noteworthy observation is the correlation between lipid phase segregation into small domains and their electrical response (See Figure 4B and Figure 4B). Albeit weak, there is correlation between lipid regions of different height and the surface potential. This increase could be due only to height differences, however, the electrical response of lipid aggregates or large debris seen in all topographic images does not show an increase with respect to the surroundings which one would expect to be sharp if it was only height-driven. With this in mind, there seems to be an electrical difference between the observed lipid domain structures and the rest of the bilayer.
Summarizing, this study demonstrates that SLBs can be subjected to a freeze-drying process, though with some loss of bilayer coverage. F-SLBs showed increased bilayer thickness compared to SLBs, likely due to reduced hydration. Importantly, the lack of water allowed for electrical property measurements via Kelvin Probe Force Microscopy, revealing differences in surface potential between DPPC and DPPC-Sterol bilayers. As a major improvement on the study of biological samples we showed that the use of F-SLBs is worth exploring further. Of course it is a new technique that has room for improvement. We surmise that these results will motivate the development of new methods to study electrical properties of supported lipid bilayers in impactful ways. Finally, we showed that KPFM can resolve the electrostatic fingerprints of sterol-containing bilayers and that F-SLBs have a similar structure compared to their liquid counterpart, providing a new comparative metric to evaluate bilayers in the context of cell response to external stimuli and membrane interactions with various pharmaceutical drugs and toxins of interest.
Supplementary Materials
The following supporting information can be downloaded at the website of this paper posted on Preprints.org.
Author Contributions
Conceptualization, A.GH., L.RO, and I.OB. Methodology, validation, formal analysis, visualization and data curation A.GH. and O.HV. Funding acquisition, I.OB. Project administration, I.OB. and A.GH. Writing—original draft preparation, AGH. Writing—review and editing, A.GH., O.HV., L.RO., I.OB. All authors have read and agreed to the published version of the manuscript.
Funding
This work was funded by CONACyT/SECIHTI vía project FORDECYT-PRONACES/74884/2020 and by UNAM via project DGAPA-PAPIIT-IG101923.
Data Availability Statement
The authors will share the data upon reasonable request to the corresponding authors.
Acknowledgments
During the preparation of this work the authors used Claude 3 Haiku in order to improve readability of the first draft. After using this tool/service, the authors reviewed and edited the content as needed and take full responsibility for the content of the publication.
Conflicts of Interest
The authors declare no conflict of interest. The funders had no role in the design of the study; in the collection, analyses, or interpretation of data; in the writing of the manuscript, or in the decision to publish the results.
Abbreviations
The following abbreviations are used in this manuscript:
| AFM | Atomic Force Microscopy |
| KPFM | Kelvin Probe Force Microscopy |
| SLB | Supported Lipid Bilayer |
| F-SLB | Freeze-dried Supported Lipid Bilayer |
| DPPC | 1,2-dipalmitoyl-sn-glycero-3-phosphocholine |
| Chol | Cholesterol |
| Ergosterol | Ergosterol |
References
- Fang, R.H.; Gao, W.; Zhang, L. Targeting drugs to tumours using cell membrane-coated nanoparticles. Nat Rev Clin Oncol. 2023, 20, 33–48. [Google Scholar] [CrossRef] [PubMed]
- Zalba, S.; Ten Hagen, T.L.M. Cell membrane modulation as adjuvant in cancer therapy. Cancer Treat Rev. 2017, 52, 48–57. [Google Scholar] [CrossRef] [PubMed]
- Prinz, W.A.; Toulmay, A.; Balla, T. The functional universe of membrane contact sites. Nat Rev Mol Cell Biol. 2020, 21, 7–24. [Google Scholar] [CrossRef] [PubMed]
- Martinac, B.; Nikolaev, Y.A.; Silvani, G.; Bavi, N.; Romanov, V.; Nakayama, Y.; et al. Cell membrane mechanics and mechanosensory transduction. Curr Top Membr. 2020, 86, 83–141. [Google Scholar] [CrossRef]
- Schaefer, K.G.; Pittman, A.E.; Barrera, F.N.; King, G.M. Atomic force microscopy for quantitative understanding of peptide-induced lipid bilayer remodeling. Methods. 2022, 197, 20–29. [Google Scholar] [CrossRef]
- Endo, M. Surface Assembly of DNA Origami on a Lipid Bilayer Observed Using High-Speed Atomic Force Microscopy. Molecules. 2022, 27. [Google Scholar] [CrossRef]
- Henderson, R.D.E.; Filice, C.T.; Wettig, S.; Leonenko, Z. Kelvin probe force microscopy to study electrostatic interactions of DNA with lipid-gemini surfactant monolayers for gene delivery. Soft Matter. 2021, 17, 826–833. [Google Scholar] [CrossRef]
- Gumí-Audenis, B.; Costa, L.; Carlá, F.; Comin, F.; Sanz, F.; Giannotti, M.I. Structure and Nanomechanics of Model Membranes by Atomic Force Microscopy and Spectroscopy: Insights into the Role of Cholesterol and Sphingolipids. Membranes 2016, 6. [Google Scholar] [CrossRef]
- Franz, C.M.; Puech, P.-H. Atomic Force Microscopy: A Versatile Tool for Studying Cell Morphology, Adhesion and Mechanics. Cellular and Molecular Bioengineering. 2008, 1, 289–300. [Google Scholar] [CrossRef]
- Wilhelm, M.; Shen, J.; Kummel, A.C.; Lee, S. Kelvin probe force microscopy and its application. Surface Science Reports. 2011, 66, 1–27. [Google Scholar] [CrossRef]
- Collins, L.; Jesse, S.; Kilpatrick, J.I.; Tselev, A.; Okatan, M.B.; Kalinin, S.V.; et al. Kelvin probe force microscopy in liquid using electrochemical force microscopy. Beilstein J Nanotechnol. 2015, 6, 201–214. [Google Scholar] [CrossRef]
- Kilpatrick, J.I.; Kargin, E.; Rodriguez, B.J. Comparing the performance of single and multifrequency Kelvin probe force microscopy techniques in air and water. Beilstein J Nanotechnol. 2022, 13, 922–943. [Google Scholar] [CrossRef]
- Salerno, M.; Dante, S. Scanning Kelvin Probe Microscopy: Challenges and Perspectives towards Increased Application on Biomaterials and Biological Samples. Materials. 2018, 11, 951. [Google Scholar] [CrossRef]
- Klausen, L.H.; Fuhs, T.; Dong, M. Mapping surface charge density of lipid bilayers by quantitative surface conductivity microscopy. Nature Communications. 2016, 7, 1–10. [Google Scholar] [CrossRef] [PubMed]
- Povilaitis, S.C.; Hector, J.A.; Mantsch, M.E.; Webb, L.J. Direct Measurement of the Effect of Cholesterol and 7-Dehydrocholesterol on Membrane Dipole Electric Field in Single and Mixed Sterol Vesicles Using Vibrational Stark Effect Spectroscopy. The Journal of Physical Chemistry B. 2025. [Google Scholar] [CrossRef] [PubMed]
- Verma, N.; Tao, Y.; Zou, W.; Chen, X.; Chen, X.; Freindorf, M.; et al. A Critical Evaluation of Vibrational Stark Effect (VSE) Probes with the Local Vibrational Mode Theory. Sensors 2020, 20. [Google Scholar] [CrossRef]
- Nanoscale Electrostatic Domains in Cholesterol-Laden Lipid Membranes Create a Target for Amyloid Binding. Biophysical Journal. 2012, 103, L27–L29. [CrossRef] [PubMed]
- Schafer, E.A.; Davis, E.; Manzer, Z.; Daniel, S.; Rivnay, J. Hybrid Supported Lipid Bilayers for Bioinspired Bioelectronics with Enhanced Stability. ACS Appl Mater Interfaces. 2023, 15, 24638–24647. [Google Scholar] [CrossRef]
- Jing, H.; Wang, Y.; Desai, P.R.; Ramamurthi, K.S.; Das, S. Lipid flip-flop and desorption from supported lipid bilayers is independent of curvature. PLoS ONE. 2020, 15, e0244460. [Google Scholar] [CrossRef]
- Bangham, A.D.; Standish, M.M.; Watkins, J.C. Diffusion of univalent ions across the lamellae of swollen phospholipids. J Mol Biol. 1965, 13, 238–252. [Google Scholar] [CrossRef]
- Lind, T.K.; Cárdenas, M. Understanding the formation of supported lipid bilayers via vesicle fusion-A case that exemplifies the need for the complementary method approach (Review). Biointerphases. 2016, 11, 020801. [Google Scholar] [CrossRef]
- Nečas, D.; Klapetek, P. Gwyddion: An open-source software for SPM data analysis. Open Phys. 2012, 10. [Google Scholar] [CrossRef]
- Orlikowska-Rzeznik, H.; Krok, E.; Chattopadhyay, M.; Lester, A.; Piatkowski, L. Laurdan Discerns Lipid Membrane Hydration and Cholesterol Content. The Journal of Physical Chemistry B. 2023. [Google Scholar] [CrossRef]
- García-Arribas, A.B.; Busto, J.V.; Alonso, A.; Goñi, F.M. Atomic force microscopy characterization of palmitoylceramide and cholesterol effects on phospholipid bilayers: A topographic and nanomechanical study. Langmuir. 2015, 31, 3135–3145. [Google Scholar] [CrossRef] [PubMed]
- Asakawa, H.; Fukuma, T. The molecular-scale arrangement and mechanical strength of phospholipid/cholesterol mixed bilayers investigated by frequency modulation atomic force microscopy in liquid. Nanotechnology. 2009, 20, 264008. [Google Scholar] [CrossRef] [PubMed]
- Almeida, P.F. A simple thermodynamic model of the liquid-ordered state and the interactions between phospholipids and cholesterol. Biophys J. 2011, 100, 420–429. [Google Scholar] [CrossRef] [PubMed]
- Galván-Hernández, A.; Kobayashi, N.; Hernández-Cobos, J.; Antillón, A.; Nakabayashi, S.; Ortega-Blake, I. Morphology and dynamics of domains in ergosterol or cholesterol containing membranes. Biochim Biophys Acta Biomembr. 2020, 1862, 183101. [Google Scholar] [CrossRef]
Figure 1.
DPPC and DPPC-Sterol Supported Lipid Bilayers. Topographic imagesof SLBs (A-C) and F-SLBs (G-I). A, D, G and J correspond to DPPC. B, E, H and K correspond to DPPC-Chol. C, F, I and L correspond to DPPC-Ergo. Corresponding height histograms are shown below each topographic image. Double or triple-peak gaussian fitted functions are shown in blue along with height peak and R2 values. For height profiles of liquid-imaging topography please see Supplementary Material.
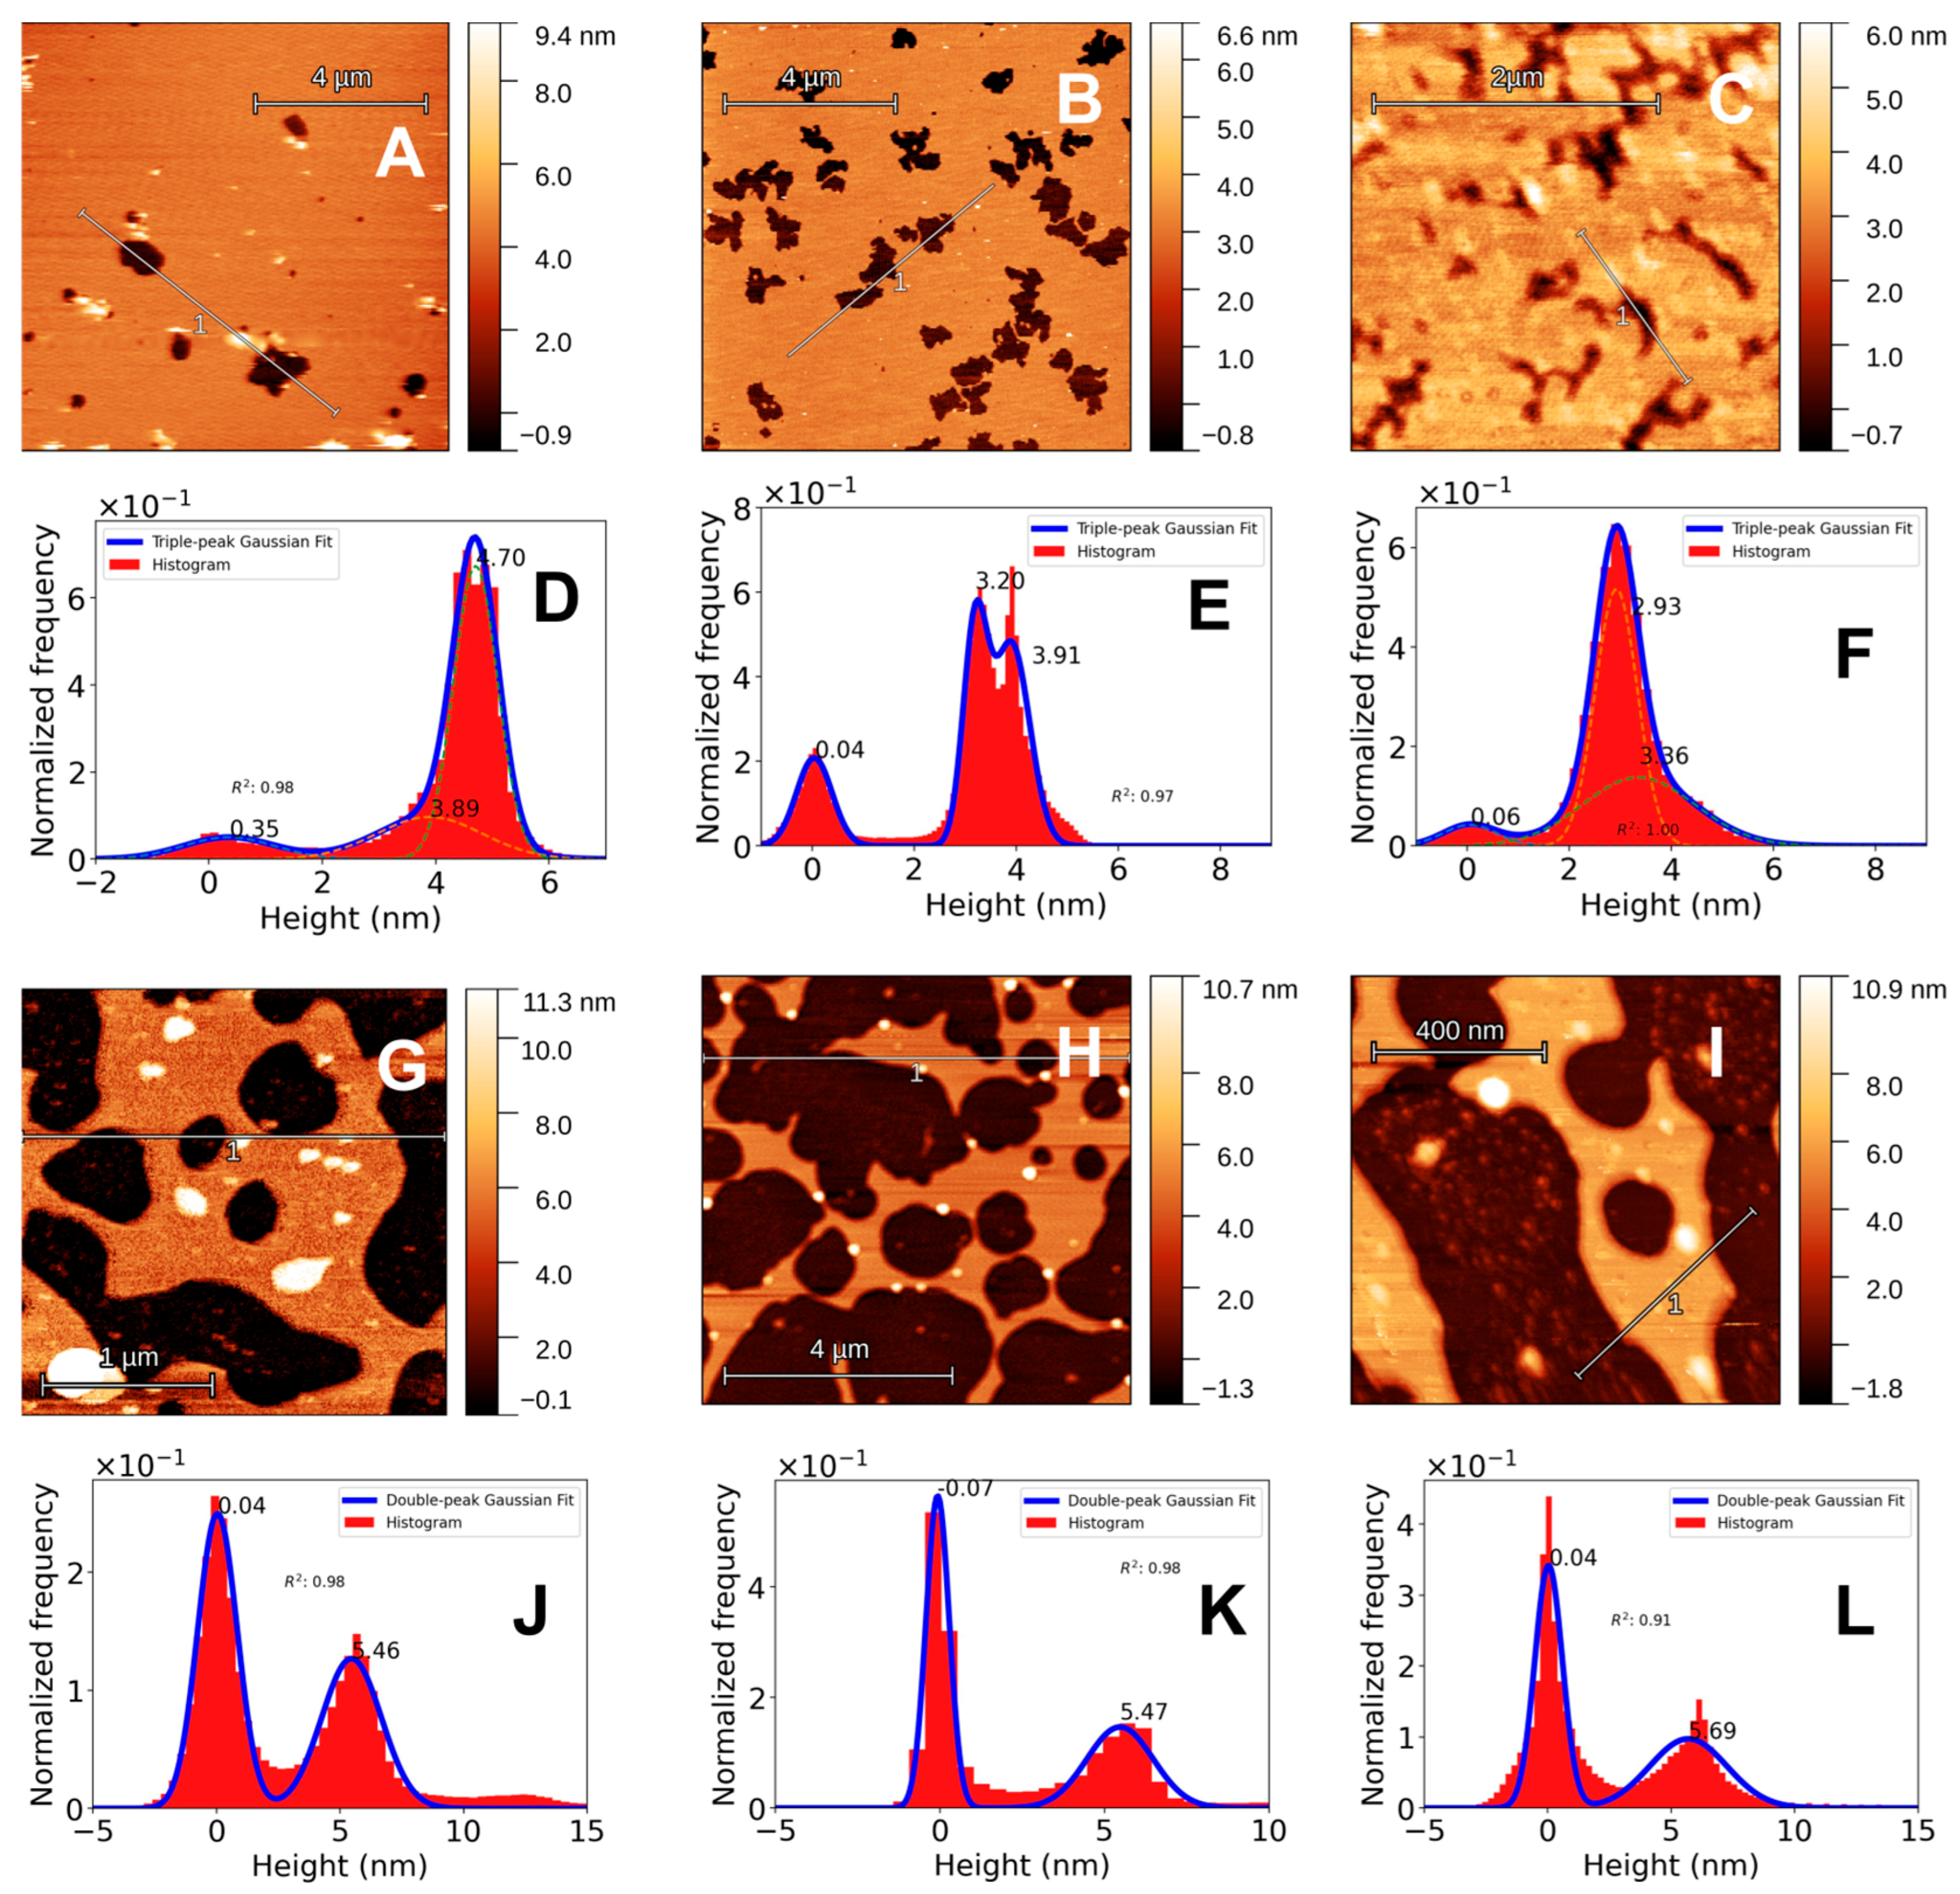
Figure 2.
DPPC Surface Potential. DPPC F-SLB imaged with AFM to obtain topographic (A) and surface potential (C) images. There are two clear regions around 450 mV in blue and 50 mV in orange. Line profiles corresponding to the 2D-images, height (B) and surface potential (D) respectively. Surface potential histogram (E) is shown along with a double-peak gaussian fit with peaks at 47 and 473 mV.
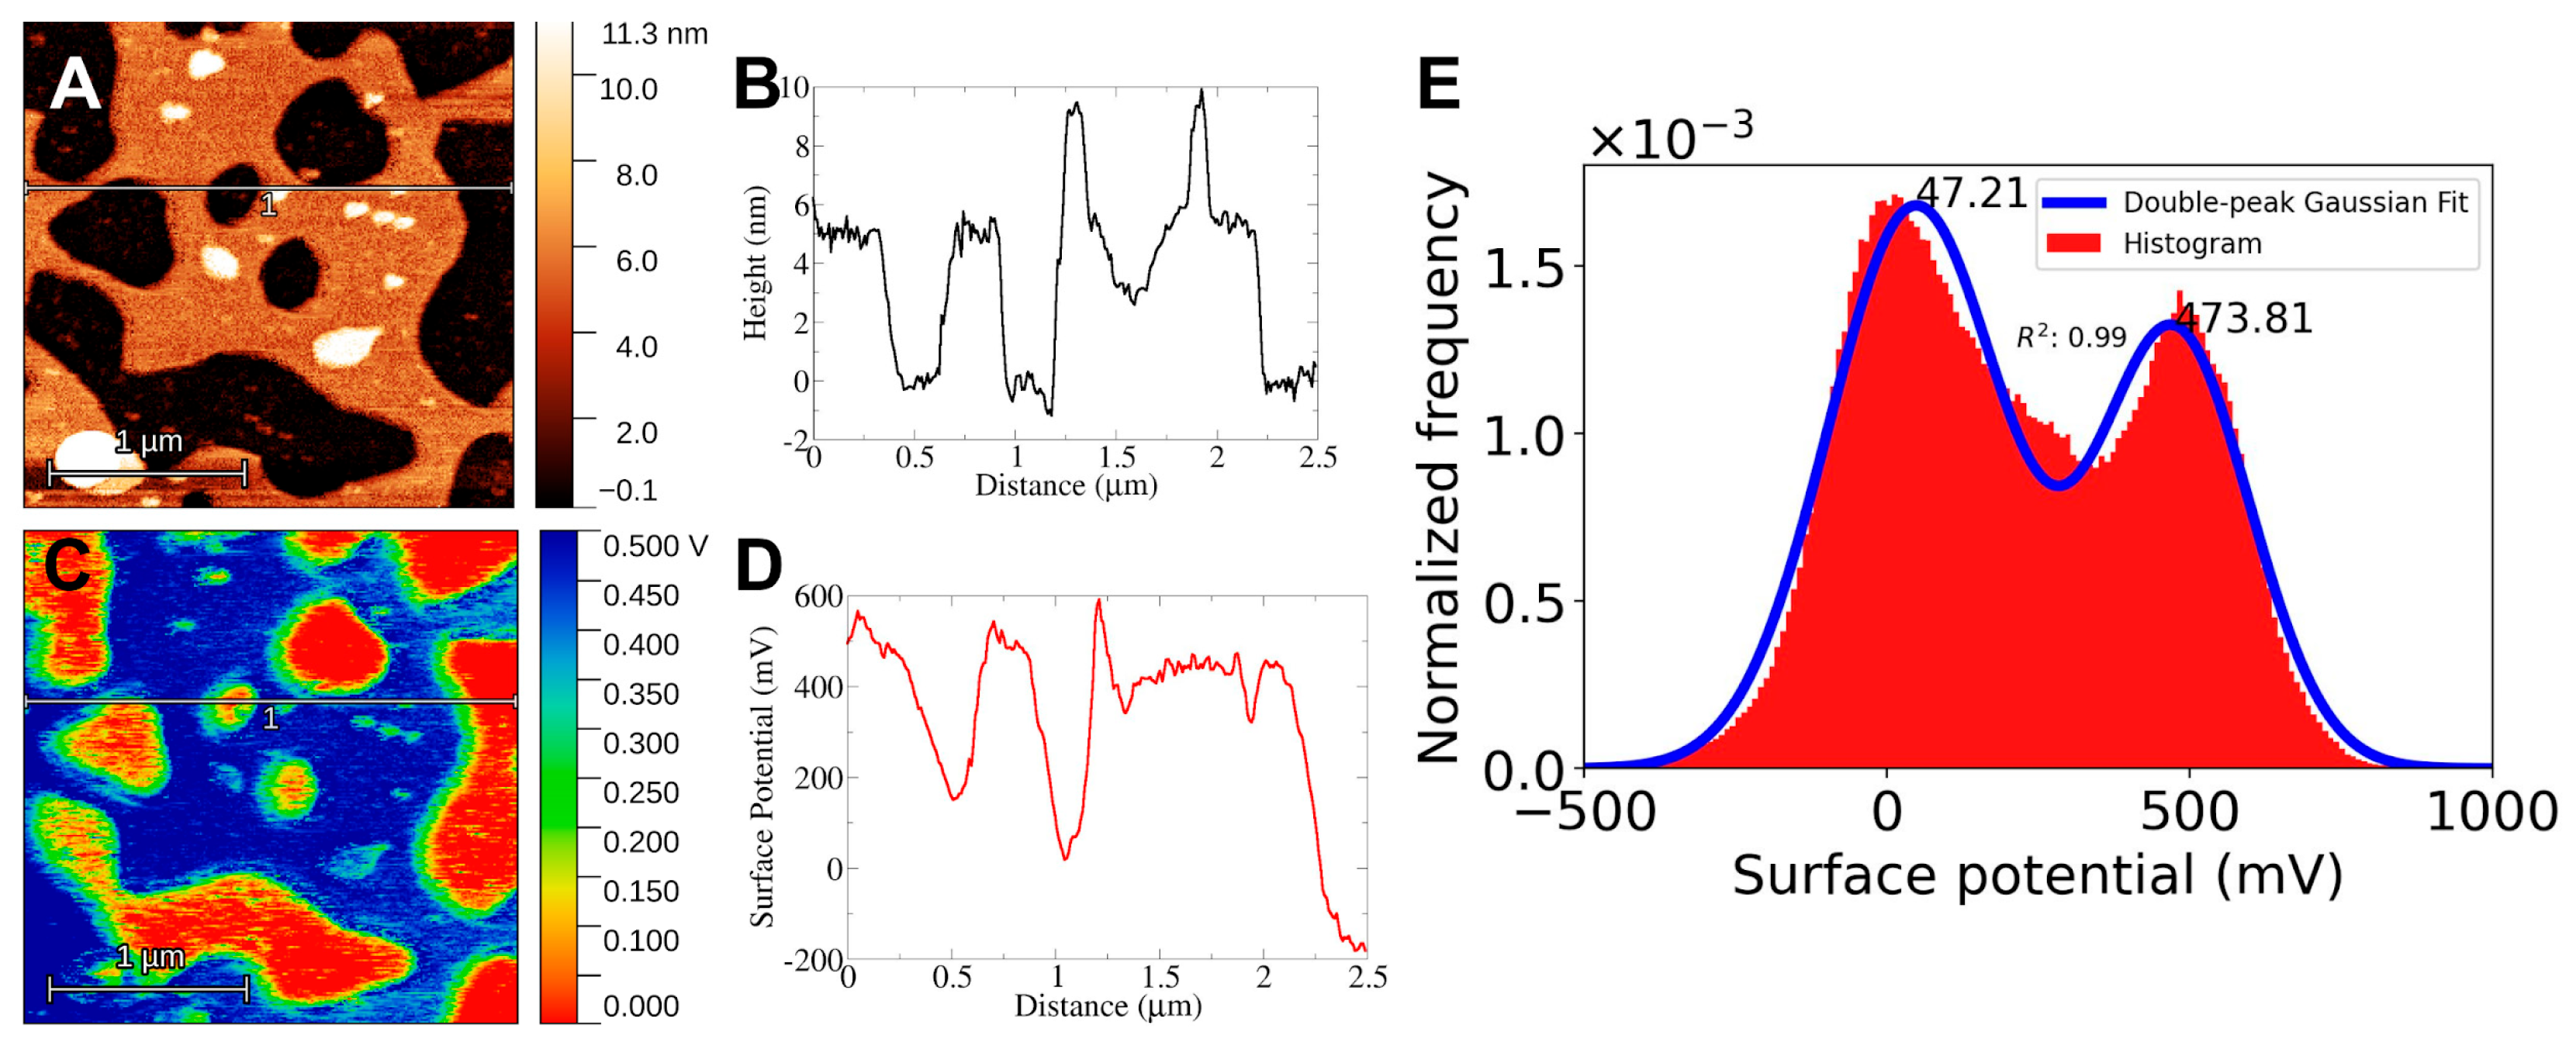
Figure 3.
DPPC-Cholesterol 75/25 mol/mol Surface Potential. DPPC-Chol F-SLB imaged with AFM to obtain topographic (A) and surface potential (C) images. There are two clear regions around 600 mV in blue and 40 mV in orange. Line profiles corresponding to the 2D-images, height (B) and surface potential (D) respectively. Surface potential histogram (E) is shown along with a triple-peak gaussian fit with peaks at 14, 182 and 623 mV.
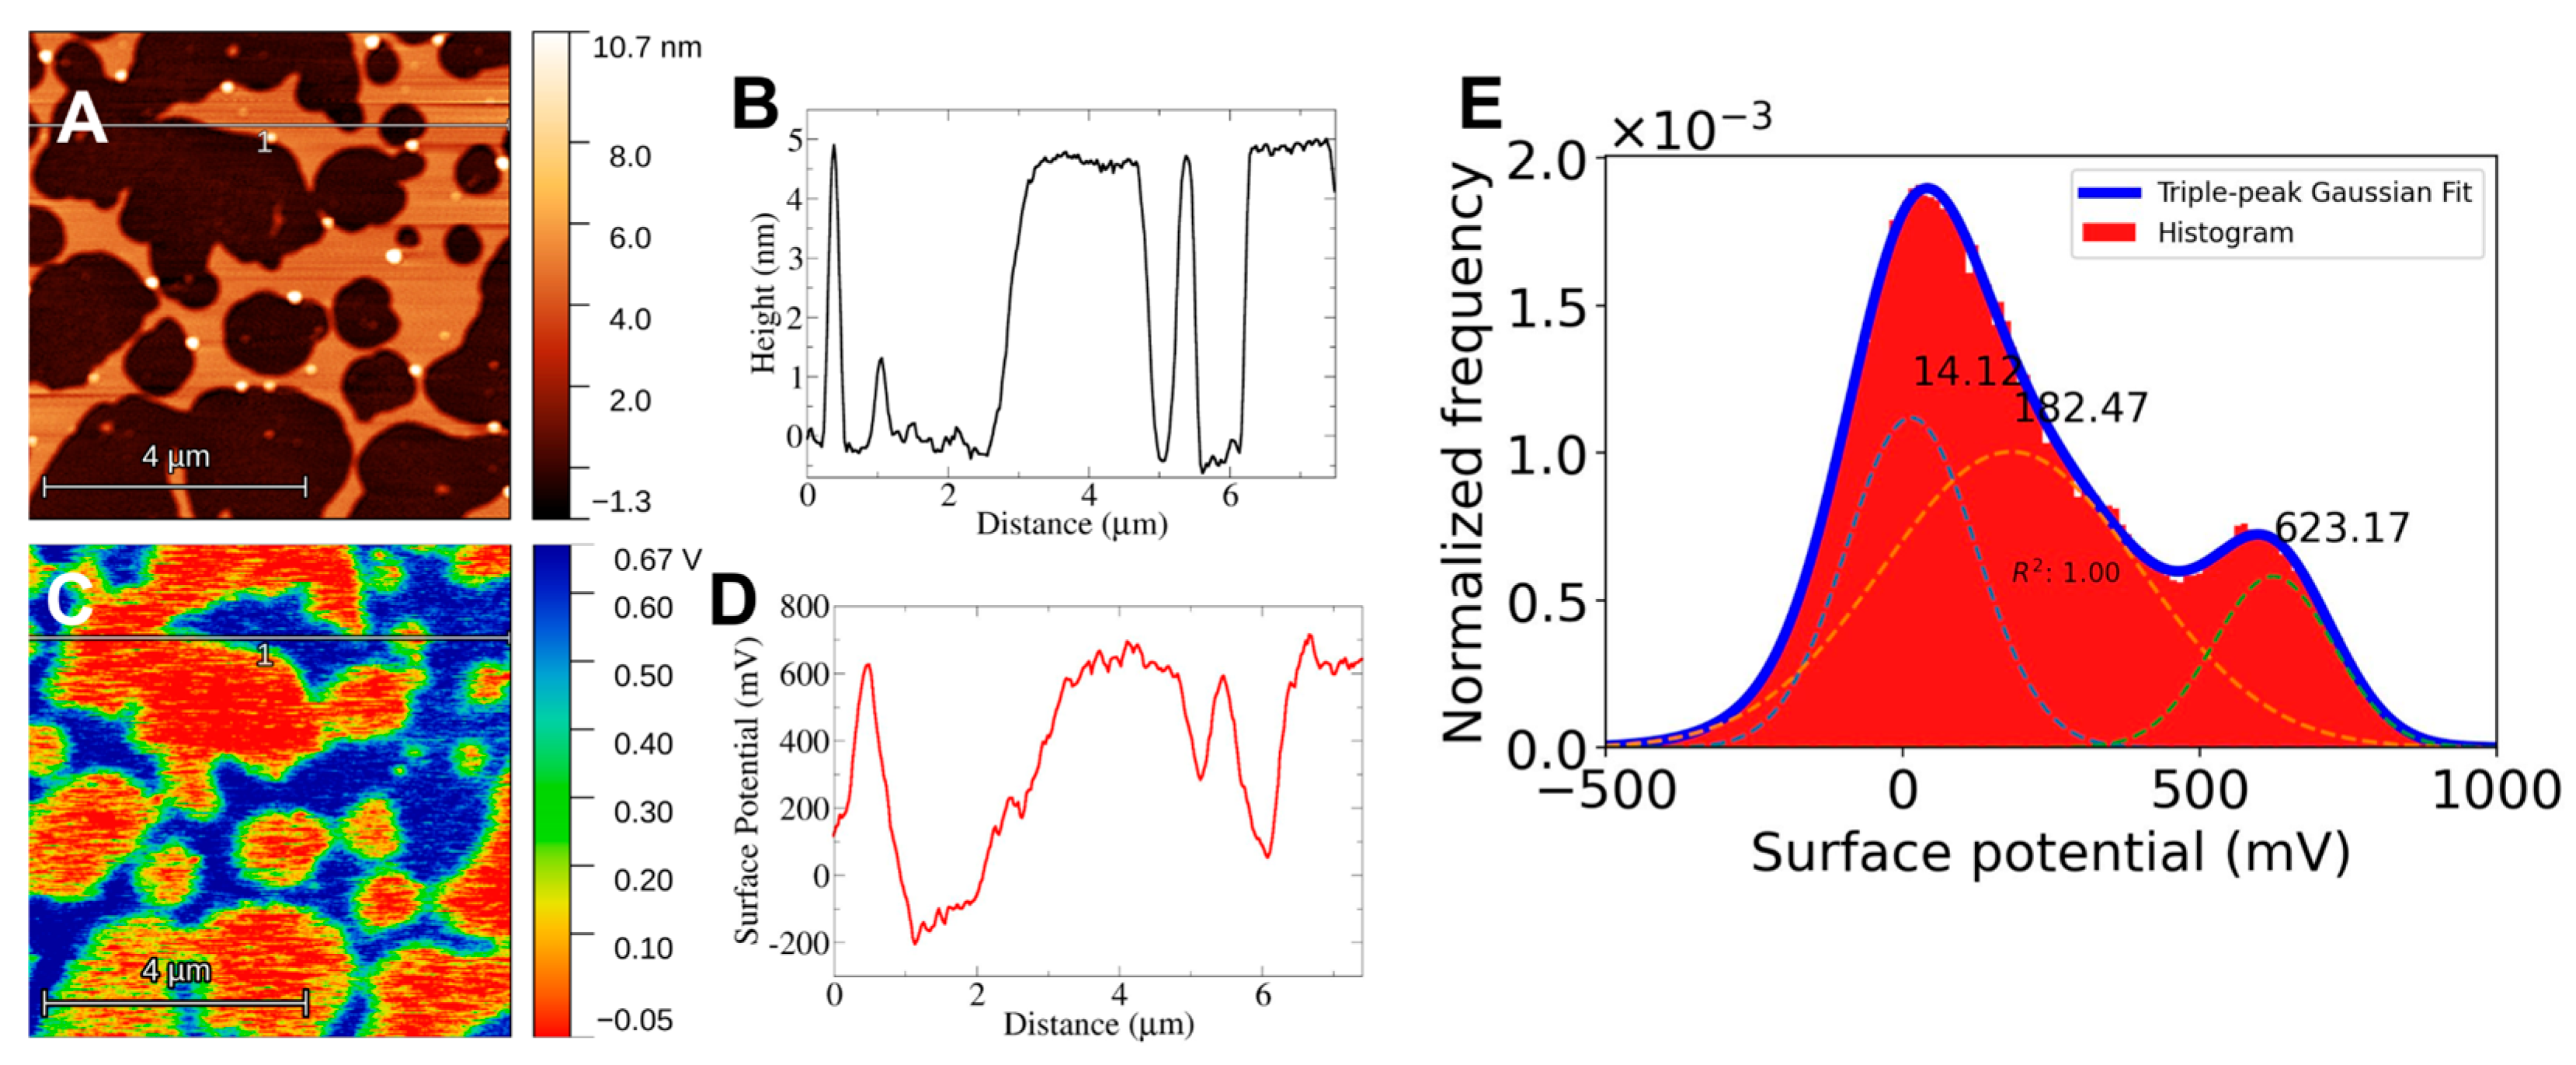
Figure 4.
DPPC-Ergosterol 75/25 mol/mol Surface Potential. DPPC-Ergo F-SLB imaged with AFM to obtain topographic (A) and surface potential (C) images. There are two clear regions around 230 mV in blue and 50 mV in red. Line profiles corresponding to the 2D-images, height (B) and surface potential (D) respectively. Surface potential histogram (E) is shown along with a triple-peak gaussian fit with peaks at -8, 142 and 569 mV.
Disclaimer/Publisher’s Note: The statements, opinions and data contained in all publications are solely those of the individual author(s) and contributor(s) and not of MDPI and/or the editor(s). MDPI and/or the editor(s) disclaim responsibility for any injury to people or property resulting from any ideas, methods, instructions or products referred to in the content. |
© 2025 by the authors. Licensee MDPI, Basel, Switzerland. This article is an open access article distributed under the terms and conditions of the Creative Commons Attribution (CC BY) license (http://creativecommons.org/licenses/by/4.0/).
Copyright: This open access article is published under a Creative Commons CC BY 4.0 license, which permit the free download, distribution, and reuse, provided that the author and preprint are cited in any reuse.


