Submitted:
04 November 2025
Posted:
05 November 2025
You are already at the latest version
Abstract
Prostate-specific antigen (PSA) is a key biomarker for the early detection of prostate cancer recurrence following surgical treatment. In this study, we present a PSA-responsive, aptamer-based switchable aggregate system (AS2-US-AuNPs-Aggregate) composed of ultrasmall gold nanoparticles (US-AuNPs) linked by (partially) pairing oligomers that selectively disassemble in the presence of PSMA. The system was optimized also using a previously developed in-silico routine, and is designed for enhanced sensing capabilities and for supporting in vivo applica-bility. We measured the sizes of the nanosystems by dynamic light scattering (DLS), and their extinction spectra, also in presence of PSA in simple buffers, in the presence of DNAse, and under blood-mimicking conditions (filtered plasma) and We measured a response down to 1 fM PSA in buffers and to 1 pM in filtered plasma. Our findings highlight the potential of aptamer-based nanoparticle aggregates as a basis for us-er-friendly, portable diagnostic tools. Additionally, we discuss key optimization strat-egies to further advance their development for in-vivo diagnostic applications.
Keywords:
prostate cancer
; nanoparticles
; aptamers
; cancer
1. Introduction
Prostate cancer (PCa) is the second most diagnosed cancer in men, with approximately 1.4 million new cases per year[1]. One possible treatment for PCa is radical prostatectomy (RP), a surgical procedure involving the complete removal of prostate tissue. Following RP, Prostate Specific Antigen (PSA) serum level is monitored over time to detect disease relapse. PSA is a secreted protein with a molecular weight of 33 kDa, expressed in both normal and cancerous prostatic tissue, and should not be present in blood after total prostate resection. However, the presence of residual tumour margins after surgery can lead to a cancer relapse with a progressive increase in serum PSA level. When PSA levels rise above 0.2 ng/ml (6 pM, the current critical threshold) in two consecutive measurements, the patient is said to present a biochemical recurrence (BCR), highly indicative of tumour relapse. Using this threshold (defined also as nadir point[2]), approximately 23% of patients experience BCR within five years after surgery.
The development of novel ultrasensitive PSA assays (USPSA), defined as assays with a limit of detection (LoD) below 1 pM[3], has significantly improved the ability to detect early rises in PSA levels. This advancement enables earlier BCR detection following RP, allowing for improved patient management. Furthermore, the introduction of USPSAs has led to the proposal of alternative nadir points, such as 300 fM[4] and 150 fM[5]. However, USPSAs available in clinicals settings still have limitations, including the need for specialised laboratories, high costs, and lack of standardization across different platforms, leading to variability in the results. In parallel, the development of commercial point of care (PoC) PSA tests based on gold nanoparticles, such as Lateral Flow Assays (LFA)-based ones, has provided portable, easy-to-use, non-invasive assays that deliver rapid results. However, these tests suffer from a higher LoD range of 9 pM – 3 nM.[6]
In this context, there is a growing interest for the development of more sensitive assays, including portable ones. Gold nanoparticle-based systems offer excellent optical properties and biocompatibility, making them well-suited for this purpose. Additionally, innovative nanoparticle-based strategies for diagnostic and prognostic applications are paving the way for in vivo use of triggerable nanostructured systems with an ex vivo readout: upon disassembly of these systems injected in living organisms, renal-clearable reporters are released, and these can be rapidly quantified in urine[7,8,9,10,11,12,13]. This approach has proven highly effective in enabling earlier cancer diagnoses compared to traditional in vitro assays, due to an increased tumour environment accessibility and a longer retention. Various platforms have been explored for this purpose, including polymeric nanoparticles (NPs), fluorescent probes, and inorganic NPs. Among them, inorganic-NPs-based systems, particularly the ones using metal nanoparticles (MNPs), offers notable advantages. These systems can be designed as larger nanostructures (typically 100–200 nm) to exploit the enhanced permeability and retention (EPR) effect for (targeted) accumulation in diseased tissues. Subsequently, they can release ultrasmall nanoparticles with a hydrodynamic diameter (HD) <6 nm, which are efficiently cleared through the kidneys via rapid renal excretion. These systems typically exploit enzymatic biomarkers such as metalloproteinases or β-glucuronidases, which are overexpressed in tumours. However, to our knowledge, no studies have focused in targeting specific protein biomarkers.
In this study, we present an activatable aptamer-nanoparticle-based structure responsive to PSA, named AS2-US-AuNPs-Aggregate, composed of aggregated ultrasmall gold nanoparticles (US-AuNPs), with a size suitable for renal clearance. This system is based on a switchable nucleotide architecture composed by two (partially) complementary sequences attached to, and linking together, the US-AuNPs; one of these oligonucleotides incorporates an aptamer specific for PSA. Upon biomarker recognition, the system releases, or is disassembled into, single US-AuNPs. The nanostructure development was initiated by designing switchable sequences through an in-silico approach. Moreover, we evaluated the stability of the AS2-US-AuNPs-Aggregate nanostructure in the presence of blood components to assess its potential for in vivo application. This step is crucial, as physiological fluids such as plasma contain biomolecules that may compromise nanostructure properties. By investigating the behaviour of the system in these complex conditions, we aimed to evaluate its functionality in biologically relevant environments, thus providing key insights into its suitability for translational applications in real-time, non-invasive diagnostics.
2. Materials and Methods
Materials and Instrumentation. Nucleotidic and aptameric sequences were purchased from Metabion (Germany). The Native Human Prostate Specific Antigen (PSA) was obtained from Abcam (Cambridge, United Kingdom). Fluorophores used for ssDNA functionalisation were the following: NHS-Rhodamine (5/6-carboxy-tetramethyl-rhodamine succinimidyl ester; Thermo Scientific™) and Atto580Q-NHS-ester (ATTO-TEC). DNase I Solution used for nucleases stability experiments was purchased by Thermo Scientific™. Human Plasma was obtained from Biowest and Human Female Plasma from Aurogene. Chemicals used in this study were the following: Gold(III) chloride trihydrate, Sodium Borohydride, Tris(2-carboxyethyl)phosphine hydrochloride (TCEP), 3,3′,5,5′-Tetramethylbenzidine (TMB), all from Sigma-Aldrich®. For ELONA assays we used Corstar® 96 well assay flat bottom plate (Corning), colorimetric readings were performed with the Infinite ® PRO 200 (TECAN) instrument. DLS (Malvern Panalytical, Zetasizer Nano ZS) and UV-Vis spectra (Agilent, Cary 3500 UV-Vis) were used for nanostructures characterisation. DLS was set with PBS as solvent and gold as material of the nanoparticles. DLS for Zeta potential measurements were set in automatic mode. All measurements were done with a backscatter measurement angle =137°.
Enzyme-linked Oligonucleotide Assay (ELONA). The aPSA[14], AS2[15] and As2-tail sequences were tested with ELONA. A 96-well Assay plate was incubated with 250 ng of PSA (diluted in 100 μl of 0.1 M NaHCO3 pH 9.6 buffer) at 37 °C for one hour with agitation. The PSA solution was removed, and, without additional washing, incubated for 2 hours at room temperature with 200 μl of Blocking Solution (BSA 3% + 100 nM of an equimolar mixture of the coating ssDNA sequences hlyQF, hlyQR, L23SQF, L23SQR)[27]. Blocking Solution was removed, without additional washing. 100 μl of folded biotinylated-sequences (aPSA-biotin; AS2tail-biotin and annealed AS2tail-biotin:RevAS2) were prepared in 1:2 serial dilutions in PBS buffer supplemented with 5 mM MgCl2, ranging from 500 nM to 3.9 nM, and incubated for 1 hour at 37°C with gentle shaking. The solution was removed and washed once with 200 μl of Washing Solution (PBS Tween-20 0.05% (v/v)). 100 μl of the enzyme conjugation solution (HRP-streptavidin diluted 1:20,000 in PBS BSA 1%) were added and incubated for 1 hour with gentle shaking at room temperature. The enzyme-conjugation solution was removed, and washed six times with 200 μl of Washing Solution. 100 μl of 5,5´-Tetramethylbenzidine (TMB) solution was added, the plate was incubated from 3 to 20 minutes, until the solution started to turn blue, at which point 100 μl of TMB stop solution (0.16M sulphuric acid) were added. Absorbance values were read at 450 nm, and the response curve was generated after applying blank correction (samples without aptamer).
Switchable nucleotide-sequences development. The in silico protocol applied to investigate the interaction of the AS2 aptamer and PSA was developed in a previous work[17]. This protocol was used to predict which nucleotides of the aptamer contact PSA and to estimate their respective energy contributions to the binding interaction. Briefly, after obtaining the 3D structure of the aptamer we performed a flexible docking interaction and post-docking analysis between the aptamer and the target protein. The crystallographic structure of the PSA protein used for the simulation corresponds to the PDB code 2ZCK. The NUPACK online tool (NUPACK3 version, [28]) was used to predict the secondary folding and thermal stability of these sequences [29,30]. Thermal stability was calculated between 30 and 70 °C using a saline concentration of 150 mM of NaCl and 25 mM of Mg++. In silico melting temperatures (Tm) of the complexes were estimated using a nucleotide concentration of 100 nM and Tm was calculated as the temperature at which the concentration of the AS2 and Control duplexes lowered to 50 nM. Melting temperatures of AS2-tail:RevAS2 and AS2tail-ctrl:RevAS2-ctrl were measured by performing absorbance reading at 260 nm. Firstly, sequences were annealed in Annealing Buffer (50 mM Tris-HCl, pH 7.5, 150 mM NaCl, 25 mM MgCl2) at a concentration of 100 nM with the following thermal steps: 2 minutes at 95 °C and then the solution was cooled down at 12 °C with a temperature ramp of -2 °C/min. For melting curve recording, absorbance values of the annealed DNAs solutions were recorded at 260 nm from 25 to 75 °C, with temperature steps dT of 1°C and with a temperature rate of +2°C/min. For in vitro analysis, melting temperature of the annealed sequences was determined as the one at the maximum value of the first derivative of the absorbance (A) with respect to the temperature (T) of the recorded melting curve (dA/dT).
US-AuNPs synthesis and functionalisation. US-AuNPs were synthetized following a protocol for obtaining 2-nm diameter nanoparticles[31], then they were characterised for size (DLS) and plasmonic properties (absorbance reading). Briefly, 375 μl of a 4% HAuCl4 solution and 500 μl of 0.2 M K2CO3 were added to 100 ml of cold Millipore water, while stirring. Then, five 1 mL aliquots of 0.5 mg/ml sodium borohydride (NaBH4) solution were added to the reaction solution while rapidly stirring. US-AuNPs concentration was calculated using a molar extinction coefficient of 6.5 × 105 cm-1 M-1 at a wavelength of 510 nm [18]. US-AuNPs were decorated with thiolated sequences (i.e. sequences modified by C3-SS or C6-SS thiol modifier) reduced by incubation of 30 μl of oligonucleotide solution (100 μM) with 3 μl of 100 mM TCEP and 2 μl of Acetate Buffer 100 mM pH 5.2 for 1 hour at room temperature. Reduced sequences were purified with Amicon spin 3 KDa filters and quantified by absorbance reading at 260 nm. For US-AuNPs functionalisation, 1 nanomole of reduced ssDNA was incubated with 100 μl of the US-AuNPs solution with shaking overnight at room temperature. The day after, 500 mM Tris-acetate (pH 8.2) buffer and 1M NaCl were gently added dropwise to each vial to obtain a final Tris-acetate concentration of 5 mM and NaCl final concentration of 300 mM. The reaction vials were stored with shaking for one additional night. ssDNA decorated US-AuNPs were purified with Amicon 100 KDa Filters and suspended in 300 mM NaCl, 25 mM Tris acetate, pH 8. The ssDNA/particle ratio was estimated with UV-Vis measurements by subtracting the contribution of the US-AuNPs at 260 nm[18] from the absorbance value recorded at 260 nm. The obtained value was used for calculating the oligonucleotides concentration. The ssDNA/particle ratio was finally calculated by dividing the ssDNA concentration obtained to the AuNPs concentration value of the solution.
US-AuNPs-Aggregate assembly and characterisation. To prepare the AS2-US-AuNPs-Aggregate, equal volumes of two separately synthesized batches—RevAS2-US-AuNPs and AS2-US-AuNPs—were mixed at a 1:1 ratio and stored at 4 °C overnight while stirring, and purified by centrifuging the solution at 1000 xg for 2 minutes; the nanoparticle pellet was resuspended in 150 mM NaCl 5 mM Tris-acetate pH 8.2 buffer solution. The AS2ctrl-US-AuNPs-Aggregate was prepared using the same protocol, mixing AS2ctrl-US-AuNPs with RevAS2ctrl-US-AuNPs. DLS and UV-Vis spectroscopy were employed to characterize the size distribution and optical properties of both Aggregates. The plasmonic peaks of the aggregates were determined by identifying the wavelengths at which the first derivative of the absorbance with respect to wavelength equals zero, after applying a five-point average smoothing. Thermal stability was assessed by monitoring the changes in hydrodynamic diameter at DLS across a temperature range of 30°C to 75°C.
AS2-US-AuNPs-Aggregate PSA response characterisation in PBS. Stability and Kinetic analysis of the AS2-US-AuNPs-Aggregate in the presence or absence of different concentrations of PSA was conducted for about 30 minutes at 37°C using DLS (set to perform 15 measurements in automatic mode). For these studies, the Aggregate was used at a final concentration corresponding to an absorbance (1 cm light path) of 0.02–0.03 at the plasmon peak. Control reactions were performed with the AS2ctrl-US-AuNPs-Aggregate under identical conditions. PSA was tested initially at 1 pM and 1 nM. DLS data were analyzed using the instrument software with the following settings: material set as gold (refractive index [RI] = 0.20; absorption = 3.320) and dispersant set as water (RI = 1.1330; viscosity = 0.6864). Data processing was carried out under the “general purpose” analysis mode, and the resulting size distributions were reported as provided by the software. Additionally, we further analysed the DLS provided correlogram as explained in the following. The correlogram characterizes the fluctuations of the intensity ; in particular, its autocorrelation function is defined as where the angled bracket indicates an average over time . can usually be written as , where is the normalized electric field autocorrelation function. If the colloid is not monodispersed, becomes a sum of several exponential decays or an integral representing a continuous distribution of hydrodynamic diameters. The DLS software allows for exporting a correlation coefficient derived from the by subtracting the long lag-time background , assuming the intensity remains relatively constant during the measurement, and by applying normalization. This correlation coefficient is proportional to . We fit this function with a squared multiexponential function ; the number of components was set to 2 or 3, with constraints sometimes imposed on possible ranges of . Each corresponds to a hydrodynamic diameter given by (µs) nm in our setup ( is the temperature, the Boltzmann constant, the refraction index and the viscosity of the medium, and =137° as already specified). For the incubation of AS2-US-AuNPs-Aggregate with PSA, the fitting constraints were: τ₁: 0–250 µs (corresponding to d₁ ≤ 116 nm); τ₂: 250–700 µs (d₂ in the 116–325 nm range) and τ₃: >1 ms (d₃ > 464 nm).
The AS2-US-AuNPs-Aggregate was then tested by incubating it with PSA in a concentration range between 1 fM to 100 nM. The AS2-US-AuNPs-Aggregate was also incubated with BSA at a concentration range from 1 fM to 500 μM. The AS2ctrl-US-AuNPs-Aggregate was incubated in the same conditions. These tests were performed at a temperature of 37°C. If not otherwise stated, measurements were taken 15 minutes after the addition of PSA to the Aggregate suspension and recorded for about 5 minutes. The size of the Aggregates was monitored by DLS measurements, and the absorbance spectrum was recorded as well.
Förster Resonance Energy Transfed (FRET) response of annealed AS2-Rhodamine:RevAS2-atto580Q sequences to plasma nucleases. AS2-NH2 and RevAS2-NH2 sequences were labelled respectively with NHS-Rhodamine and atto580Q-NHS-ester. Labelling reaction was performed overnight at room temperature in PBS 10x using a 10-fold molar excess of the fluorophore. The labelled ssDNAs were isolated by fraction collection with DNAPac™ PA100 (Thermo Scientific™) column with HPLC, using Tris HCl 20 mM pH 7.6 (eluent A) and Tris HCl 20 mM NaCl 1 M pH 7.6 (eluent B) as mobile phases with a gradient from 30% to 100% of B mobile phase in 20 minutes of run. Collected fractions were concentrated in MilliQ water using Amicon 3KDa filters, previously coated with BSA 1%. AS2-Rhodamine and RevAS2-atto580Q were annealed at equal molar ratios as described earlier. A solution of 20 nM of AS2-Rhodamine:RevAS2-atto580Q was incubated with human plasma (Biowest, France) diluted 1:8 at a temperature of 37°C. Fluorescence measurements were taken at 15-minute intervals over a duration of 10-30 hours. The fluorimeter was set with an excitation wavelength of 540 nm with a slit aperture of 10 nm, and emission wavelength between 550 and 750 nm with a slit aperture of 5 nm. The photomultiplier tube (PMT) voltage was maintained at 900 V throughout the measurements. Fluorescence intensity, after background removal (refer to S2), was calculated as the area under the curve (AUC) within the wavelength range 570 to 610 nm. For the stability of AS2-Rhodamine:RevAS2-Atto580Q towards DNase I, a solution containing 200 nM of AS2-Rhodamine:RevAS2-Atto580Q was incubated with DNase I 0.3 U/ml. Fluorescence measurements were conducted at 60-minute intervals over a 14-hour period and quantified as before. Averages and integrals have been calculated using Microsoft Excel; fit of the backgrounds have been performed using OriginPro 9 (OriginLab Corporation, Northampton MA, USA), calculation of additive and multiplicative constant for the background, background subtraction and integration of the spectra have been automatized using a home-made script in MATLAB R2017b.
Stability of the AS2-US-AuNPs-Aggregate to DNase I activity. An AS2-US-AuNPs-Aggregate solution at a DNA final concentration of 200 nM was incubated with DNase I at a concentration of 0.3 U/ml. DNA digestion was monitored by following AS2-US-AuNPs-Aggregate size and count rate variation with DLS every 60 minutes after the addition of DNase I for 14 hours.
US-AuNPs-Aggregate interaction with filtered Human Plasma. Human female plasma (pooled; TCS Biosciences, United Kingdom) was processed as follows: plasma was first centrifuged at 3,000 xg for 30 minutes at 4 °C to remove cells and cellular debris. The resulting supernatant was centrifuged at 10,000 xg for 1 hour at 4°C and then filtered using SterilFlip® 0.22 μm filter to remove microvesicles. Finally, the supernatant was then centrifuged at 33,000 xg for 1 hour and 30 minutes at 4°C to eliminate exosomes and larger plasma complexes. The obtained supernatant was finally filtered using an Amicon 100 kDa filter at 12,000 xg for 15 minutes, to remove large proteic and lipidic complexes. Plasma was characterised using DLS at every purification step. The stability and the response to PSA presence of the AS2-US-AuNPs-Aggregates in the presence of plasma was evaluated incubating them at a concentration causing an optical density of 0.1 at the plasmonic peak, with the filtered plasma diluted 1:6 at a temperature of 37°C. The Aggregate stability was assessed over a 2-hour duration through DLS. The response to PSA was tested at PSA concentrations of 10 fM, 100 fM, 1 pM, and 10 pM. The reaction kinetics were monitored using DLS over a 20-minute interval.
Statistical Tests. All data are reported as mean ± standard deviation (in Tables) or standard error (in Figures). All the data sets were analysed with t-test comparisons. Significance was attributed with a P value less than 0.05. Specifically, in figures significance is represented as follows: P<0.05 is *, P<0.01 is ** and P<0.001 is ***.
3. Results
3.1. PSA-Binding Aptameric Sequences Design and Validation
For the development of the US-AuNPs-Aggregate, we evaluated two previously published aptameric sequences, aPSA[14] and AS2[15]. The binding ability and affinity of these aptamers was assessed by a direct Enzyme-Linker Oligonucleotide Assay (ELONA)[16] (Figure S1). In our experiments, the aPSA aptamer didn’t exhibit any detectable binding response (Figure S1A). In contrast, the AS2 sequence demonstrated a significant binding at a concentration of 250 nM (t-test, p < 0.05), confirming its binding ability under our experimental conditions, which included a temperature of 37°C and physiologic saline concentration (Figure S1B, black line; Section S1). Considering these results, we selected the AS2 aptamer for the development of the switchable nucleotidic architecture. This relies on two DNA sequences: AS2tail, which comprehends the AS2 aptamer flanked by a tail of several additional bases, and RevAS2, which is complementary to a portion of AS2tail (as better explained below), and is released upon PSA recognition (Figure 1A, Table S1).
The design of RevAS2 is critical: in particular, the selection of the AS2 bases annealing to it is essential for enabling the switching mechanism. These specific AS2 nucleotides hybridizing with RevAS2 (referred to as “trigger nucleotides”) should interact with PSA with an energy high enough to support the triggering of the system activation, but they should not be part of the highest-affinity binding domains. In this way, these high-affinity regions can start the recognition of PSA, bringing therefore also the trigger nucleotides into close proximity with the part of the protein where they bind. This spatial arrangement facilitates the complete aptamer engagement with PSA, inducing therefore the de-hybridization of the duplex structure. However, identifying experimentally the most effective trigger nucleotides can be labour-intensive. To streamline this, we analysed the molecular interactions between the AS2 aptamer and PSA using a previously developed molecular docking approach[17]. As shown in Figure 1B, energy contributions of individual nucleotides from the docking results (Figure 1C) revealed a key interaction domain spanning bases 17 to 24, part of a stem-loop structure spanning bases 17-30 (see the secondary structure prediction in Figure 1D). Additional interactions derive from nucleotides 11 to 15, comprehending another part of a prominent stem-loop structure spanning bases 4–14 at the 5' terminus (Figure 1D), and from the 3' end, between bases 31 to 39, in an unstructured region for the free aptamer. Based on these findings, RevAS2 was designed to hybridize in this last region, with nucleotides 32–40 at the 3' terminus of the AS2 aptamer. Comparative secondary structure predictions at 37 °C for the unmodified AS2 aptamer and the AS2-tail:RevAS2 duplex (Figures 1D and 1E) demonstrated the maintenance of the aptamer native folding, which is essential for PSA binding. A control duplex (AS2ctrl:RevAS2ctrl) was designed using a scrambled sequence for the aptamer (Figures S2A and S2B). The full list of sequences used in this study is provided in Table S1.
Since the sensing reaction is designed to work at body temperature (37 °C), we assessed the thermal stability of the AS2-tail:RevAS2 and AS2ctrl:RevAS2ctrl duplexes. Melting temperatures (Tm) were calculated during the design stage of the duplex using NUPACK simulations, which predicted a Tm of 56°C for AS2-tail:RevAS2 duplex and 53°C for AS2ctrl:RevAS2ctrl (Figure 2A, Table S2). To estimate the stability of AS2-tail:RevAS2 upon PSA binding, we predicted the melting curve for a RevAS2-short strand, e.g. a RevAS2 lacking the nucleotides complementary to the aptamer, hybridized with a complete AS2-tail. This resulted in no duplex formation in the considered temperature range, indicating that the duplex should not be stable upon PSA binding (Figure 2A, green dotted line). Experimentally measured Tm were 52 °C for the AS2-tail:RevAS2 duplex and 53 °C for AS2ctrl:RevAS2ctrl (Figure 2B, Table S2), consistently with the values obtained by the simulations.
The affinity of the AS2tail:RevAS2 duplex towards PSA was confirmed by ELONA, obtaining a significant signal starting from a dsDNA concentration of 250 nM (t-test, p < 0.05). These findings demonstrate that AS2 retains its binding capability when incorporated into the duplex structure, maintaining comparable affinity to the native aptamer sequence under physiological conditions (Figure S1B).
3.1. Ultrasmall-AuNPs Functionalisation and Characterisation
US-AuNPs, synthetized as explained in the experimental section, were characterised for both size and zeta-potential by DLS (Table S3), and for plasmonic properties by absorbance reading (Figure 3A, B, C and Table S3). The obtained US-AuNPs showed an hydrodynamic diameter with a mean size of 4.6±0.2 nm (averaged weighting with number), a plasmonic peak at 508.0±1.0 nm consistent with the desired size of the nanoparticles[18] (Figure 3A, red line), and a zeta-potential of -11.5±1.3 mV. The plasmon peak position of the naked US-AuNPs was evaluated 24 hours post-synthesis, revealing a slight redshift, indication of an increased size suggestive of a colloidal instability (Figure S3). This increase in size is supported by an increase in the measured intensity-weighted average of the diameters, from 7.4±0.3 nm to 9.3±1.0 nm (although the number-average diameter remained consistent, from 4.5±0.6 to 4.5±0.2 nm). Even if the effect was small, all these results suggest that naked US-AuNPs tend to aggregate in larger nanoparticles and highlight the necessity for immediate functionalization after preparation: in the following syntheses we functionalised immediately the US-AuNPs with thiolated oligonucleotides (AS2tail-thio, RevAS2-thio, AS2tail-ctrl-thio and RevAS2-ctrl-thio, see Table S1). AS2tail-, RevAS2-, AS2ctrl-, and RevAS2ctrl-US-AuNPs refer to gold nanoparticles functionalized with the respective DNA sequences. ssDNA-US-AuNPs characterized for size and plasmonic peak before and after purification with a 3 kDa filter revealed no changes in ssDNA-US-AuNPs properties following purification (Figure 3A), supporting also the absence of aggregation. The obtained ssDNA-US-AuNPs showed an increased hydrodynamic radius (11.9±0.4 nm for AS2tail-US-AuNPs and 7.7±0.4 for RevAS2-US-AuNPs), a plasmonic peak shifted toward longer wavelengths (517.5±0.3 nm for As2tail-US-AuNPs and 515.3±0.3 for RevAS2-US-Au-NPs), and a lower zeta-potential (-19.7±0.5 mV for AS2tail-US-AuNPs and -18.8±1.8 mV for RevAS2-US-AuNPs) compared to US-AuNPs; AS2ctrl-US-AuNPs and RevAS2ctrl-US-AuNPs exhibited the same trend (full characterisation data are reported in Table S3). The number of DNA molecules per nanoparticle was calculated by comparing the absorbance spectra of the US-AuNPs with those of the ssDNA-functionalized US-AuNPs (Figure 3B), as explained in the experimental section, obtaining an averaged ssDNA/particle functionalisation ratio of 8.1±2.9.
3.3. US-AuNPs-Aggregate Assembly and Characterisation
The Aggregates were assembled as described in the experimental section. The obtained sizes (averaged in number) of the Aggregates were 189±35.3 nm for the AS2-US-AuNPs-Aggregate and 157.5±31.6 nm for the AS2ctrl-US-AuNPs-Aggregate. The plasmonic peak fell at 526.5±0.5 nm and 528.3±0.5 nm, respectively (Table S3, Figure 3C). Even if the plasmonic shift was lower than the one expected for full gold NPs with the same diameter of the one measured by DLS, it was positive as expected for the increase in US-AuNPs-Aggregate size. In these Aggregates, nanoparticles are linked by an oligonucleotide sequence of about 40 base pairs, resulting into an average interparticle distance of about 12 nm. As previously reported in similar structures[17], this spacing leads to only partial plasmonic electromagnetic coupling between the US-AuNPs, and therefore to a reduced plasmonic shift.
Thermal stability studies of the US-AuNPs-Aggregates demonstrated that the nanostructures remain stable at physiological temperature and undergo disassembly into individual US-AuNPs upon reaching the melting temperature (Tm) of the involved duplexes (Figure 3D and Table S2). These results also confirm that the formation of the Aggregates is driven by annealing-induced assembly of the DNA-linked nanoparticle. It is noteworthy that the melting temperature of the US-AuNPs-Aggregates was slightly higher than the one of the dsDNA alone. This discrepancy may be attributed to various factors that introduce complexity and influence the Tm when transitioning to DNA-linked nanoarchitectures, such as the DNA surface coverage, its high density on the surface, and the expected multiple dsDNA-linkages between NPs[19].
3.4. AS2-US-AuNPs-Aggregate response to PSA
The stability and the kinetic behaviour upon PSA introduction of the AS2-US-AuNPs-Aggregates are key factors in assessing their suitability for potential practical in vivo applications. In the absence of PSA, the AS2-US-AuNPs-Aggregate and the AS2-Ctrl-US-AuNPs-Aggregate showed no significant size variation with time, as observed in DLS measures, indicating stability over at least 30 minutes at 37°C (Figure S4, S5B).
The AS2-US-AuNPs-Aggregate kinetic was preliminary investigated by incubating it with PSA at 1 pM and 1 nM concentrations (Figure S4A). Notably, the number-weighted size distribution analysis proved more sensitive than the intensity-weighted size distribution analysis for detecting smaller particles in the sample (Fig. S4A; cyan vs violet dots in Fig. S5); these smaller particles likely correspond to single nanoparticles or smaller aggregates released from the AS2-US-AuNPs-Aggregates. The observation of smaller particles occurred after 10-15 minutes of incubation with PSA at concentration of 1 pM, even if they were not always highlighted by the number-averaged size either (Fig S4A, S5C). This occurred more frequently at 1 nM PSA (Figure S4A, S5D). Despite the occasional bigger impact of larger particles after the Aggregate started to disassemble, these data indicate a concentration-dependent response. The AS2-Ctrl-US-AuNPs-Aggregate, under the same conditions, did not show distinct changes in size over the observed period (Figure S4B), confirming the specificity of the reaction.
To gain deeper insights into the mechanism underlying Aggregates disassembly and, in particular, the chaotic behaviour observed in the number-weighted size distributions, we conducted a more in-depth analysis of the DLS data. Indeed, the accuracy of the fit provided by the DLS software can be affected by long-time decays in the autocorrelation function, due to sedimentation or movement of large Aggregates, dust particles or bubbles. These can introduce a background signal that affect data interpretation. To mitigate this issue, we refined the analysis by doing an additional regression analysis of an autocorrelation function outputted by the DLS software, by fitting it with simpler functions from whose parameters it was possible to estimate one, two, or three sizes characterizing the distribution of the nano-Aggregates and/or NPs sizes (Fig S5A; refer to the experimental section for details). The results of this analysis did not contradict the previous results about stability and dose-response behaviour of the AS2-US-AuNPs-Aggregates. However, they helped visualizing better the appearance, 8-15 minutes upon PSA introduction, of at least two populations of scattering entities characterized by sizes called d1 and/or d2 (see Figures S5 B-D, and the Experimental Section for details). These observations are also supported by analysing the size intensity-weighted distributions at different times after the introduction of different concentrations of PSA in the solution containing AS2-US-AuNPs-Aggregate (Figure S6), which revealed the appearance of a second peak with smaller hydrodynamic radius 8 / 13 minutes after PSA addition (Figure S6B, S6C). Another, simpler way to highlight and quantify this trend was to consider the time average (and standard error) of the DLS number-weighted-average size in a ~5-min range (or more) after 15 minutes upon PSA addiction (Figure S6D). This approach allows for a faster automatic interpretation of the DLS outputs and is utilised for the presentation of the next results.
The response of the AS2-US-AuNPs-Aggregate to PSA was evaluated across a concentration range of 1 fM to 100 nM. Number-weighted means of sizes were averaged over a 5-minute interval, beginning 15 minutes after PSA addition. These average sizes for AS2-US-AuNPs-Aggregates decreased upon incubation in a concentration-dependent manner (Figure 4A, blue line and triangles). A statistically significant reduction in the Aggregate size was observed starting at a PSA concentration of 10 fM (t-test). The AS2-US-AuNPs-Aggregate response increases at higher PSA concentrations, demonstrating a further decrease in size of the nanostructure. The specificity of the reaction was tested by incubating the AS2-US-AuNPs-Aggregates with BSA up to its physiological concentrations (500 μM). BSA was selected due to its structural similarity to Human Serum Albumin (HSA); both albumins are commonly used in biophysical and biochemical studies[20]. No significant changes were observed in the Aggregates size upon BSA incubation, even at the highest tested concentration (Figure 4A, black line). Similarly, the AS2-Ctrl-US-AuNPs-Aggregate, under the same conditions, showed no discernible trend either in size variation (Figure 4B) or for plasmonic shift (Figure S7B), neither with PSA nor with BSA.
We actually checked for changes in the UV-Vis absorbance spectra of AS2-Ctrl- and AS2-US-AuNPs-Aggregates upon introduction of PSA in all tested concentrations and conditions, but we never observed substantial shifts of the plasmon peak. A tendency of the plasmonic peak towards shorter wavelengths was observed upon incubation of the AS2-US-AuNPs-Aggregate with PSA, but this trend was not consistently significant (Figure S7A). This may be attributed to the weak plasmonic resonance of US-AuNPs and the limited efficiency of interparticle plasmon coupling within the Aggregates[17]. Moreover, larger Aggregates are likely to contribute more strongly to UV–Vis measurements; in this context, even a small number of large Aggregates may significantly affect the overall spectrum, as their increased scattering and absorbance can mask the contributions of smaller particles. For these reasons, subsequent experiments focused exclusively on DLS measurements.
3.5. AS2:RevAS2 dsDNA in Blood Mimicking Conditions
To accurately evaluate the AS2-US-AuNPs-Aggregate response under conditions that mimic in vivo environments, examination at least in plasma, serum, or mimicking conditions is essential. In the bloodstream, the presence and activity of nucleases, along with the formation of a plasma protein corona, likely affects nanoparticles properties[21]. The kinetics of AS2tail:RevAS2 sequences in human plasma and with DNase I were estimated using the AS2:Atto580Q-RevAS2:RhodamineB duplex by monitoring the restoration of Rhodamine fluorescence upon nuclease digestion. For the first case, after background removal and analysis (see Supplementary Section S2), the estimated half-life of fluorescence recovery for the AS2:Atto580Q-RevAS2:RhodamineB in 1:8 diluted plasma resulted to be 13.2±1.3 hours (Figure S8). Adjusting for the dilution factor and considering a first-order kinetics, the estimated half-life in undiluted plasma was approximately 1.65±0.17 hours.
Considering the effect of nucleases alone, we were able to compare the digestion kinetics of the AS2tail:RevAS2 sequences in solution and when incorporated into the AS2tail-US-AuNPs-Aggregates: the stability of AS2-US-AuNPs-Aggregates was tested toward DNAse I digestion and monitored by size variations via DLS, and compared with the results on AS2:Atto580Q-RevAS2:RhodamineB – at the same DNA and DNAse I concentration (Supplementary Section S3). For this experiment, full plasma could not be used because of background scattering, since this compromised the reliability of the measurements. In this case, we obtained a recovery of fluorescence for AS2:Atto580Q-RevAS2:RhodamineB with a half-life of 1.07±0.53 hours (Figure S9A), with complete digestion achieved within 2 hours. Checking the DLS-measured number-weighted averaged sizes of the AS2-US-AuNPs-Aggregates over time, under identical DNA and DNase I concentrations, we estimated a half-life of 2.1±0.1 hours (Figure S9B). Our findings indicate enhanced stability, with the duplex within the AS2-AuNPs-Aggregate exhibiting an almost 2-fold longer half-life compared to free dsDNA solutions. These results underscores the potential of DNA-driven nanoaggregated architectures to offer a protective effect against deoxyribonucleases activity.[22]
We wanted to check also the response of AS2-US-AuNPs-Aggregates to the presence of different concentrations of PSA in conditions mimicking the ones in circulating blood, e.g. in plasma or serum. However, as stated above, following the AS2-AuNPs-Aggregate behaviour in whole plasma using DLS is challenging due the presence of similarly sized particles, including small vesicles, lipoproteins, and protein aggregates. These biological components contribute to significant scattering background and interference, complicating the interpretation of aggregate size distribution and stability measurements. To address this, female human plasma was purified by centrifugation and filtration to remove all these components. Analysis of the untreated human plasma with DLS revealed two main peaks: one at 145.3±5.9 nm and another at 13.2±2.7 nm. The purification left only smaller molecules, including proteins, as confirmed by the presence of a single peak at 15.9±1.3 nm in the centrifuged and filtered plasma (we show a representative intensity-weighted distribution in Figure S10).
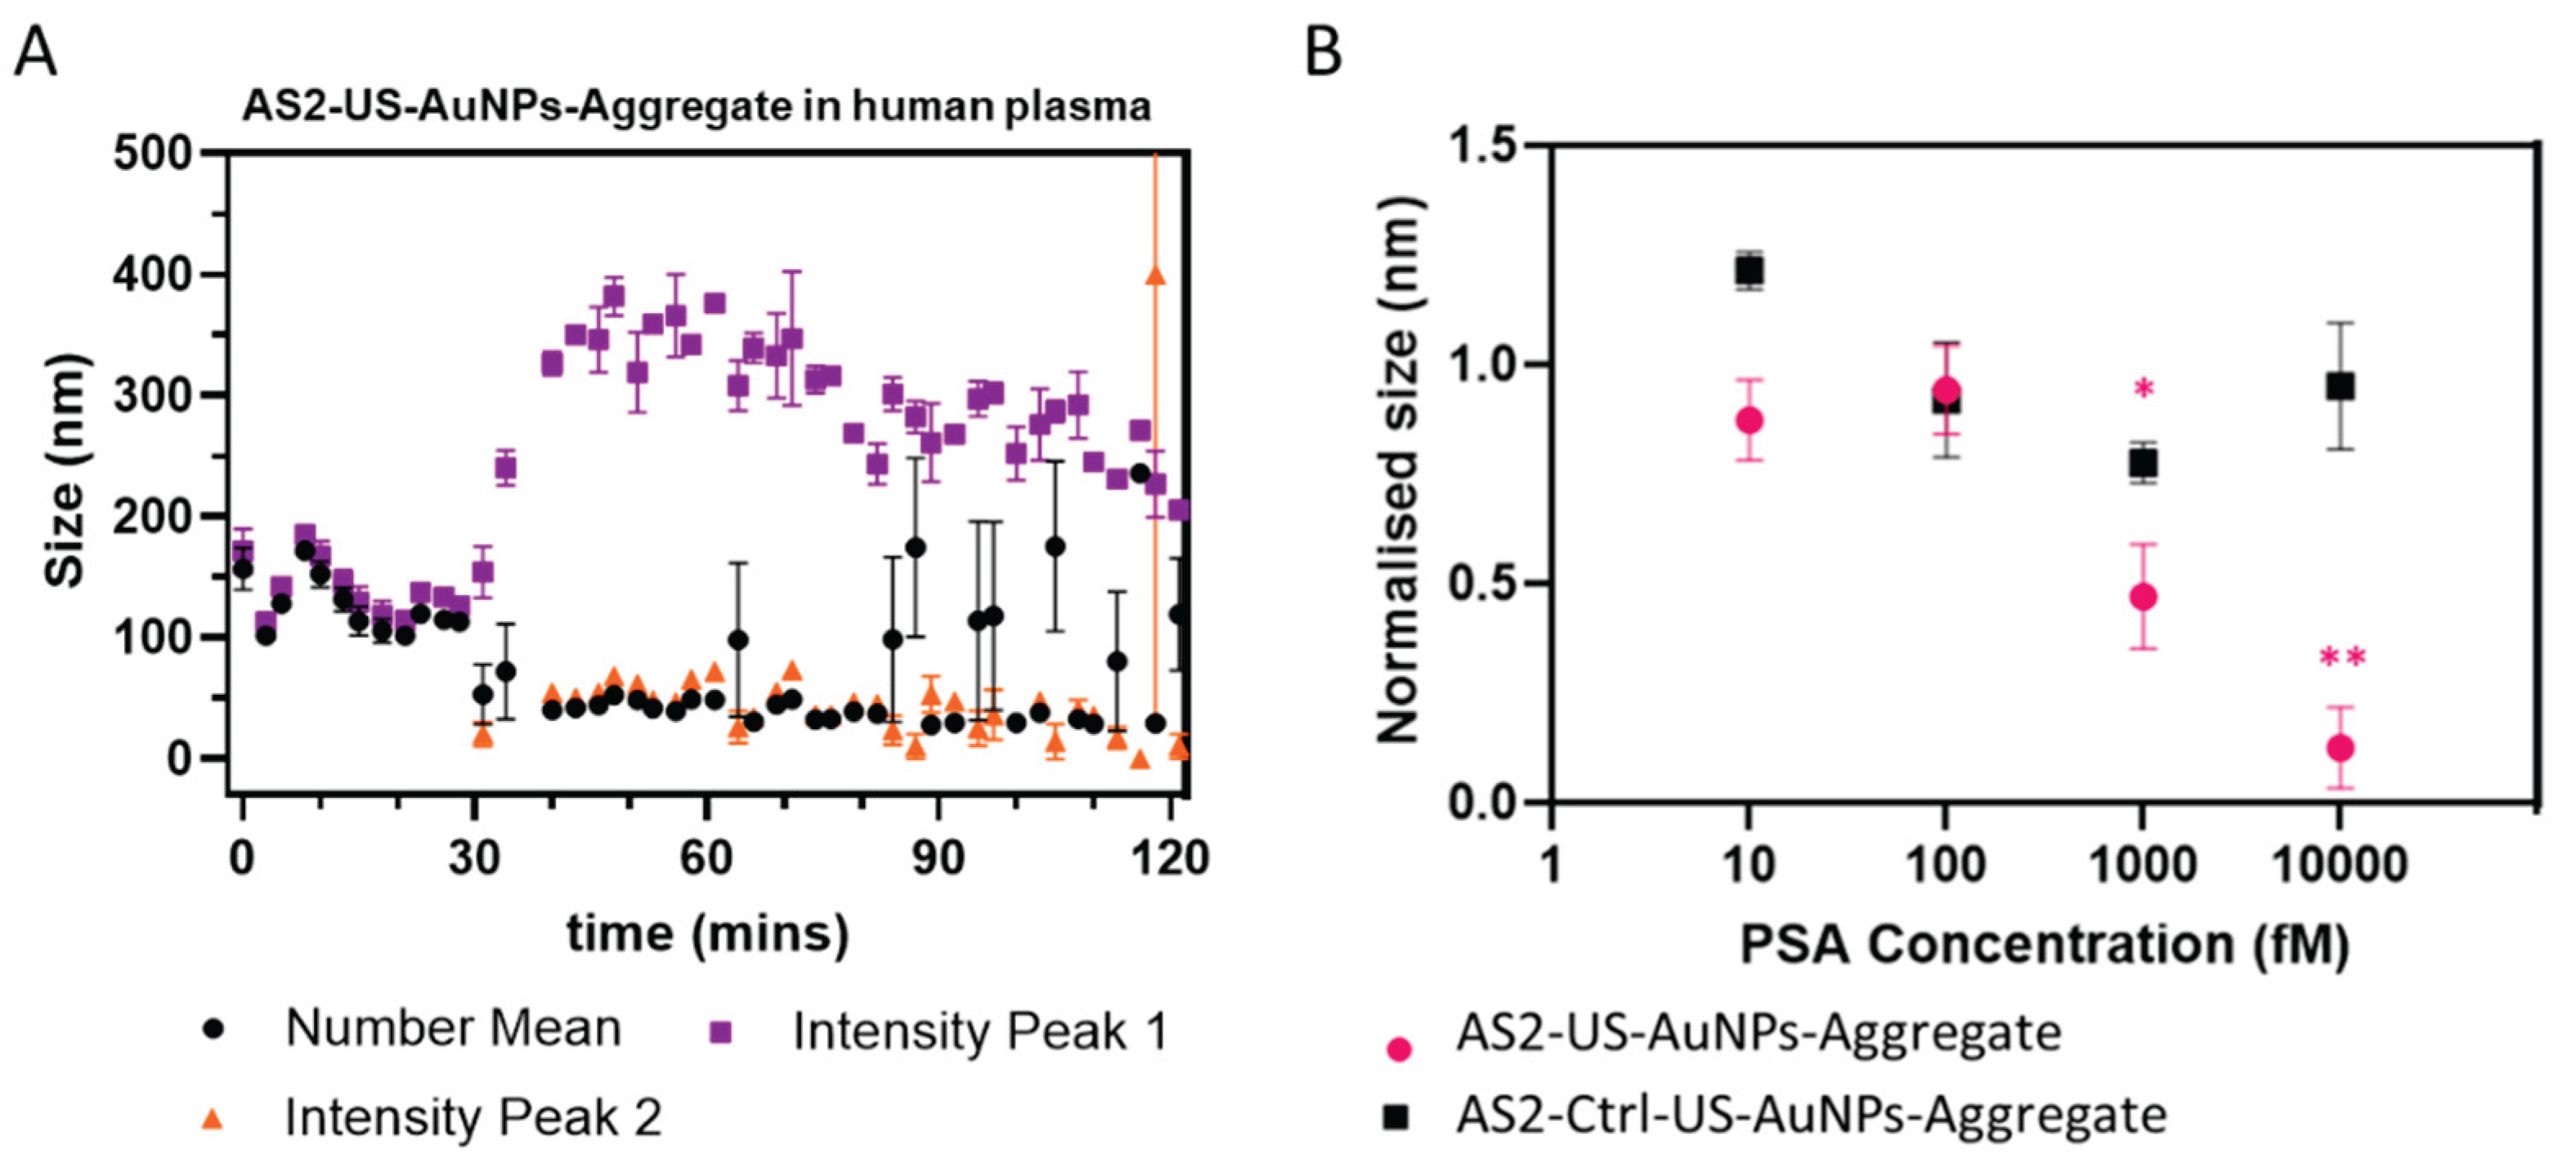
First, we evaluated the stability of the AS2-US-AuNPs-Aggregates in this purified plasma by DLS, as identifying the time window during which the aggregate remains intact is crucial for enabling effective monitoring of the PSA binding reaction. We show in Figure 5A the results, summarized by the time-behaviour of the number-weighted average size and of the intensity-weighted average size on the total distribution, if only one peak was present, or on the first and second peak if more peaks were present in the intensity-weighted distributions of sizes (see Figure S11B for some examples). Figure 5A shows that the measured size distributions are quite constant in the first ~30 minutes, with only one peak, characterized by a size around 110-160 nm for number-weighted size distributions, and consistently slightly higher for intensity-weighted size distributions (see also Figure S11B, black and orange curves), indicating stability of the AS2-US-AuNPs-Aggregate. Starting after ~30 minutes, there are evidences for a bipartite distribution of sizes, with two peaks in the intensity-weighted size distributions, the one at the shorter size being usually smaller (see also Figure S11B, cyan, blue, and violet curves). This peak has almost immediately an intensity-averaged size around 50 nm or below, with a tendency towards shorter sizes at longer times. This suggests the formation of smaller components, which could be attributed to the disassembly of AS2-US-AuNPs-Aggregates, caused by their interaction with plasma molecules and in particular by nuclease digestion. Additionally, the averaged number-weighted size usually follows the position of this peak, confirming that the size derived from the number distribution highlights the presence of smaller particles in the solution. The peak at the higher size in the intensity-weighted distribution first increases rapidly in size, with a broad maximum at ~350nm reached around 50-60 minutes, suggesting aggregation or fusion with plasma components; then, it has a slow trend towards shorter sizes, indicative of continued erosion of these aggregates (Figure 5A, Figure S11 violet and blue curves). This dynamic behaviour underscores the partial instability of the system beyond 30 minutes in plasma environment. This time is shorter than the one estimated for AS2tail:RevAS2 previously, but this could be do either to the differences in the measurements, in the content of the used plasma batch (especially in the concentration of DNAses) or to a different accessibility of the DNases to the oligomers in full plasma with respect to in the one devoid of the bigger components. Moreover, the results also highlight how plasma—a more complex matrix compared to PBS with DNase, as used in previous experiments, even for purified and filtered plasma—affects differently the aggregate stability, likely due to the presence of additional interacting components.
The previous observations indicate a critical time-frame of around 30 minutes for monitoring PSA before significant structural changes occur: we decided to follow the AS2-US-AuNPs-Aggregate PSA response within 20 minutes upon the addition of the analyte by DLS. PSA was tested across a concentration range from 100 fM to 10 pM, taking into account the clinically relevant nadir points of 150 and 300 fM proposed by Thaxton[5] and Doherty[4], respectively, as well as the classical nadir point of 6 pM. Time-course analysis revealed a concentration-dependent response. At 1 pM PSA (Figure S12C), the first concentration at which the reduction of the nanostructure size became statistically significant at around 20 minutes, a progressive decrease in size was observed for the AS2-US-AuNPs-Aggregate, becoming more distinct compared to the AS2-Ctrl-US-AuNPs-Aggregate over time. Statistically significant differences emerged at multiple time points (Figure S11C). At 10 pM PSA (Figure S11D), the AS2-US-AuNPs-Aggregate exhibited a faster and more pronounced reduction in size, with significant changes detectable as early as at 5 minutes and becoming more conspicuous over the 20-minute monitoring period. This response was both stronger and faster than that observed at the lower PSA concentrations. These results suggest a concentration-dependent response of the AS2-US-AuNPs-Aggregate, with higher PSA levels inducing a more rapid and significant structural change. Figure 5B summarize the results for the number-weighted average size after 20 minutes of incubation, the longest time point considered to avoid the instability observed in plasma. As already stated, a significant reduction in size of the AS2-US-AuNPs-Aggregate was observed starting at 1 pM PSA. This result indicates that the Aggregate retains its ability to respond to PSA in a suitable time frame (i.e. before 30 minutes), even when incubated in a complex environment that mimics physiological blood conditions.
4. Discussion
The developed AS2-US-AuNPs-Aggregates demonstrated target-responsive rapid disassembly in buffered solutions, with detectable responses at PSA concentrations as low as 10 fM. Under blood-mimicking conditions, a significant signal change was observed starting at 1 pM PSA, with faster and more pronounced kinetics at higher concentrations (10 pM). These results highlight a detection capability that surpasses many existing commercial point-of-care (PoC) assays, positioning the AS2-US-AuNPs-Aggregate as a promising platform for ultrasensitive biomarker sensing in complex media, with potential for real-time monitoring and early disease detection.
DLS measurements provided valuable insights into the Aggregate size variation during PSA interaction. However, given the limitations of DLS in complex biological matrices —such as signal variability due to polydispersity and interference from plasma components— additional characterization with higher-resolution or molecular-specific techniques is warranted to confirm and refine these findings.
This study represents a preliminary step toward in vivo applications of the AS2-US-AuNPs-Aggregate system. In a physiological context, nuclease activity, also combined with dynamic blood flow, could have both positive and negative effects. Blood flow would help to remove the detached particles from the interaction site, effectively favouring the kinetics of the system as if it were an irreversible reaction [23,24]. In this scenario, the reaction is not limited by the concentration of analyte species, but rather by the absolute number of analyte molecules available, leading to an increased sensitivity. In this scenario, nucleases may facilitate this irreversibility, by digesting faster the oligomers on the disassembled nanoparticles. On the other hand, the spontaneous instability of the aggregates in plasma—partially influenced by nuclease activity—must be carefully considered, particularly in relation of achieving precise temporal control. Within the intended reaction time window, the system must remain stable long enough for PSA recognition, subsequent aggregates disassembly, and excretion of the disassembled nanoparticles to urine, where they can be detected. However, over longer timescales, complete nuclease digestion could be beneficial, ensuring full disassembling and clearance of nanoparticles also in the absence of PSA, an essential feature for safe in vivo applications.
Given that the AS2-US-AuNPs-Aggregate was specifically designed for in vivo applications, optimising its performance and stability in biological environments is essential, and this includes strategies for temporal control of the aggregate integrity. Loynachan[25] reported the detection of renal-clearable nanoparticles in urine one hour after triggerable-nanostructure injection. In contrast, our system exhibits instability after 30 minutes, highlighting the need for optimization to extend its lifetime in plasma. This could be achieved through the incorporation of antifouling sequences and the use of modified nucleic acids more resistant to nuclease activity[26].
The use of US-NPs-Aggregate systems could enable in the future the translation of a specific protein biomarker’s presence into a measurable reporter signal in urine. Furthermore, the design of this nanostructure could be adapted for the detection of other disease-associated biomarkers, or configured by using different types of nanoparticles, thereby broadening its potential applications in diagnostic medicine.
Supplementary Materials
The following supporting information can be downloaded at the website of this paper posted on Preprints.org. Results S1: AS2 ELONA analysis; Results S2:AS2:Atto580Q-RevAS2:RhodamineB dsDNA digestion in plasma analysis; Results S3:AS2:Atto580Q-RevAS2:RhodamineB dsDNA digestion by DNaseI analysis; Figure S1: aPSA and AS2 ELONA assays; Figure S2: Secondary folding of the AS2-crtl strand and of the AS2-ctrl:RevAS2 duplex; Figure S3: Absorbance spectra and plasmon peak analysis of non-functionalized US-AuNPs; Figure S4: Stability and kinetic analysis of the Aggregates in buffer; Figure S5: Comparison between DLS extracted data and the analyzed data with the multiexponential fit; Figure S6: Intensity-weighted DLS distributions for the AS2-US-AuNPs-Aggregate with and without PSA at different incubation times; Figure S7: Plasmon shift variation of the AS2-US-AuNPs-Aggregate in response to PSA presence and relative control; Figure S8: AS2:RevAS2 digestion analysis in plasma; Figure S9: Comparison of digestion kinetics with DNaseI of AS2:RevAS2 and AS2-US-AuNPs-Aggregate; Figure S10: Representative DLS measurements of plasma before, during, and after processing; Figure S11: Representative DLS measurements for AS2-US-AuNPs-Aggregate stability in plasma; Figure S12: AS2-US-AuNPs-Aggregate and AS2-Ctrl-US-AuNPs-Aggregate number-weighted size variation in time during PSA incubation. Table S1: DNA sequences used in this study; Table S2: Melting Temperatures of the aPSA and AS2 group of sequences.
Author Contributions : Conceptualization, G.M., G.S, S.L. and F.B; methodology, G.M. and S.L..; software, S.L., R.N. and L.B.; investigation, G.M., P.M. and E.O.; writing—original draft preparation, G.M.; writing—review and editing, G.M and S.L.; supervision, S.L. All authors have read and agreed to the published version of the manuscript.
Funding
This research received no external funding.
Institutional Review Board Statement
Not applicable.
Data Availability Statement
Data presented in this study is contained within the article. Further inquiries can be directed to the corresponding authors.
Conflicts of Interest
The authors declare no conflicts of interest.
Abbreviations
The following abbreviations are used in this manuscript:
| BCR | Biochemical Recurrence |
| BSA | Bovine Serum Albumin |
| DLS | Dynamic Light Scattering |
| ELONA | Enzyme-Linked Oligonicleotide Assay |
| EPR | Enhanced Permeability and Retention |
| HSA | Human Serum Albumin |
| LFA | Lateral Flow Assay |
| LoD | Limit of Detection |
References
- Sung, H.; Ferlay, J.; Siegel, R.L.; Laversanne, M.; Soerjomataram, I.; Jemal, A.; Bray, F. Global Cancer Statistics 2020: GLOBOCAN Estimates of Incidence and Mortality Worldwide for 36 Cancers in 185 Countries. CA. Cancer J. Clin. 2021, 71, 209–249. [Google Scholar] [CrossRef] [PubMed]
- Pound, C.R.; Partin, A.W.; Eisenberger, M.A.; Chan, D.W.; Pearson, J.D.; Walsh, P.C. Natural History of Progression After PSA Elevation Following Radical Prostatectomy. JAMA 1999, 281, 1591–1597. [Google Scholar] [CrossRef] [PubMed]
- Eisenberg, M.L.; Davies, B.J.; Cooperberg, M.R.; Cowan, J.E.; Carroll, P.R. Prognostic Implications of an Undetectable Ultrasensitive Prostate-Specific Antigen Level after Radical Prostatectomy. Eur. Urol. 2010, 57, 622–630. [Google Scholar] [CrossRef]
- Doherty, A.P.; Bower, M.; Smith, G.L.; Miano, R.; Mannion, E.M.; Mitchell, H.; Christmas, T.J. Undetectable Ultrasensitive PSA after Radical Prostatectomy for Prostate Cancer Predicts Relapse-Free. Br. J. Cancer 2000, 83, 1432–1436. [Google Scholar] [CrossRef]
- Thaxton, C.S.; Elghanian, R.; Thomas, A.D.; Stoeva, S.I.; Lee, J.S.; Smith, N.D.; Schaeffer, A.J.; Klocker, H.; Horninger, W.; Bartsch, G.; et al. Nanoparticle-Based Bio-Barcode Assay Redefines “Undetectable” PSA and Biochemical Recurrence after Radical Prostatectomy. Proc. Natl. Acad. Sci. U. S. A. 2009, 106, 18437–18442. [Google Scholar] [CrossRef] [PubMed]
- Garg, S.; Sachdeva, A.; Peeters, M.; McClements, J. Point-of-Care Prostate Specific Antigen Testing: Examining Translational Progress toward Clinical Implementation. ACS Sensors 2023, 8, 3643–3658. [Google Scholar] [CrossRef]
- Domínguez, M.; García-Fernández, A.; Martí-Centelles, V.; Sancenón, F.; Blandez, J.F.; Martínez-Máñez, R. Renal-Clearable Probes for Disease Detection and Monitoring. Trends Biotechnol. 2024. [Google Scholar] [CrossRef]
- Loynachan, C.N.; Soleimany, A.P.; Dudani, J.S.; Lin, Y.; Najer, A.; Bekdemir, A.; Chen, Q.; Bhatia, S.N.; Stevens, M.M. Renal Clearable Catalytic Gold Nanoclusters for in Vivo Disease Monitoring. Nat. Nanotechnol. 2019, 14, 883–890. [Google Scholar] [CrossRef]
- Huang, J.; Jiang, Y.; Li, J.; He, S.; Huang, J.; Pu, K. A Renal-Clearable Macromolecular Reporter for Near-Infrared Fluorescence Imaging of Bladder Cancer. Angew. Chemie - Int. Ed. 2019. [Google Scholar] [CrossRef]
- Kwon, E.J.; Dudani, J.S.; Bhatia, S.N. Ultrasensitive Tumour-Penetrating Nanosensors of Protease Activity. Nat. Biomed. Eng. 2017, 1. [Google Scholar] [CrossRef]
- Schuerle, S.; Dudani, J.S.; Christiansen, M.G.; Anikeeva, P.; Bhatia, S.N. Magnetically Actuated Protease Sensors for in Vivo Tumor Profiling. Nano Lett. 2016, 16, 6303–6310. [Google Scholar] [CrossRef]
- Kwong, G.A.; Dudani, J.S.; Carrodeguas, E.; Mazumdar, E. V.; Zekavat, S.M.; Bhatia, S.N. Mathematical Framework for Activity-Based Cancer Biomarkers. Proc. Natl. Acad. Sci. U. S. A. 2015, 112, 12627–12632. [Google Scholar] [CrossRef]
- Feng, X.; Wang, Q.; Liao, Y.; Zhou, X.; Wang, Y.; Liu, W.; Zhang, G. A Synthetic Urinary Probe–Coated Nanoparticles Sensitive to Fibroblast Activation Protein α for Solid Tumor Diagnosis. Int. J. Nanomedicine 2017, 12, 5359–5372. [Google Scholar] [CrossRef]
- Savory, N.; Abe, K.; Sode, K.; Ikebukuro, K. Selection of DNA Aptamer against Prostate Specific Antigen Using a Genetic Algorithm and Application to Sensing. Biosens. Bioelectron. 2010, 26, 1386–1391. [Google Scholar] [CrossRef]
- Park, J.W.; Lee, S.J.; Ren, S.; Lee, S.; Kim, S.; Laurell, T. Acousto-Microfluidics for Screening of SsDNA Aptamer. Sci. Rep. 2016, 6, 1–9. [Google Scholar] [CrossRef] [PubMed]
- Kimoto, M.; Shermane Lim, Y.W.; Hirao, I. Molecular Affinity Rulers: Systematic Evaluation of DNA Aptamers for Their Applicabilities in ELISA. Nucleic Acids Res. 2019, 47, 8362–8374. [Google Scholar] [CrossRef]
- Matteoli, G.; Luin, S.; Bellucci, L.; Nifosì, R.; Beltram, F.; Signore, G. Aptamer-Based Gold Nanoparticle Aggregates for Ultrasensitive Amplification-Free Detection of PSMA. Sci. Rep. 2023, 13, 1–11. [Google Scholar] [CrossRef]
- Maxwell, D.J.; Taylor, J.R.; Nie, S. Self-Assembled Nanoparticle Probes for Recognition and Detection of Biomolecules. J. Am. Chem. Soc. 2002, 124, 9606–9612. [Google Scholar] [CrossRef]
- Jin, R.; Wu, G.; Li, Z.; Mirkin, C.A.; Schatz, G.C. What Controls the Melting Properties of DNA-Linked Gold Nanoparticle Assemblies? J. Am. Chem. Soc. 2003, 125, 1643–1654. [Google Scholar] [CrossRef] [PubMed]
- Gelamo, E.L.; Tabak, M. Spectroscopic Studies on the Interaction of Bovine (BSA) and Human (HSA) Serum Albumins with Ionic Surfactants. Spectrochim. Acta - Part A Mol. Biomol. Spectrosc. 2000, 56, 2255–2271. [Google Scholar] [CrossRef] [PubMed]
- Bashiri, G.; Padilla, M.S.; Swingle, K.L.; Shepherd, S.J.; Mitchell, M.J.; Wang, K. Nanoparticle Protein Corona: From Structure and Function to Therapeutic Targeting. Lab Chip 2023, 23, 1432–1466. [Google Scholar] [CrossRef]
- Chandrasekaran, A.R. Nuclease Resistance of DNA Nanostructures. Nat. Rev. Chem. 2021, 0123456789. [Google Scholar] [CrossRef]
- Hori, S.S.; Gambhir, S.S.; Zelikin, A.N.; Lange, J.; Eddhif, B.; Tarighi, M.; Garandeau, T.; Pøraudeau, E.; Clarhaut, J.; Renoux, B.; et al. Factors Affecting the Clearance and Biodistribution of Polymeric Nanoparticles. Mol. Pharm. 2011, 3, 505–515. [Google Scholar] [CrossRef]
- Khodadadi Karimvand, S.; Maeder, M.; Abdollahi, H. A Chemical Equilibrium Modelling Strategy for Tuning the Apparent Equilibrium Constants of the Chemical Systems. Anal. Chim. Acta 2019, 1049, 29–37. [Google Scholar] [CrossRef]
- Loynachan, C.N.; Soleimany, A.P.; Dudani, J.S.; Lin, Y.; Najer, A.; Bekdemir, A.; Chen, Q.; Bhatia, S.N.; Stevens, M.M. Renal Clearable Catalytic Gold Nanoclusters for in Vivo Disease Monitoring. Nat. Nanotechnol. 2019, 14, 883–890. [Google Scholar] [CrossRef] [PubMed]
- Jiang, C.; Wang, G.; Hein, R.; Liu, N.; Luo, X.; Davis, J.J. Antifouling Strategies for Selective in Vitro and in Vivo Sensing. Chem. Rev. 2020, 120, 3852–3889. [Google Scholar] [CrossRef] [PubMed]
- Matthew D. Moore, Blanca I. Escudero-Abarca, and L.-A.J. An Enzyme-Linked Aptamer Sorbent Assay to Evaluate Aptamer Binding; Tiller, T., Ed.; Methods in Molecular Biology; Springer New York: New York, NY, 2017; Vol. 1575; ISBN 978-1-4939-6855-8.
- J. N. Zadeh, C. D. Steenberg, J. S. Bois, B. R. Wolfe, M. B. Pierce, A. R. Khan, R. M. Dirks, N. A. Pierce. NUPACK: analysis and design of nucleic acid systems. J Comput Chem, 32:170–173, 2011.
- Zadeh, J.N.; Steenberg, C.D.; Bois, J.S.; Wolfe, B.R.; Pierce, M.B.; Khan, A.R.; Dirks, R.M.; Pierce, N.A. NUPACK: Analysis and Design of Nucleic Acid Systems. J. Comput. Chem. 2011, 32, 170–173. [Google Scholar] [CrossRef] [PubMed]
- Dirks, R.M.; Bois, J.S.; Schaeffer, J.M.; Winfree, E.; Pierce, N.A. Thermodynamic Analysis of Interacting Nucleic Acid Strands. SIAM Rev. 2007, 49, 65–88. [Google Scholar] [CrossRef]
- Hermanson, G.T. Bioconjugate Techniques; 2008; ISBN 978-0-12-370501-3.
- Park, J. W. et al. Acousto-microfluidics for screening of ssDNA aptamer. Sci Rep 6, 1–9 2016.
- Kimoto, M., Shermane Lim, Y. W. & Hirao, I. Molecular affinity rulers: systematic evaluation of DNA aptamers for their applicabilities in ELISA. Nucleic Acids Res 47, 8362–8374 2019.
Figure 1.
(A) Schematic of the PSA sensing reaction of the AS2-US-AuNPs-Aggregate. The AS2-US-AuNPs-Aggregate is composed by US-AuNPs (purple spheres; for simplicity, here, only two are shown, but since there are more ssDNAs per US-AuNP, there are usually Aggregates composed by many US-AuNPs), decorated either with the partial complementary sequences RevAS2 or with the AS2tail ssDNAs. The PSA interaction with the AS2 aptamer within the AS2-US-AuNPs-Aggregate triggers the release of RevAS2-US-AuNPs. (B) Docking model of the complex between the AS2 aptamer ssDNA and the PSA human protein, obtained by molecular dynamic simulations exploiting also various software including the HADDOCK webserver[17], and visualized using Visual Molecular Dynamics (VDM). (C) Potential energy contribution of each nucleotide in the AS2 sequence to the binding energy of the aptamer AS2 with the PSA protein. The standard deviation reflects the variability of these energy contributions over the course of a 4 ns simulation. (D,E) Most probable secondary folding of the AS2 aptamer (D) and of the AS2-tail:RevAS2 duplex (E) obtained with the NUPACK online tool. The colours code for the probability of base pairing at equilibrium (i.e. the probability of the corresponding base pair forming) according to the colour scale bar reported on the right. The simulation was performed with NUPACK online tool at the following conditions: DNA concentration 100 nM, Temperature 37°C, NaCl concentration 0.15 M and Mg2+ concentration 0.025 M.
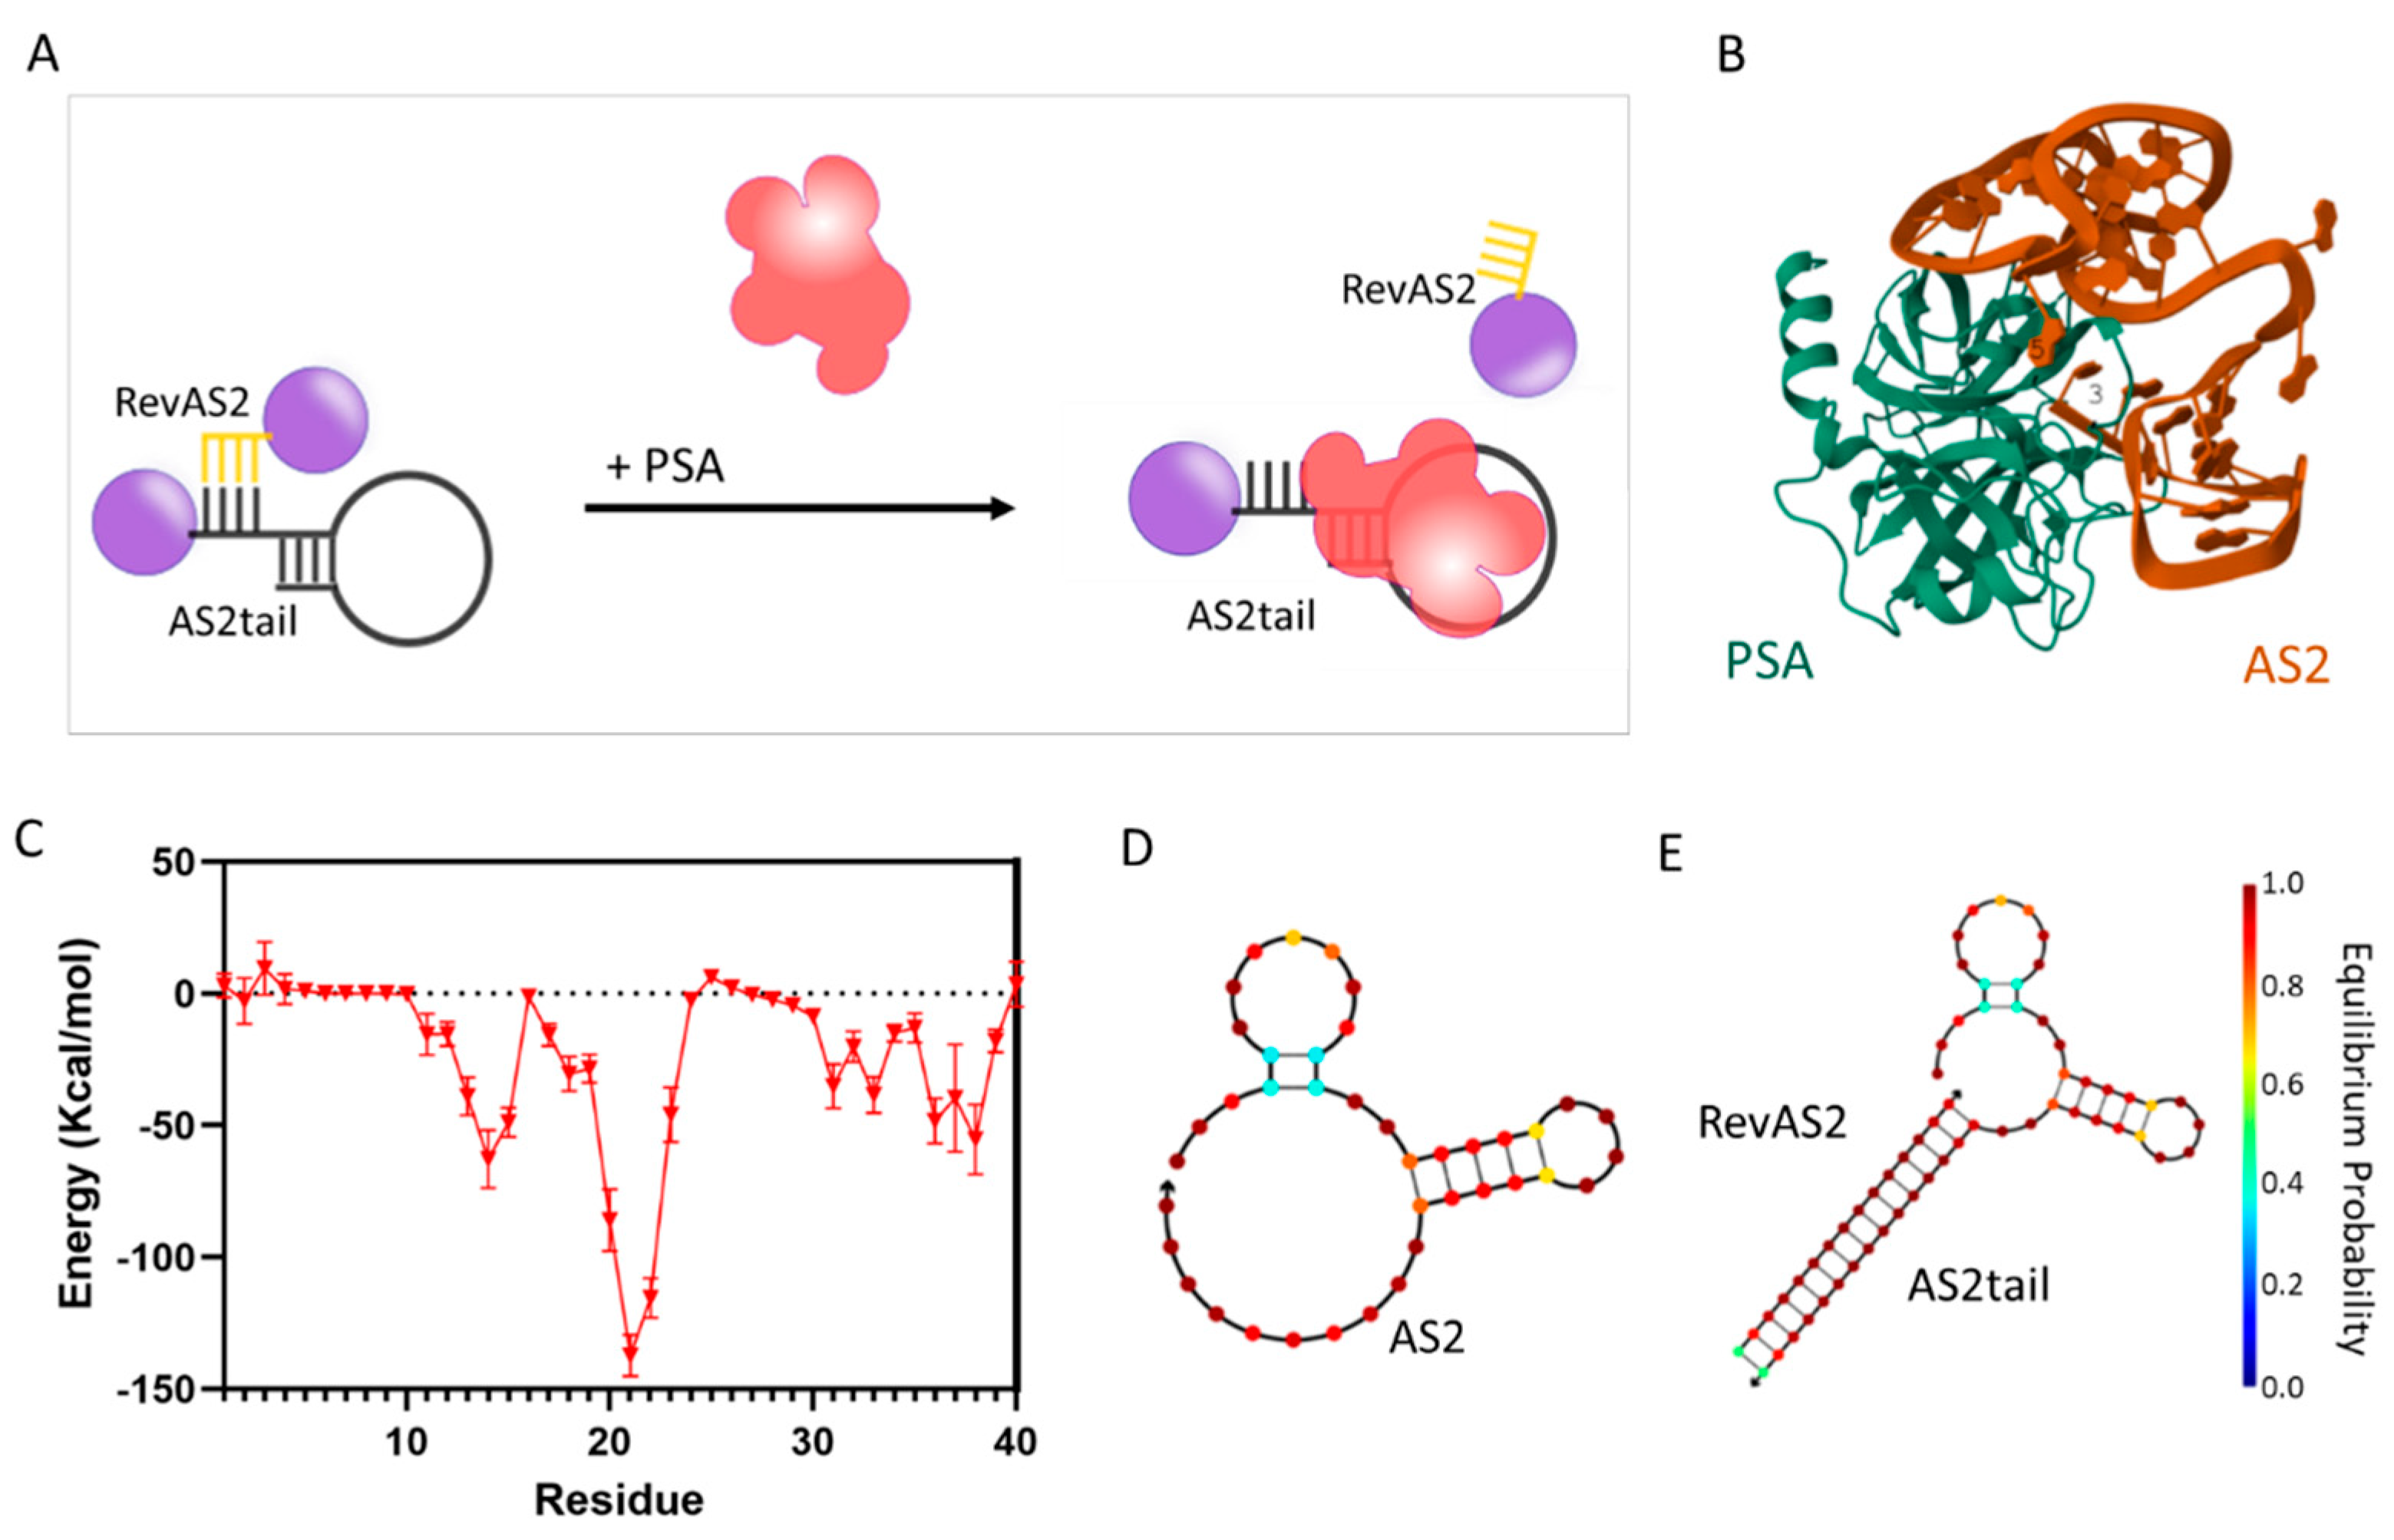
Figure 2.
Melting curves of AS2tail:RevAS2 and AS2tail-crtl:RevAS2-ctrl annealed sequences determined (A) in silico with NUPACK and (B) in vitro by absorbance measurements; absorbance is normalized between 0 and 1 at the lowest and highest measured temperatures.
Figure 2.
Melting curves of AS2tail:RevAS2 and AS2tail-crtl:RevAS2-ctrl annealed sequences determined (A) in silico with NUPACK and (B) in vitro by absorbance measurements; absorbance is normalized between 0 and 1 at the lowest and highest measured temperatures.
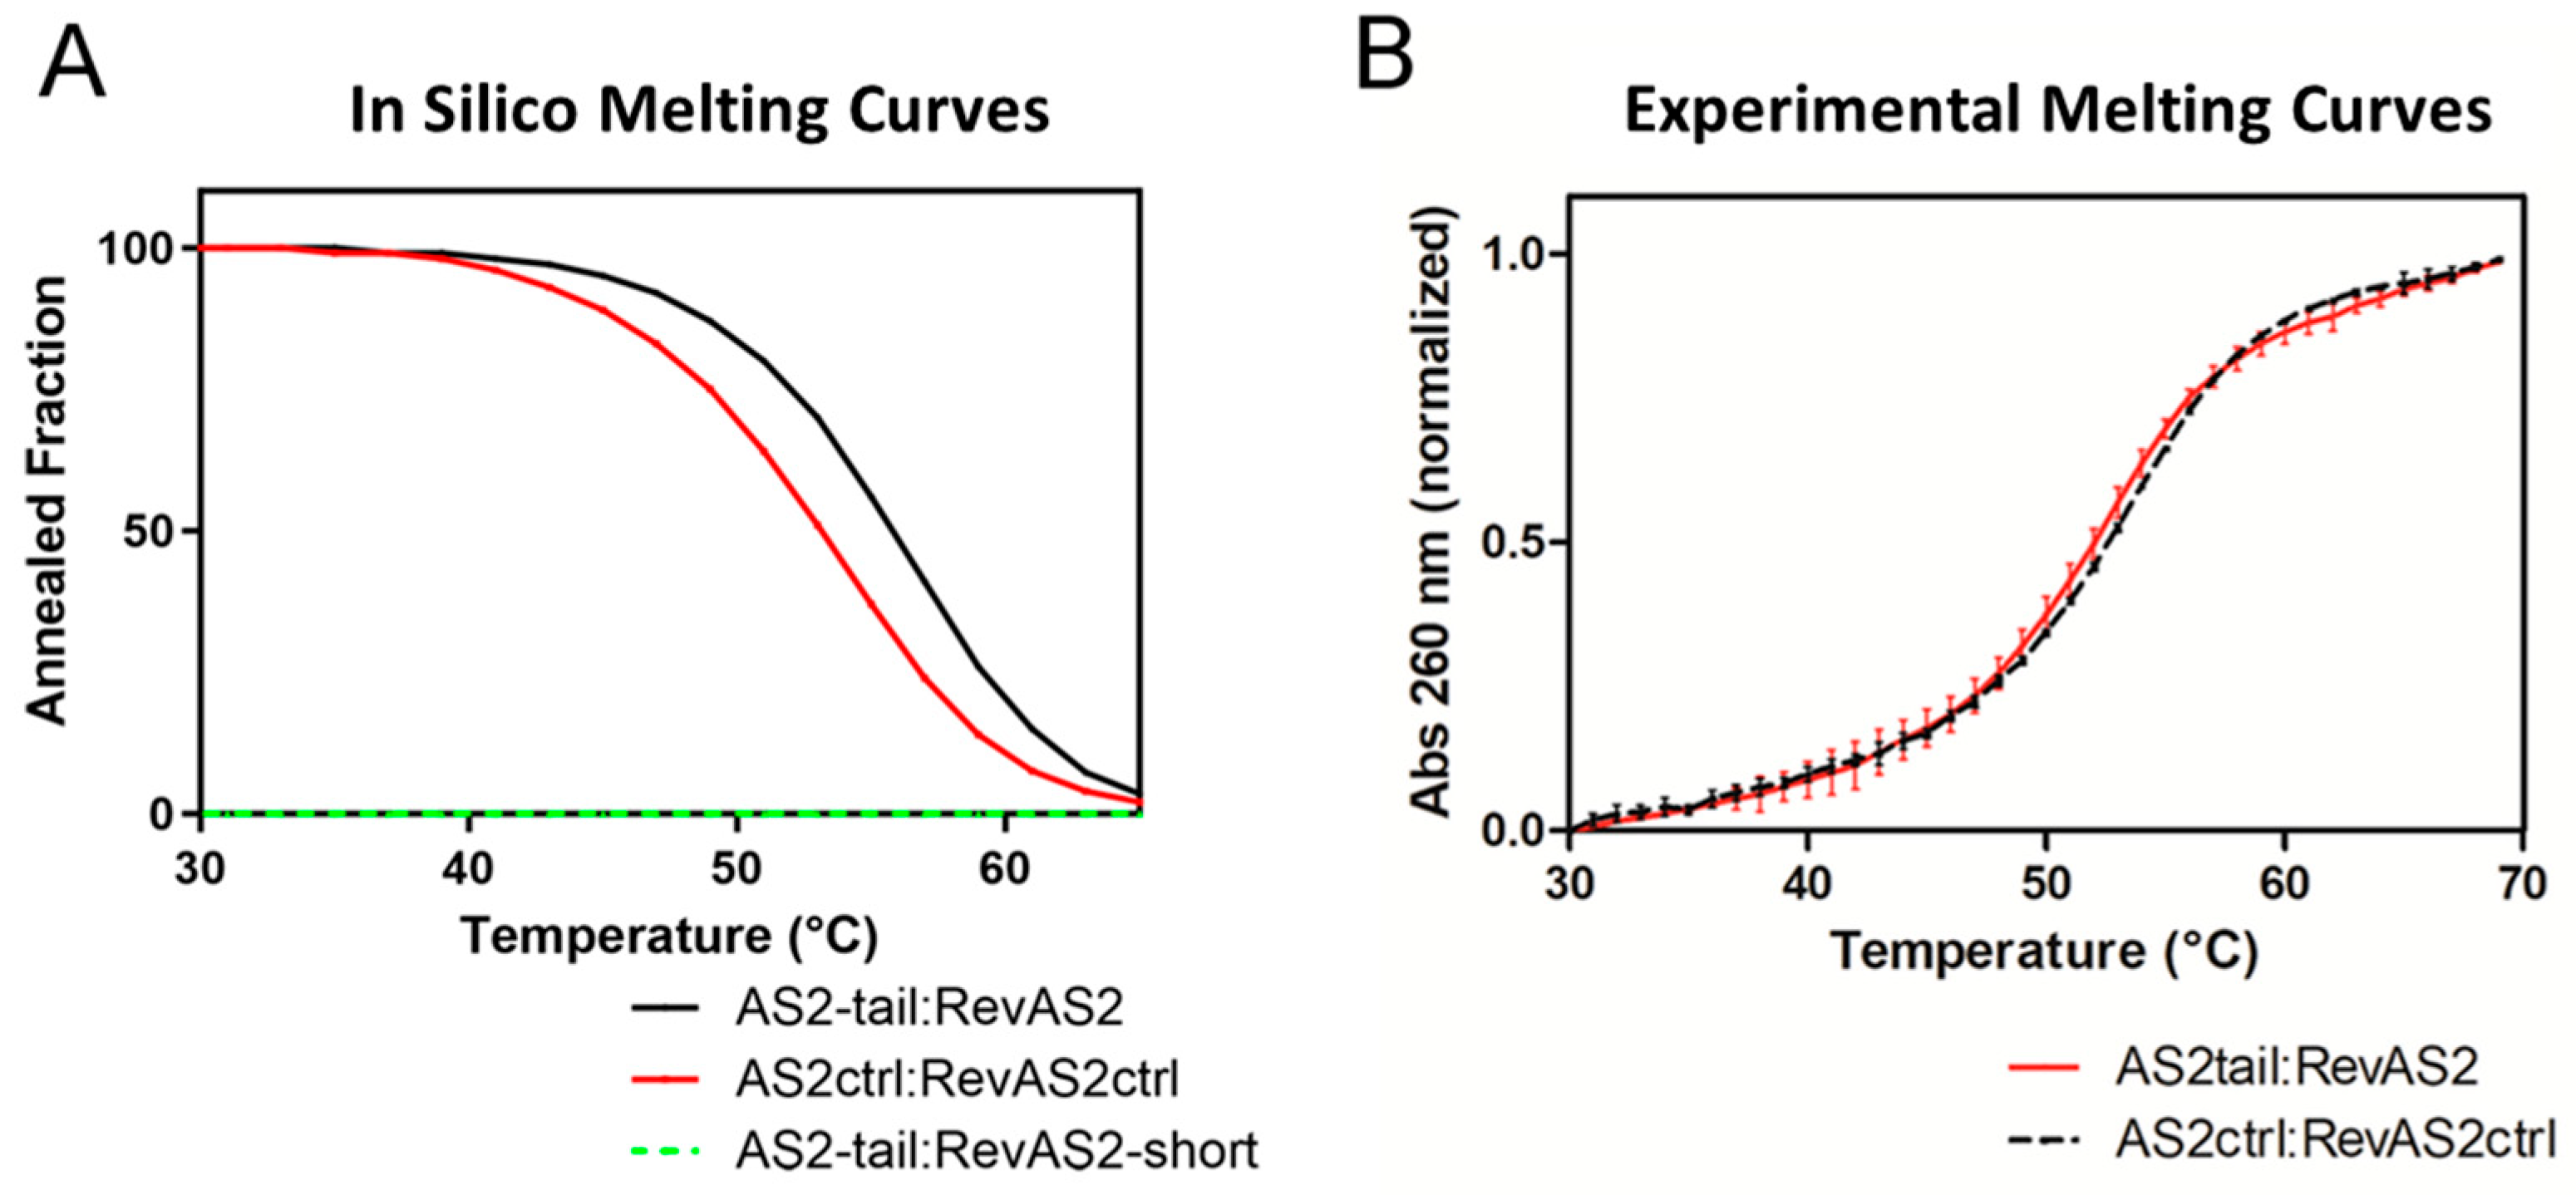
Figure 3.
(A) Exemplary extinction spectra normalised at λ=450 nm of US-AuNPs (red line) and of RevAS2-US-AuNPs before and after the purification process (black dotted and green solid lines, respectively). (B) Full UV-Vis extinction spectra, normalised at λ=450 nm, of non-functionalised (red line) and ssDNA-functionalised US-AuNPs (orange, pink, blue and dark cyan line, as better specified in the legend). (C) Representative extinction spectra normalised at λ=450 nm, showing the plasmonic peak, of single non-functionalised AuNPs (black line), ssDNA-AuNPs (orange line) and AS2-US-AuNPs-Aggregates (dark cyan line); batches of AuNPs and RevAS2-US-AuNPs are different than in panel A. (D) Melting curves of the AS2-AuNPs-Aggregate (orange squared line) and of the control AS2-CTRL-AuNPs-Aggregate (black squared lines) considering the DLS-measured number-weighted average size of the Aggregates, normalized at 1 at the lowest measured temperature. The measurement is reported as mean values of a triplicate (n=3) and the error bars are standard errors.
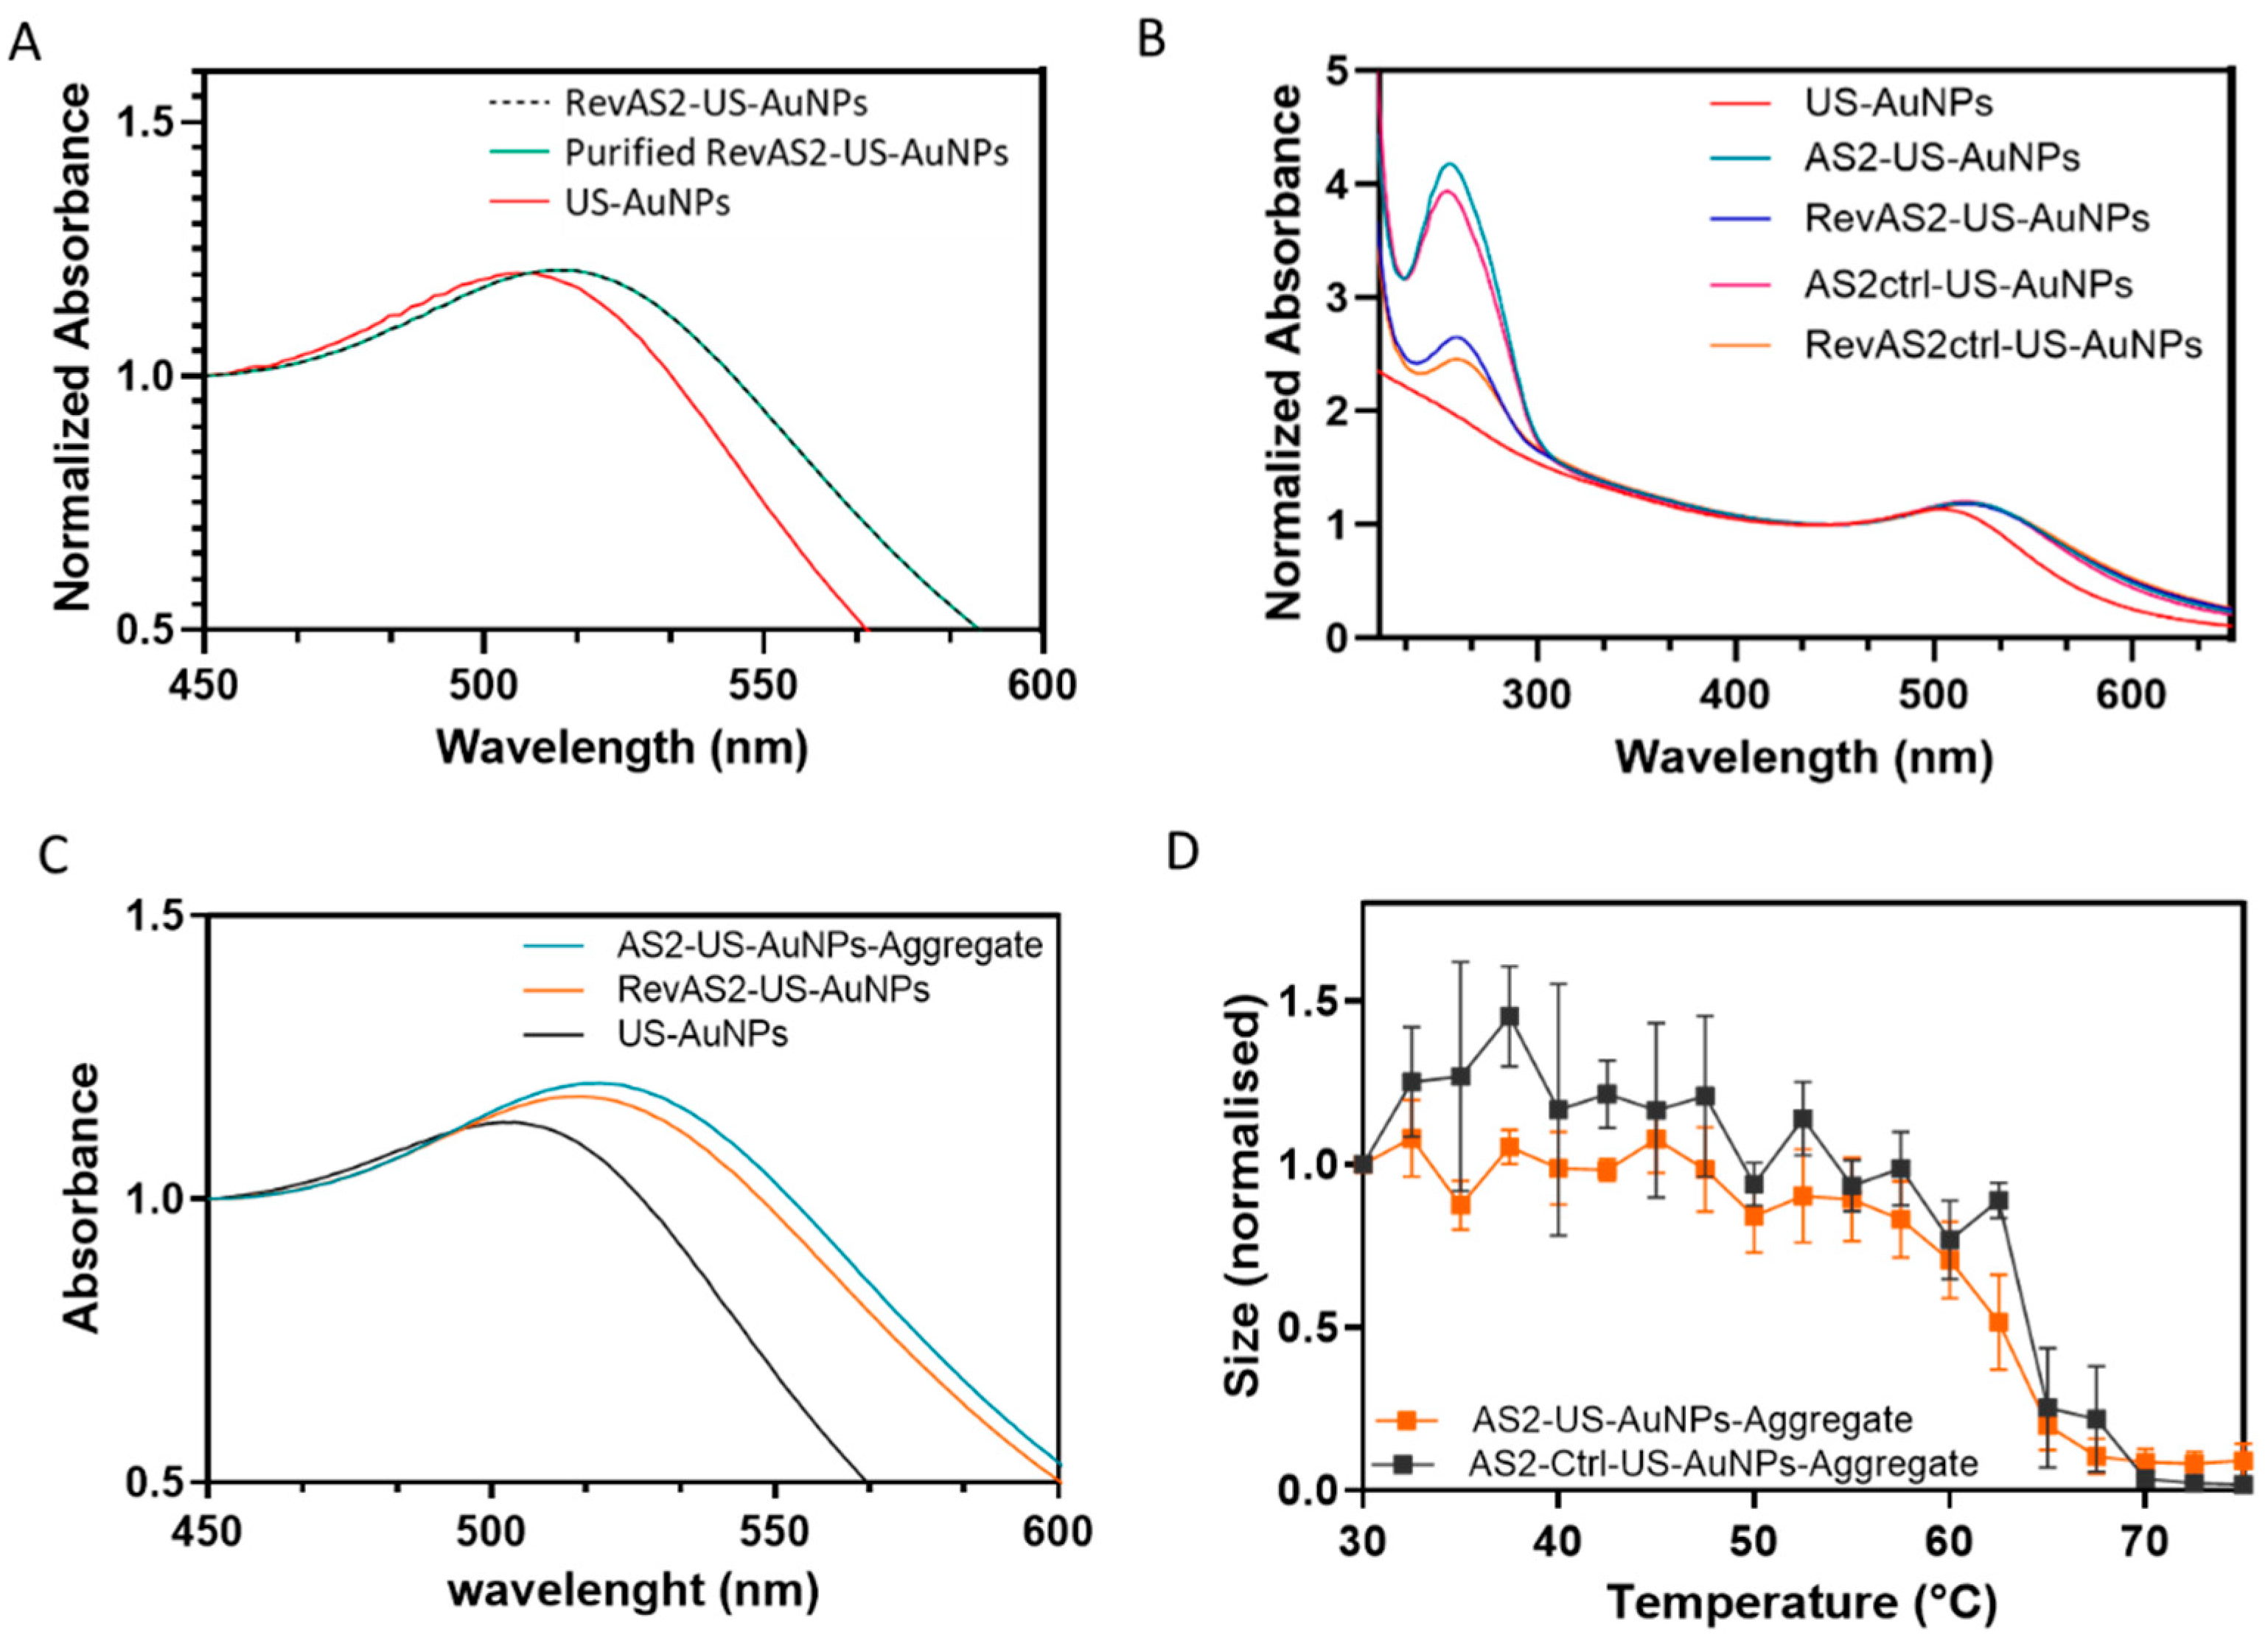
Figure 4.
Response to PSA of the AS2-US-AuNPs-Aggregates and relative controls. (A) Variation in the number-weighted averaged size, measured by DLS, of the AS2-US-AuNPs-Aggregate when incubated with the PSA protein (blue line) or with BSA (black line). (B) Size measurements of the AS2-Ctrl-US-AuNPs-Aggregate when incubated with PSA protein (blue line) or with BSA (black line). All measurements are performed with n=4, from independent experiments, and the error bars represent the standard errors.
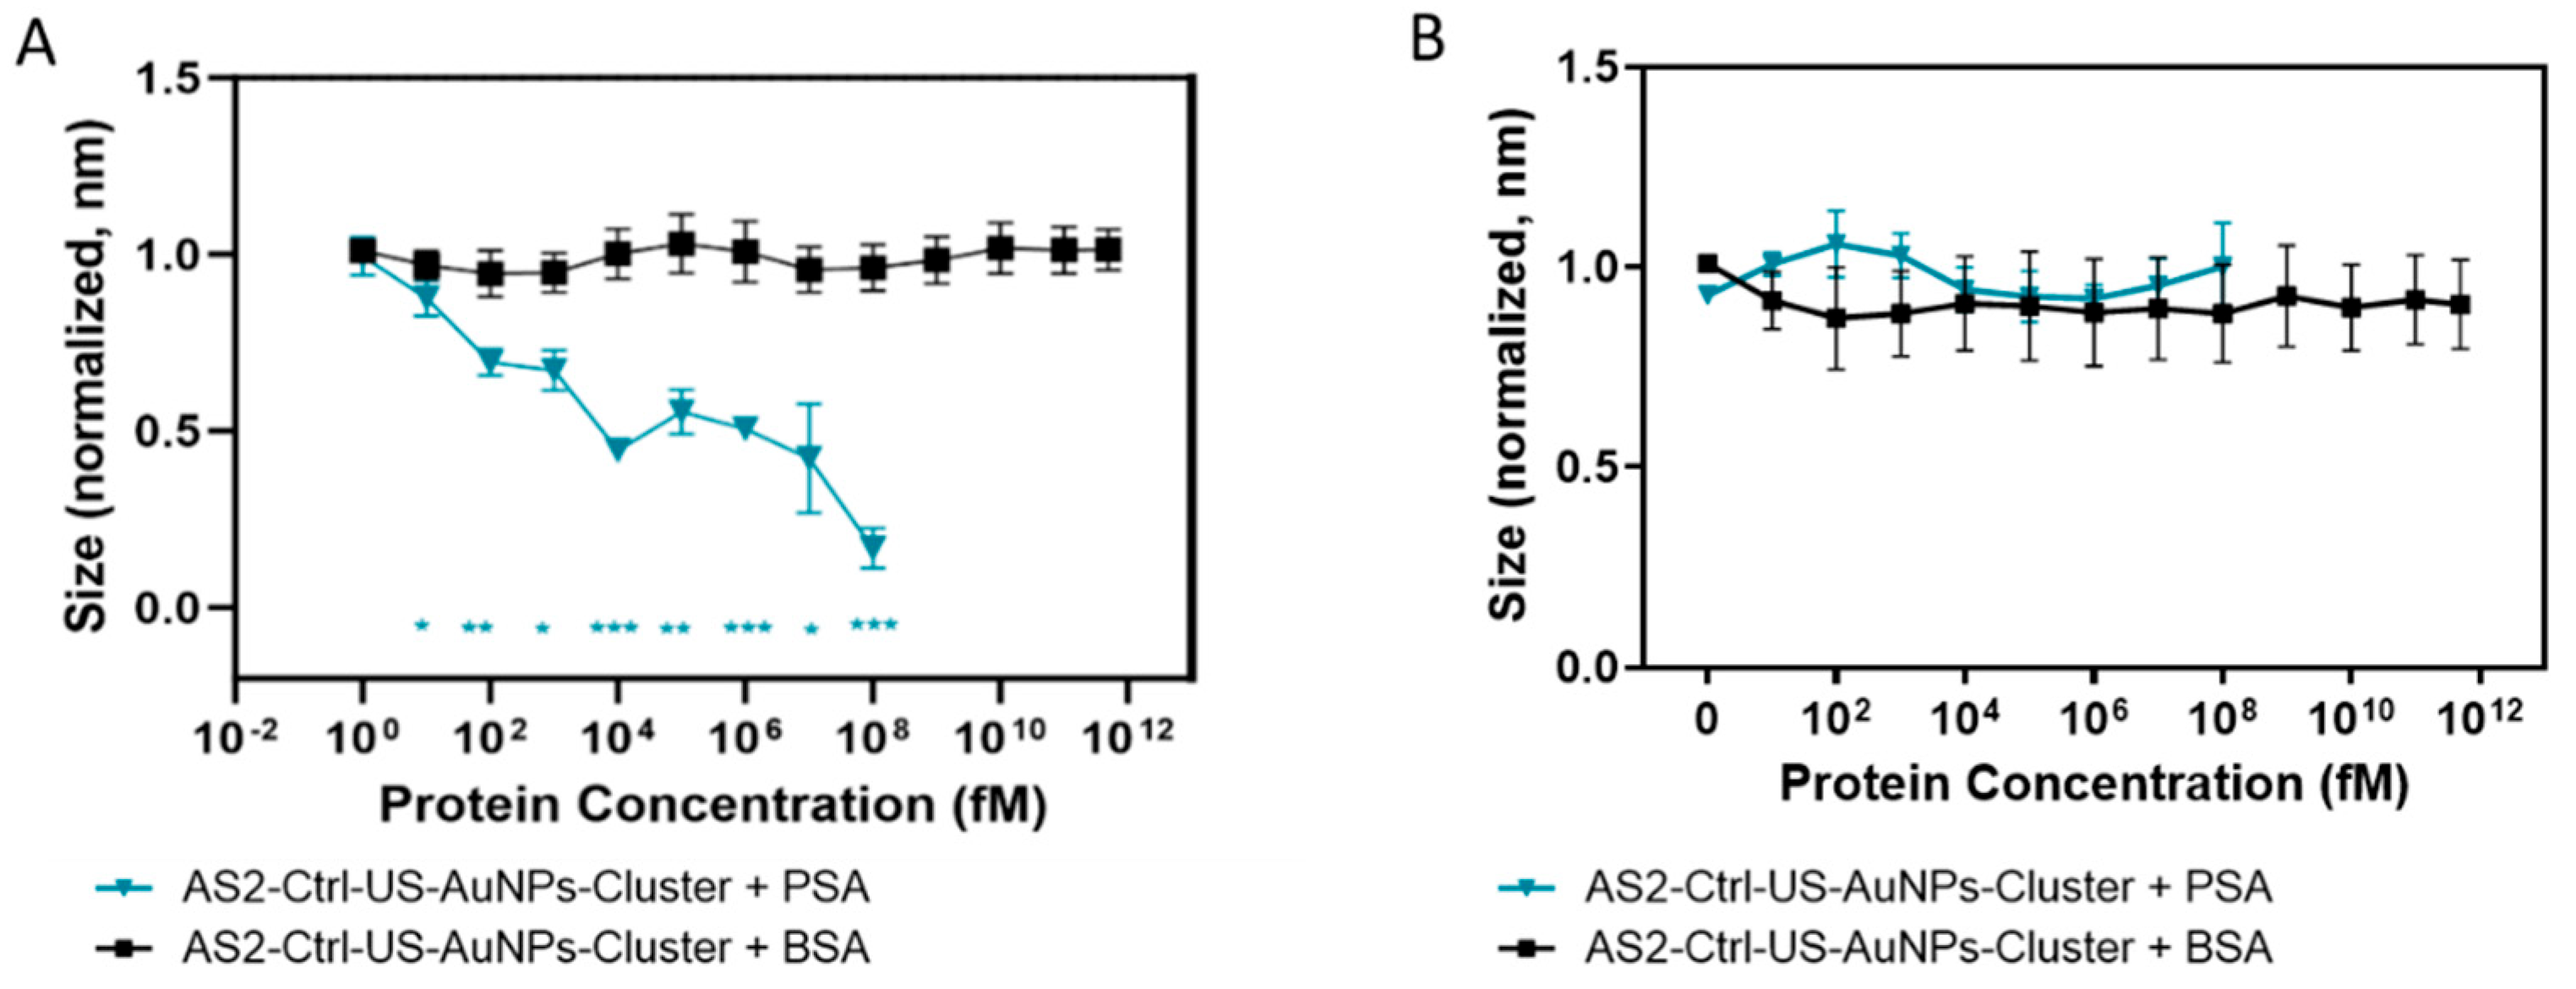
Figure 5.
(A) Stability profile of AS2-US-AuNPs-Aggregate over time in filtered human plasma diluted 1:6. Purple squares represent the average within the most populated peak in the intensity-weighted distribution of the Aggregates sizes (intensity peak 1), orange triangles indicate the same quantity in the second-most populated peak (Intensity Peak 2, when present), and black dots correspond to size averages weighted in number. Each data point represents the average of three readings acquired within a ~2-minute time window, from a single measurement, error bars are standard errors. (B) AS-2-US-AuNPs-Aggregate (pink dots) and AS2-Ctrl-US-AuNPs-Aggregate (black squares) size variation before and after 20 minutes incubation with PSA and plasma proteins. Normalisation is performed with respect to the Aggregate number-weighted size before the incubation with PSA. Number-weighted size decreased from 174.6±38.1 nm (prior to PSA incubation) to 92.5±22.6 nm (for 1 pM PSA) and to 49.2±8.7 nm (for 10 pM PSA). Each data point represents the average of three readings acquired within a ~2-minute time window, from a single measurement, after 20 minutes of PSA incubation), error bars are standard errors. T-test was used to compare the Aggregate normalized size without PSA with respect to the one after PSA incubation. * indicates a p-value < 0.05 and ** indicates a p-value <0.01.
Disclaimer/Publisher’s Note: The statements, opinions and data contained in all publications are solely those of the individual author(s) and contributor(s) and not of MDPI and/or the editor(s). MDPI and/or the editor(s) disclaim responsibility for any injury to people or property resulting from any ideas, methods, instructions or products referred to in the content. |
© 2025 by the authors. Licensee MDPI, Basel, Switzerland. This article is an open access article distributed under the terms and conditions of the Creative Commons Attribution (CC BY) license (http://creativecommons.org/licenses/by/4.0/).
Copyright: This open access article is published under a Creative Commons CC BY 4.0 license, which permit the free download, distribution, and reuse, provided that the author and preprint are cited in any reuse.


