
Submitted:
04 November 2025
Posted:
05 November 2025
You are already at the latest version
Abstract
Enteric methane (CH₄) from beef cattle is a major greenhouse gas and an energy loss to the animal. Understanding how feed and water consumption patterns influence methane production across cattle of different body frame sizes is critical for developing sustainable beef production strategies. This study aimed to determine the impact of water and feed consumption on enteric methane production in South African beef cattle under intensive production systems. Fifteen beef cattle weaners of three different frame sizes (small = 5, medium = 5, and large = 5) were randomly allocated individually to metabolic pens. Feed and water were provided ad libitum. The water intake (WI), feed intake (FI), and weight were measured daily across different feeding phases (starter, grower, and finisher) and WFR were computed. Enteric methane was measured from experimental animals per frame size over five consecutive days per feeding phase using a portable Laser Methane Detector. General Linear Model of Statistical Analysis software (SAS) version 9.4 was used to analyze the data, and the means were separated using Tukey’s Honest Significant Difference (HSD) test. Pearson's correlation coefficient was used to determine the relationship amongst variables, whereas simple linear regression analysis was used to predict methane based on the intake traits. In the starter and grower phases, CH₄ did not differ by frame despite marked intake differences. Medium-frame cattle showed higher FI and WI but lower WFR, indicating efficient hydration relative to intake. In the finisher phase, medium-frame cattle produced more CH₄ (67.33 ppm) than small (34.56 ppm) and large (47.12 ppm). Across phases, CH₄ related weakly to WFR but showed a strong negative correlation with WI in the finisher phase (r=−0.688, p<0.05), suggesting enhanced rumen turnover may constrain methanogenesis. Intake behaviors, modulated by frame size and feeding phase, shape CH₄ dynamics in intensive systems. Managing FI and especially WI to optimize rumen flow offers a practical lever for mitigating CH₄ without compromising performance. Further validation across different diets and production systems is warranted, considering global call to align agricultural practices with Sustainable Development Goals (SDGs), particularly Goal 13 on Climate Action.
Keywords:
Greenhouse gasses
; environmental impact
; feedlot systems
; climate change
; SDGs
1. Introduction
Greenhouse gas emission is a topic that addresses the environmental impact of beef production, particularly in South Africa, where intensive farming practices are prevalent. [1,2]. Ruminant livestock, particularly beef cattle, significantly contribute to greenhouse gas (GHG) emissions, primarily through enteric methane (CH₄) production [3]. Methane, a potent greenhouse gas with a global warming potential approximately 28 times greater than carbon dioxide (CO₂) over 100 years, is produced during the microbial fermentation of feed in the rumen [4]. While methane emissions are an inherent part of ruminant digestion, they represent both an environmental challenge and an energy loss to the animal, accounting for 2–12% of gross energy intake (GEI) [5].
Feed quality, composition, and intake levels significantly influence methane emissions in beef cattle. High fiber diets promote microbial fermentation and methane production, while energy-dense feeds, such as grains and fats, have been shown to reduce CH₄ yield per unit of feed intake [6,7]. Likewise, water availability and intake affect feed digestibility, metabolic efficiency, and ruminal fermentation dynamics, which in turn impact methane emissions [8]. Understanding the interactions between feed, water intake, and methane production is essential for developing mitigation strategies that enhance feed efficiency and reduce environmental footprints.
Mitigating methane emissions from beef cattle production aligns with the United Nations Sustainable Development Goals (SDGs), particularly SDG 2, which aims at ensuring food security for all. Sustainable feeding strategies improve livestock productivity and ultimately, food security. Efficient feed and water use enhance beef production while minimizing resource wastage. Sustainable Development Goal 6 aims for the accessibility of Clean Water and Sanitation. This could be achieved by utilizing water-efficient livestock systems that contribute to global water conservation efforts, as beef cattle production is a significant water-intensive industry [9]. Reducing enteric methane emissions directly contributes to climate change mitigation by lowering agricultural GHG emissions, addressing SDG 13.
Given the growing global demand for beef and increasing environmental concerns, the impact of intensive beef production systems on water resources and greenhouse gas emissions to ensure sustainable food production needs to be evaluated. Optimizing feed and water consumption strategies is, therefore, critical for reducing methane emissions while maintaining productivity and sustainability in beef cattle production. Recent advances in precision feeding and rumen microbiome manipulation provide promising avenues for methane mitigation in beef production systems [5,10,11]. Examining water-use efficiency indicators for methane production in South African beef cattle under intensive production systems is crucial for sustainable agricultural development. It involves balancing productivity with environmental considerations to ensure the long-term viability of beef production while mitigating its impact on water resources and climate change. Therefore, this study sought to determine the impact of water and feed consumption on enteric methane production of South African beef cattle under intensive production systems.
2. Materials and Methods
2.1. Experimental Design and Animal Feeds
The study was conducted at the animal nutrition section of the Agricultural Re-search Council – Production Institute (ARC-PI) in Pretoria, Gauteng, South Africa (25º 53' 59.6" S and 28º 12' 51.6" E). The area is characterized by an ambient temperature range of 18 to 29 ºC during summer and between 5 and 20 ºC during winter. Fifteen [15] healthy beef cattle weaners (Bos Taurus) of three different body frame sizes (small, medium, and large), representing three different breeds (Nguni, Bonsmara and Simmental, respectively) of similar age (7 – 9 months) and body weight groups (150 – 265 kg) were obtained from stud breeders.
On arrival at the research farm, animals were ear-tagged, de-wormed and vaccinated, and health observations were done daily thereafter. The animals were randomly assigned to treatments in a completely randomized design, i.e., five [5] animals per body frame size, and each animal was a replicate unit. The animals were allowed a 28-day adaptation period, followed by data collection for 90 days, over three feeding phases (starter (30 days), grower (32 days) and finisher (28 days)), with the animals placed individually in feeding pens. The random allocation of animals was performed using the RAND function in Microsoft Excel, ensuring unbiased assignment to eliminate allocation bias. The diets were formulated based on hominy chop (a maize by-product) and soybean oilcake, providing a high-energy, moderate-protein ration suitable for post-weaning growth (Table 1). The formulation reflects a typical maize-soy-based intensive feedlot diet, balanced for energy (TDN >74%), protein (CP ~13.5%), and essential minerals, with roughage provided by Eragrostis hay, mirroring typical South African feedlot diets. Each formulation was calculated per 1000 kg of total mixed ration on an as-fed basis.
2.2. Feed and Water Intake
Feed was offered ad libitum daily, and refusals were collected and weighed before fresh feed was provided every day. Since each animal was housed in an individual pen, FI and refusals were measured on an individual basis. The following equation was used for FI:
where Fin – feed weighed in at the beginning of the day.
Fout – feed weighed out of feeders at the end of the day.
Water was provided ad libitum to all animals using individual calibrated water troughs with water meter readings. Water intake (WI) of individual animals was measured daily at 08H00 in the morning before feeding. Water consumption was calculated by adding water intake and water in the feed. Moisture content of the feed was determined using the oven-drying method according to AOAC [12], Method 934.01. Water-to-feed ratio was computed by dividing WI by FI. The following equation was used for WFR:
2.3. Methane Production
Enteric methane emissions were measured using a portable Laser Methane Detector (LMD) mini (Crowcon Detection Instruments Ltd., TGC) over 5 consecutive days on each of the feeding phases (starter, grower, finisher). Daily environmental factors such as wind speed and direction were minimized by performing measurements in a sheltered area. Methane was measured in situ by pointing the laser beam at the nostrils of the animal, without physical contact, to minimize stress and behavioral disturbances. The LMD was positioned at a distance of 1.5 – 2 m from the muzzle at an angle allowing full capture of exhaled gases produced during eructation events. Measurements were taken during the morning feeding period when methane release is highest due to postprandial rumen fermentation activity. For each animal, five consecutive methane readings were recorded within a 5-minute observation period to account for variability due to breath patterns and eructation frequency.
2.4. Statistical Analysis
Data was tested for normality using Shapiro and Wilk. All statistical analyses were performed using SAS software version 9.4 [13]. Descriptive statistics (means ± standard deviation) were calculated for all measured traits. To evaluate the effects of frame size, growth phase, and their interaction on methane production and intake traits, a two-way analysis of variance (ANOVA) was conducted using the General Linear Model (GLM) procedure utilizing the model:
where:
= observed value of the trait (methane production)
= overall mean
= fixed effect of the ith frame size (small, medium, large)
= fixed effect of the jth feeding phase (starter, grower, finisher)
= interaction effect between frame size and growth phase
= random error term
Means were separated using Tukey’s Honest Significant Difference (HSD) test, and differences were considered significant at p < 0.05.
To determine the strength and direction of linear relationships between methane production and intake traits, Pearson correlation coefficients (r) were calculated for each growth phase using the CORR procedure with the following model:
where:
= Pearson correlation coefficient between methane and the trait (e.g., FI, WI, or WFR)
= covariance between the two variables
= standard deviations of variables X and Y, respectively
Significance of correlation was declared at p < 0.05.
To estimate the predictive relationship between methane production (dependent variable) and intake traits (independent variables), simple linear regression analysis was conducted using the REG procedure in SAS. The general model applied was:
where:
= methane production (ppm)
= predictor variable (e.g., FI, WI, WFR)
= intercept
= regression coefficient
= residual error term
The coefficient of determination (R²) was used to assess model fit and explain the proportion of variance in methane determined by the intake traits. These models were applied separately within each feeding phase (starter, grower, finisher) and frame size group (small, medium, large), allowing for detailed, phase-specific interpretation of the relationships.
3. Results
3.1. Water and Feed Intake on Methane Production
Water and feed intake, water consumption and water to feed ratio on enteric methane production of beef cattle under intensive production system are presented in Table 2. During the starter feeding phase, WI and WC were significantly higher (p < 0.05) for the medium-frame beef cattle (34.36 L and 35.42 L, respectively) than the large- (22.52 L and 23.23 L), and small- (28.96 L and 29.66 L) frame beef cattle, respectively. The medium-frame beef cattle had significantly (p < 0.05) higher FI (13.85 kg) than the small- (9.17 kg) and large- (9.29 kg) frame size beef cattle. However, WFR of the medium-frame beef cattle (2.54) was not significantly different (p > 0.05) from that of the large-frame beef cattle (2.41), which was significantly lower (p < 0.05) than for the small-frame beef cattle (3.25). There was no significant difference (p < 0.05) in methane produced by beef cattle of different frame sizes.
During the feeding phase, WI and WC were significantly higher (p < 0.05) for the large- (35.84 L and 37.15 L) and medium- (32.32 L and 33.63 L) compared to the small-frame (23.04 L and 23.61 L) beef cattle, respectively. Feed intake (FI) was significantly lower (p < 0.05) for the small-frame beef cattle (7.59 kg) than for the medium- and large-frame (both 17.41 kg) beef cattle. However, the WFR was significantly higher (p < 0.05) for the small-frame beef cattle (3.07 L/kg) than the medium- (1.86 L/kg) and large-frame (2.07 L/kg) beef cattle. There were no significant differences (p > 0.05) in methane production between the three beef cattle frame sizes observed.
During the finisher phase, the small-frame cattle had significantly high (p < 0.05) WI (35.88 L), WC (36.57 L) and WFR (3.60 L/kg) during this phase while the medium (WI of 28.88 L, WC of 29.58 L and WFR of 2.87 L/kg) and the large-frame (WI of 29.40 L, WC of 30.16 L and WFR of 2.71) beef cattle did not differ significantly (p > 0.05). Feed intake (FI) was not significantly different (p > 0.05) across the beef cattle frame sizes during this growth phase. The small-frame beef cattle maintained the highest WFR (3.60 L/kg), which was significantly higher (p < 0.05) than the medium- (2.87 L/kg) and large-frame (2.71 L/kg) beef cattle, which did not differ significantly (p > 0.05). Medium-frame beef cattle produced significantly more (p < 0.05) methane (67.33 ppm) than the small- (34.56 ppm) and large-frame (47.12 ppm) beef cattle.

Table 2.
Water and feed intake, water consumption and water to feed ratio on enteric methane production of beef cattle under intensive production system.
Table 2.
Water and feed intake, water consumption and water to feed ratio on enteric methane production of beef cattle under intensive production system.
| Growth Phase |
Frame size |
Methane (ppm) |
WI (L) |
WC (L) |
FI (kg) |
WFR (L/kg) |
|---|---|---|---|---|---|---|
| Small | 44.84a±10.02 | 28.96ab±7.85 | 29.66ab±8.06 | 9.17b±3.45 | 3.25a±0.61 | |
| Starter | Medium | 43.93a±10.02 | 34.36a±7.85 | 35.42a±8.06 | 13.85a±3.45 | 2.54b±0.61 |
| Large | 48.14a±10.02 | 22.52b±7.85 | 23.23b±8.06 | 9.29b±3.45 | 2.41b±0.61 | |
| Small | 46.15a±11.75 | 23.04b±5.42 | 23.61b±5.44 | 7.59b±1.53 | 3.07a±0.42 | |
| Grower | Medium | 52.70a±11.75 | 32.32a±5.42 | 33.63a±5.44 | 17.41a±1.53 | 1.86b±0.42 |
| Large | 48.92a±11.75 | 35.84a±5.42 | 37.15a±5.44 | 17.41a±1.53 | 2.07b±0.42 | |
| Small | 34.56b±13.25 | 35.88a±4.27 | 36.57a±4.30 | 10.07a±1.74 | 3.60a±0.64 | |
| Finisher | Medium | 67.33a±13.25 | 28.88b±4.27 | 29.58b±4.30 | 10.16a±1.74 | 2.87b±0.64 |
| Large | 47.12b±13.25 | 29.40b±4.27 | 30.16b±4.30 | 11.05a±1.74 | 2.71b±0.64 |
a, b, c Columns with different superscripts within the growth phase differ significantly (p<0.05). WI (L): Water intake in liters, WC (L): water consumption in liters, FI (kg): feed intake in kilograms, WFR: water-to-feed ratio in liters per kilogram feed intake.
3.2. Linear Regression and Pearson Correlation Coefficients of Relationships
Overall Pearson correlation matrix of water and feed intake on enteric methane production of beef cattle under intensive production systems is presented in Table 3. There were insignificant (p > 0.05) negative correlations between methane and all the traits. During the starter and grower phases, methane had weak correlations with WI (r=-0.297 and r=-0.474, respectively), while during the finisher phase, these traits (methane and WI) had significant (p < 0.05), strong negative correlations (r=-688). Methane and FI had a moderate, negative correlation (-0.409) that was insignificant (p > 0.05). There was a weak negative correlation between methane production and WFR across all feeding phases.
Table 4 presents the Pearson correlation matrix of water and feed intake and water to feed ratio on enteric methane production of beef cattle during the starter feeding phase under intensive production systems and Figure 1 (A: small, B: medium and C: large) linear regression coefficients with their R2 values of WI, FI and WFR on enteric methane production of beef cattle frame sizes during the starter feeding phase under intensive production systems during the starter feeding phase. There was no significant correlation between methane production and WI (r=0.009, p>0.05) on the small-frame cattle. Regression results (Figure 1A) confirmed that WI did not significantly predict methane output (β=0.013, R²=0.00009. A significant negative correlation was observed between methane production and FI (r=−0.662, p<0.05), with regression analysis further showing that FI significantly predicted methane output (β=−3.80, p<0.05), explaining 44% of the variance (R²=0.44). Methane production was positively and significantly correlated with the WFR (r=0.608, p<0.001). Regression results showed that WFR significantly predicted methane emissions (β=7.78, p<0.05), accounting for 37% of the variation (R²=0.37).
On the medium frame cattle, there was no significant correlation between methane production and WI (r=0.125, p>0.05). The regression analysis (β=0.0781; R²=0.016) (Figure 1B) indicated that WI explained only 1.6% of the variation in methane, confirming the absence of a meaningful linear association. Similarly, methane production showed no significant relationship with FI (r=−0.016, p>0.05) with a regression analysis (β=−0.037, R²=0.0003) confirming that FI did not predict methane levels. The correlation between methane and WFR was also not significant (r=0.113, p>0.05), with regression results (β=1.01, R²=0.013) explaining only 1.3% of the variance.
Methane production showed no significant correlation with WI (r=−0.126, p>0.05) on large-frame cattle. The regression analysis (β=0.197; R²=0.016) (Figure 1C) explained less than 2% of the variance. There was likewise no significant correlation between methane and FI (r=0.112, p>0.05). Regression results (β=0.757, R²=0.013) confirmed that FI explained only 1.3% of methane variation, indicating a weak and non-predictive relationship. Finally, methane production was negatively but not significantly correlated with the WFR (r=−0.264, p>0.05). The regression slope (β=−5.58, R²=0.07) showed that only 7% of the variation in methane emissions was explained by WFR.
Table 4.
Pearson correlation matrix of water and feed intake and water to feed ratio on enteric methane production of beef cattle during the starter feeding phase under intensive production systems.
Table 4.
Pearson correlation matrix of water and feed intake and water to feed ratio on enteric methane production of beef cattle during the starter feeding phase under intensive production systems.
| Frame size | Variables | Methane (ppm) |
|---|---|---|
| WI (L) | 0.009NS | |
| Small | FI (kg) | -0.662*** |
| WFR | 0.608*** | |
| WI (L) | 0.125NS | |
| Medium | FI (kg) | -0.016NS |
| WFR | 0.113NS | |
| WI (L) | -0.126NS | |
| Large | FI (kg) | 0.112NS |
| WFR | -0.264NS |
Correlations are significantly different from zero at *p<0.05, NS not significant. WI (L): Water intake in liters, FI (kg): feed intake in kilograms, WFR: water-to-feed ratio in liters per kilogram feed intake.
Figure 1.
Linear regression coefficients with their R2 values for beef cattle frame sizes (A: small, B: medium and C: large) during the starter feeding phase. WI (L): Water intake in liters, FI (kg): feed intake in kilograms, WFR: water-to-feed ratio in liters per kilogram feed intake.
Figure 1.
Linear regression coefficients with their R2 values for beef cattle frame sizes (A: small, B: medium and C: large) during the starter feeding phase. WI (L): Water intake in liters, FI (kg): feed intake in kilograms, WFR: water-to-feed ratio in liters per kilogram feed intake.
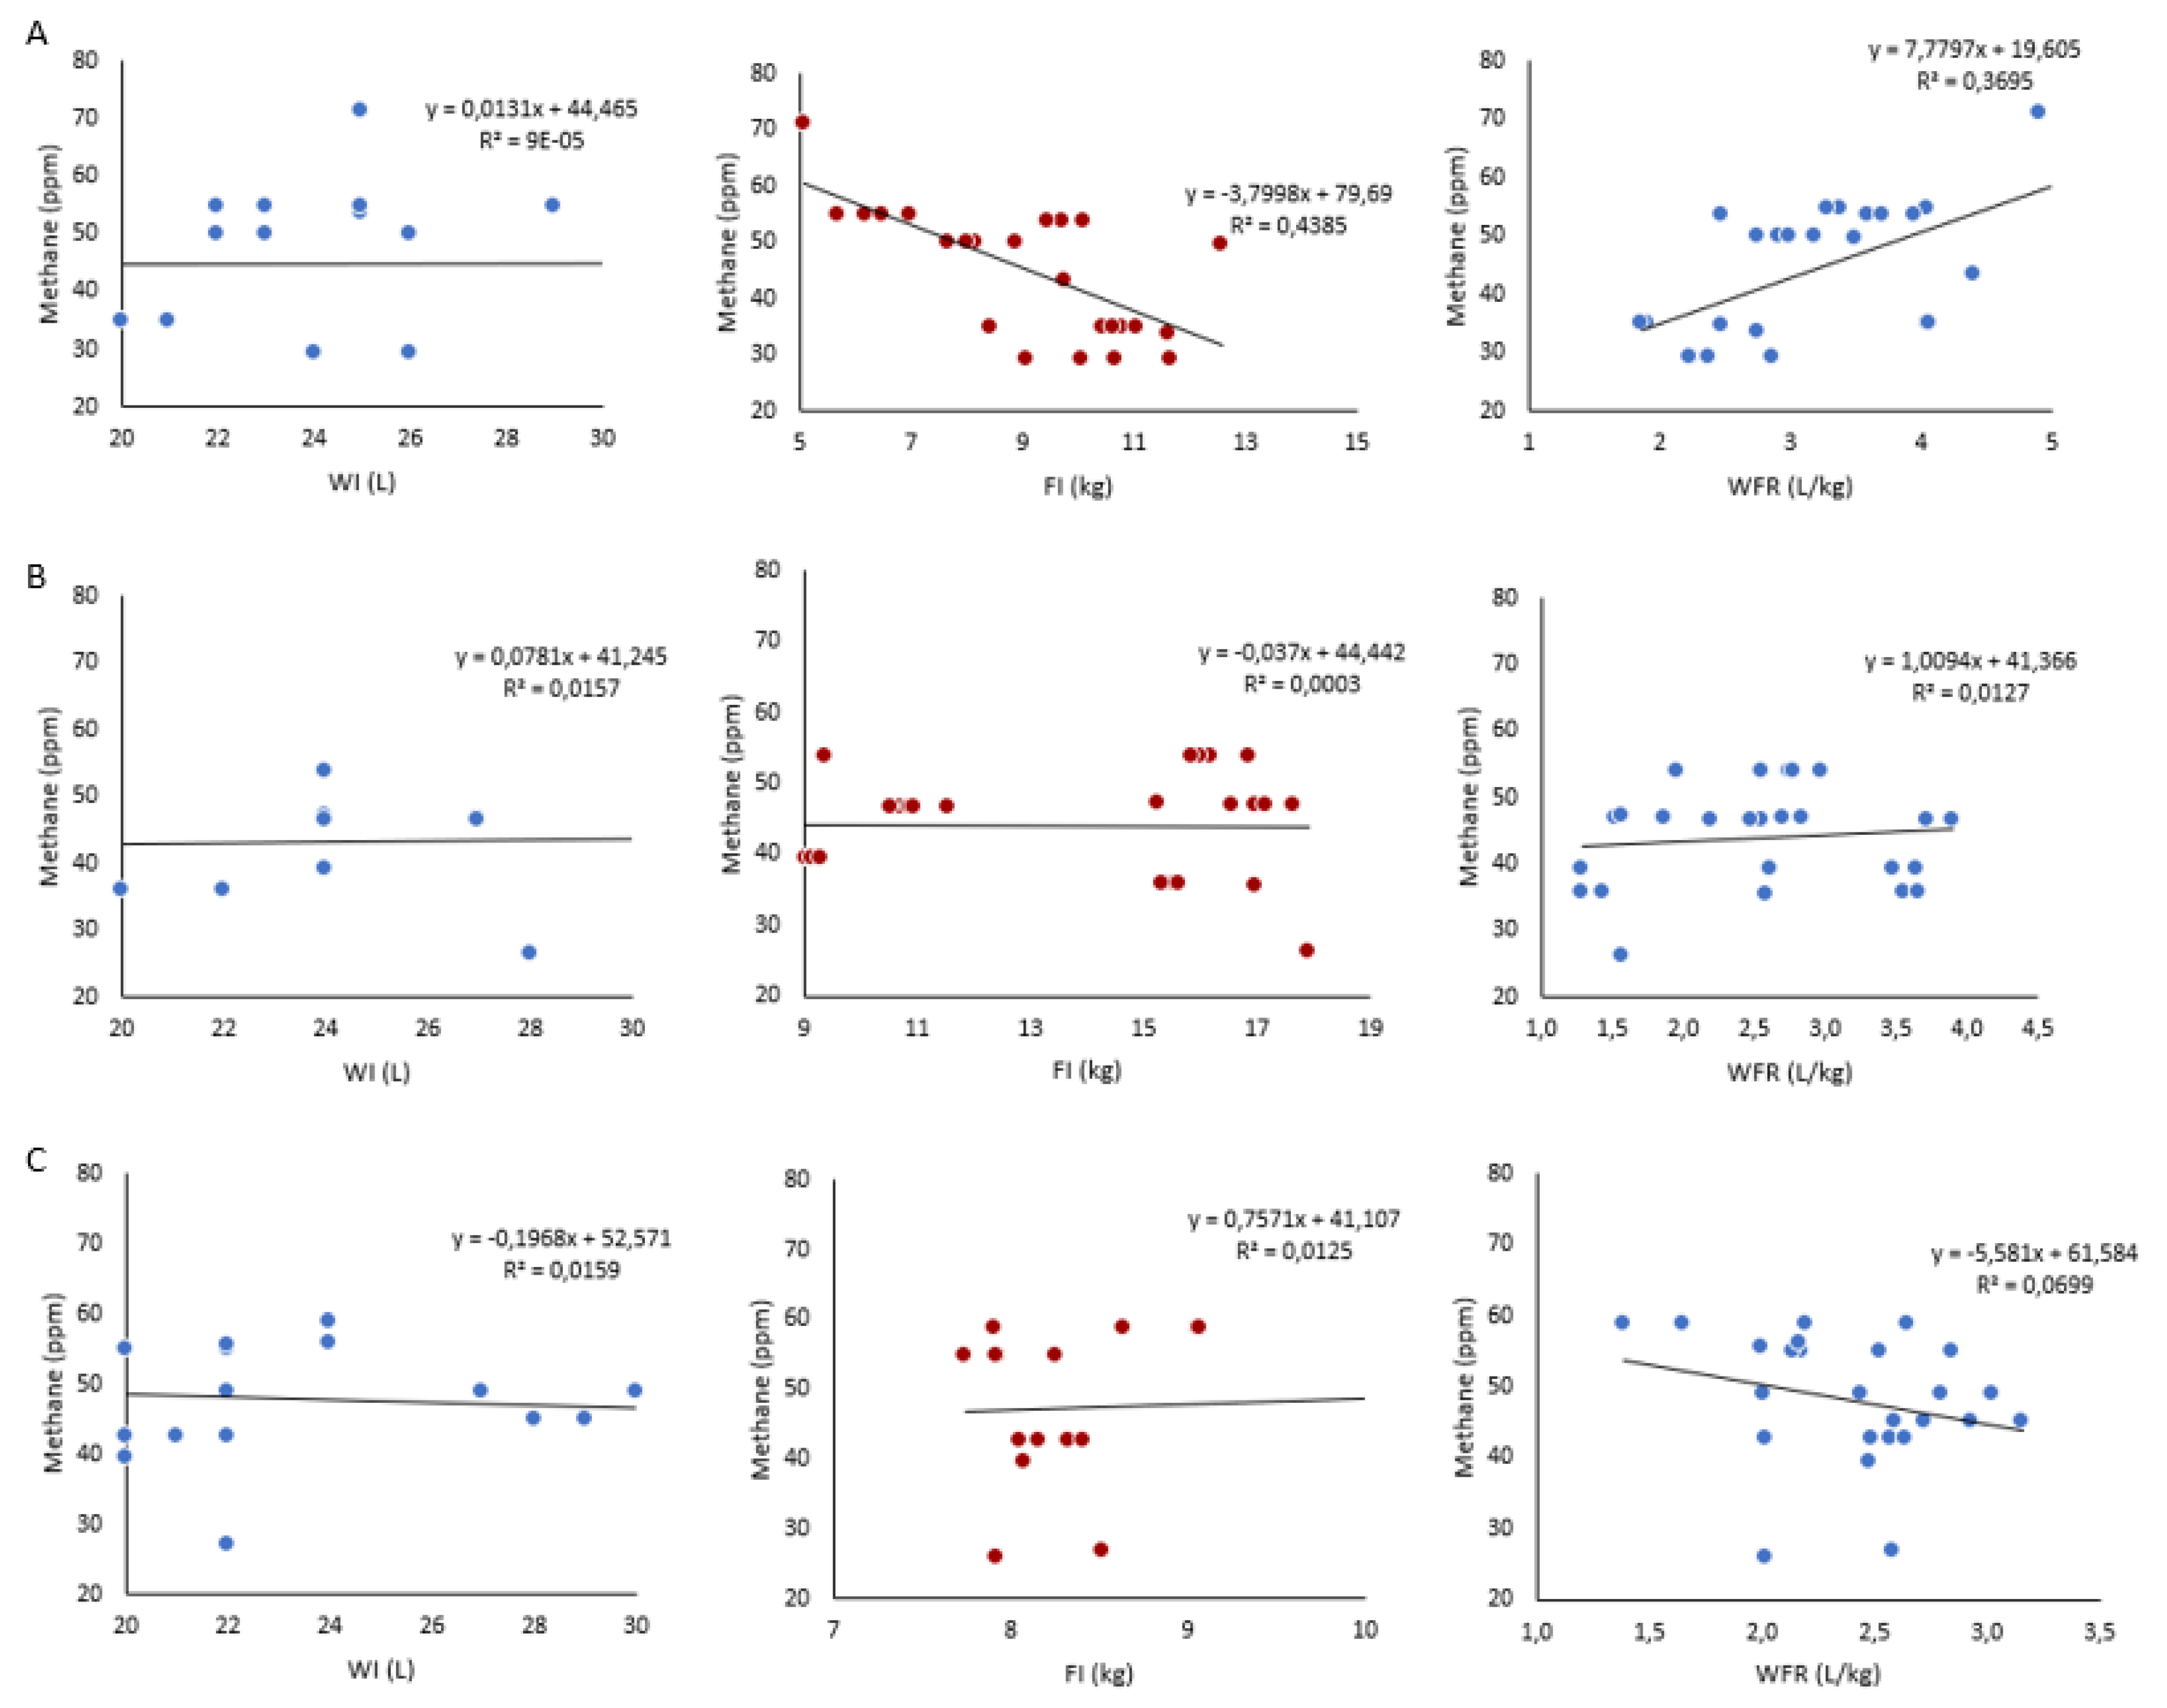
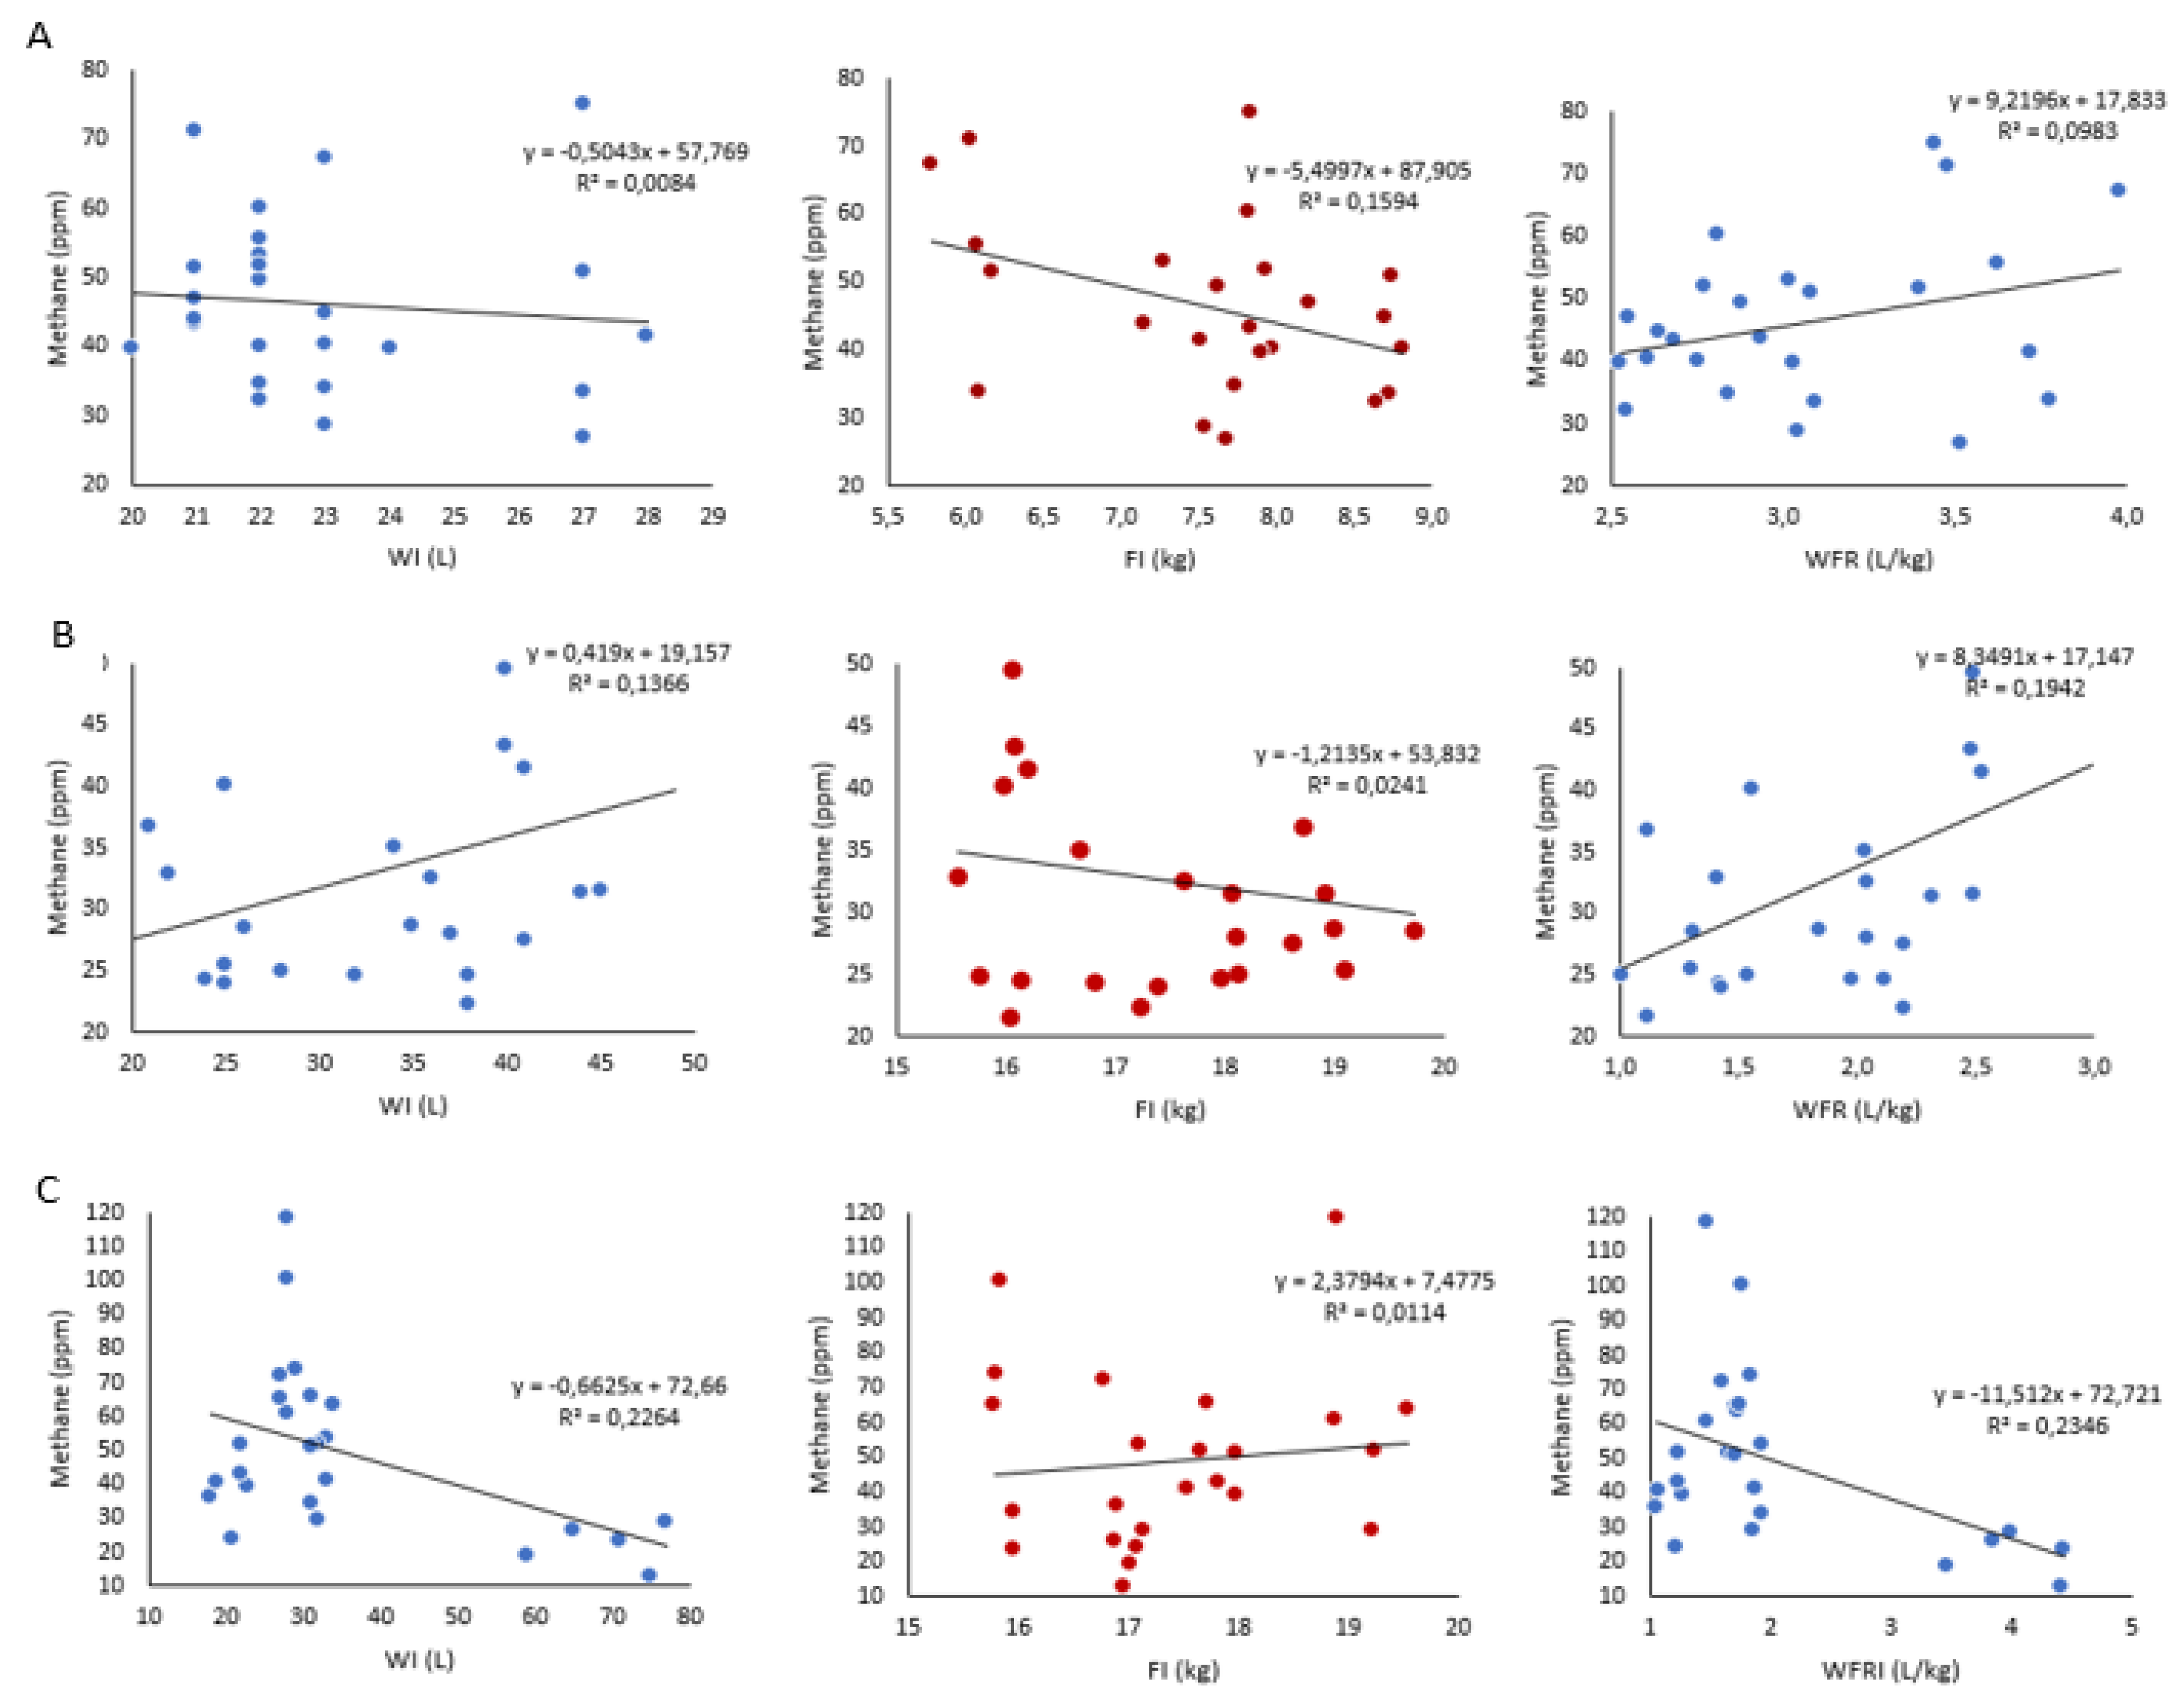
Table 5 presents the Pearson correlation matrix of water and feed intake and water to feed ratio on enteric methane production of beef cattle during the grower feeding phase under intensive production systems and Figure 2 (A: small, B: medium and C: large) linear regression coefficients with their R2 values of WI, FI and WFR on enteric methane production of beef cattle frame sizes during the grower feeding phase under intensive production systems during the starter feeding phase. There was a moderate positive and statistically significant correlation between methane production and WI (r=0.448, p<0.05). Regression results (Figure 2A) further indicated a positive relationship between the two variables (β=0.0131; R²=0.00009), although the model explained less than 0.01% of the variance. Methane production showed no significant correlation with FI (r=−0.023, p>0.05), and regression analysis (β=−3.7998; R²=0.44) showed no meaningful linear trend. Similarly, methane was not significantly correlated with WFR (r=0.322, p>0.05). The regression results (β=7.7797; R²=0.37) explained 37% of the variance, but the lack of statistical significance.
For medium-frame cattle, Table 2 shows no significant correlation between methane production and WI (r=0.370, p>0.05). Regression analysis (Figure 2B; β=0.0781; R²=0.016) confirmed that WI accounted for only 1.6% of the variance in methane production, indicating a weak and biologically negligible association. Similarly, methane production did not correlate significantly with FI (r=−0.155, p>0.05). The regression results (β=−0.037; R² = 0.0003) showed an almost flat slope, reinforcing that FI had minimal predictive value for methane variation in medium-frame animals during this phase. However, a positive and statistically significant correlation was observed between methane production and the WFR (r=0.441, p<0.05). Regression results (β= 1.0094; R²=0.013) indicated that WFR explained about 1.3% of the variance in methane emissions.
In large-frame cattle, methane production showed a significant negative correlation with WI (r=−0.476, p<0.05). Regression analysis (Figure 2C; β= 0.1968; R²=0.016) revealed that WI explained 1.6% of the variance in methane production. Methane production was not significantly correlated with FI (r=0.107, p>0.05). The regression analysis (β=0.7571; R²=0.013) accounted for 1.3% of the variance. A significant negative correlation was observed between methane production and the WFR (r=−0.484, p<0.05). Regression results (β=−5.581; R²=0.07) showed that WFR explained approximately 7% of the variance in methane emissions.
Table 5.
Pearson correlation matrix of water and feed intake and water to feed ratio on enteric methane production of beef cattle during the grower feeding phase under intensive production systems
Table 5.
Pearson correlation matrix of water and feed intake and water to feed ratio on enteric methane production of beef cattle during the grower feeding phase under intensive production systems
| Frame size | Variables | Methane (ppm) |
|---|---|---|
| WI (L) | 0.448* | |
| Small | FI (kg) | -0.023NS |
| WFR | 0.322NS | |
| WI (L) | 0.370NS | |
| Medium | FI (kg) | -0.155NS |
| WFR | 0.441* | |
| WI (L) | -0.476* | |
| Large | FI (kg) | 0.107NS |
| WFR | -0.484* |
Correlations are significantly different from zero at *p<0.05, NS not significant. WI (L): Water intake in liters, FI (kg): feed intake in kilograms, WFR: water-to-feed ratio in liters per kilogram feed intake.
Table 6 presents the Pearson correlation matrix of water and feed intake and water to feed ratio on enteric methane production of beef cattle during the finisher feeding phase under intensive production systems and Figure 3 (A: small, B: medium and C: large) linear regression coefficients with their R2 values of water and feed traits on enteric methane production of beef cattle frame sizes during the finisher feeding phase under intensive production systems. There was a negative but non-significant correlation between methane production and WI (r=−0.198, p>0.05). The regression analysis (Figure 3A; β=−0.6646; R²=0.039) showed that WI explained only 3.9 % of the variance in methane production. Methane production exhibited a positive but non-significant relationship with FI (r=0.364, p>0.05). Regression results (β=5.457; R²=0.1322) indicated that FI accounted for about 13 % of the variance in methane output. The correlation between methane production and the WFR was negative and non-significant (r=−0.384, p>0.05). Regression analysis (β=−10.821; R²=0.1473) showed that WFR explained approximately 15 % of methane variation.
Figure 2.
Linear regression coefficients with their R2 values for beef cattle frame sizes (A: small, B: medium and C: large) during the grower feeding phase. WI (L): Water intake in liters, FI (kg): feed intake in kilograms, WFR: water-to-feed ratio in liters per kilogram feed intake.
Figure 2.
Linear regression coefficients with their R2 values for beef cattle frame sizes (A: small, B: medium and C: large) during the grower feeding phase. WI (L): Water intake in liters, FI (kg): feed intake in kilograms, WFR: water-to-feed ratio in liters per kilogram feed intake.
For medium-frame cattle, Table 6 shows no significant correlations between methane production and any of the intake traits (WI, FI and WFR). The relationship between methane and WI was weak (r=−0.087, p>0.05), and the regression analysis (Figure 3B; β=0.4448; R²=0.008) explained less than 1 % of variance. Similarly, methane production was not significantly correlated with FI (r=−0.146, p>0.05). Regression results (β=−3.5373; R²=0.021) accounted for only 2 % of variance. The WFR also showed no significant relationship with methane (r=−0.006, p>0.05). The regression (β=−0.2872; R²=0.00004) was almost flat, suggesting a complete lack of association between WFR and methane emission in medium-frame cattle during the finisher phase.
In large-frame cattle, Table 6 indicates that methane production was not significantly correlated with WI (r=0.060, p>0.05). The regression results (Figure 3C; β=0.2523; R²=0.004) explained only 0.3 % of variance, confirming the absence of a predictive link between WI and methane output. A weak and non-significant negative correlation was found between methane and FI (r=−0.134, p>0.05). Regression analysis (β=−1.398; R²=0.018) indicated that FI accounted for just 1.8 % of variance, suggesting that variation in feed intake had a negligible influence on methane production during the finishing period. The WFR likewise showed no significant relationship with methane production (r=−0.162, p>0.05). The regression analysis (β=4.5804; R²=0.026) explained 2.6 % of variance.
Table 6.
Pearson correlation matrix of water and feed intake and water to feed ratio on enteric methane production of beef cattle during the finisher feeding phase under intensive production systems
Table 6.
Pearson correlation matrix of water and feed intake and water to feed ratio on enteric methane production of beef cattle during the finisher feeding phase under intensive production systems
| Frame size | Variables | Methane (ppm) |
|---|---|---|
| WI (L) | -0.198NS | |
| Small | FI (kg) | 0.364NS |
| WFR | -0.384NS | |
| WI (L) | -0.087NS | |
| Medium | FI (kg) | -0.146NS |
| WFR | -0.006NS | |
| WI (L) | 0.060NS | |
| Large | FI (kg) | -0.134NS |
| WFR | 0.162NS |
Correlations are significantly different from zero at *p<0.05, NS not significant. WI (L): Water intake in liters, FI (kg): feed intake in kilograms, WFR: water-to-feed ratio in liters per kilogram feed intake.
Figure 3.
Linear regression coefficients with their R2 values for beef cattle frame sizes (A: small, B: medium and C: large) during the finisher feeding phase. WI (L): Water intake in liters, FI (kg): feed intake in kilograms, WFR: water-to-feed ratio in liters per kilogram feed intake.
Figure 3.
Linear regression coefficients with their R2 values for beef cattle frame sizes (A: small, B: medium and C: large) during the finisher feeding phase. WI (L): Water intake in liters, FI (kg): feed intake in kilograms, WFR: water-to-feed ratio in liters per kilogram feed intake.

4. Discussion
Enteric methane (CH₄) emissions from beef cattle varied depending on beef cattle frame size. Each cattle frame-size displayed distinct FI patterns and metabolic efficiencies that influence methane production. In the starter phase, methane production did not significantly differ across frame sizes, despite noticeable variations in WI and FI. This suggests that during the early phase of growth, rumen activity and microbial fermentation may be relatively uniform across genotypes, likely due to immature rumen development [14,15]. However, distinct WI and FI behaviors were already evident. Medium frame size beef cattle recorded the highest WI and FI, but maintained the lowest WFR, implying efficient hydration relative to nutritional intake. This efficiency may be linked to metabolic maturity, digestive organ size, or improved water absorption and nutrient assimilation [16,17].
In contrast, small-frame cattle had significantly lower FI yet a higher WFR, indicating a proportionally higher water demand per unit of feed. This may be due to inefficient rumen fermentation in smaller-framed animals [17,18]. Interestingly, large frame size cattle consumed similar amounts of feed to small frame size beef cattle, but had the lowest WI overall, leading to the lowest WFR. This may reflect behavioral or physiological adjustments in large-frame cattle, such as delayed adaptation to new environments or diets, potentially resulting in reduced drinking frequency and slower water turnover rates [19].
During the grower feeding phase, distinct patterns emerged in methane emissions, which increased across all frame sizes in parallel with rising FI. Medium and large frame size beef cattle consumed significantly more water and feed than small frame cattle, a trend reflecting their elevated energy demands for musculoskeletal development, as also reported by Ojo et al. [20]. The strong positive association between FI and methane production became particularly evident during this stage, with medium frame size cattle producing the highest methane volumes, closely followed by large frame cattle. This finding supports the work of Beauchemin et al. [6], who noted that increased dry matter intake enhances fermentative activity in the rumen, resulting in greater hydrogen production that is a precursor for methanogenesis. The heightened emissions in medium frame animals may further suggest a rumen environment optimized for microbial activity, consistent with observations by Gerber et al. [21] and Haque [22], who reported that cattle with moderate frame sizes tend to exhibit higher feed digestibility and rumen retention time, which in turn promotes methane yield. Conversely, while large frame cattle also showed high FI, their greater gut capacity may facilitate faster digesta passage, potentially moderating total methane production relative to intake, as described by McAuliffe et al. [16].
Despite these increases in WI, FI and methane emissions, medium frame size beef cattle maintained a favorable WFR, indicating that their metabolic and digestive systems efficiently regulated water-use in tandem with nutrient assimilation. This observation aligns with other findings that reported medium frame size cattle often display optimized productive efficiency, allowing them to balance intake and hydration demands without compromising productivity [17,18,23]. Their lower WFR suggested better synchronization between water metabolism and rumen fermentation, supporting sustained microbial activity while avoiding excessive water turnover. In contrast, small frame size beef cattle retained the highest WFR, alongside the lowest absolute FI and methane production. This supports the observations of Mapiye et al. [24], who found that smaller-framed genotypes, due to their lower maintenance energy requirements, are conservative in both water and feed usage. Their elevated WFR may reflect slower digestive rates. As a result, while small frame beef cattle demonstrated strong resource-use efficiency, their limited intake constrained methane production.
Large frame size beef cattle showed elevated WI and FI with a slightly higher WFR than medium frame size beef cattle during the finisher phase. This pattern suggests that, although they possessed greater intake capacity, their efficiency in converting water relative to feed consumed was somewhat compromised. This might be due to large frame size animals allocating a greater proportion of their resources toward skeletal and structural tissue development, which increases their basal water requirements for cellular maintenance and nutrient transport [20]. As highlighted by Mapiye et al. [24] and McAllister et al. [17], large-framed beef cattle often have higher maintenance energy and water requirements that do not directly contribute to productive gain. This can lead to reduced digestive efficiency per unit of feed consumed, especially if rumen passage rates are altered by gut fill constraints or delayed microbial adaptation.
Although small frame cattle increased their WI and FI in the finisher phase, their total digestive tract volume remains inherently lower than that of medium and large frame animals. This limits the total volume of fermentable substrate that can be processed at any given time, thereby constraining methane production. McAllister et al. [17] and Ojo et al. [20] noted that smaller rumen volume reduces overall fermentative capacity, even when intake increases. The rise in intake may reflect compensatory consumption, but it does not necessarily equate to proportional increases in methane, as the fermentation efficiency is still governed by physical and microbial constraints [25].
The contrasting relationships observed between intake traits and methane production across frame sizes and growth phases highlight the complex interaction between water metabolism, rumen fermentation kinetics, and methanogenesis in intensively managed beef cattle. Enteric methane production showed a negative correlation with FI in small-frame cattle, particularly in the starter growth phase and continued to weaken in subsequent phases. This signifies that, animals with higher FI exhibited improved fermentation efficiency, likely due to accelerated digesta turnover and reduced rumen retention time. These findings are in agreement with reports by Goopy et al. [26] and Galyean and Hales [27], who noted that higher intake rates dilute maintenance energy requirements and lower methane yield per unit of feed consumed under feedlot conditions. Younger cattle may also have faster growth rates, which improves feed utilization and energy partitioning, leading to reduced methane losses, a similar observation made in dairy cows as well [28]. In the grower phase, the negative correlation weakened, likely due to increased FI leading to higher rumen fermentation activity and a decrease in feed efficiency as animals approached maturity [20,29]. The study also recorded moderate correlations of FI and methane production in small-frame beef cattle during the finisher feeding phase. The weak correlation in the finisher phase indicated that feed composition or quality may play a larger role in methane production than total intake. High concentrate diets, common in finishing systems, are known to decrease methane production due to decreased fermentation of structural carbohydrates [30,31].
A weak correlation between FI and methane production in medium- and large-frame cattle indicates that variations in feed consumption had minimal influence on enteric methane output in these groups. This suggests that methane production became largely independent of FI, likely due to greater digestive efficiency [32]. Larger-framed animals generally exhibit higher absolute intake capacity and faster passage rates, which can reduce methane yield per unit of feed [33]. The weak relationship also implies that, within these frame sizes, differences in methane emissions may be governed more by fermentation patterns, feed composition, or metabolic rate rather than by intake volume itself. Similar observations have been reported by Beauchemin et al. [6] and Garnsworthy et al. [34], who noted that once feed efficiency improves and rumen function stabilizes, methane output no longer scales linearly with intake.
The significant positive correlation between WI and methane production in small-frame cattle during the grower phase indicates that excessive WI may increase rumen fluid volume and microbial activity, thereby promoting methanogenesis. Conversely, the negative correlation in large-frame cattle at the same feeding phase suggests that higher WI enhances rumen dilution and hydrogen flux, leading to reduced methane formation [35,36,37]. These opposing responses emphasize that frame size modifies the physiological role of WI, with small-framed animals benefiting from controlled hydration that optimizes fermentation, while larger-framed cattle rely on greater water throughput to regulate rumen temperature and mitigate excessive fermentation gas accumulation [18,38,39]. The absence of significant relationships in the finisher phase across all frame sizes may reflect a metabolic stabilization effect, where animals achieve peak feed efficiency and methane output plateaus irrespective of intake fluctuations. Similar trends were observed by Grossi et al. [40], who reported that methane emissions become less sensitive to intake variation as cattle reach mature body weight and feed conversion efficiency improves.
The relationship between methane emissions and the WFR remains consistently weak across all phases. While WI and FI components individually show moderate to strong correlations with methane production, their combined ratio may dilute these relationships [41]. Observations made on individual beef cattle frame sizes showed moderate sensitivity of methane production to WFR, particularly the small-frame cattle across all feeding phases and the medium-frame cattle during the grower phase. There is a paucity of information on these relationships, particularly in beef cattle. A study in growing-finishing pigs indicated that an increased WFR enhances feed efficiency [42]. Enhancing feed efficiency has been reported to reduce methane production [29]. The weak correlations suggest that WFR does not directly impact rumen fermentation processes or methane production in the large-frame cattle. The WFR may be more indicative of water-use efficiency or hydration status rather than a predictor of methane emissions. Hydration status of the rumen contents, however, ensures microbial suspension and efficient transfer of hydrogen for methane production [43,44]. This aligns with findings by [18,45], who reported minimal direct relationships between WFR and methane emissions but emphasized the importance of WI in improving metabolic processes.
5. Conclusions
This study demonstrated that the strength and direction of relationships between intake traits and methane production varied by frame size and feeding phase. During the starter phase, small-frame cattle showed a strong negative relationship between FI and methane production, suggesting improved fermentation efficiency with higher consumption. In the grower phase, WI significantly influenced methane production but in opposite directions among frame sizes, positively in small-frame and negatively in large-frame cattle, indicating that frame size modifies the physiological role of water in rumen fermentation. By the finisher phase, methane output was largely independent of intake behavior, reflecting a stage of metabolic stabilization. Overall, the findings confirm that WI and WFR exert stronger and more dynamic influence on methane production than FI, particularly during the grower phase. Differences among frame sizes highlight that, physiological traits such as rumen capacity and digesta passage rate, govern the efficiency of hydrogen utilization and methanogenesis in feedlot beef cattle. The observed phase- and frame-specific responses suggest that WUE can serve as a valuable indicator for methane mitigation strategies in intensive beef systems. Managing hydration to optimize rumen turnover, especially during the grower phase on large-frame cattle, may reduce methane emissions. The study supports global efforts towards SDG-aligned Climate Action.
Author Contributions
Conceptualization, B.M., K.N., A.N., M.R.; and T.M.; methodology, A.N. and M.R.; formal analysis, A.N.; investigation, A.N.; resources, A.N., B.M., K.N., and M.R.; data curation, A.N.; writing—original draft preparation, A.N.; writing—review and editing, B.M., K.N., M.R., and T.M.; visualization, A.N.; supervision, B.M., K.N., M.R. and T.M.; project administration, A.N., and B.M; funding acquisition, B.M. All authors have read and agreed to the published version of the manuscript.
Funding
This research was funded by Water Research Commission, grant number K5/2964.
Institutional Review Board Statement
All experimental procedures involving animals were conducted in accordance with the guidelines and regulations of the Tshwane University of Technology Animal Research Ethics Committee (TUT-AREC). Ethics approval for this study was granted on 12 June 2023 under the reference number AREC202306006.
Informed Consent Statement
Not applicable. The animals used in this study were purchased specifically for research purposes, and the research team retained full ownership of the animals throughout the duration of the study. Therefore, informed consent was not required.
Data Availability Statement
The Tshwane University of Technology (TUT) remains the owner of any intellectual property because of this study. No information is allowed to be used without the prior permission of TUT.
Acknowledgments
The authors acknowledge the support provided by the funder of this study, Water Research Commission. The authors would also like to express their sincere gratitude to the Agricultural Research Council – Animal Production (ARC-AP) for providing the research facilities and technical support necessary to conduct this study. In addition, the authors would like to extend their gratitude to Ms. Nicolene Cochrane for assisting with the statistical analysis. During the preparation of this work, the author(s) used Zotero, version 7.0.11 for reference management. The authors have reviewed and edited the content as needed and take full responsibility for the publication’s content.
Conflicts of Interest
The authors declare no conflicts of interest. The funders had no role in the design of the study; collection, analyses, or interpretation of data; in the writing of the manuscript, or in the decision to publish the results.
References
- Webb E, Erasmus L. The effect of production system and management practices on the quality of meat products from ruminant livestock. South Afr J Anim Sci. 2014 Jan 9;43(3):413. [CrossRef]
- Saki A. Economic Sustainability of Extensive Beef Production in South Africa. 2020;
- Cheng M, McCarl B, Fei C. Climate Change and Livestock Production: A Literature Review. Atmosphere. 2022 Jan 15;13(1):140. [CrossRef]
- IPCC. Climate Change 2021 – The Physical Science Basis: Working Group I Contribution to the Sixth Assessment Report of the Intergovernmental Panel on Climate Change [Internet]. 1st ed. Cambridge University Press; 2023 [cited 2025 Feb 9]. Available from: https://www.cambridge.org/core/product/identifier/9781009157896/type/book.
- Min BR, Lee S, Jung H, Miller DN, Chen R. Enteric Methane Emissions and Animal Performance in Dairy and Beef Cattle Production: Strategies, Opportunities, and Impact of Reducing Emissions. Animals. 2022 Apr 7;12(8):948. [CrossRef]
- Beauchemin KA, Ungerfeld EM, Eckard RJ, Wang M. Review: Fifty years of research on rumen methanogenesis: lessons learned and future challenges for mitigation. Animal. 2020;14:s2–16. [CrossRef]
- Tongwane MI, Moeletsi ME. Emission factors and carbon emissions of methane from enteric fermentation of cattle produced under different management systems in South Africa. J Clean Prod. 2020 Aug;265:121931. [CrossRef]
- Tedeschi LO, Abdalla AL, Álvarez C, Anuga SW, Arango J, Beauchemin KA, et al. Quantification of methane emitted by ruminants: a review of methods. J Anim Sci. 2022 July 1;100(7):skac197. [CrossRef]
- Gerber PJ, Hristov AN, Henderson B, Makkar H, Oh J, Lee C, et al. Technical options for the mitigation of direct methane and nitrous oxide emissions from livestock: a review. Animal. 2013;7:220–34. [CrossRef]
- Hristov AN, Melgar A, Wasson D, Arndt C. Symposium review: Effective nutritional strategies to mitigate enteric methane in dairy cattle. J Dairy Sci. 2022 Oct;105(10):8543–57. [CrossRef]
- Smith PE, Kelly AK, Kenny DA, Waters SM. Enteric methane research and mitigation strategies for pastoral-based beef cattle production systems. Front Vet Sci. 2022 Dec 23;9:958340. [CrossRef]
- Horwitz W, AOAC International, editors. Official methods of analysis of AOAC International. 18. ed., current through rev. 1, 2006. Gaithersburg, Md: AOAC International; 2006. 2400 p.
- SAS Institute. Base SAS 9.4 Procedures Guide, Seventh Edition. 2017;
- Méo-Filho P, Berndt A, Marcondes CR, Pedroso AF, Sakamoto LS, Boas DFV, et al. Methane Emissions, Performance and Carcass Characteristics of Different Lines of Beef Steers Reared on Pasture and Finished in Feedlot. Animals. 2020 Feb 13;10(2):303. [CrossRef]
- Meo-Filho P, Ramirez-Agudelo JF, Kebreab E. Mitigating methane emissions in grazing beef cattle with a seaweed-based feed additive: Implications for climate-smart agriculture. Proc Natl Acad Sci. 2024 Dec 10;121(50):e2410863121. [CrossRef]
- McAuliffe GA, Takahashi T, Orr RJ, Harris P, Lee MRF. Distributions of emissions intensity for individual beef cattle reared on pasture-based production systems. J Clean Prod. 2018 Jan;171:1672–80. [CrossRef]
- McAllister TA, Stanford K, Chaves AV, Evans PR, Eustaquio De Souza Figueiredo E, Ribeiro G. Nutrition, feeding and management of beef cattle in intensive and extensive production systems. In: Animal Agriculture [Internet]. Elsevier; 2020 [cited 2025 Feb 9]. p. 75–98. Available from: https://linkinghub.elsevier.com/retrieve/pii/B9780128170526000057.
- Terry SA, Basarab JA, Guan LL, McAllister TA. Strategies to improve the efficiency of beef cattle production. Miglior F, editor. Can J Anim Sci. 2021 Mar 1;101(1):1–19.
- Neel JPS, Turner KE, Coleman SW, Brown MA, Gowda PH, Steiner JL. Effect of Frame Size on Enteric Methane (CH4) and Carbon Dioxide (CO2) Production by Lactating Beef Cows Grazing Native Tall-Grass Prairie Pasture in Central Oklahoma, USA, 1: Summer Season. J Anim Sci Res [Internet]. 2019 [cited 2025 Feb 9];3(3). Available from: https://www.sciforschenonline.org/journals/animal-science-research/JASR130.php.
- Ojo AO, Mulim HA, Campos GS, Junqueira VS, Lemenager RP, Schoonmaker JP, et al. Exploring Feed Efficiency in Beef Cattle: From Data Collection to Genetic and Nutritional Modeling. Animals. 2024 Dec 17;14(24):3633. [CrossRef]
- Gerber PJ, Mottet A, Opio CI, Falcucci A, Teillard F. Environmental impacts of beef production: Review of challenges and perspectives for durability. Meat Sci. 2015 Nov;109:2–12. [CrossRef]
- Haque MN. Dietary manipulation: a sustainable way to mitigate methane emissions from ruminants. J Anim Sci Technol. 2018 Dec;60(1):15. [CrossRef]
- Ismail M, Al-Ansari T. Enhancing sustainability through resource efficiency in beef production systems using a sliding time window-based approach and frame scores. Heliyon. 2023 July;9(7):e17773. [CrossRef]
- Mapiye O, Chikwanha OC, Makombe G, Dzama K, Mapiye C. Livelihood, Food and Nutrition Security in Southern Africa: What Role Do Indigenous Cattle Genetic Resources Play? Diversity. 2020 Feb 12;12(2):74. [CrossRef]
- Pressman EM, Kebreab E. A review of key microbial and nutritional elements for mechanistic modeling of rumen fermentation in cattle under methane-inhibition. Front Microbiol [Internet]. 2024 Nov 21 [cited 2025 July 28];15. Available from: https://www.frontiersin.org/articles/10.3389/fmicb.2024.1488370/full.
- Goopy JP, Korir D, Pelster D, Ali AIM, Wassie SE, Schlecht E, et al. Severe below-maintenance feed intake increases methane yield from enteric fermentation in cattle. Br J Nutr. 2020 June 14;123(11):1239–46. [CrossRef]
- Galyean ML, Hales KE. Feeding Management Strategies to Mitigate Methane and Improve Production Efficiency in Feedlot Cattle. Animals. 2023 Feb 20;13(4):758. [CrossRef]
- Hristov AN, Oh J, Giallongo F, Frederick TW, Harper MT, Weeks HL, et al. An inhibitor persistently decreased enteric methane emission from dairy cows with no negative effect on milk production. Proc Natl Acad Sci. 2015 Aug 25;112(34):10663–8. [CrossRef]
- Romanzin A, Degano L, Vicario D, Spanghero M. Feeding efficiency and behavior of young Simmental bulls selected for high growth capacity: Comparison of bulls with high vs. low residual feed intake. Livest Sci. 2021 July;249:104525. [CrossRef]
- Beauchemin KA, Tamayao P, Rosser C, Terry SA, Gruninger R. Understanding variability and repeatability of enteric methane production in feedlot cattle. Front Anim Sci. 2022 Nov 3;3:1029094. [CrossRef]
- Miller GA, Auffret MD, Roehe R, Nisbet H, Martínez-Álvaro M. Different microbial genera drive methane emissions in beef cattle fed with two extreme diets. Front Microbiol. 2023 Apr 13;14:1102400. [CrossRef]
- Løvendahl P, Difford GF, Li B, Chagunda MGG, Huhtanen P, Lidauer MH, et al. Review: Selecting for improved feed efficiency and reduced methane emissions in dairy cattle. Animal. 2018;12:s336–49. [CrossRef]
- Cottle DJ, Eckard RJ. Global beef cattle methane emissions: yield prediction by cluster and meta-analyses. Anim Prod Sci. 2018;58(12):2167. [CrossRef]
- Garnsworthy PC, Saunders N, Goodman JR, Algherair IH, Ambrose JD. Effects of live yeast on milk yield, feed efficiency, methane emissions and fertility of high-yielding dairy cows. animal. 2025 Jan;19(1):101379. [CrossRef]
- Basarab JA, Beauchemin KA, Baron VS, Ominski KH, Guan LL, Miller SP, et al. Reducing GHG emissions through genetic improvement for feed efficiency: effects on economically important traits and enteric methane production. Animal. 2013;7:303–15. [CrossRef]
- Knapp JR, Laur GL, Vadas PA, Weiss WP, Tricarico JM. Invited review: Enteric methane in dairy cattle production: Quantifying the opportunities and impact of reducing emissions. J Dairy Sci. 2014 June;97(6):3231–61. [CrossRef]
- Thompson LR, Rowntree JE. Invited Review: Methane sources, quantification, and mitigation in grazing beef systems. Appl Anim Sci. 2020 Aug;36(4):556–73. [CrossRef]
- Beede DK. What will our ruminants drink? Anim Front. 2012 Apr 1;2(2):36–43. [CrossRef]
- Morales AG, Cockrum RR, Teixeira IAMA, Ferreira G, Hanigan MD. Graduate Student Literature Review: System, plant, and animal factors controlling dietary pasture inclusion and their impact on ration formulation for dairy cows. J Dairy Sci. 2024 Feb;107(2):870–82. [CrossRef]
- Grossi G, Goglio P, Vitali A, Williams AG. Livestock and climate change: impact of livestock on climate and mitigation strategies. Anim Front. 2019 Jan 3;9(1):69–76. [CrossRef]
- Smith PE, Waters SM, Kenny DA, Kirwan SF, Conroy S, Kelly AK. Effect of divergence in residual methane emissions on feed intake and efficiency, growth and carcass performance, and indices of rumen fermentation and methane emissions in finishing beef cattle. J Anim Sci. 2021 Nov 1;99(11):skab275. [CrossRef]
- O’Meara FM, Gardiner GE, O’Doherty JV, Lawlor PG. Effect of water-to-feed ratio on feed disappearance, growth rate, feed efficiency, and carcass traits in growing-finishing pigs. Transl Anim Sci. 2020 Apr 1;4(2):630–40. [CrossRef]
- Leng RA. Interactions between microbial consortia in biofilms: a paradigm shift in rumen microbial ecology and enteric methane mitigation. Anim Prod Sci. 2014;54(5):519. [CrossRef]
- Lan W, Yang C. Ruminal methane production: Associated microorganisms and the potential of applying hydrogen-utilizing bacteria for mitigation. Sci Total Environ. 2019 Mar;654:1270–83. [CrossRef]
- Mwangi FW, Charmley E, Gardiner CP, Malau-Aduli BS, Kinobe RT, Malau-Aduli AEO. Diet and Genetics Influence Beef Cattle Performance and Meat Quality Characteristics. Foods. 2019 Dec 6;8(12):648. [CrossRef]
Table 1.
Feed ingredient composition per 1000 kg total mixed ration (as-fed basis).
| Feed ingredient (kg) | Starter | Grower | Finisher |
| Hominy chop | 630 | 670 | 690 |
| Eragrostis hay | 200 | 180 | 160 |
| Soya oilcake | 80 | 60 | 60 |
| Molasses | 60 | 60 | 60 |
| Limestone | 15.0 | 15.0 | 15.0 |
| Urea | 8.0 | 9.0 | 9.0 |
| Salt | 5.0 | 5.0 | 5.0 |
| Vit/mineral premix | 1.9 | 1.8 | 1.6 |
| Estimated nutrient specifications (%) | |||
| DM | 92.35 | 93.81 | 93.13 |
| TDN | 74.22 | 74.69 | 75.26 |
| NE (MJ/kg) | 6.81 | 6.85 | 6.91 |
| CF | 8.41 | 7.69 | 7.08 |
| CP | 13.72 | 13.39 | 13.51 |
| Ca | 6.98 | 6.86 | 6.79 |
| P | 3.13 | 3.10 | 3.14 |
Table 3.
Overall Pearson correlation matrix of water and feed intake on enteric methane production of beef cattle under intensive production systems.
Table 3.
Overall Pearson correlation matrix of water and feed intake on enteric methane production of beef cattle under intensive production systems.
| Growth phase | Variables | Methane (ppm) |
|---|---|---|
| WI (L) | -0.297NS | |
| Starter | FI (kg) | -0.409 NS |
| WFR | -0.048 NS | |
| WI (L) | -0.474 NS | |
| Grower | FI (kg) | -0.211 NS |
| WFR | -0.175 NS | |
| WI (L) | -0.688* | |
| Finisher | FI (kg) | -0.175 NS |
| WFR | -0.107 NS |
Correlations are significantly different from zero at *p<0.05, NS not significant. WI (L): Water intake in litres, FI (kg): feed intake in kilograms, WFR: water-to-feed ratio in liters per kilogram feed intake.
Disclaimer/Publisher’s Note: The statements, opinions and data contained in all publications are solely those of the individual author(s) and contributor(s) and not of MDPI and/or the editor(s). MDPI and/or the editor(s) disclaim responsibility for any injury to people or property resulting from any ideas, methods, instructions or products referred to in the content. |
© 2025 by the authors. Licensee MDPI, Basel, Switzerland. This article is an open access article distributed under the terms and conditions of the Creative Commons Attribution (CC BY) license (http://creativecommons.org/licenses/by/4.0/).
Copyright: This open access article is published under a Creative Commons CC BY 4.0 license, which permit the free download, distribution, and reuse, provided that the author and preprint are cited in any reuse.


