Submitted:
04 November 2025
Posted:
05 November 2025
You are already at the latest version
Abstract
Narrowband Internet of Things (NB-IoT) is widely used for connecting low-power devices that must operate for years without maintenance. To design reliable systems, it is essential to understand how much energy these devices consume under different conditions and which power sources can support long lifetimes. This study presents a detailed experimental evaluation of NB-IoT power consumption using a commercial System-on-Module (LMT-SoM). We measured various transmissions across different payload sizes, signal strengths, and temperatures. The results show that sending larger packets is far more efficient: a 1280-byte message requires about 7 times less energy per bit than an 80-byte message. However, standby currents varied widely between devices, from 6.7 µA to 23 µA, which has a major impact on battery life. Alongside these experiments, we compared different power sources for a 5-year deployment. Alkaline and lithium-thionyl chloride batteries were the most cost-effective solutions for indoor use, while solar panels combined with supercapacitors provided a sustainable option for outdoor applications. These findings offer practical guidance for engineers and researchers to design NB-IoT devices that balance energy efficiency, cost, and sustainability.
Keywords:
NB-IoT
; system-on-module
; power sources
; power consumption
; power consumption measurements
1. Introduction
Narrowband Internet of Things (NB-IoT) [1] is a cellular communication technology designed for devices that need low power and wide coverage and low data rate. In comparison with Bluetooth Low Energy (BLE) [2], which is an IoT technology as well [3], which has a relatively high data rate, but works at smaller distances, the NB-IoT is focused on long-distance data transmission, hence the application scope drastically differs from BLE and similar low-power IoT devices. The focus on long range communication and energy efficiency made NB-IoT one of the main technologies used in smart cities [4] and buildings [5], agriculture [6], industrial monitoring [7], different emerging edge AI frameworks [8] and use cases [9], and other applications of IoT that require extended range, low cost, and long battery life [10,11,12,13]. These systems often must operate for many years without maintenance, making energy efficiency a key design challenge.
The goal of this work is to experimentally measure the power consumption of a commercial NB-IoT System-on-Module (LMT-SoM [14]) under different environmental and communication conditions, and to evaluate which energy sources can support multi-year autonomous operation. The study combines laboratory measurements, statistical analysis, and energy source feasibility evaluation in one framework. By linking measured data with simple cost and lifetime models, the results provide practical guidance for selecting efficient configurations and power sources for NB-IoT devices.
The rest of the paper is organized as follows:
Section 2 describes state of the art and related works.
Section 3 presents the experimental setup and measurement method, and energy source feasibility evaluations method.
Section 4 summarizes the main results for packet size, temperature, and signal attenuation, and evaluates energy source feasibility and provides a cost analysis for multi-year operation.
Section 5 discusses the results and gives recommendations for designing low-power, cost-effective IoT systems.
2. State of the Art and Related Works
Cellular LPWA technologies were created by the 3rd Generation Partnership Project (3GPP) to meet the needs of IoT and machine-to-machine communications. These technologies aim to provide better coverage, simpler devices, longer battery life, and support many devices at the same time. The main cellular LPWA types are LTE-M, NB-IoT, and EC-GSM-IoT. They were standardized with 3GPP Release 13 [15].
This study concentrates on Narrowband Internet of Things (NB-IoT). This protocol is intended for devices with infrequent data upload requirements (typically multiple minutes), but where a long battery life is required. It uses a narrow 180 kHz channel and can send data up to about 250 kbps. The delay can range from 1.6 to a few seconds. NB-IoT employs orthogonal frequency-division multiplexing (OFDM) for downlink transmission and single-carrier frequency-division multiple access (SC-FDMA) for uplink transmission. In general, this technology works well indoors and saves a lot of battery, making it useful for smart meters and monitoring infrastructure [16].
Several studies have further investigated the energy consumption characteristics of NB-IoT devices under various operational and environmental conditions.
The article ”In-depth Real-World Evaluation of NB-IoT Module Energy Consumption” [17] provides an evaluation of NB-IoT module energy consumption using a custom measurement platform capable of capturing fine-grained current traces and protocol states. The study decomposed the uplink transmission process into distinct phases - synchronization, connection setup, data transfer, and idle waiting, allowing precise energy attribution. The results showed that post-transmission waiting and inactivity timers contribute significantly to total energy use, often dominating the pure transmission cost. The energy per bit decreased with larger payloads (16 - 1024 B), highlighting protocol overhead as a major factor in small-packet inefficiency. Although the work provides valuable insights into real deployment behavior, it focuses solely on NB-IoT and evaluates the feasibility of energy sources.
The article Energy Consumption Analysis of LPWAN Technologies and Lifetime Estimation for IoT Application [18] presents an empirical comparison of LoRaWAN, DASH7, Sigfox, and NB-IoT using measured current traces. The authors report per-technology energy states and derive battery lifetime under uniform test conditions. Results show that protocol overheads and connection procedures drive large energy differences across LPWANs. The work provides measurement-based guidance for selecting LPWAN settings and battery capacity in long-life deployments
The article Energy Consumption Analytical Modeling of NB-IoT Devices for Diverse IoT Applications [19] presents an analytical approach to estimate the energy use and battery lifetime of NB-IoT devices. The model is based on the standard power states of user equipment and includes transmission patterns, coverage levels, and device modes to calculate total consumption. Results show that predicted values stay within about 5% of real measurements, proving that the model can be used for planning and optimization in IoT networks. However, the study assumes fixed network parameters and does not include hybrid power sources or real environmental changes. Compared to this model-based work, our study provides experimental validation using SoM hardware under controlled conditions, linking energy performance with practical power source feasibility.
The paper Dissecting Energy Consumption of NB-IoT Devices Empirically [20] presents a detailed experimental study on NB-IoT energy usage with two commercial modules and multiple network operators. It shows that network configuration, particularly paging interval and inactivity timers, has the largest effect on power consumption, while packet size and signal quality have a limited impact. Using the Release Assistance Indicator (RAI) significantly reduces transmission energy from 0.82J to 0.12J. Most of the device’s lifetime is spent in Power Saving Mode, consuming about 10W. The study concludes that NB-IoT performance is not fully automatic and depends strongly on correct parameter tuning and operator configuration.
3. Materials and Methodology
The paper combines NB-IoT system in controlled laboratory experiments, statistical analysis, lifecycle cost evaluation and comprehensive methodology in one unified framework built upon previous works [3,21,22,23].
The main goal is to describe how energy usage changes with communication settings and environmental conditions. The study evaluates how temperature, signal strength, and packet size affect the total energy budget for NB-IoT transmissions. It also identifies which conditions allow the best energy efficiency and how much of the total energy is used during active transmission and during the low-power standby mode. In addition, the results are used to check which battery or hybrid power options can supply the required energy for several years of operation at the lowest cost.
3.1. Power Source Feasibility Calculation Framework
3.1.1. Required Energy
,where
- Energy required for device to opperate for time []
- Device operation time on single charge []
- average power consumption of a device []
3.1.2. Number of Cells Needed
Given specific energy [] and cell mass :
,where
N Number of cells
cell mass []
energy density of a cell []
Energy required for device (Equation 1) []
3.1.3. Constraint Checks
,where
- cell volume []
- cell mass []
- cell maximum continuous current []
- N number of cells (Equation 2)
3.1.4. Estimated Lifetime (Unconstrained)
,where
- single charge device lifetime estimation
- N number of cells (Equation 2)
- cell mass []
- energy density of a cell []
3.1.5. Boolean Decision
3.2. Experimental Setup
The evaluation of power consumption is a critical aspect in the design of NB-IoT-based systems. Therefore, it is necessary to select an appropriate methodology for measuring current consumption during communication performance testing.
- Shunt ammeter method is best suited for high current range.
- Feedback ammeter method is best suited for low current range.
The shunt ammeter method measures current by detecting the voltage drop across a small-value shunt resistor placed in series with the device under test. It is suitable for measuring higher current levels that occur during active operations such as wireless transmission or sensor activity.
The feedback ammeter method uses an operational amplifier in a feedback configuration to convert very small input currents into a measurable output voltage. It is designed for high sensitivity and is used to accurately capture very low current levels typical of sleep or idle modes in IoT devices.
For this experiment, the shunt ammeter method was chosen to detect SoM current consumption pattern while UDP packet transmission due to high current consumption at the data transmission routine. As a current measurement unit, the JouleScope JS110 was chosen [25]. It samples current and voltage synchronously at 2 MS/s with a 250 kHz bandwidth. Rapid auto-ranging switches shunt resistors in about 1 µs. Shunt resistor values vary from 0.01 to 1111 , which determines the maximum resolution up to 1.5 nA with 32-bits of dynamic range. The voltage range is from -1V to +15V, and the current measurement range is from -1A to 3A.
As the device under the test (DUT) was chosen a commercial System-on-Module LMT-SoM [14]. The DUT is equipped with:
- A low-power mobile module NRF9160 System-in-Package (SiP) with integrated LTE-M/NB-IoT modem [26],
- MFF2 embedded SIM chip,
- 4MB FLASH.
The device is reprogrammable with a software development kit (LMT-SDK), which is working under the Zephyr RTOS.
The experimental setup was designed to characterize the energy consumption of an NB-IoT System on a Module under controlled laboratory conditions. The overall objective was to quantify the energy cost per transmitted UDP packet while varying three key factors: payload size, RF path loss, and operating temperature. To achieve this, the study employed a combination of precision measurement equipment, programmable RF components, and an environmental chamber, allowing repeatable and statistically valid measurements across a wide range of conditions.
The measurement system was assembled using the components listed in Table 1. The device under test was the LMT SoM that supports NB-IoT Cat-NB1/Cat-M1 operation. The module was powered and monitored by the Joulescope JS110 [25], which recorded current and voltage in real time during each transmission. A GPIO/SPI controller managed both the HMC624A digital step attenuator and the data logging process. This ensured synchronization between attenuation changes and power measurements.
The programmable attenuator was used to emulate different radio channel conditions. It could introduce a path loss between 0 and –31.5 dB in fine 0.5 dB steps. RF connections were made using 50 coaxial jumpers for the baseline setup and PTFE coaxial cables for feed-through when the SoM was placed inside the climate chamber. The NB-IoT antenna was positioned outside the chamber in a fixed direction to the base station to keep the link conditions constant.
Temperature control was provided by the climate chamber, which allowed testing from -10 C to +30 C. This setup made it possible to perform repeatable measurements under combined variations of payload size, signal attenuation, and temperature. All conditions were kept stable long enough for accurate data collection and comparison.
The firmware on the SoM was configured to cycle through UDP transmissions of different payload sizes: 80, 160, 320, 640, and 1280 bytes. Each payload configuration was tested across the full attenuation range at different temperatures.
Temperature control was provided by a programmable climate chamber, which cycled through setpoints of –10 C, 0 C, +10 C, +20 C, and +30 C. At each setpoint, sufficient time was allowed for thermal stabilization before commencing measurements. For every attenuation–temperature combination, 150 seconds of continuous data were recorded. Each dataset contained timestamped power traces, the applied attenuation, and chamber temperature.
These results were used to compare how different conditions influence power use and to estimate the expected operating lifetime of the system with various energy sources. By combining the experimental data with a simple cost model, the research design provides practical guidance for developing energy-efficient NB-IoT devices that can operate for several years without battery replacement. Data post-processing was performed offline. Raw traces were downsampled to 200 kS/s to reduce processing complexity while retaining sufficient temporal resolution. Energy per packet was then extracted by aligning transmission bursts with logged metadata. To quantify the role of different parameters, statistical analysis was applied. Analysis of variance (ANOVA) [27] was used to evaluate the relative significance of payload size, attenuation, and temperature. Also, the following radio-quality metadata were logged for every current trace:
- Reference Signal Received Power(RSRP) — the average received power of downlink reference signals from the serving cell, in dBm.
- Reference Signal Received Quality (RSRQ) — a quality metric that combines RSRP with wideband received signal strength (RSSI), in dB.
- Signal to Noise Ratio (SNR) — The ratio between useful signal and noise on the downlink, in dB.
These metrics were logged alongside each trace to identify and filter out anomalous runs caused by network variability.
The measured data are going to be interpreted as:
- Energy per packet, J
- Energy per bit, J/bit
- Idle current in Power Saving Mode (PSM), µA
- Total energy consumption over time, J
3.3. Energy Source Evaluation
Paralel with the measurements of NB-IoT power consumption, a separate evaluation was carried out to study different energy sources and their suitability for long-term IoT devices. The goal was to identify which power options can support autonomous operation for at least five years and remain both technically reliable and economically practical. The evaluation included primary batteries, rechargeable batteries, and hybrid systems that combine batteries with solar energy harvesting.
The analysis started by estimating the total energy required for a typical NB-IoT node. This was done using the measured data from the experiments, which included the average transmission energy per packet, the idle current in Power Saving Mode, and the observed variation between devices. A five-year lifetime was used as the reference, since battery replacement in many industrial and urban applications is expensive or not feasible. Each energy source was then compared in three ways.
- Technical suitability
- Physical constraints
- Economic feasibility
Technical suitability was evaluated by comparing the calculated energy demand with the rated capacity of different technologies such as alkaline [28], lithium-thionyl chloride (Li-SOCl) [29,30,31], lithium-ion (Li-ion) [32], zinc-air [33], supercapacitors [31,34], and photovoltaic systems. This step also considered self-discharge, temperature limits, and the ability to provide low idle currents for long periods. Physical constraints were evaluated by checking the size and weight of the energy source to ensure it can fit into a compact sensor device. Economic feasibility was evaluated by estimating the total cost of ownership over five years, including initial price and possible replacements.
For all comparisons, the total required energy for one device was calculated as
where:
- is the average transmission energy per packet,
- is the standby energy during one communication cycle,
- is the number of hourly transmissions over five years.
The factor of 1.5 provides a 50% safety margin for environmental changes, component tolerances, and battery aging. This value resulted in a total energy demand of about 1.586 Wh for the reference device transmitting one 1 kB packet every hour.
Each battery technology was then checked to see if it can provide this energy without replacement. Nominal energy capacity, self-discharge rate, and operational temperature range were used from manufacturer datasheets. For rechargeable technologies such as Li-ion, capacity reduction with cycle aging was taken into account. Hybrid solar systems were analyzed using daily irradiance data and efficiency assumptions for small photovoltaic panels and supercapacitor storage.
For the economic evaluation, the total cost of ownership was calculated as
where:
- is the number of battery cells required to meet the energy demand,
- is the cost per cell,
- is the estimated service cost for replacement.
- is the number of replacements
If the calculated capacity was sufficient for five years, . For sources with shorter lifetimes, such as Li-ion or Zn-Air batteries, multiple replacements were assumed, and both material and service costs were included.
Physical feasibility was evaluated by comparing the total volume and mass of each power option against a maximum allowed size of 100 cm3 and a total mass of 150 g, which are typical for compact IoT sensor enclosures. Technologies exceeding these limits were marked as impractical for small devices.
By combining these technical, physical, and economic evaluations, the method allows fair comparison of different energy sources under the same operational profile. This provides a practical framework for selecting the most suitable power supply option for NB-IoT nodes that must work autonomously for several years.
4. Results
This section reports energy measurements for the NB-IoT SoM under the realistic duty cycles. Power Saving Mode (PSM) dominates the total energy when the transmission interval is on the order of hours. At 3.6V, the idle current in PSM varies across units between 6.7 µA and 23.1 µA. For a device that sends one 1280-bit packet per hour, PSM accounts for >99% of the 5-year energy budget. After this overview, we present transmission energy versus payload, and then analyze how standby variation drives the overall battery requirements.
4.1. Packet Size Impact
The influence of packet size on energy consumption was evaluated using 1,683 UDP transmissions with payloads of 80 B, 160 B, 320 B, 640 B, and 1280 B. Figure 1 shows the average energy per packet for each payload size; larger packets require more total energy per transmission, but the increase doesn’t have a one-to-one proportion to the payload size. For example, the smallest packet consumed on average 39.5 µJ, while the largest required 78.7 µJ, which is only about twice as much energy despite being 16 times larger.
To compare efficiency, the energy data was normalised to the number of transmitted bits. The results in` Figure 2 show a strong decrease in energy per bit as the payload increases. The mean value dropped from 480 nJ/bit for the 80-bit payload to 61.2 nJ/bit for the 1280-bit payload. So, efficiency increased approximately 7.6 times.
This trend is consistent across all measurements, with smaller packets exhibiting higher variation due to the larger impact of NB-IoT protocol overhead.
These results show that a large part of the NB-IoT transmission energy is used by fixed protocol actions such as synchronization and control signaling. When the packet is small, this fixed part takes most of the total energy, which makes the energy cost per bit high. For larger packets, the same overhead is shared between more data bits, so the energy per bit becomes much lower. This means that sending fewer, but larger packets can save energy and increase device lifetime without any change in hardware design. Figure 2 can be used by developers to make an educated decision about the compromise between the data reporting frequency and battery lifespan.
4.1.1. Temperature Impact
Temperature tests were performed in the range from –10 C to +30C using a climate chamber. The module was allowed to stabilize at each temperature before measurement. Figure 3 presents the measured energy per packet for the temperature sweep. The results show that temperature in this range has only a small effect on NB-IoT power consumption. The variation of energy per packet is within the measurement uncertainty, and the average PSM current also stays constant.
The stability of the energy data indicates that the tested SoM and its radio subsystem are not sensitive to normal ambient temperature changes. This means that NB-IoT devices can operate reliably in typical indoor and outdoor environments without the need for temperature compensation in the energy model.
4.2. Environmental Factors
Environmental conditions such as signal attenuation and temperature have a strong influence on the operation and energy use of NB-IoT devices. To study these effects, the SoM module was tested under controlled laboratory conditions using a programmable attenuator and a climate chamber.
4.2.1. Signal Attenuation
As seen on the Figure 4, the reliable data transmition were achieved only starting from -23dB. During data transmission at additional channel attenuations from -31dB to -23dB, the DUT were continuously seeking for the connection with the base station, and packet transmission was unstable or wasn’t detectable at all.
4.3. Energy Source Feasibility
The measured energy consumption data were used to estimate the total power needs of a typical NB-IoT device and to check which energy sources can support five years of operation. The estimation included both transmission and standby energy. For a use case with one 1kB packet sent every hour, the total energy demand was calculated as 1.586 Wh, including a 50% safety margin. Most of this energy is consumed in Power Saving Mode (PSM), while only a small part is used for transmission.
Five power source technologies were evaluated: Alkaline AA, Li-SOCl, Li-ion 18650, Zn-Air 675, and a Solar+Supercapacitor hybrid. Each source was checked for energy capacity, weight, volume, and total cost over a five-year period. The limits for integration were set to a maximum mass of 150 g and a maximum volume of 100 cm3.
Data for energy capacity, weight, volume, and unit cost were collected for the year 2024 (European market) and are combined in Table 2 as single power cells or in cell packs that would exceed or at least reach the minimum voltage level for the system.
Taking into account data from Table 2 and assuming that the technician cost per maintenance visit would cost about 45 EUR, the Power source maintenance cost analysis results are presented in Table 3
Combining information from Table 2 and Table 3 and the feasibility analysis described before the final results are obtained and presented in Table 4.
The results in Table 4 show that Alkaline and Li-SOCl batteries meet both energy and cost requirements. Alkaline AA cells provide the lowest price and are suitable for stationary indoor devices, as well as for outdoor solutions with proper IP rating. Li-SOCl cells have higher energy density and work well in low-temperature or industrial conditions. Rechargeable Li-ion batteries are not cost-effective for long lifetime applications because of capacity fading and the need for replacement. Zn-Air batteries also do not meet lifetime targets due to short service life after activation.
Li-ion and Zn-Air options are not recommended for five-year maintenance-free operation. These findings confirm that power source selection must consider both technical performance and total ownership cost for each IoT use case.
5. Discussion and Conclusions
Payload size has a strong effect on energy efficiency, as expected and this study provides precise data on the ratio between payload size and energy consumption for developers to make an educated choice when selecting data transmission frequencies. Each uplink has an overhead from control signaling and radio setup that does not depend on the payload. In our setup, this overhead was constant, with minimal margin of error, across payload sizes. Therefore, energy per bit decreases as payload increases. In our measurements, the mean energy per packet rose from 39.5 µJ at 80 B to 78.7 µJ at 1280 B, which is a sub-linear increase relative to payload size.
Temperature from -10 C to +30 C shows little effect on per-packet energy and Power saving mod current consumption in this range also shows little change.
Coverage affects total energy over time, as a weak signal causes more access retries and access failures. Retries raise total energy consumption even when the energy of one successful packet is similar. When the link is established, a packet needs nearly the same energy across the measured attenuation steps.
Over multi-year duty cycles, idle time dominates the energy budget, as measured Power saving mode current consumption differs between units from 6.7 µA to 23.1 µA at 3.6 V. Low standby current and reliable entry into Power saving mode after each uplink are critical for long battery life.
The study is limited by the usage of single module family and operator setup tested in a laboratory environment and prices reflect the EU market in year 2024.
These findings give a clear path from current traces to configuration and energy source choices for long-life NB-IoT deployments.
Author Contributions
Conceptualization, D.O. and J.J.; methodology, J.O.; validation, D.O., V.S. and J.J.; formal analysis, D.O. and V.S.; investigation, V.M.; resources, D.O., V.M. and J.O.; data curation, V.M. and J.O.; writing—original draft preparation, V.M.; writing—review and editing, D.O., V.S. and J.J.; visualization, J.O.; supervision, J.J.; project administration, J.J.; funding acquisition, D.O. All authors have read and agreed to the published version of the manuscript.
Funding
The present research has been conducted by Latvijas Mobilais Telefons SIA with the financial support from the Recovery and Resilience Facility (Project No. 5.1.1.2.i.0/2/24/A/CFLA/006), within the framework of the project of the Competence Center of Electrical and Optical Equipment Production Sector of Latvia.
Acknowledgments
During the preparation of this manuscript, the author(s) used Grammarly for the purposes of English language editing and spell checking. The authors have reviewed and edited the output and take full responsibility for the content of this publication.
Conflicts of Interest
The authors declare no conflicts of interest.
References
- Bali, M.S.; Gupta, K.; Bali, K.K.; Singh, P.K. Towards energy efficient NB-IoT: A survey on evaluating its suitability for smart applications. Materials Today: Proceedings 2022, 49, 3227–3234. [Google Scholar]
- Koulouras, G.; Katsoulis, S.; Zantalis, F. Evolution of Bluetooth Technology: BLE in the IoT Ecosystem. Sensors (Basel, Switzerland) 2025, 25, 996. [Google Scholar] [CrossRef] [PubMed]
- Ancans, A.; Ormanis, J.; Cacurs, R.; Greitans, M.; Saoutieff, E.; Faucorr, A.; Boisseau, S. Bluetooth low energy throughput in densely deployed radio environment. In Proceedings of the 2019 23rd International Conference Electronics. IEEE; 2019; pp. 1–5. [Google Scholar]
- Yaqoob, I.; Salah, K.; Jayaraman, R.; Omar, M. Metaverse applications in smart cities: Enabling technologies, opportunities, challenges, and future directions. Internet of Things 2023, 23, 100884. [Google Scholar] [CrossRef]
- Lavrinovica, I.; Judvaitis, J.; Laksis, D.; Skromule, M.; Ozols, K. A Comprehensive Review of Sensor-Based Smart Building Monitoring and Data Gathering Techniques. Applied Sciences 2024, 14, 10057. [Google Scholar] [CrossRef]
- Zabasta, A.; Kunicina, N.; Vitols, K.; Duritis, I.; Grunde, U.; Judvaitis, J.; Greitans, M.; Sematovica, I.; Malniece, A.; Galkins, I. Low-power wireless sensor network system for early diagnostic of subacute rumen acidosis in cows. In Proceedings of the 2019 IEEE 7th IEEE Workshop on Advances in Information, Electronic and Electrical Engineering (AIEEE). IEEE; 2019; pp. 1–6. [Google Scholar]
- Deniša, M.; Ude, A.; Simonič, M.; Kaarlela, T.; Pitkäaho, T.; Pieskä, S.; Arents, J.; Judvaitis, J.; Ozols, K.; Raj, L.; et al. Technology modules providing solutions for agile manufacturing. Machines 2023, 11, 877. [Google Scholar] [CrossRef]
- Judvaitis, J.; Balass, R.; Greitans, M. Mobile iot-edge-cloud continuum based and devops enabled software framework. Journal of Sensor and Actuator Networks 2021, 10, 62. [Google Scholar] [CrossRef]
- Vermesan, O.; Walde, K.V.; Bahr, R.; Conrady, C.; Judvaitis, J.; Gaigals, G.; Karlsen, T.; Coppola, M.; Sand, H.E. Edge AI LoRa Mesh Technologies. In Advancing Edge Artificial Intelligence; River Publishers, 2024; pp. 1–42.
- Muteba, K.; Djouani, K.; Olwal, T. 5G NB-IoT: Design, considerations, solutions and challenges. Procedia Computer Science 2022, 198, 86–93. [Google Scholar] [CrossRef]
- Salmins, A.; Judvaitis, J.; Balass, R.; Nesenbergs, K. Mobile wireless sensor network TestBed. In Proceedings of the 2017 25th Telecommunication Forum (TELFOR). IEEE; 2017; pp. 1–4. [Google Scholar]
- Ratasuk, R.; Vejlgaard, B.; Mangalvedhe, N.; Ghosh, A. NB-IoT system for M2M communication. In Proceedings of the 2016 IEEE wireless communications and networking conference. IEEE; 2016; pp. 1–5. [Google Scholar]
- Minoli, D.; Sohraby, K.; Occhiogrosso, B. IoT Considerations, Requirements, and Architectures for Smart Buildings—Energy Optimization and Next-Generation Building Management Systems. IEEE Internet of Things Journal 2017, 4, 269–283. [Google Scholar] [CrossRef]
- Certified Cellular IoT Solution | IoT Shortcut by LMT IoT. https://www.lmt-iot.com/.
- 3GPP. 3GPP Low Power Wide Area Technologies, 2016. Accessed: 2025-06-30.
- GSMA. NB-IoT Deployment Guide to Basic Feature Set Requirements. https://www.gsma.com/iot/wp-content/uploads/2019/07/201906-GSMA-NB-IoT-Deployment-Guide-v3.pdf, 2019.
- Lukic, M.; Sobot, S.; Mezei, I.; Vukobratovic, D.; Danilovic, D. In-depth Real-World Evaluation of NB-IoT Module Energy Consumption. In Proceedings of the 2020 IEEE International Conference on Smart Internet of Things (SmartIoT); 2020; pp. 261–265. [Google Scholar] [CrossRef]
- Singh, R.K.; Puluckul, P.P.; Berkvens, R.; Weyn, M. Energy Consumption Analysis of LPWAN Technologies and Lifetime Estimation for IoT Application. Sensors 2020, 20. [Google Scholar] [CrossRef] [PubMed]
- García-Martín, J.P.; Torralba, A. Energy consumption analytical modeling of NB-IoT devices for diverse IoT applications. Computer Networks 2023, 232, 109855. [Google Scholar] [CrossRef]
- Michelinakis, F.; Al-Selwi, A.S.; Capuzzo, M.; Zanella, A.; Mahmood, K.; Elmokashfi, A. Dissecting Energy Consumption of NB-IoT Devices Empirically. IEEE Internet of Things Journal 2021, 8, 1224–1242. [Google Scholar] [CrossRef]
- Ormanis, J.; Medvedevs, V.; Abolins, V.; Gaigals, G.; Elsts, A. Signal Loss in Body Coupled Communication: Guide for Accurate Measurements. In Proceedings of the 2022 Workshop on Benchmarking Cyber-Physical Systems and Internet of Things (CPS-IoTBench); 2022. [Google Scholar]
- Balass, R.; Medvedevs, V.; Mackus, A.I.; Ormanis, J.; Ancans, A.; Judvaitis, J. Precise realtime current consumption measurement in IoT TestBed. Open Research Europe 2024, 3. [Google Scholar] [CrossRef] [PubMed]
- Lapsa, D.; Balass, R.; Judvaitis, J.; Nesenbergs, K. Measurement of current consumption in a wireless sensor network TestBed. In Proceedings of the 2017 25th Telecommunication Forum (TELFOR); 2017; pp. 1–4. [Google Scholar] [CrossRef]
- Tehrani, Y.H.; Atarodi, S.M. Design & implementation of a high precision & high dynamic range power consumption measurement system for smart energy IoT applications. Measurement 2019, 146, 458–466. [Google Scholar] [CrossRef]
- Jetperch LLC, Olney, MD, USA. Joulescope JS110 User’s Guide, revision 1.3 ed., 2023. Last revised 2023-10-03.
- Nordic Semiconductor. nRF9160 System-in-Package. https://www.nordicsemi.com/Products/nRF9160, 2025. Accessed: 2025-06-18.
- St, L.; Wold, S.; et al. Analysis of variance (ANOVA). Chemometrics and intelligent laboratory systems 1989, 6, 259–272. [Google Scholar]
- Battery University. BU-104: Comparing Lithium-Based Batteries 2023. Accessed 20 May 2025. 20 May.
- Tadiran Batteries. Lithium Thionyl Chloride Batteries, 2024. Accessed: 2025-05-20.
- Saft Groupe, SA. LS33600 Lithium–Thionyl Chloride D-Cell Technical Data Sheet. Saft Batteries, Bagnolet, France, 2019. Revision H.
- Tadiran Batteries GmbH. PulsesPlus® Series High-Power Long-Life Lithium Batteries 2024. Product catalogue.
- IEC TC21/TC105. Safety and Performance Standards for Lithium-Ion Batteries. Technical Report IEC 62133-2, International Electrotechnical Commission, 2023.
- Zhang, J.; Wang, Y.; Zhao, Y.; Liu, X. Recent Progress in Rechargeable Zinc–Air Batteries. Energy & Environmental Science 2022, 15, 728–771. [Google Scholar]
- Panasonic Industry, Co. . Gold Capacitor Technical Guide, 2023.
Figure 1.
energy vs packet size.
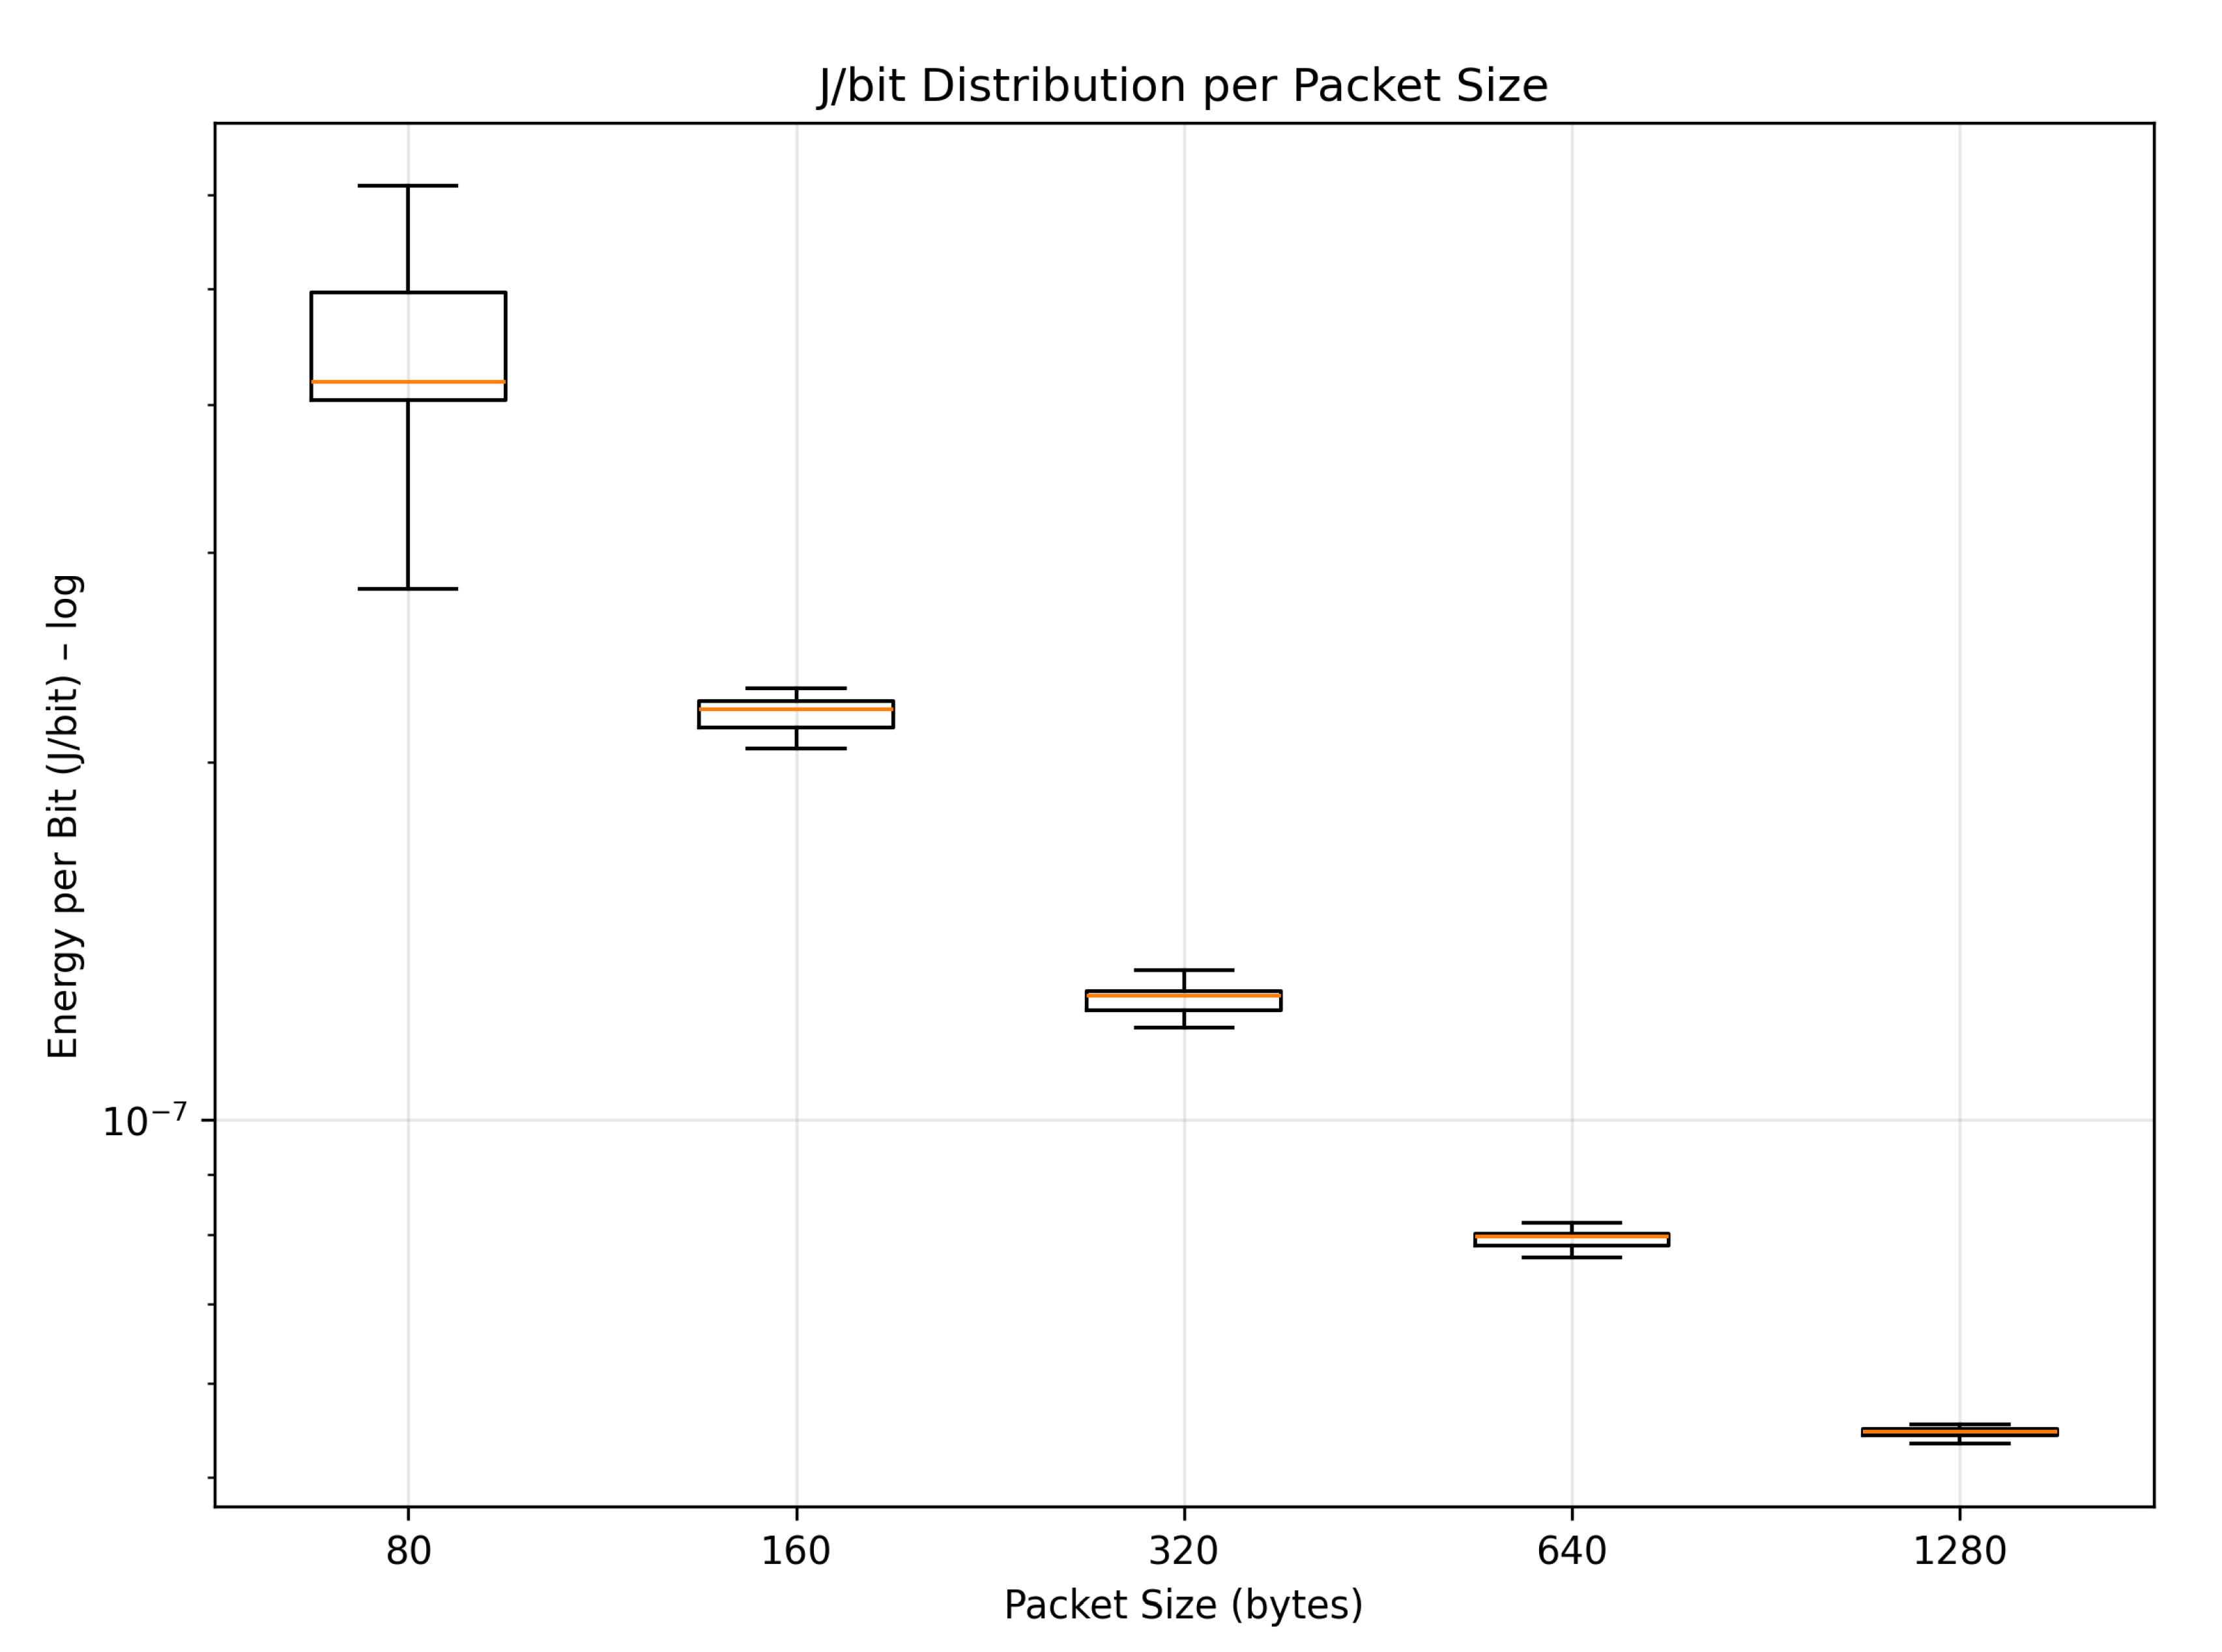
Figure 2.
Energy per bit.
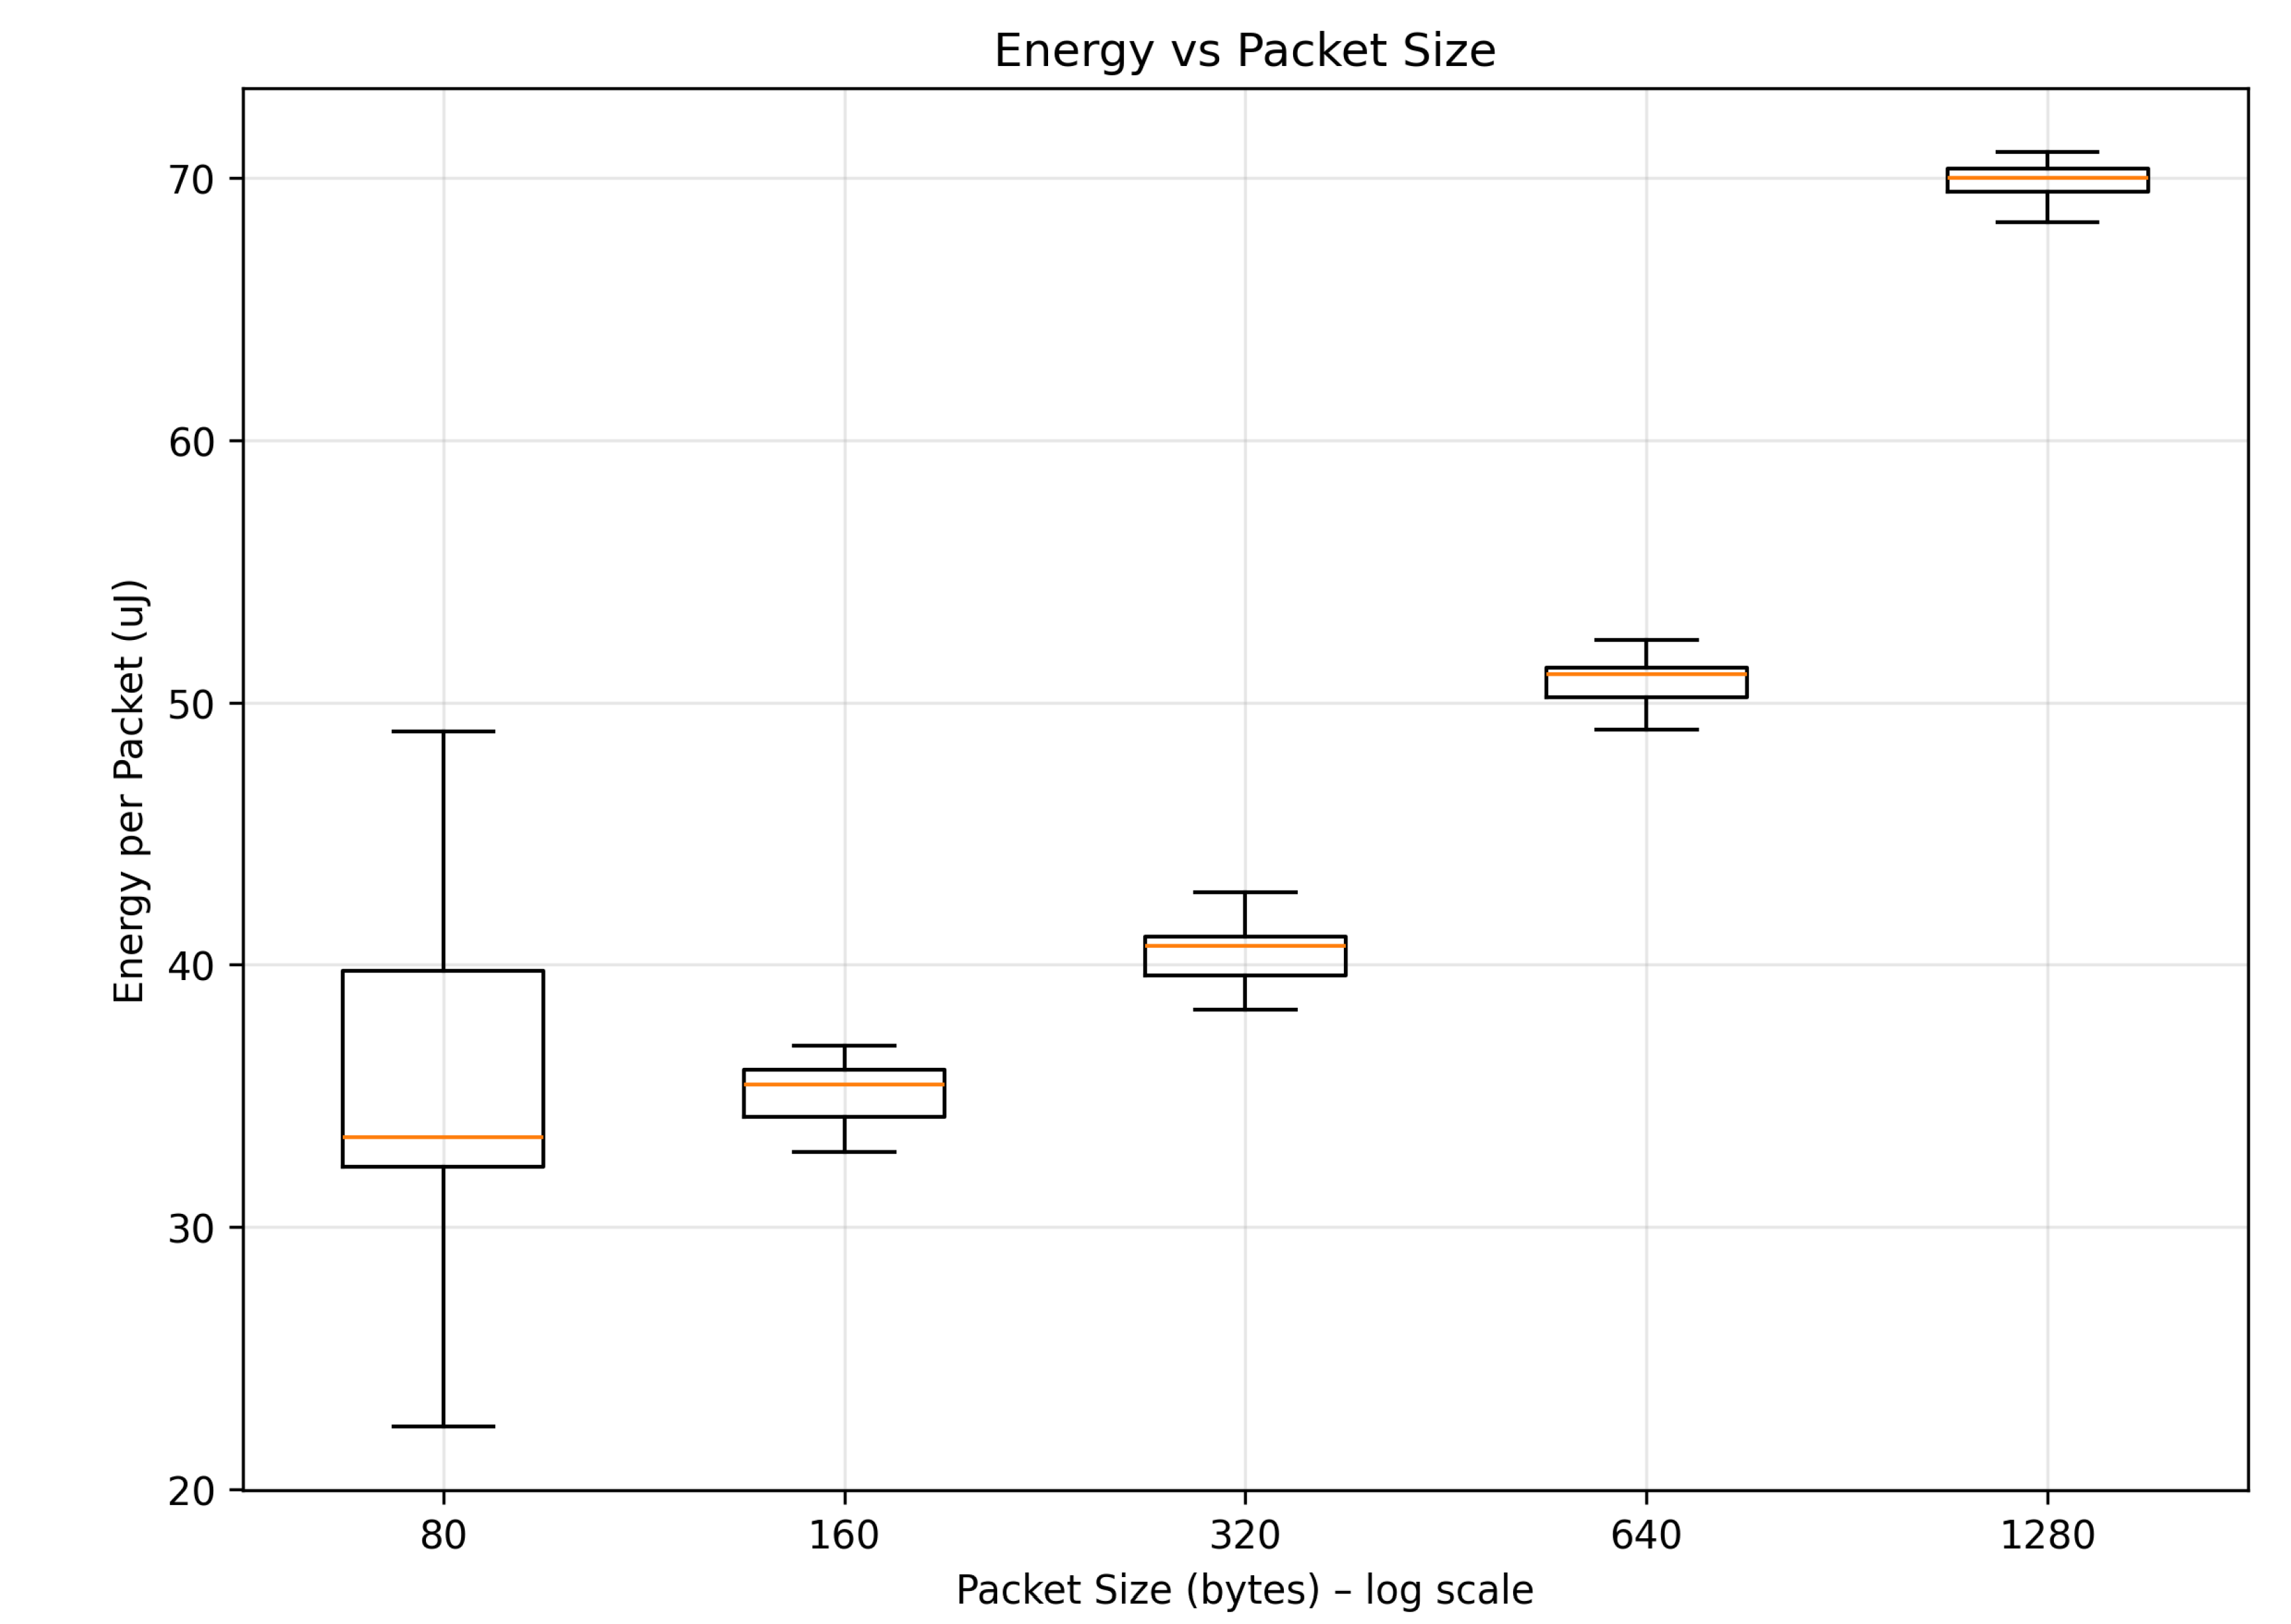
Figure 3.
Energy consumption versus operating temperature analysis. The scatter plot shows the relationship between ambient temperature and transmission energy requirements, indicating temperature-independent performance characteristics of the LMT-SoM device.
Figure 3.
Energy consumption versus operating temperature analysis. The scatter plot shows the relationship between ambient temperature and transmission energy requirements, indicating temperature-independent performance characteristics of the LMT-SoM device.
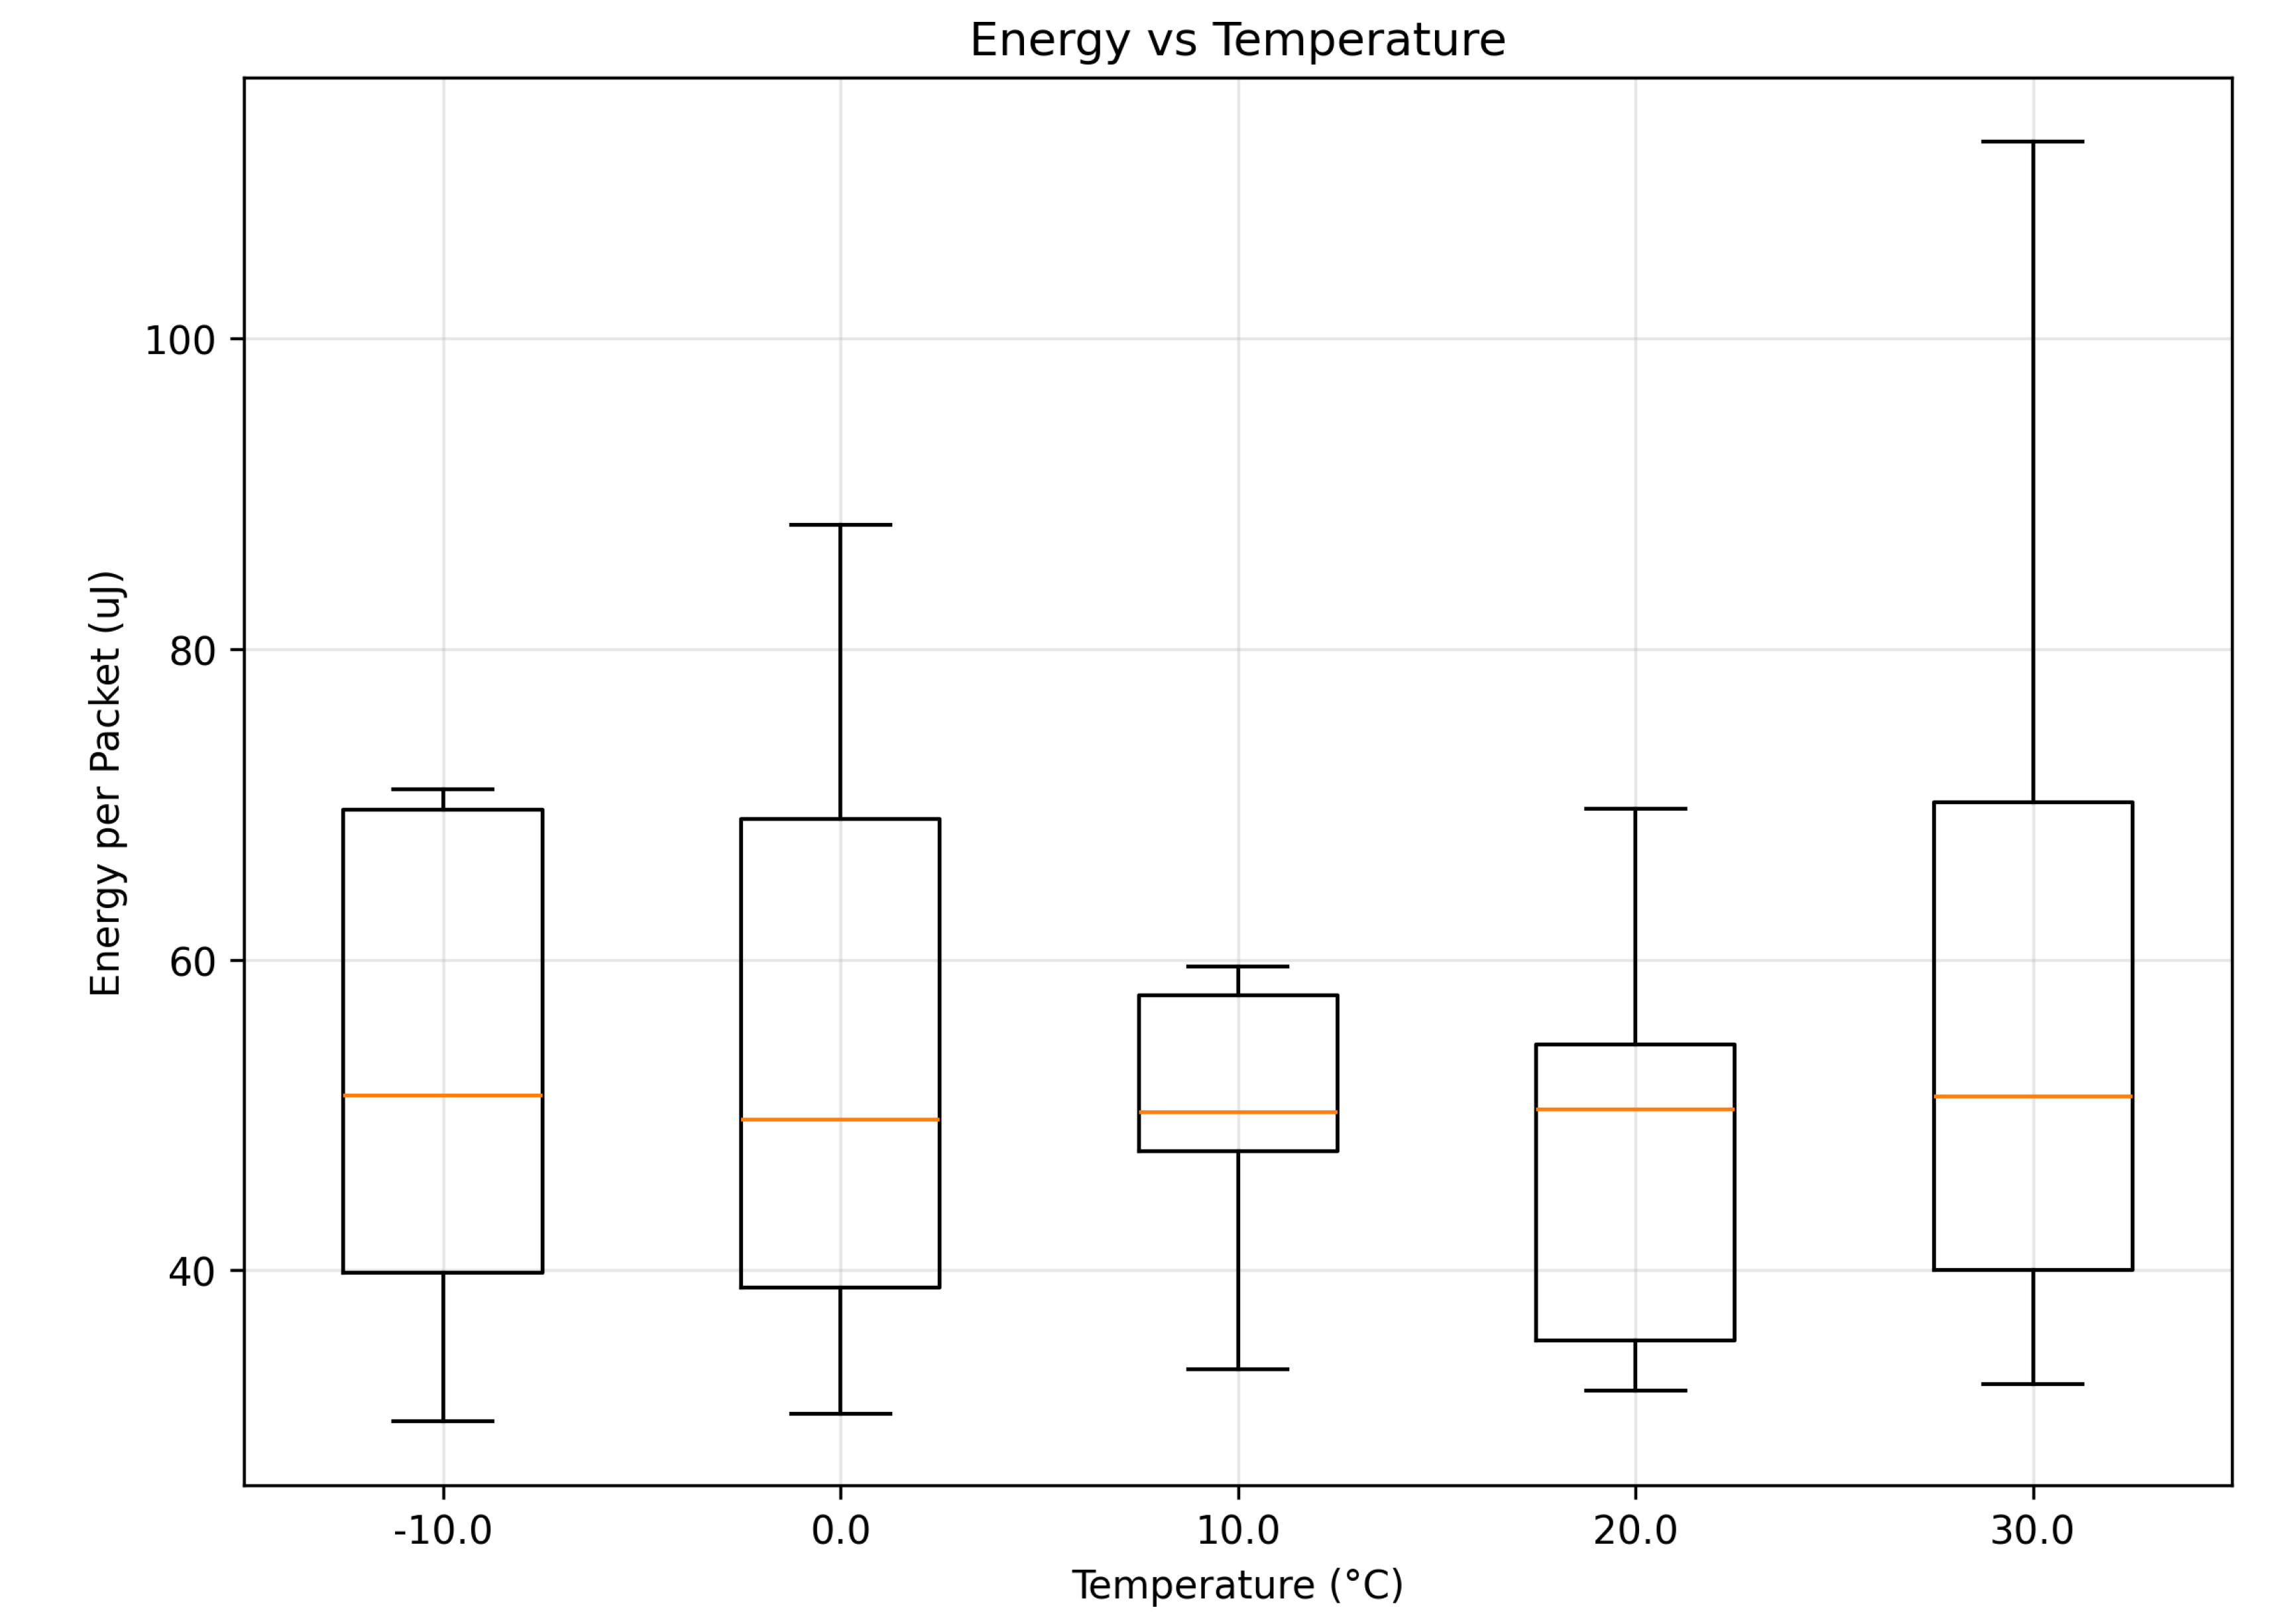
Figure 4.
Impact of channel attenuation on power consumption for different packet sizes. The analysis covers the full test range from 0 dB to -31 dB attenuation in 0.5 dB steps.
Figure 4.
Impact of channel attenuation on power consumption for different packet sizes. The analysis covers the full test range from 0 dB to -31 dB attenuation in 0.5 dB steps.
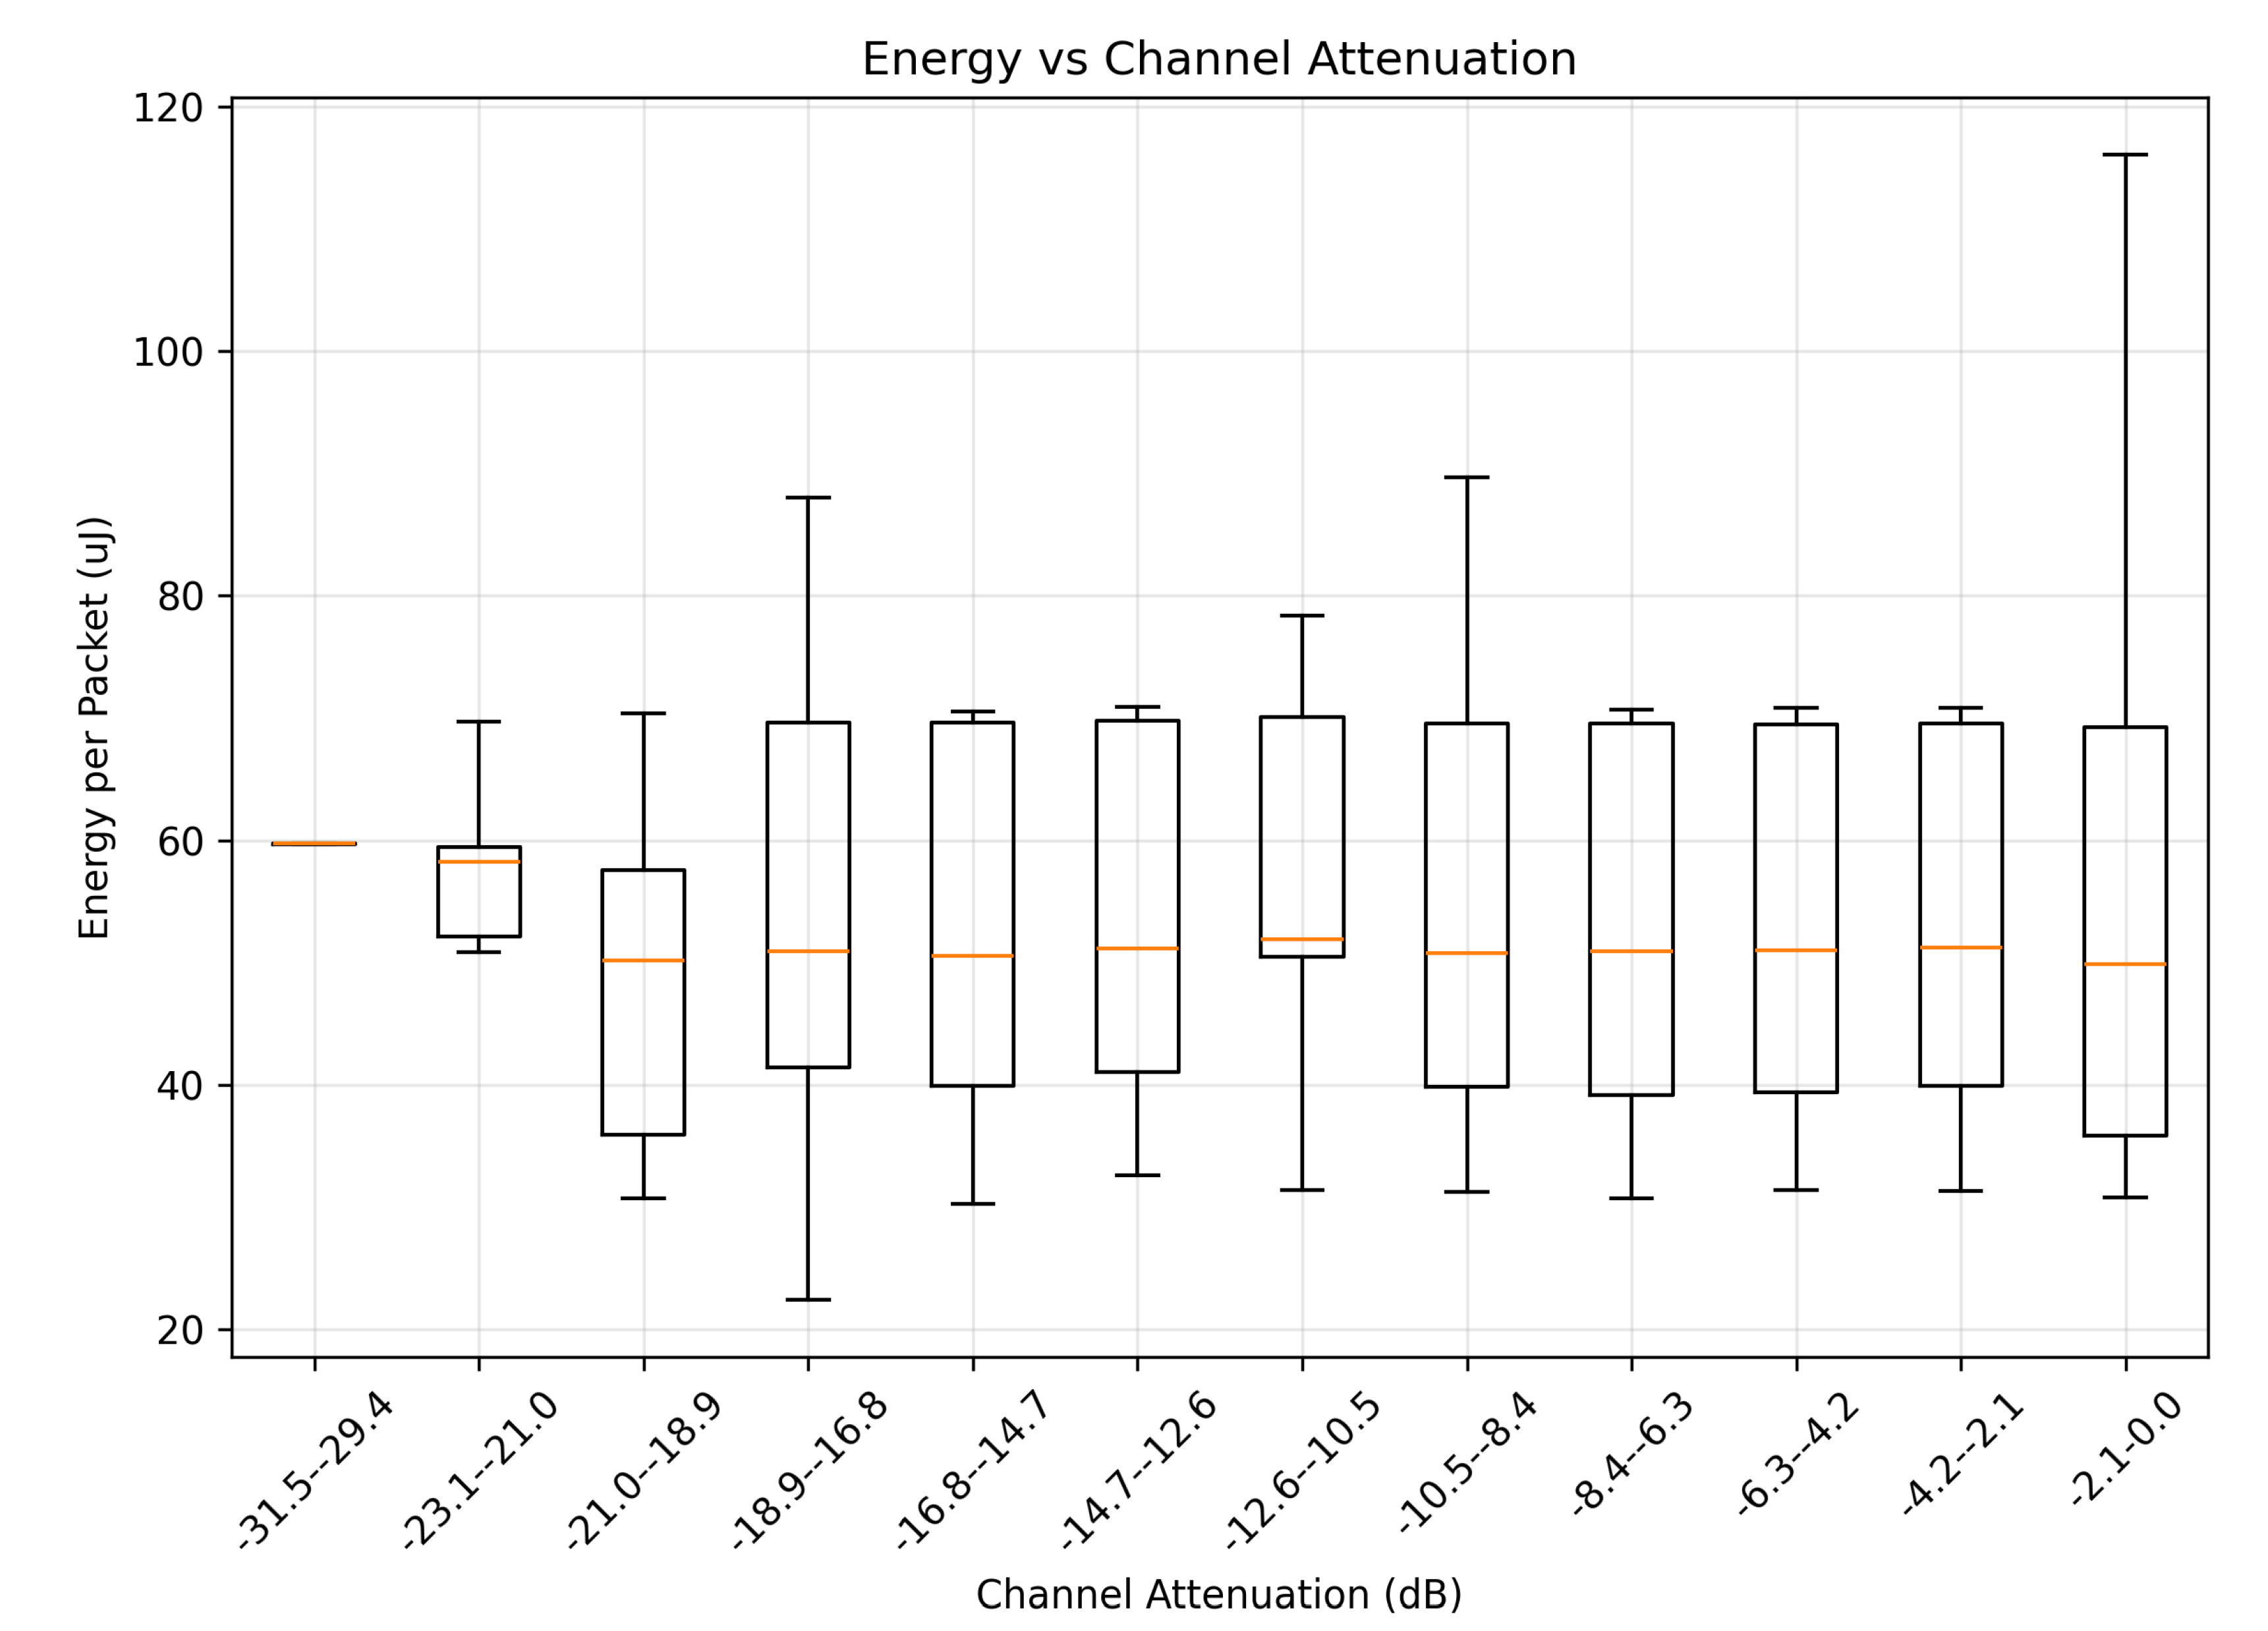

Table 1.
Hardware used in the measurement campaigns.
| Component | Purpose | Notes |
|---|---|---|
| LMT-SoM | Device-under-test | 3.3 V rail, NB-IoT Cat-NB1/Cat-M1 stack |
| HMC624A 6-bit digital step attenuator | Programmable path loss | 0–31.5 dB in 0.5 dB steps; kept at ambient temperature outside the chamber |
| 50 UFL coax jumpers | RF interconnect | < 10 cm for baseline; 1 m PTFE for chamber feed-through ; 5m to get antenna through the window |
| NB-IoT antenna | Over-the-air link | Mounted outside chamber; fixed orientation |
| JouleScope | Current & voltage logging | — |
| GPIO/SPI controller | Attenuator programming | LatePanda for automation and logging |
| Climate chamber | Temperature stimulus | — |
Table 2.
Comparison of Power Sources.
| Power Source | Capacity | Mass | Volume | Cost | Rechargeable | Notes |
|---|---|---|---|---|---|---|
| (Wh) | (g) | (cm) | (EUR) | |||
| Li-SOCl2 (LS33600) | 61.2 | 90 | 62 | 28.50 | No | 17Ah @ 3.6V |
| Li-ion 18650 | 12.95 | 48 | 16.5 | 8.50 | Yes | 500 cycles |
| Alkaline AA (3-pack) | 13.5 | 69 | 24.3 | 3.60 | No | 3 × 4.5Wh |
| Zn-Air 675 (3-pack) | 2.73 | 6.9 | 1.95 | 2.55 | No | 4 weeks open |
Table 3.
Power source maintenance cost analysis results for 5-year autonomous operation.
| Power Source | Initial Cost | Replacement Cost | Maintanence Cost | Total Cost (EUR) |
|---|---|---|---|---|
| Alkaline AA | 3.60 | 0.00 | 0.00 | 3.60 |
| Li-SOCl | 28.50 | 0.00 | 0.00 | 28.50 |
| Solar | 76.29 | 0.00 | 0.00 | 76.29 |
| Li-ion 18650 | 8.50 | 25.50 | 273.00 | 307.00 |
| Zn-Air 675 | 2.55 | 163.20 | 5824.00 | 5,989.75 |
Table 4.
Power source feasibility analysis results for 5-year autonomous operation.
| Power Source | Feasible | Mass (g) | Volume (cm³) | Replacements | Total Cost (EUR) |
|---|---|---|---|---|---|
| Alkaline AA | Yes | 69 | 24 | 0 | 3.60 |
| Li-SOCl | Yes | 90 | 62 | 0 | 28.50 |
| Solar | Yes | — | — | 0 | 76.29 |
| Li-ion 18650 | Yes | 48 | 17 | 3 | 307.00 |
| Zn-Air 675 | No | 7 | 2 | 64 | 5,989.75 |
Disclaimer/Publisher’s Note: The statements, opinions and data contained in all publications are solely those of the individual author(s) and contributor(s) and not of MDPI and/or the editor(s). MDPI and/or the editor(s) disclaim responsibility for any injury to people or property resulting from any ideas, methods, instructions or products referred to in the content. |
© 2025 by the authors. Licensee MDPI, Basel, Switzerland. This article is an open access article distributed under the terms and conditions of the Creative Commons Attribution (CC BY) license (http://creativecommons.org/licenses/by/4.0/).
Copyright: This open access article is published under a Creative Commons CC BY 4.0 license, which permit the free download, distribution, and reuse, provided that the author and preprint are cited in any reuse.


