
Submitted:
03 November 2025
Posted:
03 November 2025
You are already at the latest version
Abstract
Background/Objectives: Stress is a pervasive modern challenge that contributes to se-rious health problems and affects a significant proportion of the population. This study examines the effectiveness of a lifestyle intervention called Individual Health Man-agement (IHM) with a blended learning approach in reducing stress, as a possible so-lution to this problem. Methods: Participants experiencing stress were enrolled in a monocentric randomised controlled trial. The intervention group received the IHM programme and was moni-tored for 12 months. After six months, a primary comparison was conducted with a waitlist control group, who then also received the intervention. Additional crossover analyses were employed. The main outcome measure was the change in subjective stress (Perceived Stress Questionnaire, PSQ) from baseline after six months. Secondary outcomes included further stress- and mental load-related parameters. Results: The intervention group achieved normal stress levels, with a 41% reduction, while the control group experienced a 9% reduction. The adjusted mean difference on the PSQ between groups was -21.02 points (95% CI: -27.34, -14.70), accounting for base-line values and gender. Secondary outcomes also improved significantly. Conclusions: The IHM has multiple moderate to strong effects on mental health, re-sulting in clinically normal distress scores that can persist for up to one year.
Keywords:
Intensive Lifestyle Intervention (ILI)
; Traditional Chinese Medicine (TCM)
; Individual Health Management (IHM)
; perceived stress
; TALENT-II study
1. Introduction
Mental health is a key factor in the success of both individuals and society. The growing incidence of mental health issues, including anxiety and depression, puts a strain on healthcare systems and diminishes individuals' quality of life. This results in an increased demand for care and a greater disease burden [1]. It is therefore important to provide targeted support to improve mental health and quality of life.
Psychological distress is characterised by symptoms of stress, anxiety, and depression. These symptoms often occur together and are associated with an increased risk of cardiovascular disease, mental health disorders and premature death [2,3]. Experiencing distress has also been linked to negative outcomes such as neglecting physical exercise, increased alcohol consumption and smoking, disrupted sleep patterns, and adopting an unhealthy diet [4]. This is why there is growing academic and clinical interest in the relationship between 'lifestyle factors' and mental health and psychological well-being.
Physicians and other healthcare providers should be able to care for their patients — and themselves — by not only treating cases of acute or chronic illness, but also by implementing strategies to prevent mental and physical disorders. This type of intervention, also known as 'lifestyle medicine', is healthier, more cost-effective and can be performed by more people [5]. Numerous experts have developed health programmes to promote healthy behaviours, and health policy initiatives now call for lifestyle behaviours to be addressed. Further research into efficacy and implementation is necessary to develop innovative and successful programmes for lifestyle-based interventions, where other evidence-based therapies can be incorporated.
For this reason, the clinical effectiveness of a tailored lifestyle self-management intervention called the Individual Health Management (IHM) programme will be tested in relation to stress reduction. This has already been described in detail elsewhere [6-9]. The IHM is based on salutogenesis and the health-illness continuum theory. It aims to strengthen self-determination, self-competence, and personal responsibility for health and illness in individuals who are both 'healthy' and 'unhealthy'. The programme addresses psycho-cognitive, physical and social factors equally, promoting self-efficacy. Self-management is a central element of the IHM programme, enabling individuals to maintain and optimise their basic physiological functions (e.g. exercise, nutrition, breathing, sleep, and heat balance), as well as their psychosocial and cognitive abilities (e.g. emotional self-regulation and social competence), in their daily lives. The IHM helps individuals sustainably increase, maintain or restore their quality of life and life satisfaction by promoting a healthy lifestyle [8,9]. This is achieved via a blended learning programme lasting at least 12 months, combining modern e-health technologies with personal support in the form of health coaching, health days, remote support and medical advice and treatment if necessary. As a local pilot project, the study is supported by AOK Bayern (the General Health Insurance Fund of Bavaria), in cooperation with the TCM (Traditional Chinese Medicine) Clinic Bad Kötzting. This stress prevention study (TALENT II) is part of a network programme designed to improve health services in specific spa regions in Bavaria [6,7]. The sustainability of the IHM approach has already been demonstrated in the context of weight loss through comprehensive lifestyle change [10,11]. In the TALENT I study, the IHM intervention resulted in a significant weight loss of 10% of baseline weight after one year [10].
Similarly, the web-based lifestyle intervention programme used in IHM has now been successfully implemented in a specialised spa region for people experiencing stress [6,7]. The TALENT II study aims to evaluate the efficacy of the IHM lifestyle intervention in reducing perceived stress by strengthening mental health resources such as sense of coherence (SOC), well-being and vitality, and by supporting the regulation of autonomic functions.
2. Materials and Methods
2.1. Study design
This randomised, two-arm, controlled, monocentric, interventional clinical trial was conducted at the SINOCUR Prevention Centre in Bad Kötzting, Germany. The centre is part of a centrally coordinated health promotion network called 'IHM Campus'. The study compared an intervention group (IHM) with a control group who were placed on a six-month waiting list for the IHM programme. All participants underwent a main observation period of six months, with the intervention group undergoing further longitudinal examinations until the end of the 12-month lifestyle programme. Additionally, patients in the waiting list group were compared with themselves after receiving the intervention, using a crossover design. The study was pre-registered with the German Clinical Trials Register Freiburg (DRKS, file number DRKS00013040, registration date 1 October 2017). Participants were required to provide written informed consent. The study protocol was submitted to the Ethics Committee of the Medical Faculty of the Technical University of Munich (TUM) for review of ethical and legal compliance, as the TUM is responsible for the principal investigator.
2.2. Recruitment and participants
The health insurance company AOK Bayern recruited 84,134 participants via written correspondence. Of the 2,684 who completed the online health survey, 623 participants (31.9%) showed no signs of stress. Participants were included if they scored at least 3.20 on the TEDIUM measure (indicating moderate stress or pre-burnout), scored more than 41 on the Perceived Stress Questionnaire (PSQ), and had experienced stress for more than three months. Participants were excluded if they met any of the following criteria: lack of legal capacity; insufficient knowledge of German; lack of private internet access; a body mass index (BMI) of less than 17.5; the need for psychiatric or psychotherapeutic treatment; known health problems (e.g., diabetes, heart disease or liver or kidney disease); pregnancy or lactation; or participation in another clinical trial within the last six months. The TEDIUM questionnaire revealed that 878 people (45.0%) exhibited significantly elevated stress levels indicating pre-burnout, while 427 people (21.9%) exhibited burnout (TEDIUM score ≥4.5). Two hundred and fifty participants who met the initial study requirements and were willing to participate were invited to meet with the study physician to receive further information and undergo an eligibility assessment. Randomisation, sample size calculation and further details of the study protocol were described by Melchart et al. (7). Due to difficulties arising from the pandemic, the estimated sample size of 136 (α = 0.05, two-sided, power = 80%, expected dropout rate = 5%) could not be achieved. The recruitment and allocation of participants is illustrated in the CONSORT study flowchart (Figure 1).
2.3. Intervention
The 12-month IHM lifestyle intervention programme includes various phases and training packages, supported by a web-based health portal (viterio.de). During the first three months, participants receive intensive lifestyle counselling: three health days (induction phase) and ten weekly after-work seminars (training phase). This is followed by a nine-month maintenance phase: weekly monitoring by health coaches, remote lifestyle counselling as needed, and half-day refresher courses (see Figure 2). Successful participation is defined as attending seven of the ten after-work seminars and at least three of the four refresher days between months three and twelve.
The intervention takes a blended learning approach, combining group sessions, one-to-one counselling and a personalised web-based health portal (www.viterio.de). Through the online portal, participants can access personalised feedback in the form of written reports and graphs detailing their progress. This feedback includes time and mood analysis, as well as information on lifestyle changes, behavioural adjustments and emotional regulation. Training content includes self-awareness exercises, quality of life optimisation, a six-minute and two-kilometre walking test, '3-1-2' Qigong relaxation techniques, time and sleep management, and information on stress, resilience, mood regulation and diet. There is also information on health behaviours related to physical activity and nutrition, as well as individual goal setting. Further details of the IHM intervention programme can be found in previous publications [7,8].
2.4. Outcomes
The primary outcome measure is subjective stress, as determined by the total PSQ score. This is compared between the IHM and CG groups at six months and at baseline. The secondary outcome parameters include various self-report questionnaires, such as those measuring tedium, psycho-vegetative complaints, mental stress and burden (ISR; [12]), the visual analogue scale for well-being (WHO-5; [13]), vitality and self-efficacy, optimism and pessimism (SWOP; [14]), sense of coherence (13 items;[15] and life satisfaction (FLZ; [16]). During the baseline examination, sociodemographic data is documented. Adverse event occurrence is recorded at each physical examination.
2.5. Statistical analysis
At six months, perceived stress (PSQ total score) was the primary outcome, and was evaluated using ANCOVA to assess intervention effects, adjusting for baseline scores and gender (5% two-sided significance level). The intention-to-treat (ITT) population included participants with baseline PSQ data. Multiple imputation by chained equations (MICE) with ten imputed datasets was used to handle missing data. Descriptive and inferential analyses were conducted on the multiply imputed datasets and pooled using Rubin's rules. Degrees of freedom were calculated via Barnard and Rubin's method. Effect sizes (Cohen's d and partial eta²) and standard deviations were averaged across imputations. Sensitivity analyses included a per-protocol approach (complete cases only). Additional t-tests were conducted to assess changes within- and between-group over time. Secondary outcomes were analysed in a similar way using the ITT sample. All tests were two-tailed at α = 0.05. No correction for multiple testing was applied due to the exploratory nature of secondary outcomes. For sample sizes >30, t-tests were applied regardless of normality, supported by the central limit theorem [17]. Non-parametric tests were used where appropriate.
3. Results
3.1. Sociodemographic and baseline characteristics
A total of 77 participants were included in the study: 38 (49%) were assigned to the intervention group and 39 (51%) to the control group. The control group was 89.7% female, while the intervention group was 76.3% female. This difference was significant (p < 0.001). The mean age was 45.18 years (SD = 11.35) in the control group and 44.32 years (SD = 10.05) in the intervention group (p = 0.725). The total PSQ score at baseline was similar in both groups. However, the groups differed in terms of the 'joy' subscale of the PSQ (p = 0.015, d = 0.57). No significant differences were observed between the groups for other parameters (see Table 1).
3.2. Dropout and missing data
In the intervention group, the dropout rate was 18.4% (seven out of 38 participants) by the end of the sixth month. Three participants dropped out before month 3, four by month 6, and two by month 12. By the end of the 12-month intervention, 29 of the original 38 participants had completed the study. In the control group, the dropout rate by month six was 7.7% (three out of 39 participants). Due to technical difficulties, one participant's PSQ data was lost, resulting in 35 complete PSQ observations in the control group and 31 in the intervention group by month six. The main reason for dropping out of the study was the Covid-19 pandemic.
3.3. Primary outcome
Based on our pilot study, we had expected to observe significant differences between the groups, with an average reduction of 18 points in the IHM group and 9 points in the control group (7). However, only 77 participants could be recruited for the study. Nevertheless, the total PSQ score of the IHM group for the ITT population decreased by an average of 25.25 points (95% CI [-30.77, -19.72]), indicating a 41% reduction. This demonstrates a substantial effect size (t(37) = -9.26, p < 0.001, d = -1.55). Notably, the mean score of 36.86 after six months of intervention is below the normal clinical threshold of 41.5. In contrast, the average score of the control group decreased by 5.41 (95% CI [-9.43, -1.39]), representing a 9% reduction. However, this reduction had only a small effect, and the mean score remains clinically abnormal (t(38) = -2.72, p = 0.010, d = -0.45). Although both groups showed a significant reduction in their total PSQ scores, the intervention group experienced a notably larger effect size compared to the control group (CG) (t(67.49) = -5.96, p < 0.001, d = -1.38), with an average reduction of -19.84 (95% CI [-26.47, -13.20]).
To validate the results further, we performed the same analysis with the per-protocol (PP) population. The effect within the IHM group (mean change = -24.46) and the difference between groups (mean difference = -19.42) were similar to those observed in the ITT population (t(30) = -8.15, p < .001, d = -1.70; t(52.26) = -5.43, p < 0.001, d = -1.37, respectively).
To fully assess the impact of the intervention over a 12-month period, we conducted a within-group comparison within the IHM group. Remarkably, the intervention demonstrated sustained efficacy, resulting in significant improvements by month 12 (t(37) = -10.33, p < 0.001, d = -1.70). On average, the PSQ total score decreased by 41% at month 6 and by 45% at month 12. Similar results were observed in the PP population (see Table 2). Overall, the IHM group derived substantial benefit from the intervention, whereas the control group exhibited the natural course of the disease, which did not reach clinical significance. Figure 3 shows the difference in PSQ total score at each time point.
3.4. PSQ subscales
When examining the mean differences for the ITT population between the IHM group and the CG on the subscales at six months, significant differences with large effect sizes were observed for all sub-dimensions: worries (p < 0.001, d = -1.04); demands (p < 0.001, d = -0.88); joy (p < 0.001, d = 1.02); and tension (p < 0.001, d = -1.26). Furthermore, within-group analyses revealed that the IHM group exhibited substantial improvements in all dimensions after six and 12 months. In contrast, the CG showed significant changes only for the joy and tension sub-dimensions, with small effect sizes. See Table 2 for a more detailed overview of the statistical results.
3.5. Analysis of Covariance
To investigate the influence of the intervention on group variance while controlling for covariates, an ANCOVA was conducted using the intention-to-treat (ITT) population. The intervention accounted for 38% of the variance between the two groups and was found to have a significant effect on perceived stress scores (b = -21.02, p < 0.001). Although gender had no significant impact on changes in PSQ scores, baseline values had a modest significant effect (b = -7.16, p = 0.104; b = -0.35, p = 0.008, respectively).
Using the per-protocol (PP) population, the intervention's effect was slightly lower, accounting for 34% of the variance (b = -20.51, p < 0.001). Additionally, neither baseline PSQ scores nor gender had a significant impact on variance (b = -0.28, p = 0.055; b = -5.79, p = 0.237, respectively). Table 3 provides a summary of the results.
3.6. Cross-over analysis
Due to the small sample size, an additional single-group crossover trial was conducted. In this study, we compared the original control group (who were previously on a waiting list) with the same participants after they had received the intervention (the new IHM group). We applied the same statistical analyses to the primary outcome as in the RCT described above, adjusting for the crossover design by modelling participant ID as a random effect in the ANCOVA and using paired t-tests.
The results of the crossover analysis were slightly less robust but consistent with those of the RCT. Using the ITT population, we observed an 8% reduction in the PSQ total score for the CG at six months (mean change = -5.05, 95% CI [-8.99, -1.10]). After the intervention, the same group's PSQ total score decreased by a further 33% (mean change = -18.74, 95% CI [-15.95, -6.11]). While both reductions were statistically significant, the effect size was small during the waiting period and substantial after the intervention (CG: d = -0.44, p = 0.014; IHM: d = -0.99, p < 0.001). When we compared the mean difference between the groups at six months, we observed a significant improvement in the IHM group characterised by a large effect size (d = -0.88, p = 0.001). Notably, scores returned to clinically normal levels on average after six months of intervention, mirroring the experience observed in the IHM group in the RCT. The result for the per-protocol population was comparable to that in the imputed data. (See Table 4.) Supplementary Figure 1 and Figure 2 show the comparison of the mean differences from baseline at all time points as well as the mean PSQ total scores for all groups at all time points.
3.7. Secondary outcomes
The IHM group showed significant improvements compared to the CG on all secondary outcomes except for pessimism after six months (see Table 5 for total scores and the supplementary material for a detailed overview of sub-dimensions). Within-group analyses of the IHM intervention, comparing scores at 12 months, consistently demonstrated significant improvements in all mental and psychological factors. These effects were more pronounced than those observed at six months. Table 5 and Supplementary Figure 3 summarise the main statistical findings. Supplementary Tables S1 to S3 provide a more detailed breakdown of the sub-dimensions. The statistical results are presented below, structured by psychological domain.
3.8. Stress profile
Significant improvements were observed between the groups after six months of the intervention, favouring the IHM group. Large effect sizes were found for all burnout sub-dimensions, as well as for the total score (total score: d = -1.34, p < 0.001; discouragement: d = -1.22, p < 0.001; exhaustion: d = -0.99, p < 0.001; loss of motivation: d = -1.26, p < 0.001; see Table 5 and Supplementary Table S1).
Psycho-vegetative complaints also significantly improved, with a large effect size (total score: d = -1.24, p < 0.001). After six months, moderate between-group differences emerged in the sleep (d = -0.64, p = 0.010) and dizziness (d = -0.72, p = 0.004) sub-dimensions. Notably, the IHM group exhibited greater improvement in sleep quality (d = -1.16, p < 0.001) and dizziness (d = -0.91, p < 0.001), particularly after 12 months. This suggests an increasing difference between the groups over time (see Table 5 and Table S1 in the Supplementary Material).
3.9. Mental stress and burden
Remission of mental load between 0 and 6 months was particularly evident in the significance values of the anxiety and depression sub-dimensions of the ISR (ICD Symptom Rating), with medium-to-high effect sizes (d = -0.79, p = 0.002; d = -0.76, p = 0.001, respectively). The total score showed a significant mean reduction of 0.32 between groups (d = -0.76, p = 0.001; see Table S2).
3.10. Psychological Resource Profile
Similar positive results were found for the WHO-5 Well-Being Index, which is an early indicator of depression (d = 1.28, p < 0.001), as well as for vitality (d = 1.11, p < 0.001), self-efficacy (d = 0.78, p = 0.002) and optimism (d = 0.81, p = 0.002) (SWOP). There was no significant difference between groups for pessimism after six months (p = 0.386). However, pessimism improved considerably for the IHM group after 12 months (d = 1.78, p < 0.001). Significant differences in sense of coherence were observed between the groups, favouring the IHM group for the total score as well as for all subdimensions (total score: d = 1.07, p < 0.001; meaningfulness: d = 0.88, p < 0.001; comprehensibility: d = 0.83, p = 0.005; manageability: d = 0.64, p = 0.016). The IHM group also showed significant improvements in overall life satisfaction (d = 0.81, p = 0.001), particularly in the areas of friends/acquaintances (d = 0.73, p = 0.004), leisure activities/hobbies (d = 0.74, p = 0.003) and health (d = 0.78, p = 0.004). For an overview of all results, see Table S3.
3.11. General Mood State Severity (VAS)
The general mood state severity index also showed large, significant improvements for the IHM group compared to the CG (d = -1.58, p < 0.001; see Table 4).
3.12. Adverse events
Participants who dropped out before the end of the third month are not included in the list. This leaves 35 participants in the IHM group and 37 in the CG group. A total of 26 adverse events (AEs) were reported: 11 in the IHM group and 15 in the CG group. None were serious. Twenty-two of the 26 AEs were not related to the study and four were classified as being completely unrelated.
4. Discussion
Stress-related illnesses and disorders are prevalent in the general population and in primary healthcare settings, resulting in high rates of long-term sick leave [18,19]. The primary objective of the present study was to demonstrate the effectiveness of our programme in reducing perceived stress levels six months after the intervention, compared to those in the control waiting list group. This was measured using the Perceived Stress Questionnaire (PSQ), a widely used self-reporting tool for assessing perceived stress [20]). Six months after the start of the intervention, significant reductions in perceived stress levels were achieved, with an effect size of d = 1.38, as measured by the total PSQ score (M6) compared with the baseline value (M0). Although both groups showed reduced PSQ scores after six months, the effect was significantly and clinically more pronounced in the IHM group. Furthermore, group assignment alone explained 34–38% of the variance in the difference in total PSQ scores. In contrast, baseline scores ranging from 41.67 to 81.67 only had a medium effect on variance (10%), which decreased further to become non-significant when the per-protocol (PP) population was used instead of the intent-to-treat (ITT) population. These findings suggest that the intervention is appropriate for a wider range of patients with varying stress levels. Moreover, the lack of significant gender differences in the variances suggests that the uneven gender distribution between the groups did not substantially influence the results. However, the potential impact of gender and baseline stress levels on the observed effects requires further investigation. Sensitivity analyses and the crossover analysis confirmed the primary hypothesis, demonstrating a significant difference between groups regardless of the method employed. In all cases, mean perceived stress (PSQ) scores in the IHM group decreased significantly, reaching clinically normal levels (≤41.5) within six months. Remarkably, these low levels were maintained for up to 12 months, with further improvements observed at six and 12 months (-41% and -45%, respectively).
The PSQ-Score outcome was broadly consistent with that of an internet-delivered, therapist-supported online cognitive behavioural therapy (CBT) treatment, which Lindsäter et al. [21] compared with a waiting list group. After six months, a strong effect size was observed in the PSQ, albeit smaller than in our study: Cohen's d = 1.09. A recent study by Sennerstam et al. [22] compared internet-delivered CBT with a lifestyle programme, finding no clinical differences in reducing perceived stress symptoms (Cohen's d = 1.19 vs. 1.06). These findings support our own and indicate that lifestyle-based interventions can be as effective as internet-delivered CBT in reducing perceived stress.
According to Lindsäter et al. [23]and Sennerstam et al. [24], patients with adjustment disorders (AD) in the International Classification of Diseases (ICD-11) typically experience symptoms such as persistent worry, sleep disturbances, and somatoform complaints, while those with exhaustion disorders (ED) are more likely to suffer from cognitive impairment and pronounced fatigue. Although these categories differ in symptom emphasis, considerable overlap exists across mental health disorders. This suggests that interventions targeting stress-related symptoms, such as the present lifestyle-based, blended learning approach, may be applicable to these diagnostic groups more broadly.
Psychological distress and long-term stress exposure are progressive health problems that have also been linked to an unhealthy lifestyle, decreased quality of life and reduced well-being. Such lifestyle factors include physical activity and sedentary behaviour [4,25,26], dietary patterns and body mass index (BMI) [27,28], sleep problems [29] and smoking [30]. All of these factors may influence stress, depression and anxiety. The increase in mental health issues requires the consistent promotion of resilience and stress management, as well as lifestyle-based prevention programmes. Our IHM-Lifestyle Programme takes a salutogenic approach to encourage a positive attitude in patients, helping them to cope with everyday stressors and to promote their quality of life. The programme also helps patients to manage their attitudes, behaviour, symptoms and disease.
Furthermore, our secondary analyses revealed that our comprehensive lifestyle intervention reduced stress levels and improved various aspects of mental and physical health. This included a significant reduction in symptoms of mental distress, such as depression and anxiety. There were also improvements in functional somatic symptoms and neurovegetative functions, such as orthostatic dizziness, sleep regulation, and overall mood severity. The study also demonstrated that psychological resources, including well-being, vitality, life satisfaction, sense of coherence, self-efficacy, and optimism, were advantageous. Large within-group effect sizes were observed for most of these indicators from pre- to post-treatment, as well as significant between-group results compared with the waiting list group. These results were maintained at the 1-year follow-up.
A systematic review and meta-analysis by Amiri et al. [31] examined the effect of lifestyle interventions on depression, anxiety, and stress in randomised controlled trials. The findings revealed that adopting a healthy lifestyle improves mental health and significantly reduces stress, with pronounced effects in patients with depressive symptoms and in women. Changes to lifestyle, such as increased exercise, a healthier diet and improved sleep quality, can effectively reduce stress by lowering cortisol levels and increasing endorphins [32,33]. Furthermore, the findings suggest that psychological factors, such as increased mindfulness and improved sleep quality, may have a positive impact. This is particularly relevant given that sleep disturbances are closely linked to cognitive impairments, such as memory lapses and attention deficits, which may act as mediators between insomnia and emotional disorders, such as anxiety and depression [34].
However, the effectiveness of such interventions depends not only on the basic methodology, but also on how they are implemented. Lifestyle interventions can take the form of personal guidance during seminars and courses, personal training or internet-based training, either alone or in combination. In this context, Brinsley et al.'s [35] meta-analysis and review of digital lifestyle studies is interesting. The primary outcome was the change in symptoms of mental disorders from pre- to post-intervention. Compared to the results of our study, the authors found small to moderate effects for depression, small effects for anxiety and stress, and no effects on well-being.
The IHM programme uses a combination of teaching methods, such as classroom teaching supplemented by personal online support, as part of a blended learning approach. This approach may be more effective than face-to-face or online instruction alone. However, previous research [36-38] has demonstrated that, while internet-based interventions provide short-term stress relief, they do not lead to long-term benefits. However, longer interventions involving refresher seminars require greater commitment from participants, which likely contributed to the higher dropout rate observed in our study. This emphasises the importance of balancing intervention intensity with participant engagement to ensure both effectiveness and adherence.
4.1. Strengths and limitations
One strength of our study is that we recruited a whole cohort of insured individuals from a statutory health insurance fund that covers a large area around a clinic. There were no prior restrictions based on symptoms or conditions. Although we were able to reach many people, the outbreak of the pandemic made it difficult, and sometimes impossible, to recruit participants for face-to-face training groups. Consequently, the randomisation process did not involve the desired number of participants, resulting in an imbalanced gender distribution. Despite falling short of our target sample size, the IHM group successfully reduced perceived stress, as expected.
5. Conclusions
IHM is an effective intervention for reducing stress and improving other aspects of mental health, with positive effects lasting up to a year. Further research is recommended to investigate the parameters of the intervention and its long-term effects. Finally, it is important to consider how best to integrate lifestyle programmes into service delivery.
Supplementary Materials
The following supporting information can be downloaded at the website of this paper posted on Preprints.org. Figure S1: Cross-over analysis: A comparison of the mean differences for all time points (without using imputation); Figure 2: The mean total PSQ values at each time point (without imputation); Figure S3: All outcomes: Distribution of mean differences (change score) at each time point per group (without imputation); Table S1: Results for the stress profile; Table S2: Results for the mental stress and burden (ISR); Table S3: Results for the psychological resource profile.
Author Contributions
Conceptualization, Dieter Melchart, Erich Wühr and Beatrice Bachmeier; Methodology, Dieter Melchart, Beatrice Bachmeier and Lara Isabel Jötten; Software, Dieter Melchart and Lara Isabel Jötten; Validation, Dieter Melchart, Beatrice Bachmeier and Lara Isabel Jötten; Formal analysis, Beatrice Bachmeier and Lara Isabel Jötten; Investigation, Dieter Melchart and Erich Wühr; Resources, Dieter Melchart and Erich Wühr; Data curation, Dieter Melchart and Lara Isabel Jötten; Writing – original draft, Dieter Melchart and Lara Isabel Jötten; Writing – review & editing, Dieter Melchart, Erich Wühr, Beatrice Bachmeier and Lara Isabel Jötten; Visualization, Erich Wühr; Supervision, Dieter Melchart and Erich Wühr; Project administration, Dieter Melchart and Erich Wühr; Funding acquisition, Dieter Melchart. All authors have read and agreed to the published version of the manuscript.
Funding
This research was funded by the Bayrisches Landesamt für Gesundheit und Lebensmittelsicherheit (Bavarian Ministry for Health and Food Safety). Development activities at the Competence Centre of Complementary Medicine and Naturopathy, Klinikum rechts der Isar, Technische Universität München (TUM) and Deggendorf Institute of Technology (DIT), were supported by Erich-Rothenfußer-Stiftung München (welfare group, patient foundation). Implementation phases were funded by the Bavarian Ministry of Health in several quality assurance and clinical research projects. The TCM-Klinik Bad Kötzting provided a study nurse to assist with the study. However, it did not provide any direct financial contributions. The funding parties have not been involved in study design, data collection, analysis and interpretation of data or writing the manuscript.
Institutional Review Board Statement
The study was conducted in accordance with the Declaration of Helsinki, and approved by the ethics commission of the Medical Faculty of Technical University of Munich (file number 278/17S). The investigators will ensure that the study will be conducted in compliance with the ethical guidelines as set out by this committee, and in line with the guidelines for good clinical practice (GCP).
Informed Consent Statement
Informed consent was obtained from all subjects involved in the study.
Data Availability Statement
The original contributions presented in this study are included in the article/supplementary material. Further inquiries can be directed to the corresponding author. The statistical data from the study can be found in the final report to the project sponsor. This will be available as a supplement download as part of the TCM Clinic Report 2023/4, which is scheduled to be published in digital book form by Springer Verlag in mid-2026.
Acknowledgments
We would like to thank the health insurance provider AOK Bayern for its generous support of the pilot project over several years. Thanks also to all the IHM coaches, doctors, study nurses, and TCM clinic management who participated in the study. Special thanks go to the Bavarian Ministry of Health and Care and the Erich Rothenfußer Foundation in Munich for their joint financial support of the study.
Conflicts of Interest
The authors declare no conflicts of interest.
Abbreviations
The following abbreviations are used in this manuscript:
| AOK | Allgemeine Ortskrankenkasse - General Health Insurance, Bavaria |
| CoCoNat | The Competence Center for Complementary Medicine and Naturopathy |
| IHM | Individual Health Management |
| ILI | Intensive Lifestyle Intervention |
| TALENT | TAilored Lifestyle IntervENTion Study |
| VITERIO | VIrtual Tool for Education, Reporting, Information and Outcomes |
References
- GBD 2019 Mental Disorders Collaborators. Global, regional, and national burden of 12 mental disorders in 204 countries and territories, 1990-2019: a systematic analysis for the Global Burden of Disease Study 2019. Lancet Psychiatry 2022, 9, 137–150. [Google Scholar] [CrossRef] [PubMed]
- Hahad, O.; Kerahrodi, J.G.; Brähler, E.; Lieb, K.; Gilan, D.; Zahn, D.; et al. Psychological resilience, cardiovascular disease, and mortality - Insights from the German Gutenberg Health Study. J Psychosom Res. 2025, 192, 112116. [Google Scholar] [CrossRef] [PubMed]
- Li, X.; Zhao, W.; Wei, Y.-H.; Zhang, X.-S.; Zhu, Y.; Li, X.-H. Perceived stress, risk factors and prognostic monitoring loci for the development of depression. World Journal of Psychiatry. 2025, 15. [Google Scholar] [CrossRef] [PubMed]
- Bourke, M.; Wang, H.F.W.; McNaughton, S.A.; Thomas, G.; Firth, J.; Trott, M.; et al. Clusters of healthy lifestyle behaviours are associated with symptoms of depression, anxiety, and psychological distress: A systematic review and meta-analysis of observational studies. Clin Psychol Rev. 2025, 118, 102585. [Google Scholar] [CrossRef]
- Marx, W.; Manger, S.H.; Blencowe, M.; Murray, G.; Ho, F.Y.-Y.; Lawn, S.; et al. Clinical guidelines for the use of lifestyle-based mental health care in major depressive disorder: World Federation of Societies for Biological Psychiatry (WFSBP) and Australasian Society of Lifestyle Medicine (ASLM) taskforce. World J Biol Psychiatry. 2023, 24, 333–386. [Google Scholar] [CrossRef]
- Melchart, D.; Wühr, E.; Doerfler, W.; Eustachi, A.; Wellenhofer-Li, Y.; Weidenhammer, W. Preliminary outcome data of a Sino-European-Prevention-Program (SEPP) in individuals with perceived stress. Journal of Preventive Medicine and Healthcare 2017, 1, 1003. [Google Scholar] [CrossRef]
- Melchart, D.; Wühr, E.; Wifling, K.; Bachmeier, B.E. The TALENT II study: a randomized controlled trial assessing the impact of an individual health management (IHM) on stress reduction. BMC Public Health. 2018, 18, 823. [Google Scholar] [CrossRef]
- Melchart, D.; Eustachi, A.; Wellenhofer-Li, Y.; Doerfler, W.; Bohnes, E. Individual Health Management - A Comprehensive Lifestyle Counselling Programme for Health Promotion, Disease Prevention and Patient Education. Forsch Komplementmed. 2016, 23, 30–35. [Google Scholar] [CrossRef]
- Melchart, D.; Wühr, E.; Doerfler, W.; Eustachi, A.; Wellenhofer-Li, Y.; Weidenhammer, W. Introduction of a web portal for an Individual Health Management and observational health data sciences. Patient Relat Outcome Meas. 2018, 9, 1–8. [Google Scholar] [CrossRef]
- Melchart, D.; Löw, P.; Wühr, E.; Kehl, V.; Weidenhammer, W. Effects of a tailored lifestyle self-management intervention (TALENT) study on weight reduction: a randomized controlled trial. Diabetes Metab Syndr Obes. 2017, 10, 235–245. [Google Scholar] [CrossRef]
- Melchart, D.; Wühr, E.; Weidenhammer, W. High and Low Responders in a Comprehensive Lifestyle Program for Weight Loss - Secondary Analysis of a Randomized Controlled Trial. Complement Med Res. 2017, 24, 232–239. [Google Scholar] [CrossRef] [PubMed]
- Tritt, K.; Heymann Fvon Zaudig, M.; Zacharias, I.; Söllner, W.; Loew, T. Entwicklung des Fragebogens "ICD-10-Symptom-Rating" (ISR) [Development of the "ICD-10-Symptom-Rating"(ISR) questionnaire]. Z Psychosom Med Psychother. 2008, 54, 409–418. [Google Scholar] [CrossRef] [PubMed]
- Topp, C.W.; Østergaard, S.D.; Søndergaard, S.; Bech, P. The WHO-5 Well-Being Index: a systematic review of the literature. Psychother Psychosom. 2015, 84, 167–176. [Google Scholar] [CrossRef] [PubMed]
- Scholler, G.; Fliege, H.; Klapp, B.F. Fragebogen zu Selbstwirksamkeit, Optimismus und Pessimismus: Restrukturierung, Itemselektion und Validierung eines Instruments an Untersuchungen klinischer Stichproben [Questionnaire of self-efficacy, optimism and pessimism: reconstruction, selection of items and validation of an instrument by means of examinations of clinical samples]. Psychother Psychosom Med Psychol. 1999, 275–283. [Google Scholar]
- Feldt, T.; Lintula, H.; Suominen, S.; et al. Structural validity and temporal stability of the 13-item sense of coherence scale: Prospective evidence from the population-based HeSSup study. Qual Life Res 2007, 16, 483. [Google Scholar] [CrossRef]
- Henrich, G.; Herschbach, P. Questions on Life Satisfaction (FLZM) - A Short Questionnaire for Assessing Subjective Quality of Life. European Journal of Psychological Assessment. 2000, 16, 150–159. [Google Scholar] [CrossRef]
- Moore, D.S.; McCabe, G.P.; Craig, B.A. 2014. Introduction to the Practice of Statistics. 8th ed. New York (NY): W. H. Freeman.
- Parkes, S.; Irizar, P.; Greenberg, N.; Wessely, S.; Fear, N.T.; Hotopf, M.; et al. Sickness absence and associations with sociodemographic factors, health risk behaviours, occupational stressors and adverse mental health in 40,343 UK police employees. Epidemiol Psychiatr Sci. 2024, 33, e26. [Google Scholar] [CrossRef]
- Iwasaki, S.; Deguchi, Y.; Okura, S.; Maekubo, K.; Inoue, K. Quantifying the impact of occupational stress on long-term sickness absence due to mental disorders. Work. 2025, 80, 1137–1143. [Google Scholar] [CrossRef]
- Cohen, S.; Kamarck, T.; Mermelstein, R. A Global Measure of Perceived Stress. Journal of Health and Social Behavior. 1983, 24, 385. [Google Scholar] [CrossRef]
- Lindsäter, E.; Axelsson, E.; Salomonsson, S.; Santoft, F.; Ejeby, K.; Ljótsson, B.; et al. Internet-Based Cognitive Behavioral Therapy for Chronic Stress: A Randomized Controlled Trial. Psychother Psychosom. 2018, 87, 296–305. [Google Scholar] [CrossRef]
- Sennerstam, V.; Franke Föyen, L.; Kontio, E.; Svärdman, F.; Lekander, M.; et al. Internet-Delivered Treatment for Stress-Related Disorders: A Randomized Controlled Superiority Trial of Cognitive Behavioral Therapy versus General Health Promotion. Psychother Psychosom. 2025, 1–16. [Google Scholar] [CrossRef]
- Lindsäter, E.; Svärdman, F.; Rosquist, P.; Wallert, J.; Ivanova, E.; Lekander, M.; et al. Characterization of exhaustion disorder and identification of outcomes that matter to patients: Qualitative content analysis of a Swedish national online survey. Stress Health. 2023, 39, 813–827. [Google Scholar] [CrossRef] [PubMed]
- Sennerstam, V.; Hedman-Lagerlöf, E.; Nilsonne, G.; Lekander, M.; Rück, C.; et al. Exhaustion Disorder in Primary Care: A Comparison With Major Depressive Disorder and Adjustment Disorder. Scand J Psychol. 2025, 66, 315–326. [Google Scholar] [CrossRef] [PubMed]
- Herbert, C.; Meixner, F.; Wiebking, C.; Gilg, V. Regular Physical Activity, Short-Term Exercise, Mental Health, and Well-Being Among University Students: The Results of an Online and a Laboratory Study. Front Psychol. 2020, 11, 509. [Google Scholar] [CrossRef] [PubMed]
- Rebar, A.L.; Stanton, R.; Geard, D.; Short, C.; Duncan, M.J.; Vandelanotte, C. A meta-meta-analysis of the effect of physical activity on depression and anxiety in non-clinical adult populations. Health Psychol Rev. 2015, 9, 366–378. [Google Scholar] [CrossRef]
- Jacka, F.N.; Cherbuin, N.; Anstey, K.J.; Butterworth, P. Dietary patterns and depressive symptoms over time: examining the relationships with socioeconomic position, health behaviours and cardiovascular risk. PLoS One. 2014, 9, e87657. [Google Scholar] [CrossRef]
- Flórez, K.R.; Dubowitz, T.; Ghosh-Dastidar, M.B.; Beckman, R.; Collins, R.L. Associations between depressive symptomatology, diet, and body mass index among participants in the supplemental nutrition assistance program. J Acad Nutr Diet. 2015, 115, 1102–1108. [Google Scholar] [CrossRef]
- Jin, Y.; Li, J.; Ye, J.; Luo, X.; Wilson, A.; Mu, L.; et al. Mapping associations between anxiety and sleep problems among outpatients in high-altitude areas: a network analysis. BMC Psychiatry. 2023, 23, 341. [Google Scholar] [CrossRef]
- Crabb, A.B.; Allen, J.; Taylor, G. What if I fail? Unsuccessful smoking cessation attempts and symptoms of depression and anxiety: a systematic review and meta-analysis. BMJ Open. 2025, 15, e091419. [Google Scholar] [CrossRef]
- Amiri, S.; Mahmood, N.; Javaid, S.F.; Khan, M.A. The Effect of Lifestyle Interventions on Anxiety, Depression and Stress: A Systematic Review and Meta-Analysis of Randomized Clinical Trials. Healthcare (Basel). 2024, 12. [Google Scholar] [CrossRef]
- Yadav, R.K.; Magan, D.; Mehta, N.; Sharma, R.; Mahapatra, S.C. Efficacy of a short-term yoga-based lifestyle intervention in reducing stress and inflammation: preliminary results. J Altern Complement Med. 2012, 18, 662–667. [Google Scholar] [CrossRef]
- Daubenmier, J.J.; Weidner, G.; Sumner, M.D.; Mendell, N.; Merritt-Worden, T.; Studley, J.; et al. The contribution of changes in diet, exercise, and stress management to changes in coronary risk in women and men in the multisite cardiac lifestyle intervention program. Ann Behav Med. 2007, 33, 57–68. [Google Scholar] [CrossRef] [PubMed]
- Akpoveta, E.D.; Okpete, U.E.; Byeon, H. Sleep disorders and mental health: Understanding the cognitive connection. World J Psychiatry. 2025, 15, 105362. [Google Scholar] [CrossRef] [PubMed]
- Brinsley, J.; O'Connor, E.J.; Singh, B.; McKeon, G.; Curtis, R.; Ferguson, T.; et al. Effectiveness of Digital Lifestyle Interventions on Depression, Anxiety, Stress, and Well-Being: Systematic Review and Meta-Analysis. J Med Internet Res. 2025, 27, e56975. [Google Scholar] [CrossRef] [PubMed]
- Goh, Y.-S.; Ow Yong, Q.Y.J.; Tam, W.-S.W. Effects of online stigma-reduction programme for people experiencing mental health conditions: A systematic review and meta-analysis. Int J Ment Health Nurs. 2021, 30, 1040–1056. [Google Scholar] [CrossRef]
- Ierardi, E.; Bottini, M.; Riva Crugnola, C. Effectiveness of an online versus face-to-face psychodynamic counselling intervention for university students before and during the COVID-19 period. BMC Psychol. 2022, 10, 35. [Google Scholar] [CrossRef]
- Karyotaki, E.; Efthimiou, O.; Miguel, C.; Bermpohl, F.M.G.; Furukawa, T.A.; Cuijpers, P.; et al. Internet-Based Cognitive Behavioral Therapy for Depression: A Systematic Review and Individual Patient Data Network Meta-analysis. JAMA Psychiatry. 2021, 78, 361–371. [Google Scholar] [CrossRef]
Figure 1.
CONSORT study flowchart: Due to corona, data for month 3 is missing in two cases. However, these participants did not drop out of the study and were not excluded, as the reason for the missing data was not related to the study.
Figure 1.
CONSORT study flowchart: Due to corona, data for month 3 is missing in two cases. However, these participants did not drop out of the study and were not excluded, as the reason for the missing data was not related to the study.
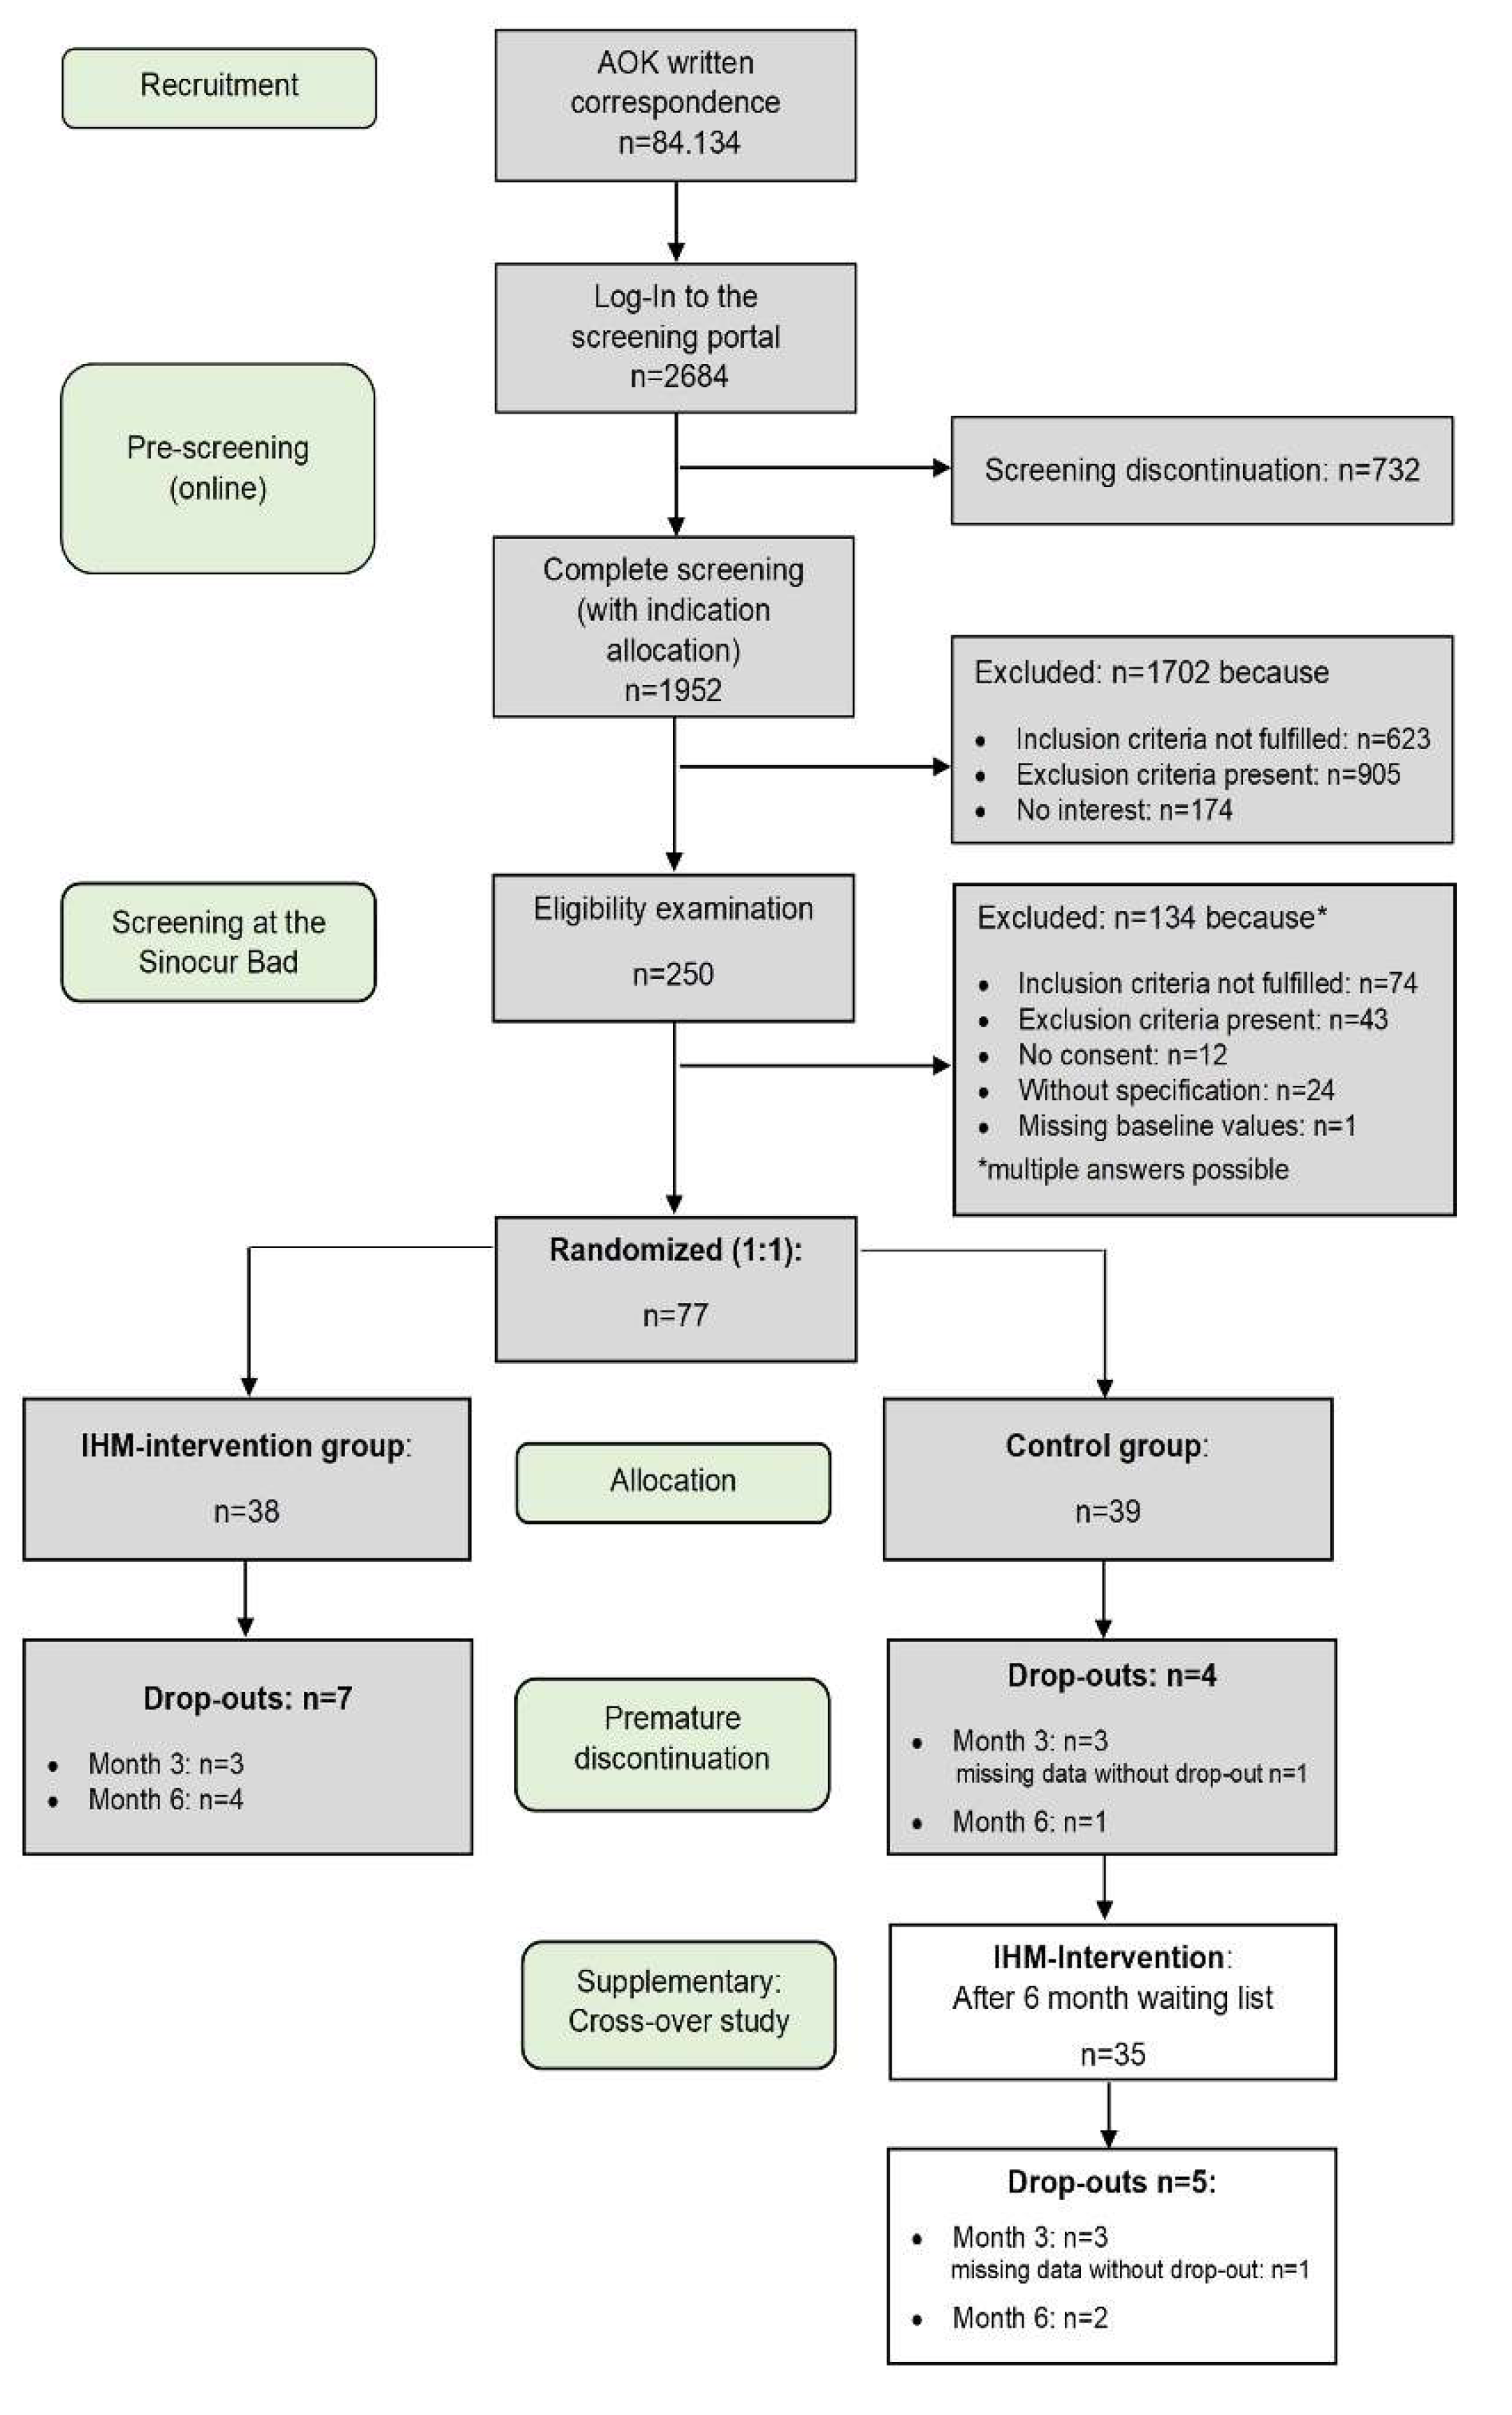
Figure 2.
Schematic course of the IHM: Illustration of the structure and timeline of the Individual Health Management (IHM) intervention across its phases.
Figure 2.
Schematic course of the IHM: Illustration of the structure and timeline of the Individual Health Management (IHM) intervention across its phases.
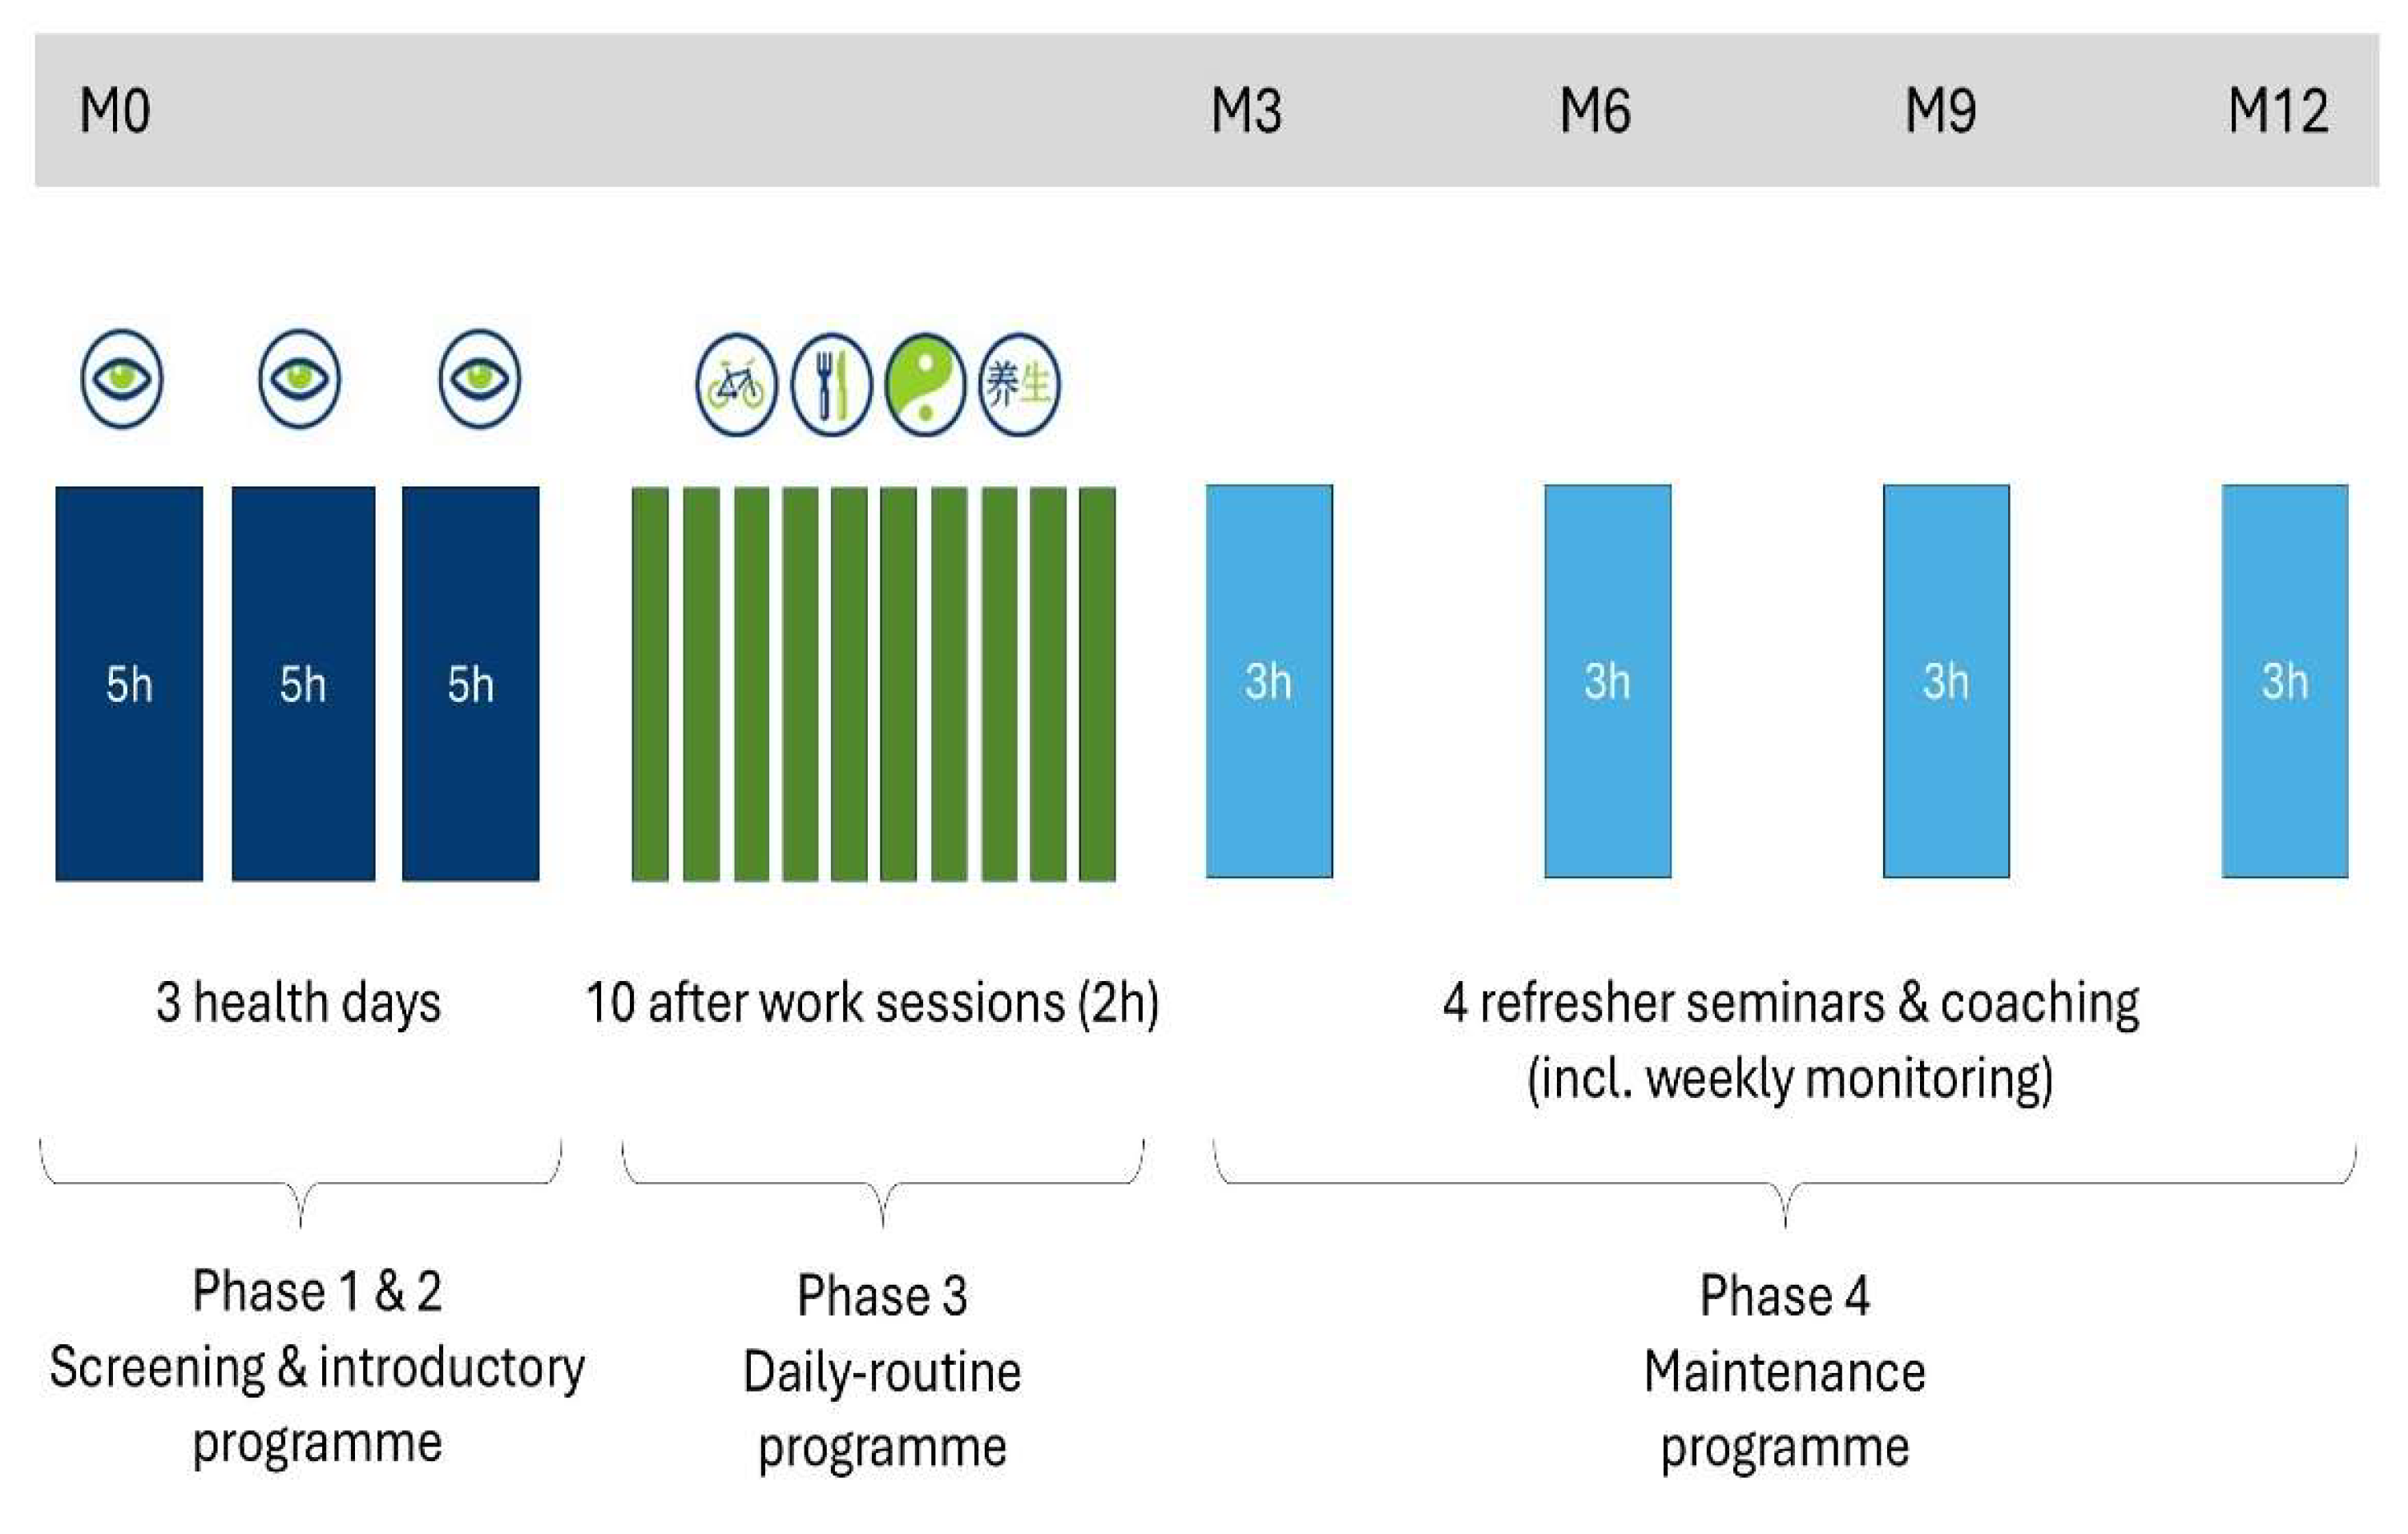
Figure 3.
Perceived Stress: Distribution of mean differences from baseline (M0) after three months (M3), six months (M6), nine months (M9) and twelve months (M12) per group (CG = control group, IHM = intervention group; no imputation). The dashed line indicates no change. Values above the line show a decline and values below the line an improvement. White circles represent the mean, black lines and circles the median.
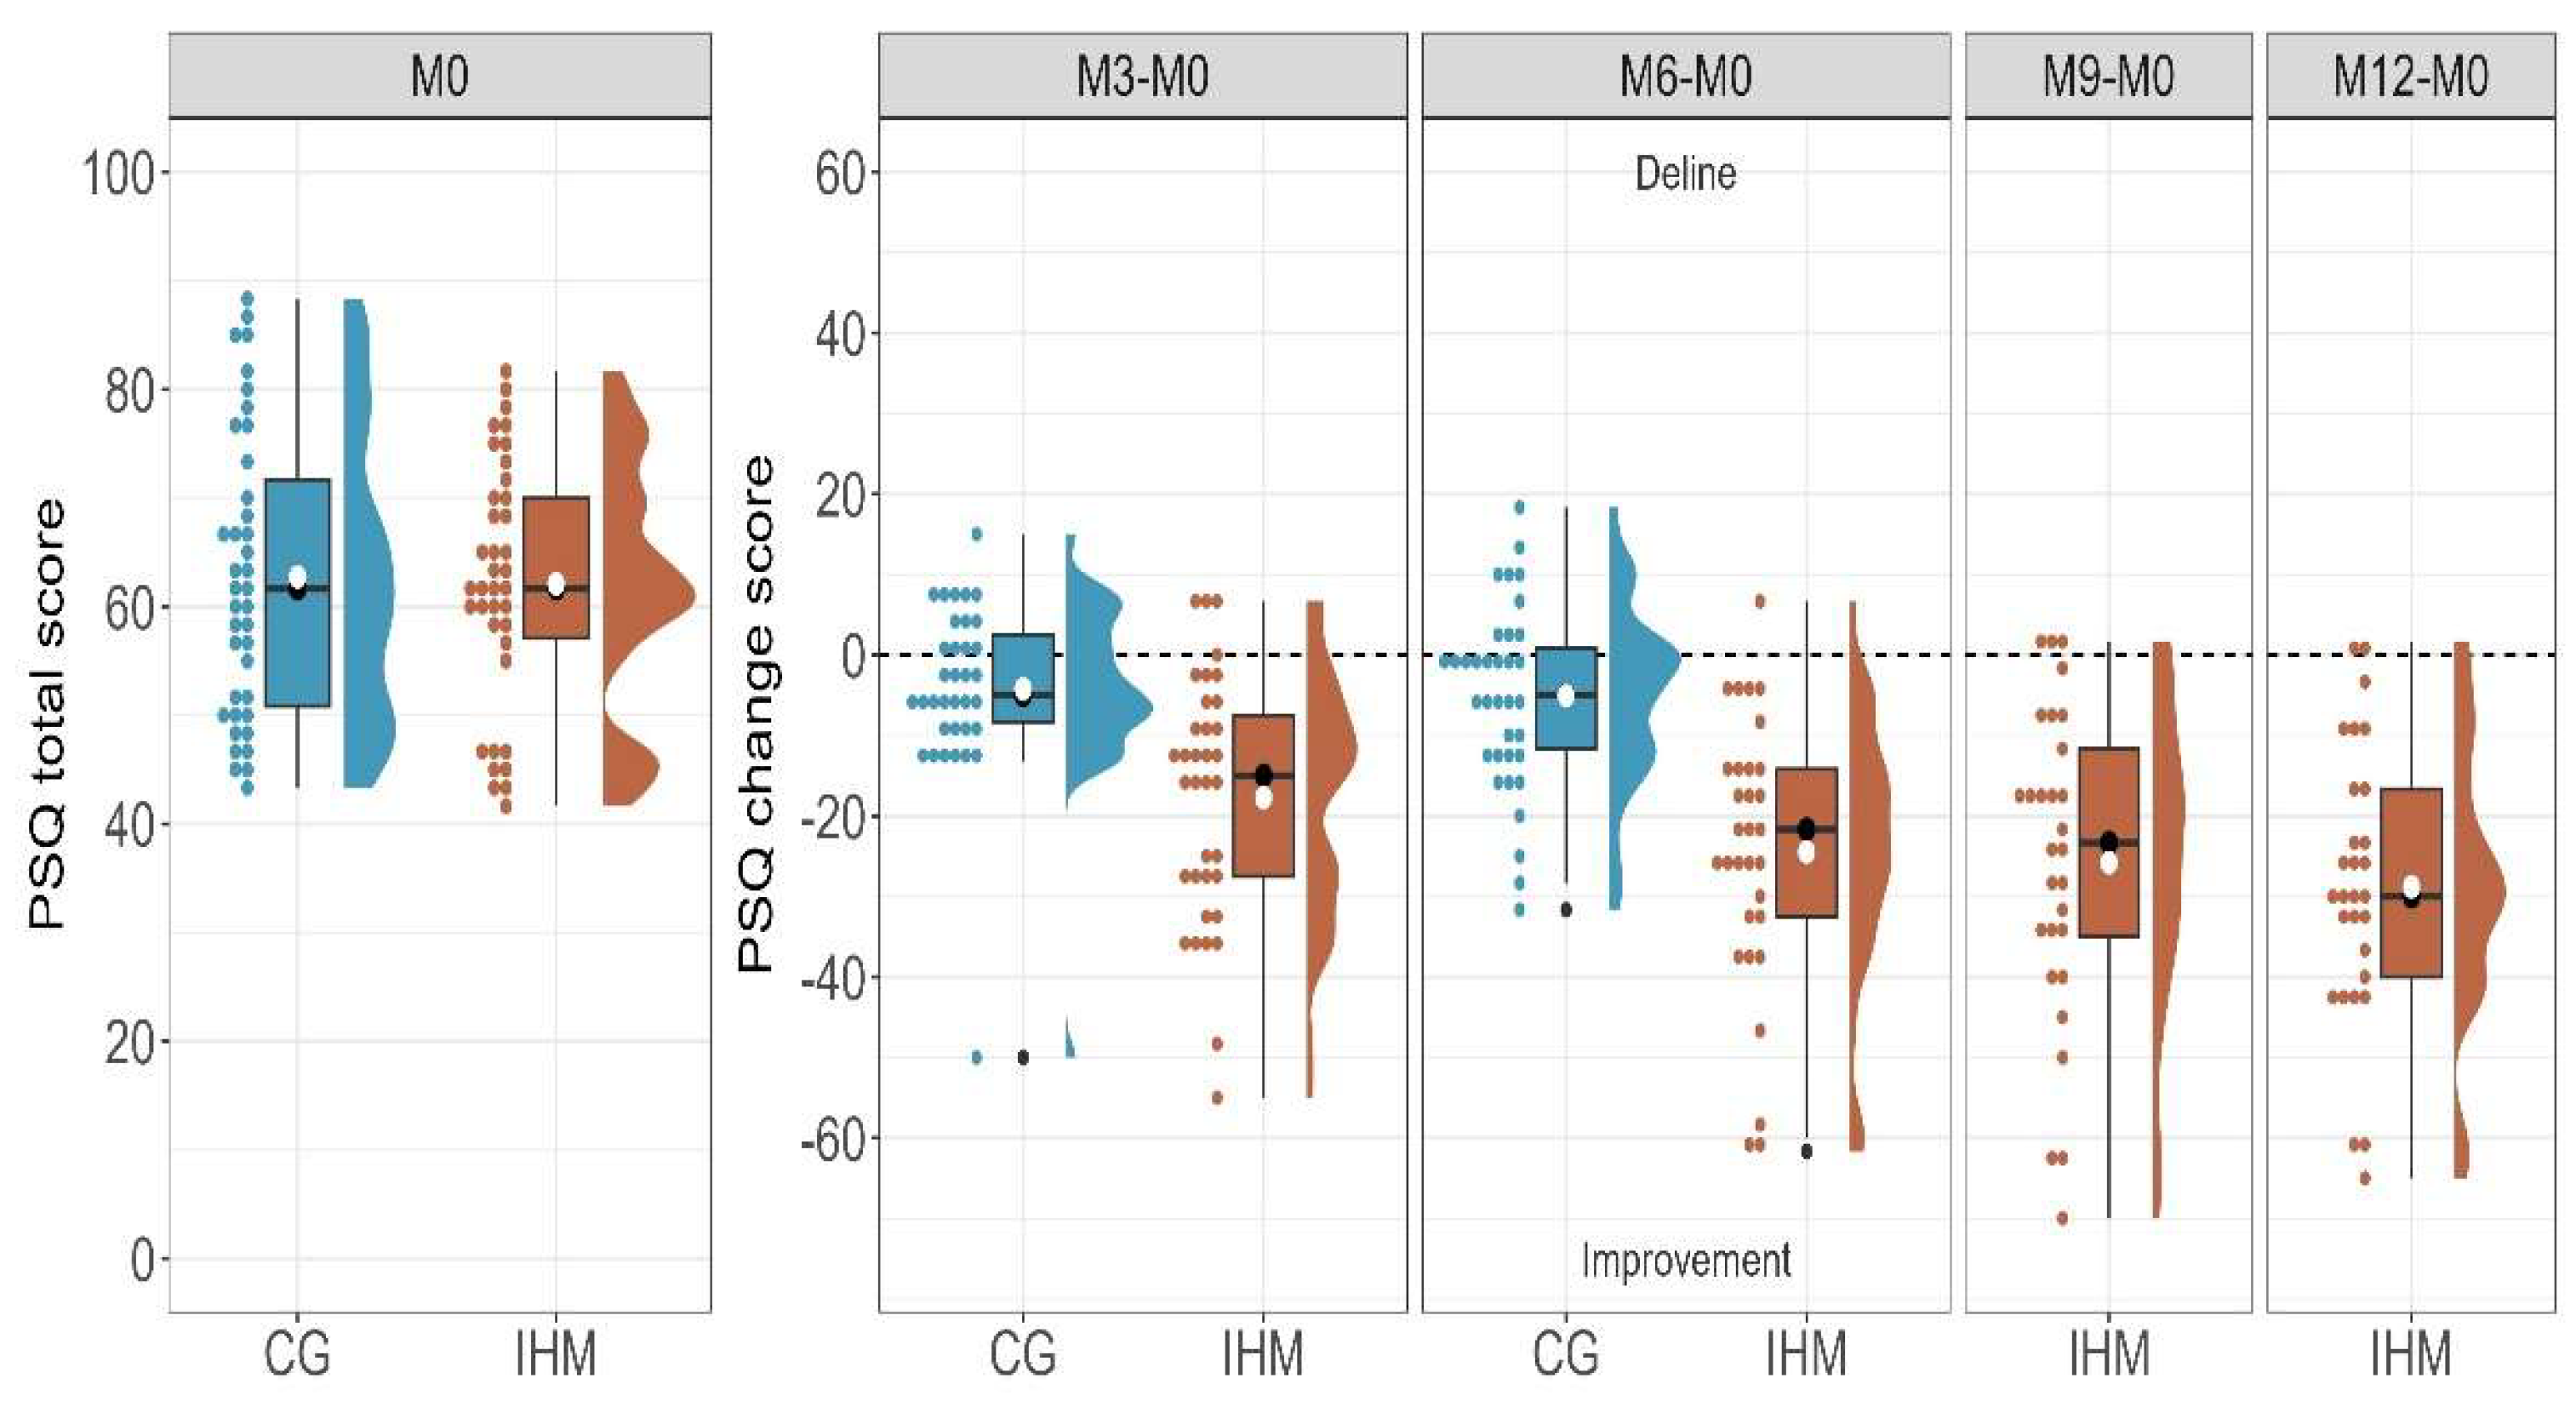

Table 1.
Baseline demographic and clinical characteristics.
| Intervention Group (n = 38) |
Control Group (n = 3 9) |
Between group differences |
In total (n = 77) |
||||
|---|---|---|---|---|---|---|---|
| mean | SD | mean | SD | p | mean | SD | |
| Age (years) | 44.32 | 10.05 | 45.18 | 11.35 | 0.725 | 44.75 | 10.67 |
| n | % | n | % | p | n | % | |
| Female | 29 | 76.3 | 35 | 89.7 | <0.001*** | 64 | 83.1 |
| Male | 9 | 23.7 | 4 | 10.3 | 13 | 16.9 | |
| School education | 0.529 | ||||||
| No school-leaving certificate | 0 | 0.0 | 1 | 2.6 | 1 | 1.3 | |
| Secondary general school certificate | 15 | 40.5 | 11 | 28.2 | 26 | 34.2 | |
| Intermediate school certificate | 15 | 40.5 | 19 | 48.7 | 34 | 44.7 | |
| University entrance qualification | 6 | 16.2 | 8 | 20.5 | 14 | 18.4 | |
| Other degree | 1 | 2.7 | 0 | 0.0 | 1 | 1.3 | |
| Vocational education | 0.207 | ||||||
| No completed vocational training | 4 | 10.8 | 4 | 10.3 | 8 | 10.5 | |
| Completed apprenticeship | 23 | 62.2 | 18 | 46.2 | 41 | 54.0 | |
| Vocational School | 7 | 18.9 | 11 | 28.2 | 18 | 23.7 | |
| University of applied science | 1 | 2.7 | 3 | 7.7 | 4 | 5.3 | |
| University degree | 0 | 0.0 | 2 | 5.1 | 2 | 2.6 | |
| Other degree | 2 | 5.4 | 1 | 2.6 | 3 | 3.9 | |
| Employment status | 0.748 | ||||||
| Employed | 34 | 91.9 | 35 | 89.7 | 69 | 90.8 | |
| Temporarily retired | 1 | 2.7 | 0 | 0.0 | 1 | 1.3 | |
| Retired | 0 | 0.0 | 2 | 5.1 | 2 | 2.6 | |
| Employed without remuneration | 1 | 2.7 | 1 | 2.6 | 2 | 2.6 | |
| Without specification | 1 | 2.7 | 1 | 2.6 | 2 | 2.6 | |
| Living condition | 0.286 | ||||||
| Individual household | 5 | 13.5 | 9 | 23.1 | 14 | 18.4 | |
| Multi-person household | 32 | 86.5 | 30 | 76.9 | 62 | 81.6 | |
| Smoking | 0.720 | ||||||
| No | 35 | 92.1 | 35 | 89.7 | 70 | 90.9 | |
| Yes | 3 | 7.9 | 4 | 10.3 | 7 | 9.1 | |
| Alcohol | 0.417 | ||||||
| No | 36 | 94.7 | 35 | 89.7 | 71 | 92.2 | |
| Yes | 2 | 5.3 | 4 | 10.3 | 6 | 7.8 | |
| PSQ | mean | SD | mean | SD | p | mean | SD |
| Total score | 62.11 | 11.30 | 62.74 | 13.19 | 0.822 | 62.42 | 12.22 |
| Worries | 51.23 | 18.61 | 51.97 | 17.58 | 0.859 | 51.60 | 17.98 |
| Demands | 64.03 | 22.49 | 57.78 | 18.88 | 0.191 | 60.87 | 20.84 |
| Joy | 36.67 | 14.52 | 28.03 | 15.83 | 0.015* | 32.29 | 15.71 |
| Tension | 69.82 | 14.35 | 69.23 | 18.14 | 0.874 | 69.52 | 16.27 |
| Secondary outcomes | |||||||
| Tedium-Measure Burnout | 4.19 | 0.54 | 4.33 | 0.54 | 0.266 | 4.26 | 0.54 |
| Psycho-vegetative complaints | 56.74 | 13.86 | 53.72 | 13.12 | 0.330 | 55.21 | 13.48 |
| ISR total scores | 1.13 | 0.51 | 1.07 | 0.42 | 0.560 | 1.10 | 0.47 |
| General mood state severity (VAS) | 58.82 | 15.24 | 53.69 | 15.12 | 0.143 | 56.22 | 15.30 |
| Well-being (WHO-5) | 7.89 | 3.65 | 10.56 | 10.48 | 0.140 | 9.25 | 7.95 |
| Vitality (SF-36) | 35.00 | 15.55 | 37.69 | 15.34 | 0.447 | 36.36 | 15.40 |
| Self-efficacy (SWOP) | 12.21 | 2.73 | 11.41 | 2.45 | 0.180 | 11.81 | 2.61 |
| Optimism (SWOP) | 5.32 | 1.36 | 4.74 | 1.25 | 0.058 | 5.03 | 1.33 |
| Pessimism (SWOP) | 5.00 | 1.19 | 5.00 | 1.19 | 1 | 5.00 | 1.18 |
| Sense of Coherence (SOC) | 54.53 | 9.16 | 54.54 | 9.44 | 0.995 | 54.53 | 9.25 |
| Life satisfaction (FLZ) | 33.34 | 27.37 | 29.97 | 26.70 | 0.587 | 31.64 | 26.91 |
Note. The table 1 shows the sociodemographic characteristics of the intervention (IHM) and control (CG) groups, including means and standard deviations (SD), p-values from independent between-group comparisons using either a t-test or a Wilcoxon-rank-sum test for categorial parameters, and overall means and SD for the total sample. Please note that data for one participant (IHM) is missing for education, employment details and living conditions due to a technical error.
Table 2.
Findings from the statistical analysis of the PSQ, broken down by time point and group.
| Intervention group (n = 38) | Control group (n = 39) | Between groups | ANCOVA | ||||||||
|---|---|---|---|---|---|---|---|---|---|---|---|
| Mean | SD | ΔM0 | Cohen’s d | Mean | SD | ΔM0 | Cohen’s d | Mean difference ΔM0 [95% CI] |
Cohen’s d |
Parameter estimate for group factor [95% CI] | |
| PSQ total score ITT | |||||||||||
| M0 | 62.11 | 11.30 | 62.74 | 13.19 | -0.63 [-6.21; 4.95] | ||||||
| M 3 | 44.71 | 14.95 | -17.39 | -1.13*** | 59.06 | 15.88 | -3.68 | -0.33. | -13.72 [-20.14; -7.30] | -1.02*** | -14.70 [-20.94; -8.45] |
| M 6 | 36.86 | 15.46 | -25.25 | -1.55*** | 57.32 | 15.60 | -5.41 | -0.45** | -19.84 [-26.47; -13.20] | -1.38*** | -21.02 [-27.34; -14.70] |
| M 9 | 36.84 | 15.71 | -25.27 | -1.37*** | |||||||
| M 12 | 33.90 | 14.43 | -28.20 | -1.70*** | |||||||
| Sensitivity analysis for PSQ total score PP | |||||||||||
| M 3 | 44.76 | 15.44 | -17.71 | -1.31*** | 59.19 | 16.43 | -4.24 | -0.27* | -13.48 [-19.84; -7.11] | -1.01*** | -14.20 [-20.54; -7.85] |
| M 6 | 37.15 | 16.70 | -24.46 | -1.70*** | 57.57 | 16.06 | -5.05 | -0.34* | -19.42 [-26.10; -12.43] | -1.37*** | -20.51 [-27.48; -13.54] |
| M 9 | 36.04 | 17.39 | -25.80 | -1.78*** | |||||||
| M 12 | 33.91 | 15.88 | -28.79 | -2.13*** | |||||||
| PSQ worries ITT | |||||||||||
| M0 | 51.23 | 18.61 | 51.97 | 17.58 | -0.74 [-8.96; 7.48] | ||||||
| M 3 | 34.74 | 14.97 | -16.49 | -0.92*** | 48.87 | 19.68 | -3.09 | -0.18 | -13.40 [-21.80; -4.99] | -0.76** | -14.36 [-21.87; -6.84] |
| M 6 | 27.19 | 16.56 | -24.04 | -1.18*** | 47.78 | 20.45 | -4.19 | -0.24 | -19.85 [-28.85; -10.85] | -1.04*** | -21.48 [-29.61; -13.36] |
| M 9 | 25.75 | 17.49 | -25.47 | -1.24*** | |||||||
| M 12 | 24.30 | 15.53 | -26.93 | -1.38*** | |||||||
| PSQ demands ITT | |||||||||||
| M0 | 64.04 | 22.49 | 57.78 | 18.88 | 6.26 [-3.16; 15.68] | ||||||
| M 3 | 45.79 | 22.04 | -18.25 | -0.87*** | 56.48 | 23.03 | -1.30 | -0.08 | -16.95 [-26.56; -7.33] | -0.89*** | -15.96 [-25.19; -6.73] |
| M 6 | 42.60 | 23.60 | -21.44 | -1.09*** | 52.91 | 20.87 | -4.87 | -0.27 | -16.57 [-25.82; -7.31] | -0.88*** | -15.33 [-24.47; -6.19] |
| M 9 | 45.00 | 23.95 | -19.04 | -0.79*** | |||||||
| M 12 | 39.30 | 20.81 | -24.74 | -1.30*** | |||||||
| PSQ joy ITT | |||||||||||
| M0 | 36.67 | 14.52 | 28.03 | 15.83 | 8.63 [1.73; 15.54] | ||||||
| M 3 | 50.79 | 19.46 | 14.12 | 0.78*** | 35.37 | 17.21 | 7.33 | 0.52** | 6.79 [-1.18; 14.76] | 0.42. | 10.16 [2.19; 18.14] |
| M 6 | 60.18 | 19.83 | 23.51 | 1.28*** | 33.90 | 18.91 | 5.86 | 0.37* | 17.65 [9.07; 26.22] | 1.02*** | 21.51 [12.58; 30.44] |
| M 9 | 61.70 | 20.19 | 25.04 | 1.13*** | |||||||
| M 12 | 62.07 | 20.71 | 25.40 | 1.18*** | |||||||
| PSQ tension ITT | |||||||||||
| M0 | 69.82 | 14.35 | 69.23 | 18.14 | 0.59 [-6.85; 8.03] | ||||||
| M 3 | 49.11 | 17.99 | -20.72 | -0.96*** | 66.26 | 20.59 | -2.97 | -0.18 | -17.75 [-26.97; -8.52] | -0.91*** | -18.48 [-26.92; -10.03] |
| M 6 | 37.82 | 18.27 | -32.00 | -1.39*** | 62.51 | 22.64 | -6.72 | -0.41* | -25.28 [-34.91; -15.66] | -1.26*** | -25.87 [-35.04; -16.70] |
| M 9 | 38.30 | 21.68 | -31,53 | -1.24*** | |||||||
| M 12 | 34.09 | 18.17 | -35,74 | -1.56*** | |||||||
Note: The table shows t-test results comparing the IHM and CG, as well as paired t-tests assessing changes over time. For each time point, mean scores (± SD), mean change scores from baseline (ΔM0), effect sizes (Cohen's d: <.05 small, 0.5-0.8 medium, >0.8 large) and p-values (Significance: p < 0.05*, p < 0.01**, p < 0.001***) are reported. Between-group mean differences and 95% confidence intervals (CIs) are presented, along with the parameter estimate for the group factor from the ANCOVA model, adjusted for baseline scores and gender. SD values and Cohen's d for the intent-to-treat population (ITT) were calculated from multiply imputed data as the mean value across imputations. A sensitivity analysis based on the PP sample is also included. The sample size for each month is as follows: IHM: M3 n = 35, M6 n = 31, M9 n = 29, M12 n = 29; PP: M3 n = 35, M6 n = 35.
Table 3.
ANCOVA results for the differences between month 6 and month 0 adjusted for gender and baseline values.
Table 3.
ANCOVA results for the differences between month 6 and month 0 adjusted for gender and baseline values.
| ANCOVA results | Estimate | SE | df | [95% CI] | t | p | par. n2 |
|---|---|---|---|---|---|---|---|
| ITT population | |||||||
| Intercept | 30.37 | 11.29 | 61.81 | [7.81; 52.93] | 2.69 | 0.009 | |
| Group (IHM/CC) | -21.02 | 3.17 | 68.04 | [-27.34; -14.70] | -6.63 | <0.001 | 0.38 |
| PSQ baseline score | -0.35 | 0.13 | 67.74 | [-0.61; -0.10] | -2.73 | 0.008 | 0.10 |
| Gender | -7.16 | 4.34 | 63.44 | [-15.84; 1.52] | -1.65 | 0.104 | 0.04 |
| PP Population | |||||||
| Intercept | 17.73 | 10.37 | 62 | [-2.99; 38.45] | 1.71 | 0.092 | |
| Group (IHM/CC) | -20.51 | 3.49 | 62 | [-27.47; -13.54] | -5.89 | <0.001 | 0.34 |
| PSQ baseline score | -0.28 | 0.14 | 62 | [-0.56; 0.01] | -1.96 | 0.055 | 0.06 |
| Gender | -5.79 | 4.85 | 62 | [-15.48; 3.90] | -1.20 | 0.237 | 0.02 |
Note: the table shows the estimated marginal means (± standard error and 95% confidence interval (CI)) for the intent-to-treat (ITT) and per-protocol (PP) populations, alongside the ANCOVA model results including the intercept, group (control group (CG) vs. intervention group (IHM)), perceived stress baseline score (PSQ) and gender as predictors. The associated p-value for each variable in the model indicates statistical significance, and partial eta squared (par. η²) reflects the effect size by representing the proportion of variance explained by that variable after accounting for other factors. For the ITT population, partial n² was calculated from multiply imputed data as the mean value across imputations.
Table 4.
Cross-over: Statistical results for the comparison between and within groups.
| Intervention group (n = 35) | Control group (n = 35) | Between groups | ANCOVA | ||||||||
|---|---|---|---|---|---|---|---|---|---|---|---|
| Mean | SD | ΔM0 | Cohen’s d | Mean | SD | ΔM0 | Cohen’s d | Mean difference ΔM0 [95% CI] |
Cohen’s d | Parameter est. for group [95% CI] | |
| PSQ total score ITT | |||||||||||
| M0 | 57.57 | 16.06 | 62.62 | 13.17 | |||||||
| M 3 | 46.54 | 20.72 | -11.03 | -0.80*** | 58.37 | 15.92 | -4.25 | -0.39* | -6.78 [-12.42; -1.14] | -0.54* | -7.64 [-12.94; -2.34] |
| M 6 | 38.83 | 22.23 | -18.74 | -0.99*** | 57.57 | 16.06 | -5.05 | -0.44* | -13.69 [-21.74; -5.64] | -0.88** | -15.23 [-22.36; -8.10] |
| M 9 | 45.68 | 21.70 | -11.89 | -0.69*** | |||||||
| M 12 | 35.80 | 18.58 | -21.77 | -1.57*** | |||||||
| Sensitivity analysis for PSQ total score PP | |||||||||||
| M 3 | 46.24 | 20.87 | -11.61 | -0.59*** | 58.38 | 15.96 | -4.41 | -0.29* | -6.67 [-12.10; -1.23] | -0.55* | -7.72 [-12.83; -2.60] |
| M 6 | 38.33 | 22.08 | -19.11 | -0.96*** | 57.57 | 16.06 | -5.05 | -0.34* | -13.78 [-22.04; -5.51] | -0.89** | -15.56 [-22.75; -8.36] |
| M 9 | 44.81 | 23.35 | -11.16 | -0.52** | |||||||
| M 12 | 34.47 | 18.07 | -21.60 | -1.22*** | |||||||
Note: this table summarises the results of dependent samples t-tests, which compare the new intervention group (IHM) with the control group (CG), and paired samples t-tests, which assess changes within groups over time. For each time point, the following are reported: mean scores (± standard deviation, SD); mean change scores from baseline (ΔM0); effect sizes (Cohen’s d: <0.05 small effect, 0.5–0.8 medium effect, >0.8 large effect); and p-values (significance: p < 0.05*, p < 0.01**, p < 0.001***). Between-group mean differences with 95% confidence intervals (CIs) are presented, along with the parameter estimate for the group factor from the ANCOVA model, adjusted for baseline scores and gender. SD values and Cohen's d for the intent-to-treat (ITT) population were calculated as the mean value across multiply imputed data. A sensitivity analysis based on the per protocol (PP) sample is also included. The sample sizes for the PP for each month are as follows: IHM: n = 35 for M0, n = 31 for M3, n = 30 for M6, n = 26 for M9, n = 25 for M12; CC: n = 34 for M3, n = 35 for M6 (data missing for one person between time points due to Corona).
Table 5.
Results for the main secondary outcomes.
| Intervention group (n = 38) | Control group (n = 39) | Between groups | ANCOVA | ||||||||
|---|---|---|---|---|---|---|---|---|---|---|---|
| Mean | SD | ΔM0 | Cohen’s d | Mean | SD | ΔM0 | Cohen’s d | Mean difference ΔM0 [95% CI] |
Cohen’s d |
Parameter est. for group [95% CI] | |
| Tedium-Measure (Burnout): total score | |||||||||||
| M0 | 4.19 | 0.54 | 4.33 | 0.54 | |||||||
| M 3 | 3.42 | 0.75 | -0.77 | -1.15*** | 4.19 | 0.71 | -0.14 | -0.25 | -0.63 [-0.92; -0.35] | -1.03*** | -0.69 [-0.98, -0.40] |
| M 6 | 2.99 | 0.71 | -1.20 | -1.50*** | 4.06 | 0.70 | -0.27 | -0.46** | -0.94 [-1.26; -0.61] | -1.34*** | -1.06 [-1.36, -0.75] |
| M 9 | 2.75 | 0.68 | -1.45 | -1.71*** | |||||||
| M 12 | 2.74 | 0.73 | -1.45 | -1.77*** | |||||||
| Psycho-vegetative complaints total score | |||||||||||
| M0 | 56.74 | 13.86 | 53.72 | 13.12 | |||||||
| M 3 | 41.92 | 14.01 | -14.82 | -1.03*** | 51.98 | 14.86 | -1.74 | -0.19 | -13.08 [-18.81; -7.35] | -1.08*** | -13.03 [-18.43, -7.63] |
| M 6 | 35.58 | 15.43 | -21.15 | -1.24*** | 50.77 | 15.08 | -2.94 | -0.25 | -18.21 [-25.06; -11.36] | -1.24*** | -17.99 [-24.34, -11.64] |
| M 9 | 34.41 | 14.12 | -22.33 | -1.25*** | |||||||
| M 12 | 31.07 | 14.45 | -25.67 | -1.48*** | |||||||
| ISR: total score | |||||||||||
| M0 | 1.13 | 0.51 | 1.07 | 0.42 | |||||||
| M 3 | 0.87 | 0.47 | -0.26 | -0.66*** | 1.07 | 0.47 | 0.00 | 0.01 | -0.27 [-0.44, -0.10] | -.072** | -0.29 [-0.44, -0.14] |
| M 6 | 0.72 | 0.43 | -0.41 | -0.85*** | 0.98 | 0.37 | -0.09 | -0.25 | -0.32 [-0.52, -0.12] | -0.76** | -0.33 [-0.48, -0.17] |
| M 9 | 0.66 | 0.41 | -0.47 | -0.99*** | |||||||
| M 12 | 0.53 | 0.36 | -0.61 | -1.21*** | |||||||
| WHO well-being index | |||||||||||
| M0 | 7.89 | 3.65 | 9.26 | 4.73 | |||||||
| M 3 | 12.86 | 5.28 | 4.97 | 0.95*** | 9.96 | 5.34 | 0.71 | 0.16 | 4.26 [1.94, 6.58] | 0.86*** | 3.85 [1.59, 6.11] |
| M 6 | 15.03 | 4.28 | 7.14 | 1.42*** | 9.67 | 5.18 | 0.41 | 0.08 | 6.73 [4.31, 9.15] | 1.28*** | 6.05 [3.88, 8.22] |
| M 9 | 14.61 | 5.92 | 6.71 | 1.13*** | |||||||
| M 12 | 15.82 | 4.25 | 7.92 | 1.65*** | |||||||
| Vitality | |||||||||||
| M0 | 35.00 | 15.55 | 37.69 | 15.34 | |||||||
| M 3 | 52.08 | 20.54 | 17.08 | 0.82*** | 40.31 | 20.59 | 2.62 | 0.17 | 14.46 [5.34, 23.59] | 0.79** | 14.79 [5.96, 23.62] |
| M 6 | 60.58 | 19.37 | 25.58 | 1.06*** | 40.17 | 19.06 | 2.47 | 0.15 | 23.10 [4.88, 13.35] | 1.11*** | 22.49 [13.66, 31.32] |
| M 9 | 60.05 | 22.37 | 25.05 | 1.03*** | |||||||
| M 12 | 63.55 | 18.44 | 28.55 | 1.17*** | |||||||
| Self-efficacy (SWOP) | |||||||||||
| M0 | 12.21 | 2.73 | 11.41 | 2.45 | |||||||
| M 3 | 13.26 | 2.70 | 1.05 | 0.47** | 12.12 | 2.33 | 0.71 | 0.37 | 0.34 [-0.73, 1.41] | 0.16 | 0.70 [-0.34, 1.75] |
| M 6 | 14.59 | 2.53 | 2.38 | 0.89*** | 11.83 | 2.28 | 0.42 | 0.19 | 1.96 [0.74, 3.17] | 0.78** | 2.49 [1.41, 3.56] |
| M 9 | 15.04 | 2.88 | 2.83 | 1.10*** | |||||||
| M 12 | 15.47 | 2.44 | 3.26 | 1.23*** | |||||||
| Sense of Coherence (SOC): total score | |||||||||||
| M0 | 54.53 | 9.16 | 54.54 | 9.44 | |||||||
| M 3 | 60.10 | 11.74 | 5.57 | 0.51** | 55.22 | 11.06 | 0.68 | 0.08 | 4.89 [0.25, 9.53] | 0.50* | 5.36 [0.85, 9.89] |
| M 6 | 64.61 | 11.59 | 10.08 | 1.01*** | 54.76 | 11.18 | 0.22 | 0.02 | 9.87 [5.00, 14.73] | 1.07*** | 10.04 [5.17, 14.91] |
| M 9 | 65.90 | 10.61 | 11.38 | 1.03*** | |||||||
| M 12 | 65.23 | 11.16 | 10.71 | 0.90*** | |||||||
| Life satisfaction (FLZ): total score | |||||||||||
| M0 | 33.34 | 27.37 | 29.97 | 26.70 | |||||||
| M 3 | 42.51 | 25.83 | 9.17 | 0.33. | 40.24 | 26.70 | 10.26 | 0.50** | -1.09 [13.32, 11.14] | -0.04 | 1.00 [-9.84, 11.84] |
| M 6 | 59.90 | 28.28 | 26.56 | 0.75*** | 33.13 | 26.40 | 3.16 | 0.16 | 23.40 [9.63, 37.16] | 0.81** | 27.53 [15.77, 39.30] |
| M 9 | 63.50 | 29.29 | 30.16 | 0.91*** | |||||||
| M 12 | 62.93 | 32.75 | 29.59 | .83*** | |||||||
| General mood state severity (VAS) | |||||||||||
| M0 | 58.82 | 15.24 | 53.69 | 15.12 | |||||||
| M 3 | 36.70 | 16.16 | -22.11 | -1.18*** | 51.33 | 20.87 | -2.37 | -0.11 | -19.75 [-29.29, -10.20] | -0.96*** | -17.45 [-26.08, -8.81] |
| M 6 | 29.88 | 14.92 | -28.93 | -1.45*** | 57.64 | 17.16 | 3.94 | 0.18 | -32.88 [-42.76, -22.99] | -1.58*** | -29.71 [-37.74, -21.68] |
| M 9 | 30.86 | 18.20 | -27.96 | -1.20*** | |||||||
| M 12 | 28.50 | 15.63 | -30.32 | -1.33*** | |||||||
Note: This table summarises the results of independent samples t-tests comparing the intervention group (IHM) and the control group (CG), as well as the results of paired samples t-tests assessing changes within each group over time. For each time point, the following are reported: mean scores (± standard deviation, SD); mean change scores from baseline (ΔM0); effect sizes (Cohen’s d: <0.05 small effect, 0.5–0.8 medium effect, >0.8 large effect); and p-values (significance: p < 0.05*, p < 0.01**, p < 0.001***). Between-group mean differences with 95% confidence intervals (CIs) are presented, along with the parameter estimate for the group factor from the ANCOVA model, adjusted for baseline scores and gender. All samples are based on the intent-to-treat (ITT) population. SD values and Cohen's d were calculated as the mean value across multiply imput.
Disclaimer/Publisher’s Note: The statements, opinions and data contained in all publications are solely those of the individual author(s) and contributor(s) and not of MDPI and/or the editor(s). MDPI and/or the editor(s) disclaim responsibility for any injury to people or property resulting from any ideas, methods, instructions or products referred to in the content. |
© 2025 by the authors. Licensee MDPI, Basel, Switzerland. This article is an open access article distributed under the terms and conditions of the Creative Commons Attribution (CC BY) license (http://creativecommons.org/licenses/by/4.0/).
Copyright: This open access article is published under a Creative Commons CC BY 4.0 license, which permit the free download, distribution, and reuse, provided that the author and preprint are cited in any reuse.


