Submitted:
31 October 2025
Posted:
03 November 2025
You are already at the latest version
Abstract
Spatial mobility is vital for the well-being of older adults. Lack of adequate transportation can limit their access to healthcare, services, and social opportunities. For older adults who do not or no longer drive, receiving rides is their primary mode of transportation, but this reliance can burden their ride providers. Measuring and assessing the geospatial burden of providing rides is important for research and policies that aim to address the impact on ride providers and older adults’ unmet travel needs. In this manuscript, we propose an approach that collects data to assess ride providers’ geospatial activity spaces for their own routine activities and for providing rides. By comparing the two activities spaces, we suggest a possible method to operationalize geospatial ride-providing burden, using three potential burden indicators. Using data from a pilot study (N = 18 ride providers), we apply these burden indicators and correlate them to other indicators of burden (i.e., days/month giving rides and monetary costs, missed work, increased per-sonal stress). We conclude that the percentage of the ride-provision activity space that is outside the ride provider's regular activity space may be a useful indicator of geospatial burden of providing rides.
Keywords:
geospatial mobility
; caregiver burden
; transportation
1. Introduction
An estimated 63 million people aged 65 and older lived in the United States in 2025, representing 19% of all U.S. residents. This number is expected to increase by 30% to 82 million by 2050, comprising 23% of the U.S. population (US Census Bureau, 2023). For adults aged 65 and older, the total Medicare expenditures in 2020 were $624 billion, with additional costs of $123 billion in Medicaid spending, $162 billion from private health insurance, $165 billion out-of-pocket spending, and $170 billion from other payers and programs (Centers for Medicare & Medicaid Services, 2024). Additionally, billions of dollars in unpaid informal care are provided to older adults; a study from 2014 valued this care at $522 billion per year (Chari et al., 2015). As a result, maintaining the health and wellbeing of this segment of the population is an important societal goal (Machina et al., 2020).
Geospatial mobility, or movement beyond one’s home to areas within a community and beyond (Webber et al., 2010), is critical for older adults’ physical and mental health, social inclusion, and full participation in life (Choi et al., 2020, Nordbakke & Schwanen, 2014). Older adults’ geospatial mobility is associated with better physical and mental health and lower levels of depression and loneliness (Baker et al., 2003, Chung et al., 2022, Kalu et al., 2022). While transportation to destinations outside the home is essential to fulfilling basic needs for quality of life, older Americans often face significant challenges in accessing reliable transportation options. With increased age, the experience of unmet travel needs (i.e., not having transportation to desired locations) becomes more common (Luiu et al., 2017), especially for people who have aged into disabling conditions that make driving themselves or using public transportation difficult or impossible (Che Had et al., 2023, Wood et al., 2023). For example, people with dementia need transportation that is not only affordable but also provided in circumstances that are low in stress, noise, and navigation complexity, and by ride providers who are understanding, patient, and empathetic (Lanthier-Labonté et al., 2024).
1.1. U.S. Policy to Meet the Travel Needs of Older Adults
In the United States, the main policy response for people with disabilities including age-related functional limitations that prevent them from using fixed route public transportation is the Americans with Disabilities Act (ADA) mandate for paratransit services. ADA paratransit services consist of origin-to-destination transportation—often in vehicles such as wheelchair-accessible vans or small buses with lifts or ramps—in locations within a designated paratransit zone, usually defined as a ¾ mile buffer around fixed route public transportation (National Rural Transit Assistance Program, 2024). The cost to the public to provide ADA paratransit services can be astonishingly high; a study of costs from 2013 to 2018 in five Texas cities found the average operational cost of taking one person to a common destination (e.g., ‘grocery store or doctor or church’) was $88 in 2018 (Cooperative Mobility for Competitive Megaregions, n.d.).
Despite the provision of these costly services, the transportation needs of many older adults in the United States are unfulfilled (Luiu et al., 2017). Paratransit services may be considered an unattractive way to fulfill these needs because they are geographically limited, require booking in advance, are inconsistent and unreliable, are considered inconvenient, have high variability in terms of travel times per trip, often have long wait times, and may limit the number of non-disabled companions who may accompany the older adults (Feeley et al., 2016, Akcicek et al., 2024, Federal Transit Administration, n.d.). Moreover, most older adults, especially those in suburban and rural areas, are accustomed to transportation using private automobiles, which offer convenience, independence, and even a sense of self-identify (Ryvicker et al., 2020, Chihuri et al., 2016, Sanford et al., 2020). In general, older adults in the United States prefer using private automobiles for transportation over other forms of transportation, and getting rides from others is a common form of transportation (Choi & DiNitto, 2015, Jones et al., 2018). Policy solutions to older adults’ transportation needs should consider the role of private ride provision due to its potential cost savings, efficiencies, and alignment with the practices, preferences, and needs of older adults.
This manuscript seeks to build preliminary knowledge and capacity for conducting research and considering new policy approaches by exploring ways to assess and operationalize the geospatial burden of providing rides for older adults. Research related to the operationalization and assessment of transportation burden is a necessary first step in considering subsidies, reimbursement, or other ways to support private ride provision for older adults’ transportation.
1.2. Private Rides Given to Older Adults
For older adults who cannot drive themselves to destinations, getting rides from others in their informal and formal care networks is the most common and preferred alternate mode of transportation (Jones et al., 2018, Choi & DiNitto, 2015, Kim, 2011). Within these networks, family members and friends are the primary source of rides (Bird et al., 2017). Survey research of a sample of 1103 nationally representative Medicare recipients with at least one caregiver found caregivers were an average of 62 years old (SD = 14.3) and tended to be adult children (51%) or spouses (22%) and most (55%) lived with the care recipient (Koumoutzis & Vivoda, 2023). A survey of a random sample of 268 informal caregivers in Michigan (Mage = 61 years; SD = 9.4 years) who provided transportation for their care recipients found that 82% of the transportation providers were relatives (53% children, 6% spouses, 20% other family) and 18% were friends (Eby et al., 2017).
Among primary caregivers who provided older Medicare recipients with rides across the United States, almost one-third (31%) reported providing rides every day or most days per week (Koumoutzis & Vivoda, 2023). For U.S. residents who provide care to older adults, approximately 16% of the time they spend daily in routine travel is transporting their care recipient (Kim, 2025). Ride-providers provide transportation less frequently to older adults with high levels of support needs (Koumoutzis & Vivoda, 2023), perhaps because of the added complexities of transporting someone with high levels of functional limitations. A study using the same nationally representative dataset found that caregivers who provided regular transportation spent more total hours per week in caregiving tasks (Koumoutzis et al., 2022), suggesting increased burden for those who provided rides to an older care recipient. In Michigan, almost half (47%) of transportation providers surveyed worked outside the home for pay (Eby et al., 2017). For this group, the increased caregiving hours associated with providing transportation could take an even greater toll. Among a nationally representative sample of Millennials (those born from 1980 to 1998 and aged 18 through 34 at the time of the study) who provided care to an older adult with dementia, transportation was the most common type of assistance, reported by 79% of the caregivers (Vega et al., 2017). A large majority of the Millennial caregivers (84%) lived in a different household from the older adult care recipient and 16% reported having to drive over an hour to get to the house of the person living with dementia. They indicated emotional distress and missing work were consequences of their caregiving. Providing transportation assistance to the care recipient may have positive effects such as acknowledgement of emotional and loving bonds, but it can also present challenges for the ride provider, including disruption of the ride provider’s own pursuits, scheduling conflicts, missed work, increased stress, feelings of pressure related to a sense of obligation, strain on familial roles, and even changes in living situations (Liang et al., 2015, Taylor & Tripodes, 2001).
Older adults are likely aware of these difficulties. They have reported a reticence for asking for rides out of concern for being a burden or an inconvenience or recognizing that ride providers may not be able to reliably and consistently provide rides (Bayne et al., 2021, Ragland et al., 2019). As a result, they may limit or delay trips outside the home (Murray & Musselwhite, 2019), which could lead to erosion of wellbeing (Choi et al., 2020, Nordbakke & Schwanen, 2014).
1.3. Assessing Ride Provider Burden
Although providing transportation to older adults can pose challenges and add burden for their ride providers, a few transportation-specific tools for quantifying the burden exist. Price (2014) developed a 34-item scale for providers to self-report the degree of their burden with items such as, “Providing transportation for my loved one feels confining to me,” “Providing transportation for my loved one tries my patience,” and “I cannot afford to pay for transportation assistance for my loved one” (pp. 107-114). These items capture a holistic perspective of burden ranging from emotional and mental to financial. However, they do not account for the concept of accessibility in terms of the extent to which the ride provider can easily reach the older adult and their travel destinations. If the older adult and their destinations are more accessible, the ride provider will likely be able to provide rides with greater frequency and less personal sacrifice.
For research and policy directly related to financial and time costs of providers, quantifying the accessibility of the locations to which an older adult is transported is critical. Several different approaches are used to assessing accessibility to types of destinations (e.g., healthcare facilities), including distance, travel time, the number of opportunities (e.g., service providers/locations) within a specified distance or travel time from one’s home, and the number of opportunities within an area based on an individual’s routine activities (Sherman et al., 2005). Distance and travel time to a ride recipient’s destinations have limitations as measures of a ride provider’s burden because they do not account for the routine travel of the ride provider. For instance, a 10-mile drive to take someone to a medical appointment has greater burden on the ride provider if the facility is in the opposite direction of the ride provider’s work location. However, if the ride provider works 10 miles away and the healthcare facility is one block from their work, the 10-mile drive would be much more accessible for the driver. Similarly, considering the number of opportunities within a certain time or distance constraint using a cumulative opportunity approach (Horner et al., 2015), may not be appropriate as the concern is not how many opportunities the ride provider can access for themselves, but rather how easily the ride provider can access a destination determined by the older adult’s preferences and needs (e.g., a neighborhood senior center where they have long-standing social connections). To address these limitations, we propose an approach that considers the routine travel patterns of the ride provider when assessing levels of geospatial accessibility and, consequently, ride-provider burden.
1.3.1. Activity Spaces
To consider the routine travel of a ride provider when assessing their potential ride-providing burden, we use the concept of an activity space. An activity space is the local geographical area in which a person moves during their day-to-day routine activities (Sherman et al., 2005). It can be perceived as the movement near one’s home, movement for routine activities, and movement around and through the areas in which routine activities occur (Kamruzzaman & Hine, 2012). An activity space can be a better representation of a person’s true neighborhood in terms of movement patterns than the boundaries of a residential neighborhood (York Cornwell & Cagney, 2017). Activity spaces have been used to examine geospatial accessibility of opportunities because they help understand what is accessible, or nearby, in terms of the everyday local environment of a person (Gesler & Meade, 1988, Sherman et al., 2005).
Activity spaces can be represented in several ways (Sherman et al., 2005, Kamruzzaman & Hine, 2012, Schönfelder & Axhausen, 2003), and a comparison of methods (Sherman et al., 2005) suggests two of the best for understanding accessibility are the one standard deviation ellipse (SDE1) and the road network buffer (RNB). A standard deviation ellipse is an area similar in shape to an ellipse on a map that is centered on the geographic mean location of a person’s regular activities (Yuill, 1971), and a SDE1 contains approximately 68% of a person’s activities (Sherman et al., 2005).
A RNB creates a buffer (e.g., 1 kilometer or a half mile) around the roads connecting the locations of regular activities (Sherman et al., 2005).
1.4. Gaps in Knowledge and the Current Study
Despite the potentially harmful individual and societal consequences of both unmet travel needs for older adults and ride-providing burden for ride providers, few studies have explored how best to measure transportation burden and even fewer, if any, have used geospatial accessibility approaches to understanding the potential burden of providing transportation to older adults. To fill these knowledge gaps, this study uses the concept of activity spaces to assess geospatial transportation-providing burden using data from a study of transportation among older Vietnamese adults in the Dallas-Fort Worth metroplex. Using survey data from ride providers to calculate the area of two types of activity spaces—ride providers’ (1) regular activity space and (2) ride-provision activity space—the study has two main aims:
- To propose and calculate metrics (i.e., burden indicators) for assessing the geospatial burden of providing rides using the concept of activity spaces;
- To evaluate the association of the proposed burden indicators with each other and with impacts of providing rides.
2. Materials and Methods
This exploratory, pilot study used a cross-sectional survey research design. The study focused on two types of activity spaces for the ride providers. The first was the activity space of their routine activities, an activity space that has commonly been used in previous research (Sherman et al., 2005, Szanton et al., 2023). The second was a ride-provision activity space conceived to capture the geospatial area in which ride providers routinely travel to give rides. We then used these two activity spaces to operationalize three separate indicators of geospatial ride-providing burden, and explored their association with each other, frequency of ride provision, and ride-provision impacts. All aspects of the research were reviewed and approved by The University of Texas at Arlington Institutional Review Board, protocol #2019-0454.
2.1. Recruitment and Data Collection
We recruited and collected data in the Dallas-Fort Worth-Arlington metropolitan area (DFW metroplex or DFW) from July 2020 to January 2021. Ride providers were eligible to participate in the study if they were at least aged 18 years old, spoke either Vietnamese or English, and provided a ride to a Vietnamese adult aged 65 or older. Recruitment for this study was initially connected to a parent study of older Vietnamese immigrants in the Dallas-Fort Worth metroplex (Lee et al., 2022, Mauldin et al., 2024). When older adults in the parent study indicated they had a ride provider, they were asked to provide contact information for the people who provided them rides in private automobiles so the ride provider could be invited to participate in a survey of ride providers. Due to the low number of participants in the parent study who received rides from others, we expanded recruitment for the ride provider survey research to include anyone who provided rides to an older Vietnamese adult in the Dallas-Fort Worth metroplex. The expanded recruitment efforts included snowball sampling, outreach to student groups at a local university, and flyers posted at various locations commonly used by Vietnamese residents such as Asian grocery stores and shopping centers, churches, temples, and gyms. Initially, study participants were compensated with a $10 Walmart gift card. This was increased to $20 in October 2020 to assist with recruitment.
Data were collected over the telephone using interviewer-administered questionnaires in either Vietnamese or English as preferred by the participant using Qualtrics survey software. The questionnaires were initially developed in English, translated into Vietnamese by a bilingual native Vietnamese research team member, and back-translated into English by another bilingual native Vietnamese research team member. The original and back-translated English versions were compared by the two translators and the Principal Investigator, who identified discrepancies, and the Vietnamese translation was revised by consensus between the two translators. The interviews took approximately 20 minutes.
We collected data from 20 ride providers. Of these, 18 provided complete information to construct regular activity spaces and comprise the sample for this study. Nine of the 18 participants (50%) conducted their interview in Vietnamese, the remaining nine (50%) in Vietnamese.
2.2. Measures
Demographic data were collected by self-report on the questionnaire for the ride provider’s age, gender, marital status, education, country of birth, length of time in the United States if born elsewhere, ethnicity, primary language spoken at home, and monthly household income (in dollars).
2.2.1. Modes of Transportation
One survey item, “Do you or someone in your household own an automobile?” as-sessed household automobile ownership with option responses 1=Yes, I own a working automobile, 2=Yes, I own an automobile, but it does not work, 3=Yes, someone in my house owns a working automobile, 4=Yes, someone in my house owns an automobile, but it does not work, 5=No. An additional item asked participants to select all modes of transportation they used, including 1=Walking, 2=Drive myself, 3=Get a ride with someone else, 4=City bus or other public transportation, 5=Taxi or ridesharing, 6=Paratransit, 7=Other. For each mode selected, participants were asked to provide the frequency with which they used each mode (1=More than once per day, 2=Once per day, 3=More than once per week, 4=Once per week, 5=A few times per month, 6=Once per month, 7=Less than once per month).
2.2.2. Routine Activities
To construct the ride provider’s regular activity space, the questionnaire included two dimensions of activity space: locations of residence and destinations for routine activities. Items similar to those on the VERITAS questionnaire (Chaix et al., 2012) were used to obtain information about the frequency and location of activities over the time span of the previous month. Participants were asked to report on their routine activities with a question that asked, "Which of the following activities do you do routinely, at least once a month?" A list of 20 potential activities such as grocery shopping, visit friend or family member, eat out, church or other religious activity, exercise, health care facility, etc. was provided. Participants could also write in other routine activities that were not on the list.
For each activity selected, participants provided the frequency (0-30 days/month) and the location of the activity. To collect the location, we used the Google Maps integra-tion feature in Qualtrics. Data collectors were able to type in a precise address if the in-formation was available. If the participant was not able or did not wish to provide an exact location, the data collector could place a Google Maps pin at a nearby cross street location. The data were stored as latitude/longitude coordinates.
2.2.3. Rides Provided to Older Adult
Constructing ride-provision activity spaces required the locations of the places where the ride provides took the older adult and the frequency of the rides. A series of items on the questionnaire assessed the location and frequency of giving rides to the old-er adult for the same set of routine activities as for the ride-provider’s regular activity space including write-in options. The data were entered into Qualtrics using the Google Maps integration feature described above and were recorded as latitude/longitude coordinates. The frequency with which rides were given was assessed with a single item asking, “How many days each month do you give rides to [ride recipient’s name].”
2.2.4. Impacts of Providing Rides
We assessed several potential negative effects associated with providing rides to an older adult by asking the participants to select as many impacts as applied from a list of potential impacts that included (1) I have incurred transportation related expenses (gasoline, tolls, parking, etc.); (2) I have missed work; (3) I have missed my own physical or mental healthcare appointments; (4) increased personal stress; (5) increased family stress; and (6) other. If at least one of these was selected, an impact of providing rides existed (0 = no; 1 = yes).
Monthly Expense of Providing Rides. For those who indicated they incurred transportation-related expenses, a follow up question asked: "Approximately what are your total monthly transportation-related expenses (gasoline, tolls, parking, etc.) that you have incurred as a result of providing transportation to [older person]?" as a continuous variable in dollars per month.
2.3. Analysis
All analyses other than geospatial analyses were conducted in SPSS Version 29. Descriptive statistics for the sample’s demographic characteristics, transportation characteristics, and routine activities were calculated using means, standard deviations, frequencies and percentages. To meet the first aim of this study (proposing and calculating metrics, or burden indicators, for assessing the geospatial burden of providing rides using the concept of activity spaces), we conducted geospatial analyses to construct and evaluate the participants’ regular activity spaces and ride-provision activity spaces. For our second aim-—evaluating the association of the proposed burden indicators with each other and with impacts of providing rides—we conducted bivariate correlational analyses of each proposed indicator with the frequency of giving rides and reporting an impact of providing rides.
2.3.1. Geospatial Analyses
We conducted geospatial analyses for this study using ArcGIS Pro 3.0 (ESRI, 2022). Regular and ride-provision activity spaces were constructed using the location and frequency of locations described in the measures section above. Finally, to propose metrics for the geospatial burden of providing rides, we examined the overlap of participant’s regular activity space and their ride-provision activity space. Using this geospatial overlap, we propose three different approaches for evaluating the geospatial burden of giving rides (i.e., "burden indicators)," which provide different conceptualizations of the extent to which the ride provider must leave their own regular activity space to provide rides.
2.3.2. Estimating Regular Activity Spaces
Using ArcGIS, we translated the survey latitude/longitude data related to regular monthly destination points into geographic locations. Each of the 18 participants provided a home address and at least two routine activity locations (i.e., three geographic locations). We weighted the locations using the frequency (i.e., number of days per month) of travel to each location (Gesler & Meade, 1988), with the home address having a weight of 30 days.
After all the weighted activity locations for a respondent were mapped in ArcGIS, we generated the SDE1 using the directional distribution function within the spatial statistics tools in ArcGIS. This procedure measures x and y distance separately and calculates the mean x and y center point for the activity space. Using the center point, the process rotates the x-axis and creates orthogonal vectors projected from the center point with a length denoted by the standard deviation for this axis rotation. Therefore, two times the minimum standard deviation became the SDE1 minor axis length, and two times the maximum standard deviation became the SDE1 major axis length (Yuill, 1971). Figure 1 provides an example of a ride provider’s SDE1 regular activity space.
2.3.3. Ride-Provision Activity Spaces
The ride-provision activity space considers the locations of the activities where rides are provided to the older adult. Twelve participants had more than two locations to which they transported an older adult; for them, we created SDE1 ride-provision activity spaces using the locations of the activities where rides were provided and, when available, the older adult’s home address (n = 9). The location of each activity was weighted by the frequency of providing rides to that location, and the home address was weighted by the frequency associated with the most frequent activity for which rides were provided. In Figure 2, we present an example of the SDE1 regular activity space and SDE1 ride-provision activity space for one ride provider.
For participants with only two geographic locations (n = 6), we represented the activity space with a half-mile road network buffer to approximate the size of the one-kilometer road buffer network used by Sherman et al. (2005). For these cases, we created the shortest path between these two points using the Network Analyst function in ArcGIS. After uploading the node junction (ND junction), edge (ND junction Edges), and point files into ArcGIS, we processed one ID at a time. The Closest Facility option in the Network Analysis tab selects the closest location for one trip end and removes any barriers. The Multiple Ring Buffer tool creates a 0.5-mile radius “multiple ring buffer” along the shortest path to represent the activity space.
2.3.4. Metrics for Estimating the Geospatial Burden of Providing Rides
We developed three indicators for the geospatial burden of providing rides to an older adult. These indicators are presented below as Burden Indicators A, B, and C. For each, we calculated the mean, standard deviation, 5% trimmed mean, minimum, and maximum.
Burden Indicator A: Size of Ride-Provision Activity Space. The size of the ride-provision activity space may indicate geospatial burden for the ride provider. Giving rides in a small, clustered area is likely easier than across a sprawling geospatial area. To account for this, Burden Indicator A (BIA) is the area of the ride-provision activity space in square miles. We calculated the area of the ride-provision polygon in square miles using automated tools within ArcGIS.
Burden Indicator B: Percentage of Ride-Provision Activity Space that is Not Accessible to the Ride Provider. The second indicator (Burden Indicator B) is an extension of the concept of accessibility (Sherman et al., 2005). Burden Indicator B is conceptualized as the percentage of ride-provision activity space not accessible to the ride provider, with accessible defined by any location within the boundaries of the ride provider’s regular activity space (Sherman et al., 2005). This calculation required determining the areas of overlap of the ride providers’ regular activity space with their ride-provision activity space. Figure 3 graphically depicts this using shaded areas of the SDE1s.
As shown in Figure 3:
| G + C | = | The area of the ride provider’s ride-provision activity space |
| S + C | = | The area of the ride provider’s regular activity space |
| G | = | The area of the ride-provision does not fall within the boundaries of the ride provider’s regular activity space; under the conceptualization of Burden Indicator B, G is considered "inaccessible." |
| C | = | The area that is common to both the ride provider’s regular activity space and ride-provision activity space |
Using the notation above, the formula (equation 1) for Burden Indicator B (BIB) is:
Burden Indicator C: Ratio of Inaccessible Ride-Provision Activity Space to Ride Provider’s Regular Activity Space. The final burden indicator provides an assessment of how large the burden of providing trips outside the ride provider’s regular activity space is in respect to the size of their regular activity space. The rationale for this is that if a ride provider has a large activity space, they may be accustomed to traveling long distances for their routine activities. In this case, taking on additional distances for providing rides may be less burdensome than for those with smaller regular activity spaces.
To operationalize Burden Indicator C, we divide the area of the ride-provision ac-tivity space that is outside the regular activity space by the area of the regular activity space. Using the notation presented in the section above, the formula for Burden Indica-tor C (BIC) is equation 2:
2.3.5. The Association of the Burden Indicators, Frequency of Providing Rides, and Reported Impacts of Providing Rides
To evaluate the association of the proposed burden indicators with each other and with impacts of providing rides (aim 2), we calculated bivariate correlations among the burden indicators and the frequency of providing rides each month. We used Spearman’s rho correlation coefficient due to violations of assumptions of normality in the data. We also calculated a nonparametric point-biserial correlation coefficient using Spearman’s rho for the association of having reported any impact of providing rides with the burden indicators and the frequency of providing rides.
Confidence intervals for the correlation coefficients were estimated using a bi-as-corrected and accelerated bootstrap approach with 5,000 samples. Statistical significance was determined using α = .05. Pairwise deletion was used to handle missing data.
3. Results
The sample’s demographic characteristics are presented in Table 1. The ride providers all identified as Vietnamese, and almost all (90%) spoke Vietnamese as their primary language at home. The sample was fairly evenly distributed in terms of gender, age, and marital status, and immigrant status. Most had a high school diploma or less education. Their average monthly household income was low (M = $2,102/month; SD = $1,763.50).
3.1. The Sample’s Transportation-Related and Regular Activity Space Characteristics
Table 2 presents descriptive statistics for the sample’s transportation-related and regular activity space characteristics. A large percentage of the ride providers (n = 16, 89%) owned a working automobile and all drove themselves for transportation. The average area of the regular activity space was 44.36 square miles (SD = 55.24 square miles).
3.2. Ride-Provision Activity Spaces and Characteristics
The average area of the ride-provision activity spaces was 34.13 square miles (SD = 74.9 square miles). For most ride providers (n = 11, 61.1%), the ride-provision activity space was smaller than their regular activity space.
The ride providers reported taking the older adult to a range of one to nine types of activities, with a mean of 2.9 types of routine activities per ride provider (SD = 2.03). They reported providing rides between two and 30 days per month, with an average of providing rides 11.4 days per month (SD = 8.6 days). The most common type of ride provided was for grocery shopping (n = 11, 61%); rides to the grocery store were provided, on average, approximately once per week (M = 4.3 rides per month; SD = 1.9 rides). Over half of the ride providers (n = 10, 55.6%) gave routine rides to a health care facility, on an average of twice per month (SD = 2.3). A substantial minority gave rides to religious ser-vices (n = 7, 39%) and for visiting friends and family (n = 5, 28%). Although fewer ride providers gave rides to work, the average number of trips for work was relatively high compared to the other types of rides (M = 14.7 rides/month, SD = 11.7). Table 3 presents additional details about each type of activity for which they provided rides.
3.3. Impact of Providing Rides
Half of the ride providers (n = 9) indicated they experienced no impact from providing rides to an older adult. The other half reported they had incurred transportation expenses (n = 7, 39.9%), missed work (n = 3, 16.7%), and/or experienced increased personal stress (n = 2, 11.1%) as a result providing rides. None of the ride providers reported missing their own healthcare appointments or increased family stress because of providing rides. Among the ride providers who reported incurring transportation expenses, the average monthly expenditure was $77.14 per month (SD = $44.15). The smallest reported monthly expense was $10 and the largest was $120.
3.4. Geospatial Burden Indicators for Providing Rides
Based on the participant’s regular and ride-provision activity spaces, we calculated the three different burden indicators (A, B, and C) to assess the geospatial impact of providing rides.
Burden Indicator A (BIA) is the area of the ride provision-activity space. The smallest BIA value was .17 square miles and the largest was 279.5 square miles. On average, BIA was 34 square miles (SD = 74.9 square miles, 5% trimmed mean = 22.38 square miles). The distribution of values for BIA was highly skewed (skewness = 2.857) and contained two outliers with particularly large ride-provision activity spaces (279.5 square miles and 188.9 square miles, respectively)
Burden Indicator B (BIB) is the percentage of ride-provision activity space that is not accessible to the ride provider, as defined by being located within the boundaries of the ride provider’s regular activity space. The values for BIB ranged from 0% to 99.6%, with a mean of 49.42% (SD = 40.48%, 5% trimmed mean = 49.38%) of the ride-provision activity space inaccessible to the ride provider. The distribution of BIB scores approximated a normal distribution, only slightly skewed (skewness = -.116), and contained no outliers.
Burden Indicator C (BIC) is the ratio of the area of the ride-provision activity space that was outside the ride provider’s regular activity space to the area of the regular activity space. The mean value of BIC was 4.44 (SD = 14.57, 5% trimmed mean = 1.50). Most of the ratios (n = 13, 72%) were less than 1.0, indicating the area of the inaccessible ride-provision activity space was smaller than the ride provider’s regular activity space. However, a substantial minority (n = 5, 28%) had BIC values greater than 1, indicating the inaccessible ride-provision activity space was larger than their regular activity space. The distribution of values for BIC was highly skewed (skewness = 16.555). Most of the BIC scores (n = 13, 72.2%) ranged from 0 to 1; however, there were two outliers with ratios of 11.6 and 61.8, respectively.
3.1. Correlation of Geospatial Burden Indicators, Frequency of Providing Rides, and Monthly Expenses for Providing Rides
We examined the correlations of the geospatial burden indicators and present results in Table 4. There was a large and significant correlation (ρ = .579, p = .012) between BIA (the area of the ride-provision activity space) and BIC (the ratio of the inaccessible portion of the ride-provision activity space to the size of the regular activity space). The correlation between BIB (the percentage of ride-provision activity space that is not accessible to the ride provider) and BIC was even larger (ρ = .864, p < .001). Although the correlation between BIB and BIA was moderate, it was not statistically significant (ρ = .352, p = .152).
- 1–2: Bias = –.016, SE = .233, 95% CI [–.180, .720]
- 1–3: Bias = –.023, SE = .208, 95% CI [.095, .872]
- 1–4: Bias = .005, SE = .224, 95% CI [–.513, .310]
- 1–5: Bias = .011, SE = .249, 95% CI [–.731, .275]
- 2–3: Bias = –.024, SE = .098, 95% CI [.635, .958]
- 2–4: Bias = .009, SE = .264, 95% CI [–.704, .219]
- 2–5: Bias = .002, SE = .258, 95% CI [–.499, .548]
- 3–4: Bias = .008, SE = .247, 95% CI [–.590, .263]
- 3–5: Bias = .006, SE = .250, 95% CI [–.665, .337]
- 4–5: Bias = .003, SE = .281, 95% CI [–.642, .472]
4. Discussion
Previous studies pair the concept of regular activity spaces with geospatial analysis to investigate accessibility to services; however, this study introduces the concept of examining the relationship between a ride provider’s regular activity space and their ride-provision activity spaces to explore the geospatial burden of providing rides. From a selection of potential methods (Schönfelder & Axhausen, 2003), this paper relies on an ellipse-based method for evaluating activity space when possible because this approach measures a total area of potential activity rather than the alternative methods that utilize a geospatial grid or a shortest path network based on existing activity patterns. The ellipse provides stronger support for trip chaining that deviates from one’s current activity pattern, which makes it suitable for assessing the interaction between activity spaces.
This paper proposes three potential indicators of geospatial burden by assessing the interaction between the ride provider’s regular activity space and their ride-provision activity space. The results section compares them to one another and examines each indicator’s association with reported impacts of providing rides. Based on its positive association with impacts of providing rides, Burden Indicator B (the percentage of the ride-giving activity space that was outside the ride provider’s regular activity space) outperformed the other burden indicators. In addition, it was not affected by outliers as were the other two burden indicators. In the sample, the other burden indicators were negatively associated with reporting an impact, and Burden Indicator B was the only burden indicator that performed in the way expected in terms of having a positive association with impacts from providing rides. Burden Indicator B was only moderately correlated with Burden Indicator A (the size of the ride-provision activity space), suggests the two approaches are similar, but reflect of true construct differences.
Burden Indicator B may be a reasonable "all-purpose" burden indicator that is somewhat analogous to traditional ways of assessing accessibility as locations within a regular activity space (Sherman et al., 2005) with the exception that it examines an area of square miles rather than single geospatial points. A moderate negative correlation between Burden Indicator B and the days per month providing rides occurs. A plausible explanation for this is that the percentage of ride-provision activity space that is outside the boundaries of the regular activity space poses a substantial burden for providing rides and reduces the ride provider’s ability to give rides. Although exploratory, the study suggests that assessing the geospatial burden of providing rides through a self-report of activities and their locations may be a feasible approach.
The ellipse approach provides a strong method for defining an activity space beyond specific activity point locations. For each of the burden indicators, greater levels of burden were associated with fewer rides per month, which indicates that all the travel needs of the older care recipient may not be met. While GPS tracking potentially represents the most effective method for gathering activity space data for care providers (Kestens et al., 2018), it represents a poor method for gathering data for a ride-provision space because it will not capture unserved travel to desired or necessary activities. Furthermore, if care providers must forego travel to provide transportation to an older care recipient, a GPS track will likely be unable to capture their preferred, but unrealized, activity spaces. Populations at risk for transportation disadvantage need alternative data collection strategies that capture their latent demand and missed trips (Fields et al., 2021). One App, MyAmble, shows promise on collecting a full set of completed, desired and necessary activities with their point locations (Fields et al., 2022). This approach also supports separating trips associated with caregiving from the regular activity pattern of a care provider.
In this study, all the ride-providers for the older adults identified as Vietnamese, and most spoke Vietnamese as their primary language. This suggests the importance of ride-providers having a strong cultural and linguistic match with the older adults for whom they are providing rides, something that has been identified as a weakness in many paratransit services (Salkas, 2019). Alternative approaches are suggested by Petry et al. (2024), who propose providing services and subsidies that target the excess burden experienced by older caregivers. Their strategies include more frequent use of community health workers to provide care, normalizing respite care for older caregivers, and providing financial compensation directly to older caregivers. These approaches involve direct payments to care providers, including ride providers, and the findings from this study can support the development and implementation of such strategies in policy and practice.
Geospatial evaluation of providing rides likely represents an appropriate way to understand the burden of ride provision and assess eligibility for potential subsidies and services. The burden indicator combined with socioeconomic factors may be used to prioritize financial subsidies and services. To implement services and subsidies for ride providers, agencies could use assessment tools that collect data about routine activities, including the frequency and location of the activities for the regular and ride-provision activity spaces. Geospatial software tools (e.g., a ride-provision burden app potentially extended from the current MyAmble app (Fields et al., 2022) could be developed to quickly understand accessibility and burden. The tool could also be programmed to provide alternative options for services such as banking that might be located more conveniently for the ride provider and older person. Aggregated data from such an app could provide valuable data for city planners, housing authorities, and the business sector to locate services and housing that may be co-located near older adult care recipients and/or their caregivers.
4.1. Limitations and Future Directions
The main limitations of the reported results are the small sample size of ride providers and the lack of random sampling; however, the study still demonstrates the potential effectiveness of the method of formulating a burden indicator. The reported results require replication with a larger sample. A larger sample size and random sampling would increase generalizability and support increased assessments of factors associated with greater geospatial burden, including land use policies, cultural variation (e.g., differences in acculturation and sense of filial responsibility), individual circumstances (e.g., financial means) and negative impacts on ride providers. It is also important to note that the construction of the ride-provision activity spaces varied depending on the number of locations the ride-provider gave rides to and could result in a SDE1 or a RBN activity space.
Future research must capture when care providers use paratransit, ride hailing, and public transportation to provide transportation for the care recipients because these modes may pose an even more significant burden on care providers due to their high costs or high travel times. Enhanced qualitative data collection would allow researchers to add context for the transportation behaviors and assess the willingness of care recipients to use alternate modes of transportation. Future research should also investigate the trip origins and trip chaining behaviors of the care providers. For example, for younger (working age) ride providers, many of the trips may be initiated from work rather than home. Rides provided for different activities (e.g., grocery shopping compared to health care) have different flexibility in timing and trip sequencing and likely represent different temporal or geospatial burdens. The transportation burdens may be combined with socioeconomic indicators to develop a comprehensive or normalized burden indicator that serves a composite indicator for the need for services or subsidies. Additional related research could examine the feasibility of software applications for creating and assessing regular and ride-provision activity spaces. As the numbers of older adults in the United States grow, they require transportation solutions that allow them to access activities like health care, healthy food, and social opportunities, and achieve an overall well-being and quality of life. This study represents an important preliminary investigation to quantify the burden experienced by care providers when they try to meet the travel needs of an older care recipient.
5. Conclusions
As researchers, practitioners, and policy makers seek solutions to the problems of providing adequate and safe transportation to older adults, innovative approaches are warranted. The recognition of the importance of defining and assessing ride-providing burden to explore supports for one of the most important sources of transportation for older adults—private ride providers—is the basis for this research. Geospatial approaches to assessing ride-providing burden capture a wholistic conceptualization of the experiences of providing rides, and using activity spaces to understand accessibility and burden is promising.
Author Contributions
Conceptualization, Rebecca L. Mauldin and Stephen P. Mattingly; methodology, Rebecca L. Mauldin and Stephen P. Mattingly; formal analysis, Mahshid Haque and Rebecca L. Mauldin; investigation, Rebecca L. Mattingly, Stephen P. Mattingly, and Rupal Parekh; data curation, Rebecca L. Mauldin; writing—original draft preparation, Rebecca L. Mauldin, Stephen P. Mattingly, Soeun Jang, Swasati Handique, Mahshid Haque, and Rupal Parekh; writing—review & editing, Rebecca L. Mauldin, Stephen P. Mattingly, Soeun Jang, Swasati Handique, Mahshid Haque, and Rupal Parekh; supervision, Rebecca L. Mauldin and Stephen P. Mattingly; project administration, Rebecca L. Mauldin; funding acquisition, Rebecca L. Mauldin, Stephen P. Mattingly, and Rupal Parekh. All authors have read and agreed to the published version of the manuscript.
Funding
This research was funded by The National Institute for Transportation and Communities, a U.S. DOT University Transportation Center, under grant number 1302.
Data Availability Statement
The datasets presented in this article are not readily available due to privacy concerns because the data contain home addresses of research participants and ride recipients. Requests to access the dataset should be directed to rebecca.mauldin@uta.edu.
Conflicts of Interest
The authors declare no conflicts of interest. The funders had no role in the design of the study; in the collection, analyses, or interpretation of data; in the writing of the manuscript; or in the decision to publish the results.
References
- 49 CFR § 37.
- 49 CFR § 37.131(a)(1)(i).
- Akcicek, C., Misra, A., Shirgaokar, M. & Marshall, W., 2024. How time inefficient and uncertain are paratransit trips compared to car trips. Transportation Research Record, 2678, 272-285.
- Baker, P. S., Bodner, E. V. & Allman, R. M., 2003. Measuring life-space mobility in community-dwelling older adults. Journal of the American Geriatrics Society, 51, 1610-1614.
- Bayne, A., Siegfried, A., Beck, L. F. & Freund, K., 2021. Barriers and facilitators of older adults’ use of ride share services. Journal of Transport & Health, 21, 101055.
- Bird, D. C., Freund, K., Fortinsky, R. H., Staplin, L., West, B. A., Bergen, G. & Downs, J., 2017. Driving self-regulation and ride service utilization in a multicommunity, multistate sample of U.S. older adults. Traffic Injury Prevention, 18, 267-272.
- Centers for Medicare & Medicaid Services. 2024. National health expenditure data: Age and sex [Age and Sex Tables] [Online]. Available: https://www.cms.gov/data-research/statistics-trends-and-reports/national-health-expenditure-data/age-and-sex [Accessed 07/19/2025].
- Chari, A. V., Engberg, J., Ray, K. N. & Mehrotra, A., 2015. The opportunity costs of informal elder-care in the United States: New estimates from the American Time Use Survey. Health Services Research, 50, 871-882.
- Che Had, N. H., Alavi, K., Md Akhir, N., Muhammad Nur, I. R., Shuhaimi, M. S. Z. & Foong, H. F., 2023. A scoping review of the factor associated with older adults’ mobility barriers. International Journal of Environmental Research and Public Health, 20, 4243.
- Chihuri, S., Mielenz, T. J., Dimaggio, C. J., Betz, M. E., Diguiseppi, C., Jones, V. C. & Li, G., 2016. Driving cessation and health outcomes in older adults. Journal of the American Geriatrics Society, 64, 332-341.
- Choi, M. S., Dabelko-Schoeny, H. & White, K., 2020. Access to employment, volunteer activities, and community events and perceptions of age-friendliness: The role of social connectedness. Journal of Applied Gerontology, 39, 1016-1024.
- Choi, N. G. & Dinitto, D. M., 2015. Depressive symptoms among older adults who do not drive: Association with mobility resources and perceived transportation barriers. The Gerontologist, 56, 432-443.
- Chung, J., Boyle, J. & Wheeler, D. C., 2022. Relationship between life-space mobility and health characteristics in older adults using global positioning system watches. Journal of Applied Gerontology, 41, 1186-1195.
- Cooperative Mobility for Competitive Megaregions, n.d. ADA paratransit services costs soar for seniors and people with disabilities in Texas – A bleak future? : The University of Texas.
- Eby, D. W., Molnar, L. J., Kostyniuk, L. P., St. Louis, R. M. & Zanier, N., 2017. Characteristics of informal caregivers who provide transportation assistance to older adults. PLoS One, 12, e0184085.
- Esri 2022. ArcGIS Pro, v. 3.0. Redlands, CA: Environmental Systems Research Institute.
- Federal Transit Administration. n.d. Civil Rights ADA frequently asked questions [Online]. Available: https://www.transit.dot.gov/regulations-and-guidance/civil-rights-ada/frequently-asked-questions [Accessed 07/19/2025].
- Feeley, C., Demitrijevic, B., Spasovic, L. & Lee , J. Y. 2016. Develop and pilot test smart phone/tablet app for paratransit demand-response passenger pick-up alerts to assist passengers with disabilities and reduce no-shows and dwell times. U.S. Department of Public Transportation.
- Fields, N. L., Cronley, C., Mattingly, S. P., Miller, V. J., Ramezanpour Nargesi, S. R., Bharmal, E. I. & Chace, M., 2022. Leveraging app technology to measure the impact of transportation disadvantage: The development of MyAmble. Journal of Technology in Human Services, 40, 157-180.
- Fields, N. L., Cronley, C., Mattingly, S. P., Roark, E. M., Leat, S. R. & Miller, V. J., 2021. Transportation mobility and health among older adults: Examining missed trips and latent demand. Journal of Transport & Health, 21, 101069.
- Gesler, W. M. & Meade, M. S., 1988. Locational and population factors in health care-seeking behavior in Savannah, Georgia. Health Services Research, 23, 443-462.
- Horner, M. W., Duncan, M. D., Wood, B. S., Valdez-Torres, Y. & Stansbury, C., 2015. Do aging populations have differential accessibility to activities? Analyzing the spatial structure of social, professional, and business opportunities. Travel Behaviour and Society, 2, 182-191.
- Jones, V. C., Johnson, R. M., Rebok, G. W., Roth, K. B., Gielen, A., Molnar, L. J., Pitts, S., Diguiseppi, C., Hill, L., Strogatz, D., Mielenz, T., Eby, D. W. & Li, G., 2018. Use of alternative sources of transportation among older adult drivers. Journal of Transport & Health, 10, 284-289.
- Kalu, M. E., Bello-Haas, V. D., Griffin, M., Boamah, S., Harris, J., Zaide, M., Rayner, D., Khattab, N., Abrahim, S., Richardson, T. K., Savatteri, N., Wang, Y. & Tkachyk, C., 2022. Cognitive, psychological and social factors associated with older adults’ mobility: a scoping review of self-report and performance-based measures. Psychogeriatrics, 22, 553-573.
- Kamruzzaman, M. & Hine, J., 2012. Analysis of rural activity spaces and transport disadvantage using a multi-method approach. Transport Policy, 19, 105-120.
- Kestens, Y., Thierry, B., Shareck, M., Steinmetz-Wood, M. & Chaix, B., 2018. Integrating activity spaces in health research: Comparing the VERITAS activity space questionnaire with 7-day GPS tracking and prompted recall. Spat Spatiotemporal Epidemiol, 25, 1-9.
- Kim, S.-O., 2025. Mobility of care and time poverty: the travel burdens of family caregivers in an aging America. Transportation.
- Kim, S., 2011. Assessing mobility in an aging society: Personal and built environment factors associated with older people’s subjective transportation deficiency in the US. Transportation Research Part F: Traffic Psychology and Behaviour, 14, 422-429.
- Koumoutzis, A. & Vivoda, J. M., 2023. On the road again: Factors associated with family/friend caregiver-provided transportation. Journal of Transport & Health, 31, 101633.
- Koumoutzis, A., Vivoda, J. M. & Cao, J., 2022. With a little help From my friends and family: Transportation and caregiving hours. Journal of Applied Gerontology, 41, 1914-1923.
- Lanthier-Labonté, S., Chaudhury, H., Wong, J. & Hung, L., 2024. Dementia-friendly transportation services: A scoping review. The Gerontologist, 64.
- Lee, K., Cassidy, J., Mauldin, R. L., Parekh, R., Miyawaki, C. E., Ngo, H., Tran, T. K. H. & Nguyen, K. N., 2022. Recruitment and data collection challenges of research focused on older adults and family caregivers from Asian American communities: A case study series. Clinical Gerontologist, 1-15.
- Liang, P., Gustafsson, L., Liddle, J. & Fleming, J., 2015. Family members’ needs and experiences of driving disruption due to health conditions or ageing. Disability and Rehabilitation, 37, 2114-2129.
- Luiu, C., Tight, M. & Burrow, M., 2017. The unmet travel needs of the older population: a review of the literature. Transport Reviews, 37, 488-506.
- Machina, M., Mpofu, E., Rivera-Torres, S., Knight, R. & Abah, T. 2020. Older adults’ wellbeing. In: MPOFU, E. (ed.) Sustainable Community Health: Systems and Practices in Diverse Settings. Cham: Springer International Publishing.
- Mauldin, R. L., Parekh, R., Connolly, J. P., Mattingly, S. P., Mushtaq, A. & Fujimoto, K., 2024. Life-space mobility, transportation, and the companionship network of members of a Hispanic senior center. The Journals of Gerontology: Series B, 79.
- Murray, A. & Musselwhite, C., 2019. Older peoples’ experiences of informal support after giving up driving. Research in Transportation Business & Management, 30, 100367.
- National_Rural_Transit_Assistance_Program. 2024. ADA toolkit [Online]. Available: https://irp.cdn-website.com/270961f6/files/uploaded/ADA_Toolkit_2025.pdf [Accessed 07/19/2025].
- Nordbakke, S. & Schwanen, T., 2014. Well-being and mobility: A theoretical framework and literature review focusing on older people. Mobilities, 9, 104-129.
- Petry, S. E., Lara, L. & Boucher, N. A., 2024. Older caregivers: Who they are and how to support them. Journal of Aging & Social Policy, 36, 589-602.
- Price, B. J. 2014. Validation of the Transportation Burden Questionnaire among family caregivers of older adults. [Dissertation], University of Missouri-Saint Louis.
- Ragland, D. R., Macleod, K. E., Mcmillan, T., Doggett, S. & Felschundneff, G. 2019. Assessing and addressing the mobility needs of an aging population. Institute of Transportation Studies Berkeley.
- Ryvicker, M., Bollens-Lund, E. & Ornstein, K. A., 2020. Driving status and transportation disadvantage among Medicare beneficiaries. Journal of Applied Gerontology, 39, 935-943.
- Salkas, K. 2019. Public transportation access and community participation for Latinxs with disabilities. Ph.D., University of Illinois at Chicago.
- Sanford, S., Naglie, G., Cameron, D. H. & Rapoport, M. J., 2020. Subjective experiences of driving cessation and dementia: A meta-synthesis of qualitative literature. Clinical Gerontologist, 43, 135-154.
- Schönfelder, S. & Axhausen, K. W., 2003. Activity spaces: measures of social exclusion? Transport Policy, 10, 273-286.
- Sherman, J. E., Spencer, J., Preisser, J. S., Gesler, W. M. & Arcury, T. A., 2005. A suite of methods for representing activity space in a healthcare accessibility study. International journal of health geographics, 4, 24.
- Szanton, S. L., Alexander, K. A., Kim, B., Li, Q., Gee, G. C., Bandeen-Roche, K. J., Adkins-Jackson, P. B., Hladek, M. D., Samuel, L. J., Haozous, E. A., Okoye, S. M., Crews, D. C. & Thorpe, R. J., Jr., 2023. Life space and activity space measurement: Making “room” for structural racism. The Gerontologist, 64.
- Taylor, B. D. & Tripodes, S., 2001. The effects of driving cessation on the elderly with dementia and their caregivers. Accident Analysis & Prevention, 33, 519-528.
- US Census Bureau 2023. 2023 National Population Projections Tables: Main series.
- Vega, W. A., Aranda, M. P. & Rodriguez, F. S. 2017. Millennials and dementia caregiving in the.
- United States. USC Edward R. Roybal Institute on Aging and UsAgainstAlzheimer’s.
- Webber, S. C., Porter, M. M. & Menec, V. H., 2010. Mobility in older adults: A comprehensive framework. The Gerontologist, 50, 443-450.
- Wood, I., Bhojak, T., Jia, Y., Jacobsen, E., Snitz, B. E., Chang, C.-C. H. & Ganguli, M., 2023. Predictors of driving cessation in older adults: A 12-year population-based study. Alzheimer Disease & Associated Disorders, 37.
- York Cornwell, E. & Cagney, K. A., 2017. Aging in Activity Space: Results From Smartphone-Based GPS-Tracking of Urban Seniors. The Journals of Gerontology: Series B, 72, 864-875.
Figure 1.
A regular activity space represented by a one standard deviation ellipse (SDE1) generated in ArcGIS Pro using destinations of routine activities weighted by frequency of travel to the activity. © 2025, Mahshid Haque.
Figure 1.
A regular activity space represented by a one standard deviation ellipse (SDE1) generated in ArcGIS Pro using destinations of routine activities weighted by frequency of travel to the activity. © 2025, Mahshid Haque.
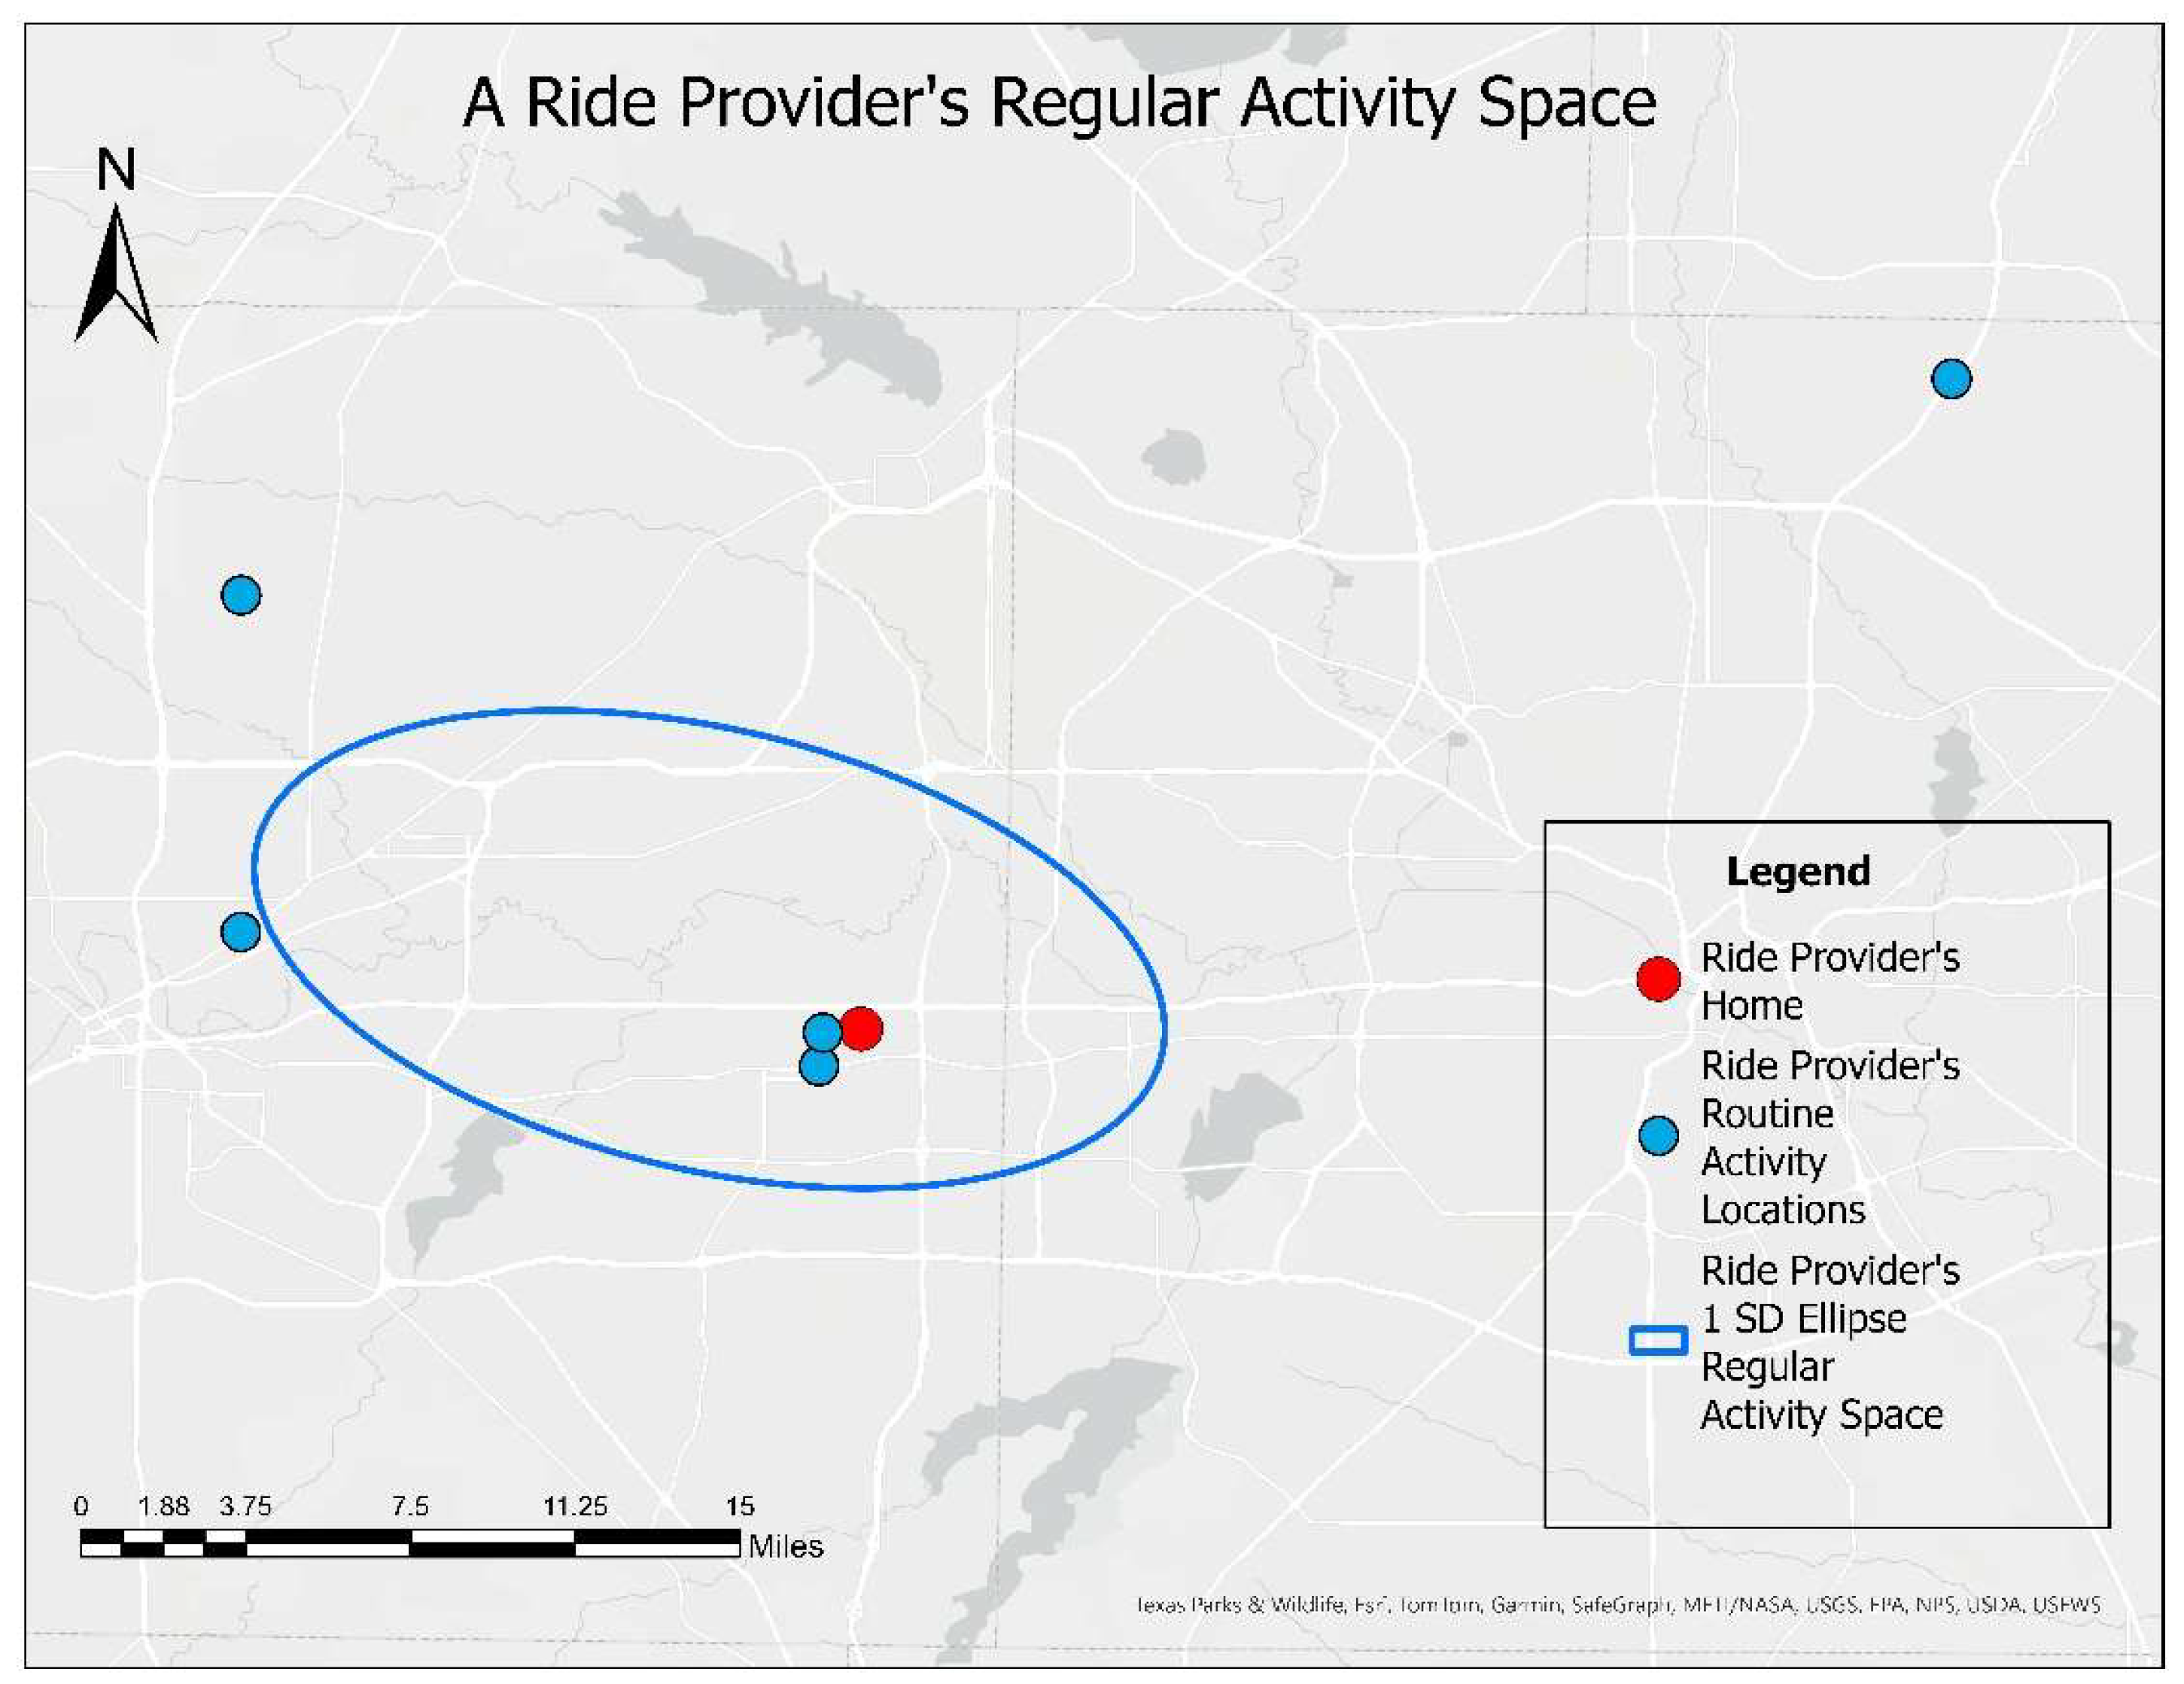
Figure 2.
Map depicting a ride provider’s SDE1 regular activity space and SDE1 ride-provision activity. © 2025, Mahshid Haque.
Figure 2.
Map depicting a ride provider’s SDE1 regular activity space and SDE1 ride-provision activity. © 2025, Mahshid Haque.
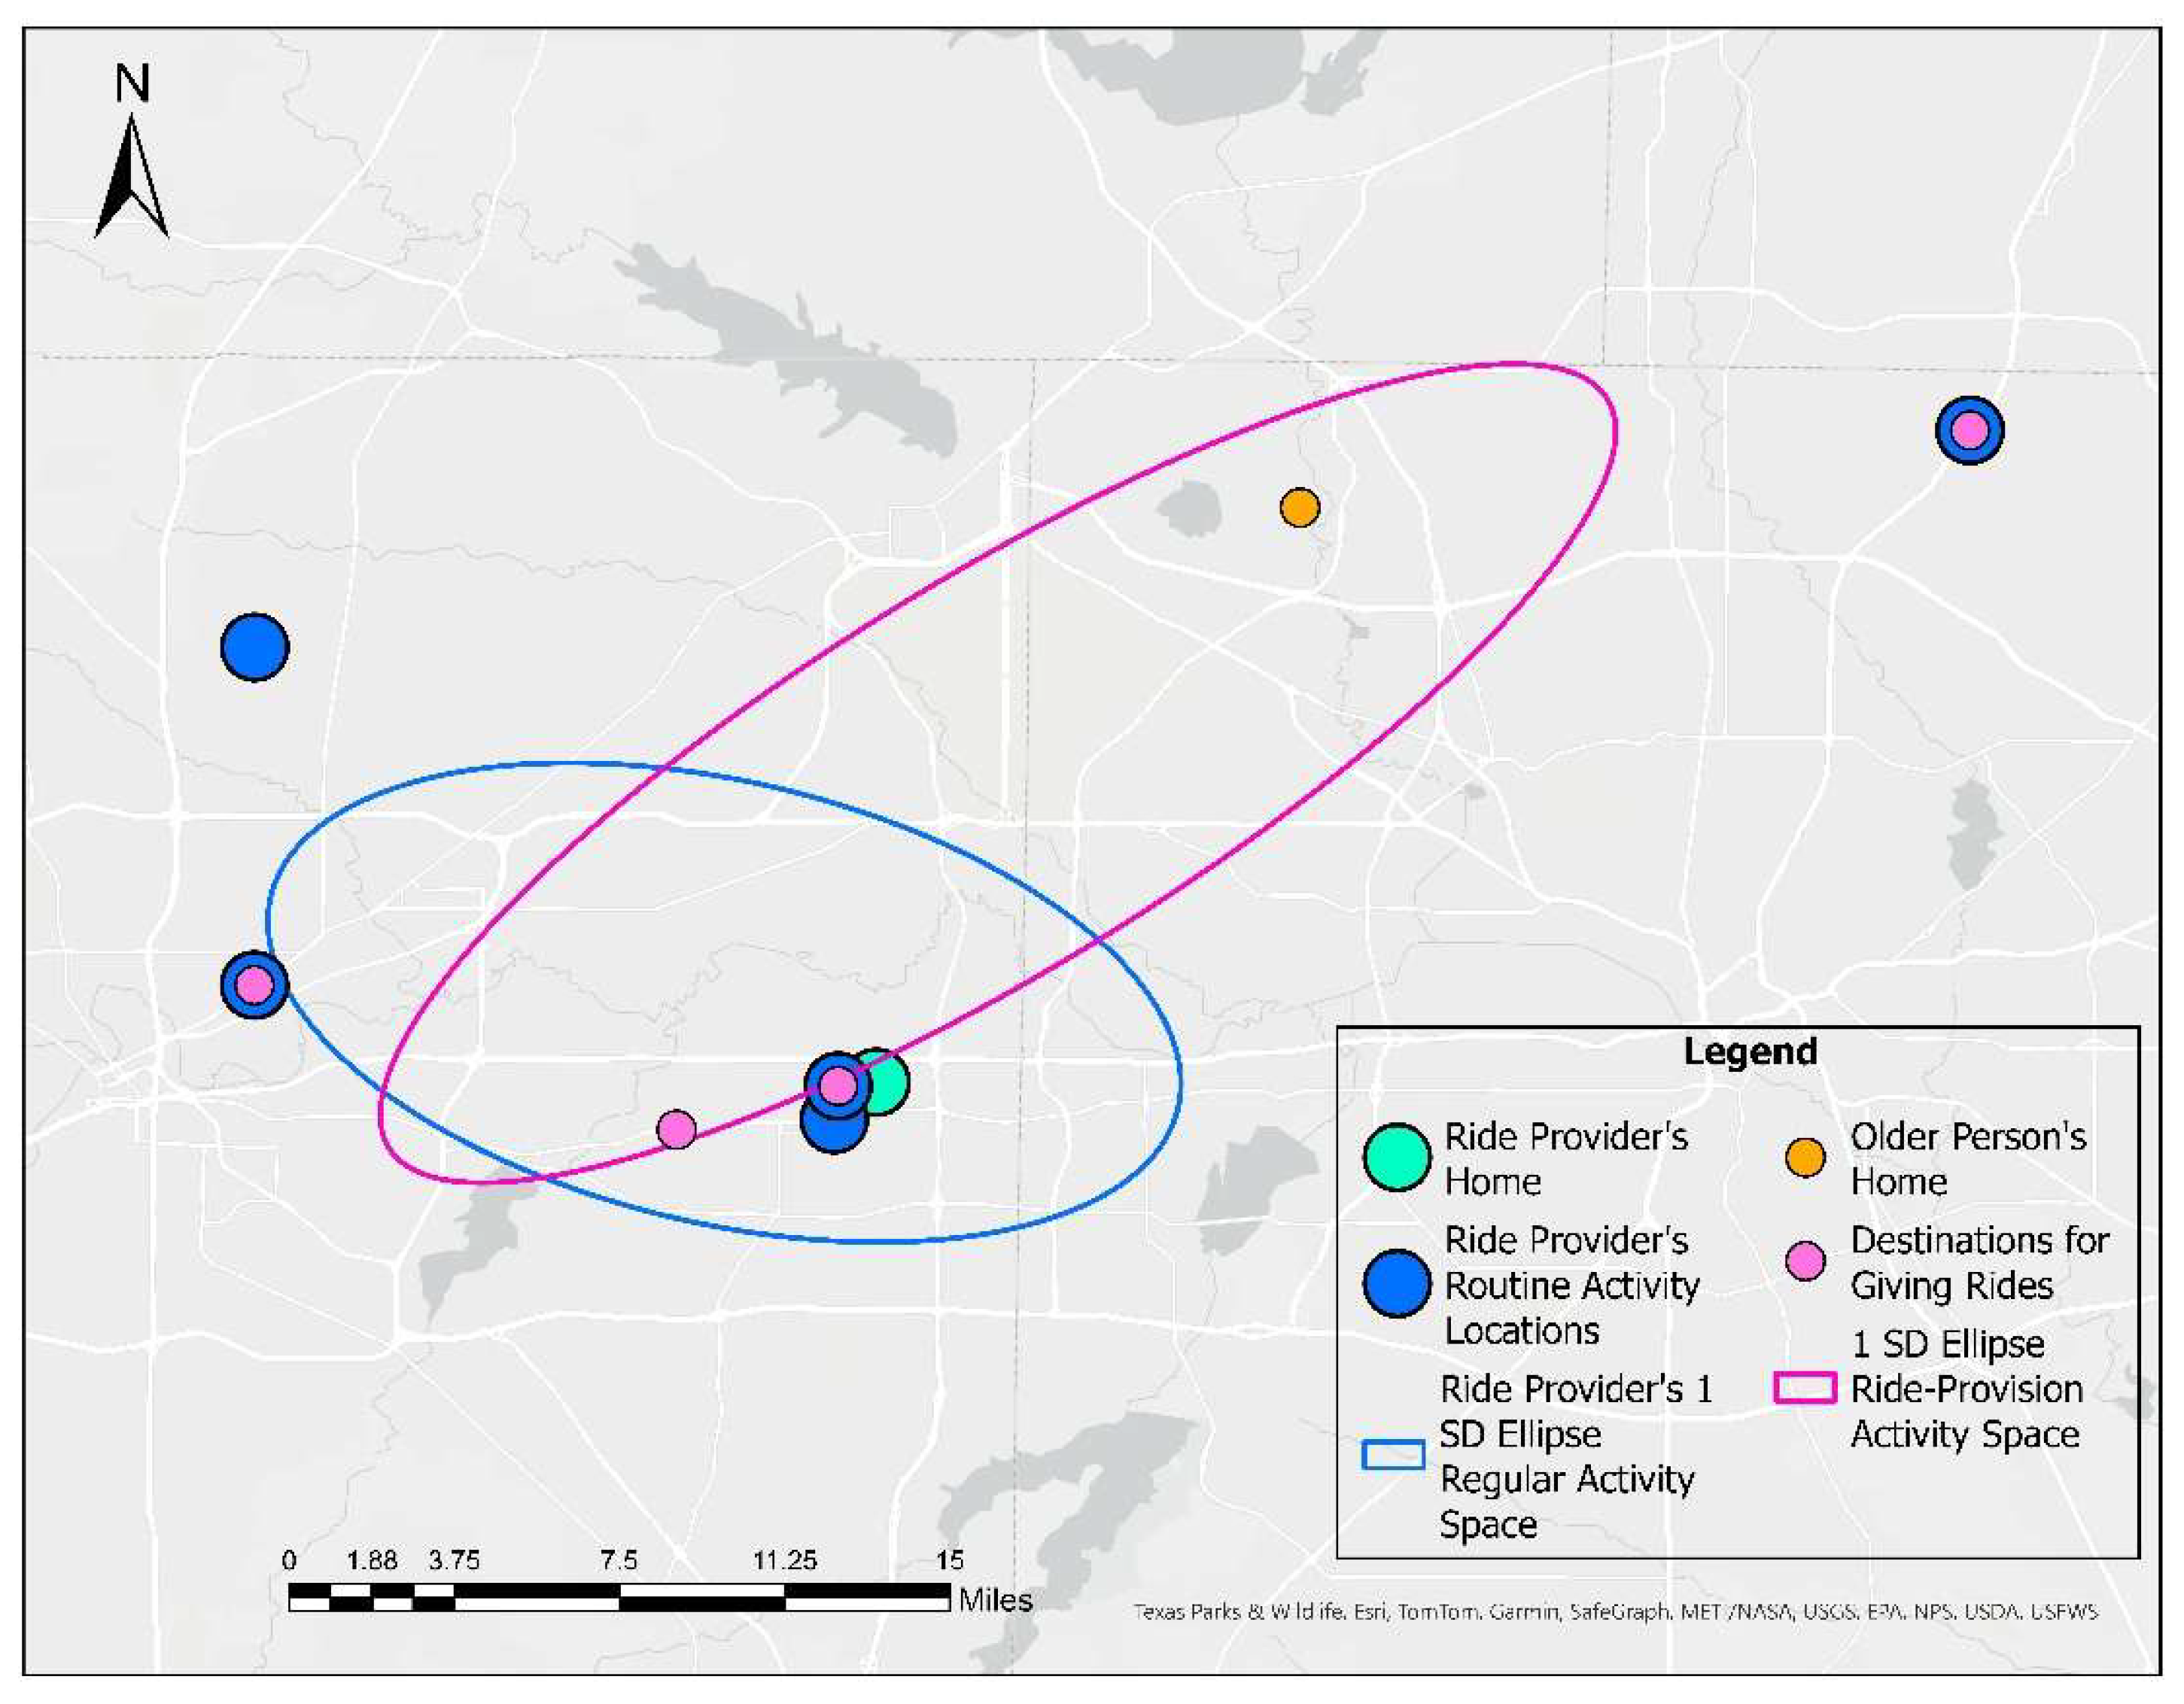
Figure 3.
Labeled portions of the overlapped regular activity space (S + C) and the ride-provision activity space (G + C). © 2025, Mahshid Haque.
Figure 3.
Labeled portions of the overlapped regular activity space (S + C) and the ride-provision activity space (G + C). © 2025, Mahshid Haque.
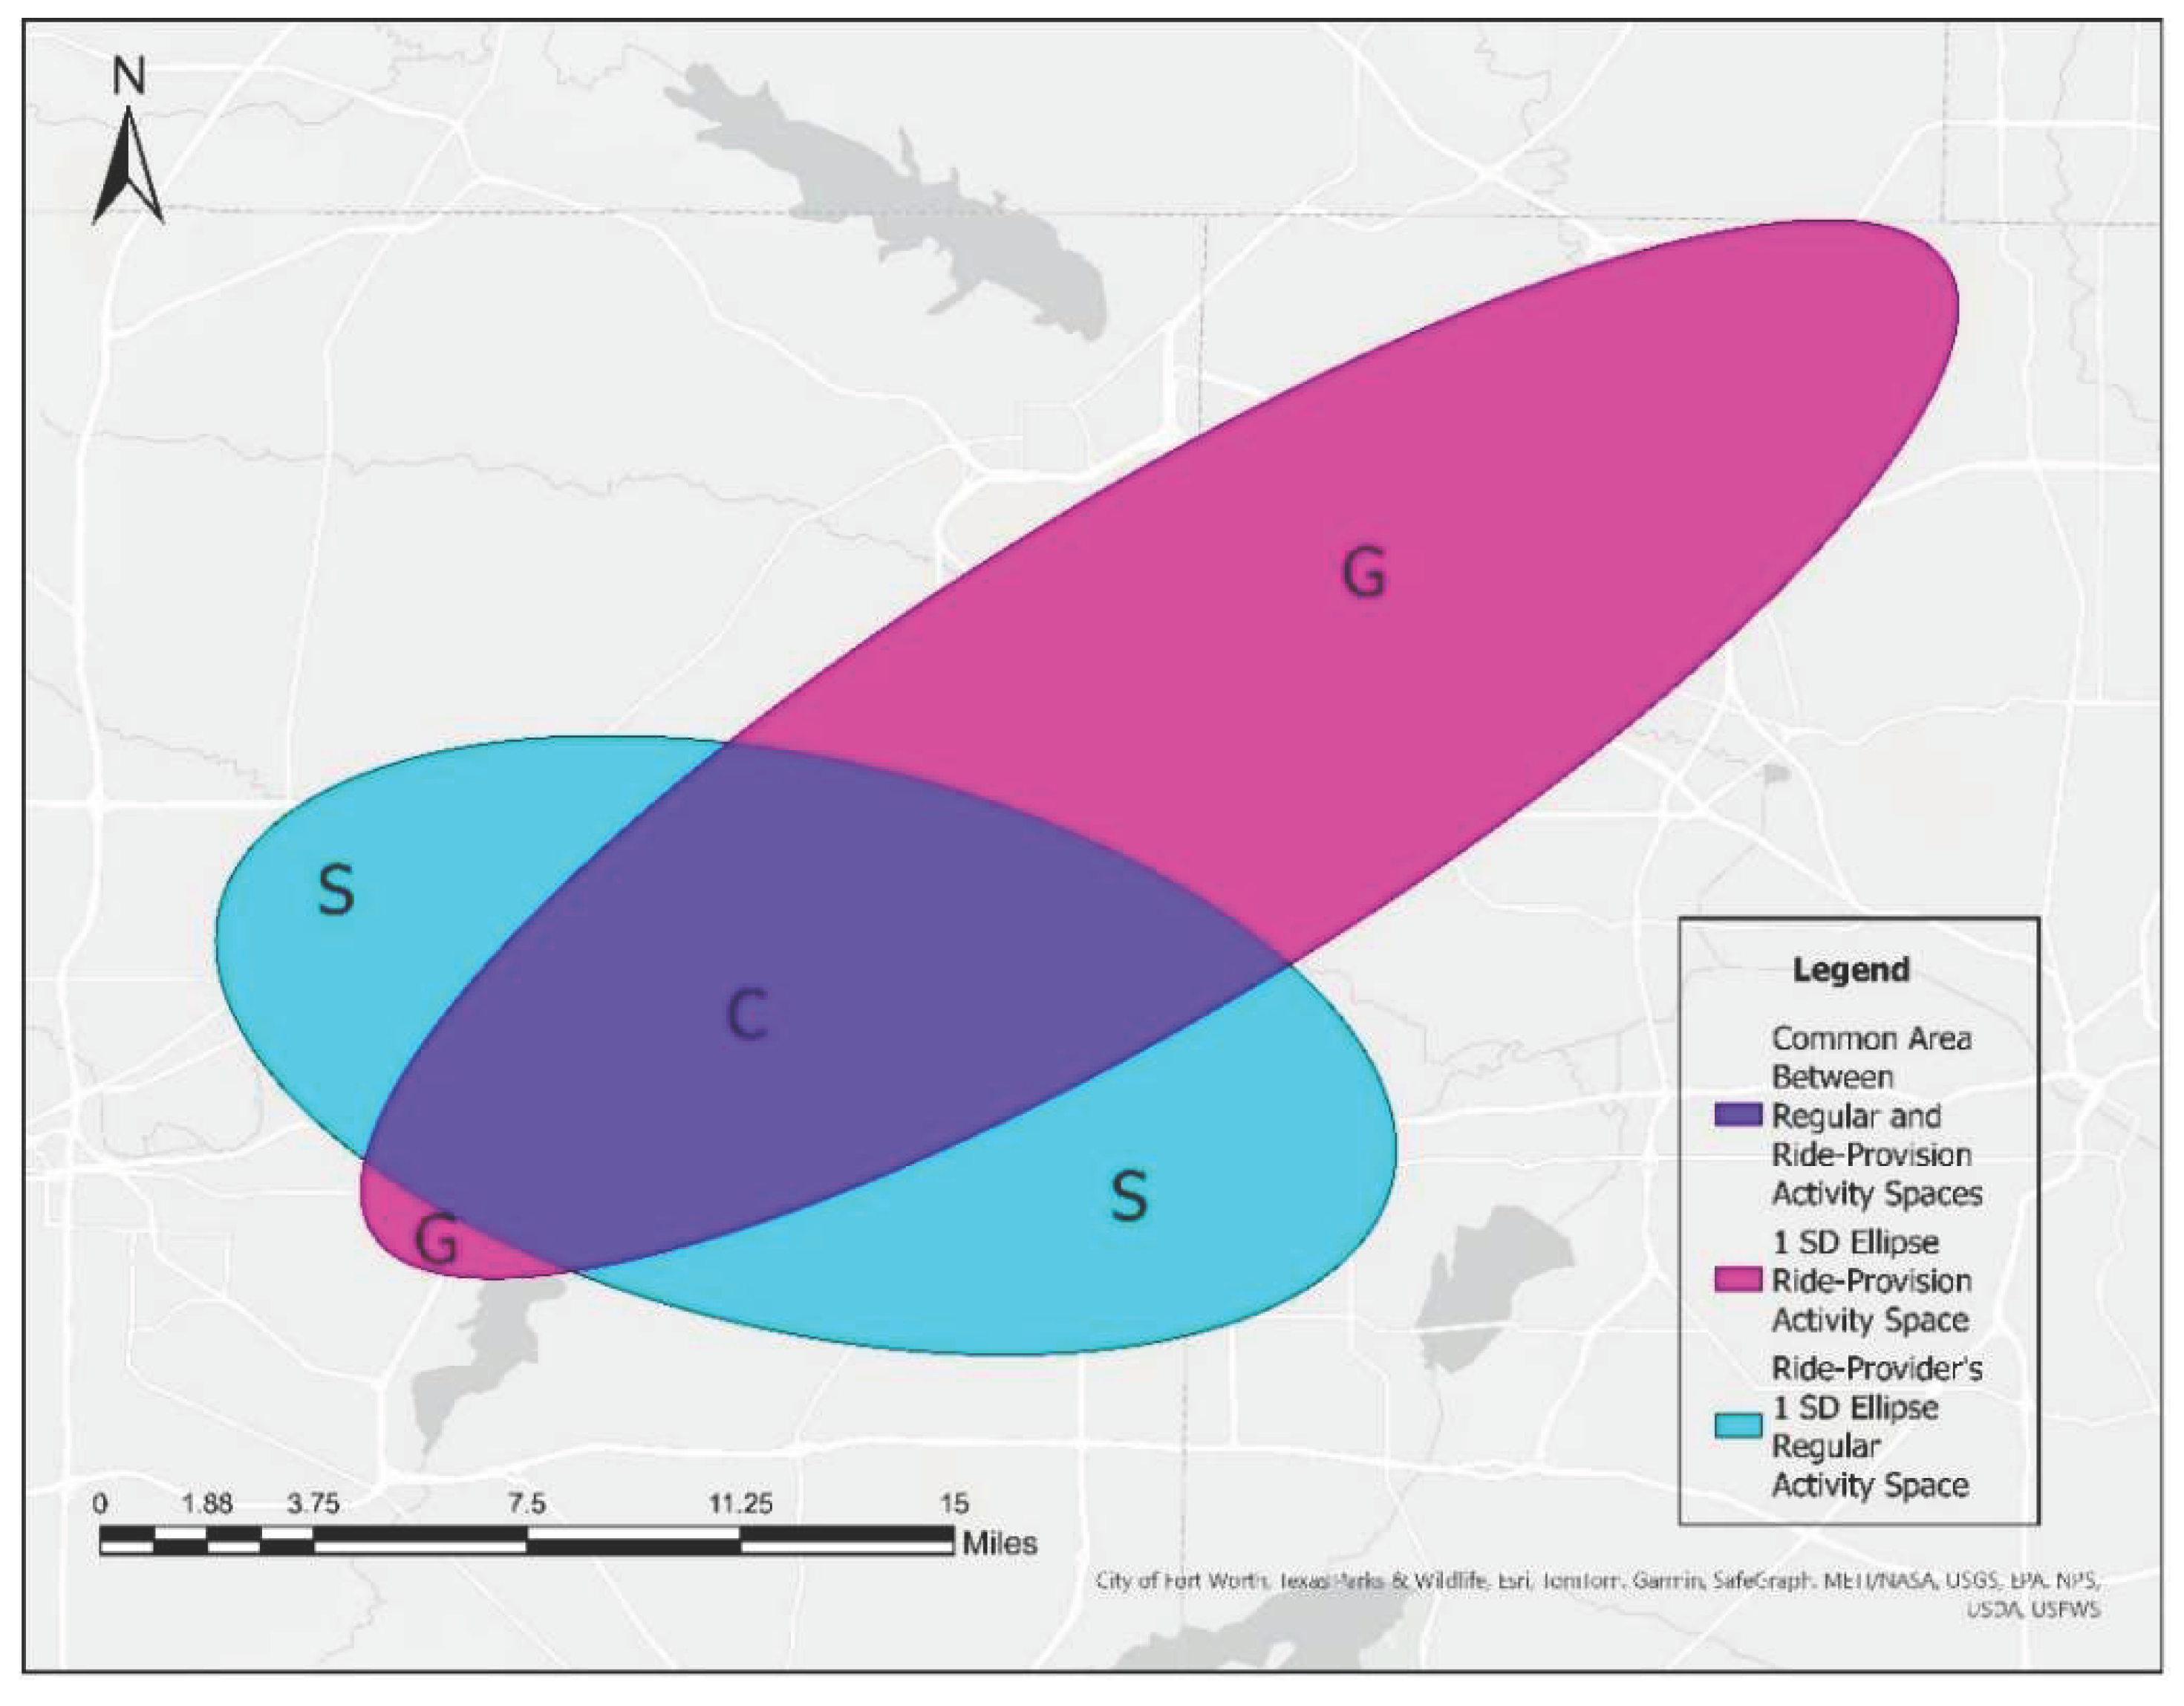

Table 1.
Demographic Characteristics of the Sample of Ride Providers for Older Vietnamese Adults (N = 18).
Table 1.
Demographic Characteristics of the Sample of Ride Providers for Older Vietnamese Adults (N = 18).
| Variable | n | % | M | SD | min | max |
|---|---|---|---|---|---|---|
| Age | 17 | 46.18 | 23.50 | 18 | 79 | |
| Less than 25 | 5 | 29.4 | ||||
| 25 to 59 | 5 | 29.4 | ||||
| 60 or older | 7 | 41.2 | ||||
| Gender | ||||||
| Female | 9 | 50.0 | ||||
| Male | 9 | 50.0 | ||||
| Marital Status | ||||||
| Single | 9 | 50.0 | ||||
| Married/domestic partnership | 9 | 50.0 | ||||
| Education | ||||||
| Less than high school | 3 | 16.7 | ||||
| High school diploma or equivalent | 10 | 55.6 | ||||
| Some college or associate’s degree | 4 | 22.2 | ||||
| College degree | 1 | 5.6 | ||||
| Country of Birth | ||||||
| The United States | 9 | 50.0 | ||||
| Vietnam | 9 | 50.0 | ||||
| Years in U.S., If Not Born in U.S. | 9 | 20.89 | 12.77 | 5 | 45 | |
| Vietnamese Ethnicity | 18 | 100.0 | ||||
| Primary Language Spoken at Home | ||||||
| Vietnamese | 16 | 88.9 | ||||
| English | 2 | 11.1 | ||||
| Monthly household income | 18 | 2102.61 | 1763.50 | 0 | 6004 |
Table 2.
Transportation-Related and Regular Activity Space Characteristics among Sample of Ride Providers (N = 18).
Table 2.
Transportation-Related and Regular Activity Space Characteristics among Sample of Ride Providers (N = 18).
| Variable | n | % | M | SD | min | max |
|---|---|---|---|---|---|---|
| Household Automobile Ownership | ||||||
| Owns working automobile | 16 | 88.9 | ||||
| Owns non-working automobile | 1 | 5.6 | ||||
| Someone in household owns working automobile | 1 | 5.6 | ||||
| Mode of Transportation | ||||||
| Drives self | 18 | 100.0 | ||||
| Gets ride with someone else | 1 | 5.6 | ||||
| Frequency of Driving Self | ||||||
| More than once per day | 10 | 55.6 | ||||
| Once per day | 4 | 22.2 | ||||
| More than once per week | 4 | 22.2 | ||||
| Frequency of Getting Rides with Someone Else | ||||||
| Less than once per month | 1 | 100 | ||||
| Area of regular activity space, in square miles | 18 | 44.36 | 55.24 | 0.51 | 184.52 |
Table 3.
Ride-Provision Activity Space (AS) and the Activities to which Rides were Routinely Provided (N = 18).
Table 3.
Ride-Provision Activity Space (AS) and the Activities to which Rides were Routinely Provided (N = 18).
| Variable | n | % | M | SD | min | max |
|---|---|---|---|---|---|---|
| Area of Ride-Provision AD (sq. miles) | 18 | 34.13 | 74.9 | .17 | 279.49 | |
| Days/Month Rides were Provided | 13 | 11.38 | 8.62 | 2 | 30 | |
| Number of Activities for which Rides were Provided | 18 | 2.89 | 2.03 | 1 | 9 | |
| Grocery shopping | 11 | 61.1 | ||||
| Frequency* | 11 | 4.27 | 1.90 | 1 | 8 | |
| Go to convenience mart | 2 | 11.1 | ||||
| Frequency* | 2 | 3.50 | .71 | 3 | 4 | |
| Buy gasoline | 2 | 11.1 | ||||
| Frequency* | 2 | 4.00 | 0.0 | 4 | 4 | |
| Shop for clothes or other retail items | 3 | 16.7 | ||||
| Frequency* | 3 | 2.67 | 1.53 | 1 | 4 | |
| Visit friend or family member | 5 | 27.8 | ||||
| Frequency* | 5 | 2.80 | 1.48 | 1 | 5 | |
| Church or other religious activities | 7 | 38.9 | ||||
| Frequency* | 7 | 9.00 | 9.71 | 4 | 30 | |
| Exercise | 1 | 5.6 | ||||
| Frequency* | 1 | 4.00 | 0.00 | 4 | 4 | |
| Pharmacy | 2 | 11.1 | ||||
| Frequency* | 2 | 3.0 | 1.41 | 2 | 4 | |
| Beauty salon, barber, other personal care services | 1 | 5.6 | ||||
| Frequency* | 1 | 2.00 | 0.00 | 2 | 2 | |
| Bank | 2 | 11.1 | ||||
| Frequency* | 2 | 1.5 | .71 | 1 | 2 | |
| Senior center | 2 | 11.1 | ||||
| Frequency* | 2 | 15.00 | 19.80 | 1 | 29 | |
| Work | 3 | 16.7 | ||||
| Frequency* | 3 | 14.67 | 11.72 | 6 | 28 | |
| Health care | 10 | 55.6 | ||||
| Frequency* | 10 | 2.30 | 2.26 | 1 | 8 |
* Frequency is provided in days/month.
Table 4.
Spearman’s Rank-Order Correlations among Burden Indicators (BIs), Frequency, and Impact of Providing Rides (N = 18 unless otherwise noted).
Table 4.
Spearman’s Rank-Order Correlations among Burden Indicators (BIs), Frequency, and Impact of Providing Rides (N = 18 unless otherwise noted).
| Variable | 1 | 2 | 3 | 4 | 5 |
|---|---|---|---|---|---|
| 1. Burden Indicator A (BIA) | — | ||||
| 2. Burden Indicator B (BIB) | .352 | — | |||
| 3. Burden Indicator C (BIC) | .579* | .864** | — | ||
| 4. Number of Days Given Rides/montha | –.111 | –.295 | –.202 | — | |
| 5. Any Impact for Providing Rides Reported (ref = no) | –.268 | .032 | –.182 | –.107 | — |
1 Note. p < .05. ** p < .01. an = 13 for correlations involving number of days giving rides/month. Bias-corrected and accelerated (BCa) bootstrap results (5,000 samples) for each pair (indicated by variable numbers) are as follows:
Disclaimer/Publisher’s Note: The statements, opinions and data contained in all publications are solely those of the individual author(s) and contributor(s) and not of MDPI and/or the editor(s). MDPI and/or the editor(s) disclaim responsibility for any injury to people or property resulting from any ideas, methods, instructions or products referred to in the content. |
© 2025 by the authors. Licensee MDPI, Basel, Switzerland. This article is an open access article distributed under the terms and conditions of the Creative Commons Attribution (CC BY) license (http://creativecommons.org/licenses/by/4.0/).
Copyright: This open access article is published under a Creative Commons CC BY 4.0 license, which permit the free download, distribution, and reuse, provided that the author and preprint are cited in any reuse.


