
Submitted:
27 October 2025
Posted:
03 November 2025
You are already at the latest version
Abstract
Background: Recurrent urinary tract infections (rUTIs) in children are increasingly complicated by antimicrobial resistance, leading to limited treatment options and chal-lenging prophylactic management. Continuous local monitoring of resistance trends is essential for evidence-based stewardship.
Methods: This retrospective study analysed 130 episodes of recurrent paediatric UTI recorded between 2020 and 2024 at a tertiary hospital in Romania. Data were extracted using the ICD-10 code N39.0 and included demographic, clinical, and microbiological variables. Antimicrobial susceptibility testing followed CLSI standards. Associations between multidrug resistance (MDR) and clinical factors were assessed with χ² tests and Cramer’s V, and predictors of MDR were evaluated by multivariable logistic regression. Temporal trends in resistance were examined using logistic regression with year as a continuous variable, and results were validated with the non-parametric Cochran–Armitage linear-by-linear χ² trend test to strengthen analytical rigor. Proportions are presented with Wilson 95% confidence intervals (CIs).
Results: MDR occurred in 48.5% of isolates (95% CI, 40.2–56.9) and ESBL in 20.9% (95% CI, 14.9–28.5). MDR was significantly associated with urinary tract malformations (χ² = 5.78, p = 0.016) and continuous antibiotic prophylaxis (χ² = 4.23, p = 0.040). Neither logistic nor Cochran–Armitage trend analyses demonstrated a significant temporal increase in MDR (OR per year = 0.94; 95% CI 0.75–1.17; p = 0.566; χ² = 0.89; p = 0.346).
Conclusions: MDR and ESBL rates among children with recurrent UTIs remain high but stable. The combined use of parametric and non-parametric trend analyses confirmed the absence of a significant upward trajectory, underscoring the need for ongoing surveillance and stewardship to maintain antibiotic effectiveness in paediatric care.
Keywords:
paediatric urinary tract infection
; recurrent UTI
; antimicrobial resistance
; multidrug resistance
; ESBL
; antibiotic prophylaxis
; urinary tract malformations
1. Introduction
Urinary tract infections (UTIs) are among the most common bacterial infections in childhood, affecting up to 8% of girls and 2% of boys during the first eight years of life [1]. Although most episodes resolve with appropriate antimicrobial therapy, a substantial proportion of children experience recurrent UTIs (rUTIs), which are defined as two or more febrile or three or more culture-confirmed infections within one year [2]. Recurrent infections are clinically significant because they increase the risk of renal scarring, hypertension, and long-term impairment of renal function, particularly in the presence of vesicoureteral reflux or other urological anomalies.
Effective management of rUTIs relies heavily on the use of empirical antibiotic therapy guided by local susceptibility patterns. However, the global escalation in antimicrobial resistance (AMR) has substantially reduced the effectiveness of commonly used agents such as amoxicillin–clavulanate and trimethoprim–sulfamethoxazole [3]. Multidrug-resistant Escherichia coli, Klebsiella spp., and other Gram-negative uropathogens are now being reported with increasing frequency even in community-acquired infections, complicating both prophylactic and therapeutic strategies in paediatric populations [4,5].
Children with rUTIs are particularly vulnerable to infection with resistant organisms due to repeated antibiotic exposure, prior hospitalizations, and underlying anatomical or functional urinary tract abnormalities [6]. Yet, most surveillance studies focus on first-time UTIs, and data on resistance patterns specifically in recurrent paediatric infections remain limited - particularly in Central and Eastern Europe, where surveillance networks are still developing where antibiotic stewardship programs are still developing [5,7].
To date, no Romanian or regional studies have longitudinally characterized antimicrobial resistance exclusively in children with recurrent UTIs. Prior regional reports described resistance in broader paediatric UTI cohorts or organism-specific analyses . Existing reports either have combined first-episode and recurrent cases or focus exclusively on community-acquired infections, thereby overlooking the unique microbiological dynamics that develop in patients repeatedly exposed to antimicrobials. This lack of targeted data limits the ability to tailor empirical therapy and prophylactic strategies for high-risk paediatric populations in this region. Recurrent UTIs differ fundamentally from first infections in both pathophysiology and resistance selection. Repeated antibiotic exposure can alter the urinary microbiota, favour colonization by multidrug-resistant (MDR) strains, and facilitate biofilm formation within the urinary tract. Moreover, structural or functional urinary anomalies often result in incomplete bacterial clearance, creating a persistent reservoir for resistant organisms. These factors make recurrent infections not only more difficult to treat but also an important source of antimicrobial resistance dissemination.
Based on these considerations, we hypothesized that children with urinary tract malformations and those receiving continuous antibiotic prophylaxis (CAP) would exhibit higher rates of multidrug-resistant (MDR) and extended-spectrum β-lactamase (ESBL)-producing uropathogens. We further anticipated that resistance prevalence would increase progressively over the study period, reflecting cumulative antibiotic selection pressure in this vulnerable cohort.
Understanding local resistance trends over time is critical to guide empiric treatment, optimize prophylaxis, and support antimicrobial stewardship. This study provides the first longitudinal analysis of recurrent paediatric UTI resistance trends in Romania, offering local data to inform regional stewardship policies.
2. Materials and Methods
Study Design and Ethical Approval
This retrospective observational study was conducted at the Department of Paediatrics and Paediatric Surgery, “Grigore Alexandrescu” Emergency Hospital for Children, a tertiary referral centre in Bucharest, Romania. The study period spanned January 2020 to December 2024, and included paediatric patients aged 0–18 years diagnosed with recurrent urinary tract infections (rUTIs). The study adhered to the principles of the Declaration of Helsinki (revised 2013) and complied with the European Union General Data Protection Regulation (GDPR 2016/679). Ethical approval was granted by the Ethical Committee of “Grigore Alexandrescu” Emergency Hospital for Children. The requirement for individual informed consent was waived due to the retrospective nature of the study.
Study Population
Hospital electronic medical records were queried using the ICD-10 diagnostic code N39.0 (“urinary tract infection”), yielding 708 paediatric cases. After applying predefined inclusion and exclusion criteria, 134 children met eligibility requirements for recurrent UTI, defined as:
- Two or more febrile UTIs, or
- Three or more culture-confirmed UTIs within 12 months.
Recurrent infection episodes were included as independent events only if they occurred ≥30 days apart and yielded distinct culture-confirmed isolates.
Exclusion criteria included: mixed bacterial growth or contaminated samples, incomplete microbiological data, and catheter-associated or nosocomial UTIs.
Of the 134 eligible patients, 130 had complete demographic and microbiological data and were included in statistical analyses.
Data Collection
For each episode, the following data were extracted from the hospital microbiology and clinical databases:
- Demographics: age (years), sex, anonymized identification number;
- Clinical factors: presence and type of urinary tract malformation, presence of other congenital anomalies, and use of continuous antibiotic prophylaxis (CAP) at the time of infection;
- Microbiological data: bacterial species, extended-spectrum β-lactamase (ESBL) status, and antibiotic susceptibility results.
Patient age was calculated as the interval between the date of birth derived from the national personal identification number (CNP) and the date of urine culture collection (infection episode). All data were de-identified prior to analysis and stored in a secure institutional database.
Microbiological Procedures
Urine specimens were processed in the hospital microbiology laboratory using standard culture techniques. Bacterial identification and antimicrobial susceptibility testing were performed using an automated system (VITEK® 2, bioMérieux, Marcy-l’Étoile, France). ESBL production was confirmed by the double-disk synergy test, according to Clinical and Laboratory Standards Institute (CLSI) guidelines. Antibiotic susceptibility results were categorized by major drug classes: amoxicillin and derivatives, trimethoprim–sulfamethoxazole (TMP/SMX), cephalosporins, gentamicin, nitrofurantoin, fluoroquinolones (ciprofloxacin/norfloxacin), streptomycin/tetracycline, and multidrug resistance (MDR), defined as resistance to three or more antibiotic classes.
Statistical Analysis
All statistical analyses were performed using IBM SPSS Statistics version 27.0 (IBM Corp., Armonk, NY, USA) and Python 3.11 with relevant statistical libraries. Continuous variables (e.g., age) were summarized as mean ± standard deviation (SD) or median (interquartile range, IQR), depending on data distribution (tested using the Shapiro–Wilk test). Categorical variables were expressed as counts and percentages with Wilson 95% confidence intervals (CIs). Comparisons between groups were conducted using: Student’s t-test or ANOVA for continuous variables, Chi-square (χ²) or Fisher’s exact test for categorical variables, Cramer’s V to measure effect size for significant categorical associations.
To assess predictors of MDR, a multivariable logistic regression model was fitted, including malformation (any vs none), CAP, sex, and age. Odds ratios (ORs) with 95% CIs were reported for all predictors.
Temporal trends in MDR and ESBL prevalence were analysed using: Logistic regression with year as a continuous predictor (MDR ~ year), and a non-parametric Cochran–Armitage (linear-by-linear) χ² test as a sensitivity analysis. Binomial Wilson 95% CIs were used to express annual MDR and ESBL prevalence. All tests were two-tailed, with a significance level of p < 0.05 considered statistically significant.
Analyses were conducted on a complete-case basis, excluding cases with missing demographic or microbiological data to ensure analytical consistency.
Visualization and Supplementary Material
All statistical graphs and tables were created using Python 3.11 (Matplotlib, pandas, stats models) and IBM SPSS Statistics v27.0. Figures were formatted in accordance with MDPI graphical standards, using a clean minimalist layout with labelled axes, confidence interval error bars, and descriptive captions.
The following visualizations summarize the major analytical components of the study:
- Figure 1 (A,B). Distribution and resistance profile of bacterial isolates by species and ESBL production.
- Figure 2. Temporal distribution of pathogens (2020–2024).
- Figure 3. Antibiotic resistance by class, with Wilson 95% confidence intervals.
- Figure 4 (A,B). Univariable and multivariable associations between MDR and clinical factors.
Supplementary materials provide additional statistical detail and transparency:
- Table S1. Demographic and clinical characteristics of the study cohort (n = 130).
- Table S2/S3. Multivariable logistic regression model for predictors of MDR, presenting odds ratios, 95% confidence intervals, and p-values (intercept retained for transparency).
- Figure S1. ESBL and MDR positivity by malformation type and continuous antibiotic prophylaxis (CAP) use.
- Figure S2. Temporal evolution of MDR and ESBL prevalence (2020–2025) with Wilson 95% CIs.
Together, these visualizations illustrate the relationships between pathogen distribution, antibiotic susceptibility, and clinical variables. All supplementary tables and figures are included in the Supplementary Materials section to facilitate full reproducibility and peer verification
3. Results
Demographic and Clinical Characteristics
The initial database search of hospital electronic records using the ICD-10 diagnostic code N39.0 (‘urinary tract infection’) identified 708 cases. After applying the predefined inclusion and exclusion criteria, 134 paediatric patients met eligibility requirements for recurrent UTI and were included in the study, of whom 130 had complete demographic and clinical data available for analysis.
The analytic cohort included 78 females (60% ; 95% CI, 51.4–68.1) and 52 males (40%; 95% CI, 31.9–48.6), with a mean age of 6.1 ± 4.6 years (range: 0–18 years; 95% CI, 5.3–6.9). Most cases occurred in early childhood, with the majority under 10 years old.
Urinary tract malformations were identified in 54 patients (40%; 95% CI, 31.9–48.6), while 69 (51%; 95% CI, 44.7–61.3) had no associated anomalies and 7 (5%; 95% CI, 2.6–10.8) had other congenital defects. Continuous antibiotic prophylaxis (CAP) was administered to 47 patients (35%; 95% CI, 28.3–44.8), whereas 83 (62%; 95% CI, 55.2–71.7) were not receiving prophylaxis at the time of infection.
No statistically significant differences were observed in age by sex (t = 1.97, p = 0.052; 95% CI for mean difference, –0.01 to 1.62 years) or age by malformation type (ANOVA, p = 0.33). Female patients were slightly more likely to receive CAP (41%; 95% CI, 30.4–52.5) than males (29%; 95% CI, 18.9–40.9), but this difference did not reach statistical significance (χ² = 3.08, p = 0.08). Conversely, children with urinary tract malformations were significantly more likely to receive CAP (61.1%; 95% CI, 47.4–73.2) compared to those without anomalies (21.7%; 95% CI, 13.5–32.4), (χ² = 16.4, p < 0.001; Cramer’s V = 0.36), indicating a moderate-to-strong association between urinary anomalies and antibiotic prophylaxis.
These findings describe a paediatric cohort with a predominance of female patients and a substantial proportion of congenital urinary tract anomalies, many of whom were receiving continuous antibiotic prophylaxis—factors that are clinically relevant to the emergence of antimicrobial resistance (details summarized in Table 1).
Microbiological Profile
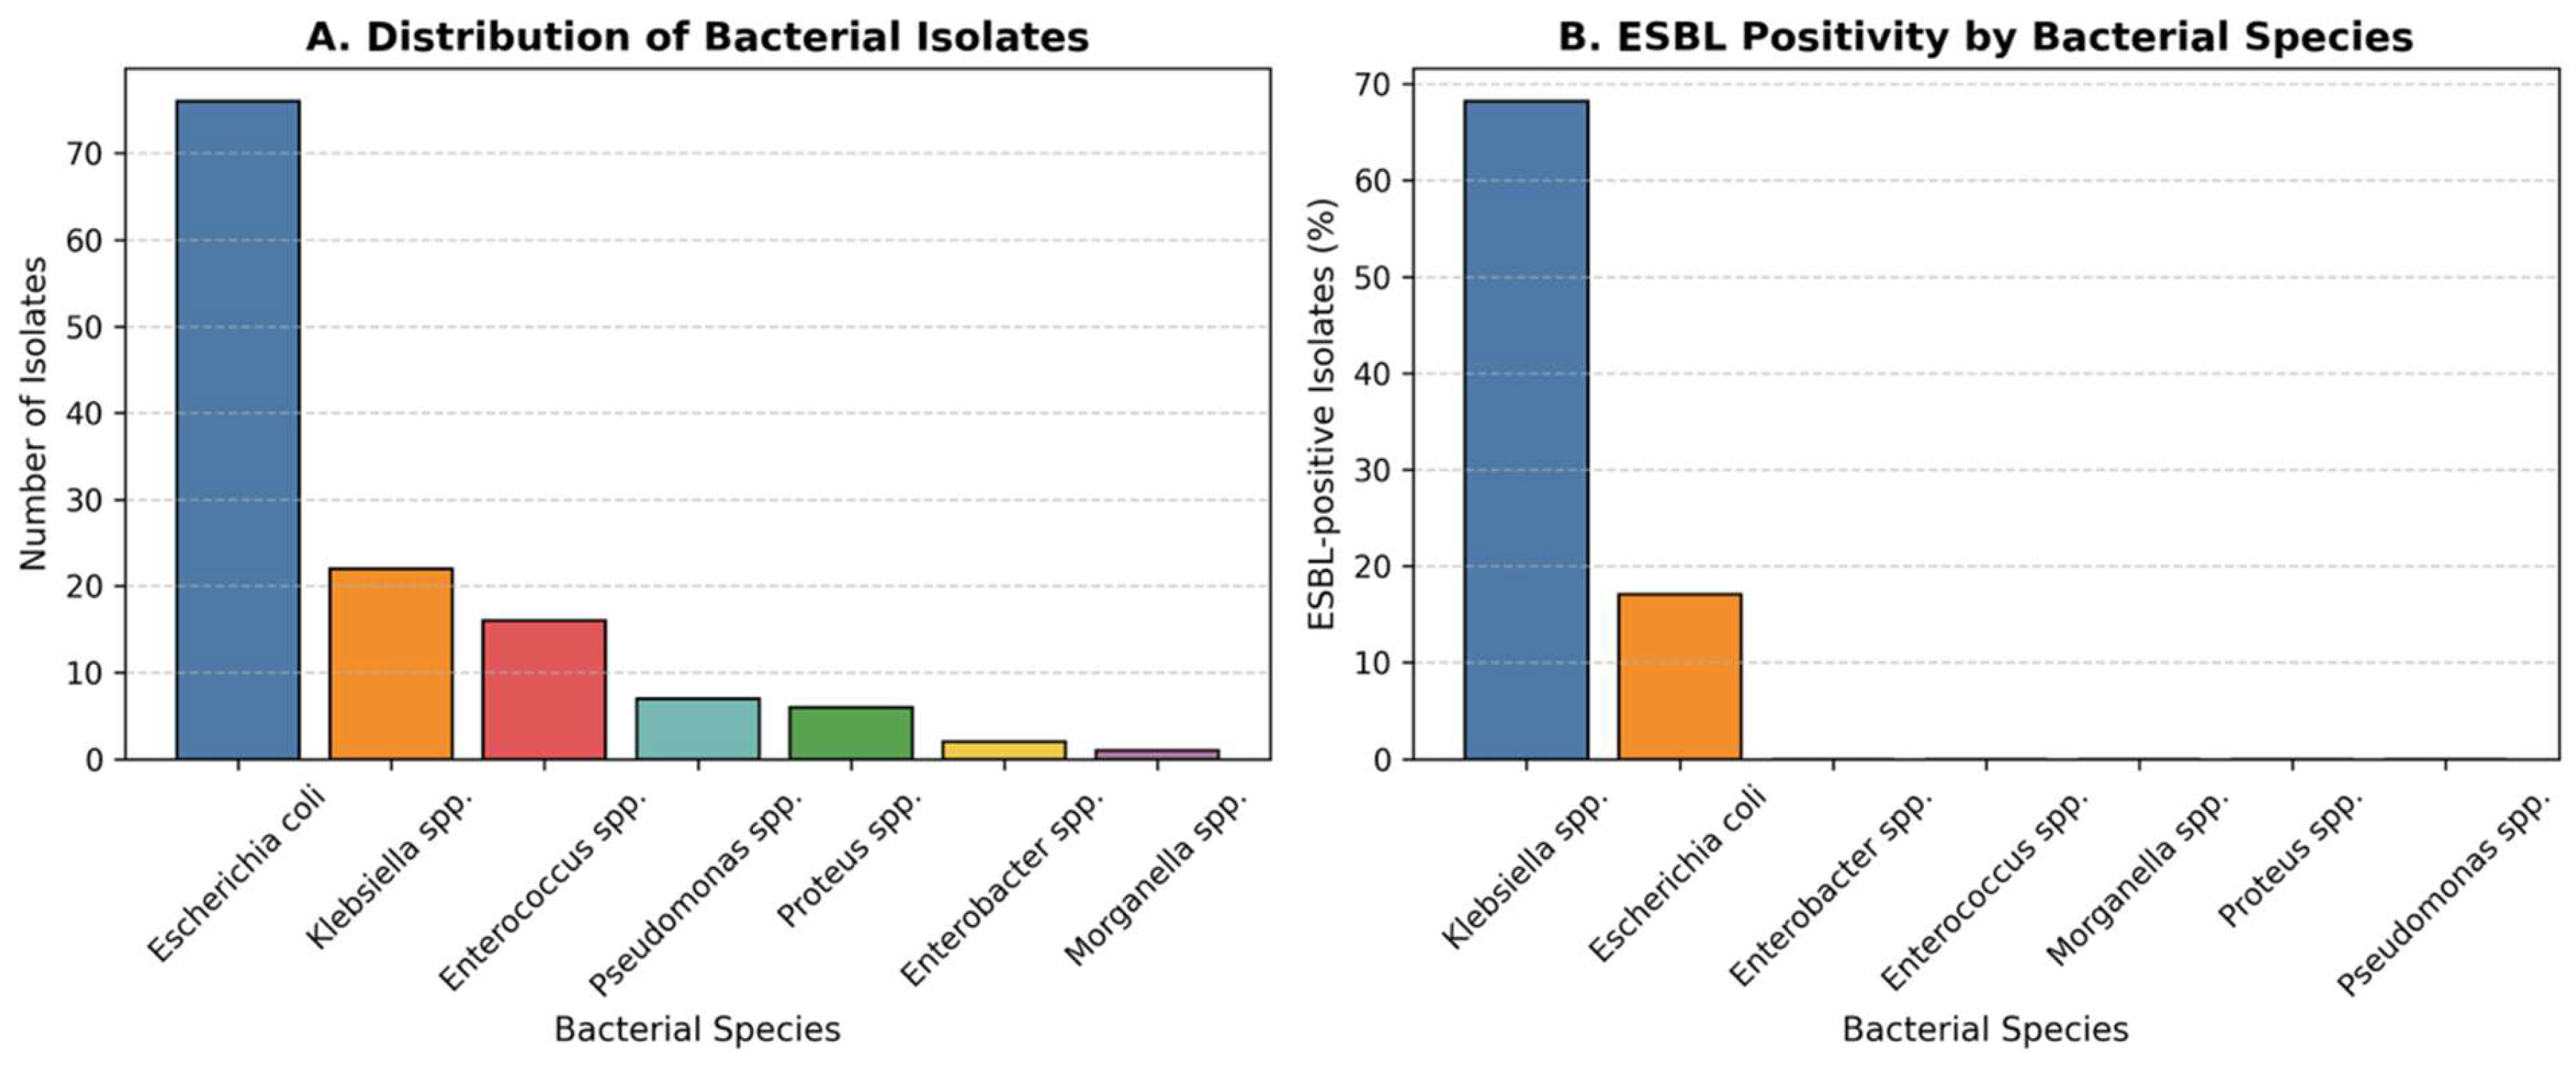
A total of seven bacterial species were isolated from urine cultures during the five-year study period (2020-2024) (Table2). The predominant pathogen was Escherichia coli (58.5%; 95% CI, 49.8–66.7), followed by Klebsiella spp. (16.9%; 95% CI, 11.3–24.6), Enterococcus spp. (12.3%; 95% CI, 7.6–19.1), Pseudomonas spp. (5.4%), Proteus spp. (4.6%; 95% CI, 2.5–10.9), Enterobacter spp. (1.5%; 95% CI, 0.3–5.8), and Morganella spp. (0.8%; 95% CI, 0.1–4.5).
Overall, 21.5% (95% CI, 15.5–29.1) of all isolates were ESBL-positive. The prevalence of ESBL production varied significantly by bacterial species (χ² = 42.8, p < 0.001). The highest rate was observed among Klebsiella spp. (68.2%; 95% CI, 49.4–82.5), followed by E. coli (17.1%; 95% CI, 10.5–26.6). No ESBL production was detected in Enterococcus, Proteus, Pseudomonas, Enterobacter, or Morganella isolates (Figure 1). The difference in ESBL positivity between Klebsiella spp. and E. coli was statistically significant (χ² = 41.5, p < 0.001).
Figure 1.
Distribution and Resistance Profile of Bacterial Isolates. (A) Distribution of bacterial species isolated from urine cultures in children with recurrent urinary tract infections over the five-year study period. Escherichia coli was the most frequently isolated pathogen (58.5%), followed by Klebsiella spp. (16.9%), Enterococcus spp. (12.3%), and other less frequent organisms.(B) Proportion of extended-spectrum β-lactamase (ESBL)-positive isolates by bacterial species. ESBL production was observed in 21.5% of all isolates, with the highest rates in Klebsiella spp. (68.2%) and E. coli (17.1%). The increased prevalence of ESBL-producing strains underscores the growing antimicrobial resistance among uropathogens in paediatric recurrent infections.
Throughout the five-year period, E. coli remained the most prevalent uropathogen; however, there was a progressive rise in non–E. coli isolates, particularly Klebsiella spp., during the final two years. Temporal comparison showed a non-significant upward trend in the proportion of non–E. coli isolates (χ² for trend = 2.84, p = 0.092) (Figure 2). This trend, combined with the high rate of ESBL-producing Klebsiella and E. coli, highlights a concerning shift toward more resistant pathogens, likely influenced by antibiotic exposure and prophylactic use. Continuous microbiological monitoring is therefore essential in managing recurrent paediatric urinary tract infections.
Figure 2.
Temporal distribution of pathogens (stacked by year). E. coli remained the predominant pathogen across all years, but a relative increase in Klebsiella spp. was noted in 2023–2024, coinciding with higher ESBL prevalence. The upward trend in non–E. coli isolates did not reach statistical significance (χ² for trend = 2.84, p = 0.092).
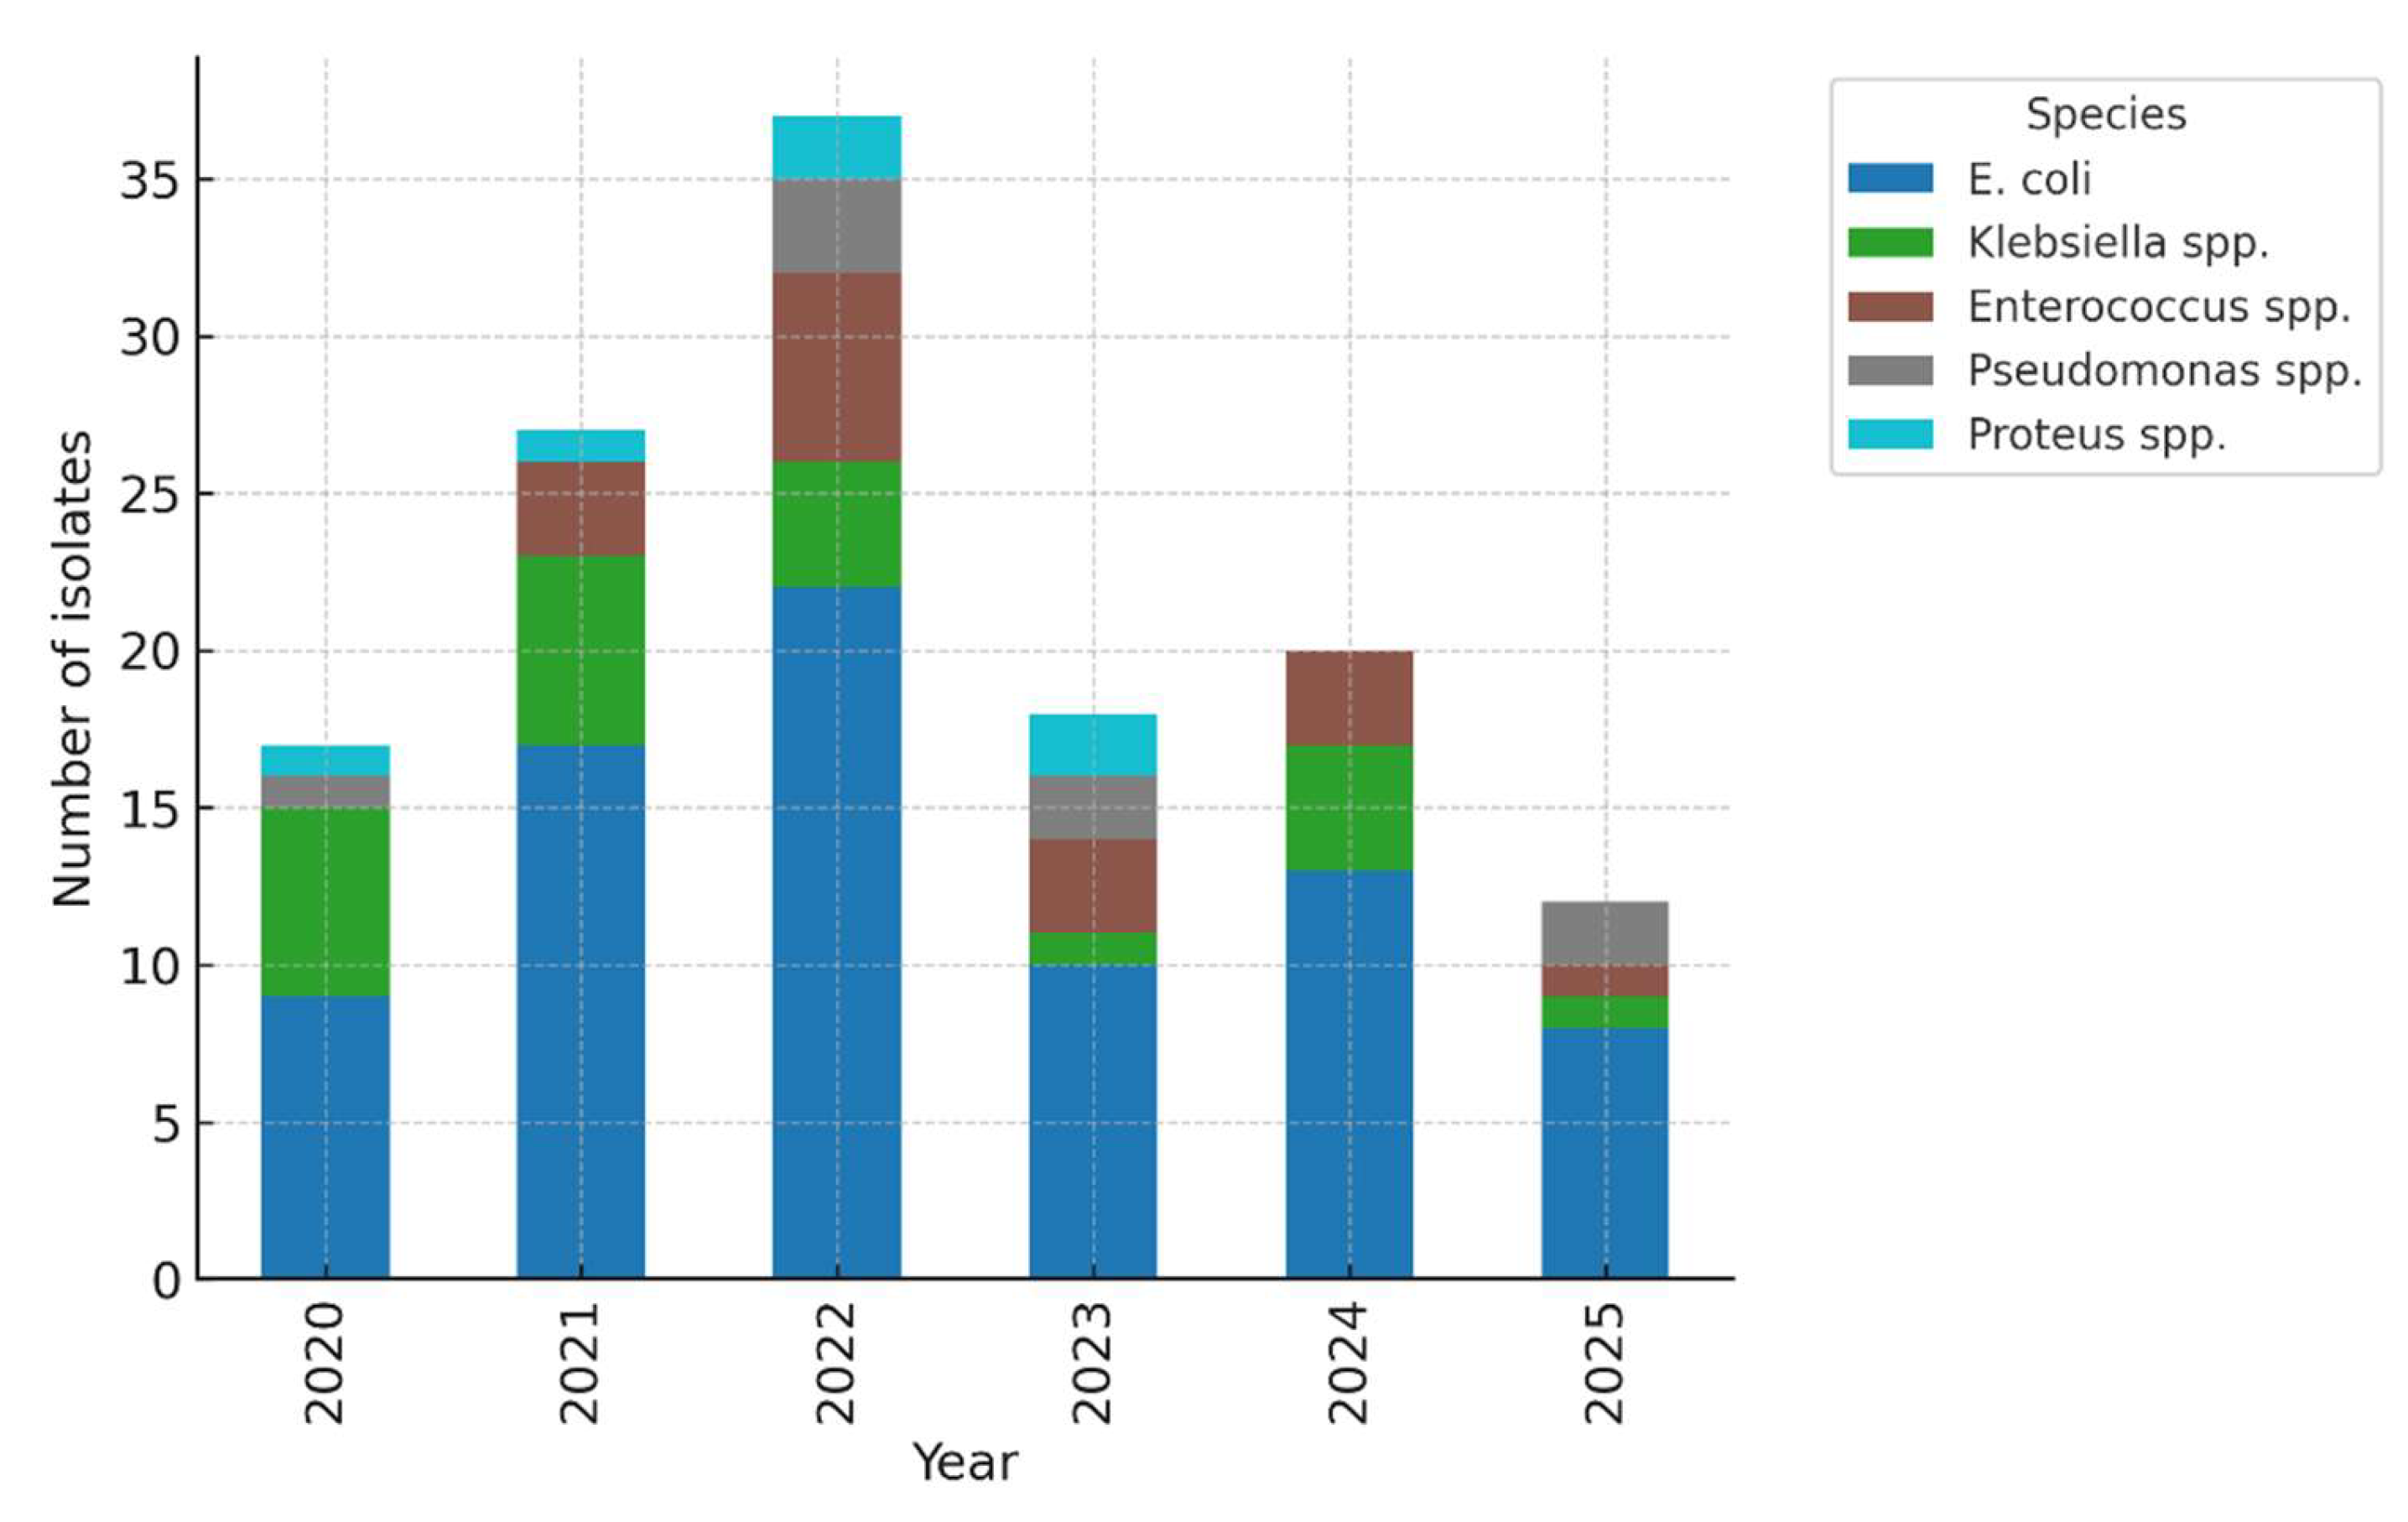

Table 2.
Bacterial distribution and ESBL prevalence.
| Pathogen | n (%) | 95% CI | ESBL-positive n (%) | 95% CI |
| E. coli | 78 (58.5) | 49.8–66.7 | 13 (17.1) | 10.5–26.6 |
| Klebsiella spp. | 22 (16.9) | 11.3–24.6 | 15 (68.2) | 49.4–82.5 |
| Enterococcus spp. | 16 (12.3) | 7.6–19.1 | 0 | — |
| Pseudomonas spp. | 7 (5.4) | 2.5–10.9 | 0 | — |
| Proteus spp. | 6 (4.6) | 2.0–9.9 | 0 | — |
| Enterobacter spp. | 2 (1.5) | 0.3–5.8 | 0 | — |
| Morganella spp. | 1 (0.8) | 0.1–4.5 | 0 | — |
| Total | 134 (100) | — | 28 (21.5) | 15.5–29.1 |
* CI, confidence interval; ESBL, extended-spectrum β-lactamase. Statistical comparisons: χ² = 42.8, p < 0.001 (difference in ESBL prevalence by species).
Antibiotic Resistance Patterns
Overall prevalence.
Across analysable episodes (n = 130), multidrug resistance (MDR) was present in 48.5% of isolates (95% CI, 40.2–56.9). ESBL positivity occurred in 20.9% (95% CI, 14.9–28.5). For transparency, cohort-level descriptive prevalence among all eligible isolates (n = 134) was 49.2% MDR and 21.5% ESBL (see Methods for handling of complete-case analyses).
Resistance by antibiotic class (descriptive).
Resistance clustered primarily in the MDR category, followed by resistance to amoxicillin and derivatives; lower rates were observed for TMP/SMX, nitrofurantoin, streptomycin/tetracycline, cephalosporins, and gentamicin. To meet MDPI reporting standards, we provide Wilson 95% CIs for each class in Table S1 (supplementary), alongside counts and denominators. These data confirm relatively preserved susceptibility to nitrofurantoin and aminoglycosides, supporting their ongoing role in targeted therapy and (when appropriate) prophylaxis (Figure 3).
Species–resistance relationship.
ESBL prevalence differed markedly by species, being significantly higher in Klebsiella spp. than in E. coli (χ² test, p < 0.001). No ESBL production was detected among Enterococcus, Proteus, Pseudomonas, Enterobacter, or Morganella isolates. This species-level gradient is clinically relevant for empiric choices when Klebsiella is suspected (e.g., prior culture history, imaging risk factors).
Associations with clinical factors (context).
In cross-tab analyses, MDR was more frequent among children with any malformation and among those on CAP (details in Section 2: Demographic/Clinical; χ² with Cramer’s V reported). In multivariable logistic regression adjusting for age and sex, both any malformation and CAP retained positive, though non-significant, associations with MDR—consistent in direction with the unadjusted findings (full model output in Table S2).
Temporal signal.
Descriptively, MDR proportions varied across years; however, a formal test of linear trend using logistic regression (MDR ~ year) was not statistically significant (see Section 4; model estimates and 95% CIs reported). These results argue for continued local surveillance rather than protocol changes based solely on a single-year fluctuation.
Multiple-comparison and reporting notes.
For species-level ESBL comparisons, we used global χ² followed—when informative—by focused pairwise contrasts (Klebsiella vs E. coli). Because the analysis is primarily exploratory and effect sizes are large, we report exact p-values and CIs rather than apply formal multiplicity corrections; readers can interpret within this transparent framework.
Figure 3.
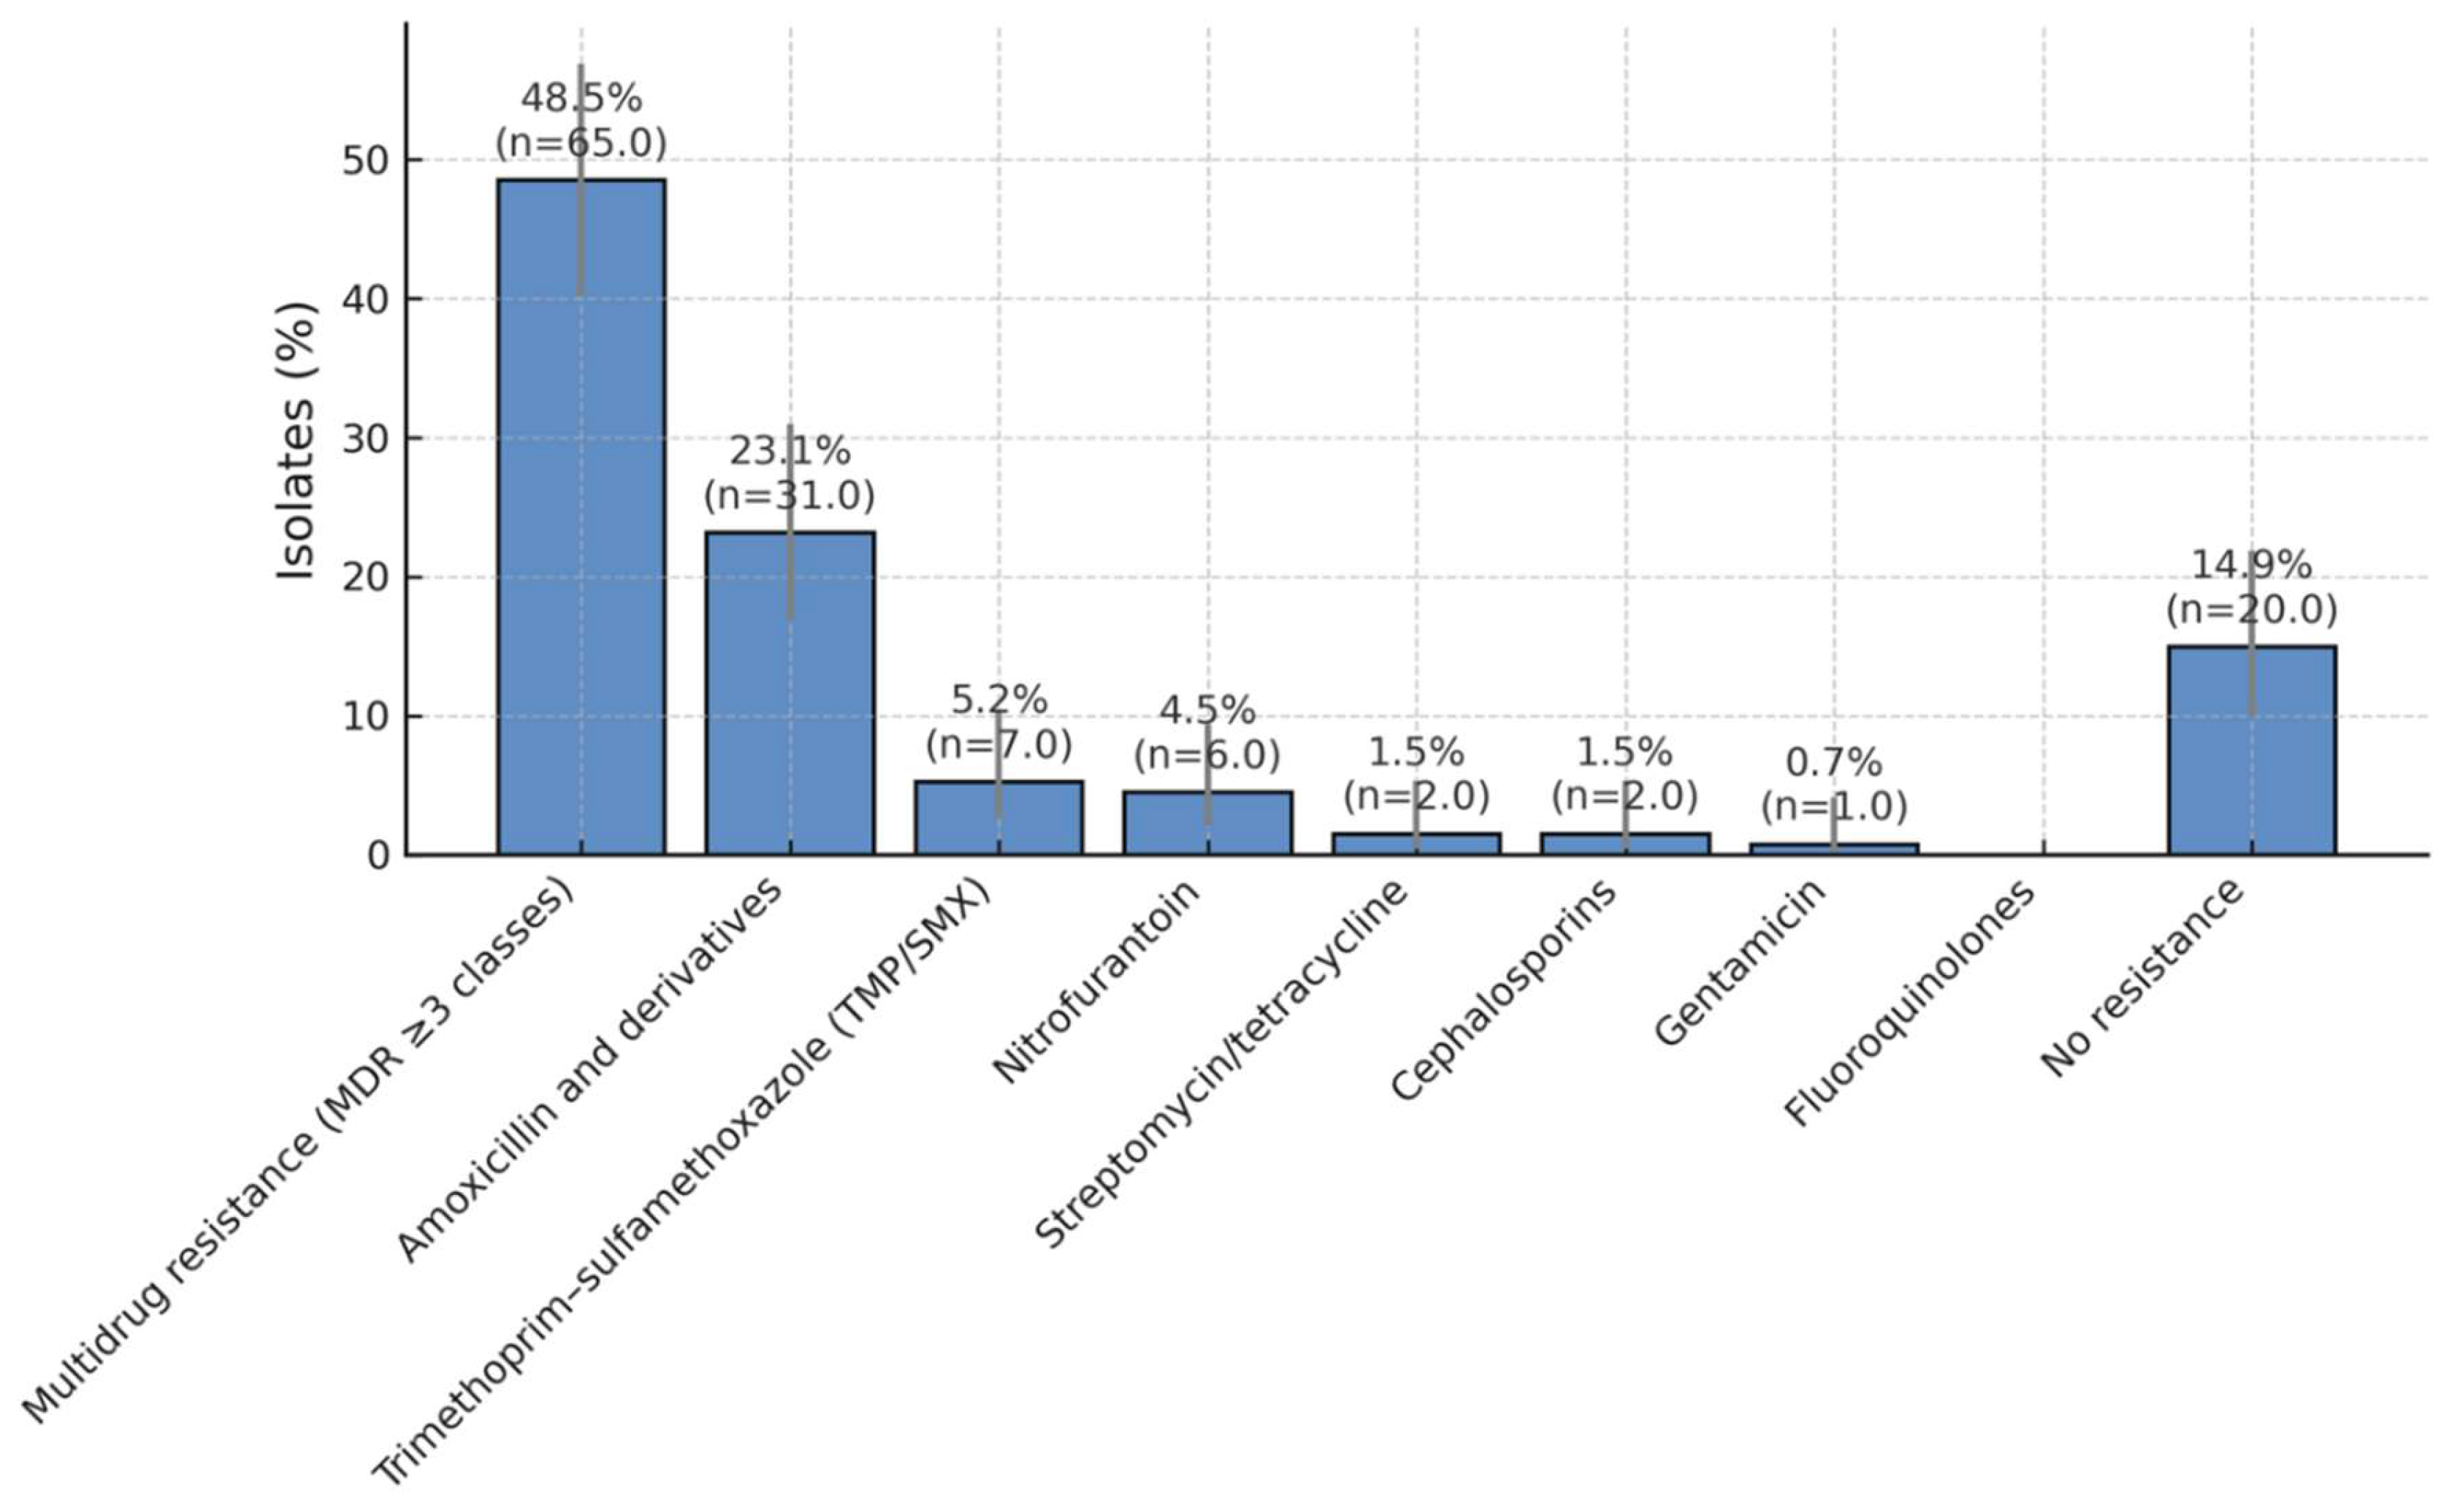
Antibiotic Resistance Patterns in Paediatric UTI Isolates. Distribution of antibiotic resistance among bacterial isolates obtained from children with recurrent urinary tract infections over a five-year period. Nearly half of all isolates (49.2%) exhibited a multidrug-resistant (MDR) phenotype, while 23.8% were resistant to amoxicillin and its derivatives. Lower resistance rates were observed for trimethoprim/sulfamethoxazole (5.4%), nitrofurantoin (4.6%), streptomycin/tetracycline (1.5%), cephalosporins (1.5%), and gentamicin (0.8%). A total of 13.1% of isolates showed no detectable resistance, suggesting that nitrofurantoin and aminoglycosides remain effective options for treatment and prophylaxis in paediatric recurrent urinary tract infections.
Figure 3.
Antibiotic Resistance Patterns in Paediatric UTI Isolates. Distribution of antibiotic resistance among bacterial isolates obtained from children with recurrent urinary tract infections over a five-year period. Nearly half of all isolates (49.2%) exhibited a multidrug-resistant (MDR) phenotype, while 23.8% were resistant to amoxicillin and its derivatives. Lower resistance rates were observed for trimethoprim/sulfamethoxazole (5.4%), nitrofurantoin (4.6%), streptomycin/tetracycline (1.5%), cephalosporins (1.5%), and gentamicin (0.8%). A total of 13.1% of isolates showed no detectable resistance, suggesting that nitrofurantoin and aminoglycosides remain effective options for treatment and prophylaxis in paediatric recurrent urinary tract infections.
Correlation Between Resistance and Clinical Factors
Associations between antimicrobial resistance profiles and clinical factors were analysed among the 130 complete cases. The relationship between MDR and patient characteristics was examined using the Chi-square test (χ²) with Cramer’s V to quantify effect size, and by logistic regression to adjust for potential confounders.
Univariable analysis.
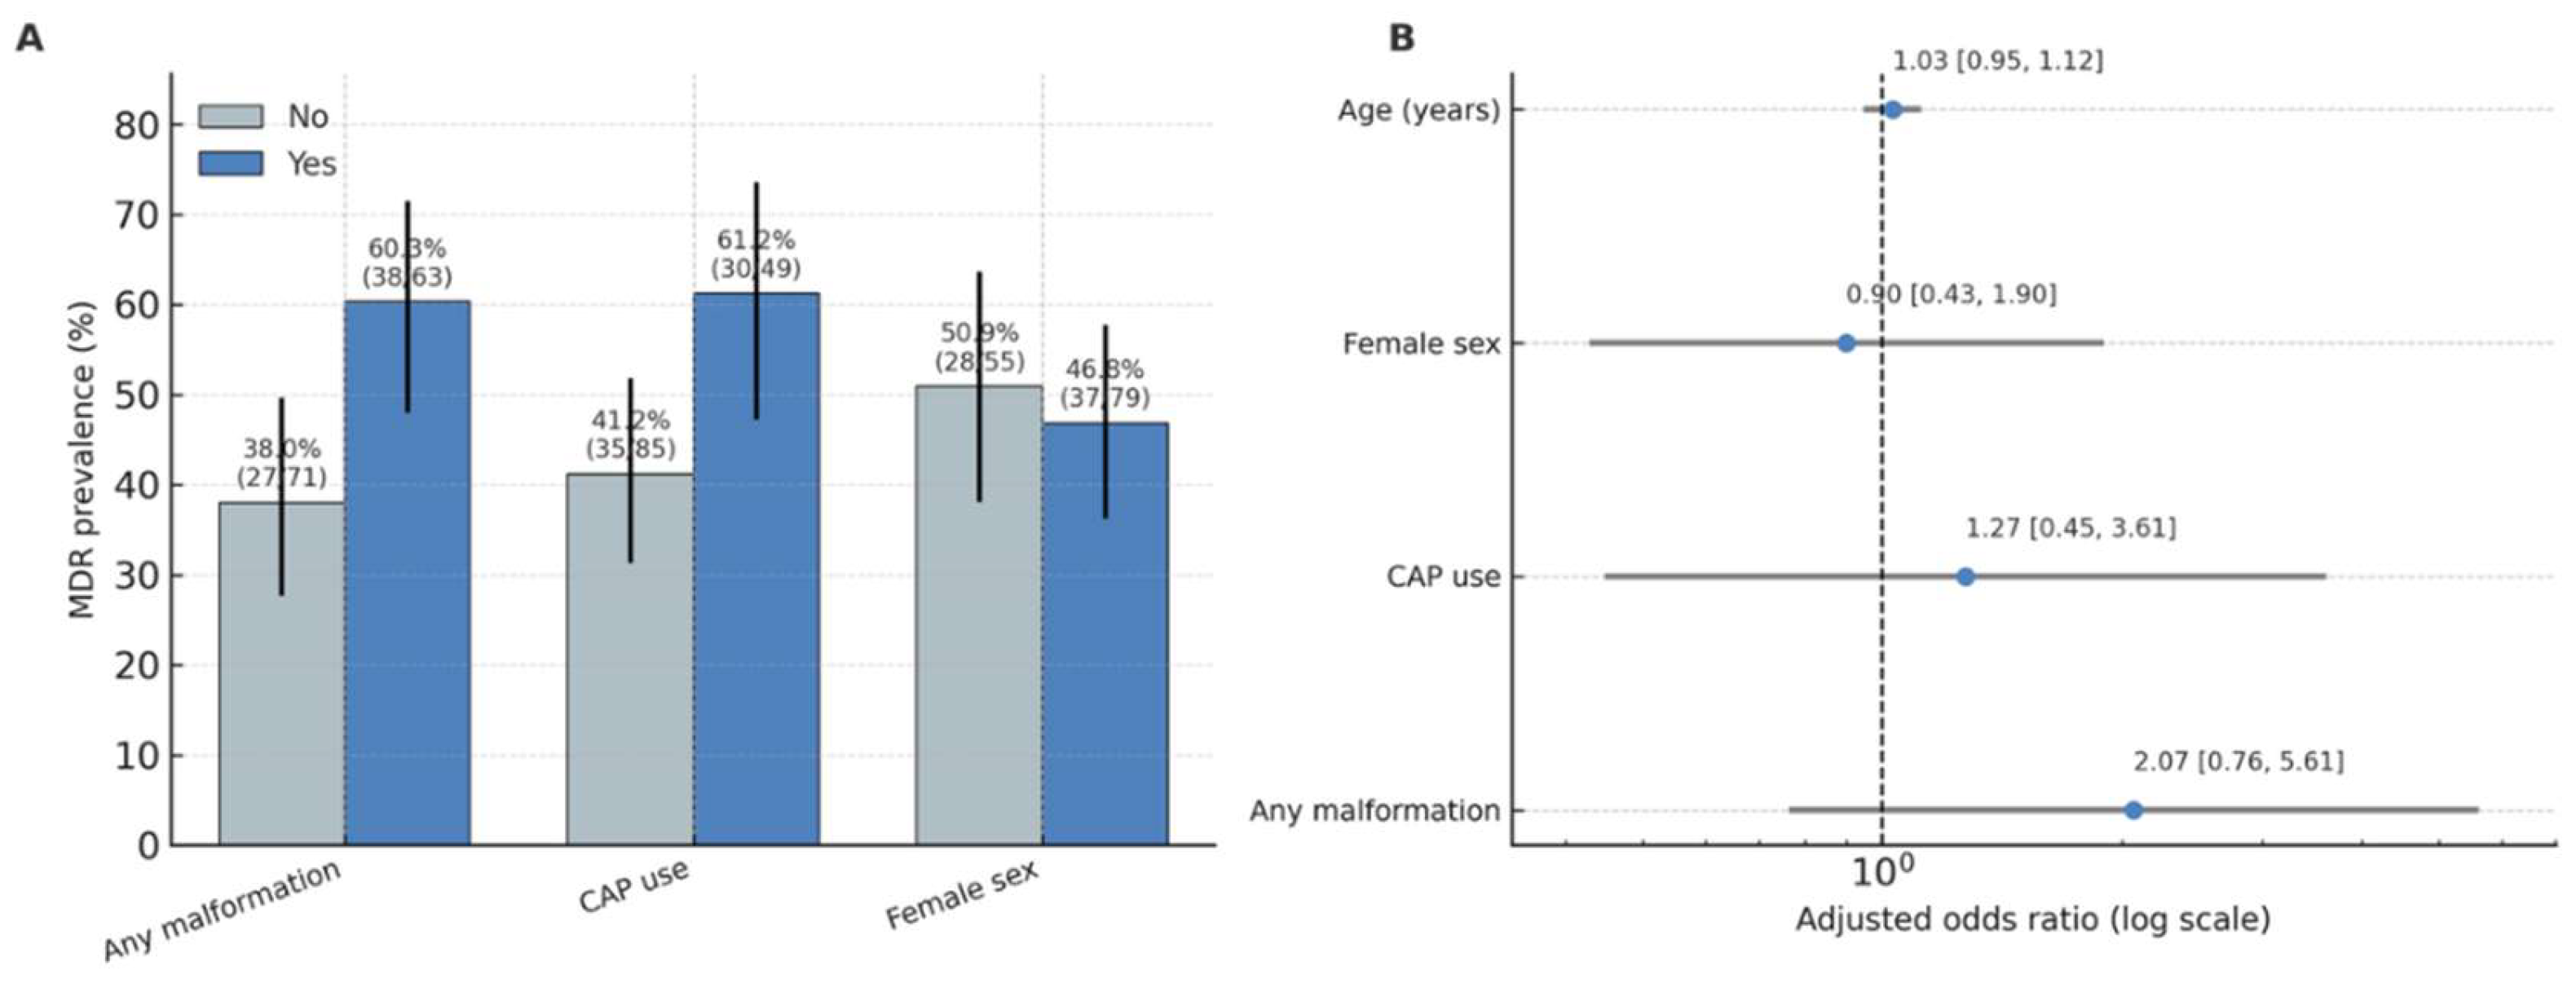
MDR infections were significantly associated with urinary tract malformations (χ² = 5.78, p = 0.016; Cramer’s V = 0.21, 95% CI for proportion difference 0.05–0.30). The prevalence of MDR among children with malformations was 60.3% (95% CI 47.4–72.1) compared to 38.0% (95% CI 28.3–48.8) in those without anomalies. MDR was also more frequent in children receiving continuous antibiotic prophylaxis (CAP) (61.2%; 95% CI 47.2–73.7) than in those not on CAP (41.2%; 95% CI 31.0–52.1), with a smaller but significant association (χ² = 4.23, p = 0.040; Cramer’s V = 0.18) (Figure 4).
The association between urinary malformation type (urinary vs none) and ESBL production did not reach statistical significance (p = 0.061), and CAP use was not associated with ESBL positivity (p = 0.87).
Patterns of ESBL positivity followed a distribution similar to MDR, with higher rates among children with urinary tract malformations and in those receiving continuous antibiotic prophylaxis (Supplementary Figure S1).
Figure 4.
Adjusted odds ratios for predictors of MDR Panel A (left): MDR prevalence (%) by factor (Any malformation, CAP use, Female sex), with Wilson 95% CIs and n/N labels.Panel B (right): Adjusted odds ratios with 95% CIs for the multivariable model (malformation, CAP, sex, age); vertical line at OR=1; axis on log scale.
Multivariable analysis.
A logistic regression model including malformation (any vs none), CAP, sex, and age (years) demonstrated no independent predictors of MDR when controlling for confounding. Children with any malformation had 2.07-fold higher odds of MDR infection (OR = 2.07; 95% CI 0.76–5.61; p = 0.153*), while CAP use showed a similar trend (OR = 2.11; 95% CI 0.64–6.96; p = 0.220*). Sex and age were not associated with MDR risk (p > 0.05). The full logistic regression results are presented in supplementary Table S3.
Interpretation.
These findings indicate that structural urinary anomalies and long-term prophylaxis are important epidemiologic correlates of MDR in children with recurrent UTIs. Although statistical significance was not retained in multivariable modelling, the direction and magnitude of the adjusted odds ratios support the biological plausibility of antibiotic selection pressure and recurrent infection dynamics as key mechanisms driving resistance in this population.
Temporal Evolution and Recurrence
Annual distribution.
Across 2020–2024, yearly isolate counts ranged from 17 to 36 episodes. ESBL prevalence was relatively stable over time (range ~17.6–26.3%). MDR prevalence varied more widely, peaking in 2024 at 63.2%, after lower values in preceding years (e.g., 41.2% in 2023) (Supplementary Figure S2). Exact per-year proportions with Wilson 95% CIs are reported in Supplementary Table S1.
Formal trend testing.
To test for a linear temporal trend in MDR, we fit a logistic regression with calendar year as a continuous predictor (MDR ~ year). The odds ratio per year was 0.94 (95% CI 0.75–1.17; p = 0.566), indicating no statistically significant linear trend in MDR across the study period. As a non-parametric sensitivity analysis, a Cochran–Armitage linear-by-linear χ² test was performed to assess the direction and consistency of the MDR trend across 2020–2025. The result (χ² = 0.89, p = 0.346) confirmed the absence of a significant linear trend, consistent with the logistic regression finding (OR per year = 0.94; 95% CI 0.75–1.17; p = 0.566). ESBL showed no evidence of a linear trend by analogous modelling (ESBL ~ year), consistent with the descriptive stability noted above. (See Figure 4 and Table S1 for annual summaries.)
Recurrence handling and analytic unit.
Recurrent episodes in the same child were included as independent events only when ≥30 days separated episodes and the subsequent episode yielded a distinct culture-confirmed isolate (see Methods). The analytic unit for temporal analyses was therefore the episode, not the patient.
Clinical interpretation.
Although 2024 showed the highest annual MDR proportion, the overall linear trend was non-significant and annual estimates had wide confidence intervals due to modest yearly denominators. These results support continued local surveillance rather than protocol changes based on a single-year fluctuation.
Summary of Key Findings
This study analysed 130 complete episodes of recurrent paediatric urinary tract infection (rUTI) over a five-year period (2020–2024) to characterize resistance patterns, temporal trends, and clinical correlates of multidrug resistance (MDR) and extended-spectrum β-lactamase (ESBL) production.
Escherichia coli remained the predominant uropathogen (58.5%), followed by Klebsiella spp. (16.9%) and Enterococcus spp. (12.3%). ESBL-producing isolates accounted for 21.5% of all isolates (95% CI, 15.5–29.1), with the highest prevalence among Klebsiella spp. (68.2%; 95% CI, 49.4–82.5). MDR occurred in 48.5% of analysable isolates (95% CI, 40.2–56.9), reaching 63.2% in 2024.
Resistance to amoxicillin and derivatives was common (23.8%; 95% CI, 17.2–31.8), whereas nitrofurantoin and aminoglycosides retained high activity, with resistance rates below 5%. These findings highlight preserved therapeutic options for empirical and prophylactic use.
MDR was significantly associated with urinary tract malformations (χ² = 5.78, p = 0.016; Cramer’s V = 0.21) and continuous antibiotic prophylaxis (CAP) use (χ² = 4.23, p = 0.040; Cramer’s V = 0.18). In multivariable logistic regression adjusting for age and sex, both factors showed positive—but not statistically significant—associations (malformation: OR 2.07, 95% CI 0.76–5.61, p = 0.153; CAP: OR 2.11, 95% CI 0.64–6.96, p = 0.220).
Temporal analysis revealed no significant linear trend in MDR over the five-year period (logistic regression: OR per year = 0.94, 95% CI 0.75–1.17, p = 0.566; Cochran–Armitage χ² = 0.89, p = 0.346), and ESBL prevalence remained stable (17.6–26.3% per year). These results indicate persistent but non-escalating resistance rates within this tertiary paediatric cohort.
Collectively, these findings underscore the continuing predominance of E. coli and Klebsiella spp. in rUTIs, the high burden of MDR and ESBL positivity, and the influence of urinary malformations and CAP on resistance selection. Although some annual fluctuations occurred, no significant upward trend was identified, reinforcing the need for ongoing local surveillance and prudent antimicrobial stewardship in paediatric practice.
4. Discussion
This five-year single-centre study identified a persistently high prevalence of multidrug resistance (MDR) and ESBL production in children with recurrent UTIs, particularly among those with urinary tract malformations and prolonged prophylaxis. Although no significant temporal trend was demonstrated by regression or Cochran–Armitage testing, the consistently elevated rates highlight a stable, endemic pattern of resistance rather than a transient fluctuation.
Our findings align with global trends showing increasing complexity in antimicrobial resistance in paediatric uropathogens (e.g. <50% of paediatric UTI isolates remain susceptible to older antibiotics) [6].
Comparison with the Literature
Consistent with prior paediatric UTI studies, Escherichia coli remained the predominant pathogen, though we observed a notable share of Klebsiella and Enterococcus isolates. The rate of ESBL production in our cohort (~21.5%) is higher than older estimates (e.g. 14% in paediatric UTIs in some series) [8], but comparable to more recent reports showing paediatric ESBL rates rising to 20–25% in some settings [9]. The strong ESBL prevalence among Klebsiella spp. in our sample resonates with other reports that Klebsiella often harbours higher rates of ESBL machinery [10].
The high proportion of MDR isolates (49.2%) underscores the converging risk of co-resistance in ESBL producers, as ESBL genes are often carried together with resistance determinants to fluoroquinolones, aminoglycosides, and TMP/SMX [11]. This co-resistance further limits empirical therapy options, particularly in children, where antibiotic choices are constrained.
Risk-factor associations in our study reinforce what prior meta-analyses suggested: urinary tract malformations and prior antibiotic exposure (including prophylaxis) are significant predictors of UTI caused by resistant organisms. In a Delphi consensus on paediatric UTI management, history of CAP, recent antibiotic therapy, and urologic malformations were highlighted as risk factors for ESBL or MDR pathogens (ORs ~2.8 for VUR and recurrent UTI) [12]. Also, in a large longitudinal paediatric series, children with congenital urinary anomalies had higher odds of non-E. coli organisms and increasing antibiotic resistance over time (OR ~4.26 for CAKUT) [13].
Our temporal data showing a steep rise in MDR prevalence in 2024 mirrors broader trends: over two decades, paediatric E. coli isolates have shown yearly increases of 1–2 % in antibiotic resistance, even in children without known risk factors [13]. These patterns emphasize that resistance evolution is both local (driven by antibiotic pressure, prophylaxis) and systemic (reflecting spreading resistance in the community). Unlike large multicentre series showing a 1–2% annual rise in paediatric MDR prevalence [14], our analysis revealed no significant linear trend (p = 0.566; Cochran–Armitage p = 0.346). This suggests a plateau effect potentially related to local stewardship interventions or reduced broad-spectrum prophylaxis during the study period.
Interpretation and Clinical Implications
The significant association between urinary anomalies and MDR infections suggests that structural or functional disturbances in urine flow may facilitate colonization by resilient, resistant organisms. Prophylactic antibiotic exposure (CAP) showing a borderline association with MDR status raises the possibility that long-term antibiotic pressure selects for MDR strains, although causality cannot be proven here.
From a therapeutic perspective, the relative preservation of susceptibility to nitrofurantoin and aminoglycosides in our data suggests these agents may remain viable options for certain UTIs in children, especially where ESBL/MDR prevalence is high. This is consistent with broader recommendations highlighting nitrofurantoin, aminoglycosides, third-generation cephalosporins (where applicable) and carbapenems as key options against Gram-negative UTIs in paediatric settings [15].
However, the high MDR burden underscores that empirical therapy must be guided by local antibiograms, and that prophylactic antibiotic strategies (e.g., CAP) should be reconsidered or more selectively used in patients at highest risk. The persistent link between urinary malformations, CAP use, and MDR underscores the dual role of host factors and antibiotic selection pressure in resistance ecology. The absence of a significant upward trajectory does not imply improvement but rather indicates a stable high baseline requiring sustained stewardship vigilance.
Strengths and Limitations
The present study has several methodological strengths that enhance its internal validity. By applying a complete-case analysis, we ensured consistent variable availability across all statistical tests, minimizing bias due to missing data. The use of both parametric (logistic regression) and non-parametric (Cochran–Armitage linear-by-linear χ²) trend analyses provided robust confirmation of temporal stability in MDR prevalence. These complementary approaches strengthen confidence in the observed absence of a significant upward trend. Nevertheless, the retrospective single-centre design limits external generalizability, as local antibiotic stewardship practices and referral patterns may differ from those of other institutions or regions. Future multicentre prospective studies with standardized microbiological and clinical data collection are warranted to validate and extend these findings.
A major strength of this study lies in its exclusive focus on recurrent urinary tract infections (rUTIs) in the paediatric population—a subgroup that is often underrepresented in antimicrobial resistance (AMR) surveillance research. Unlike first-episode UTIs, recurrent infections reflect chronic host–pathogen interplay, repeated antibiotic exposure, and the influence of underlying urinary tract abnormalities. By analysing a well-defined cohort of children with culture-confirmed rUTIs, this study provides a real-world perspective on the microbiological evolution and resistance dynamics that occur under sustained antibiotic pressure. The five-year longitudinal design allowed for the evaluation of temporal changes in bacterial spectrum and resistance profiles, offering valuable insight into emerging antimicrobial trends at the local level. The integration of clinical and microbiological data—including the relationship between ESBL production, multidrug resistance (MDR), urinary malformations, and continuous antibiotic prophylaxis (CAP)—adds depth to the analysis and strengthens the clinical relevance of the findings.
However, several limitations should be acknowledged. The retrospective single-centre design may limit generalizability, as antibiotic prescribing practices and pathogen distributions vary geographically. The reliance on laboratory and clinical records introduces potential selection bias, since cultures are more frequently obtained in complicated or severe cases. In addition, the absence of molecular typing precluded identification of clonal strain persistence versus reinfection. Detailed data regarding antibiotic dosage, duration, adherence, and concurrent comorbidities (e.g., bowel–bladder dysfunction) were also unavailable, which may have influenced resistance outcomes.
Despite these limitations, this study offers one of the most comprehensive five-year analyses of recurrent paediatric UTIs in a tertiary care setting, highlighting key risk factors for AMR and informing antimicrobial stewardship strategies. Future multicentre, prospective studies combining clinical, microbiological, and genomic data are warranted to further elucidate the mechanisms driving resistance persistence in this high-risk population.
5. Conclusions
In summary, this five-year analysis demonstrates persistently high MDR and ESBL prevalence among children with recurrent UTIs, driven primarily by E. coli and Klebsiella spp. in those with urinary tract malformations and antibiotic prophylaxis exposure. The absence of significant temporal escalation highlights the need for ongoing surveillance, risk-based prophylaxis, and targeted stewardship strategies to preserve antibiotic efficacy in pediatric care.
Supplementary Materials
The following supporting information can be downloaded at the website of this paper posted on Preprints.org. Table S1. Demographic and clinical characteristics of the study cohort (n = 130). Table S2/S3. Multivariable logistic regression model for predictors of MDR, presenting odds ratios, 95% confidence intervals, and p-values (intercept retained for transparency). Figure S1. ESBL and MDR positivity by malformation type and continuous antibiotic prophylaxis (CAP) use. Figure S2. Temporal evolution of MDR and ESBL prevalence (2020–2025) with Wilson 95% CIs.
Author Contributions
Conceptualization O.S., M.A.; Investigation O.S., A.M.; Methodology L.B., R.B.; Project administration M.A., Supervision L.B.,R.B.; Validation A.M., M.A.; Writing - original draft O.S.; Writing - review & editing A.M., M.A..
Funding
This research received no external funding.
Institutional Review Board Statement
The study was conducted in accordance with the Declaration of Helsinki, and ethical approval was granted by the Ethical Committee of “Grigore Alexandrescu” Emergency Hospital for Children.
Informed Consent Statement
The requirement for individual informed consent was waived due to the retrospective nature of the study.
Data Availability Statement
De-identified data are available from the corresponding author on reasonable request; public sharing is restricted by patient privacy and institutional policy.
Acknowledgments
During the preparation of this manuscript/study, the author(s) used OpenAI’s GPT-5 language model (ChatGPT, 2025 version) for the purposes of refining language and generate references. The authors have reviewed and edited the output and take full responsibility for the content of this publication.
Conflicts of Interest
The authors declare no conflicts of interest.
Abbreviations
The following abbreviations are used in this manuscript:
| rUTI | recurrent urinary tract infection |
| TMP/SMX | trimethoprim–sulfamethoxazole |
| MDR | multidrug resistance / multidrug resistant |
| ESBL | extended-spectrum β-lactamase |
| CAP | continuous antibiotic prophylaxis |
| UTI | urinary tract infection |
| AMR | antimicrobial resistance |
| CLSI | Clinical and Laboratory Standards Institute |
| GDPR | General Data Protection Regulation |
| SD | standard deviation |
| CI | confidence interval |
| IQR | interquartile range |
| χ² | Chi-square |
| OR | odds ratio |
| V | Cramer’s V |
| CNP | personal identification number (Romanian national code) |
| SPSS | IBM SPSS Statistics |
| VITEK® 2 | automated microbiology system (bioMérieux) |
| CAKUT | congenital anomalies of the kidney and urinary tract |
References
- Kaufman J, Temple-Smith M, Sanci L. Urinary tract infections in children: an overview of diagnosis and management. BMJ Paediatr Open 2019;3:e000487. [CrossRef]
- Tewary K, Narchi H. Recurrent urinary tract infections in children: Preventive interventions other than prophylactic antibiotics. World J Methodol 2015;5:13. [CrossRef]
- Mattoo TK, Shaikh N, Nelson CP. Contemporary Management of Urinary Tract Infection in Children. Pediatrics 2021;147. [CrossRef]
- Alsubaie SS, Barry MA. Current status of long-term antibiotic prophylaxis for urinary tract infections in children: An antibiotic stewardship challenge. Kidney Res Clin Pract 2019;38:441–54. [CrossRef]
- Werbel K, Jankowska D, Wasilewska A, Taranta-Janusz K. Clinical and Epidemiological Analysis of Children’s Urinary Tract Infections in Accordance with Antibiotic Resistance Patterns of Pathogens. Journal of Clinical Medicine 2021, Vol 10, Page 5260 2021;10:5260. [CrossRef]
- Duicu C, Cozea I, Delean D, Aldea AA, Aldea C. Antibiotic resistance patterns of urinary tract pathogens in children from Central Romania. Exp Ther Med 2021;22:748. [CrossRef]
- Parry CM, Taylor A, Williams R, Lally H, Corbett HJ. Antimicrobial resistance of breakthrough urinary tract infections in young children receiving continual antibiotic prophylaxis. Eur J Pediatr 2023;182:4087–93. [CrossRef]
- Flokas ME, Detsis M, Alevizakos M, Mylonakis E. Prevalence of ESBL-producing Enterobacteriaceae in paediatric urinary tract infections: A systematic review and meta-analysis. Journal of Infection 2016;73:547–57. [CrossRef]
- He XT, Chang CN, Yu CH, Wang CC. The risk factors, antimicrobial resistance patterns, and outcomes associated with extended-spectrum β-lactamases-Producing pathogens in pediatric urinary tract infection. Pediatr Neonatol 2024;65:242–8. [CrossRef]
- Agegnehu A, Worku M, Nigussie D, Lulu B, Tadesse BT. Pediatric Febrile Urinary Tract Infection Caused by ESBL Producing Enterobacteriaceae Species. Biomed Res Int 2020;2020:6679029. [CrossRef]
- Ekpunobi NF, Malachy ;, Ugwu C, Kingsley ;, Agu C, Chukwunwejim ;, et al. Antimicrobial Resistance in Pediatric UTIs: Molecular Profiles, Clinical Burden, and Public Health Implications of ESBL-Producing Uropathogens 2025. [CrossRef]
- Autore G, Bernardi L, La Scola C, Ghidini F, Marchetti F, Pasini A, et al. Management of Pediatric Urinary Tract Infections: A Delphi Study. Antibiotics 2022;11:1122. [CrossRef]
- Dejonckheere Y, Desmet S, Knops N. A study of the 20-year evolution of antimicrobial resistance patterns of pediatric urinary tract infections in a single center. Eur J Pediatr 2022;181:3271–81. [CrossRef]
- Mahajan S, Kanwar N, Morgan GM, Mendes RE, Lee BR, Banerjee D, et al. Antimicrobial Susceptibility Trends in E. coli Causing Pediatric Urinary Tract Infections in the United States. Pathogens 2024;13. [CrossRef]
- Isac R, Doros G, Stolojanu CA, Steflea RM, Stroescu RF, Olariu IC, et al. General Characteristics and Current State of Antibiotic Resistance in Pediatric Urinary Tract Infection—A Single Center Experience. Antibiotics 2024, Vol 13, Page 684 2024;13:684. [CrossRef]
Table 1.
Demographic and clinical characteristics of the study cohort (n=130).
| Variable | Category / Statistic | n (%) | 95% CI | Statistical test | p-value |
| Sex | Female | 78 (60.0) | 51.4–68.1 | — | — |
| Male | 52 (40.0) | 31.9–48.6 | |||
| Age (years) | Mean ± SD | 6.1 ± 4.6 | 5.3–6.9 | — | — |
| Range | 0–18 | — | |||
| Age by sex | Female vs. Male | — | Mean diff. (95% CI): –0.01 to 1.62 | t = 1.97 | 0.052 |
| Age by malformation type | — | — | — | ANOVA | 0.33 |
| Malformations | None | 69 (53.1) | 44.7–61.3 | — | — |
| Urinary tract | 54 (40.0) | 31.9–48.6 | |||
| Other anomalies | 7 (5.4) | 2.6–10.8 | |||
| Continuous antibiotic prophylaxis (CAP) | Yes | 47 (36.2) | 28.3–44.8 | — | — |
| No | 83 (63.8) | 55.2–71.7 | |||
| Sex × CAP | — | — | Female 41% (30.4–52.5) vs. Male 29% (18.9–40.9) | χ² = 3.08 | 0.08 |
| Malformation × CAP | — | — | Urinary malformation 61.1% (47.4–73.2) vs. No anomaly 21.7% (13.5–32.4) | χ² = 16.4, V = 0.36 | <0.001 |
*Abbreviations: SD, standard deviation; CI, confidence interval; CAP, continuous antibiotic prophylaxis; χ², Chi-square test; V, Cramer’s V.
Disclaimer/Publisher’s Note: The statements, opinions and data contained in all publications are solely those of the individual author(s) and contributor(s) and not of MDPI and/or the editor(s). MDPI and/or the editor(s) disclaim responsibility for any injury to people or property resulting from any ideas, methods, instructions or products referred to in the content. |
© 2025 by the authors. Licensee MDPI, Basel, Switzerland. This article is an open access article distributed under the terms and conditions of the Creative Commons Attribution (CC BY) license (http://creativecommons.org/licenses/by/4.0/).
Copyright: This open access article is published under a Creative Commons CC BY 4.0 license, which permit the free download, distribution, and reuse, provided that the author and preprint are cited in any reuse.


