
Submitted:
30 October 2025
Posted:
03 November 2025
You are already at the latest version
Abstract
Microplastics represent an emerging threat to marine ecosystems, human health, and coastal aesthetics, with increasing concern about their accumulation on beaches due to ocean currents, wave action, and accidental spills. Despite their environmental impact, current methods for detecting and quantifying microplastics remain largely manual, time-consuming, and spatially limited. In this study, we propose a deep learning-based approach for the semantic segmentation of microplastics on sandy beaches, enabling pixel-level localization of small particles under real-world conditions. Twelve segmentation models were evaluated, including U-Net and its variants (Attention U-Net, ResUNet), as well as state-of-the-art architectures such as LinkNet, PAN, PSPNet, and YOLOv11 with segmentation heads. Models were trained and tested on augmented data patches, and their performance was assessed using Intersection over Union (IoU) and Dice coefficient metrics. LinkNet achieved the best performance with a Dice coefficient of 80% and an IoU of 72.6% on the test set, showing superior capability in segmenting microplastics even in the presence of visual clutter such as debris or sand variation. Qualitative results support the quantitative findings, highlighting the robustness of the model in complex scenes.
Keywords:
microplastics
; semantic segmentation
; environmental monitoring
; deep neural networks
1. Introduction
Plastics, while versatile in applications ranging from industry to food preservation, pose a significant environmental threat when they decompose into smaller fragments known as microplastics. Microplastics are an environmental issue that severely impacts marine ecosystems. It is estimated that between 4.7 and 12.8 million metric tons of plastic entered the ocean in 2010, and without proper management, the accumulated amount of plastic waste that could enter the ocean from land is projected to increase by an order of magnitude by 2025 [1]. These plastics fragment due to UV radiation and wave action into increasingly smaller pieces, transforming into microplastics. Microplastics are deposited on shores, carried by sea currents, and in highly exposed areas, concentrations on beaches can reach values of more than 300 grams of microplastics per square meter [2].
In addition to the harm they may cause to marine organisms that ingest them, microplastics also cause aesthetic and landscape damage. This is a growing concern for citizens, local authorities in coastal areas, as well as for administrations at all levels and research funding programs. This issue became evident following the accident of the “Toconao” ship off the Portuguese coast. The ship was carrying containers filled with pellets, the raw material used to manufacture plastics, which are about 5 mm in diameter. This type of spill generates significant environmental damage due to the impossibility of removing these pellets from the sea because of their small size and the large number of pellets each container holds. Once they reach the shores, cleaning and removing them from the beaches is very difficult, which caused great public alarm.
Furthermore, the toxicity of these pellets depends on the additives they carry, which could pose a problem for marine organisms. This accident highlighted the need for monitoring and alert systems to detect the arrival of unusually high quantities of pellets or any other type of microplastic that could pose a threat to ecosystems or cause significant landscape damage on beaches. Various studies have demonstrated the significant variability in the reaching of microplastics on beaches, which depends on wind, wave action, and currents [2]. This results in a substantial difference in concentration even between consecutive days of sampling, making it very difficult to monitor coastal arrival due to the considerable sampling effort and enormous expense in human resources.
In Europe, the objective of the Marine Strategy Framework Directive (MSFD, 2008/56/EC) [3] is to assess trends in good environmental status, for which it is necessary to implement monitoring programs, in this case, for Descriptor 10 related to marine litter. As noted by Galgani et al. [4], the unequal spatial and temporal distribution of marine debris presents a challenge when designing a statistically robust monitoring program. Therefore, one of the major challenges in this field of study is finding a way to automate both the quantification and classification of microplastics, saving time and sampling effort.
Thanks to Artificial Intelligence, several studies are attempting to develop technologies with this goal in mind. Additionally, citizens who visit beaches daily could help by collecting samples or images that would allow automated quantification and classification, generating data that would inform authorities of possible spills or unusually high microplastic arrivals, enabling them to make decisions such as increasing cleaning services. Currently, apps Marine Litter Watch 1 or MARNOBA 2 have been developed for use with smartphones to monitor macro-litter, but to date, mesoplastics (5-25 mm) and microplastics (5-1 mm) have not been included.
The present study represents an effort in the development of software for the automatic quantification of microplastics on beaches, which could be incorporated into any of the currently existing apps for marine litter monitoring. In this context, our work focuses on benchmarking optimal neural network architectures for microplastic segmentation in coastal environments. This research aims to contribute to environmental monitoring by applying advanced computer vision techniques, laying the groundwork for future automated systems for microplastic detection and management in coastal areas.
2. Related Works
As stated in the introduction, the analysis of debris on the coast, especially plastic debris, is of significant interest to the scientific community. In some cases, this analysis is performed manually by experts who analyze aerial images, as demonstrated by the study conducted by Moy et al. [5], which analyzed almost 76 km of coastline across the main Hawaiian Islands of Niihau, Kauai, Oahu, Molokai, Lanai, Maui, Kahoolawe, and Hawaii. A similar study is that of Deidun et al. [6], where aerial images of the Maltese Islands were used to categorize different types of debris, including plastics. In another example of visual analysis, Kako et al. [7] monitored Newport Beach in Oregon over the course of one year to observe whether debris from the Great Tohoku Earthquake and the massive tsunami of March 11, 2011, reached the west coast of the United States. Photographs were taken and analyzed to count the amount of debris present on the beach.
Visual analysis of images is time-consuming, so the introduction of automatic techniques from the field of computer vision can alleviate the task and enable the monitoring of wider areas. Gonçalvez et al. [8] analyzed the presence of plastics on Cabedelo Beach (Portugal) using aerial images captured by a drone. Those authors focused on meso-litter items (sizes between 2.5 cm and 50 cm) due to the resolution of the images taken from an altitude of 20 m. Meso-litter items were classified at the pixel level using color as an input feature to a Random Forest classifier [9]. The images were divided into 320 × 320-sized patches, which were then rescaled to 64 × 64. Results were reported in terms of the F1-score, as the task was approached as a classification problem, yielding scores of 76% and 57% for plastics located on the beach and in the dunes, respectively. A similar approach, but using a neural network instead of a Random Forest, was employed by Pinto et al. [10] on Leirosa Beach (Portugal), achieving an average F1-score of 49% across the different types of litter considered. In a more recent study, Ross Winans [11] utilized the annotated images from Moy et al. [5] to train various deep learning methods for litter detection, with the best F1-score of 50.7% achieved using SSD with MobileNetV2.
The detection of beached marine plastics has been explored not only in the visible range but also in the infrared spectrum. Cocking et al. [12] utilized a hyperspectral SWIR (short-wave infrared) camera to detect plastics on a beach from a height of 5 meters, covering a beach transect. The setup was not natural; instead, it was prepared by the researchers, who placed plastic items with different polymer compositions along dry sandy regions of the shoreline. The results obtained depended on the threshold used in the SCM measure employed by the authors and the type of polymer, either PE or PP, with detection rates ranging from 51% to 100%
Previous works that aim to automatically detect plastic items on beaches using methods from the computer vision field primarily focus on object detection. Object detection methods produce bounding boxes that enclose detected objects but do not delineate them at the pixel level in images. To achive the latter, segmentation methods have been proposed, receiving significant attention in the computer vision field over the decades. For example, in 1975, Otsu’s method introduced an adaptive thresholding technique that minimizes intra-class variance, providing a robust baseline for segmenting high-contrast objects within varying backgrounds [13]. The method, proposed by Sauvola and Pietikäinen [14], calculates a local threshold based on the mean and standard deviation within a sliding window across the image, allowing the segmentation to adapt to variations in background and lighting.
In the last years, with the rise of deep learning approaches, numerous methods have been proposed. One of the first proposed methods was the Fully Convolutional Network (FCN) [15], which modifies traditional convolutional neural networks (CNNs) for pixel-wise prediction tasks. This is achieved by replacing fully connected layers with convolutional layers. Another models obtained as an improvement of a detection models are Mask R-CNN [16] and YOLO [17]. Thus Mask R-CNN is an extension of Faster R-CNN [18], integrates instance segmentation capabilities by adding a branch that predicts segmentation masks for each Region of Interest (RoI). Similarly, YOLO originally designed for object detection, has evolved to include segmentation capabilities. Its latest versions provide instance segmentation by predicting masks for detected objects.
Another widely used model is U-Net [19], featuring an encoder-decoder architecture with skip connections. These connections enable precise localization while preserving contextual information. Similarly, LinkNet [20] employs an encoder-decoder architecture with skip connections, achieving competitive performance while using significantly fewer parameters. The Pyramid Attention Network (PAN) [21] leverages a spatial pyramid attention mechanism to enhance feature extraction for semantic segmentation. By incorporating attention mechanisms, PAN effectively captures global context and improves pixel-level classification accuracy. These methods will be discussed in more detail in Section 3.2.
3. Materials and Methods
3.1. Microplastic Images Dataset
Images of the microplastics were captured using both a digital camera and a mobile phone positioned at a height of approximately 1 meter at Las Canteras Beach (28º08’02"N, 15º26’30"W), a sandy urban beach located on the northern coast of Gran Canaria (Spain) facing the North Atlantic Ocean (Figure 1). The total length of the beach is approximately 3 km, but the area under consideration is the westernmost part, as it is the most exposed to currents and spans roughly 800 meters. In this part of the beach, the sand displays several shades, ranging from yellow (Figure 2) to dark gray (Figure 3).
The use of a drone was discarded because achieving sufficient resolution to detect small plastic particles requires the drone to fly at very low altitudes, which, as noted by Andriolo [22], poses significant safety risks for people on the beach. For example, Topouzelis et al. [23] report that using a Sony A5100 24.3-megapixel camera mounted on a drone flying at an altitude of 100 meters results in a spatial resolution of approximately 5 cm/pixel, making this approach unfeasible for detecting microplastics with sizes on the order of millimeters.
The images acquired with the camera and mobile phone are of high resolution, 4928 × 3264 and 3840 × 2160 pixels respectively, which implies that the models need to increase their number of parameters to process the original images at full size. These 72 images were obtained from two image acquisition campaigns conducted as part of two master’s theses [24,25]. A common technique widely used to address this issue is dividing high-resolution images into smaller patches. For example, Han et al. [26] employed 512 × 512-sized patches as input to the Mask R-CNN network to segment images of microplastics captured in a laboratory setting against a white background. In this paper, we have opted to divide the images into patches of 256 × 256 pixels. As a result, a dataset comprising 604 images with corresponding annotations was created. Figure 4 shows examples of the cropped images alongside their corresponding annotations. A similar approach was applied by Lorenzo-Navarro et al. [27] to classify microplastic particles using a combination of U-Net as segmenter and VGG16 as classifier.
3.2. Methods
As stated in the introduction, the aim of this paper is to evaluate whether segmentation methods can effectively segment microplastics on the beach that have been washed ashore by the tide. In this study, we considered six architectures, including some variations, resulting in a total of 12 methods.
A brief description of each method is provided below.
3.2.1. U-Net
The U-Net architecture comprises a contracting path for feature extraction and an expansive path for precise localization. The contracting path includes repeated 3x3 convolutions with ReLU activation, followed by 2x2 max pooling for downsampling, doubling the feature channels at each step. The expansive path involves upsampling, 2x2 "up-convolutions" to halve feature channels, concatenation with corresponding cropped features from the contracting path, and 3x3 convolutions with ReLU activation. A final 1x1 convolution maps features to the desired classes. The network contains 23 convolutional layers.
Some variations of the original architecture have been proposed. Attention U-Net [28] incorporates attention gates (AGs) to refine the skip connections by emphasizing salient features and filtering out irrelevant or noisy responses before the concatenation step. AGs also downweight gradients from background regions during the backward pass, ensuring that updates to the shallow layers prioritize spatially relevant areas. Another variant of the U-Net is ResUNet [29] where convolutional blocks in the U-Net are replaced by residual blocks [30] to ease training, enhance information propagation through skip connections, and achieve high performance with fewer parameters.
3.2.2. YOLO
YOLO [17] is a series of models initially proposed as real-time object detection framework that treat detection as a single regression problem, predicting bounding boxes and class probabilities directly from an image in one evaluation. Recent versions, such as those developed by Ultralytics (e.g., YOLOv8), have extended YOLO’s capabilities to include instance segmentation. These models retain the core YOLO architecture made up of a backbone for feature extraction, a neck for multi-scale feature aggregation, and a detection head, but augment it with a segmentation head that generates mask prototypes and affinity maps to delineate object boundaries. The segmentation head operates in parallel with the bounding box and class prediction heads, leveraging the same multi-scale features to ensure efficient, real-time performance.
3.2.3. LinkNet
The LinkNet architecture consists of an encoding path for feature extraction and a decoding path for reconstruction. The encoding path follows one of the ResNet backbones, using residual blocks with repeated 3×3 convolutions, batch normalization, and ReLU activation. Downsampling is achieved through strided convolutions, reducing spatial resolution and increasing the number of feature channels.
The decoding path mirrors the encoding process, but progressively restores spatial resolution using transposed convolutions ("up-convolutions"). Each decoder block is directly linked to its corresponding encoder block through residual connections, which transfer spatial information without additional learnable parameters. This linkage compensates for information loss caused by downsampling, enabling efficient reconstruction with minimal computational overhead. A final 1×1 convolution maps the feature maps to the desired segmentation classes.
3.2.4. Feature Pyramid Network
Feature Pyramid Network (FPN) [31] is not a standalone architecture but a feature enhancement strategy that can be integrated into various models. It is a top-down feature fusion mechanism designed to enhance multi-scale feature representations in deep convolutional networks. Unlike traditional approaches that use single-scale features or computationally expensive featurized image pyramids, FPN leverages the inherent pyramidal hierarchy of convolutional networks while maintaining high-level semantic information across all scales.
FPN consists of a bottom-up pathway, a top-down pathway, and lateral connections. The bottom-up pathway extracts hierarchical features using a convolutional backbone (e.g., ResNet), where deeper layers capture more abstract representations at progressively lower resolutions. The top-down pathway upsamples these high-level features, while lateral connections merge them with semantically weaker but spatially richer features from earlier layers using 1×1 convolutions and element-wise addition. A final 3×3 convolution is applied to refine the fused features. This approach ensures that all levels of the feature pyramid contain strong semantic representations, making it well-suited for tasks like object detection and segmentation.
3.2.5. Pyramid Attention Network
The Pyramid Attention Network (PAN) [31] is a deep learning model designed for semantic segmentation that combines attention mechanisms with spatial pyramids to improve feature extraction and pixel-wise classification. Unlike traditional approaches that rely on complex decoder structures or dilated convolutions, PAN integrates Feature Pyramid Attention (FPA) and Global Attention Upsample (GAU) modules to enhance multi-scale feature representation and spatial precision.
The Feature Pyramid Attention (FPA) module employs a spatial pyramid attention structure to capture multi-scale contextual information effectively while preserving localization details. It utilizes multiple convolutional kernels of different sizes, followed by global average pooling, to refine high-level feature maps.
The Global Attention Upsample (GAU) module improves the decoding process by using high-level global context to guide the upsampling of lower-level features, ensuring that category-specific information is retained while reducing computational overhead.
3.2.6. Pyramid Scene Parsing Network
Pyramid Scene Parsing network (PSP) [32] is a deep learning model designed to improve semantic segmentation by effectively capturing both local and global context information. Traditional Fully Convolutional Networks (FCNs) often struggle to understand complex scenes due to limited contextual awareness. PSPNet addresses this by introducing a pyramid pooling module that aggregates context from multiple regions, enabling the network to consider various scales of contextual information.
The pyramid pooling module operates by pooling features from different subregions of the image, generating representations that encompass diverse contextual scopes. These pooled features are then combined with the original feature map to produce a global prior, which enhances the network’s ability to parse scenes with complex and varied objects.
3.2.7. Loss
To mitigate segmentation bias [33], the models were trained using binary cross-entropy loss (Equation (1)). Binary cross-entropy is a widely used loss function for binary classification tasks, including binary segmentation, where the goal is to classify each pixel as belonging to either the foreground (class 1) or the background (class 0). The loss function measures the difference between the ground truth labels and the predicted probabilities for each pixel i. It is defined as:
Here, represents the ground truth label (0 or 1) for pixel i, is the predicted probability that pixel i belongs to the foreground, and N is the total number of pixels. The loss function penalizes incorrect predictions more heavily when the model is confident but wrong, encouraging the model to produce well-calibrated probabilities.
4. Results
To evaluate the performance of the segmentation models described in Section 3.2, we will use both the Intersection over Union (IoU) and the Dice coefficient (Dice) metrics. The IoU is a widely used metric for evaluating segmentation methods, as it measures the percentage of overlapping pixels between the ground truth and the predicted segmentation relative to their total union. The IoU is defined as:
where A represents the ground truth (i.e., the labeled image), and B denotes the predicted regions of the segmentation method. Here, is the number of overlapping pixels between the ground truth and predictions, while corresponds to the total number of pixels covered by either the ground truth or the predictions.
However, the Dice coefficient is particularly useful due to its sensitivity to small overlaps, making it well suited to detect fine-grained objects such as microplastic particles, which are small relative to the total area of the image (see Figure 2 and Figure 3). Additionally, the Dice coefficient balances the union and intersection by normalizing against the combined size of the predicted and ground truth regions, improving interpretability for imbalanced tasks like ours. The Dice coefficient is defined as:
where is the number of overlapping pixels, and A and B represent the total number of pixels in the ground truth and predictions, respectively. Unlike the IoU, the Dice coefficient’s denominator accounts for the sum of pixels in both regions, effectively giving double weight to the overlapping area.
To evaluate the segmentation models, the initial dataset described in Section 3 was partitioned into three disjoint subsets: training (483 samples), validation (60 samples), and test (61 samples). To enhance training data diversity, we applied an augmentation pipeline to the training images, which included vertical and horizontal flips (each with a probability of 0.5), color adjustments to simulate varying illumination conditions modifying brightness (0–0.1), hue (0–0.05), and saturation (0–0.1), rotations to simulate different camera orientations (0–10 degrees), and perspective transformations to simulate changes in camera position with a distortion scale between 0 and 0.2.
This process expanded the training subset to 1,449 images. The validation subset was used to optimize model hyperparameters, while the test subset - never exposed during training or validation - provided the final performance evaluation. This strict separation ensures that the generalizability of the model is assessed without bias.
Table 1 presents the results for the evaluated models. Two models achieved an IoU above 70% in the test set, which is considered a strong result. Regarding the Dice coefficient, eleven models surpassed 70%, LinkNet reaching 80%, a notable performance given that the Dice coefficient is a more stringent metric than the IoU. The lowest IoU and Dice coefficient are obtained with the ResUNet architecture. With respect to YOLOv11 models, they exhibit a low performance except the medium size model (YOLOv11m) that achieves the third best results in Dice coefficient and fourth best result with IoU metric. This fact can be explained due to the resolution of the images that are best suited for the medium model that for the rest.
Apart from the quantitative results measured by IoU and Dice metrics, qualitative evaluation is essential in computer vision applications, including this microplastics segmentation task, to analyze model behavior across diverse scenarios. Figure 5 displays the original images, ground truth masks, and LinkNet’s segmentation results for two test set images. These images contain not only microplastics but also debris. The model successfully segments only the microplastics particles, with one exception: a black particle adjacent to the blue one in the lower row, which is misclassified due to its visual similarity to unlabeled small rocks. In the upper image, non-microplastics objects (e.g., small rocks and a bird feather) are correctly ignored.
Figure 6 highlights the performance gap between LinkNet (the top-performing model) and PSPNet. While LinkNet correctly segments almost all microplastic particles, missing only a few very small ones on the right side of the image, PSPNet fails to detect many particles and produces low-resolution predictions. This is evident on the right side of its output, where multiple particles are grouped into a single, larger detection.
5. Discussion
The segmentation of microplastics on sand is a challenging task due to the presence of debris such as small rocks, wood fragments, and biological elements like bird feathers and algae. Among the segmentation models compared in this work, LinkNet and PAN exhibited the best performance. LinkNet employs skip connections similar to U-Net but uses element-wise addition of decoder information rather than U-Net’s concatenation scheme. PAN’s strong performance may stem from its attention mechanisms, which improve localization at the cost of increased computational overhead.
Although the dataset is relatively small, it encompasses diverse scenarios with varying sand colors (from dark to yellow), the most common found on sandy beaches, as well as microplastics of different colors and shapes. This diversity suggests that our approach could be applicable to other beaches with similar sand colors. Regarding particle shape representation, fibers are underrepresented in the images. These particles are particularly challenging to detect due to their minimal weight (making them prone to wind removal) and small size (complicating labeling efforts).
One key advantage of semantic segmentation is the level of detail it provides. Unlike detection methods that produce bounding boxes, which enable particle counting but cannot accurately estimate the area covered by microplastics, segmentation offers spatial measurements. This is particularly valuable for elongated particles, where bounding boxes typically encompass much larger areas than the actual microplastics. While these area estimates lack precision due to uncalibrated camera parameters, they nevertheless enable analysis of temporal trends in microplastic accumulation on beaches, eliminating the need for tedious manual counting and weighing procedures.
The emergence of large foundation models trained on millions of images has enabled zero-shot learning capabilities (where models can be applied without additional training) in semantic segmentation. Meta’s Segment Anything Model (SAM) [34] represents a significant advance in this field, demonstrating impressive segmentation performance. However, for specialized tasks like microplastic segmentation, such general-purpose models show notable limitations. As shown in Figure 7, when applied to the same image as in Figure 6, SAM produces results similar to those of PSPNet (Figure 6, bottom row), with the main difference being that it does not group particles into larger regions as PSPNet does. However, its performance is clearly lower than that of LinkNet, which was specifically trained for this task.
An automated monitoring system, which can be done on a daily basis with photographs taken with cameras or smartphones, would allow for rapid detection of massive arrivals of microplastics, enabling a quick response by authorities and clean-up services.
Author Contributions
Conceptualization: Javier Lorenzo-Navarro, Alicia Herrera; Methodology: Javier Lorenzo-Navarro; Software: Javier Lorenzo-Navarro, José Salas-Cáceres; Writing - Original Draft: Javier Lorenzo-Navarro; Writing - Review & Editing: Javier Lorenzo-Navarro, José Salas-Cáceres, Modesto Castrillón-Santana, May Gómez, Alicia Herrera; Funding acquisition: Javier Lorenzo-Navarro, Modesto Castrillón-Santana, May Gómez
Funding
This work is partially funded by project PID2021-122402OB-C22/MICIU/AEI/10.13039/501100011033 FEDER, UE, by project IMPLAMAC (MAC2/1.1a/265) financed by the Interreg MAC (European Fund to Regional Development, Macaronesian Cooperation), by the ACIISI-Gobierno de Canarias and European FEDER funds under project ULPGC Facilities Net and Grant EIS 2021 04, and by the Consejería de Universidades, Ciencia e Innovación y Cultura (Gobierno de Canarias) and the European Social Fund Plus (FSE+) under the funding framework for doctoral research.
Data Availability Statement
Data will be made available in an open-access repository upon acceptance of the manuscript.
Conflicts of Interest
The authors declare no conflicts of interest.
References
- Jambeck, J.R.; Geyer, R.; Wilcox, C.; Siegler, T.R.; Perryman, M.; Andrady, A.; Narayan, R.; Law, K.L. Plastic waste inputs from land into the ocean. Science 2015, 347, 768–771. [Google Scholar] [CrossRef] [PubMed]
- Herrera, A.; Asensio, M.; Martínez, I.; Santana, A.; Packard, T.; Gómez, M. Microplastic and tar pollution on three Canary Islands beaches: An annual study. Marine Pollution Bulletin 2018, 129, 494–502. [Google Scholar] [CrossRef] [PubMed]
- European Parliament. Directive 2008/56/EC of the European Parliament and of the Council of 17 June 2008 establishing a framework for community action in the field of marine environmental policy (Marine Strategy Framework Directive). Official Journal of the European Union 2008, 164, 19–40. [Google Scholar]
- Galgani, F.; Lusher, A.L.; Strand, J.; Haarr, M.L.; Vinci, M.; Jack, E.M.; Kagi, R.; Aliani, S.; Herzke, D.; Nikiforov, V.; et al. Revisiting the strategy for marine litter monitoring within the european marine strategy framework directive (MSFD). Ocean and Coastal Management 2024, 255. [Google Scholar] [CrossRef]
- Moy, K.; Neilson, B.; Chung, A.; Meadows, A.; Castrence, M.; Ambagis, S.; Davidson, K. Mapping coastal marine debris using aerial imagery and spatial analysis. Marine pollution bulletin 2018, 132, 52–59. [Google Scholar] [CrossRef] [PubMed]
- Deidun, A.; Gauci, A.; Lagorio, S.; Galgani, F. Optimising beached litter monitoring protocols through aerial imagery. Marine pollution bulletin 2018, 131, 212–217. [Google Scholar] [CrossRef] [PubMed]
- Kako, S.; Isobe, A.; Kataoka, T.; Yufu, K.; Sugizono, S.; Plybon, C.; Murphy, T.A. Sequential webcam monitoring and modeling of marine debris abundance. Marine pollution bulletin 2018, 132, 33–43. [Google Scholar] [CrossRef] [PubMed]
- Gonçalves, G.; Andriolo, U.; Pinto, L.; Bessa, F. Mapping marine litter using UAS on a beach-dune system: a multidisciplinary approach. Science of The Total Environment 2020, 706, 135742. [Google Scholar] [CrossRef] [PubMed]
- Breiman, L. Random forests. Machine Learning 2001, 45, 5–32. [Google Scholar] [CrossRef]
- Pinto, L.; Andriolo, U.; Gonçalves, G. Detecting stranded macro-litter categories on drone orthophoto by a multi-class Neural Network. Marine Pollution Bulletin 2021, 169, 112594. [Google Scholar] [CrossRef] [PubMed]
- Winans, W.R.; Chen, Q.; Qiang, Y.; Franklin, E.C. Large-area automatic detection of shoreline stranded marine debris using deep learning. International Journal of Applied Earth Observation and Geoinformation 2023, 124, 103515. [Google Scholar] [CrossRef]
- Cocking, J.; Narayanaswamy, B.E.; Waluda, C.M.; Williamson, B.J. Aerial detection of beached marine plastic using a novel, hyperspectral short-wave infrared (SWIR) camera. ICES Journal of Marine Science 2022, 79, 648–660. [Google Scholar] [CrossRef]
- Otsu, N.; et al. A threshold selection method from gray-level histograms. Automatica 1975, 11, 23–27. [Google Scholar] [CrossRef]
- Sauvola, J.; Pietikäinen, M. Adaptive document image binarization. Pattern recognition 2000, 33, 225–236. [Google Scholar] [CrossRef]
- Long, J.; Shelhamer, E.; Darrell, T. Fully convolutional networks for semantic segmentation. In Proceedings of the Proceedings of the IEEE conference on computer vision and pattern recognition, 2015, pp.
- He, K.; Gkioxari, G.; Dollár, P.; Girshick, R. Mask r-cnn. In Proceedings of the Proceedings of the IEEE international conference on computer vision, 2017, pp. 2961–2969.
- Redmon, J. You only look once: Unified, real-time object detection. In Proceedings of the Proceedings of the IEEE conference on computer vision and pattern recognition, 2016, pp. 779–788.
- Ren, S.; He, K.; Girshick, R.; Sun, J. Faster R-CNN: Towards real-time object detection with region proposal networks. IEEE transactions on pattern analysis and machine intelligence 2016, 39, 1137–1149. [Google Scholar] [CrossRef] [PubMed]
- Ronneberger, O.; Fischer, P.; Brox, T. U-net: Convolutional networks for biomedical image segmentation. In Proceedings of the Medical image computing and computer-assisted intervention–MICCAI 2015: 18th international conference, Munich, Germany, October 5-9, 2015, proceedings, part III 18; Springer, 2015; pp. 234–241. [Google Scholar]
- Chaurasia, A.; Culurciello, E. Linknet: Exploiting encoder representations for efficient semantic segmentation. In Proceedings of the 2017 IEEE visual communications and image processing (VCIP). IEEE; 2017; pp. 1–4. [Google Scholar]
- Li, H.; Xiong, P.; An, J.; Wang, L. Pyramid attention network for semantic segmentation. arXiv preprint arXiv:1805.10180, arXiv:1805.10180 2018.
- Andriolo, U.; Topouzelis, K.; van Emmerik, T.H.; Papakonstantinou, A.; Monteiro, J.G.; Isobe, A.; Hidaka, M.; Kako, S.; Kataoka, T.; Gonçalves, G. Drones for litter monitoring on coasts and rivers: suitable flight altitude and image resolution. Marine Pollution Bulletin 2023, 195, 115521. [Google Scholar] [CrossRef] [PubMed]
- Topouzelis, K.; Papakonstantinou, A.; Garaba, S.P. Detection of floating plastics from satellite and unmanned aerial systems (Plastic Litter Project 2018). International Journal of Applied Earth Observation and Geoinformation 2019, 79, 175–183. [Google Scholar] [CrossRef]
- Mesa Santana, F. Detección De Microplásticos En Playas Utilizando Técnicas De Visión Por Computador. Master’s thesis, Instituto Universitario SIANI, Universidad de Las Palmas de Gran Canaria, 2023.
- Ortiz Campos, E. Exploración de Técnicas Avanzadas de Visión por Computador para la Segmentación Eficiente de Microplásticos. Master’s thesis, Instituto Universitario SIANI, Universidad de Las Palmas de Gran Canaria, 2024.
- Han, X.L.; Jiang, N.J.; Hata, T.; Choi, J.; Du, Y.J.; Wang, Y.J. Deep learning based approach for automated characterization of large marine microplastic particles. Marine Environmental Research 2023, 183, 105829. [Google Scholar] [CrossRef] [PubMed]
- Lorenzo-Navarro, J.; Castrillón-Santana, M.; Sánchez-Nielsen, E.; Zarco, B.; Herrera, A.; Martínez, I.; Gómez, M. Deep learning approach for automatic microplastics counting and classification. Science of The Total Environment 2021, 765, 142728. [Google Scholar] [CrossRef] [PubMed]
- Oktay, O.; Schlemper, J.; Folgoc, L.L.; Lee, M.; Heinrich, M.; Misawa, K.; Mori, K.; McDonagh, S.; Hammerla, N.Y.; Kainz, B.; et al. Attention U-Net: Learning Where to Look for the Pancreas. [arXiv:cs.CV/1804.03999]. 2018. [Google Scholar]
- Zhang, Z.; Liu, Q.; Wang, Y. Road extraction by deep residual u-net. IEEE Geoscience and Remote Sensing Letters 2018, 15, 749–753. [Google Scholar] [CrossRef]
- He, K.; Zhang, X.; Ren, S.; Sun, J. Deep residual learning for image recognition. In Proceedings of the Proceedings of the IEEE conference on computer vision and pattern recognition, 2016, pp. 770–778.
- Lin, T.Y.; Dollár, P.; Girshick, R.; He, K.; Hariharan, B.; Belongie, S. Feature Pyramid Networks for Object Detection. In Proceedings of the Proceedings of the IEEE Conference on Computer Vision and Pattern Recognition (CVPR); 2017; pp. 2117–2125. [Google Scholar]
- Zhao, H.; Shi, J.; Qi, X.; Wang, X.; Jia, J. Pyramid Scene Parsing Network. In Proceedings of the Proceedings of the IEEE Conference on Computer Vision and Pattern Recognition (CVPR); 2017; pp. 2881–2890. [Google Scholar]
- Wang, Z.; Berman, M.; Rannen-Triki, A.; Torr, P.H.S.; Tuia, D.; Tuytelaars, T.; Gool, L.V.; Yu, J.; Blaschko, M.B. Revisiting Evaluation Metrics for Semantic Segmentation: Optimization and Evaluation of Fine-grained Intersection over Union, 2023, [arXiv:cs.CV/2310.19252].
- Kirillov, A.; Mintun, E.; Ravi, N.; Mao, H.; Rolland, C.; Gustafson, L.; Xiao, T.; Whitehead, S.; Berg, A.C.; Lo, W.Y.; et al. Segment Anything, 2023, [arXiv:cs.CV/2304.02643].
| 1 | |
| 2 |
Figure 1.
Las Canteras Beach. Las Palmas de Gran Canaria. Spain
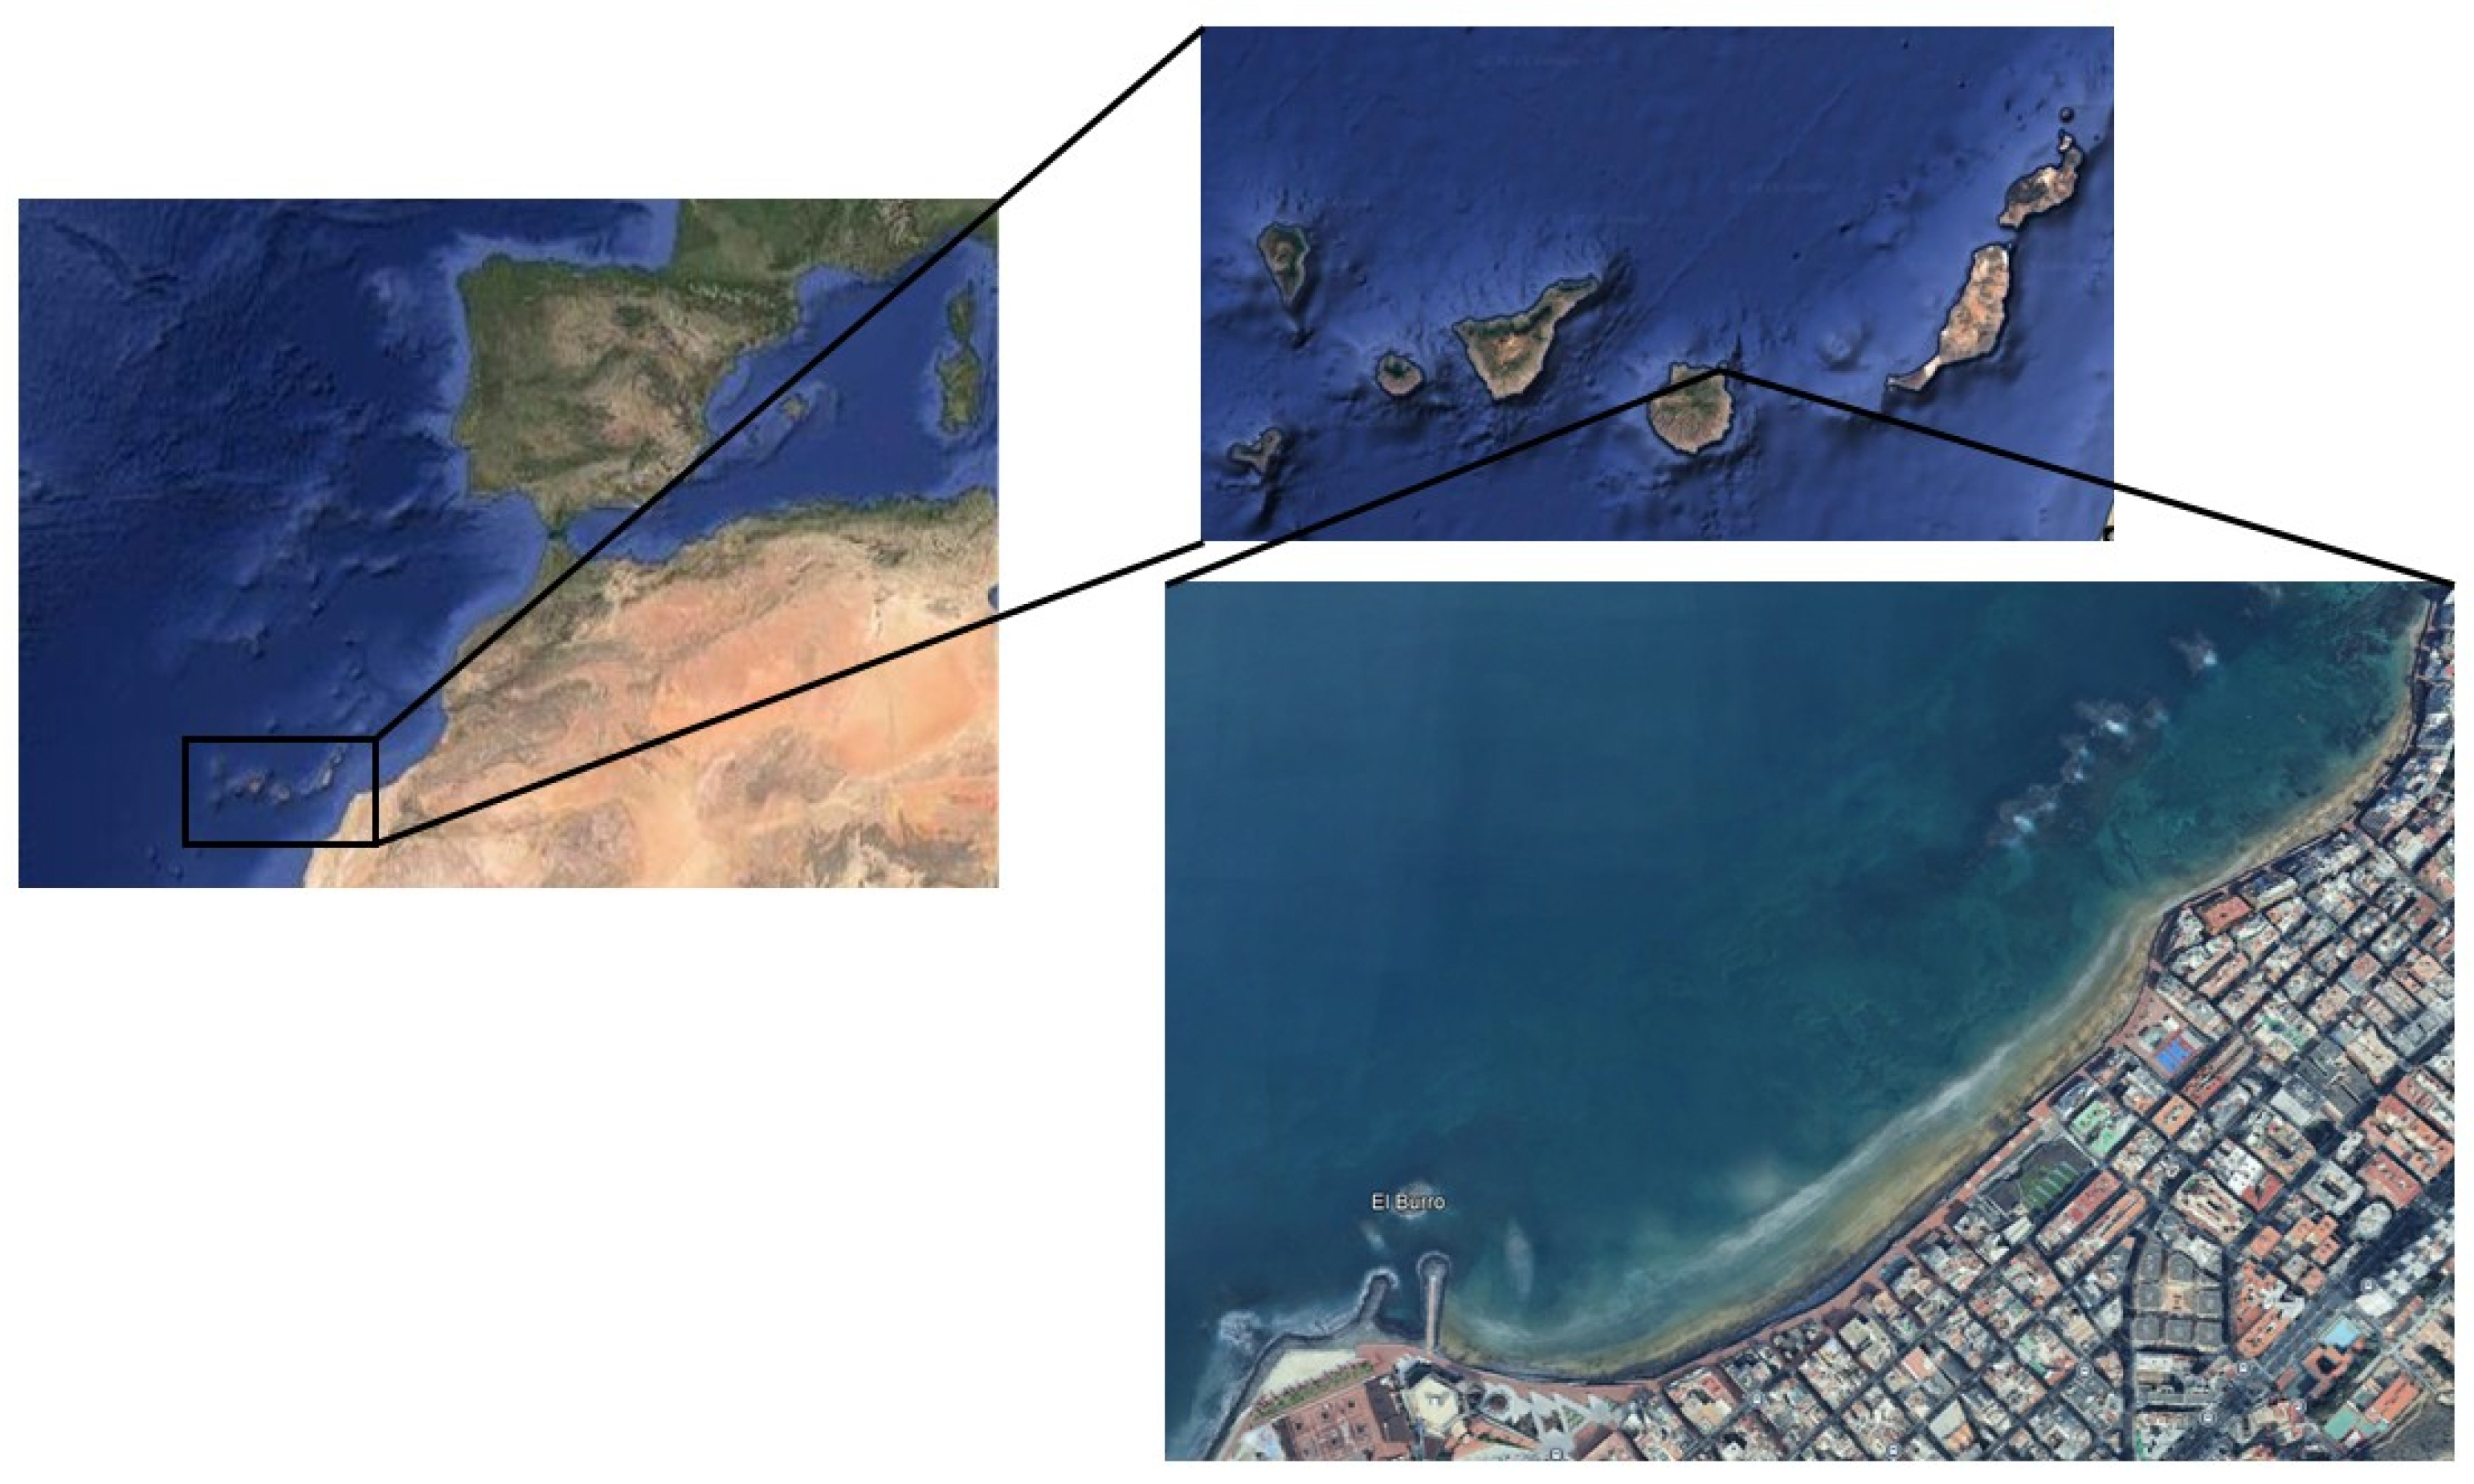
Figure 2.
Example of microplastics on yellow sand.
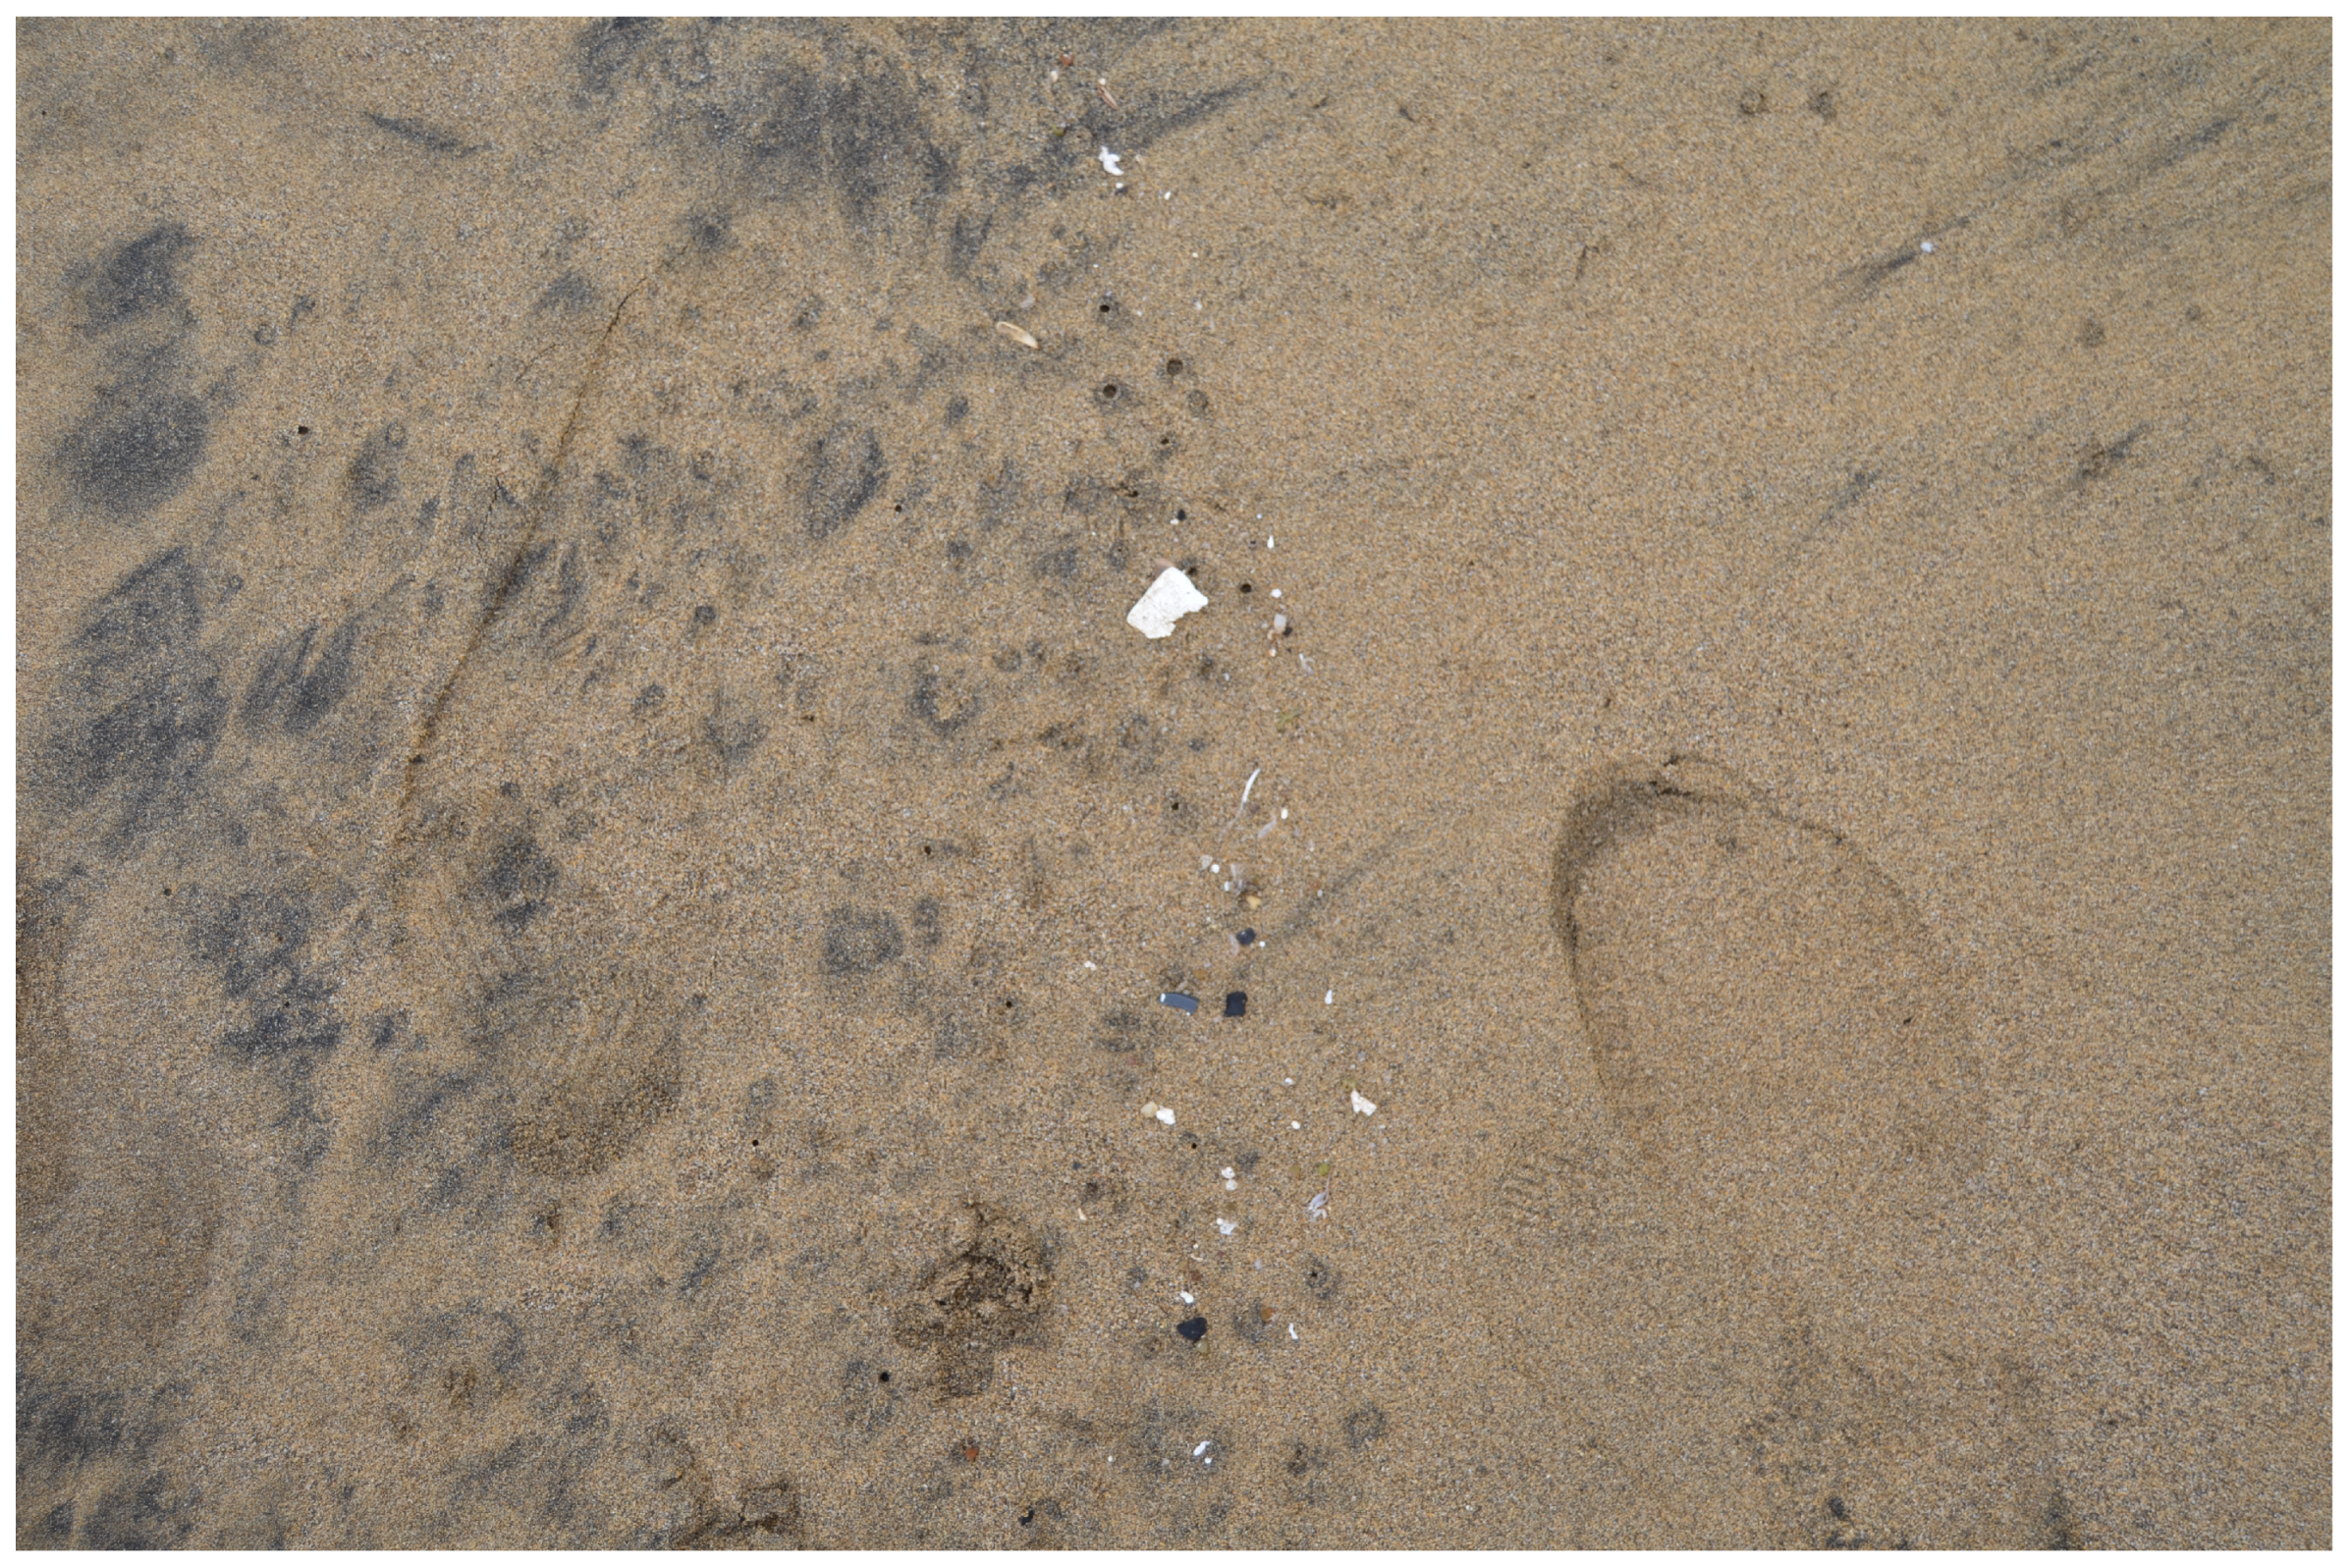
Figure 3.
Example of microplastics on dark gray sand.
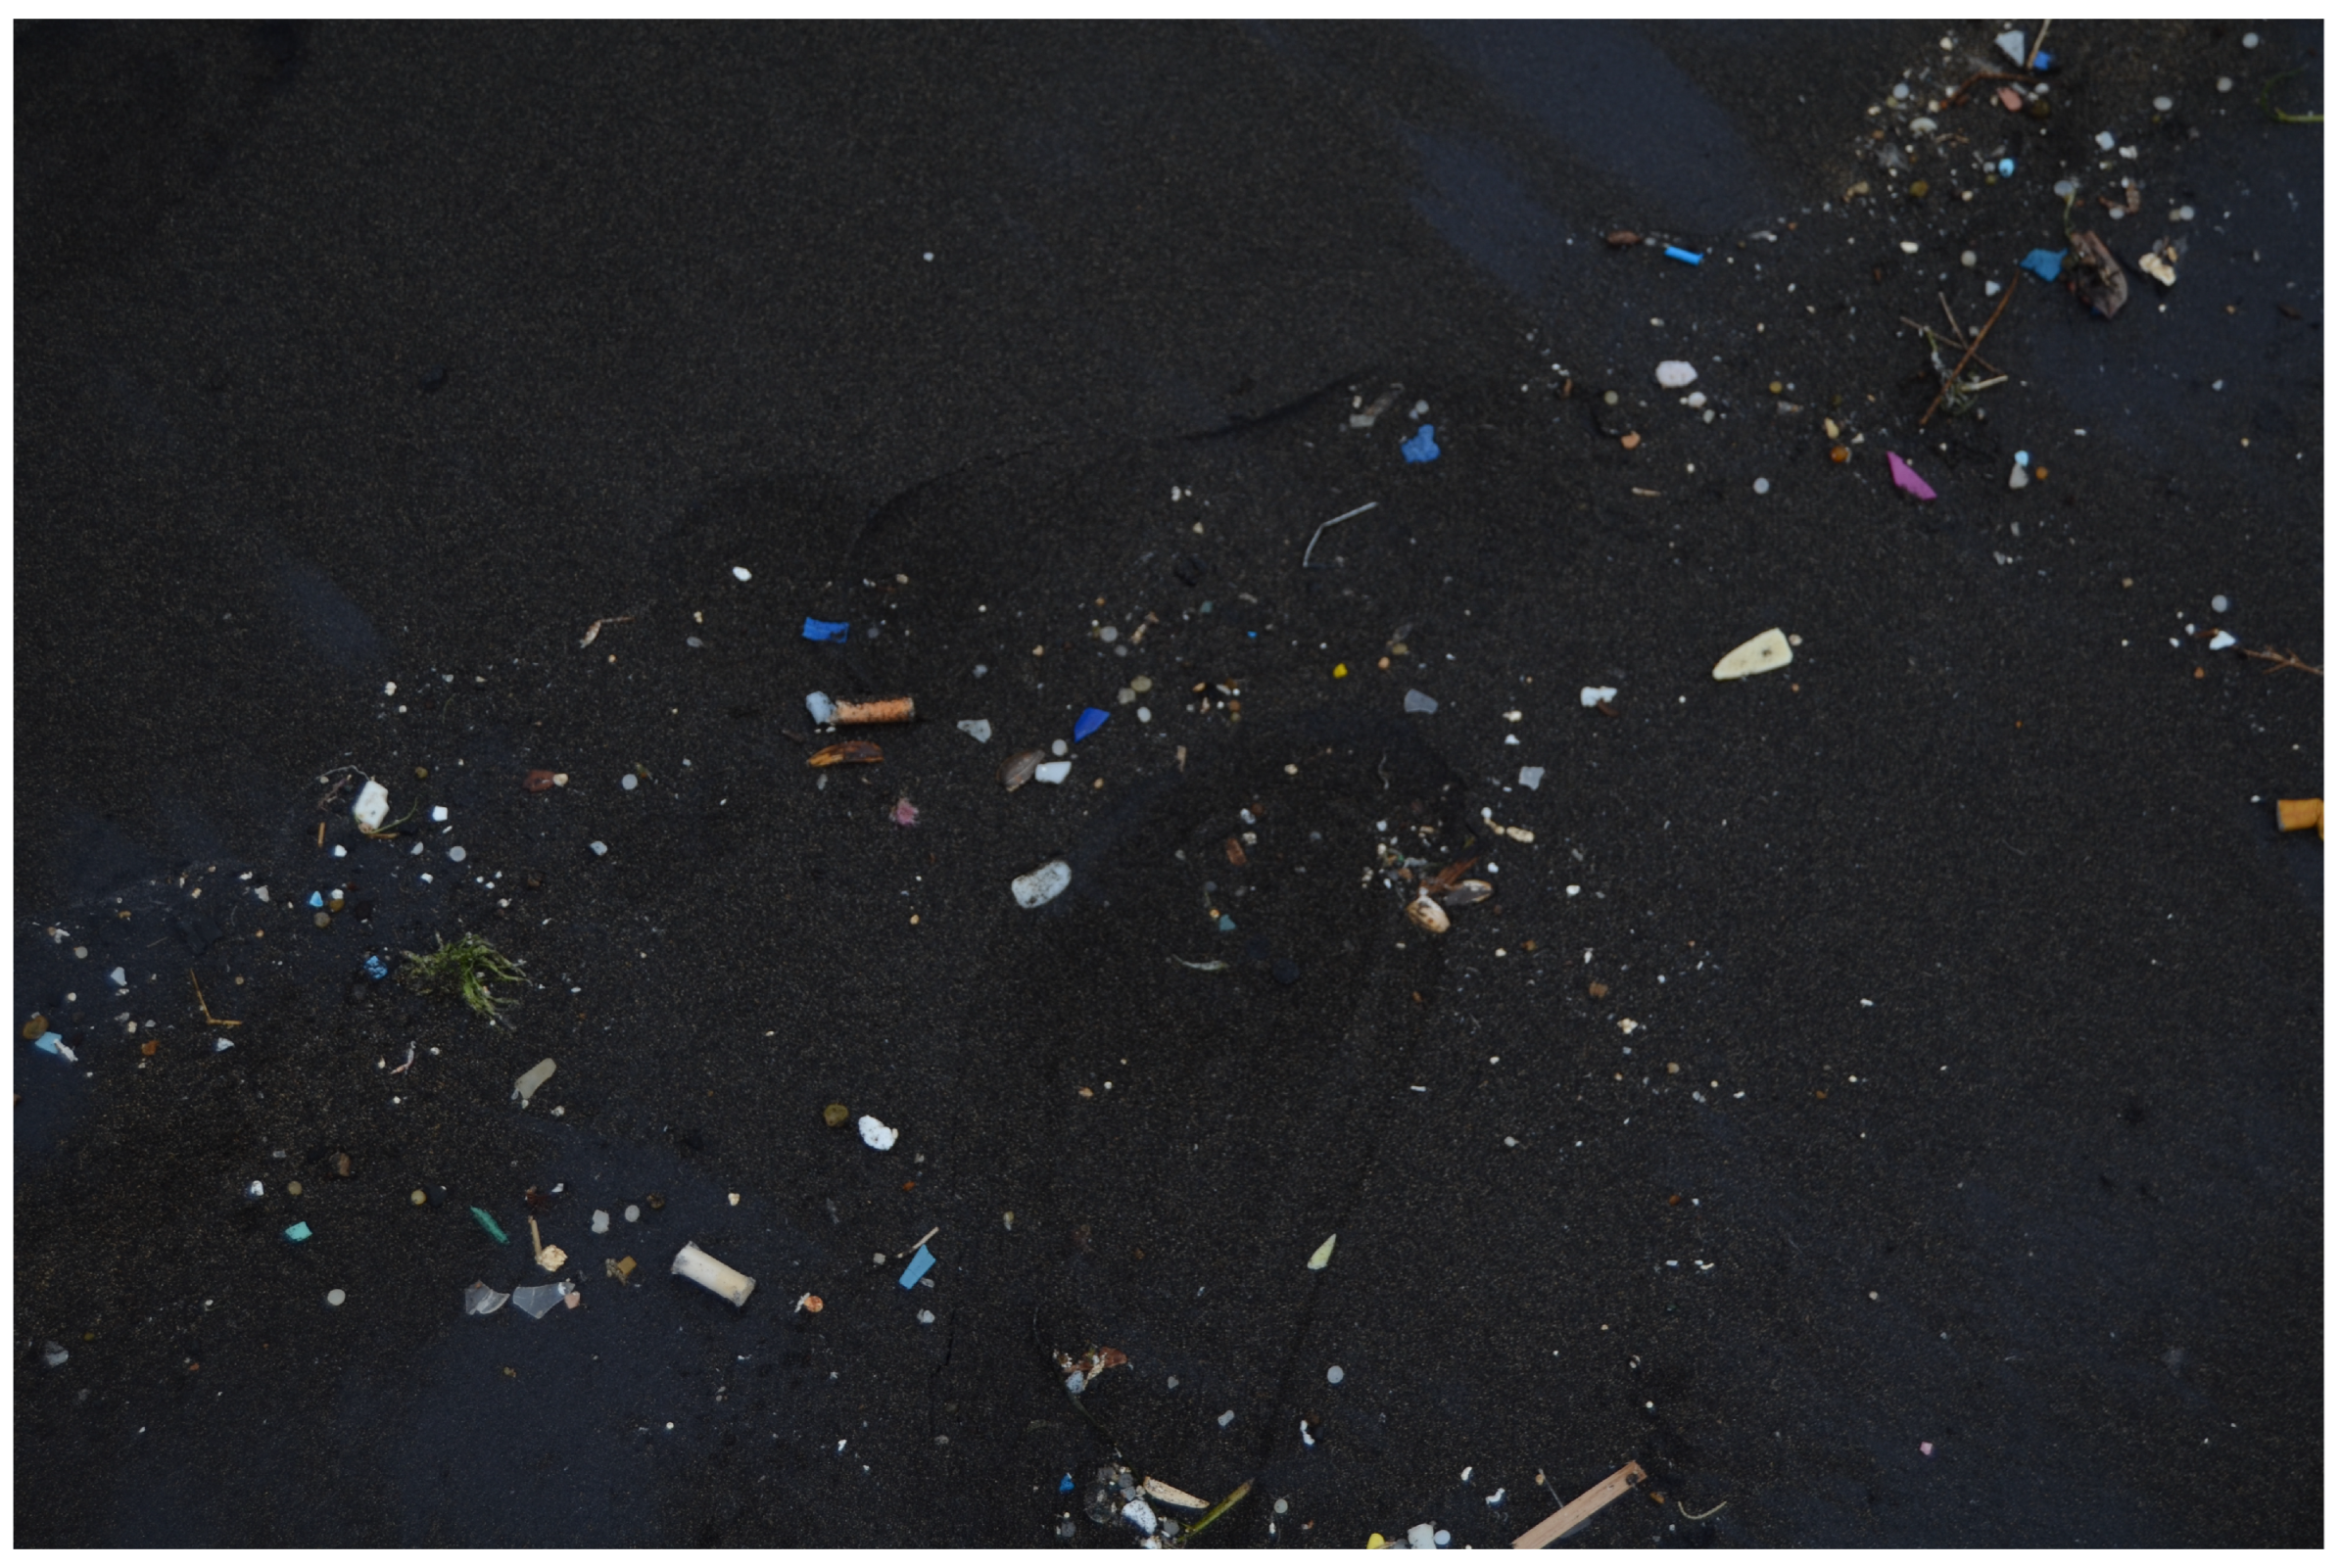
Figure 4.
Example dataset images paired with their corresponding annotations.
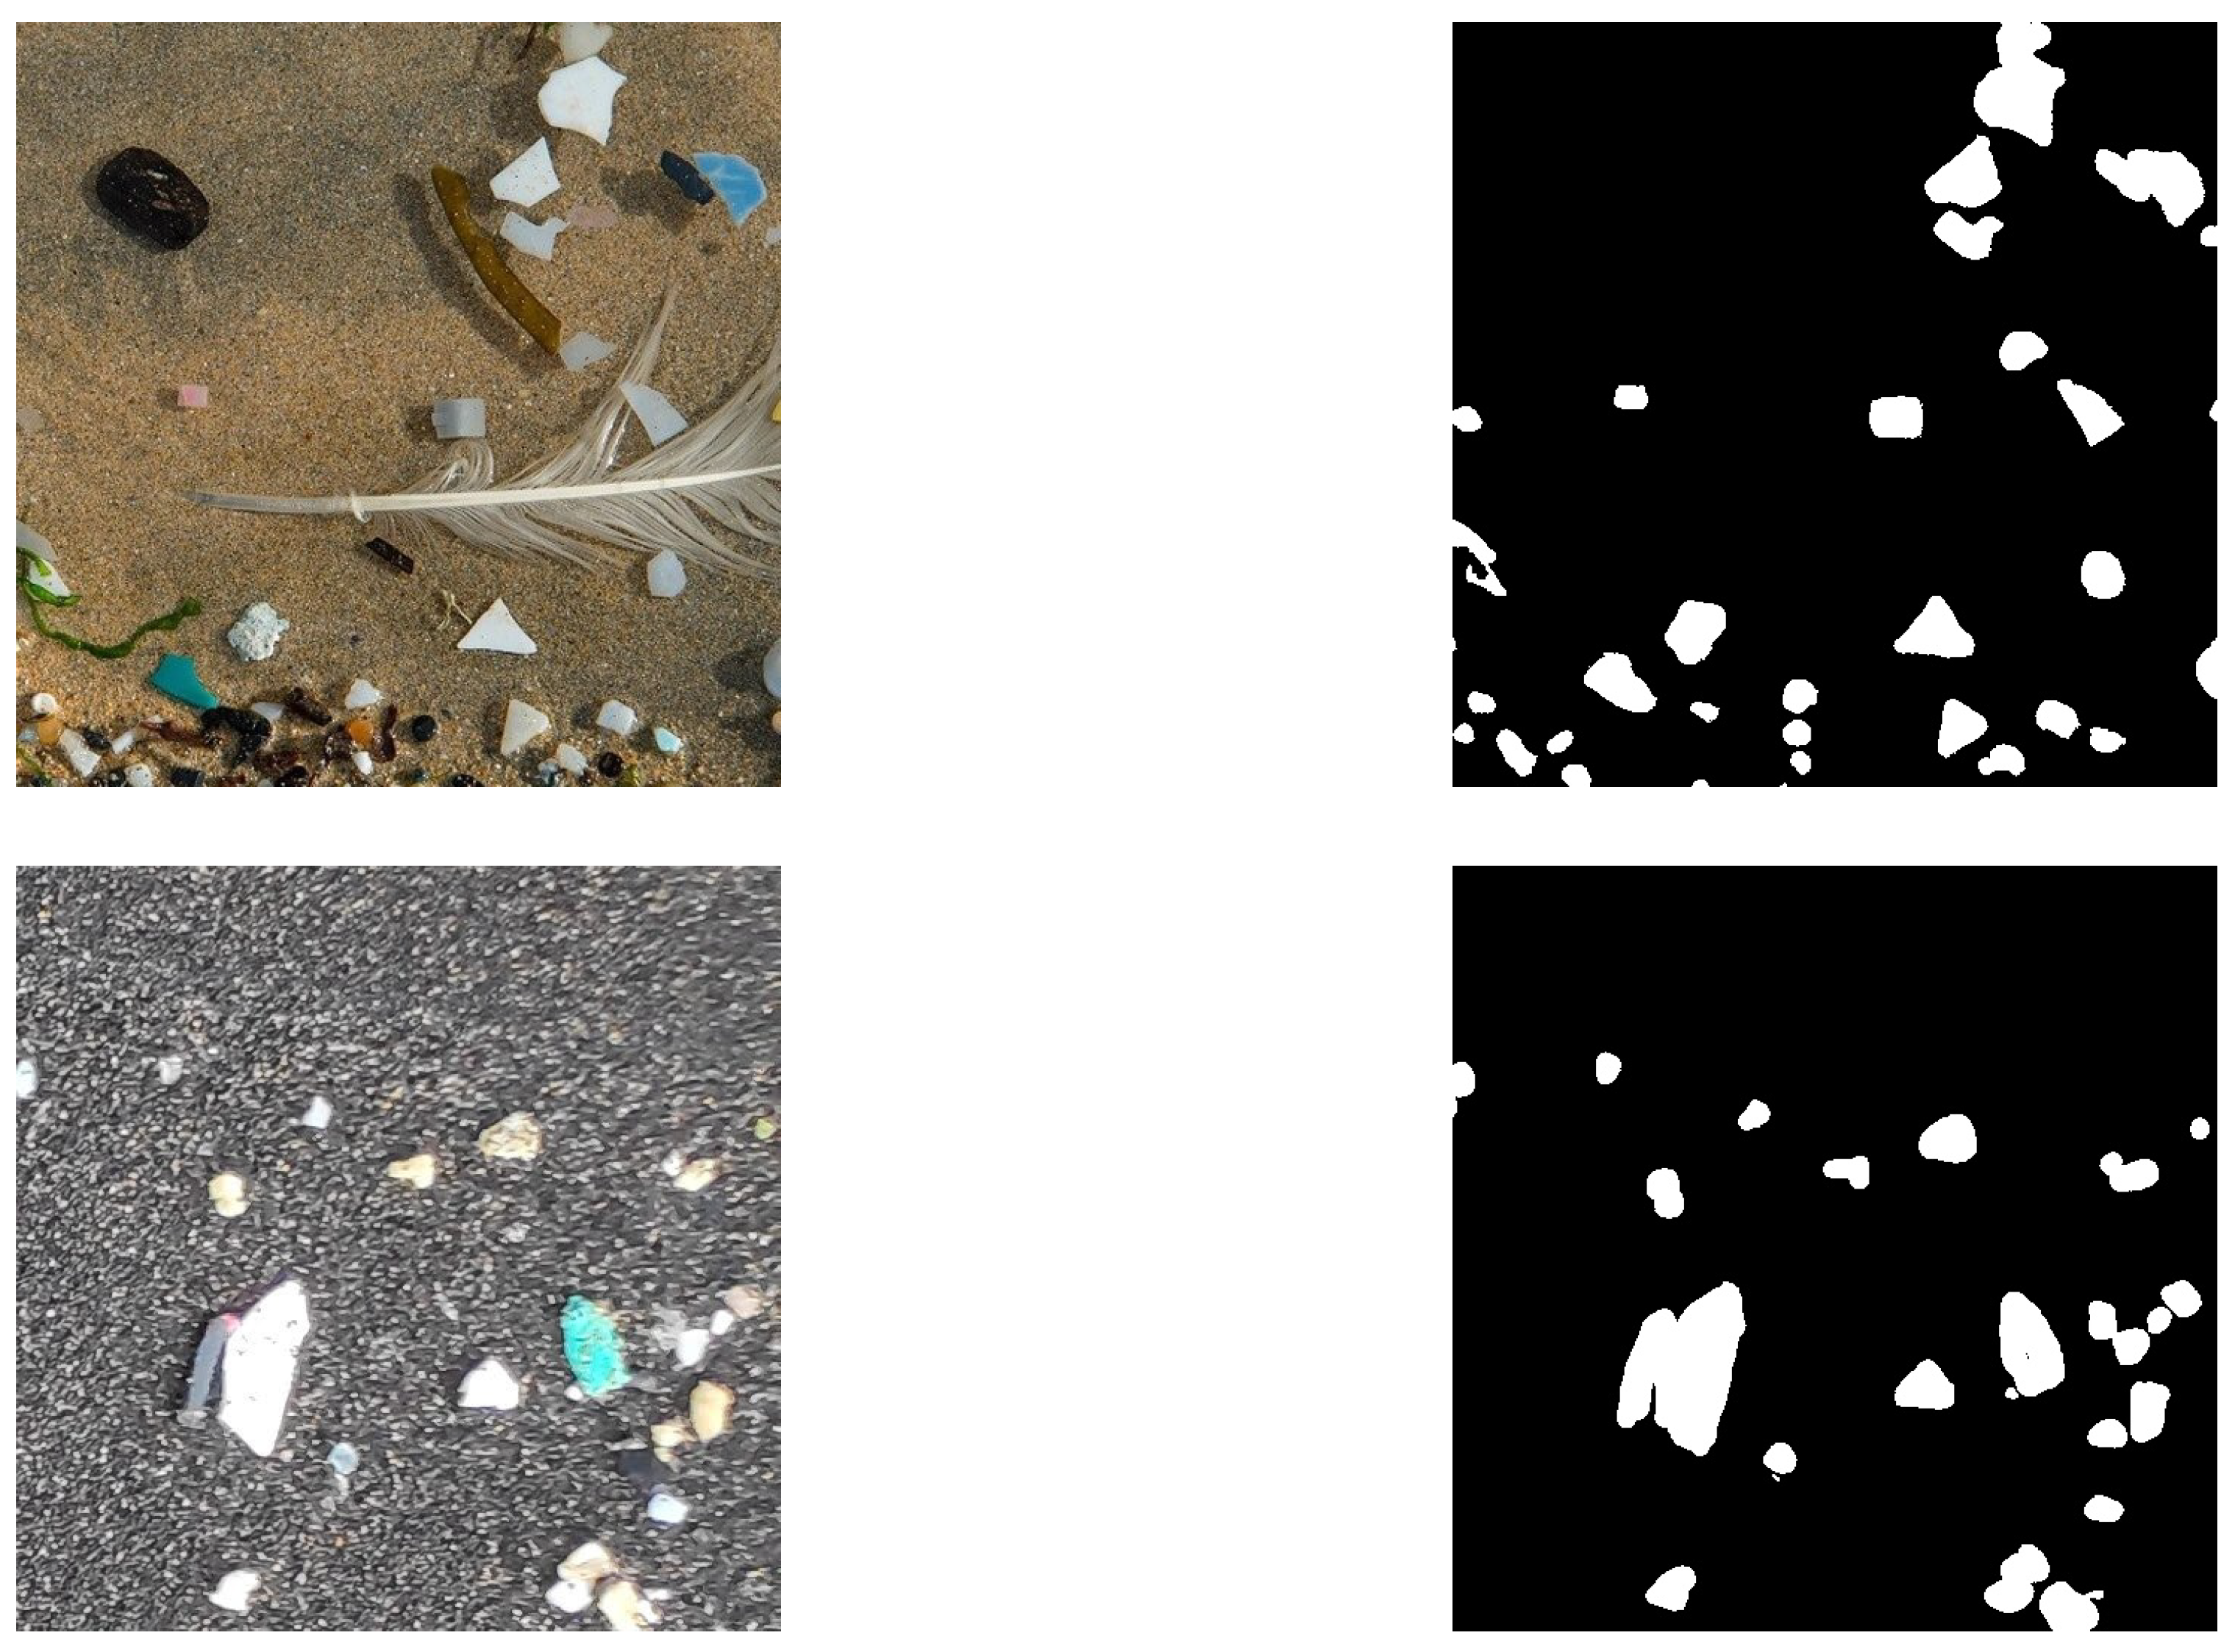
Figure 5.
LinkNet segmentation performance in percentage on complex test-set images (microplastics with environmental debris).
Figure 5.
LinkNet segmentation performance in percentage on complex test-set images (microplastics with environmental debris).
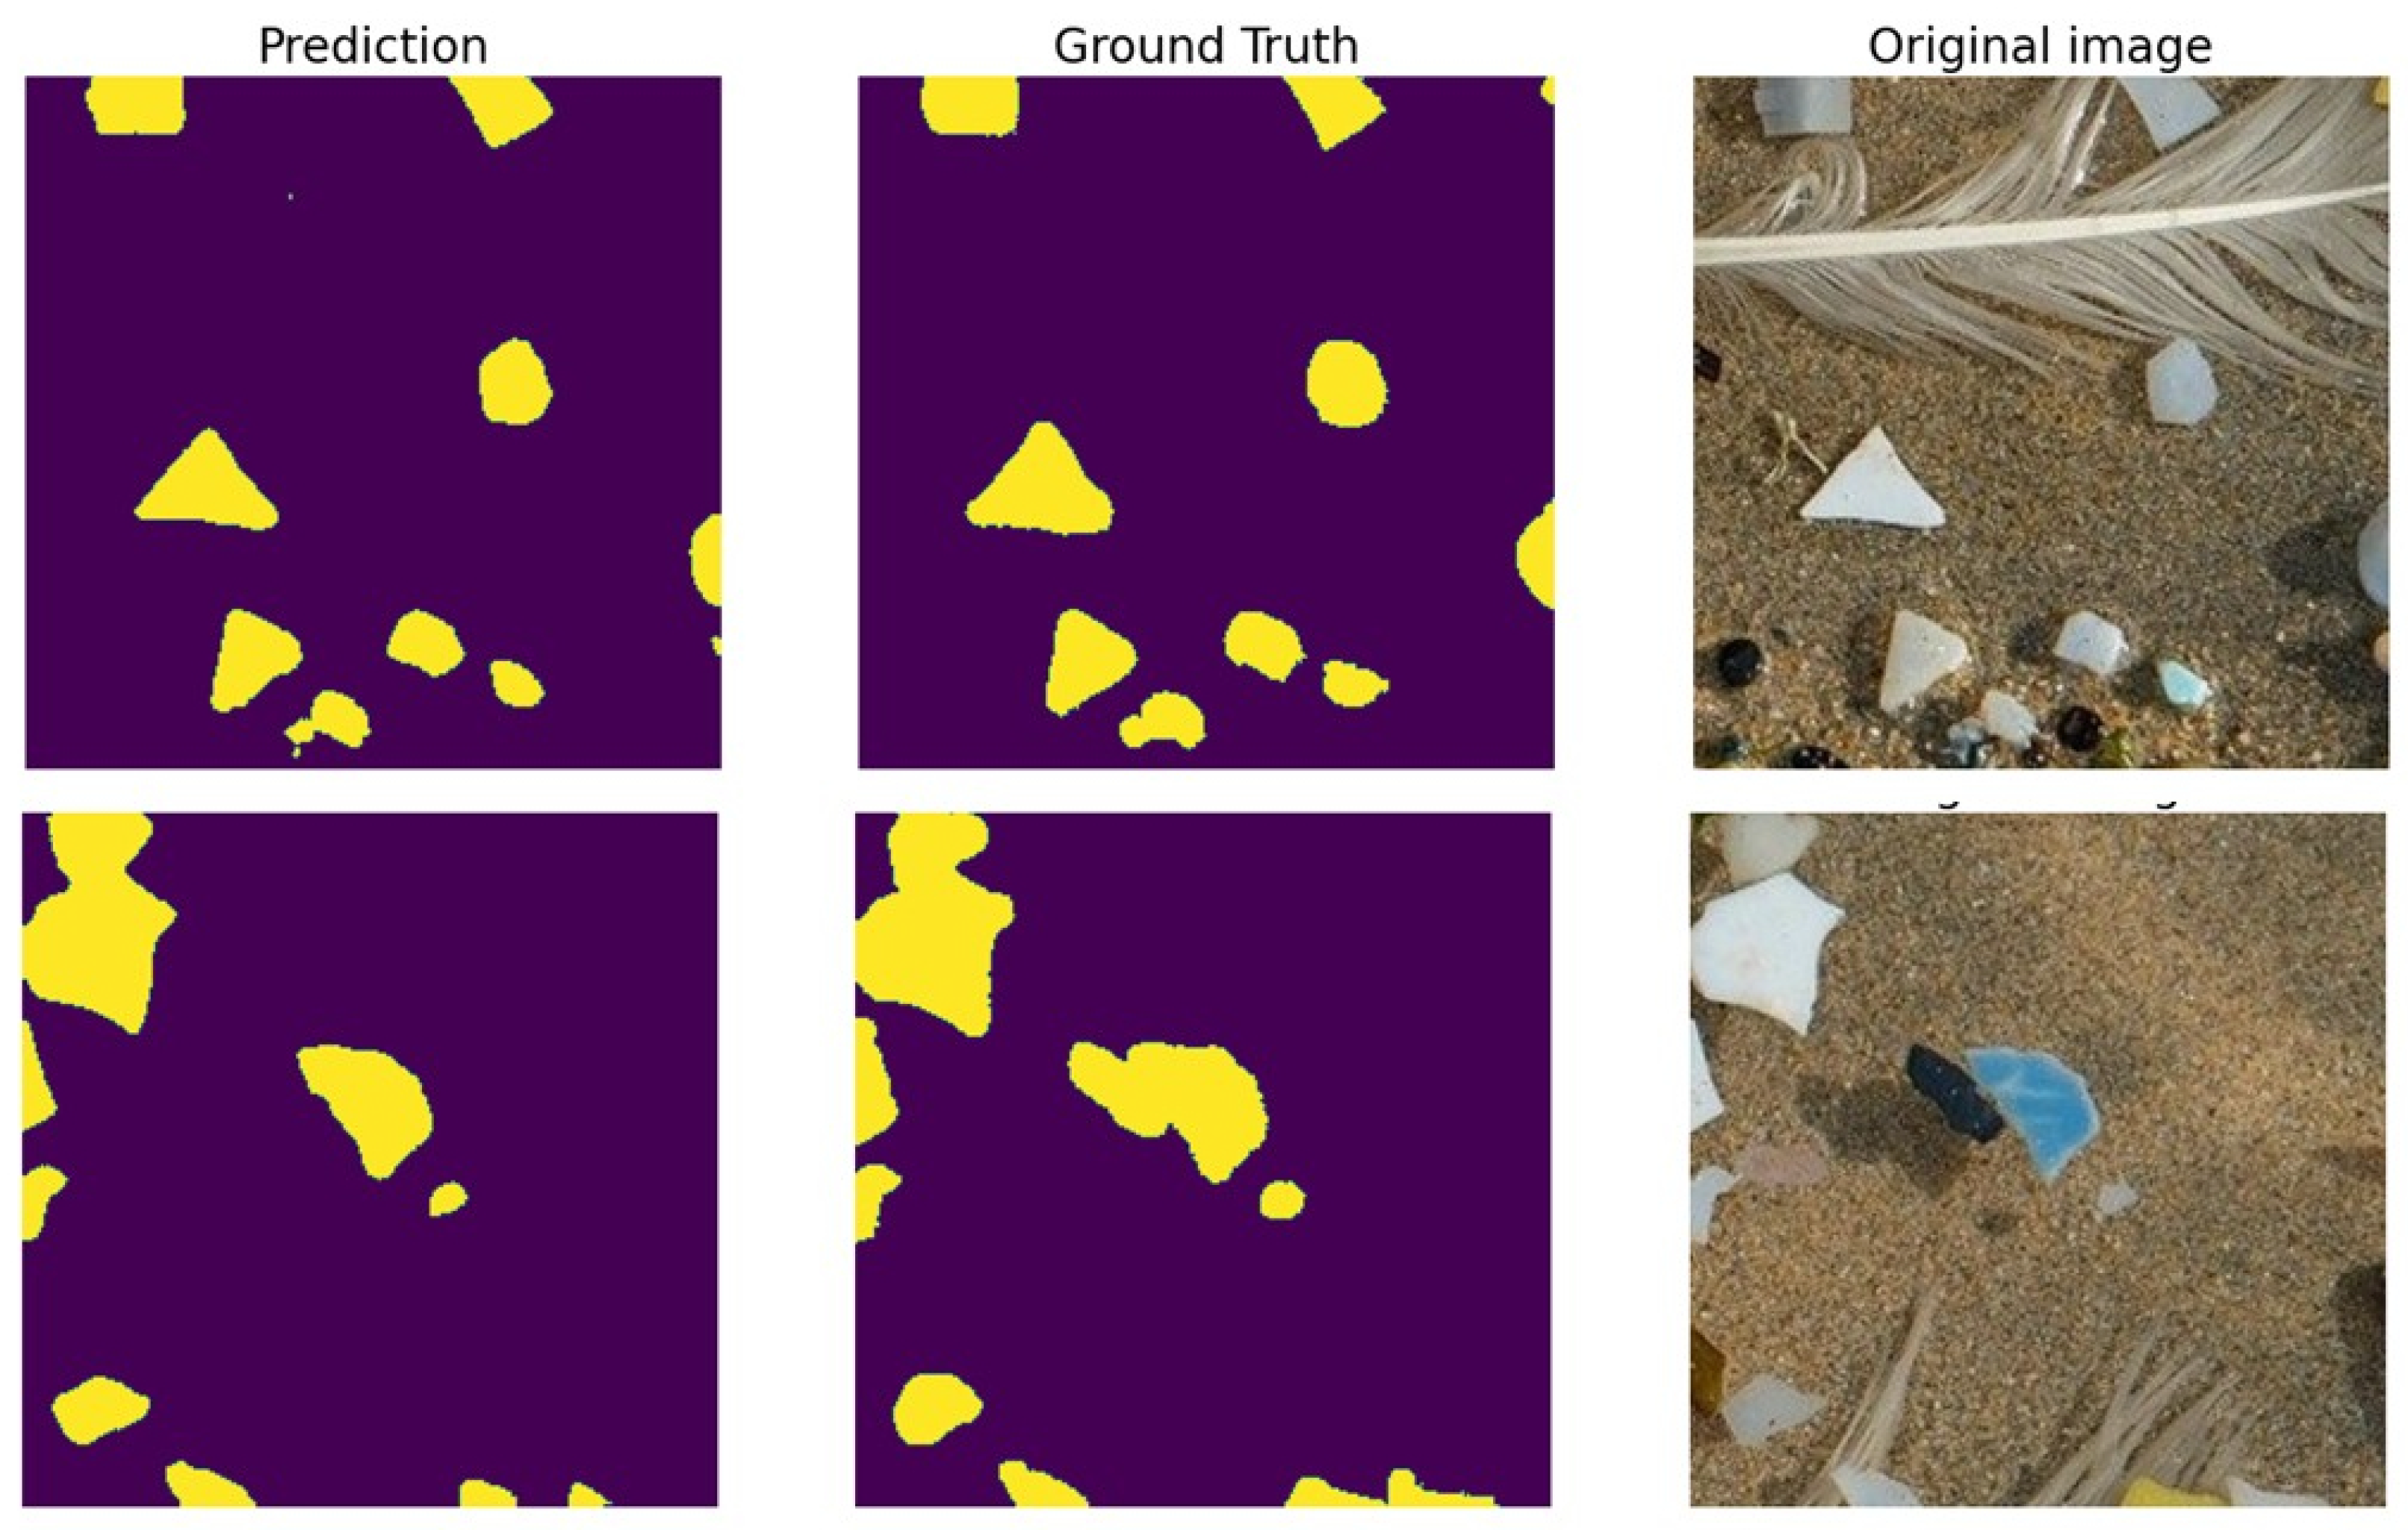
Figure 6.
LinkNet (upper row) and PSP (lower row) segmentation results on a test image.
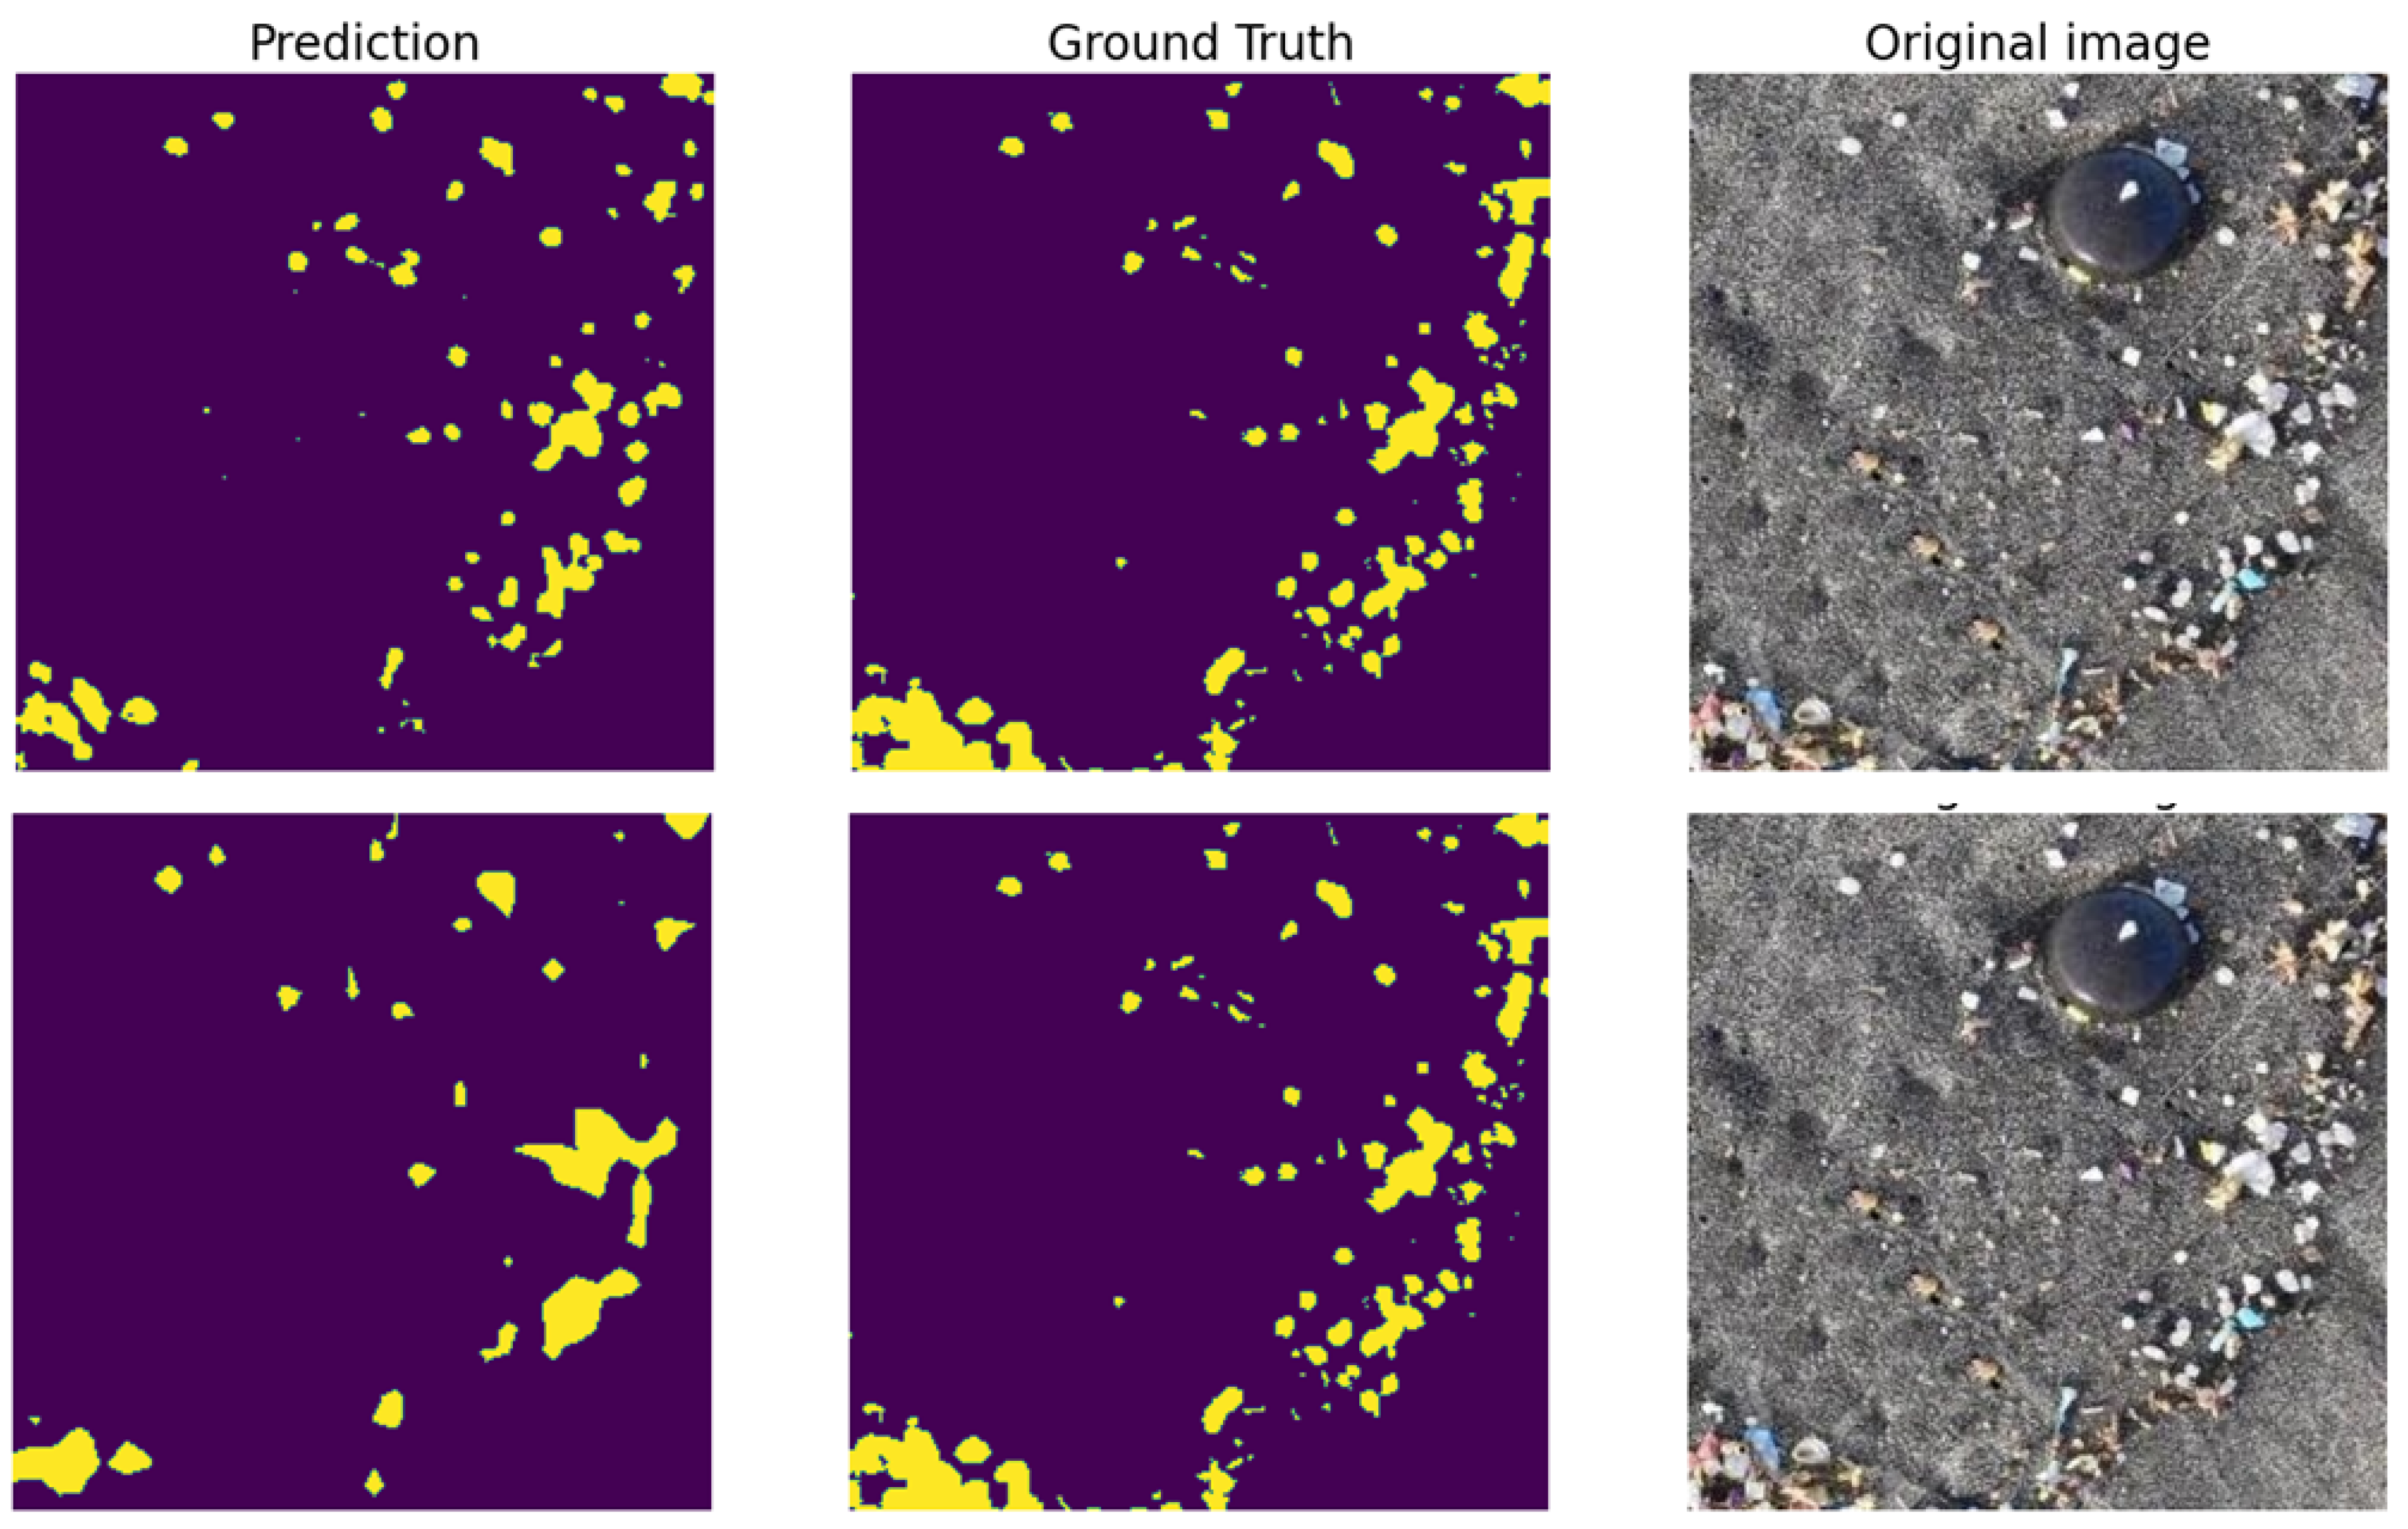
Figure 7.
Segmentation results obtained with the SAM 2 Meta’s model.
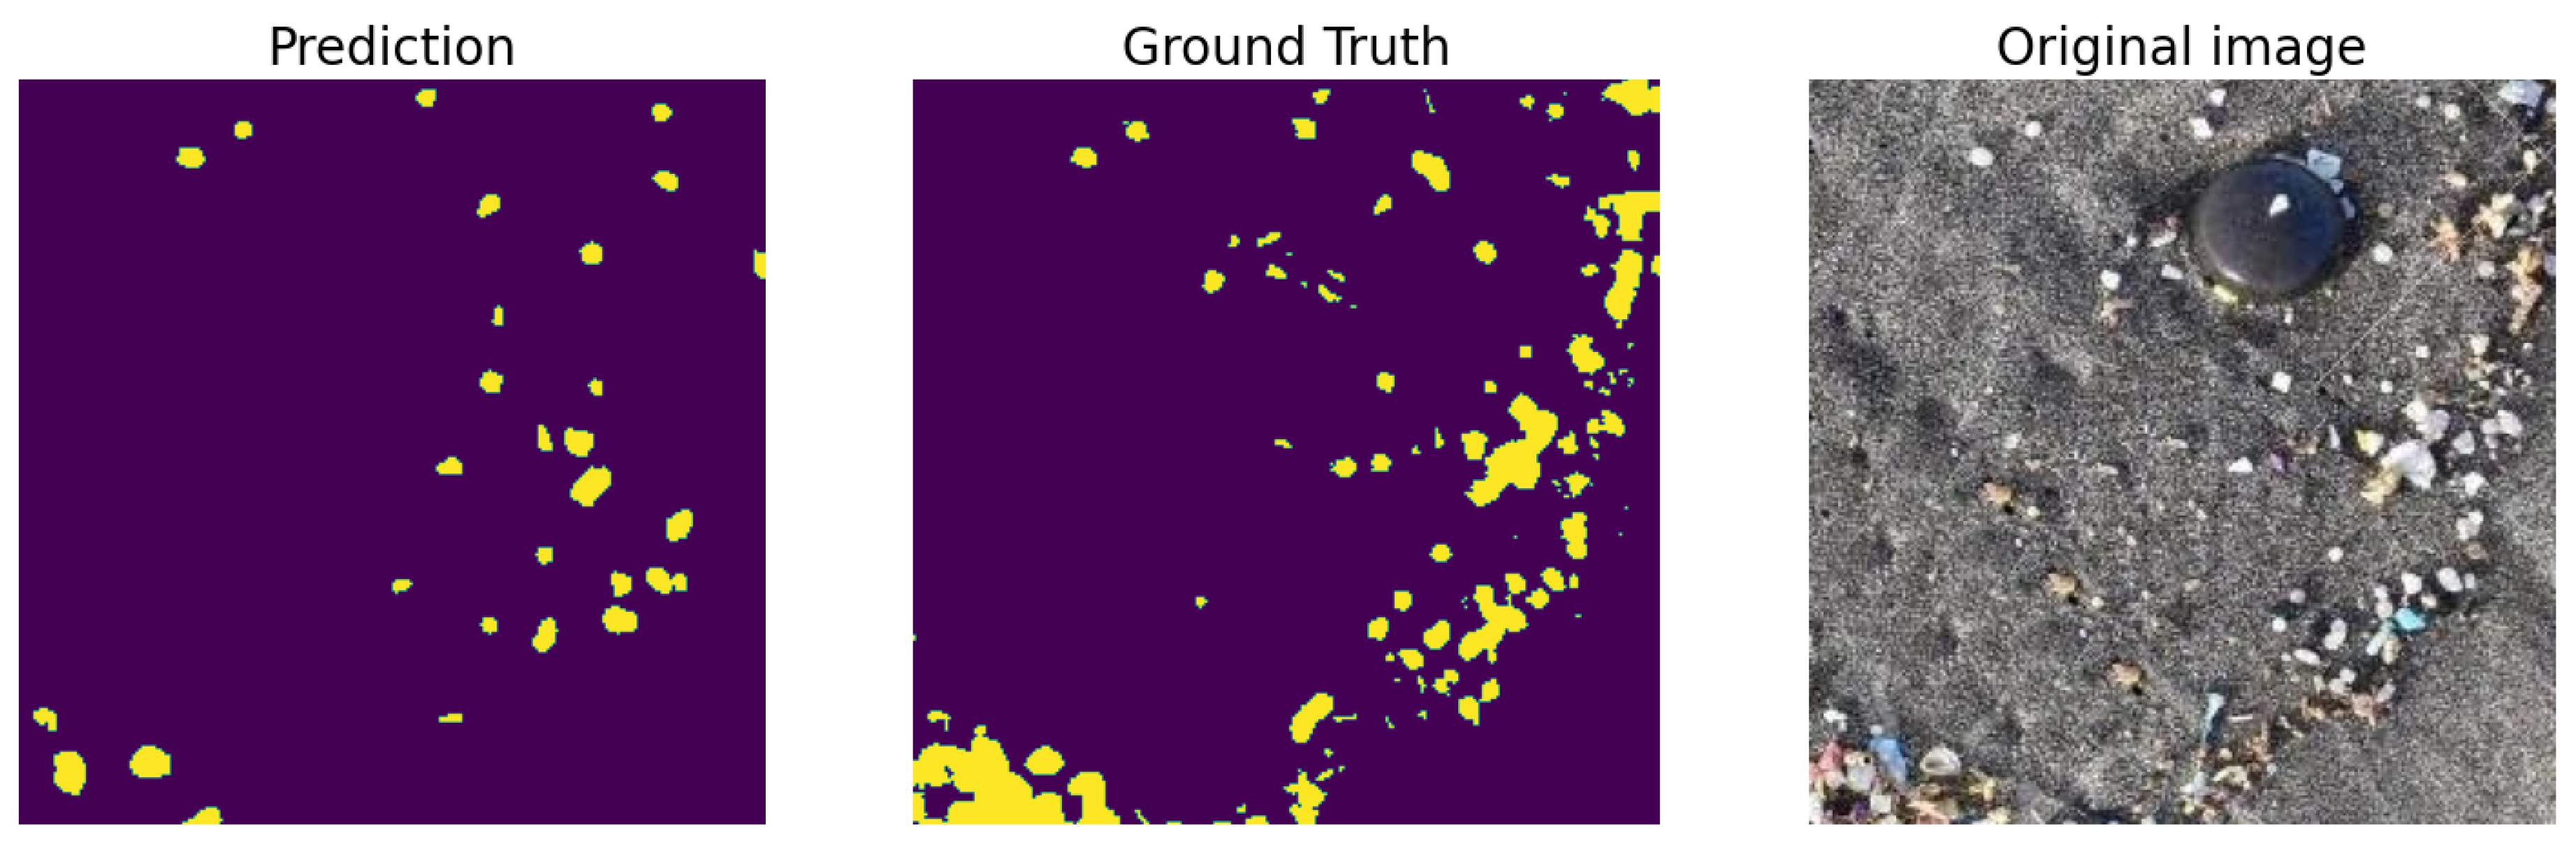

Table 1.
Results of the different segmentation methods.
| Model | Val. Dice | Val. IoU | Test Dice | Test IoU |
|---|---|---|---|---|
| LinkNet | 82.0 | 73.6 | 80.0 | 72.6 |
| PAN | 76.2 | 71.3 | 79.2 | 71.3 |
| YOLOv11m | 73.9 | 64.4 | 78.6 | 69.2 |
| FPN | 75.3 | 66.6 | 77.7 | 69.4 |
| PSP | 72.8 | 63.5 | 76.4 | 67.3 |
| AttentionUnet | 78.7 | 69.3 | 76.4 | 68.0 |
| Unet | 78.5 | 69.0 | 76.0 | 67.9 |
| YOLOv11s | 75.6 | 66.0 | 76.0 | 67.2 |
| YOLOv11n | 71.8 | 62.0 | 74.4 | 65.8 |
| YOLOv11x | 72.7 | 62.4 | 74.2 | 65.4 |
| YOLOv11l | 67.5 | 57.9 | 73.4 | 64.1 |
| ResUnet | 74.6 | 65.3 | 67.8 | 60.3 |
Disclaimer/Publisher’s Note: The statements, opinions and data contained in all publications are solely those of the individual author(s) and contributor(s) and not of MDPI and/or the editor(s). MDPI and/or the editor(s) disclaim responsibility for any injury to people or property resulting from any ideas, methods, instructions or products referred to in the content. |
© 2025 by the authors. Licensee MDPI, Basel, Switzerland. This article is an open access article distributed under the terms and conditions of the Creative Commons Attribution (CC BY) license (http://creativecommons.org/licenses/by/4.0/).
Copyright: This open access article is published under a Creative Commons CC BY 4.0 license, which permit the free download, distribution, and reuse, provided that the author and preprint are cited in any reuse.


