
Submitted:
29 October 2025
Posted:
30 October 2025
You are already at the latest version
Abstract
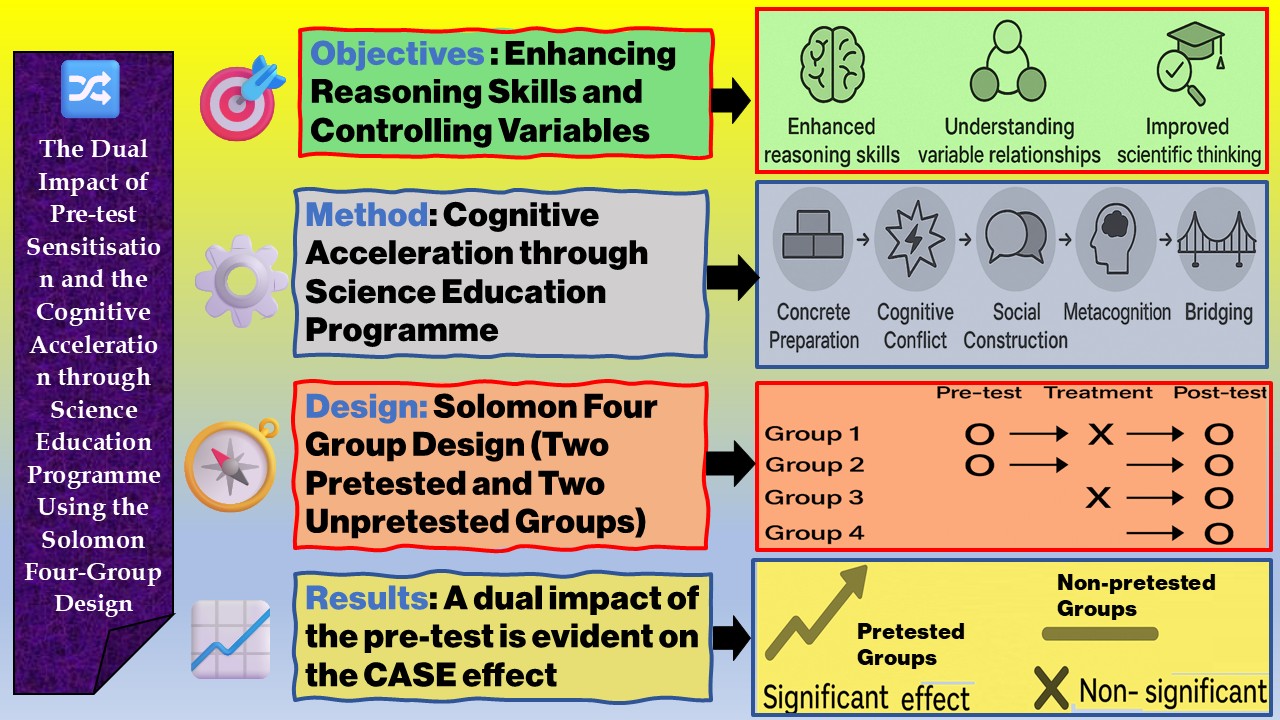
Many studies have investigated the Cognitive Acceleration through Science Education (CASE) programme, demonstrating its impact on students’ reasoning and learning development across different educational contexts. Likewise, numerous experimental investigations have employed the Solomon Four-Group Design (SFGD) to control for pre-test sensitisation and improve the validity of intervention studies. However, despite the extensive use of both frameworks independently, no previous research has integrated them within a single study. The present research therefore combines the theoretical foundations of CASE with the methodological rigour of the SFGD to explore the influence of intervention and pre-test effects on learners’ cognitive growth. This study demonstrates the dual impact of pre-test sensitisation and the CASE programme on middle school students using an experimental design. The study was conducted with 88 students divided into four groups: two experimental and two control following the Solomon Four-Group Design to account for pre-test sensitisation and its potential interaction with the treatment. Statistical analyses revealed that the observed effects were not solely attributable to the CASE program but were significantly influenced by combined effects of pre-test sensitisation and treatment. This study therefore explores both the methodological challenges associated with pre-test sensitisation as well as its role in shaping the educational outcomes of the Cognitive Acceleration program. The findings contribute to a deeper understanding of the conditions under which cognitive acceleration programs can be effectively implemented and evaluated in educational contexts, highlighting the necessity of considering pre-test sensitisation when interpreting intervention effects.
Keywords:
cognitive acceleration
; pre-test sensitisation
; Solomon four-group design
; educational research
; statistical analysis
; meta-analysis
1. Introduction
Recent findings from the study of educational neuroscience have brought the majority to the view that there is great significance in knowing how the brain learns for the shaping of effective practices at instruction and cognitive results [1]. The determination of associations between neuroscience literacy and improved learning behavior and school outcomes indicates that the ability of the learners to conduct metacognitive regulation and reasoning depends on a basic awareness of the key neurocognitive mechanisms [1]. This becomes complementary in perspective to the intent and aims of the the Cognitive Acceleration through Science Education programme (CASE), initially designed for students aged 12–14, replaced one science lesson every fortnight over two years and aimed to develop reasoning skills in topics such as variables, proportionality, probability, and formal modelling [2,3]. It comprised 30 lessons structured to enhance cognitive development through activities fostering critical thinking and problem-solving [4].
Evaluated using a quasi-experimental design, the programme demonstrated significant cognitive gains, with participating students often outperforming peers by one grade level [4]. Its effects, particularly in areas such as scientific creativity, have shown enduring impacts rather than immediate results [5]. Adaptations for other disciplines, such as Mathematics Education, have further highlighted improvements in self-regulation, motivation, and academic achievement [6].
Widely implemented across Europe [7,8,9], Australia [10,11,12,13], USA [14,15], Asia [3,16,17,18], and Africa [19,20], CASE has demonstrated its effectiveness in diverse socio-cultural settings and subjects. Its units are based on five key principles of the “Thinking Science” approach: (1) concrete preparation, (2) cognitive conflict, (3) social construction, (4) metacognition, and (5) bridging [2]. Teachers play a pivotal role in guiding discussions, fostering cognitive conflict, and supporting reasoning development throughout the process.
Inquiry-Based Learning (IBL) has garnered significant attention, especially after its promotion in the United States during the late 20th and early 21st centuries and later in Europe following the publication of influential expert reports [21,22]. Acknowledged as a promising alternative to traditional direct instruction, IBL has been praised for its ability to foster critical thinking [23] and problem-solving skills [24].
However, some researchers argue that IBL has been overemphasised, overshadowing the role of direct teaching methods. Disparities in findings, including negative associations, have been reported in some studies [25,26], underlining the need for a critical analysis of its advantages. Investigations from last decade, often through meta-analyses, have explored factors influencing the effectiveness of IBL. For instance, Spronken-Smith et al. (2011)[27] highlighted the importance of institutional support, teacher characteristics, and effective lesson design. They also emphasised the use of thought-provoking questions to develop reasoning skills, reflecting the principles of the CASE approach.
Lazonder & Harmsen (2016)[28] provided additional insights by reviewing 72 studies, underscoring the importance of structured guidance for successful IBL. This aligns with the CASE model, where teachers play a central role in guiding reasoning and challenging students’ ideas during experimentation.
Recent discussions have shifted from advocating IBL to identifying conditions that maximise its educational outcomes. Romero-Ariza et al. (2020)[24] examined how teachers from various socio-cultural contexts implemented IBL, concluding that effective approaches incorporate argumentation and modelling opportunities. These strategies enable students to critically evaluate evidence and construct explanatory models, consistent with the three-dimensional model of the Next Generation Science Standards [29] and Osborne’s (2014) perspectives [30]. From this view, high-quality IBL involves revisiting and refining ideas based on experimental evidence, thereby enriching meaning-making and enhancing science education [24].
Öztürk et al. (2022)[31] reviewed meta-analyses conducted between 2015 and 2022, highlighting the effectiveness of inquiry-based approaches, particularly modelling, in developing critical thinking and inquiry skills. Such methods not only advance scientific literacy and conceptual understanding but also lead to enduring knowledge [32].
The CASE approach exemplifies high-quality IBL, engaging students in investigating physical phenomena, challenging their ideas, and refining them through experimental evidence. This study aims to evaluate the impact of a CASE-based intervention, with a focus on developing reasoning skills as an example of high-quality IBL.
This study aims to address two research questions that have guided methodology and analysis:
How does the implementation of a series of five CASE program lessons affect students’ reasoning skills, particularly their ability to control variables, compared to students who did not receive the program and compared to their reasoning skills before the intervention?
Does pre-test sensitisation (PS) occur in this study, and how does it influence students’ outcomes compared to those who did not receive the pre-test? This question examines whether pre-test exposure affects learning outcomes, influencing the interpretation of the CASE program’s effectiveness. Understanding PS is crucial, as it may amplify, diminish, or have no effect on the treatment’s impact. Identifying these variations ensures a more accurate evaluation of the program.
2. Materials and Methods
2.1. Materials
This study was conducted within the framework of extracurricular activities organised by the “Scientific and Technological Club,” an initiative established by a secondary school teacher in Morocco.
The study was carried out between the last week of April and the end of May 2022, offering students an opportunity to engage in structured scientific learning outside their regular classroom environment. It was based on a sequence of five CASE lessons, selected from the original set of 30 developed by Adey et al. (2001) [2], representing a significantly shorter version of the full programme. Each lesson included one, two, or three activities designed to be completed within an hour.
Certain lessons need the preparation of particular resources for the hands-on phase. In this intervention, the following materials were prepared (see Table 1):
2.2. Method
For each activity, note sheets were prepared and shared with groups of four to five students to promote collaboration during their investigations and to help them record their observations and findings. In addition, work cards were developed that included images or real-world scenarios, allowing students to connect the type of thinking fostered in the lessons with practical situations during the bridging phase.
The lesson sequence started with a class discussion around the question, “What do scientists do?” Students offered a range of responses such as conducting experiments, doing research, making precise measurements, and observing with microscopes. The teacher then spent a few minutes organising these ideas to highlight that one of the main goals of science is to discover and understand relationships among different phenomena. To reinforce this point, the teacher linked the discussion to previous lessons. For instance, in the “Earth’s Atmosphere” unit, students had observed that temperature decreases as altitude increases. By analysing these earlier examples, students were guided to recognise the difference between values and variables. In the given case, both temperature and altitude were treated as variables, each capable of taking two values: high and low.
Among all the activities outlined in Table 1, activity 1 “What Varies?” is presented here in detail as an example, while the remaining activities were also implemented separately, each during a two-hour session. This first activity began by showing students a set of laminated cardboard shapes (see Figure 1) and asking them, “What are the differences between these shapes?” Through examining the shapes, students identified three key variables: colour (with two possible values: white and black), shape (triangle and square), and size (small, medium, and large). They also observed that shapes sharing the same form had the same colour, which illustrated a relationship between two variables—shape and colour. The activity concluded the “concrete preparation” phase by introducing and familiarising students with the terms “variable”, “value”, and “relationship”.
Set 2 (see Figure 2) was created to trigger “cognitive conflict” by challenging students’ underlying assumptions about consistent relationships among variables such as colour, shape, and size. Although secondary school students usually recognise that objects can vary in form, they often develop habitual expectations based on past experiences—for instance, linking specific shapes with certain colours. The objects in Set 2 were intentionally chosen to disrupt these expectations by presenting unexpected or contradictory combinations. Unlike Set 1, where size, colour, and shape followed clear, structured patterns, Set 2 deliberately broke or altered these relationships. This inconsistency was designed to provoke students to question and reconsider their earlier assumptions
To support students’ reasoning and reflection, the following guiding questions were posed:
- What are the variables and their possible values?
- Does a relationship still exist between colour and shape?
- Are any of the variables connected to one another?
- If so, in what way are they related?
These prompts encouraged students to revisit and reconstruct their thinking, examining whether the causal or categorical patterns they previously expected were still valid. In doing so, the questions strengthened the cognitive conflict process at the heart of the activity.
The third phase, cognitive conflict, involved working closely and thinking critically . In Set 2, the students examined their patterns. They were asked to rethink their ideas about connections between shape, colour and size. With the teacher’s help, they improved their thinking about variability so that their understanding became clearer. At this stage of learning involved a constant exchange between integrating new ideas and modifying old ones, resulting in a cycle of mutual construction of meaning. To keep his discussion going, the teacher often threw to the student a question for them to think about. He asked them for example “If we put a black square in the right, what may we put in the left?”
The metacognition phase encouraged students to reflect on their own thinking processes by examining their responses and evaluating their validity through logical reasoning and evidence-based discussion. The teacher supported this stage by posing reflective prompts such as, “Could you explain the reasons behind your choice? Why or why not?” which guided students to articulate, justify, and critically assess their thought processes.
The bridging phase aimed to transfer the cognitive skills developed in the CASE-based lessons—particularly recognising variables and analysing their relationships—into wider areas of the science curriculum and daily life. To strengthen this reasoning approach, the teacher intentionally incorporated it into later topics, such as experimental design in physics and data analysis in biology. This continuity enabled students to extend their analytical thinking beyond the initial lessons and appreciate its importance in authentic scientific investigation.
2.3. Research Design
This study employs Solomon Four-Group Design (SFGD), which is one of the most robust frameworks for experimental research [33,34]. The structure of this design is presented in Table 2. The SFGD is particularly effective in controlling for PS and the interaction effects between pre-testing and the treatment effect. It is considered a highly rigorous design for ensuring reliable and valid results.
The SFGD plays a pivotal role in the accurate evaluation of educational programs, offering precise assessments and guiding the future development of such initiatives, by adopting this design, researchers are better equipped to address challenges such as PS and to measure intervention effects with greater accuracy, this not only ensures the reliability of assessments but also contributes significantly to the advancement of educational research across various domains [35,36,37,38,39].
2.4. Sample and Context
Eighty-eight (88) students from middle school were distributed across four groups: two experimental groups and two control groups, all students from the same college, specifically from four classes of the second year of the medium stage. These students, aged between 13 and 14 years, were already organised into four official and regular classes within the college. Each class was randomly assigned to one of the groups following the SFGD (See Table 3).
However, differences in group sizes emerged due to irregular attendance across the five scheduled classes, as well as during the pre- and post-tests. This variability in attendance was influenced by the schooling conditions in a semi-rural environment, coupled with family-related factors and transportation challenges. Consequently, the study considered only students who attended at least three of the five scheduled classes. Thus, for the pre- and post-tests of the control groups, the number of participants was larger, as these tests required minimal time and were conducted in a single session.
The middle school where the study was conducted is situated in a rural zone near Tangier, in the north of Morocco. This institution caters to students from nearby villages, reflecting the characteristics of educational institutions in such areas. The college where the research was conducted was selected due to its accessibility and the first author’s implication as a teacher with it, as he is a physics and chemistry teacher there, though not directly responsible for the participating students. This professional connection facilitated the coordination of research activities and provided an informed understanding of the local educational context.
2.5. Instruments and Measures
The structure of the questions was based on problem-solving scenarios inspired by previous research [40], while the content was directly took from the CASE program materials. Both the pre-test and post-test consisted of multiple-choice questions, with a maximum score of 15 points if correctly answering all items. Participants from both the control and experimental groups were given one hour to complete each test.
Data was gathered through the students’ worksheets questionnaires and then summing the total score of each test, where each question required marking an ‘X’ on the correct option and selecting the correct reasoning for that choice. Test scores were then saved into SPSS, including different variables that may be used in the analysis: Post-test, Pre-test, scores, and the Gain score, which is the difference between the Post-test and the Pre-test.
3. Results
3.1. Predictive Validity Analysis of the Instrument
To examine the predictive validity of the instrument, a linear regression analysis was conducted, with Pre-test scores as the predictor and Post-test scores as the dependent variable for Groups 1 and 2 following the approach outlined by Odom & Morrow, Jr. (2006)[41] . The results, presented in Table 4, indicate that 49.4% of the variance in Post-test scores is explained by Pre-test scores (R² = 0.494, Adjusted R² = 0.478), suggesting a moderate to strong predictive relationship between the two variables. The correlation coefficient (R = 0.703) further supports this association.
A detailed examination of the regression coefficients (Table 5) confirms that Pre-test scores are a significant predictor of Post-test scores (B = 0.671, β = 0.703, t = 5.588, p < 0.001). This finding indicates that an increase in Pre-test scores corresponds to an increase in Post-test scores, supporting the validity of the Pre-test as a predictor of post-intervention performance.
These results provide strong empirical support for the instrument’s predictive validity, demonstrating that Pre-test scores predict Post-test outcomes within the study’s context.
3.2. Reliability and Internal Consistency of the Instrument
To evaluate the internal consistency of the measurement instrument, Guttman’s Lambda reliability coefficients were computed. These coefficients provide a more refined measure of reliability by assessing different methods of partitioning the test items [42]. The results, presented in Table 6, indicate the extent to which the instrument maintains consistency across its components.
The values for λ₁, λ₂, λ₃, λ₄, and λ₅ demonstrate a strong level of internal reliability, confirming the consistency of the measurement instrument. λ₁ (0.762), which represents the most basic measure of internal consistency, indicates a solid foundation for reliability. The values for λ₂, λ₃, λ₄, and λ₅ all exceed 0.80, suggesting that the test items are well-aligned and consistently measure the intended construct. Additionally, the highest reliability coefficient, λ₅, accounts for unequal item variances, further reinforcing the robustness of the instrument. These findings provide strong empirical support for the reliability of the instrument, confirming its suitability for measuring the targeted constructs. The high internal consistency suggests that the instrument is well-structured and produces stable measurements, ensuring confidence in its application for research purposes.
3.3. Data Normality
Before proceeding with the statistical analyses, it is necessary to verify the normality of the data to ensure the appropriateness of the chosen methods. Assessing normality provides a foundation for determining whether parametric tests can be applied or if non-parametric alternatives are required.
The Kolmogorov-Smirnov test indicates no significant deviations from normality for outcomes O1, O2, O4, and O6, and O6, with p≥0.067. However, O5 displays a significant result (p=0.040), suggesting a potential departure from normality in this outcome. The Shapiro-Wilk test, which is more sensitive for smaller sample sizes, corroborates these findings. All outcomes exhibit p-values up to 0.05 (0.926 (O1), 0.839 (O2), 0.664 (O3), 0.351 (O4), 0.198 (O5), and 0.274 (O6)), indicating that the null hypothesis of normality cannot be rejected. This includes O5, where the Shapiro-Wilk test suggests no significant deviation (p=0.198) despite the Kolmogorov-Smirnov result. In summary, while the Kolmogorov-Smirnov test highlights a potential departure from normality in O5, the Shapiro-Wilk test, which is often preferred for small sample sizes, suggests that the data for all outcomes, including O5, are normally distributed. These findings support the use of parametric statistical methods for further analysis, provided other assumptions are met.
Beyond verifying the normality of the data, it is crucial to address the potential impact of outliers, particularly given the small size of some of our experimental groups, where even minor deviations can disproportionately influence the results.
Huber’s M-Estimator, Tukey’s Biweight, Hampel’s M-Estimator, and Andrews’ Wave were applied to the given outcomes (O1 to O6). These robust estimators are specifically designed to mitigate the influence of outliers [43], providing more reliable measures of central tendency compared to the analysis through central tendency means, particularly in datasets that may deviate from normality.
A notable observation is the general consistency of values across the different M-Estimators for each category, with only minor variations evident between methods. For instance, for O5, the M-Estimator values range from 8.8706 (Huber’s M-Estimator) to 8.9333 (Hampel’s M-Estimator), reflecting a small variability of just 0.0627. This suggests that the data are relatively stable and not heavily influenced by extreme values or significant outliers. Similarly, O2 consistently exhibits the highest values across all estimators, ranging from 11.0849 (Hampel’s M-Estimator) to 11.1876 (Andrews’ Wave), while O4 presents some of the lowest values, with estimates ranging from 7.8077 (Huber’s M-Estimator) to 7.8894 (Hampel’s M-Estimator). Such differences could indicate variations in central tendencies among these groups, warranting further investigation into their potential causes.
The range of values across all categories is from 7.8077 (O4, Huber’s M-Estimator) to 11.1876 (O2, Andrews’ Wave), demonstrating a good level of robustness. The minor variations observed between methods suggest that the dataset is relatively stable and not significantly affected by extreme values or outliers. This robustness ensures that the central tendency measures are reliable and provides a solid foundation for further analysis and comparisons between groups.
3.4. Analysis of Pre-Test Sensitisation
The primary objective of the SFGD is detecting whether an interaction exists between the pre-test and the treatment. To achieve this, a Two-Way Analysis of Variance (ANOVA) was conducted. This test assessed the interaction effect between the pre-test and the treatment on the dependent variable post-test crores, aiming to determine whether exposure to the pre-test influenced the treatment’s measurement, thereby identifying potential PS effects.
The results of the Levene’s test indicated that the assumption of homogeneity of variances was met (F(3.84)=0.299, p=0.826). In the Two-Way ANOVA, the main effect of the treatment revealed a statistically significant effect (F(1.84)=6.794, p=0.011), indicating that the treatment contributed significantly to the variance in post-test scores. The main effect of the pre-test was not statistically significant (F(1.84)=0.186, p=0.668), suggesting that the pre-test alone did not significantly influence the post-test scores. However, the interaction between the treatment and the pre-test was found to be statistically significant (F(1.84)=11.482, p=0.001). The F-value indicates the proportion of variance in the dependent variable explained by the interaction relative to the unexplained variance, and the associated p-value confirms that this interaction effect is statistically significant. This result suggests that the combination of the pre-test and the treatment had a measurable and meaningful impact on the dependent variable.
3.5. Managing Pre-Test Sensitisation
The detection of a significant interaction between the pre-test and the treatment underscores the necessity of looking at the pre-tested and non-pre-tested groups as distinct categories in subsequent analyses. This approach enables a more precise examination of the treatment’s effects within each group and ensures that the influence of the pre-test is adequately considered. Such an analysis allows for the identification of one of several possible scenarios: the treatment may exert a significant effect in both groups; the magnitude or direction of the treatment effect may differ between the pre-tested and non-pre-tested groups; or the treatment may prove effective in only one of the two groups. Additionally, although less likely given the significant main effect of the treatment, it is possible for the treatment’s effectiveness within each subgroup to be individually non-significant, while the interaction effect alone drives the observed significance. Differentiating between these scenarios is essential for achieving a nuanced understanding of the interaction between the pre-test and the treatment, as well as for drawing valid and robust conclusions about the overall effectiveness of the treatment.
3.6. Analysis of Post-Test
The first parametric test conducted was an independent-samples t-test to compare the post-test scores (O2 and O4) of the pre-tested groups. This comparison aimed to determine whether there was a statistically significant difference in post-test performance between participants who received the treatment (O2) and those who did not (O4) within the pre-tested condition. Levene’s test for equality of variances confirmed that the assumption of homogeneity of variances was met (F=0.131, p=0.720).
The results of the t-test showed a statistically significant difference in post-test scores between the treated group (O2) and the untreated group (O4) with a corresponding p-value of 0.001. The mean difference between the two groups was 3.144, with a 95% confidence interval ranging from 1.337 to 4.951. These results indicate a statistically significant difference in post-test scores between the treated and untreated groups within the pre-tested condition, favouring the treated group.
The second parametric test was conducted to compare the post-test scores of the non-pre-tested groups, Group 3 and Group 4 (O5 Compared to O6). Levene’s test confirmed homogeneity of variances (F=0.680, p=0.413), allowing a t-test assuming equal variances to be performed. The independent-samples t-test revealed no statistically significant difference in post-test scores between the treated and untreated groups within the non-pre-tested condition (p=0.502).
These last two tests demonstrates that the pre-test plays a critical role in enhancing the effect of the treatment. In the pre-tested condition, the treatment significantly improved post-test scores compared to the untreated group, indicating that the pre-test has sensitised participants or prepared them to benefit more effectively from the treatment. In contrast, in the non-pre-tested condition, no significant difference was observed between the treated and untreated groups, implying that the treatment alone, without the pre-test, may not be sufficient to produce a notable impact.
3.7. Pre-Test Sensitisation via Pre-Test
To deepen the understanding of the role of pre-test scores, a comparative analysis of the pre-test results will be undertaken. While the previous analyses have offered valuable insights, further investigation is justified, as each subsequent analysis may yield significant findings that contribute to a more nuanced comprehension of the data.
A comparative analysis of pre-test scores (O1 Compared to O3) will be undertaken to further explore their implications, as additional analyses may provide deeper insights.
Levene’s test confirmed the homogeneity of variances (F=0.003, p=0.959). The independent-samples t-test showed no statistically significant difference in pre-test scores between the two groups (t(32)=1.665, p=0.106), indicating that the groups were similar in their initial performance.
Unlike the t-test, which directly compares group means, the ANCOVA results indicate a significant treatment effect on post-test scores while controlling for pre-test differences. The corrected model is statistically significant (F(2.31)=24.648, p<0.001), explaining 61.4% of the variance in post-test scores (R2 =0.614, Adjusted R2=0.589). The pre-test variable significantly contributes to the model (F(1.31)=26.665, p<0.001), accounting for 46.2% of the variance (Partial Eta Squared = 0.462). The Four Solomon Groups factor also has a significant effect (F(1.31)=9.643, p=0.004), explaining 23.7% of the variance (Partial Eta Squared = 0.237). These findings highlight the critical role of both, the Pre-test scores and group membership to either the treated or the untreated group, in determining post-test outcomes.
4. Discussion
The foundational steps of analysis conducted thus far demonstrate that the treatment has a significant effect when preceded by a pre-test understanding the interaction between the pre-test and the treatment. However, the Solomon Design offers a broader range of possibilities, providing the opportunity to conduct additional tests and explore further insights.
Figure 3 provides a concise visual representation of the key statistical findings from this study, helping to organise and clarify the relationships and results observed across the groups.
By consolidating the numerous statistical results into a clear and structured format, the scheme allows for easier interpretation of the relationships between groups and their respective statistical outcomes. It simplifies the complexity of the interactions between PS, treatment, and group characteristics, making the logical connections between results more apparent.
The independent sample t-test was conducted to compare the post-test scores of Group 1 (O2: pre-tested and treated) and Group 3 (O5: treated but non-pre-tested). Levene’s test for equality of variances indicated that the assumption of equal variances was met (F=0.770, p=0.389). The results showed a statistically significant difference between the two groups (t(24)=2.338, p=0.028), with a mean difference of 2.003 (95% CI: 0.235 to 3.771). This finding suggests that the pre-tested and treated group (Group 1) scored significantly higher on the post-test compared to the treated but non-pre-tested group (Group 3), a result that aligns with previous findings, further confirming the influence of PS on treatment outcomes.
Similarly, a comparison between the post-test scores of Group 1 (O2: pre-tested and treated) and Group 4 (O6: untreated and non-pre-tested) was conducted. The results, while approaching significance (t(44)=−2.005, p=0.051), indicate a notable difference in performance, with Group 1 scoring higher than Group 4. These findings align with expectations, reflecting the combined influence of treatment and PS.
The relationship between pre-test and post-test scores was examined through two paired-samples t-tests, both revealing a consistent pattern: no significant difference in means but a strong correlation between the scores. In the first analysis, pre-test (O1) and post-test (O2) scores were compared. While the paired samples t-test showed no significant difference (p=0.082), a moderate strong positive correlation (M=7.86, SD=2.72) and M=7.80, SD=2.29; t(24)=0.147, p=0.884), yet a strong correlation (r=0.681, p<0.001) was found. These findings consistently suggest a relationship between pre-test and post-test scores, reflecting stability in participants’ performance across the two tests. However, the absence of significant differences in means does not support a measurable effect of the pre-test alone, highlighting the potential influence of other factors.
The latest test examined whether the pre-test alone has influenced behaviour, independently of the treatment. A t-test was conducted to compare the post-test scores of the pre-tested and untreated Group 2 (O4) with the non-pre-tested and untreated Group 4 (O6). The independent-samples t-test revealed a statistically significant difference (t(60)=−2.743, p=0.008), with equal variances assumed (p=0.901). These findings suggest that the act of pre-testing itself may have influenced participants’ performance, underscoring the potential impact of PS on post-test outcomes.
As a brief note, the t-test value (t(60)=−2.428, p=0.018) indicates a statistically significant difference between O3 (Pre-test) and O6 (Post-test). However, this result holds no relevance to the current study, as it merely reflects differences between two tests conducted prior to any experimental intervention and does not relate to the treatment’s effects.
5. Conclusions
This study demonstrates that PS influence post-test outcomes and interact with the treatment, leading to variations in treatment effectiveness. These findings emphasise the importance of using adequate statistical methods, such as ANCOVA, to control for baseline differences and robust measures to ensure reliable results.
PS in a context like this is something that has to be taken into account, especially when dealing with real-life questions, as presenting such questions to students may create more cognitive conflict, giving pre-tested students an advantage in this regard, as cognitive conflict is a key pillar of the CASE approach. Additionally, exposure to these questions in the pre-test could enhance their motivation to explore the content of the CASE sessions. In contrast, students who enter the sessions directly, without this prior engagement, are likely to have lower attention levels compared to those who took the pre-test.
While the absence of PS allows for a straightforward execution of the treatment process described by Braver & Braver (1988)[44], its presence introduces complexity that requires additional analytical considerations. Moreover, the detection of PS is highly context-dependent, shaped by the specific characteristics of the samples, groups, and experimental conditions. It is crucial to acknowledge that each study has its unique realities, and the findings here may not generalise to all similar studies. Additionally, the method has been further explained and illustrated with examples for both quantitative and qualitative variables in education science by El Karkri et al (2025)[45], providing a more comprehensive perspective on its application in different research contexts.”
The Solomon Design has proven to be a powerful framework, offering extensive opportunities to investigate the interplay of pre-test and treatment effects. While the abundance of outcomes and observations may sometimes lead to contradictions or require careful organisation to achieve logical consistency, the findings of this study were coherent and meaningful. The study demonstrates that PS influences post-test outcomes and interacts with the treatment, leading to variations in treatment effectiveness. Furthermore, the detection of PS is highly context-dependent, shaped by the specific characteristics of the samples, groups, and experimental conditions. It is crucial to acknowledge that each study has its unique realities, and the findings here may not generalise to all similar studies. To strengthen credibility, it is recommended to incorporate a second control group consisting of non-pre-tested participants. This “couple of two non-pre-tested groups” approach ensures that PS is properly addressed, thereby enhancing the reliability and validity of the findings. Future research should further explore these dynamics across diverse contexts and samples to build a more comprehensive understanding of pre-test and treatment interactions.
This study may be the first to explore the potential of CASE while considering PS through the SFGD, providing a methodological approach to isolate and understand its true effect. It is evident that the potential of CASE as a treatment has a significant effect when preceded by a pre-test. This does not necessarily imply (at least in our case) that the content of the pre-test needs to be adjusted or that it should be excluded. On the contrary, this finding highlights the importance and utility of conducting a pre-test to achieve a significant effect. While this does not definitively confirm that the pre-test disrupts the ability to detect the true effect of the potential of CASE, it suggests that the pre-test could serve as a preparatory step, helping to familiarise students with the objectives and content of the sessions delivered during implementation of CASE.
Note: This study was conducted by one of the authors, a physics teacher, with his students in a middle school. While it is an experimental study, it cannot be classified as action research. Despite the positive results regarding the effectiveness of CASE, its future implementation remains uncertain, as it requires an administrative decision involving all relevant stakeholders in the education system.
Author Contributions
Mourad El Karkri: Conceptualization, investigation, methodology, data curation, formal analysis, writing – original draft, visualization, software. Antonio Quesada: review and editing, supervision, resources, project administration, validation, funding acquisition. Marta Romero-Ariza: review and editing, validation, supervision, resources.
Funding
This research received no external funding.
Institutional Review Board Statement
Ethical review and approval were waived for this study by the Ethical Committee for Human Research at the University of Jaén, as it involved the administration of non-sensitive, fully anonymous educational tests. Participation was voluntary, and no participants were considered “vulnerable” or subjected to any form of psychological stress or discomfort.
Informed Consent Statement
Formal written consent was not required, as participants took part voluntarily in fully anonymous educational activities after being informed of the study’s purpose.
Data Availability Statement
The data supporting the findings of this study are not publicly available due to privacy restrictions. The datasets consist of anonymized student responses collected for research purposes only and are available from the corresponding author upon reasonable request.
Conflicts of Interest
The authors declare no conflicts of interest.
Abbreviations
The following abbreviations are used in this manuscript:
| CASE | Cognitive Acceleration through Science Education |
| SFGD | Solomon Four-Group Design |
| IBL | Inquiry-Based Learning |
| PS | Pre-test sensitisation |
| ANCOVA | Analysis of Covariance |
| ANOVA | Analysis of Variance |
References
- Almarzouki, A.F.; Alqahtani, A.I.; Baessa, J.K.; Badaood, D.K.; Nujoom, R.R.; Malibari, R.W.; Aljared, E.M.; Alghamdi, R.S. Neuroscience Literacy and Academic Outcomes: Insights from a University Student Population. Brain Sci. 2025, 15, 44. [Google Scholar] [CrossRef]
- P. Adey, M. Shayer, C. Yates, and C. A. through S. Education, Thinking Science: The Materials of the CASE Project. Nelson Thornes, 2001. [Online]. Available: https://books.google.co.ma/books?id=TCZ6AAAACAAJ.
- Budiman, Z.B.; Halim, L.; Meerah, S.M.; Osman, K. The effects of cognitive conflict management on cognitive development and science achievement. Int. J. Sci. Math. Educ. 2013, 12, 1169–1195. [Google Scholar] [CrossRef]
- Adey, P. Evidence for Long-term Effects: Promises and Pitfalls. Evaluation Res. Educ. 2004, 18, 83–102. [Google Scholar] [CrossRef]
- Lin, C.; Hu, W.; Adey, P.; Shen, J. The Influence of CASE on Scientific Creativity. Res. Sci. Educ. 2003, 33, 143–162. [Google Scholar] [CrossRef]
- Shayer, M.; Adhami, M. Fostering Cognitive Development Through the Context of Mathematics: Results of the CAME Project. Educ. Stud. Math. 2007, 64, 265–291. [Google Scholar] [CrossRef]
- Cattle, J.; Howie, D. An Evaluation of a School Programme for the Development of Thinking Skills through the CASE@KS1 Approach. Int. J. Sci. Educ. 2008, 30, 185–202. [Google Scholar] [CrossRef]
- Seleznyov, S.; Adhami, M.; Black, A.; Hodgen, J.; Twiss, S. Cognitive acceleration in mathematics education: further evidence of impact. Educ. 3-13 2021, 50, 564–576. [Google Scholar] [CrossRef]
- Clowser, A.; Jones, S.W.; Lewis, J. ‘Can the principles of cognitive acceleration be used to improve numerical reasoning in science?’, Sch. Sci. Rev., vol. 99, no. 368, pp. 117–122, 2018.
- Adey, P.; Shayer, M. The Effects of Cognitive Acceleration. In Socializing Intelligence Through Academic Talk and Dialogue; Resnick, L.B., Asterhan, C.S.C., Clarke, S.N., Eds.; American Educational Research Association, 2015; pp. 127–140. [CrossRef]
- Finau, T.; Treagust, D.F.; Won, M.; Chandrasegaran, A.L. Effects of a Mathematics Cognitive Acceleration Program on Student Achievement and Motivation. Int. J. Sci. Math. Educ. 2016, 16, 183–202. [Google Scholar] [CrossRef]
- McCormack, L.; Finlayson, O.E.; McCloughlin, T.J. The CASE Programme Implemented Across the Primary and Secondary School Transition in Ireland. Int. J. Sci. Educ. 2014, 36, 2892–2917. [Google Scholar] [CrossRef]
- Venville, G.; Oliver, M. The impact of a cognitive acceleration programme in science on students in an academically selective high school. Think. Ski. Creativity 2015, 15, 48–60. [Google Scholar] [CrossRef]
- Endler, L.C.; Bond, T. Cognitive development in a secondary science setting. Res. Sci. Educ. 2000, 30, 403–416. [Google Scholar] [CrossRef]
- Endler, L.C.; Bond, T.G. Changing Science Outcomes: Cognitive Acceleration in a US Setting. Res. Sci. Educ. 2007, 38, 149–166. [Google Scholar] [CrossRef]
- Hugerat, M.; Najami, N.; Abbasi, M.; Dkeidek, I. The cognitive acceleration curriculum as a tool for overcoming difficulties in the implementation of inquiry skills in science education among primary school students. J. Balt. Sci. Educ. 2014, 13, 523–534. [Google Scholar] [CrossRef]
- Mohammed, M.K. ‘The Impact of the Cognitive Acceleration Strategy on Achievement in Chemistry and Deductive Thinking among Second Grade Intermediate Students’, Int. J. Innov., vol. 12, no. 4, 2020.
- Sarwar, S.; Samiullah, M.; Rahman, F.-U. The Effect of Cognitive Acceleration Programme on Critical Thinking of Science Students at Secondary Level. Int. J. Innov. Teach. Learn. (IJITL) 2021, 7, 87–100. [Google Scholar] [CrossRef]
- Mbano, N. The Effects of a Cognitive Acceleration Intervention Programme on the Performance of Secondary School Pupils in Malawi. Int. J. Sci. Educ. 2003, 25, 71–87. [Google Scholar] [CrossRef]
- Mbano, N. Pupils' thinking whilst designing an investigation. Afr. J. Res. Math. Sci. Technol. Educ. 2004, 8, 105–115. [Google Scholar] [CrossRef]
- , Science Education Now. A renewed pedagogy for the future of Europe. Luxembourg: Offices for Official Publications of the European Communities, 2007. [Online]. Available: https://www.eesc.europa.eu/sites/default/files/resources/docs/rapportrocardfinal. European, Commission (Ed.).
- Hazelkorn, E.; et al. , Eds, Science education for responsible citizenship: report to the European Commission of the Expert Group on Science Education. in Research and innovation, no. 26893 EN. Luxembourg: Publications Office of the European Union, 2015.
- Ariza, M.R.; Armenteros, A.Q.; Castro, A.E. Promoting critical thinking through mathematics and science teacher education: the case of argumentation and graphs interpretation about climate change. Eur. J. Teach. Educ. 2021, 47, 41–59. [Google Scholar] [CrossRef]
- Oliver, M.C.; Romero-Ariza, M.; Quesada, A.; Abril, A.M.; Sorensen, P. Highly Recommended and Poorly Used: English and Spanish Science Teachers’ Views of Inquiry-based Learning (IBL) and its Enactment. Eurasia J. Math. Sci. Technol. Educ. 2019, 16. [Google Scholar] [CrossRef] [PubMed]
- de Jong, T.; Lazonder, A.W.; Chinn, C.A.; Fischer, F.; Gobert, J.; Hmelo-Silver, C.E.; Koedinger, K.R.; Krajcik, J.S.; Kyza, E.A.; Linn, M.C.; et al. Let's talk evidence – The case for combining inquiry-based and direct instruction. Educ. Res. Rev. 2023, 39. [Google Scholar] [CrossRef]
- Zhang, L.; Kirschner, P.A.; Cobern, W.W.; Sweller, J. There is an Evidence Crisis in Science Educational Policy. Educ. Psychol. Rev. 2021, 34, 1157–1176. [Google Scholar] [CrossRef]
- Spronken-Smith, R.; Walker, R.; Batchelor, J.; O'Steen, B.; Angelo, T. Enablers and constraints to the use of inquiry-based learning in undergraduate education. Teach. High. Educ. 2011, 16, 15–28. [Google Scholar] [CrossRef]
- Lazonder, A.W.; Harmsen, R. Meta-Analysis of Inquiry-Based Learning. Rev. Educ. Res. 2016, 86, 681–718. [Google Scholar] [CrossRef]
- National Research Council. A Framework for K-12 Science Education: Practices, Crosscutting Concepts, and Core Ideas. Washington, D.C.: National Academies Press, 2012. Accessed: Feb. 01, 2024. [Online]. Available: http://nap. 1316.
- Osborne, J. Teaching Scientific Practices: Meeting the Challenge of Change. J. Sci. Teach. Educ. 2014, 25, 177–196. [Google Scholar] [CrossRef]
- Öztürk, B.; Kaya, M.; Demir, M. Does inquiry-based learning model improve learning outcomes A second-order meta-analysis. J. Pedagog. Res. 2022, 6, 201–216. [Google Scholar] [CrossRef]
- A Firman, M.; Ertikanto, C.; Abdurrahman, A. Description of meta-analysis of inquiry-based learning of science in improving students’ inquiry skills. J. Phys. 1088; [Online]. Available: https://iopscience.iop.org/article/10.1088/1742-6596/1157/2/022018. [Google Scholar]
- Campbell, D.T.; Stanley, J.C. Experimental and quasi-experimental designs for research. Belomt, CA: Wadsworth, 1966.
- Fraenkel, J.R.; Wallen, N.E.; Hyun, H.H. How to design and evaluate research in education, 8th ed. New York: McGraw-Hill Humanities/Social Sciences/Languages, 2012.
- Ahmadzadeh, H.; et al. , ‘Development of a Health Literacy Promotion Program HeLPP) to Promote Self-Care Behaviors and Quality of Life among Rural Patients with Type 2 Diabetes: Preliminary Results’, J. Health Lit., no. Online First, Apr. 2024. [Google Scholar] [CrossRef]
- Dare, S.E.; van Dijk, W.W.; van Dijk, E.; van Dillen, L.F.; Gallucci, M.; Simonse, O. The effect of financial education on pupils’ financial knowledge and skills: Evidence from a Solomon four-group design. J. Educ. Res. 2020, 113, 93–107. [Google Scholar] [CrossRef]
- Ermol, A. The effects of the SNAPPS model on clinical learning experiences for Physician Assistant students. J. Appl. Learn. Teach. 2023, 6. [Google Scholar] [CrossRef]
- Mercanoğlu, A.O.; Şimşek, K.Y. The Impact of Employee Recreation on Their Respective Productivity. SAGE Open 2023, 13. [Google Scholar] [CrossRef]
- Şahin, Ş.; Kılıç, A. Comparison of the effectiveness of project-based 6E learning and problem-based quantum learning: Solomon four-group design. J. Res. Innov. Teach. Learn. [CrossRef]
- Acevedo, J.A.; Oliva, J.M. ‘Validación y aplicación de un test de razonamiento lógico. Revista de psicología general y aplicada’, Rev. Psicol. Gen. Apl. Rev. Fed. Esp. Asoc. Psicol., vol. 48, no. 3, pp. 339–351, 1995.
- Odom, L.R.; Morrow, J.J.R. What's this r? A Correlational Approach to Explaining Validity, Reliability and Objectivity Coefficients. Meas. Phys. Educ. Exerc. Sci. 2006, 10, 137–145. [Google Scholar] [CrossRef]
- Revelle, W.; Condon, D.M. Reliability. In The Wiley Handbook of Psychometric Testing, 1st ed.; Irwing, P., Booth, T., Hughes, D.J., Eds.; Wiley, 2018, pp. 709–749. [CrossRef]
- Y. Susanti, H. Pratiwi, S. Sulistijowati H., and T. Liana, ‘M estimation, S estimation, and MM estimation in robust regression’. Int. J. Pure Apllied Math. 2014; 91, 349–360. [CrossRef]
- Braver, M.W.; Braver, S.L. Statistical treatment of the Solomon four-group design: A meta-analytic approach. Psychol. Bull. 1988, 104, 150–154. [Google Scholar] [CrossRef]
- El Karkri, M.; Quesada, A.; Romero-Ariza, M. Methodological aspects of the Solomon four-group design: Detecting pre-test sensitisation and analysing qualitative and quantitative variables in education research. Rev. Educ. 2025, 13. [Google Scholar] [CrossRef]
Figure 1.
Set 1): Variations in laminated shapes, white and black, triangles and squares, in small, medium, and large sizes.
Figure 1.
Set 1): Variations in laminated shapes, white and black, triangles and squares, in small, medium, and large sizes.

Figure 2.
Set 2): Introducing a cognitive conflict to explore whether there is a relationship between variables and values.
Figure 2.
Set 2): Introducing a cognitive conflict to explore whether there is a relationship between variables and values.

Figure 3.
Summary of Statistical Results for Pre-test (O1, O3) and Post-test Scores (O2, O4, O5, O6) with Treatment (X) Using the SFGD.
Figure 3.
Summary of Statistical Results for Pre-test (O1, O3) and Post-test Scores (O2, O4, O5, O6) with Treatment (X) Using the SFGD.
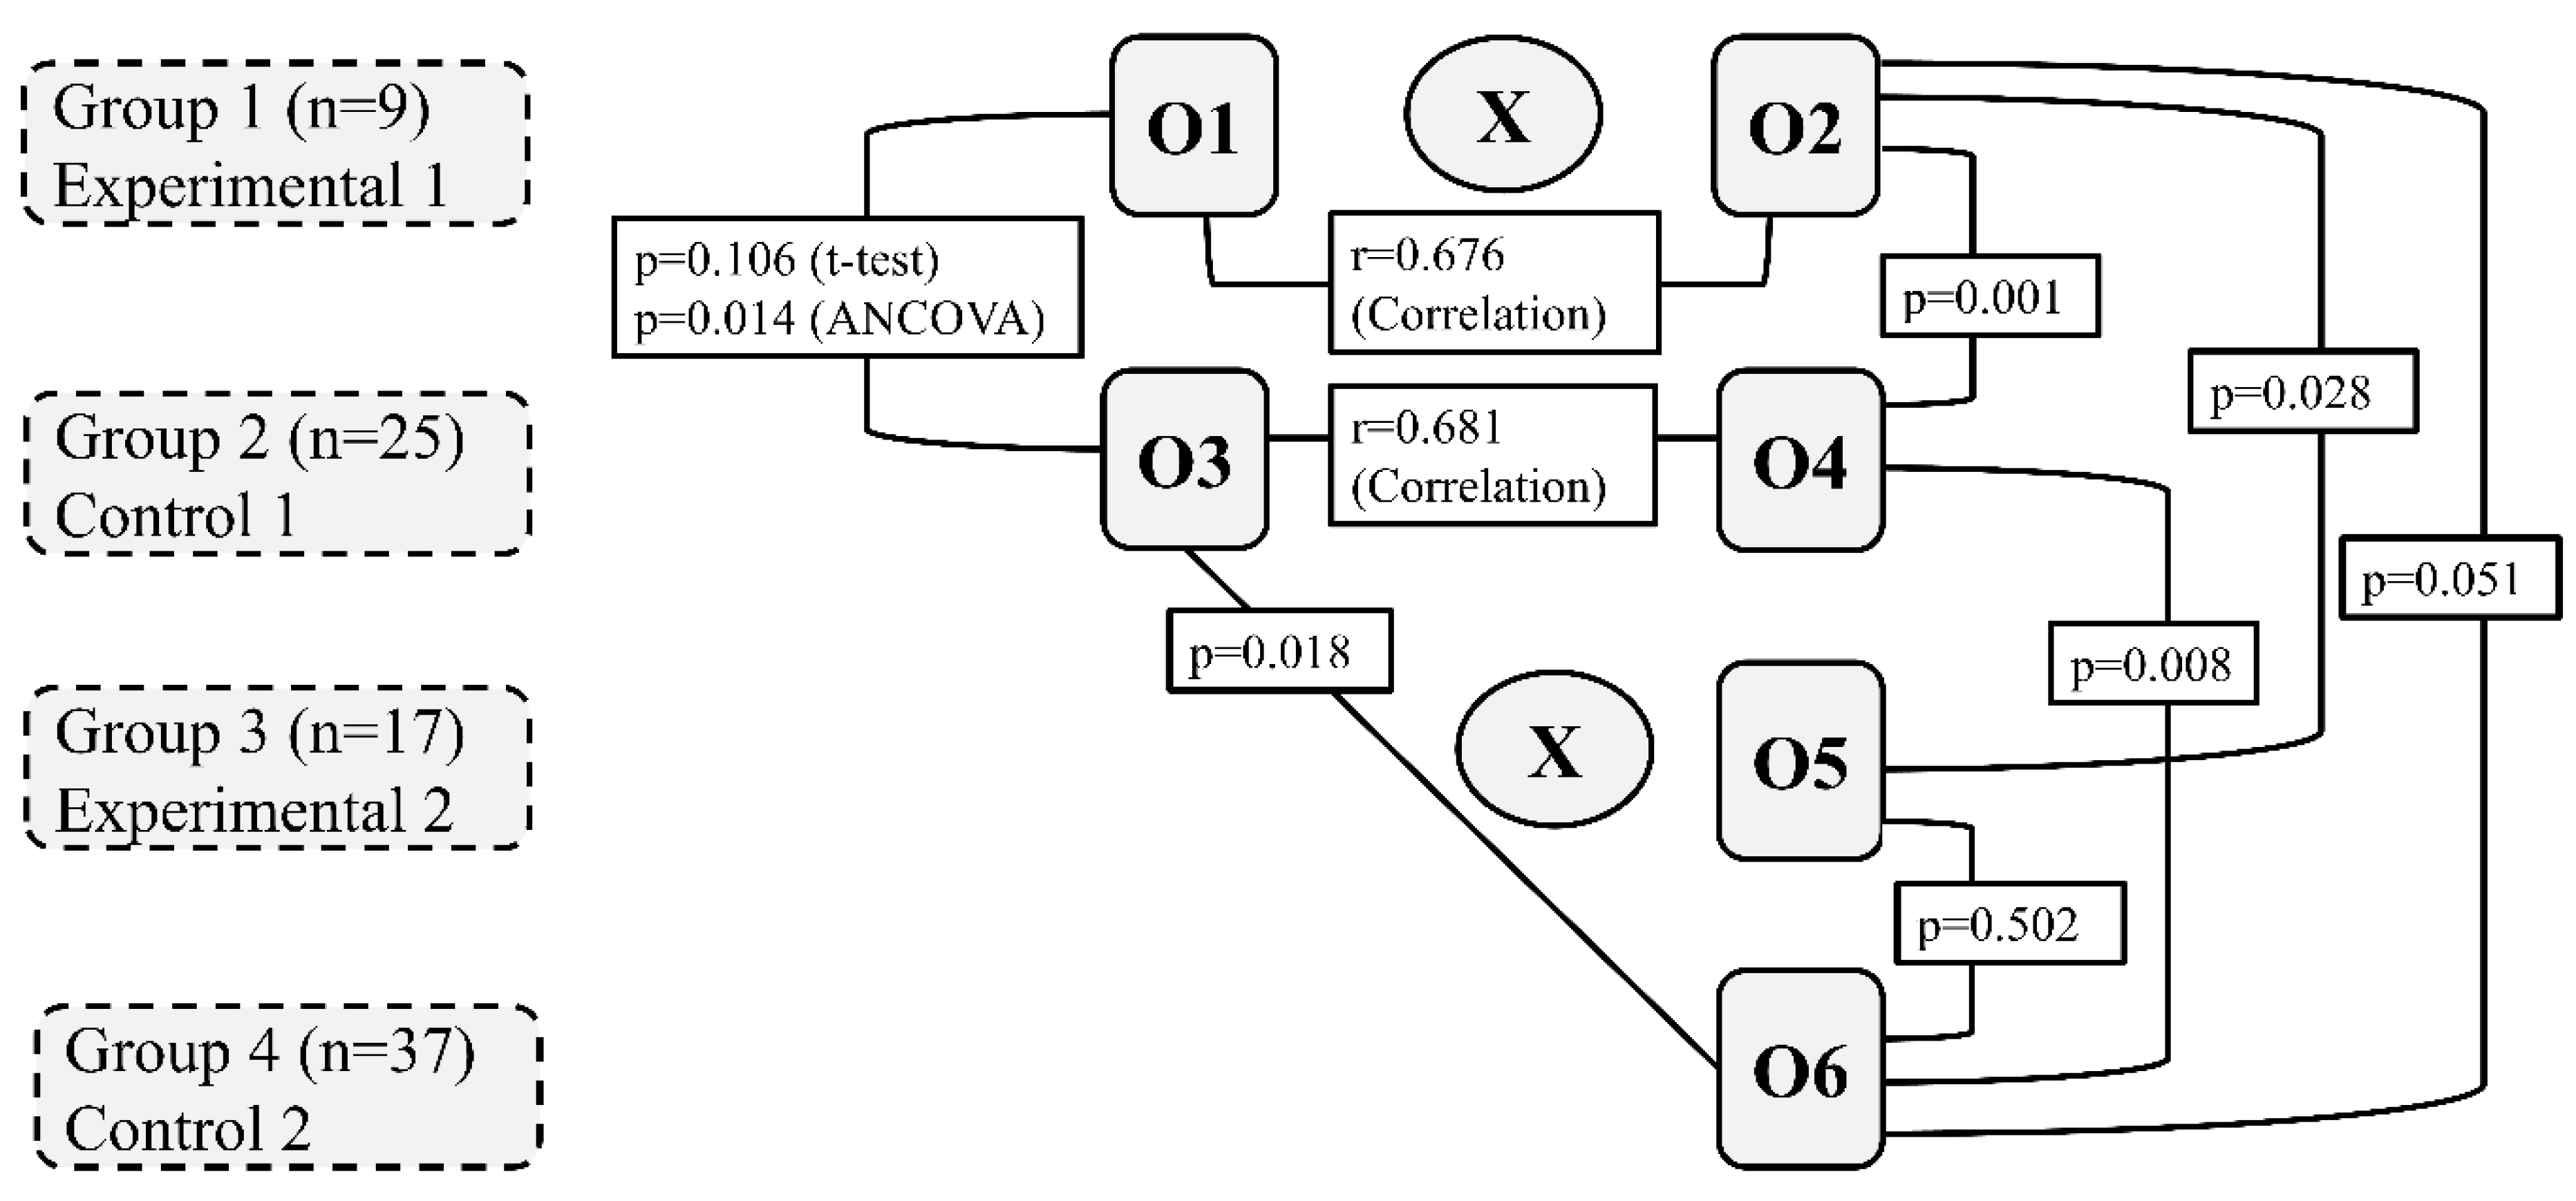

Table 1.
Resources and materials required for the CASE-based intervention following the first five lessons (Control of variables).
Table 1.
Resources and materials required for the CASE-based intervention following the first five lessons (Control of variables).
| Topics | Activities and Equipment required |
|---|---|
| What varies? |
|
| Two variables |
|
| What sort of relationship? |
|
| The fair test |
|
| Roller ball |
|
Table 2.
The Solomon Four Group Design.
| Groups | Assignment | Pre-test | Treatment | Post-test |
|---|---|---|---|---|
| Experimental 1 | Random | O1 | Yes | O2 |
| Control 1 | Random | O3 | No | O4 |
| Experimental 2 | Random | Yes | O5 | |
| Control 2 | Random | No | O6 |
Note. O1 through O6 represent different outcomes of the results.
Table 3.
The Solomon Four-Group Design and Sample Size for Each Group.
| Groups | Assignment | Size group | Group Percentage | Pre-test | Treatment | Post-test |
|---|---|---|---|---|---|---|
| Experimental 1 | Random | 9 | 10.2% | O1 | Yes | O2 |
| Control 1 | Random | 25 | 28.4% | O3 | No | O4 |
| Experimental 2 | Random | 17 | 19.3% | Yes | O5 | |
| Control 2 | Random | 37 | 42.0% | No | O6 |
Table 4.
Model Summary of Regression Analysis Examining the Predictive Relationship Between Pre-test and Post-test Scores.
Table 4.
Model Summary of Regression Analysis Examining the Predictive Relationship Between Pre-test and Post-test Scores.
| Model | R | R Square | Adjusted R Square | Std. Error of the Estimate |
|---|---|---|---|---|
| 1 | .703 a | .494 | .478 | 1.91628 |
| a. Predictors: (Constant), Pre-test Score | ||||
Table 5.
Regression Coefficients Estimating the Predictive Influence of Pre-test Scores on Post-test Performance.
Table 5.
Regression Coefficients Estimating the Predictive Influence of Pre-test Scores on Post-test Performance.
| Coefficientsa | ||||||||
|---|---|---|---|---|---|---|---|---|
| Model | Unstandardized Coefficients | Standardized Coefficients | t | Sig. | 95.0% Confidence Interval for B | |||
| B | Std. Error | Beta | Lower Bound | Upper Bound | ||||
| 1 | (Constant) | 3.045 | 1.053 | 2.893 | .007 | .901 | 5.189 | |
| Pre-test | .671 | .120 | .703 | 5.588 | .000 | .427 | .916 | |
| a. Dependent Variable: Post-test | ||||||||
Table 6.
Guttman’s Lambda Reliability Coefficients for Assessing Internal Consistency of the Measurement Instrument.
Table 6.
Guttman’s Lambda Reliability Coefficients for Assessing Internal Consistency of the Measurement Instrument.
| Lambda | 1 | .762 |
| 2 | .837 | |
| 3 | .802 | |
| 4 | .825 | |
| 5 | .838 | |
| 6 | . | |
| N of Items | 20 | |
Disclaimer/Publisher’s Note: The statements, opinions and data contained in all publications are solely those of the individual author(s) and contributor(s) and not of MDPI and/or the editor(s). MDPI and/or the editor(s) disclaim responsibility for any injury to people or property resulting from any ideas, methods, instructions or products referred to in the content. |
© 2025 by the authors. Licensee MDPI, Basel, Switzerland. This article is an open access article distributed under the terms and conditions of the Creative Commons Attribution (CC BY) license (http://creativecommons.org/licenses/by/4.0/).
Copyright: This open access article is published under a Creative Commons CC BY 4.0 license, which permit the free download, distribution, and reuse, provided that the author and preprint are cited in any reuse.


