

Submitted:
29 October 2025
Posted:
30 October 2025
You are already at the latest version
Abstract
Whole-body vibration (WBV) represents a significant health and comfort concern in modern public transportation systems. This study compares vibration exposure in two types of articulated city buses — diesel-powered and fully electric— under real operating conditions in one of European city (1 million inhabitants). Measurements were conducted at three seating positions (front, middle, rear) across four surface types: smooth asphalt, mixed asphalt-rail, cobblestone, and idle. Triaxial accelerometers recorded accelerations processed according to ISO 2631-1. The frequency-weighted root mean square (RMS) served as the principal comfort indicator, while FFT spectra provided spectral insight. Results show up differences in vibrations, and therefore passenger comfort, in both buses powered by different energy sources (the research was conducted in the period May - July 2025). The article highlights additional inconveniences resulting from operating the buses on roads.
Keywords:
whole-body vibration (WBV)
; ISO 2631-1
; RMS
; electric bus
; diesel bus
; vibration comfort
; passenger health
1. Introduction
The Mechanical vibrations are an inherent component of vehicular operation, affecting both mechanical integrity and human well-being. Whole-body vibration (WBV), transmitted through seats and vehicle structures, can lead to discomfort, fatigue, and long-term health risks. The ISO 2631-1:1997 standard provides the foundation for assessing human exposure to vibration by defining frequency-weighting filters (Wd, Wk) and health guidance caution zones.
In the context of urban public transport, buses are one of the most frequent sources of long-term exposure to WBV. The recent transition to electric propulsion promises not only lower emissions but also potential improvement in ride quality due to smoother torque delivery and reduced drivetrain-induced vibrations. However, comparative data quantifying WBV differences between diesel and electric city buses remain limited.
The main objective of this study is to quantify WBV in real operational conditions for two articulated bus platforms—diesel and electric—and to assess their implications for passenger comfort and health using ISO 2631-1997 standard.
There is a wealth of valuable literature available in the literature, including studies on vibrations (and even their potential impact on passenger discomfort) in various vehicles equipped with engines with different power supply methods [1,2,3,4,5,6,7,8].
Thamsuwan O., et al. [1] conducted a large-scale field study on WBV exposure in urban bus drivers, showing significant health risk classification under ISO thresholds, especially on cobbled surfaces. Their findings underscore the role of road profile in WBV exposure. Similarly, Ittianuwat R., et al. [2] evaluated different seat suspension systems and found that vertical WBV amplitudes can be reduced with optimized passive dampers.
Patel, Gohil and Borhade [3] compared vibration exposure across various urban road profiles and speeds, establishing that asphalt-rail transitions induce frequency spikes in the 2–8 Hz range, which directly affect lumbar resonance. In another key study, Jagiełło, Wołek and Bizon [4] contrasted WBV between diesel and electric buses, revealing that e-buses demonstrate lower weighted RMS values due to smoother drivetrain profiles.
From a biomechanical standpoint, Alin et al. [5] modelled human-seat dynamics under vertical and multi-axis excitation. Their simulation validated ISO thresholds and indicated that the spine is most sensitive to oscillations below 6 Hz. This aligns with findings by Bai [6], who compared active and passive bus seats, noting a marked reduction in exposure under active damping conditions.
Multibody dynamics have also been applied. Portela and Zannin [7] simulated seated human response in vehicle cabins and identified yaw-induced WBV peaks near articulation joints. Fernandes [8] proposed an optimization framework for suspension design, validated with ISO metrics, reducing exposure zone classification from “Caution” to “Acceptable”.
The particularly valuable literature presenting the results of tests of vehicle components (active and passive) on vibration potential [9,10,11,12]. Horvath and Feszty [9] reviewed gear waviness and NVH in EVs, emphasizing that high-frequency vibrations in EVs are more dominant compared to ICE vehicles, affecting perceived comfort. Sangeetha and Ramachandran [9] focused on PMSM-based electric drives, showing that torque ripple is a significant source of passenger discomfort, especially at low speeds. García-Tárrago et al. [10] explored vibration transmission through rubber mounts, highlighting how different impedance behavior in ICE and EV configurations affects isolation efficiency. Fiedler et al. [11] compared interior noise and vibration levels in premium ICE and EV vehicles, noting that EVs tend to have improved low-frequency profiles but introduce high-frequency challenges due to electric drivetrain harmonics. Gad et al. [12] evaluated magnetorheological damper seats in both ICE and EV platforms. The study found measurable improvements in vibration suppression under real-world uncertain driving conditions, offering benefits in both types of vehicles.
Taking into account the subject of the article, it is also necessary to cite publications concerning vibration research in the light of their impact on the human body [14,15,16,17]. Whole-body vibration (WBV) occurs when mechanical oscillations are transmitted through a vehicle's structure to its occupants. This type of exposure is common in transportation environments, particularly among professional drivers and frequent commuters. Numerous studies have investigated the physiological, neurological, and musculoskeletal impacts of WBV on the human body. Zhang et al. [14] investigated the onset of drowsiness induced by WBV during transportation. Their findings suggest that specific vibration frequencies (particularly in the 1–20 Hz range) can induce fatigue and drowsiness in as little as 20 minutes of exposure, posing significant safety risks in vehicular and public transport contexts. Griffin’s foundational work [15] identifies the resonance frequencies of the human body, revealing heightened sensitivity around 4–8 Hz for the spine and internal organs. These frequencies are commonly encountered in road and rail transport, which may contribute to spinal compression, lower back pain, and long-term tissue degradation. Rahmani et al. [16] assessed the physiological strain on bus drivers under WBV conditions, noting increased heart rates and muscle fatigue, particularly in the lumbar region. These effects were correlated with reduced reaction time and performance accuracy, suggesting operational risk escalation in professional driving scenarios. Li et al. [17] explored the effect of WBV in high-speed magnetic levitation (maglev) trains, comparing it with traditional rail vehicles. The study revealed that although maglev systems eliminate some vibrational sources, failures in levitation units can introduce unique WBV patterns with similar health implications.
2. Methodology
The study was conducted over a three-month period on a regular public transport bus route. These vehicles are very popular across Europe, with over 50,000 diesel vehicles sold and 2,500 electric vehicles sold. The average age of the vehicles studied was five years. The table below compares the key parameters of the two articulated bus models studied.

Table 1.
Comparison of methodologically significant parameters of the tested articulated buses.
| Specification | Bus 1 (diesel) (Euro-5) | Bus 2 (electric) |
| Length (m) | 18.13 | 18.13 |
| Power Output (kW) | 220–260 | 440 peak |
| Gross Weight (kg) | 28,000 | 29,000 |
| Passenger Capacity | 163 | 146 |
| Production period (years) | 1997 - 2006 | 2019 - present |
Both vehicles operated in (this same) line in European city, along identical routes and traffic conditions, covering asphalt, cobblestone, and mixed surfaces (tram-rail section). Measurements were taken at three seat locations: front (behind driver), middle (articulated joint), and rear (above engine/electric axle).
WBV was measured using triaxial accelerometers, mounted on the seat bases to capture vertical (z), lateral (y), and longitudinal (x) accelerations. Sensors were connected to a data acquisition system offering 24-bit resolution and 10 kHz sampling rate per channel [18]. Table 2 contains the most important parameters of the sensor and acquisition system used.
All devices were calibrated prior to measurements. The measurement protocol followed ISO 2631-1 guidelines, ensuring correct sensor orientation, surface fixation, and route repeatability.
The objective of the experiment was to obtain comparable seat-vibration data in two city
buses ( diesel-powered and an electric). The study was organized as a two-factor design with repeated trials. The independent variables were: (i) pavement/operating condition with four levels - asphalt, mixed (asphalt with tram tracks which is very often for bus ride, because trams and buses share the same "bus lane"), cobblestone, and idle (bus at standstill) - and (ii) seat location with three levels - front, middle, and rear. All other conditions were kept constant as far as practicable; in particular, the same route segments, instrumentation, and parameter settings were used throughout. The complete measurement structure for both buses is shown in Figure 1 (diesel) and Figure 2 (electric). For each bus and each seat location, the vehicle was driven over three fixed route segments representative of the pavement types (asphalt / mixed / cobblestone). In addition, an idle condition was recorded with the bus stopped. Each condition was measured in two independent repetitions ( ×2 ). In total this yields 4 conditions × 3 seats × 2 repetitions = 24 runs per bus and 48 runs overall.
The following vibration parameters are calculated for each channel and seat position:
- RMS (Root Mean Square) - quantifies the average vibration level and is directly linked to long-term health effects (shows the average vibration level);
- VDV (Vibration Dose Value) - measures cumulative vibration exposure, sensitive to transient shocks (tells how strong the total vibration exposure was);
- Peak acceleration - the highest instantaneous acceleration recorded during the session;
- Crest Factor - the ratio of peak to RMS, indicating the sharpness or impulsiveness of the signal (checks if the vibration had sharp peaks or was smooth);
- Dominant Frequency - the frequency component with the highest energy (after weighting), related to human resonance;
- Peak Time - the moment at which peak acceleration occurs, useful for correlating with route events.
Before analysis, the raw acceleration signals are filtered using ISO-defined weighting curves (Wd, Wk, etc.) based on the axis of measurement [20]. This ensures the signal reflects the actual perception and physiological impact of vibration on the human body. A key part of the methodology is the synthesis of a combined vector magnitude (VM) from the three orthogonal axes (X, Y, Z), which allows evaluation of total-body exposure. Based on the combined RMS and VDV values, each measurement is classified into ISO-defined exposure zones (e.g., safe, borderline, or hazardous).
3. Results
This study compared the exposure to whole-body vibration in two articulated city buses: a diesel-powered and a fully electric bus (Table 1). Measurements were conducted under identical operating conditions across various seat positions and road surface types. All data were analyzed according to ISO 2631-1 standards, focusing on frequency-weighted RMS values, VDV, crest factor, and spectral characteristics.
Seat location was the main factor determining the level of WBV. The front seat consistently provided the lowest exposure, while the middle and rear seats had higher amplitudes, especially on uneven surfaces. Spectral analysis also confirmed that the electric drive effectively eliminates mid-frequency components (20–30 Hz), which are typically associated with oscillations of the combustion engine drivetrain at idle [21,22]. In other situations, vibration exposure in the articulated electric bus is higher than in the diesel bus (Figure 3 and Figure 4).
The above data pertain to the combined cycle, in terms of the vehicle's driving surface. However, a more precise distinction between the surface (asphalt and cobblestone) reveals a slight reduction in vibrations in the articulated electric bus for the seats located in the middle and at the front of the vehicle, when driving on asphalt. These small differences do not affect the final conclusion of a higher average vibration exposure in the electric vehicle.
The summary of measurements and their analysis in relation to the ISO 2631-1 standard indicates detailed numerical values:
- Asphalt: aw≈0,24-0,35 m/s2 across seats. This places the front seat in not
uncomfortable and some middle/rear cases in a little uncomfortable. Diesel and
Electric are close; Electric is lower at the middle seat. FFTs are dominated by very low frequencies with modest levels, hence small weighted RMS.
- Mixed (asphalt + tram tracks): aw≈0,45-0,67 m/s2, i.e. mostly fairly uncom-
fortable (with some front-seat Diesel cases at a little uncomfortable). Electric tends
to be higher at the front and rear seats. FFTs show broadened energy in the 3-20 Hz band, which is strongly weighted by Wk.
- Cobblestone: aw≈0,86-1,45 m/s2 at all seats, i.e. firmly uncomfortable. The
Electric bus is typically higher at the middle and rear seats. FFTs present elevated broadband content with a hump in ∼ 4-12 Hz, the range most influential for seated vertical WBV per ISO 2631-1, explaining the high aw.
- Idle: aw≈0,008-0,074 m/s2 (not uncomfortable) for all seats. Diesel exhibits a
narrow low-frequency line (engine idle), but absolute levels remain low; Electric is uniformly lower in idle.
Figure 5 illustrates the frequency spectrum analysis performed using Power Spectral Density (PSD) calculated via Welch's method. The results are focused on the 0-80 Hz band, as this range was identified to contain the dominant spectral content. The Total PSD represents the cumulative power across all three axes (X, Y, Z).
At the sample measurement location (middle seat) and for both mixed and cobblestone surfaces, the maximum PSD values within this range were significantly higher for the electric bus. This observation is corroborated by the frequency-weighted RMS results. Furthermore, these distinct differences in the waveforms persist across all tested surface types, suggesting that this vibrational signature is primarily attributable to the bus's intrinsic mechanical characteristics rather than the road-surface interaction.
It's important to note that not only high amplitude but also frequency variability can lead to micro-injuries, preclinical changes, and psychomotor fatigue [23]. This also highlights the importance of harmonizing vibration risk measurement methods.
For studies with a large number of variables (surface type, power supply method, passenger seat), it was decided to summarize the research results in the form of a heatmap. Figure 6 shows the aforementioned map for the OZ direction.
Based on the research carried out and its analysis, the following general conclusions can be drawn:
- No universal winner between vehicle types. The relative ranking of diesel vs. electric depends on surface and seat. The Electric bus is consistently lower in idle and is sometimes lower on asphalt, whereas on mixed and cobblestone it often shows higher Wk-weighted RMS at the middle and rear seats.
- Comfort is governed by energy in the ISO-sensitive band. Elevated FFT content in ∼ 4-12 Hz (where Wk applies the strongest weights for a seated person in the vertical direction) is the primary driver of increases in mixed and cobblestone sections concentrate energy in this band, which explains the shift toward higher discomfort classes.
- Seat location matters. On rougher surfaces (mixed, cobblestone) the middle and rear seats typically exhibit higher aw than the front seat, consistent with the time domain
- Surface dictates comfort class; asphalt - not to a little uncomfortable; mixed – pre dominantly fairly uncomfortable; cobble- stone - uncomfortable at all seats; idle – not uncomfortable.
- Engine signature in idle is visible but negligible for aw. Diesel idle shows a narrow low-frequency line in the FFT (engine order), yet absolute levels are small; electric idle remains uniformly low. Both yield very low weighted RMS in idle.
It should be noted that the above studies were conducted (over a three-month period) on real vehicles (articulated buses), both electric and diesel-powered, operating on a fixed route. The tested vehicles (Table 1) have very similar parameters (except for the power supply method) and are extremely popular in public transport in Europe. The obtained results appear to result from the weight distribution of these vehicles (articulated electric buses have batteries located on the roof). Each subsequent generation of batteries increases their capacity, but also their weight, as demonstrated in the literature [24,25].
Taking into account the average time of use of public transport buses in Europe (diesel 12-15 years, electric 10-14 years, which corresponds to 500,000-800,000 km), the tests should be repeated periodically, based on subsequent generations of introduced buses. The research did not take into account another variable reported by electric bus drivers, i.e. significant surface degradation caused by electric buses, which must have a direct impact on vibration exposure.
Author Contributions
All authors have read and agreed to the published version of the manuscript.”
Funding
This research received no external funding
Institutional Review Board Statement
Not applicable
Informed Consent Statement
Not applicable.
Data Availability Statement
Data Availability Statements are available in section “MDPI Research Data Policies” at https://www.mdpi.com/ethics.
Acknowledgments
The authors have reviewed and edited the output and take full responsibility for the content of this publication.
Conflicts of Interest
The authors declare no conflicts of interest.
Abbreviations
The following abbreviations are used in this manuscript:
| Aw | Weighted Root Mean Square Acceleration (m/s²), as per ISO 2631-1 |
| EV | Electric Vehicle |
| FFT | Fast Fourier Transform |
| ICE | Internal Combustion Engine |
| ISO | International Organization for Standardization |
| LD | Linear Dichroism |
| MDPI | Multidisciplinary Digital Publishing Institute |
| NVH | Noise, Vibration, and Harshness |
| PMSM | Permanent Magnet Synchronous Motor |
| RMS | Root Mean Square |
| TLA | Three Letter Acronym |
| VDV | Vibration Dose Value |
| VM | Vector Magnitude |
| WBV | Whole-Body Vibration |
| Wd | Frequency weighting filter for horizontal direction (per ISO 2631-1) |
| Wk | Frequency weighting filter for vertical direction (per ISO 2631-1) |
References
- Thamsuwan O., et al. (2022). Whole-body vibration exposure in urban bus drivers: A field study. International Journal of Industrial Ergonomics 43(1):9-17. [CrossRef]
- Ittianuwat R., Fard M., Kato K. (2017). Evaluation of seatback vibration based on ISO 2631-1 (1997) standard method: The influence of vehicle seat structural resonance. Ergonomics, 60(1):82-92. [CrossRef]
- Patel, A. Gohil P., Borhade B. (2010). Modeling and Vibration Analysis of Road Profile Measuring System. International Journal of Automotive and Mechanical Engineering 1:13-28. [CrossRef]
- Jagiełło A., Wołek M., Bizon W. (2023). Comparison of Tender Criteria for Electric and Diesel Buses in Poland—Has the Ongoing Revolution in Urban Transport Been Overlooked? Energies 1:13-28. [CrossRef]
- Alin O., Tarnita D., Bolcu D., Malciu R. (2025). A study of biomechanical model of seated human body exposed to vertical vibrations. Materials Science and Engineering 997(IOP Conf. Series: Materials Science and Engineering):2-9.
- Bai X. (2016). Integrated semi-active seat suspension for both longitudinal and vertical vibration isolation. Journal of Intelligent Material Systems and Structures 28(8):1036-1049. [CrossRef]
- Portela B., Zannin P., (2021). Whole-Body Vibration in Bus Drivers: Association with Physical Fitness and Low Back Pain. International Journal for Innovation Education and Research.
- Fernandes E. S. (2017). Optimization of Vehicle Suspension System to Improve Comfort. IOSR Journal of Mechanical and Civil Engineering 17(01):33-40. [CrossRef]
- Horvath, K.; Feszty, D. (2025). Surface Waviness of EV Gears and NVH Effects—A Comprehensive Review. World Electr. Veh. J., 16(9), 540. https://www.mdpi.com/2032-6653/16/9/540.
- Sangeetha, E.; Ramachandran, V.P. (2025). Speed and current harmonics reduction using an adaptive proportional integral resonant controller for PMSM based electric vehicle drives. Sci. Rep. https://www.nature.com/articles/s41598-025-09981-1.
- García-Tárrago, M.J.; Calaf-Chica, J. (2025). High-frequency mechanical impedance of rubber mounts: experimental characterization and resonance mechanisms. Eur. J. Mech. A/Solids. https://www.sciencedirect.com/science/article/pii/S0997753825001111.
- Fiedler, U.; Visser, R.; Kreissig, V. (2025). Interior Noise Optimization of Powertrain. In Proceedings of the Acoustics Conference. https://books.google.com/books?id=-ulZEQAAQBAJ&pg=PA88.
- Gad, A.S.; Ata, W.G.; El-Zomor, H.M.; Jabeen, S.D. (2025). Optimizing driver comfort: magnetorheological damper seat suspension for internal combustion and electric vehicles under uncertain conditions. J. Vib. Eng. Technol. https://link.springer.com/article/10.1007/s42417-024-01714-4.
- Zhang, N.; Fard, M.; Davy, J.L.; Robinson, S.R. (2025). Vibration-induced drowsiness contours: New safety recommendations for the transport industry. J. Saf. Res. https://www.sciencedirect.com/science/article/pii/S0022437525001112.
- Griffin, M.J. (1996). Handbook of Human Vibration; Academic Press: London, UK.
- Rahmani, R.; Aliabadi M., Golmohammadi R., Babamiri M., Farhadian M. (2022). Body physiological responses of city bus drivers subjected to noise and vibration exposure in working environment. Heliyon. [CrossRef]
- Li, Y.; Yin, M.; Wang, Z.; He, Y.; Li, H. (2025). Dynamic Analysis of Levitator Failure in HTS Pinning Maglev Vehicle. IEEE Trans. Magn. https://ieeexplore.ieee.org/abstract/document/10925621/.
- National Instruments. NI-9234 Specifications. Available online: https://www.ni.com/pdf/manuals/374186d.pdf (accessed on 15 October 2025).
- PCB Piezotronics. Model 356B41. Available online: https://www.pcb.com/products?m=356B41 (accessed on 15 October 2025).
- International Organization for Standardization. ISO 2631-1:1997 - Mechanical vibration and shock — Evaluation of human exposure to whole-body vibration — Part 1: General requirements.
- Mnati, H.M.; Hammami, M.; Ksentini, O. (2025). Study of Four-Stroke Engine Vibrations: Influence of Friction and Thermal Effects on Piston Speed, Displacement, and Acceleration. J. Middle Tech. Univ. https://journal.mtu.edu.iq/index.php/MTU/article/view/2700.
- Rahimi A., Mohd, S.; Kamarudin, Q.E. (2025). Design of Vibration Energy Harvester Using Piezoelectric Sensor. Res. Prog. Mech. Manuf. Eng. https://penerbit.uthm.edu.my/periodicals/index.php/rpmme/article/view/21591.
- Tarabini, M.; Bovenzi, M. (2025). Human Response to Vibration: Measurement and Assessment of Risk. IEEE Instrum. Meas. [CrossRef]
- Sandrini G., Chindamo D., Gadola M., Candela A., Magri P. (2024) Exploring the Impact of Vehicle Lightweighting in Terms of Energy Consumption: Analysis and Simulation on Real Driving Cycle. Energies 2024, 17(24). [CrossRef]
- Czerliński M., Pawłowski P. (2025) Capacity of Zero-Emission Urban Public Transport, „Sustainability”, 2025, t.17, s. 1–21. [CrossRef]
Figure 1.
Structure of vibration measurements for diesel-powered bus.
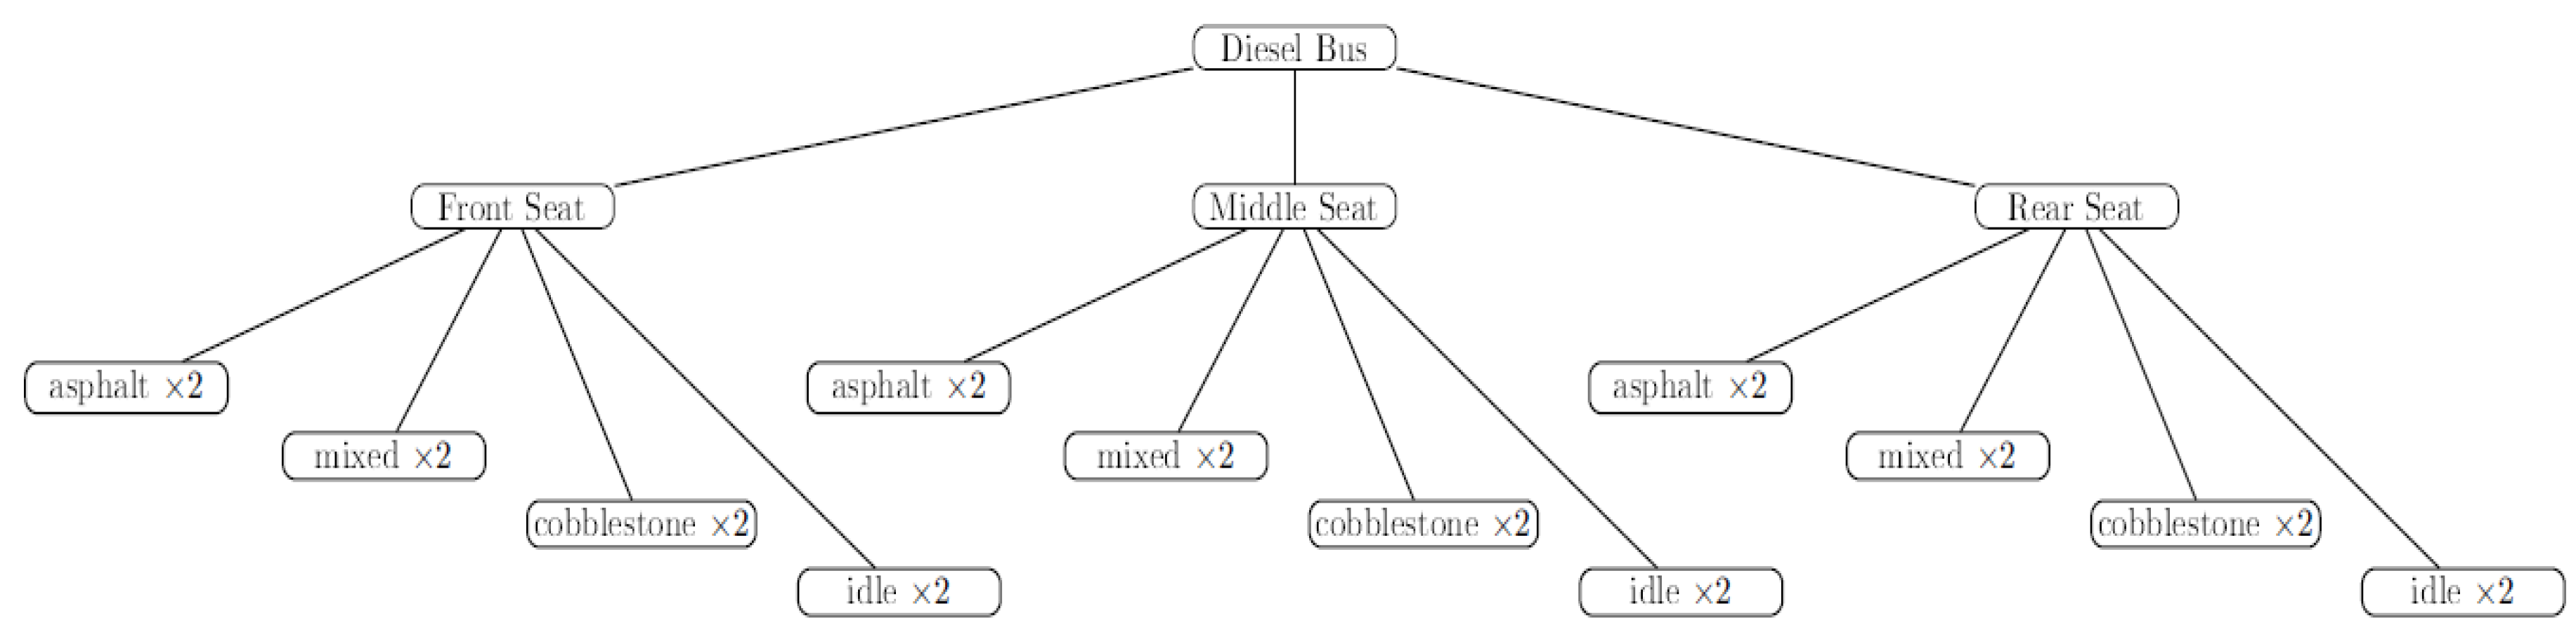
Figure 2.
Structure of vibration measurements for electrical-powered bus.
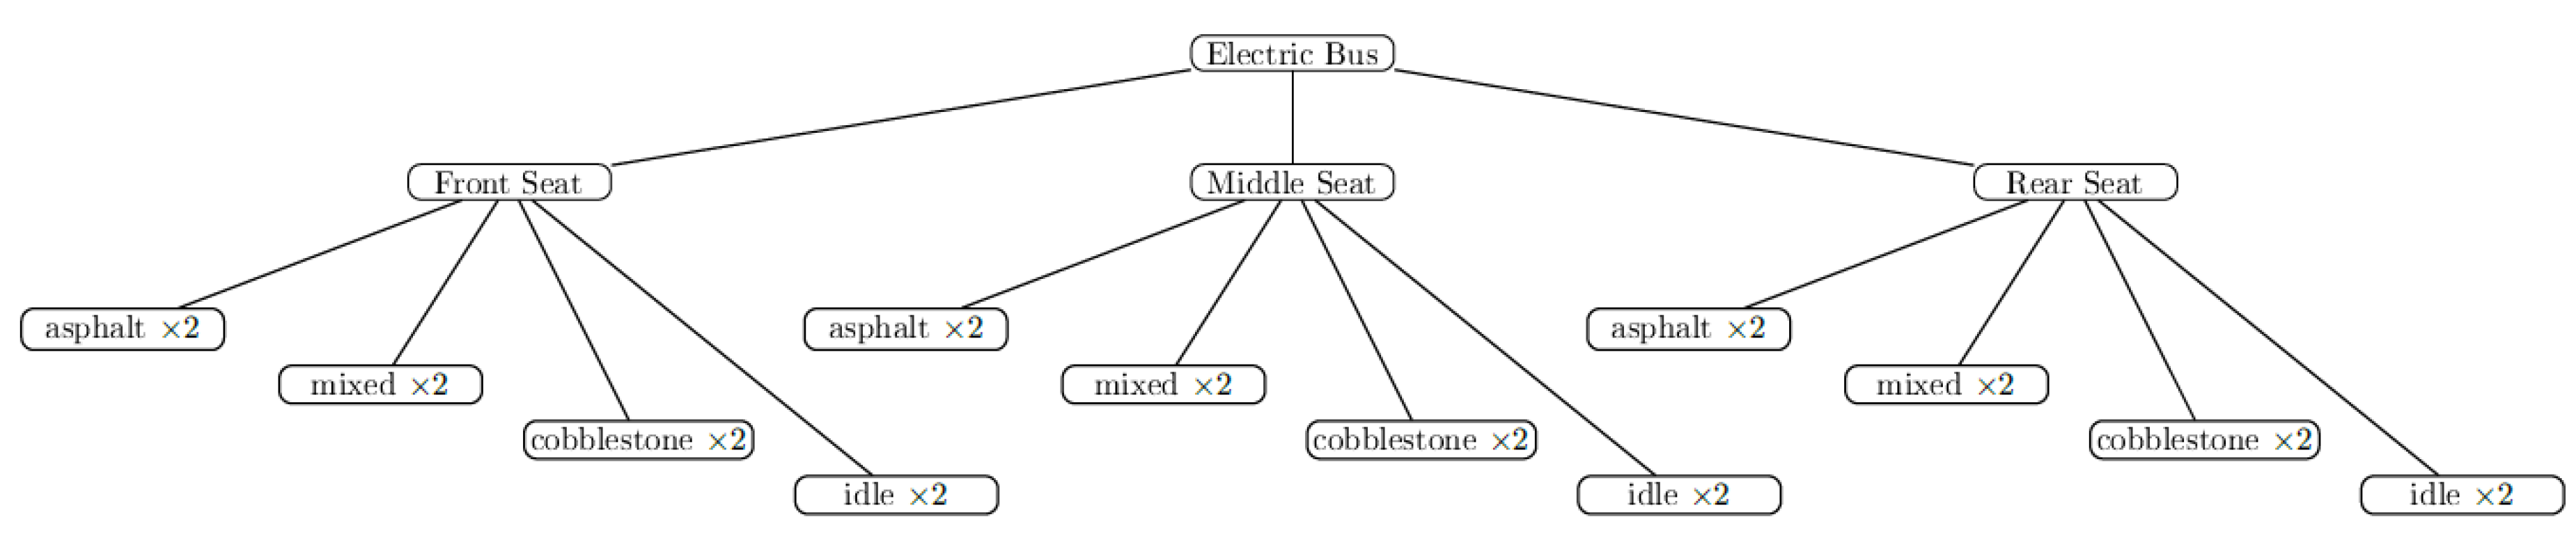
Figure 3.
Average RMS vector value, diesel bus.
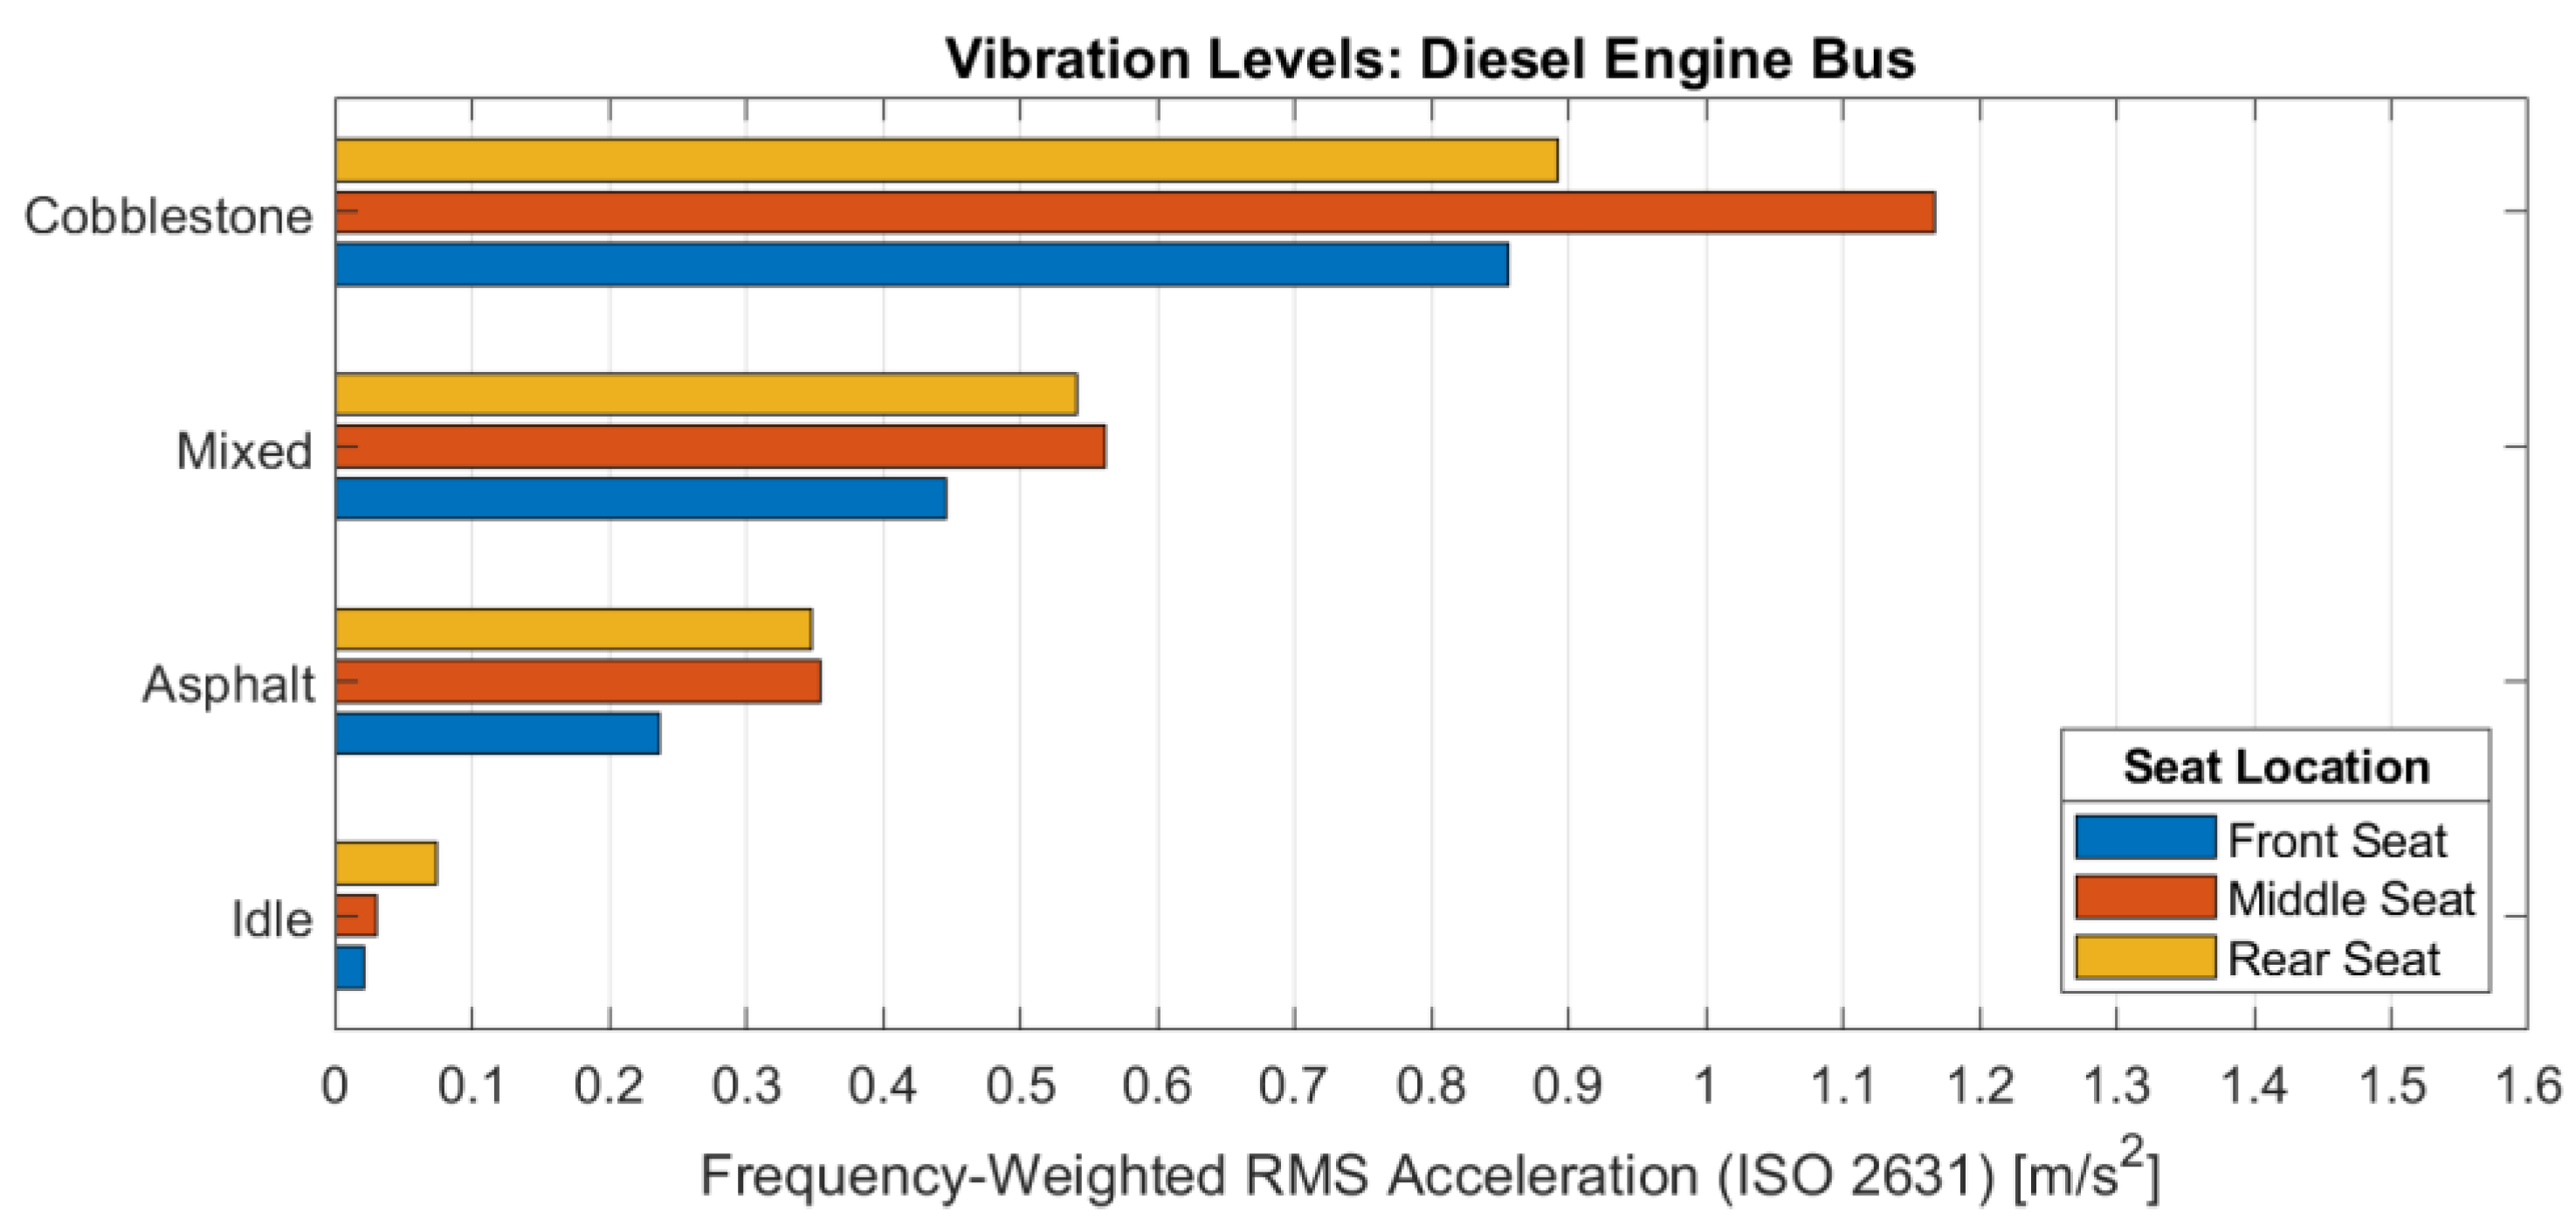
Figure 4.
Average RMS vector value, electric bus.
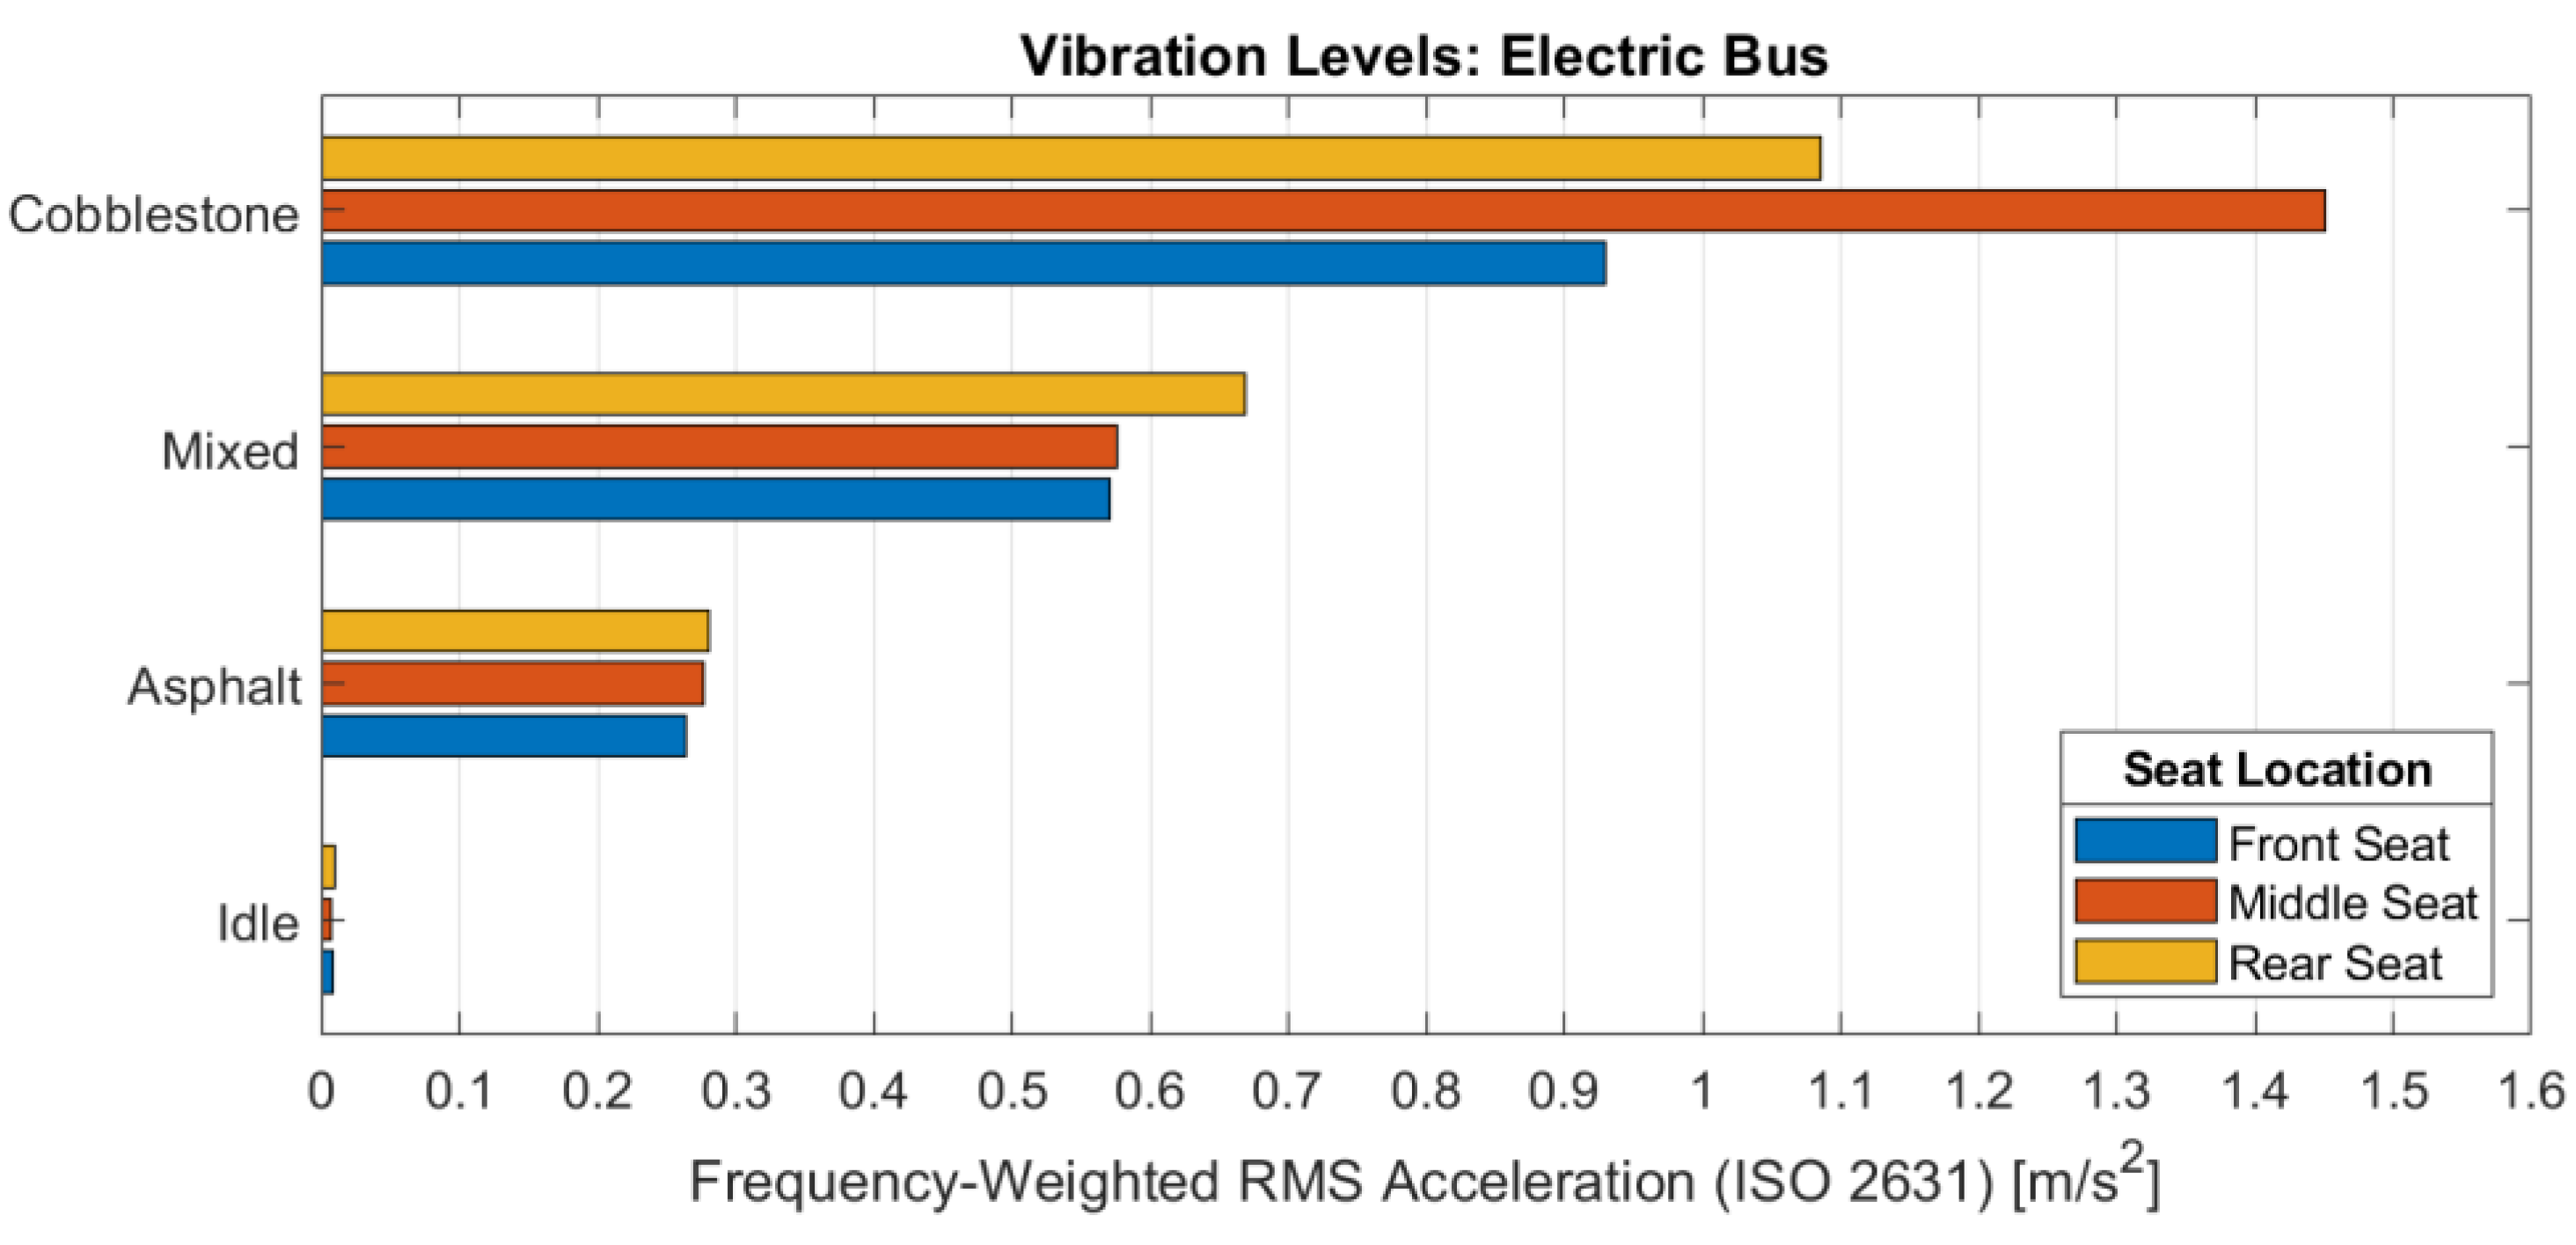
Figure 5.
Comparison of the averaged Total Power Spectral Density (PSD) (power sum of X, Y, Z axes) measured at the middle seat for a diesel bus (left) and an electric bus (right) on an asphalt, mixed and cobblestone surface.
Figure 5.
Comparison of the averaged Total Power Spectral Density (PSD) (power sum of X, Y, Z axes) measured at the middle seat for a diesel bus (left) and an electric bus (right) on an asphalt, mixed and cobblestone surface.
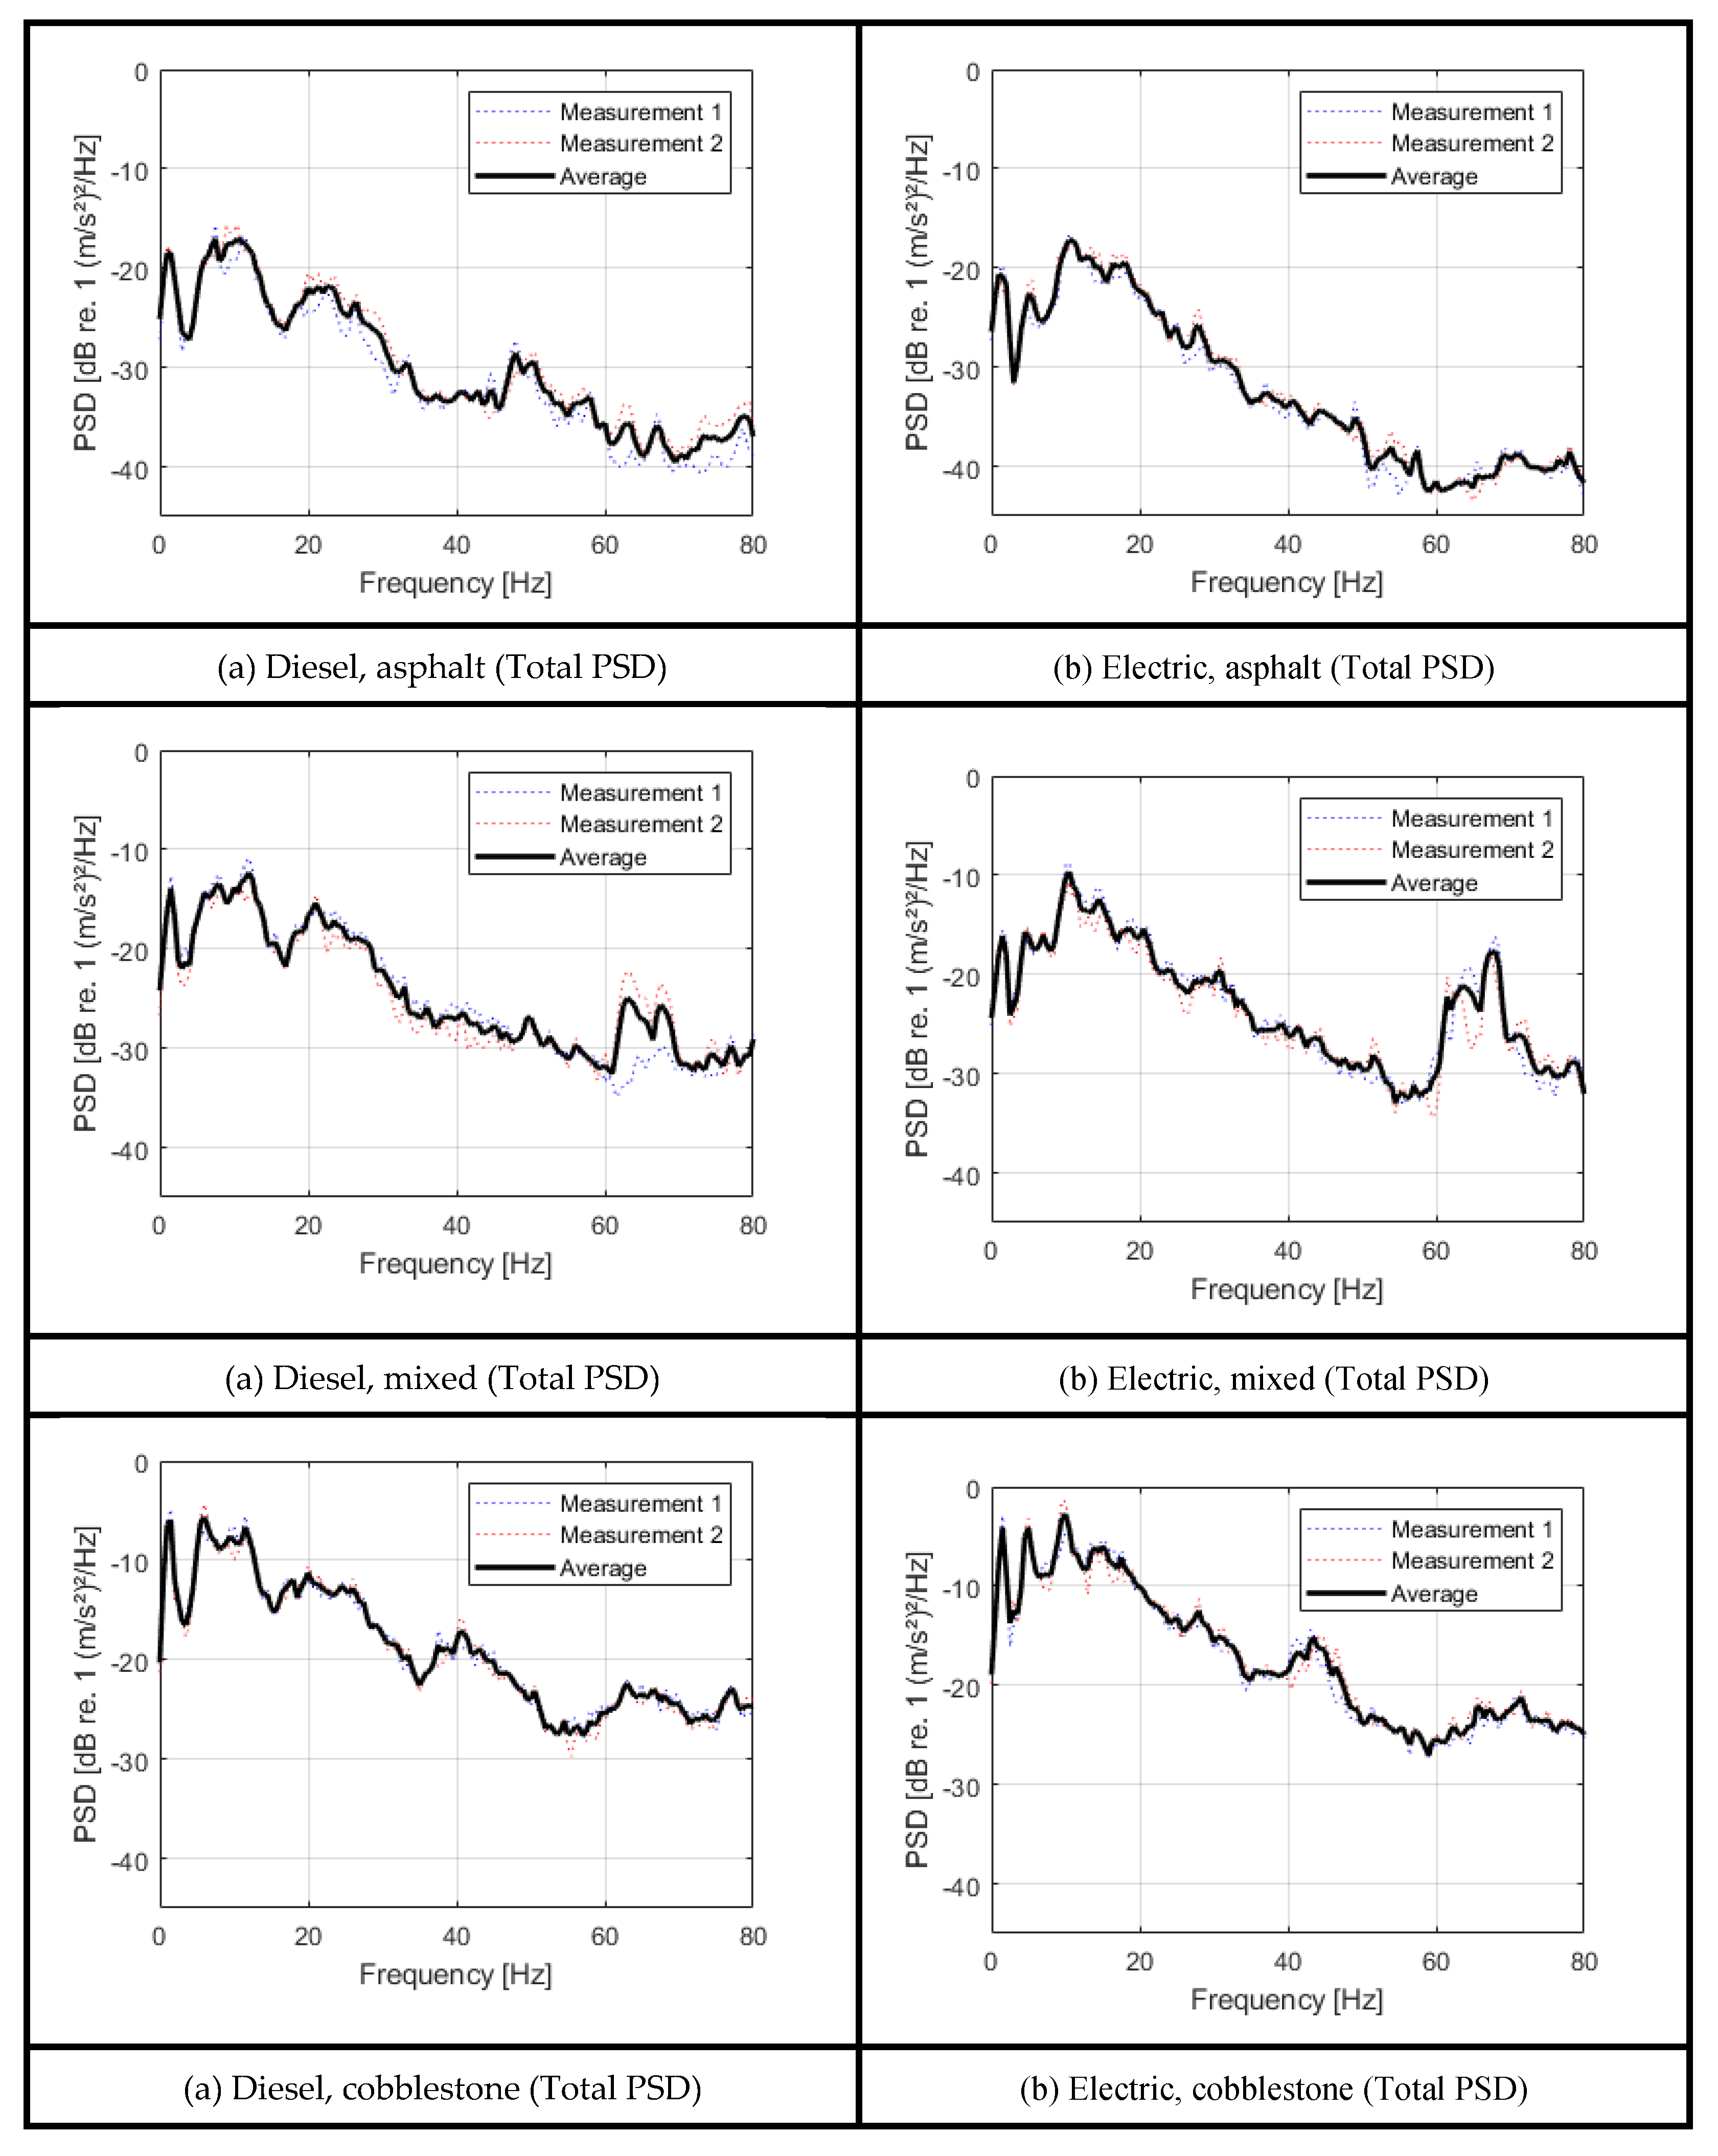
Figure 6.
Heatmap of Wk-weighted RMS aw (z-axis) by surface and seat.
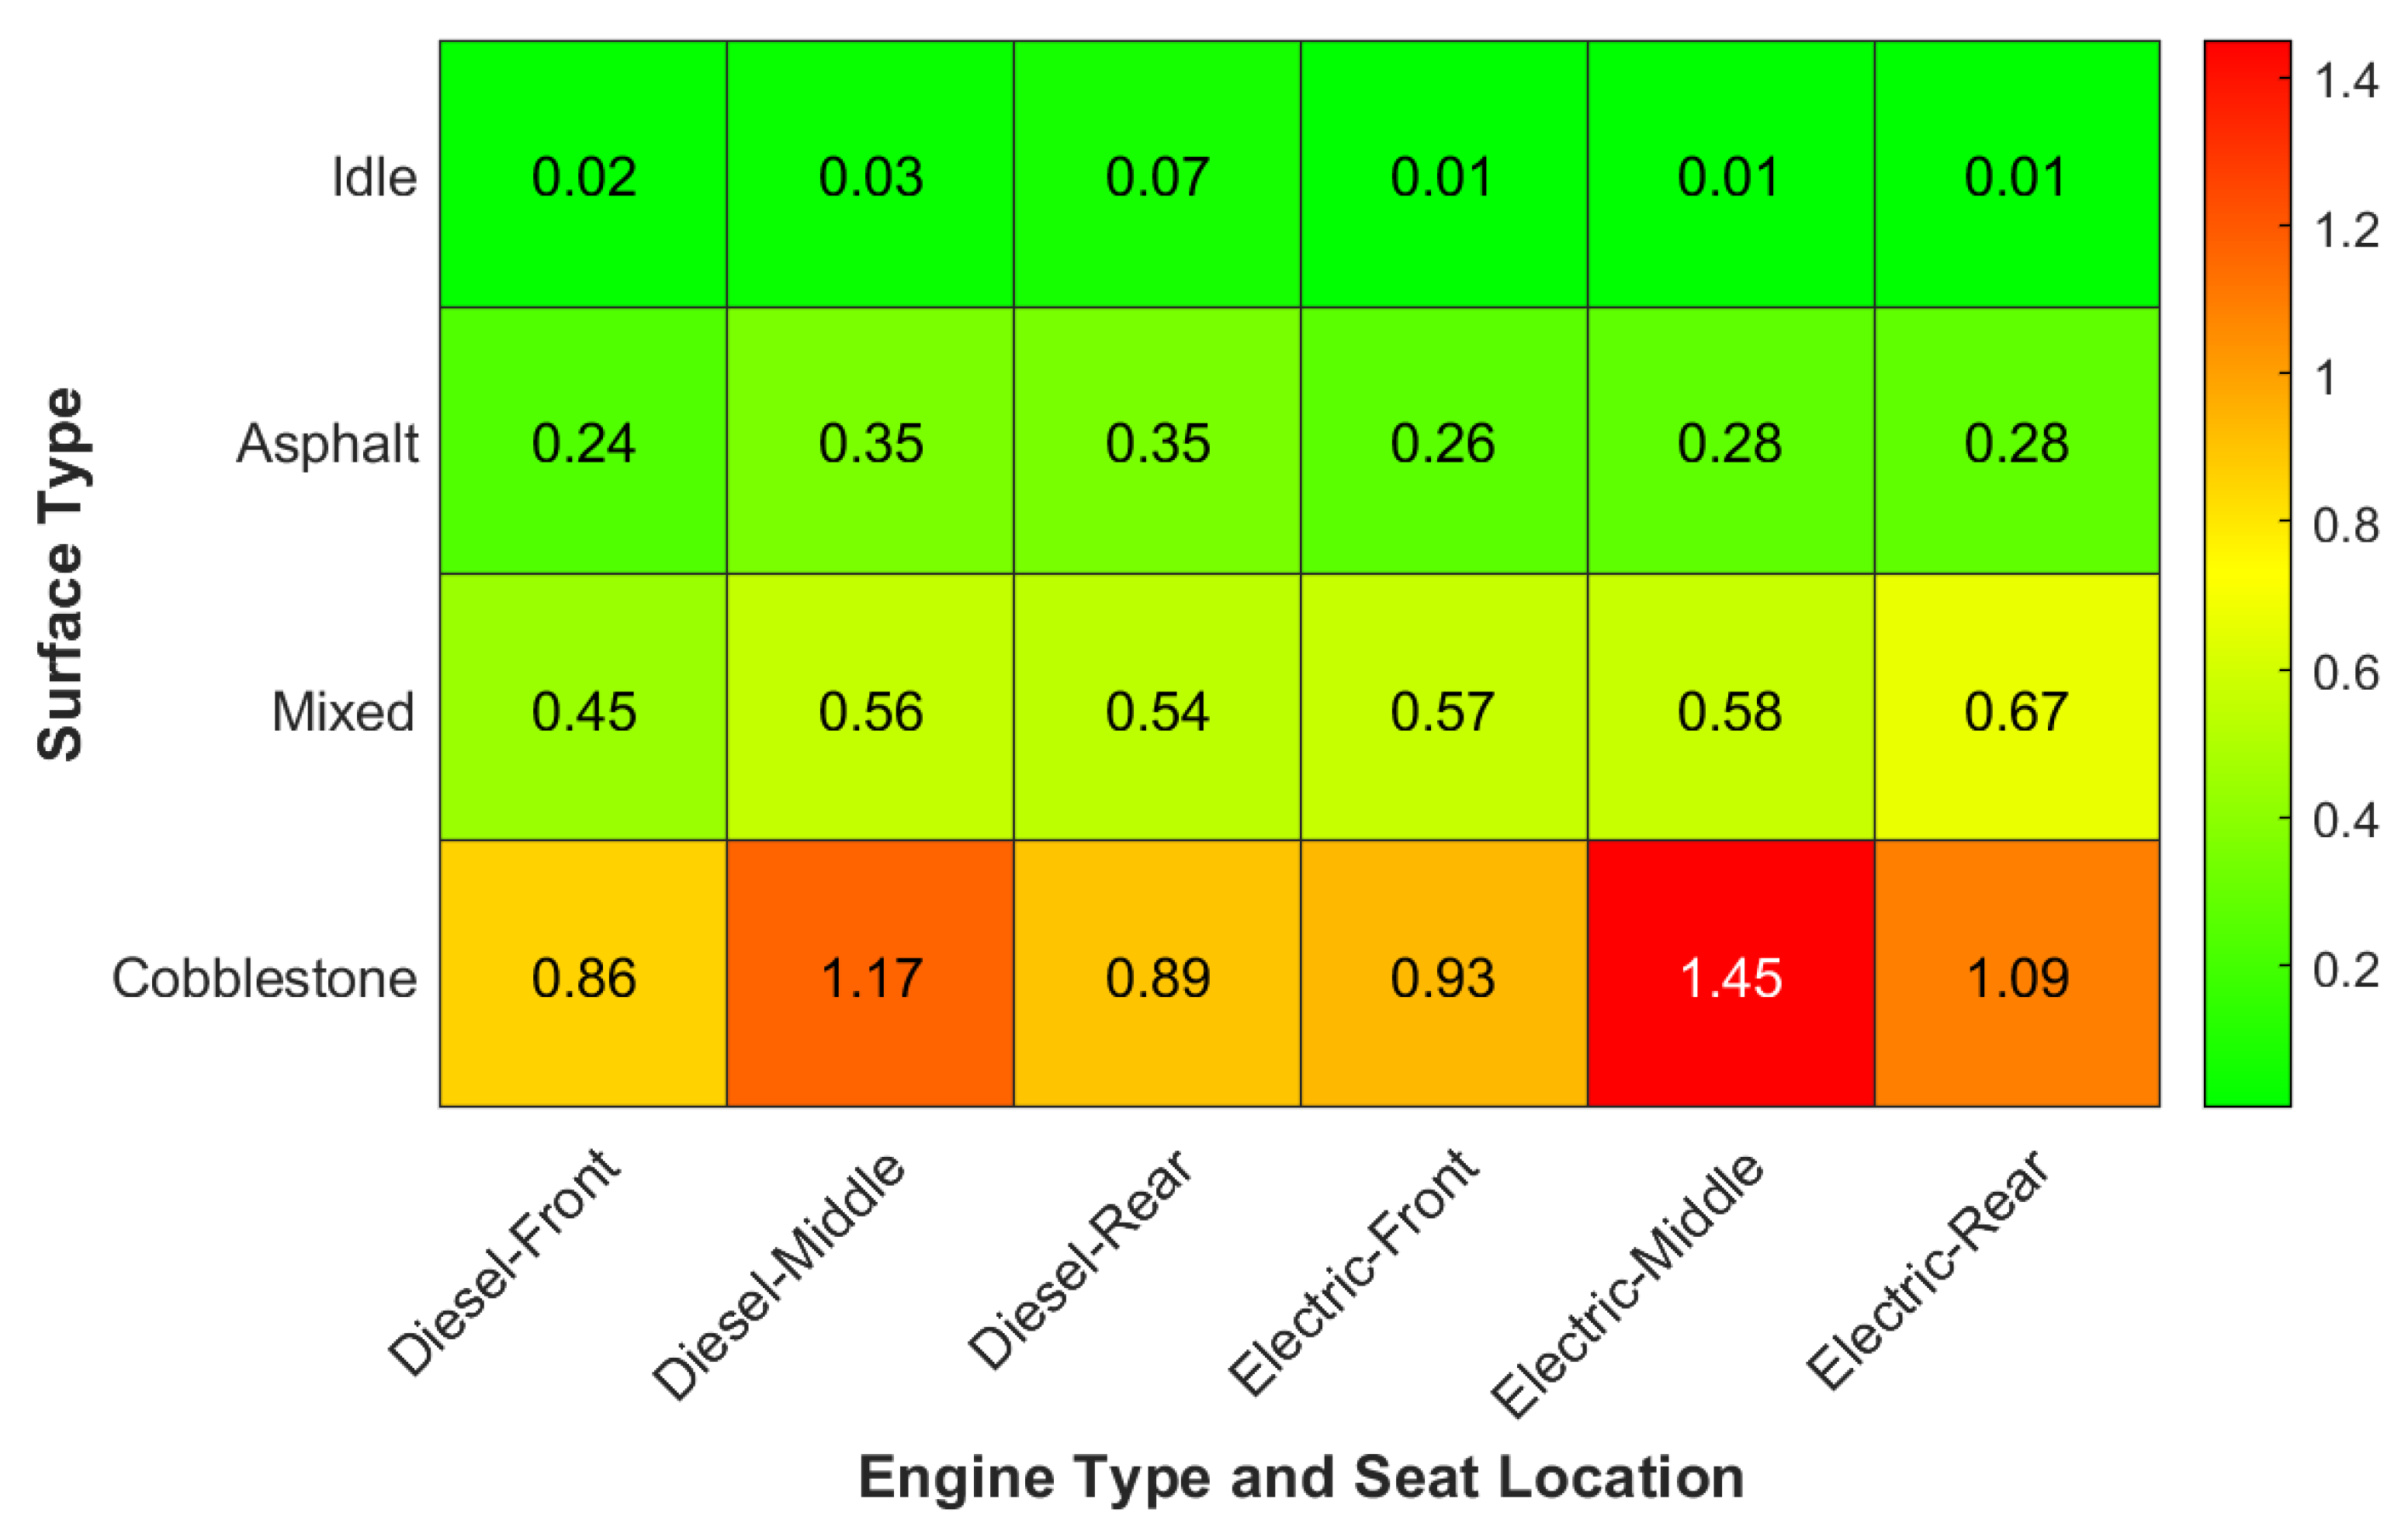
Table 2.
Parameters of the vibration sensor used. [19].
Table 2.
Parameters of the vibration sensor used. [19].
| Specification | Value |
| Model | 356B41 |
| Manufacturer | PCB Piezotronics |
| Type | Triaxial ICP® Accelerometer |
| Sensitivity (±10%) | 100 mV/g |
| Measurement Range | ±50 g |
| Frequency Range (±5%) | 0.5 to 1000 Hz |
| Resonant Frequency | =>27 kHz |
| Transverse Sensitivity | <=5% |
| Output | Voltage, single-ended |
| Weight | 272 grams |
| House Material | Hermetic |
Disclaimer/Publisher’s Note: The statements, opinions and data contained in all publications are solely those of the individual author(s) and contributor(s) and not of MDPI and/or the editor(s). MDPI and/or the editor(s) disclaim responsibility for any injury to people or property resulting from any ideas, methods, instructions or products referred to in the content. |
© 2025 by the authors. Licensee MDPI, Basel, Switzerland. This article is an open access article distributed under the terms and conditions of the Creative Commons Attribution (CC BY) license (http://creativecommons.org/licenses/by/4.0/).
Copyright: This open access article is published under a Creative Commons CC BY 4.0 license, which permit the free download, distribution, and reuse, provided that the author and preprint are cited in any reuse.


