Submitted:
29 October 2025
Posted:
29 October 2025
You are already at the latest version
Abstract
This study examines the relationships between land use, climate, and nature-based adaptation in coastal and island regions of South Korea, focusing on the counties of Muan and Shinan along the southwest coast. Using land use data (2014) and meteorological data (2001–2010), Pearson’s correlation analysis was applied to assess the associations between six land-use categories and eight climatic indicators, including temperature extremes, tropical nights, and precipitation patterns. Results show that built-up and agricultural areas are closely linked to higher maximum temperatures and more frequent heatwaves, indicating greater climatic vulnerability. Conversely, forests and grasslands demonstrate significant cooling effects, acting as natural buffers against rising temperatures. Wetlands and water bodies play dual roles in supporting initial hydrological heat mitigation but enhancing nocturnal heat retention during prolonged heatwaves. Bare lands exhibit high variability in temperature and rainfall, reflecting the destabilizing impact of land degradation. These findings underscore the importance of nature-based land management—such as forest expansion, wetland conservation, and vegetation restoration—for mitigating heat stress and enhancing climate resilience. The study calls for extending national climate adaptation policies beyond urban areas to support aging, and therefore vulnerable, coastal and island populations facing the intensifying effects of climate change.
Keywords:
climate change
; coastal and island regions
; ecosystem-based management
; heatwaves and tropical nights
; nature conservation
1. Introduction
Climate change not only causes rising temperatures and changes in precipitation patterns; it also drives structural shifts in land use and community systems. In coastal and island settings, sea-level rise, shoreline erosion, and more frequent storm surges bring about increasing threats to agricultural land and settlements [1,2]. They directly affect local livelihoods and, in turn, prompt a reconfiguration of land-use patterns [3,4]. For instance, agricultural productivity on reclaimed land may decline due to saline intrusion, while climate risks can make land unsuitable for tourism purposes. Islands also tend to have limited infrastructure and fewer economic sectors than the mainland, reducing their adaptive capacity or resilience; consequently, recovery from heatwaves, tropical nights, and typhoons often takes longer [5].
Conversely, land-use changes also contribute to climate change [6,7]. Expansion of impervious and industrial surfaces exacerbates local thermal environments [8], whereas declines in forests and grasslands diminish cooling and hydrologic regulation [9]. Furthermore, continued shrinkage of coastal ecosystems, such as tidal flats and wetlands, due to reclamation and landfilling counteracts the role these areas play as carbon sinks that support climate change mitigation. As such, land-use changes diminish not only the physical landscape but, through their effects on the climate, also ecosystem services and socio-economic resilience [10,11]. It warrants analyzing the links between land-use change and climate variability in island and coastal regions, as this will offer essential inputs needed for sustainable territorial management and for strengthening local resilience. Additional comparative analyses to examine the associated particularities of urban, inland, coastal, and island contexts would further provide a foundation for localized climate adaptation policies.
Republic of Korea, a peninsula with roughly 3,300 islands and a long coastline, has a maritime climate in its islands and coastal areas [12]. Historically, coastal and island regions experience milder winters and cooler summers than inland regions on the mainland [13,14], and these climatic conditions shape ecological patterns as well as fisheries, agriculture, tourism, and other human activities. Yet, these same regions are highly vulnerable to climatic changes. In particular, sea-level rise, coastal erosion, and rapid shoreline change significantly affect communities whose livelihoods depend on islands and coasts [15,16]. In recent decades, Korean summers have lengthened, and both heatwaves and tropical-night events have intensified and expanded geographically [17].
The relative incidence of tropical nights—nights during which minimum temperatures more than 25℃ in Korea—is closely linked to land use. In urbanized areas, solar energy absorbed by impervious surfaces during the day is released at night, elevating nighttime temperatures and disturbing residents’ sleep cycles [18,19,20]. Megacities such as Seoul have become places where tropical-night conditions occur for increasing lengths of time with the result that policies have been put in place to mitigate health impacts (e.g., night-time shelters for seniors and other vulnerable groups, and urban-forest programs). Tropical nights are also emerging in coastal and island regions [21,22,23]. Unlike urban areas, where the nighttime heat tends to ease shortly before dawn, island and coastal regions often exhibit persistently high pre-dawn temperatures due to maritime influences [24,25]. Furthermore, with the exception of large coastal cities such as Busan, many island and shoreline communities in Korea have high shares of elderly residents, who are most vulnerable when it comes to coping with tropical nights. Sadly, because historically the perception is that coastal summers are cooler than inland summers, and because it concerns more sparsely populated areas, policy measures to alleviate tropical-night impacts are often not implemented or not prioritized in a timely fashion.
Land use is one of the key aspects that can either exacerbate or alleviate tropical-night and heatwave risks, and robust comparisons must identify urban–rural and inland–coastal differences [26]. However, Korea still lacks sufficient studies that give insights into fine-scale land-use characteristics in island and coastal contexts [27]. This study therefore investigates the relationships between current climatic conditions and land use in island and coastal regions of Korea. As a case study, we focus empirically on Muan County (a peninsula-type coastal lowland) and Shinan County (a multi-island archipelago) along the southwest coast to clarify land–climate interactions and to derive implications for land management and localized adaptation strategies that prioritize the elderly and other vulnerable groups.
2. Study Areas
The counties of Muan and Shinan are jurisdictions along the western shoreline of Jeollanam-do province in southwestern Korea (Figure 1). Although being geographically adjacent, the two areas differ in topographic and ecological characteristics. To start with the latter, Shinan is an island-only county consisting of around one thousand islands—the largest archipelago in the nation—with more than 65% of its area comprised of coastlines and tidal flats. Shinan’s extensive tidal flats were inscribed on the UNESCO World Heritage List in 2021 as part of the ‘Getbol, Korean Tidal Flats’. Also, the UNESCO Shinan-Dadohae Biosphere Reserve and the Dadohaehaesang National Park include some parts of the Shinan tidal flats. The strong tidal ranges and direct exposure to sea-level rise make the tidal flats an emblematic marine environment. Fisheries, aquaculture, agriculture, and nature-based tourism dominate the local economy [28], and spatial conflicts have recently emerged due to offshore wind-energy development initiatives. Table 1 briefly describes the two regions.
Muan, situated at the western end of a peninsula, is a county on the mainland coast. Its landscape transitions from inland low hills and plains toward the Yellow Sea. Much of Muan comprises low-lying agricultural land and alluvial plains, with broad tidal flats along its western coast. Especially in the areas named Tando, Mangun, and Hyeongyeong, large stretches of flat alluvium formed by tidal inundation have been reclaimed for agriculture from the 1960s onward. The Muan tidal flats are designated as a Wetland Protected Area (2008) and constitute critical habitat for coastal biodiversity and migratory birds [29].
Climatically, both counties exhibit temperate maritime influences. Muan being part of the mainland yields a slightly larger daytime temperature range, whereas the archipelagic setting of Shinan gives moderated conditions due to the surrounding sea. Economically, Muan is more agriculture-oriented, while Shinan combines fisheries and aquaculture with farming [30]. Both are highly aged societies, especially Shinan, where more than 40% of residents are aged 65 or older.
Given the existing contrasts in terrain, land use, ecological function, industrial structure, and demographics, comparing Muan and Shinan provides an informative lens on land–climate interactions in coastal and island systems. Muan represents a peninsula-type coastal plain closely integrated with inland land-use dynamics, whereas Shinan—directly exposed to marine forces—more sensitively reflects the impacts of climate change.
3. Materials and Methods
3.1. Land Use and Climate Data
Land use provides an intuitive indicator of interactions between the natural environment and human activities [31], particularly in island and coastal settings where climatic factors, historical use, socio-economic structures, and cultural adaptation all converge [32,33]. We used the Ministry of Environment land-use map (1:25,000; reference year 2014). The original land-use dataset was reclassified into six categories—Built-up Area; Agricultural Area; Wetland; Bare Land; Forest & Grassland; and Water Surface—tailored to this study. Area was calculated by polygon in ArcGIS Pro, and proportional shares (%) by eup/myeon(town) administrative units were used for statistical analysis

Table 2.
Land use classification used in this study.
| Sub-category | Category |
| Residential area | Build-up Area |
| Business area | |
| Transportation area | |
| Institutional area | |
| Industrial area | |
| Recreational area | |
| Paddy fields | Agricultural Area |
| Upland fields | |
| Greenhouse cultivation area | |
| Other cultivation area | |
| Orchard | |
| Tidal flats | Wetland |
| Inland wetland | |
| Natural bare land | Bare Land |
| Artificial bare land | |
| Coniferous forest | Forest and Grassland |
| Deciduous forest | |
| Mixed forest | |
| Natural grassland | |
| Artificial grassland | |
| Inland water | Water Surface |
| Marine water |
Table 3.
Climatic data from the Korea Meteorological Administration.
| Administrative districts |
Daily Mean Temperature (℃) |
Daily Maximum Temperature (℃) |
Daily Minimum Temperature (℃) |
Tropical Night Days |
Heat-wave Days |
Annual Precipita-tion (mm) |
Precipita-tion Intensity | Heavy Rain Days |
| Muaneup | 13.6 | 18.6 | 9.3 | 7.7 | 10.9 | 1312.3 | 15.2 | 1.7 |
| Samhyang | 13.9 | 18.6 | 9.9 | 9.3 | 7.8 | 1253.0 | 13.8 | 1.5 |
| Illo | 13.9 | 18.9 | 9.6 | 9.0 | 10.8 | 1251.7 | 14.4 | 1.6 |
| Mongtan | 13.6 | 18.7 | 9.2 | 6.4 | 10.5 | 1348.8 | 15.0 | 1.7 |
| Unnam | 14.3 | 18.6 | 10.6 | 14.2 | 10.2 | 1138.7 | 14.8 | 1.3 |
| Cheonggye | 13.8 | 18.5 | 9.9 | 8.7 | 8.2 | 1240.4 | 14.4 | 1.4 |
| Haeje | 14.1 | 18.5 | 10.4 | 12.3 | 8.7 | 1162.5 | 14.1 | 1.1 |
| Hyeongyeong | 13.9 | 18.6 | 9.9 | 10.1 | 9.4 | 1242.3 | 14.4 | 1.3 |
| Mangun | 14.1 | 18.6 | 10.3 | 12.2 | 9.2 | 1197.9 | 14.7 | 1.2 |
| Jido | 14.3 | 18.3 | 10.9 | 14.0 | 7.1 | 1191.4 | 14.7 | 1.2 |
| Aphae | 14.2 | 18.5 | 10.7 | 11.5 | 7.7 | 1129.1 | 14.6 | 1.2 |
| Jeungdo | 14.4 | 18.4 | 11.0 | 15.1 | 7.0 | 1169.8 | 14.5 | 1.2 |
| Imja | 14.6 | 18.4 | 11.4 | 16.7 | 7.7 | 1173.5 | 14.7 | 1.3 |
| Jaeun | 14.3 | 18.1 | 10.8 | 13.7 | 6.5 | 1195.7 | 15.1 | 2.0 |
| Bigeum | 14.4 | 18.3 | 11.1 | 12.0 | 7.3 | 1134.7 | 14.8 | 1.7 |
| Docho | 14.3 | 18.1 | 11.0 | 10.6 | 6.3 | 1121.8 | 14.7 | 1.6 |
| Heuksan | 13.8 | 16.6 | 11.5 | 5.5 | 0.1 | 1077.5 | 14.1 | 1.6 |
| Haui | 14.3 | 18.1 | 10.8 | 7.8 | 5.1 | 1117.7 | 14.8 | 1.5 |
| Shinui | 14.2 | 18.2 | 10.7 | 7.1 | 5.0 | 1143 | 14.5 | 1.5 |
| Jangsan | 14.3 | 18.3 | 10.8 | 8.3 | 5.9 | 1129.8 | 14.4 | 1.5 |
| Anjwa | 14.2 | 18.3 | 10.8 | 11.2 | 8.4 | 1141.6 | 14.7 | 1.7 |
| Palgeum | 14.3 | 18.3 | 10.8 | 11.6 | 7.9 | 1129.3 | 14.7 | 1.7 |
| Amtae | 14.2 | 18.1 | 10.7 | 11.6 | 6.2 | 1170.1 | 14.6 | 1.6 |
For climatic data, we used the Korea Meteorological Administration’s (KMA) fine-scale dataset developed to support basic-level local governments in preparing detailed climate adaptation plans under the national Low-Carbon Green Growth Act (2015). Because routine observations are not available at the scale of eup/myeon, we averaged observations from 1 ASOS (Automated Synoptic Observing System) and 11 AWS (Automatic Weather System) stations for Shinan and from 4 AWS stations for Muan, then interpolated values to eup/myeon units using inverse distance weighting (IDW). The eight variables used were Daily mean temperature; Maximum temperature; Minimum temperature; Number of tropical-night days; Number of heatwave days; Annual precipitation; Precipitation intensity; and Number of heavy-rain days
3.2. Analysis
To examine land–climate interactions, we calculated Pearson correlation coefficients (r) between the proportional area of each land-use category (by eup/myeon) and the 10-year mean meteorological variables using IBM SPSS Statistics 26. Significance thresholds were set at p < 0.05 and p < 0.01.
4. Results and Discussion
4.1. Land Use
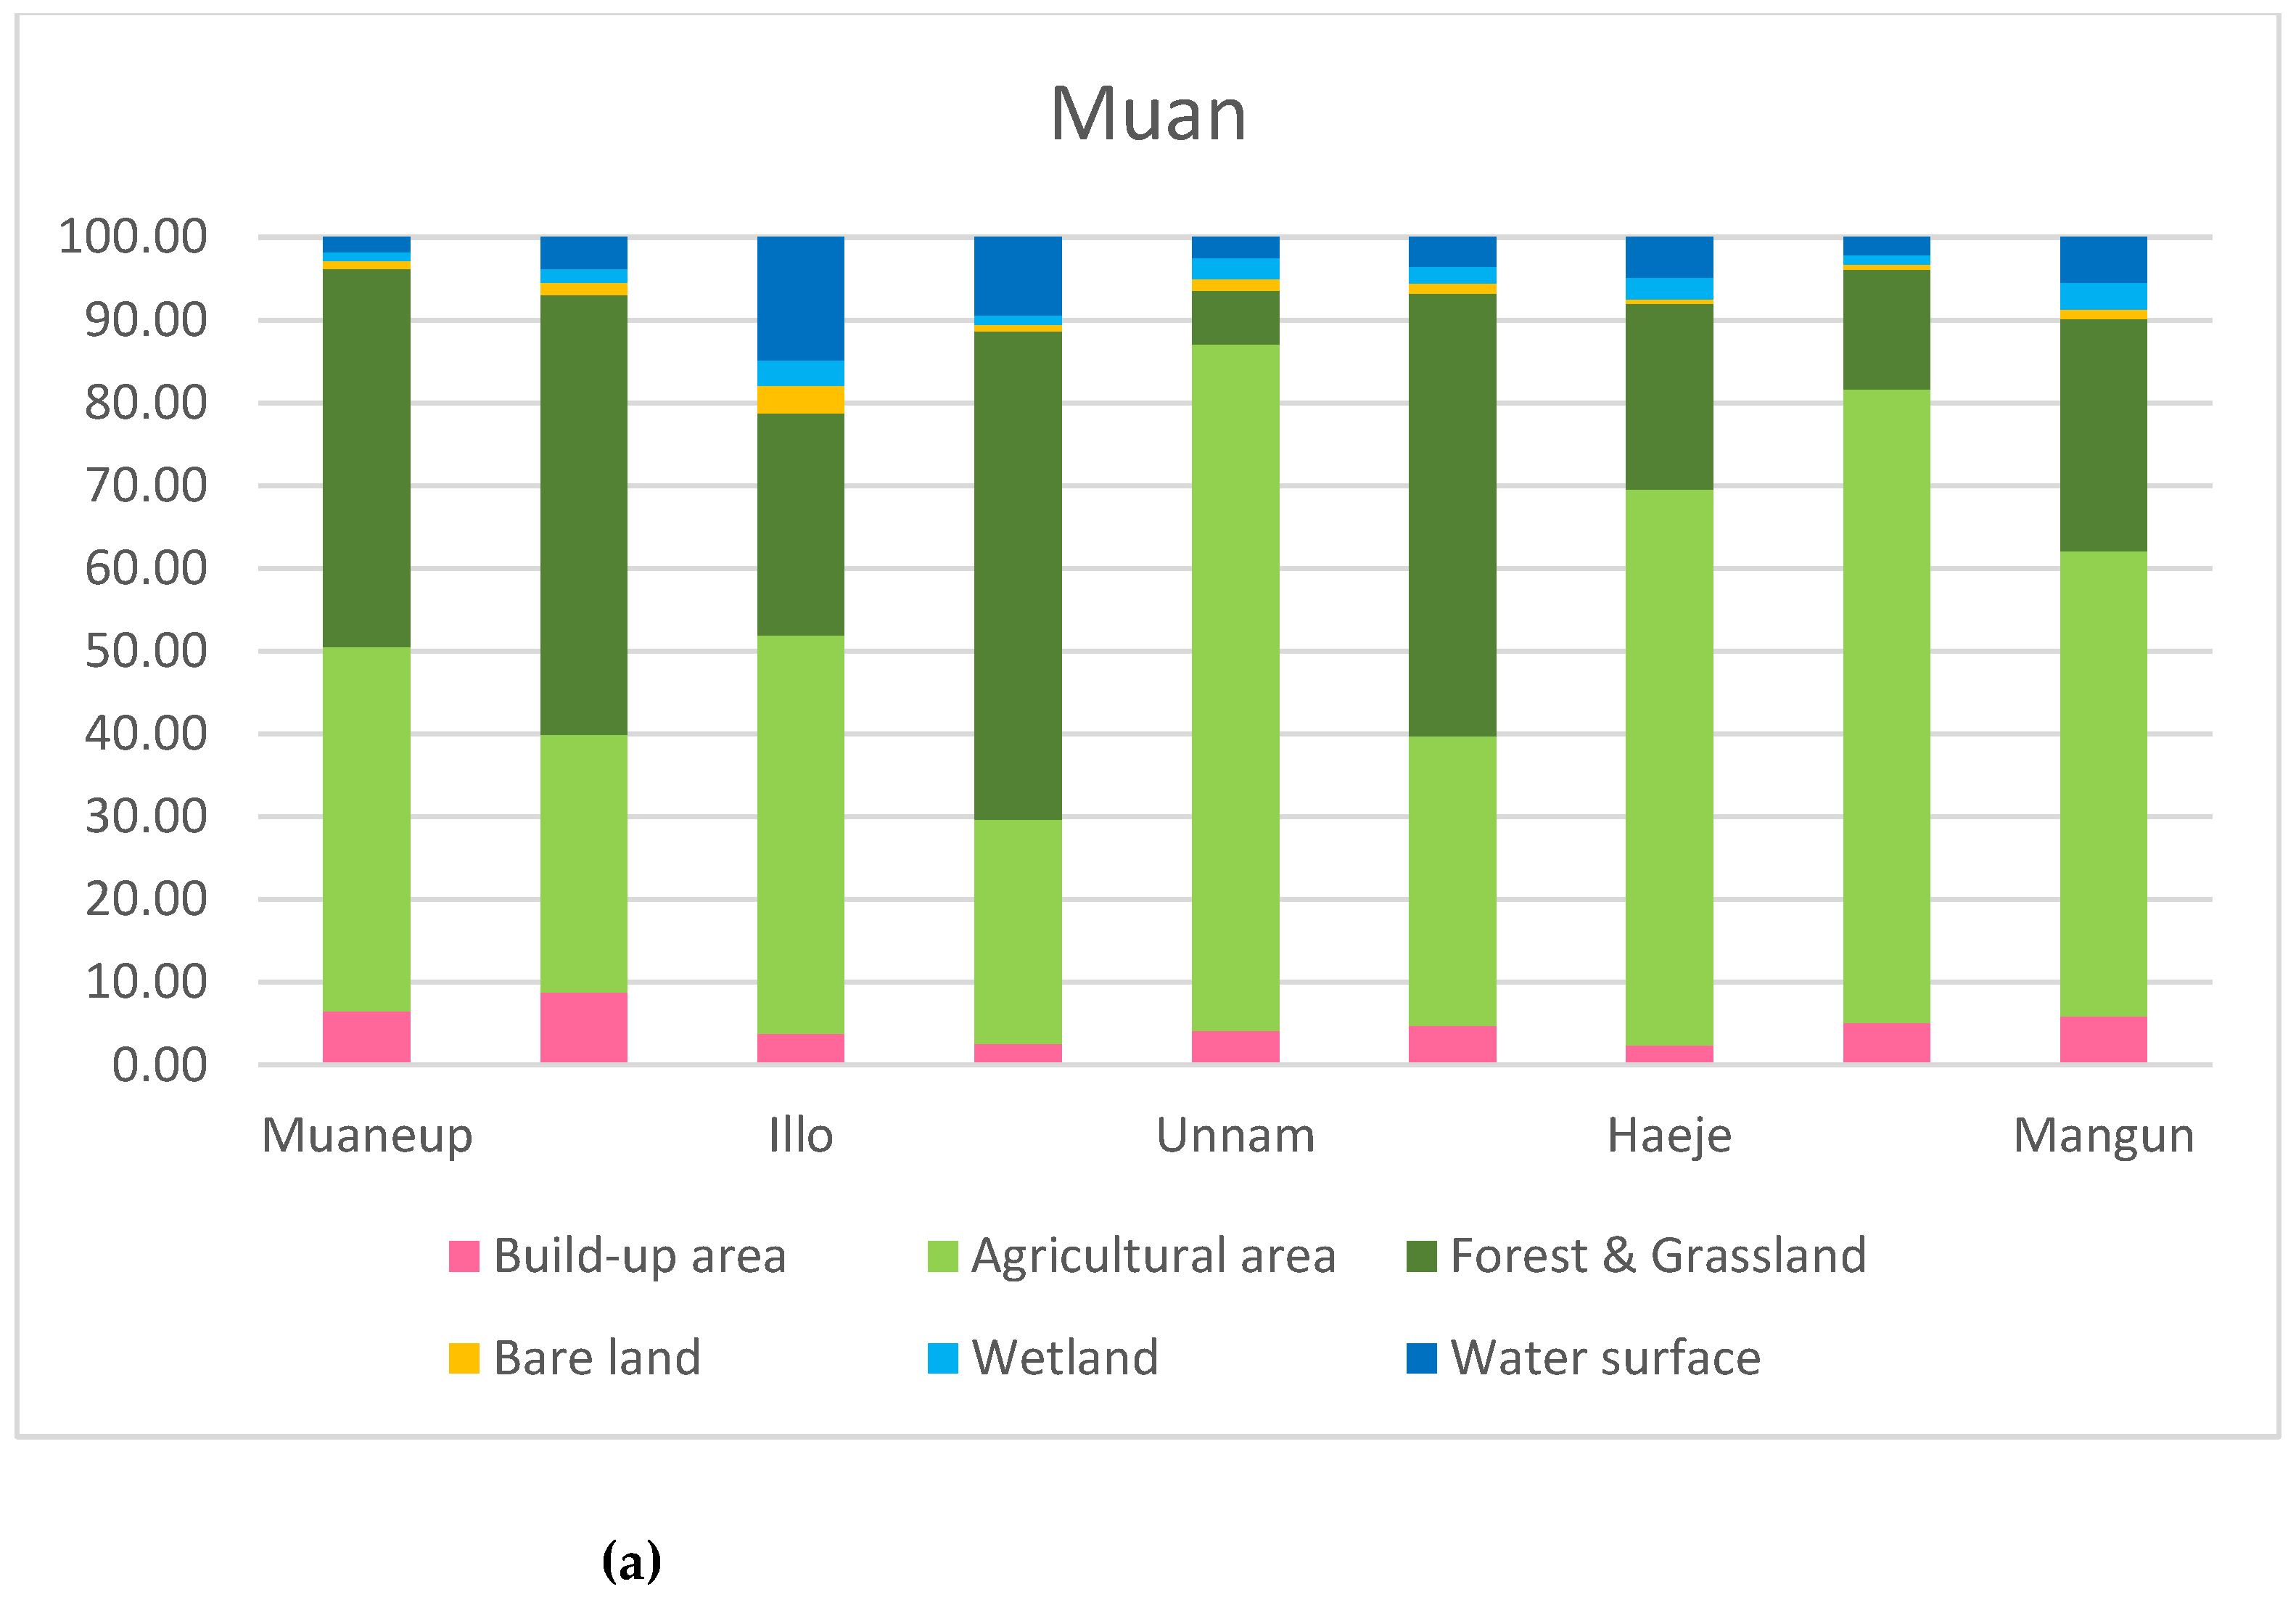
Figure 1 show the land use map of two regions. In Muan, agriculture and forest/grassland dominate. Unnam shows the highest agricultural share (82.95%), followed by Hyeongyeong (76.51%) and Haeje (67.19%). These coastal-plain areas have long histories of reclamation, converting wetland into agricultural land,and are characterized by a greater proportion of dry fields than paddy fields. By contrast, lower agricultural shares are found in Mongtan (59.03%), Cheonggye (53.45%), and Samhyang (53.20%), which include extensive forest and grassland across gently rolling inland hills. Nevertheless, the agricultural shares are still considerable and they highlight Muan’s agriculture-centered economy (Figure 2).
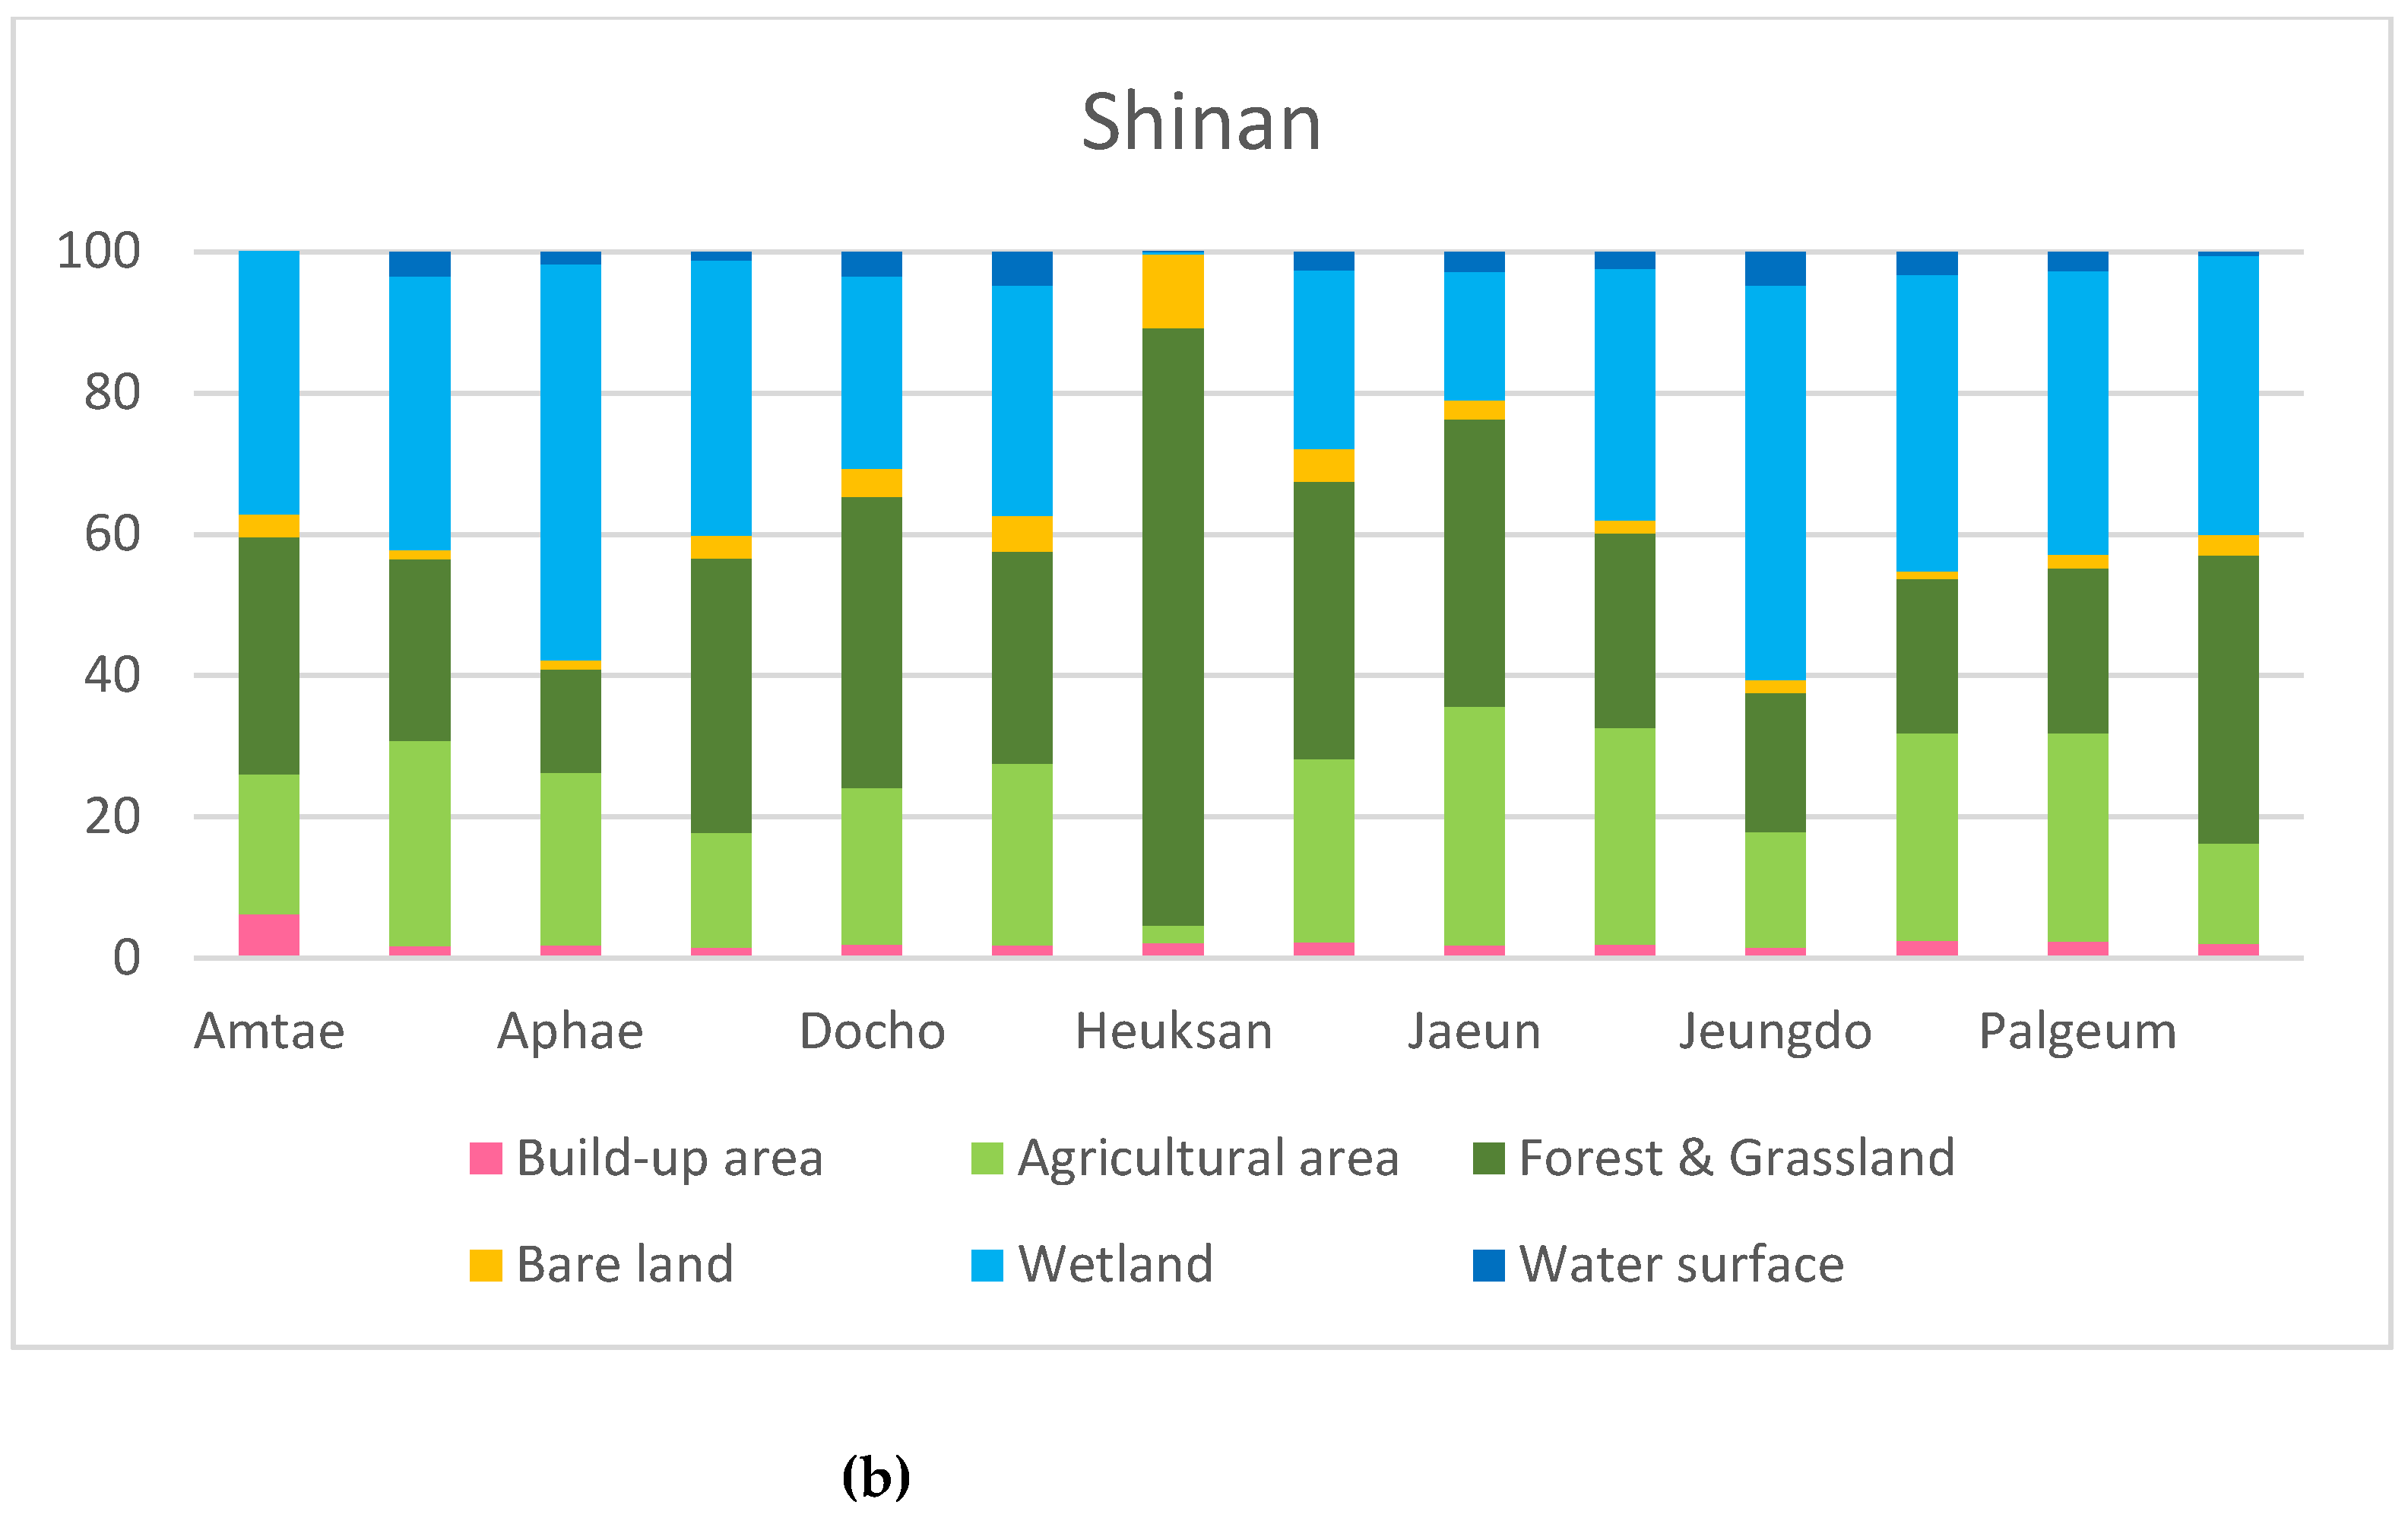
In Shinan, the dominant land uses are forest/grassland and wetland (tidal flat). Inner-archipelago islands (e.g., Aphae, Palgeum, Jaeun) combine agriculture with extensive tidal flats, whereas the outer islands (e.g., Heuksan) feature larger forested areas and have a stronger orientation on fisheries. Large-scale reclamation since the 1960s has converted portions of tidal flats into agricultural land, producing a mixed agri-fishery structure [34]. In comparison, Muan represents a peninsula-type agricultural coastal plain, while Shinan typifies a multi-island, mixed economy of farming and fishing.
Figure 2.
Land use map of study areas.
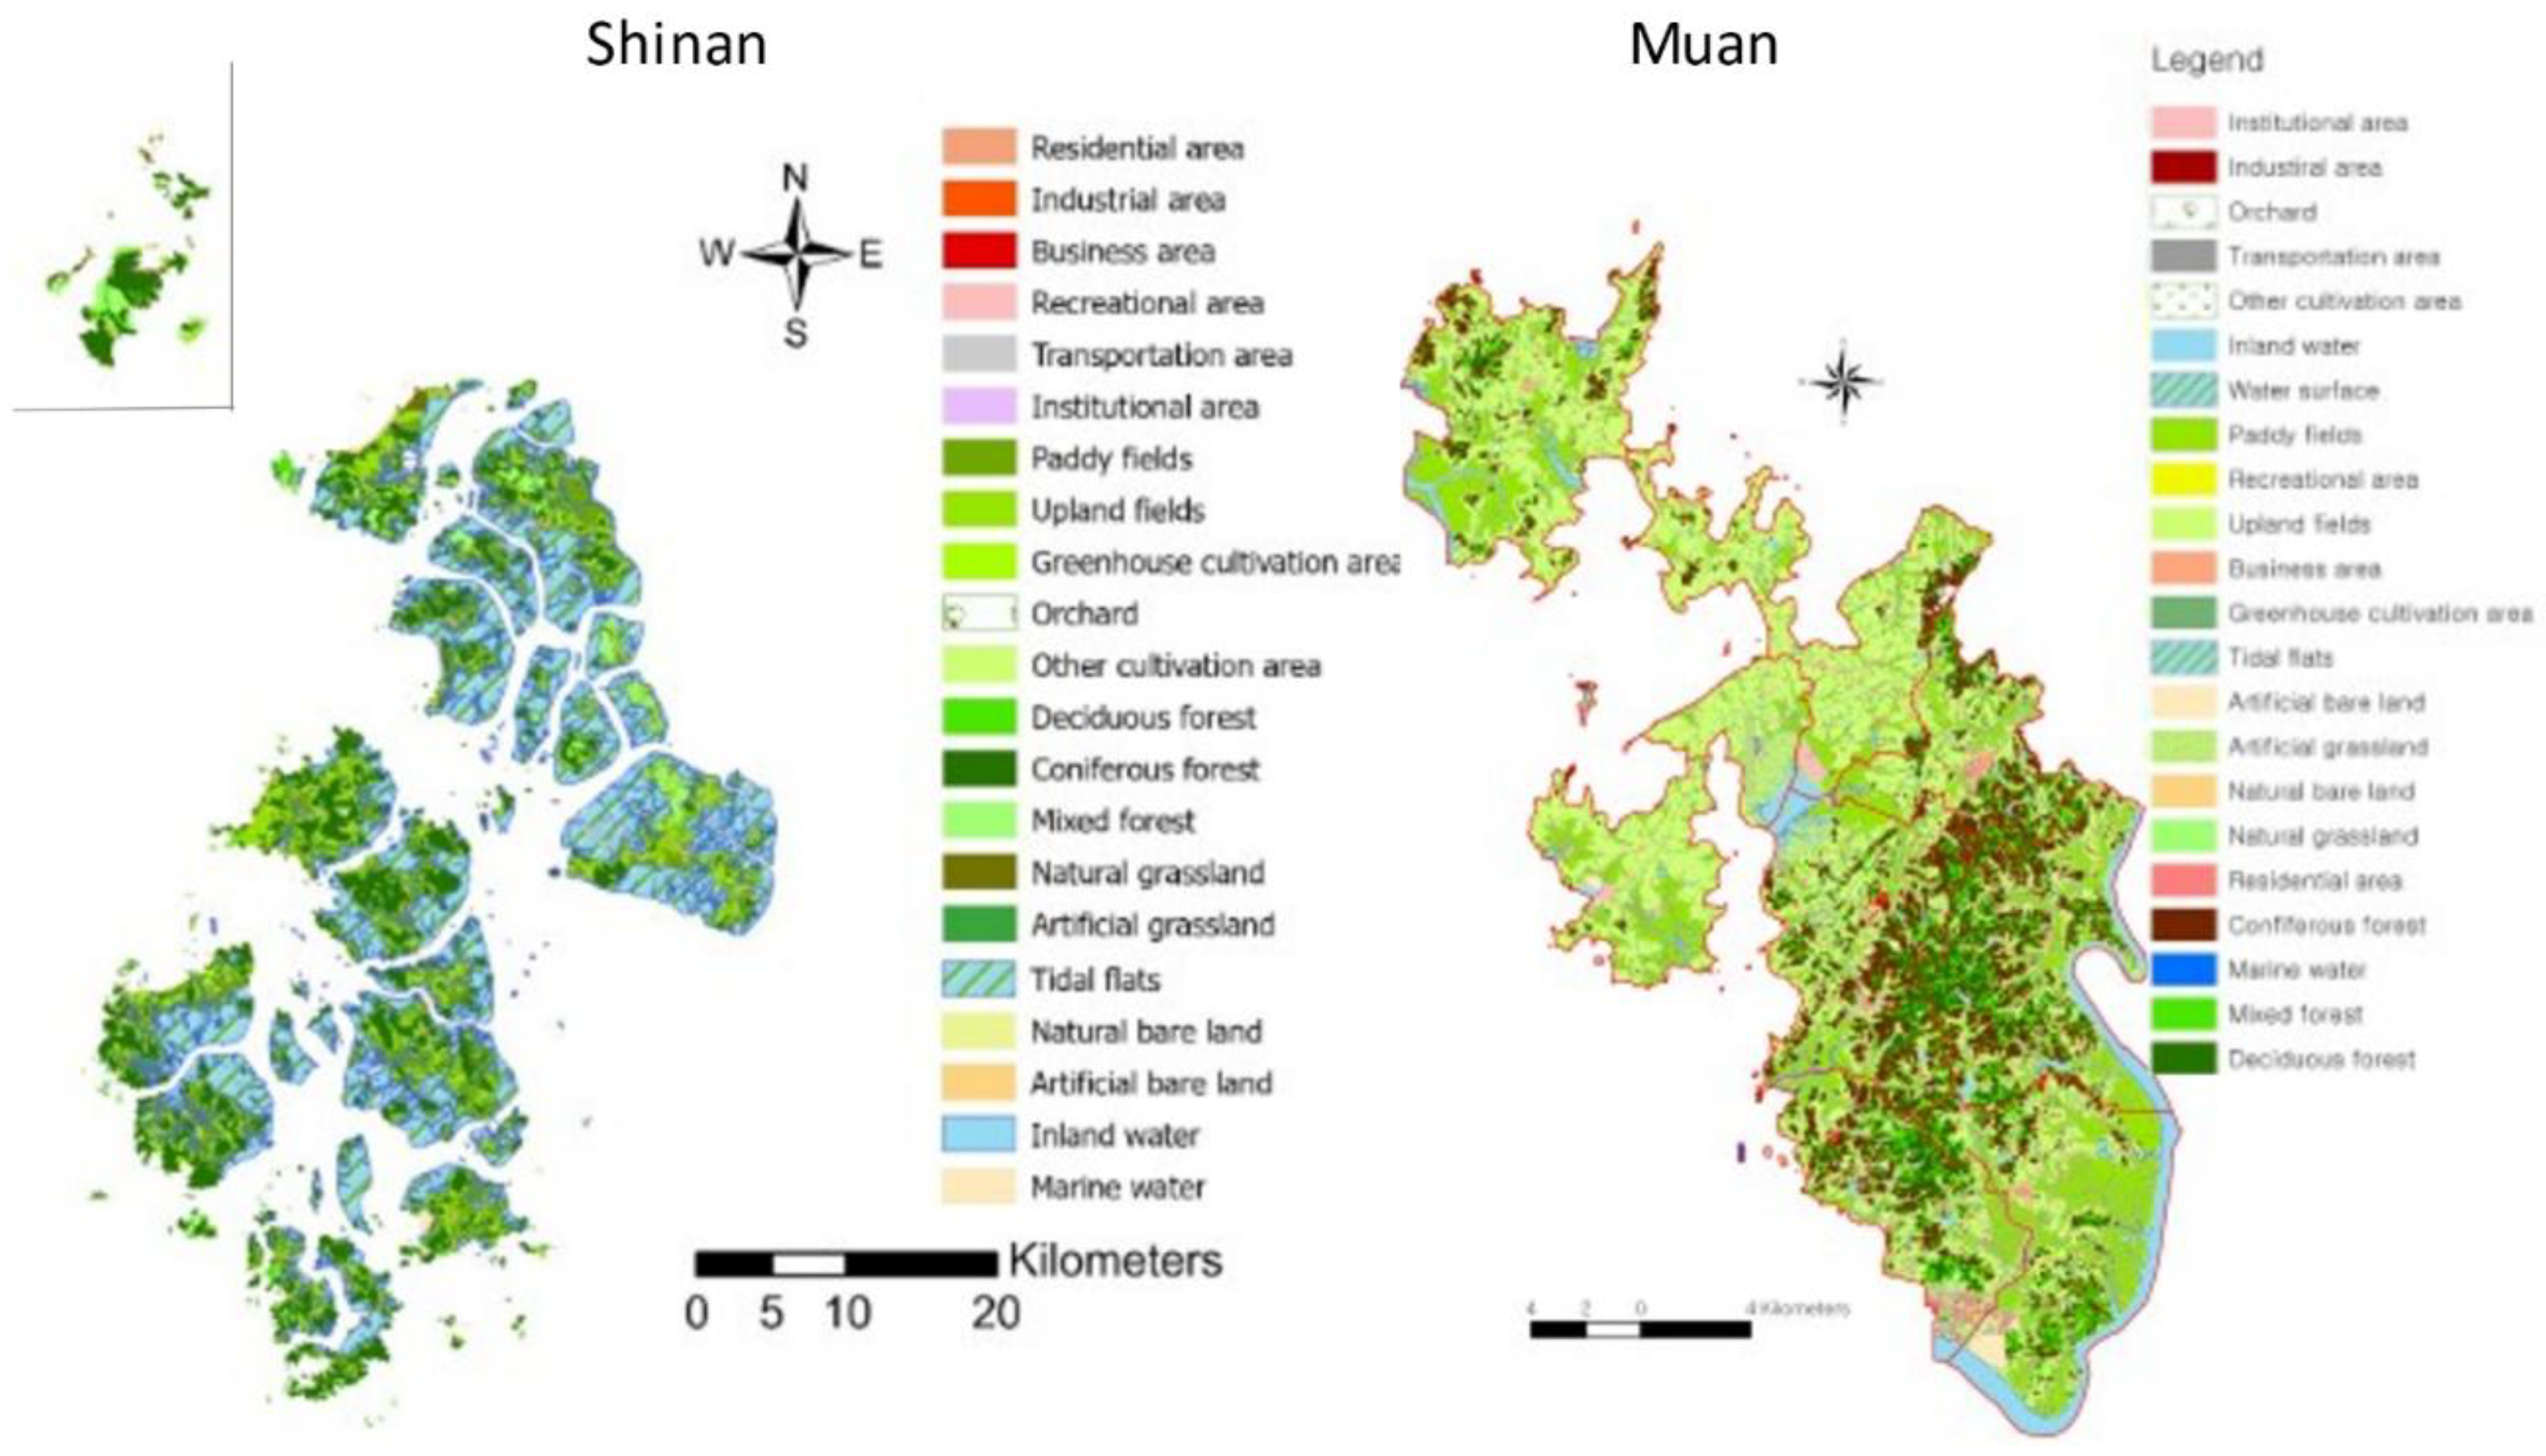
Figure 3.
Area ratio by land use in the survey area. (a) Muan; (b) Shinan.
4.2. Correlations Between Land Use and Climate
Pearson correlations reveal distinct thermal and hydrologic signatures by land-use type (Table 4). Built-up areas correlate negatively with daily minimum temperature (r = −0.511, p < 0.05), pointing to the presence of the urban heat-island phenomenon. They also correlate positively with annual precipitation (r = 0.468, p < 0.05), which suggests they bring about conditions that stimulate atmospheric processes leading to precipitation. Agricultural areas show strong positive correlations with daily maximum temperature (r = 0.557, p < 0.01) and the number of heatwave days (r = 0.687, p < 0.01), and a negative correlation with daily minimum temperature (r = −0.497, p < 0.05), which altogether reveals a vulnerability to extreme heat.
Wetlands correlate positively with daily mean temperature (r = 0.686, p < 0.01), daily minimum temperature (r = 0.583, p < 0.01), which calls to mind their heat-storage capability that stabilizes nighttime temperatures. Wetlands also show a negative correlation with annual precipitation (r = −0.525, p < 0.05). Bare land exhibits very strong positive correlations with daily maximum temperature (r = 0.880, p < 0.01), daily minimum temperature (r = −0.668, p < 0.01) and the number of heatwave days (r = 0.834, p < 0.01), while showing a negative correlation with annual precipitation (r = −0.606, p < 0.01). This reflects rapid daytime heating, slow nighttime cooling, and thermal instability typical of vegetation-poor surfaces.
Forests and grasslands show significant negative correlations with daily mean temperature (r = −0.443, p < 0.05), daily maximum temperature (r = −0.592, p < 0.01), the number of tropical-night days (r = −0.603, p < 0.01), and the number of heatwave days (r = −0.528, p < 0.01), altogether indicating clear cooling effects. In addition, forests and grasslands correlate positively with heavy-rain days (r = 0.490, p < 0.05), suggesting they contribute to local hydrologic cycling. Water surfaces correlate positively with maximum temperature (r = 0.513, p < 0.05), the number of heatwave days (r = 0.531, p < 0.01), and annual precipitation (r = 0.438, p < 0.05), capturing both thermal-capacity effects and the potential persistence of tropical nights. In addition, they revealed a negative correlation with the daily minimum temperature (r = −0.474, p < 0.05). This indicates that if the temperature regulation effect of the water surface exceeds a certain level, it may lead to an increase in temperature.
5. Conclusion and Policy Implications
This study has analyzed the correlations between land-use types and key climatic variables in two representatives coastal–island jurisdictions in southwestern Korea. Land use directly shapes local microclimates and is closely linked to heatwave and tropical-night dynamics. Built-up areas exhibited the classic signature of urban heat islands, while agricultural areas showed they are highly susceptible to extreme heat. Forests and grasslands demonstrated cooling effects that mitigate both heatwaves and tropical nights. Wetlands and water surfaces related to precipitation patterns and hydrometeorological regulation although, during prolonged heatwaves, they may reinforce nighttime heat retention.
These findings support the need for a land-use-based climate adaptation framework in coastal and island regions. In areas with high shares of agricultural land and bare land—such as Unnam, Hyeongyeong, and Haeje in Muan—community cooling strategies should prioritize village-forest restoration and green-infrastructure expansion such as village forest in rural areas [35]. More broadly, national adaptation policies, which have largely focused on cities, should explicitly target island and coastal communities as these typically have higher proportions of elderly [36,37]. Building ‘climate-cooling infrastructure’ that leverages sea breezes, water bodies, and green corridors—adapted from urban interventions such as greenway connectivity and night-time cooling shelters—can reduce nighttime heat exposure and health risks for those more vulnerable populations [38,39]. Given the dual roles of wetlands and water surfaces, high-resolution satellite monitoring and microclimate networks are needed to disentangle storage versus mitigation effects across seasons and heatwave durations.
Because increases in bare land intensify thermal instability and alter local precipitation, rapid vegetation restoration and ecological sheltering are urgent [40,41,42]. Finally, adaptation must extend beyond physical measures so as to embrace community-based ecological recovery [43]. Long-standing traditional ecological knowledge (TEK) of coexisting with the sea, tidal flats, and agricultural landscapes in Muan and Shinan should inform policy choices and decisions, enabling a sustainable, island-based biocultural adaptation model [44,45,46].
6. Limitations and Future Work
The climatic (2001–2010) and land-use (2014) datasets used in the study were not time-synchronized, which may have introduced minor inaccuracies, although the general regional climate patterns are stable. Furthermore, the analyses were conducted at the eup/myeon scale relying on averaged values. This limitation could easily be overcome if the central government would measure meteorological data at a finer scale (i.e., a town scale) more frequently and make it available to local governments so as to provide information that can help them prepare for climate change. While correlations effectively identify statistical associations, causal structures among land use, temperature, and precipitation were not explicitly modeled. Integrating spatial regression and machine-learning approaches would improve predictive capacity. In conclusion, conducting future research to analyze coastal and island regions in other areas at a similar latitude would also yield broader insights to support formulating and tuning adaptation planning efforts.
7. Patents
This section is not mandatory but may be added if there are patents resulting from the work reported in this manuscript.
Author Contributions
Conceptualization, J.-E. K. and S.-K. H.; methodology, J.-E. K.; software, J.-E. K.; validation, J.-E. K. and S.-K. H.; formal analysis, J.-E. K.; investigation, J.-E. K.; resources, J.-E. K.; data curation, J.-E. K.; writing—original draft preparation, J.-E. K.; writing—review and editing, J.-E. K. and S.-K. H; All authors have read and agreed to the published version of the manuscript.
Funding
This Research was supported by the Research Fund of Mokpo National University in 2023.
Institutional Review Board Statement
Not applicable.
Informed Consent Statement
Not applicable.
Data Availability Statement
We encourage all authors of articles published in MDPI journals to share their research data. In this section, please provide details regarding where data supporting reported results can be found, including links to publicly archived datasets analyzed or generated during the study. Where no new data were created, or where data is unavailable due to privacy or ethical restrictions, a statement is still required. Suggested Data Availability Statements are available in section “MDPI Research Data Policies” at https://www.mdpi.com/ethics.
Acknowledgments
We would like to thank Dr. Dirk J. M. Sarrloos for his English proof reading.
Conflicts of Interest
The authors declare no conflicts of interest.
References
- Griggs, G.; Reguero, B. G. Coastal adaptation to climate change and sea-level rise. Water, 2021, 13(16), 2151. [CrossRef]
- Rawat, N.; Babu, M. S. U.; Nautiyal, S. Climate change and sea-level rise: A review of studies on low-lying and island countries. ISEC Working Paper. 2016.
- Shen, X.; Liu, B.; Lu, X. Effects of land use/land cover on diurnal temperature range in the temperate grassland region of China. Sci. Total Environ., 2017, 575, 1211–1218. [CrossRef]
- Nayak, S.; Mandal, M. Interactions of land-use cover and climate change at global level: How to mitigate the environmental risks and warming effects. Ecol Indic, 2019, 89, 104238. [CrossRef]
- IPCC. Small islands. In McCarthy, J. J.; Canziani, O. F.; Leary, N. A.; et al. (Eds.), Climate Change 2001: Impacts, Adaptation, and Vulnerability. Cambridge Univ. Press. 2001.
- Barati A. A.; Zhoolideh M.; Azadi, H.; Lee, J. H.; Scheffran, J. Impact of land use and land cover changes on temperature trends over India. Land Use Policy, 2019. 89, 104238. [CrossRef]
- Pielke, A. R.; Pitman, A.; Niyogi, D.; Mahmood, R.; Mcalpine, C.; Hossain, F.; Goldewijk, K. K.; Nair. U.; Betts, R.; Fall, S.; Reichstein, M.; Kabat, P.; de Noblet, N. Land use/land cover changes and climate: Modeling analysis and observational evidence. Wiley Interdiscip. Rev. Clim. Change, 2011, 2, 828–850. [CrossRef]
- Grimm, N. B.; Faeth, S. H.; Golubiewski, N. E.; Redman, C. L.; Wu, J.; Bai X.; Briggs, J. M. Global change and the ecology of cities. Science, 2008, 319(5864), 756–760. [CrossRef]
- Bonan, G. B. Forests and climate change: forcings, feedbacks, and the climate benefits of forests. Science, 2008, 320(5882), 1444–1449. [CrossRef]
- Foley, J. A.; Defries, R.; Asner, G. P.; Barford, C.; Bonan G.; Carpenter, S. R.; Chapin, F. S.; Coe, M. T.; Daily, G. C.; Gibbs, H. K.; Helkowski, J. H.; Holloway, T.; Howard, E. A.; Kucharik, C. J.; Monfreda, C.; Patz, J. A.; Prentice, C.; Ramankutty, N.; Snyder, P. K. Global consequences of land use. Science, 2005, 309(5734), 570-4. [CrossRef]
- Turner, B. L. II; Kasperson, R. E.; Matson, P. A.; McCarthy, J. J.; Corell, R. W.; Christensen, L.; Eckley, N.; Kasperson, J. X.; Luers, A.; Martello, M. L.; Polsky, C.; Pulsipher, A.; Schiller, A. A framework for vulnerability analysis in sustainability science. Proc. Natl. Acad. Sci. USA, 2003, 100(14), 8074–8079. [CrossRef]
- Kim, J.-C.; Kim, D.-G. A Study on Correlations between Sea Surface Temperature and Air-Temperature of The Yellow Sea of Korea. J. Korean Isl., 30(1), 151-172. [CrossRef]
- Park, C.; Choi, Y.; Moon, J.-Y.; Yun, W.-T.; Classification of Climate Zones in South Korea Considering both Air Temperature and Rainfall. J. Korean Geogr. Soc., 2009, 44, 1-16.
- Narayan, S.; Esteban, M.; Albert, S.; Jamero, M. L.; Crichton, R.; Heck, N.; Goby, G.; Jupiter, S. Local adaptation responses to coastal hazards in small island communities: insights from 4 Pacific nations. Environ. Sci. Policy., 2020, 104, 199-207. [CrossRef]
- Etongo, D.; Arriso, L. Vulnerability of fishery-based livelihoods to climate variability and change in a tropical island: insights from small-scale fishers in Seychelles. Discov Sustain., 2021, 2, 48. [CrossRef]
- Cho, K. Korea's Adaptation Strategy to Climate Change. KEPP., 2011, 9, 1–15.
- Korea Meteorological Administration (KMA). Annual Climate Report 2022. 2023.
- Kang, Y.; Park, J.; Jang, D. H. Compound impact of heatwaves on vulnerable groups considering age, income, and disability. Sci. Rep., 2024, 14, 24732. [CrossRef]
- Ashu, A. B.; Kang, J. Assessing climate change impacts on flood risk in the Yeongsan River Basin, South Korea. Sci. Rep., 2025, 15, 26113. [CrossRef]
- Ha, K. J.; Yun, K. S. Climate change effects on tropical night days in Seoul, Korea. Theor. Appl. Climatol., 2012, 109, 191–203. [CrossRef]
- Park, T.-W.; Lee, C.-G.; Chang, M.; Park, D.-S. Regional characteristics of hot days and tropical nights in the Honam area, South Korea. Atmos. Sci. Lett., 2022, 23, e1086. [CrossRef]
- Choi, N.; Lee, M.-I. Spatial Variability and Long-Term Trend in the Occurrence Frequency of Heatwave and Tropical Night in Korea. Asia-Pac. J. Atmos. Sci., 2019, 55, 101-114. [CrossRef]
- Kim, J.-C.; Kim, D.-G. A study on correlations between sea surface temperature and air temperature of the Yellow Sea of Korea. J. Korean Island, 2018, 30, 151–172. [CrossRef]
- Rahman, G.; Kim, J.-Y.; Kim, T.-W.; Park, M.; Kwon, H.-H Spatial and temporal variations in temperature and precipitation trends in South Korea over the past half-century (1974–2023) using innovative trend analysis. J. Hydro-Environ. Res., 2025, 58, 1-18. [CrossRef]
- Ryu, J.-H.; Lee, J.-H.; Kang, S.-L. Non-stationary temperature extremes in South Korea: An extreme value analysis of global warming impacts. Atmos. Res., 58, 789–803. [CrossRef]
- Park, T.-W.; Lee, C.-G.; Chang, M.; Park, D.-S. R. (2022). Regional characteristics of hot days and tropical nights in the Honam area, South Korea. Atmos. Sci. Lett., 2026. 328, 108388. [CrossRef]
- Hong, S.-K.; Grydehøj, A. (2022). Sustainable island communities and fishing villages in South Korea: Challenges, opportunities and limitations. Sustainability, 14, 16657. [CrossRef]
- Hong, S.-K. (2015). Socio-economic foundation by biocultural resources management: Suggestion for UNESCO Shinan Dadohae Biosphere Reserve, Korea. J. Mar. Island Cult., 4(2), 81–88. [CrossRef]
- Lee, H.-J.; Cho, K.-M.; Hong, S.-K.; Kim, J.-E.; Kim, K.-W.; Lee, K.-A.; Moon, K.-O. (2010). Management plan for UNESCO Shinan Dadohae Biosphere Reserve (SDBR), Republic of Korea: Integrative perspective on ecosystem and human resources. J. Ecol. Environ., 33(2), 95–103. [CrossRef]
- Kim, J.-E. (2015). Rural landscape and biocultural diversity in Shinan-gun, Jeollanam-do, Korea. J. Ecol. Environ., 38(2), 249–256. [CrossRef]
- Foley, J. A.; et al. (2005). Global consequences of land use. Science, 309(5734), 570–574. [CrossRef]
- Hong, S.-K.; Wehi, P.; Matsuda, H. Island biocultural diversity and traditional ecological knowledge. J. Mar. Island Cult., 2013, 2, 57–58. [CrossRef]
- Kim, J.-E. Land use patterns and landscape structures on the islands in Jeonnam Province’s Shinan County occasioned by the construction of mainland bridges. J. Mar. Island Cult., 2016, 5, 53–59. [CrossRef]
- Kim, J.-E. Land use management and cultural value of ecosystem services in Southwestern Korean islands. J. Mar. Island Cult., 2013, 2, 49–55. [CrossRef]
- Kim, J.-E.; Hong, S.-K. Pattern and process in Maeul, a traditional Korean rural landscape. J. Ecol. Environ., 2011, 34, 237–249. [CrossRef]
- Kim, Y.-O.; Lee, W.; Kim, H.; Cho, Y. Social isolation and vulnerability to heatwave-related mortality in the urban elderly population: A time-series multi-community study in Korea. Environ. Int., 2020, 142, 105868. [CrossRef]
- Kabisch, N.; Frantzeskaki, N.; Pauleit, S.; Naumann, S.; Davis, M.; Artmann, M.; Haase, D.; Knapp, S.; Korn, H.; Stadler, J.; Zaunberger, K.; Bonn, A. Nature-based solutions to climate change mitigation and adaptation in urban areas: perspectives on indicators, knowledge gaps, barriers, and opportunities for action. Ecol. Soc., 2016, 21(2), 39. [CrossRef]
- Marando, F.; Heris, M. P.; Zulian, G.; Udias, A.; Mentaschi, L.; Chrysoulakis, N.; Parastatidis, D.; Maes, J. Urban heat island mitigation by green infrastructure in European Functional Urban Areas. Sustain. Cities Soc., 2022, 77, 103564. [CrossRef]
- Gill, S. E.; Handley, J. F.; Ennos, A. R.; Pauleit, S. Adapting cities for climate change: The role of the green infrastructure. Built Environ., 2007, 33(1), 115–133. [CrossRef]
- Abdolghafoorian, A.; Farhadi, L.; Bateni, S. M.; Margulis S.; Xu, T. Characterizing the effect of vegetation dynamics on the bulk heat transfer coefficient to improve variational estimation of surface turbulent fluxes. J. Hydrometeorol., 2017,18, 321-333. [CrossRef]
- Wang, L.; Tian, F.; Wang, X.; Yang, Y.; Wei, Z. Attribution of the land surface temperature response to land-use conversions from bare land. Glob. Planet. Change, 2020, 193, 103268. [CrossRef]
- Ma, G.; Zhang, Y.; Li, H.; Yang, Y.; Li, R. Dynamics and interactions of soil moisture and temperature during degradation and restoration of alpine swamp meadow on the Qinghai-Tibet plateau. Front. Environ. Sci., 2025,13, 1476167. [CrossRef]
- Hong, S.-K.; Kim, J.-E.; Wu, J.; Nakagoshi, N. Traditional forests in villages linking humans and natural landscapes. In Landscape Ecol. Asian Cult. (pp. 157–174). Springer, Tokyo. 2011. [CrossRef]
- Kim, J.-E. Land use management and cultural value of ecosystem services in Southwestern Korean islands. J. Mar. Island Cult., 2013, 2(1), 49–55. [CrossRef]
- Kim, J.-E. Traditional ecological knowledge and sustainability of ecosystem services on islands: A case study of Shinan County, Jeollanam-do, Republic of Korea. J. Mar. Island Cult., 2019, 8(1), 28–35. [CrossRef]
- Hong, S.-K.; Kim, J.-E.; Ro, T. H. Island biocultural diversity initiative for sustainable society in Asia-Pacific island regions. In Landscape Ecol. Sustain. Soc. Springer, Cham. 2017. [CrossRef]
Figure 1.
Location of study areas.
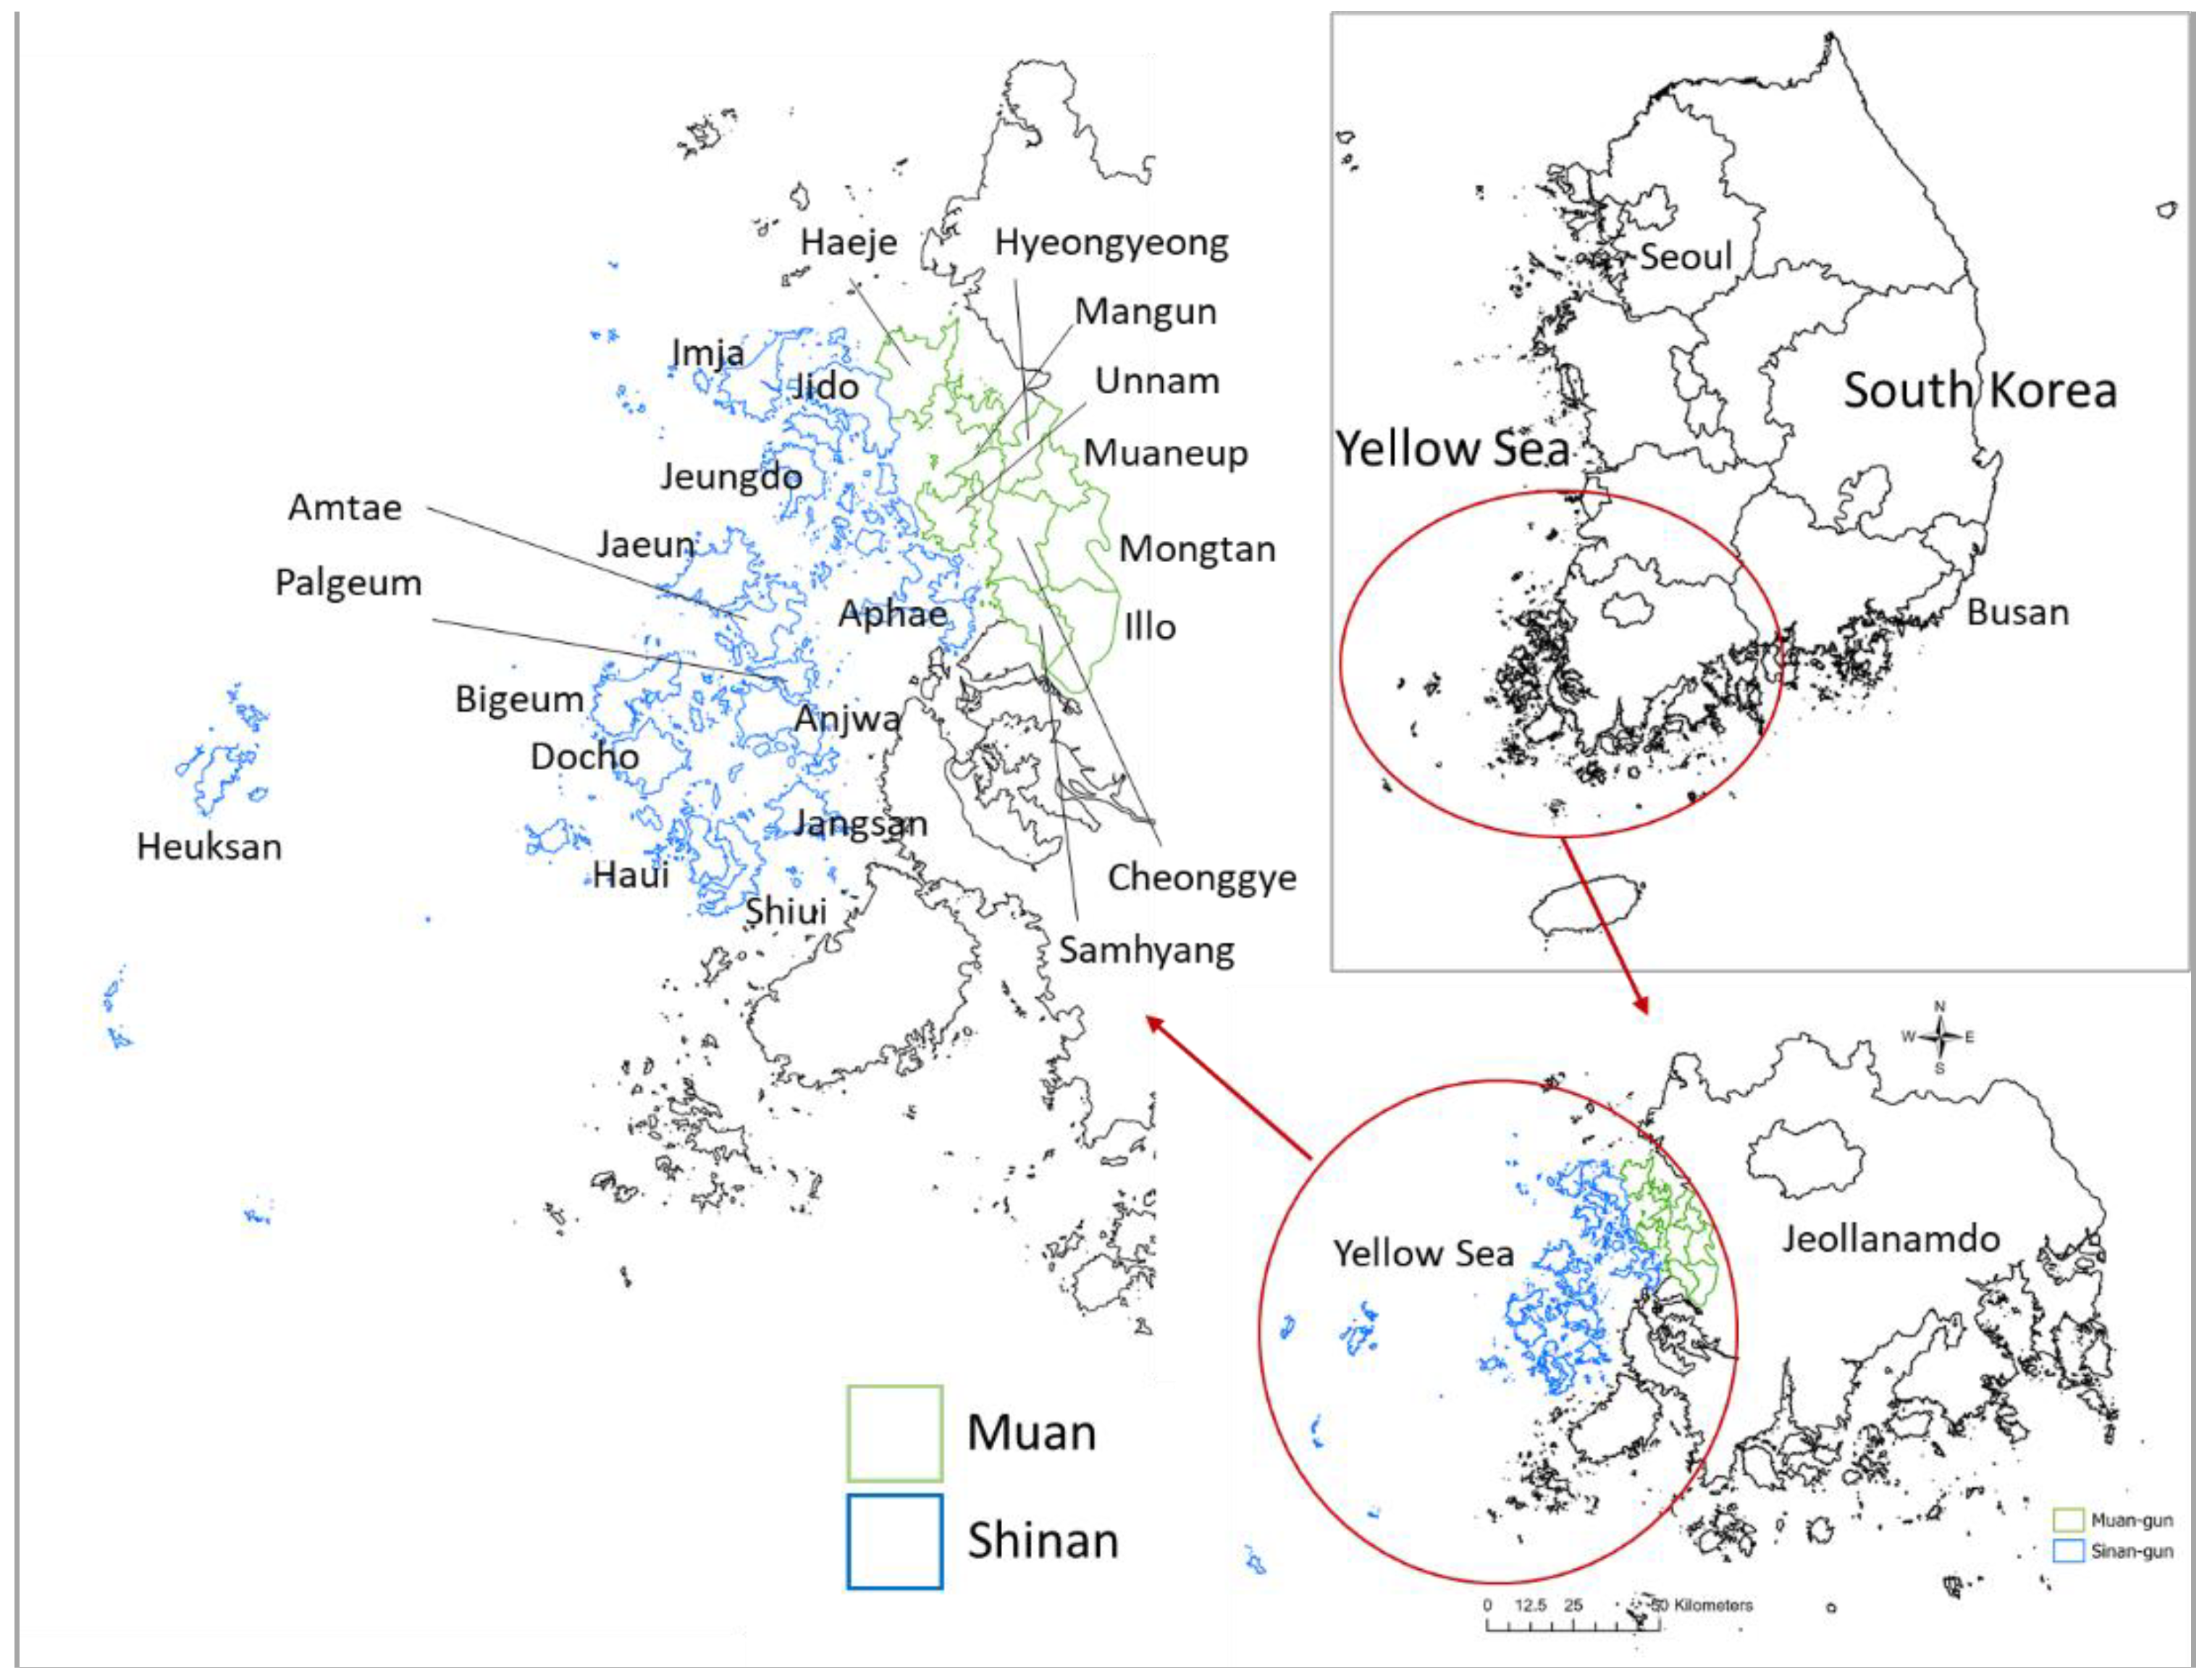
Table 1.
Profile of the study areas (Muan and Shinan).
| Item | Muan | Shinan |
| Area | 436.40 km² | 655.68 km² |
| Human population (2020) | 86,132 | 38,938 |
| Population density | 197.37 persons km² | 59.38 persons km² |
| Economy | Mainly agriculture; limited aquaculture | Mixed farming, fishing, and aquaculture |
| Administrative units | 3 eups and 6 myeons (9 local offices) |
2 eups and 12 myeons (14 local offices) |
| Natural environments | Muan Tidal Flat Wetland Protected Area | UNESCO World Heritage (Getbol), UNESCO Shinan-Dadohae Biosphere Reserve, Dadohaehaesang National Park |
| Geographical features | North–south elongated terrain; most hills 200–300 m above sea level; extensive reclaimed tidal flats converted to cropland since the 1960s | 2 eups and 12 myeons (14 local offices) Composed of ~890 islands; mostly rolling hills 200–300 m above sea level; broad tidal flats |
Table 4.
Pearson correlation coefficients between land use categories and climatic variables (Muan and Shinan). * p < 0.05; ** p < 0.01.
Table 4.
Pearson correlation coefficients between land use categories and climatic variables (Muan and Shinan). * p < 0.05; ** p < 0.01.
| Daily Mean Temperature | Daily Maximum Temperature | Daily Minimum Temperature | Tropical Night Days | Heatwave Days | Annual Precipitation | Precipitation Intensity | Heavy Rain Days | |
| Build-up Area | -0.39 | 0.383 | -0.511* | -0.102 | 0.404 | 0.468* | -0.199 | -0.021 |
| Agricultural Area | -0.239 | 0.557** | -0.497* | 0.198 | 0.687** | 0.364 | -0.029 | -0.357 |
| Wetland | 0.686** | -0.097 | 0.583** | 0.343 | -0.313 | -0.525* | 0.172 | -0.081 |
| Bare Land | 0.208 | 0.88** | 0.668** | -0.196 | 0.834** | -0.606** | -0.103 | 0.341 |
| Forest & Grassland | -0.443* | -0.592** | -0.01 | -0.603** | -0.528** | 0.12 | -0.12 | 0.49* |
| Water Surface | -0.232 | 0.513* | -0.474* | -0.084 | 0.531** | 0.438* | -0.11 | 0.99 |
Disclaimer/Publisher’s Note: The statements, opinions and data contained in all publications are solely those of the individual author(s) and contributor(s) and not of MDPI and/or the editor(s). MDPI and/or the editor(s) disclaim responsibility for any injury to people or property resulting from any ideas, methods, instructions or products referred to in the content. |
© 2025 by the authors. Licensee MDPI, Basel, Switzerland. This article is an open access article distributed under the terms and conditions of the Creative Commons Attribution (CC BY) license (http://creativecommons.org/licenses/by/4.0/).
Copyright: This open access article is published under a Creative Commons CC BY 4.0 license, which permit the free download, distribution, and reuse, provided that the author and preprint are cited in any reuse.


