

Submitted:
28 October 2025
Posted:
30 October 2025
Read the latest preprint version here
Abstract
We analyze the evolution of a few atmospheric and surface physical properties on Earth over a period of 20 years (period from 2005 to 2024) through the radiance fluxes measured by the Meteosat Second Generation (MSG) satellites. The results show significant changes in time in the solar (–1.3 %) and infrared domains (+0.4%), consistent with data from similar radiometers on other satellite platforms. We conclude that the outgoing solar radiation flux (OSR) decreases as a result mainly of low-level cloud reduction under the nominal Meteosat field of view (MFoV) at 0-degrees longitude in the geostationary orbit. We relate regional changes in 60 subareas to the cloud distribution high and low in the atmosphere, and show the connection between the imbalance at the top of the atmosphere and the observed variation in sea surface temperature (SST) in the Atlantic. We also discard a significant cirrus variation in the 20 years of the study, in spite of aviation forcing at high levels.
Keywords:
satellite observations
; radiance
; absorption of thermal radiation
; radiation flux
; long-term series
1. Introduction
Satellite measurements sample the spectrum of the radiation reflected or emitted by the Earth. Key variables are cloudiness and the concentration of absorbing gases plus aerosol. Those variables determine the surface temperature and steer the Earth radiative balance [1].
Changes in the radiation balance, due to natural climate variability and human activity, translate to surface warming and adopt diverse regional patterns. Products and datasets from low-Earth-orbit [2] and geostationary [3,4] satellites are being used to derive the components of the Earth Radiation Budget (ERB) at the top of the atmosphere (ToA), recognized as one of the Essential Climate Variables [5]. Meteosat Second Generation (MSG), a European geostationary satellite system now largely improved by a third generation, provides temporal samples to capture information at 15-minute intervals about the diurnal cycles of the radiation reaching the ToA since 2004 [6,7,8].
A review paper [9] summarizing the advances in the utilization of radiation measurements explores the direct use of spectral observations to evaluate climate models.
As an extension of a previous work by the authors [10] we explore now the regional variability in the ToA imbalance and its impact on the sea surface temperature (SST) in the Atlantic and west Indian oceans, based on radiance fluxes measured by Meteosat within the period 2005–2024.
2. Methods
The method used in this study is described in a previous work [10], here upgraded and applied to a longer time period, while reducing the uncertainty of the results by 70%. Each set of measurements of the Meteosat Field of View (MFOV) on an operational cycle of 15 minutes is considered a slot. We compare slot and channel average radiances for an initial period of time (‘remote’, from January 2005 to December 2014) and a final period (‘recent’, from January 2005 to December 2014), to determine trends in the data. See Table 1.
Data averages are built with a lag of 522 weeks, approximately ten years. We compare the MFOV average data in the Meteosat slot at the nominal date and time Friday 7 January 2005 at 12 00 UTC with the slot on Friday 9 January 2015 at 12 00 UTC. We choose a constant weekday for all the sampled data. to avoid possible minor changes in the images due to different human activities at different weekdays. The weekly choice, rather than a more frequent data sampling, proves robust, since a week is a typical decoupling time for satellite imagery in the synoptic scale.
As an example (Figure 1), the slot-average radiance around 0.6 µm measured by Meteosat oscillates in time between 3.2 mW·m–2·sr–1·cm around June-July (the less cloudy period in the year) and 4.6 mW·m–2·sr–1·cm around the equinoxes. The cluster of dots with the differences in ten years (a) is biased to a negative value around –0.1, indicating a decrease of reflected radiation, explainable by a significant decrease in cloud cover for all seasons. From the scatter plot (a), the months of June and July present the lowest reflectivities in the year. Cloud loss is however similar for all times in the year. Kendall’s tau for the channel 0.6 µm time series (c) is –0.07 (p-value of 0.0005) indicating a clear trend.
A note on image similarity: slots separated 24 hours show typical Pearson correlation coefficients of 0.95 ± 0.02, and only 0.48 ± 0.05 if the two images are separated by one week. If we compare monthly image averages for consecutive months, where the rapid movement of cloud is averaged out, the correlation grows to 0.71 ± 0.03. Longer period averages increase the correlation, i.e., an averaged year is similar to the next averaged year. And for longer averages, the 0.6 µm solar correlation between 10-year averages of 0.6µm solar images reaches 0.994.
On an initial (remote) and a final (recent) period, each ten years long (3647 days or 521 weeks) and consisting of 522 slots, we attain statistical significance for most channels. The SEVIRI radiometer on board of MSG scans the MFOV at eleven different wavelengths, with sub-satellite point horizontal resolution of 3 km × 3 km. The achieved data resolution is better than ±0.1 K for brightness temperatures as a result of data grouping in 4 × 4 pixel boxes.
MSG data
We use the 522 pairs of slots for three kinds of statistical analyses: (a) MFOV pixel average for each channel used to estimate trends, in Figure 2. (b) Local change of pixel averages for all pixels, shown in Figure 3 for two of the channels. (c) Pixel sampling for inter-channel comparisons in Figure 4.
The characteristics of the SEVIRI channels are shown in the first four columns of Table 2. The information from Meteosat is available at the EUMETSAT data portal https://user.eumetsat.int (free registration is required to access data). We extracted calibrated and rectified (level 1.5) radiances from December 2004 to December 2024 at 12 UTC over the MFOV from the satellite at 0° longitude. Data are retrieved as files with a count value for each pixel, channel and nominal time. The count value is converted into radiation units (10-3 Wm-2 sr-1 (cm-1)-1) with the help of the slot calibration coefficients in each retrieved file. In this study, we restrict ourselves to the slot labeled 12 UTC, which contains MFOV data captured between 1200 UTC and 1212 UTC, acquired from south to north, roughly corresponding to midday conditions at Greenwich meridian. The trends estimated in this study (defined here as the change between the final and initial measurements) are the differences in slot-average values measured with a 10 year interval on the 11 different channels of SEVIRI (see Table 2).
For the interpretation of the atmospheric and ground evolution, we group Meteosat SEVIRI channels in four spectral categories (last column in Table 2 and Figure 2), which requires the integration of the measurements in solid angle. In the Lambertian hypothesis for radiation emission from a surface, solar channels get divided by a correction constant π to compensate null values in the night. We encounter a limitation in how well the channels represent the spectral domain. As seen in the 4th column of Table 2, the bandwidths in SEVIRI channels partially overlap and do not completely cover the infrared or solar domain. The channel grouping therefore introduces errors of ±0.15 Wm-2 for each group of integrated radiances (last column in Table 2).
We integrate in the spectral domain and angular domain to result in radiances (in units Wm-2) through the formula:
with Const = 1 for solar channels (numbered 1 to 4) and Const = π for infrared channels (from 5 to 11). The first value (Const=1) produces a 24-hour average out of the measured day data at 12 UTC, assuming a typical cycle of 12 hours of night and 12 hours for describing the illumination evolution as a positive sine function.
Radiance variation = Const * Spectral radiance variation * Channel spacing
The climate is driven by the net amount of radiation entering and leaving the Earth-atmosphere at its top, consisting of the Earth’s reflected shortwave radiation (RSW) and the Outgoing Longwave Radiation (OLR). These two quantities can be respectively assessed from Meteosat solar channels (1 to 4) and infrared channels (5 to 11). The solar incoming radiation (SIR) varies with the Earth-Sun distance in the course of the year. See [11] for details.
As an equation for the climate imbalance (we call it CI here, but commonly it is referred as Earth Energy Imbalance or EEI) we use:
CI = SIR – RSW – OLR
This imbalance translates into the Earth surface temperature change, with a growing trend in recent decades [12], plus the heat storage in the ocean and inner land layers. From the satellite perspective in formula (2), a reduction in the satellite measured radiances (exiting the planet) means an increase of the imbalance, CI.
Finally, we use a calculation sheet containing a 20 vertical-level model of the standard atmosphere (called ‘our model’ in this paper) to evaluate the approximate change in radiance fluxes in response to atmospheric physical variables like greenhouse gas concentration, water vapor amount and high or low cloud. It was calibrated against the measured radiances.
A summary of strengths and limitations in this study is presented in Table 3.
3. Results
We focus in four basic Meteosat data analysis that we performed.
3.1 Global analysis
3.2 Regional analysis
3.3 Imbalance evolution at the top of the atmosphere (ToA).
3.4 Sea surface temperature in connection with the imbalance.
3.1. Global Analysis
Figure 2 summarizes the spectrally integrated per-decade variation (in Wm-2) for the eleven MSG channels, by comparing the recent 10-year period (2015–2024, in blue) with the ‘remote’ period 2005-2014.
We take the central wavenumbers of the MSG channels as the basis for the channel interval width estimation, and integrate in stereo angle and wavenumber. Excepting those at 7.3 µm and at 12 µm, the channels show statistically significant variations in the radiance per unit of wavenumber (usually expressed in cm-1).
For the solar channels (SEVIRI channels 1 to 4) and for the CO2 channel (SEVIRI channel at 13.4 µm) a negative radiance trend is observed. The radiances can be grouped in four regions by wavelength as seen in Figure 2, labeled: solar, water vapor, thermal infrared and CO2 spectral domains. The radiance changes in Wm-2 for the four groups, with uncertainties of ±0.15 Wm-2, are also indicated. Most outstanding variations occur for channels centered at 0.6, 0.8, 6.2 and 13.4 µm. These results were already analyzed and commented in [10] and highlight the primary role of cloud in the flux balance at the ToA.
The outgoing radiance decrease in the CO2 absorption region appears to be the consequence of the continuously increasing gas level, currently at a rate of about 5% per decade. The radiance decrease at channel 13.4 µm shows in our model an equivalent increase of 4.5% per decade in the CO2 atmospheric concentration, compounded with an increase in air temperature of (0.34 ± 0.08) K. A similar air warming of (0.31 ± 0.11) K would also explain the measured increase at channel 5 around 6.2 µm. The atmosphere specific humidity likely changed in ways we try to ascertain from channels at 10.8 µm and 12 µm, whose difference grows in every sub-region of the MFoV. See Figure 4 (bottom image).
The given values for air heating are confirmed by estimates from other data sources, which point to the recent record-low planetary albedo as the primary warming factor [14].
The low cloud reduction together with the increase in surface and atmosphere temperatures explains the thermal infrared radiance increase. This result is very similar to the most recent data from Ceres [15], which however shows a smaller change in the absorbed solar radiation. The reason is perhaps because it does not cover the last few hot years 2023-2025, or because it refers to the whole world, as opposed to the Atlantic hemisphere we deal with in this paper. Their OLR increase estimate matches ours.
In fact the Sahel Chad basin receives lately more precipitation, similar to the precipitation during the high phase of the inter-decadal hydrological cycle in 1950-1960.[16,17]. This tallies in our study with the cyan hues in that region. We do not observe a clear pattern in the creation or destruction of cloud in the MFoV, but an average reduction is clearly the trend.
Several studies [18] point out the prevalence of aerosol trends over greenhouse gas trends in climate warming: “Aerosol reductions significantly contribute to climate warming and increase the frequency and intensity of extreme weathers”[19]. We have not pursued this thesis here.
The relative variation for channel 10.8 µm (Figure 3, right) is not as high as for 0.6 µm, but firmly correlates with the solar decadal variation (Figure 3, left). A Pearson correlation coefficient of 0.71 is noted for the decadal variation in radiances at 0.6µm and 10.8 µm, where a decrease in reflectance at 0.6 µm tends to match an increase in outgoing longwave radiation (OLR) at 10.8 µm. Even the 60 regions we distinguish in Figure 4 show on average that pattern at the more local scale. Physically a cloud reduction allows an easier escape for heat from the ground. Above the Sahara, mostly cloud free, there is no noticeable change in those two channels.
Figure 4 shows areas of geographical variation in the channel 0.6 µm reflectivity and combinations of radiance values in the infrared or their variation in the decade, namely 10.8 µm and 12.0 µm. A random selection of pixels in each regional square area is represented by color dots indicating their average reflectivity from 3% (in blue) to 60% (in red). We observe there the areas most affected by a decrease in RSW, namely the north Atlantic, eastern Europe, north-east Brazil and off the western coast of southern Africa. On the other hand, the Sahel, central Brazil and areas of the south Atlantic increase their cloud cover. Also above the warm Agulhas current [20].
3.2. Regional Evolution
Areas with less cloud in the final period than in the initial allow an easier escape route to space for the outgoing longwave radiation. The anomaly correlation for the regional changes in channels 0.6 µm and 10.8 µm is -0.46, and therefore significant, which also turns into an intuitive result: with less cloud the Earth is able to release more heat into space as infrared radiation. Areas of increased outgoing longwave radiation (OLR) correlate with areas of decreased reflected shortwave radiation (RSW).
Desert regions like the Sahara, with scarce cloudiness along the year and marginal land use transformation, show minimal changes in RSW but considerable changes in OLR in the 20 years, which can be explained by soil temperature increases, not excluding aerosol (dust) changes. Maritime regions like the South Atlantic show high correlation between RSW and OLR changes, mostly for less reflected and more emitted radiation. In an area with very low presence of human-related aerosols most of the change must be in the cloud amount. A decrease in the cloud cover optimally explains that less solar radiation is reflected to space (negative RSW), and that more heat from the surface can reach space (positive OLR).
The cloud cover decrease concerns mainly the low-level cloud. Warm cloud has a cooling effect on the planet, whereas high-level cloud is typically warming the surroundings, or occasionally having a neutral effect. We have not observed a variation in high-level cloud. In this work we disregard the night conditions, which imposes a limitation in the results.
The decadal increase in brightness temperature around 10.8 µm (+0.32 K) and 12.0 µm (+0.20 K) may reflect changes in humidity, air temperature, or cloud cover. The difference between these two channels, which has increased by 0.12 K over the decade, corresponds, according to our simulations with our model either to a (6 ± 2)% rise in specific humidity in the lower atmosphere or to an increase of (0.8 ± 0.2) K in low-level air temperature. A hypothetical decrease of about 6% in high-level cloud cover could also produce a similar differential warming of 0.12 K. However, our test for variations in high cloud shows no significant decadal change.
To identify high cloud we counted pixels with particular thresholds in reflectivity and brightness temperatures as follows: Reflectivity at 1.6µm < 25% (ice cloud), at 0.8µm > 90% (bright cloud), brightness temperature (BT) at 10.8µm < 220K (cold cloud) and BT10.8µm – BT12µm < 3K (thick cloud). The number of pixels fulfilling all four conditions is not significantly different in the two decades considered.
Our regional analysis, mainly depicted in Figure 4, concludes on a high variability among the 60 square regions distinguished within the MFoV in satellite projection, which can be interpreted individually. Red dots in the scatterograms indicate the most reflective pixels in the MFoV on the multi-year average. Blue dots stand for the darkest and usually linked to clear ocean surfaces.
- The top image in Figure 4 with inset diagrams shows the pixel connection between the infrared (IR) value of the pixel in kelvin (K) on the vertical axis, and its relative change in 0.6µm radiation on the abscissa. That allows an identification of the temperature of the pixel most affected by the cloud reduction by just looking at the shift to the left hand side in the dot distribution. For instance, in the north Atlantic west of the Iberian peninsula, it is the warmer pixels suffering dissipation (shift to the left). Off the coast of Namibia, there is a uniform reduction in low level cloud, the typical dense fog in convective cells as a result of warm desert air sweeping above the cold Benguela current.[21]
- The middle image in Figure 4 shows pixel estimates by region for the warming due to the decadal change in short and long wave radiation. Blue shades in the scatter plots reveal which cloud level is more influential in the regional warming or cooling. In most regions, it is the most reflecting pixels losing more reflectivity and contributing more to the positive climate imbalance (CI) at the top of the atmosphere.
- The bottom image in Figure 4 shows regional changes for the difference in kelvin between channels at 10.8 µm and at 12.0 µm (‘split window difference’), which is generally a growth around 0.2 K in a decade. We think this increase is mainly due to the higher specific humidity in the low levels of the troposphere, as a result of the increase in ocean and land temperatures. We did not find evidence of a global increase in high cloud or thin cirrus after exploring and counting pixels above particular thresholds defining that cloud. Over the Sahara we notice a strong variation in the difference, presumably not due to humidity changes, but rather to an increase in low-level air temperatures.
3.3. Sea Surface Temperature (SST)
Using our own algorithm solely based on Meteosat radiances we estimate sea surface temperatures at every water pixel under the MFoV. Figure 5 provides the overall results for the average and decadal change in SST. The Mediterranean, Black Sea, around Madagascar and the south Seas near Antarctica show the sharpest SST increases. North-west Atlantic and the Caribbean sea show SST cooling.
3.4. Connection of SST to Climate Imbalance
There is a strong connection between the climate imbalance (CI) and the SST change in the monthly time scale (Figure 6 A). At the MFoV scale SST warming occurs approximately between October and February, and cooling the remaining months. What happens when we eliminate the seasonal variations with a 12-month filter of the imbalance and SST data? Then (Figure 6 B) their correlation drops to +0.6 and we observe growth periods in one variable coinciding with level periods in the other. Both variables show a positive trend in the course of the 20 years. The lack of agreement is not surprising, given the complexities of the ocean internal dynamics, which we barely understand through its surface and float studies on a reduced number of points [22].
The average imbalance during the sea surface warming seasons and the SST variation allow to estimate the mixed layer depth in ca. (35 ± 10) m. That is the layer of turbulence near the sea surface with homogeneous temperature and salinity. This value is an average of north and south Atlantic conditions typically with opposed cycles, therefore smaller than the local yearly amplitudes.
For the climate imbalance series (one data per week) there is a significant trend (Kendall’s tau=0.045, p-value=0.031) and the weekly increments appear random (runs test z-score=0.66, p-value=0.51), an indication of strong variability in the infrared and solar fluxes at the ToA, and weak elasticity in the climate system [23].
Figure 7 shows the sea surface temperature evolution from January 2020 to June 2025 for different geographic subareas of the MFoV, illustrating a differential warming in the northern hemisphere (NH) and the southern hemisphere (SH) ocean portions. Other recent studies point to this same probable fact, which we have not yet studied in depth or quantified [24].
4. Discussion and Conclusions
1. In response to atmospheric changes in gas and cloud amounts, Meteosat radiances significantly changed in the last decades, with marked regional differences, both in the solar and the infrared domains.
2. A low-level cloud decrease affected the Meteosat field of view in the last decades, contributing a large part of the current climate warming, both on land and ocean temperatures.
3. The results on the connection between SST and ToA imbalance (Figure 6 B) for the Meteosat FoV are close to those of Loeb from Ceres [15] in both variables during the overlap in the analyzed periods. Even more reassuring is that our graphs based on the Atlantic compare well in dips and bumps with those by Loeb referring to an all-oceans average, as if the Atlantic were synchronized with other oceans, mainly the Pacific, for the synoptic scale variations. The ocean surface then responds more quickly to changes in the atmosphere than the deep ocean. Other estimates are similar to ours, e.g., the change per decade in OLR (–0.27 theirs, –0.30 Wm-2 ours), with some divergence in the change of absorbed solar radiation (+0.73 Wm-2 theirs, +1.1 Wm-2 in our study).
4. For the period from July 2023 to July 2024 (the most recent year in the moving-averaged data of this study), we observe a significant imbalance reduction, driven mainly by the solar flux (–3.1 ± 0.5 W m−2), accompanied by an increase in SST (Figure 6 B). This concurrence suggests a largely unknown heat exchange between the boundary layer and the deeper ocean. Some authors [26] estimate that 93% of the imbalance energy ends up in the ocean as heat content (OHC), most noticeable near the surface. We conclude that the SST is an incomplete indicator of ocean heating.
5. We use no external reference for the current imbalance at the ToA, so that its graph lines in Figure 6 should not be construed as absolute or confirmed. Since the imbalance is a weak indicator of the surface temperature rate, we have chosen the zero reference for imbalance that best explains the accelerating heating of the last few years. The graph’s worth lies in showing the imbalance evolution in time, not the imbalance current value.
6. The flux imbalance at the top of the atmosphere explains the seasonal cycle changes in the sea surface temperature on the short term. However there is no response to changes in the ToA imbalance on the sea surface temperatures on the one-year moving averaged series, with poor correlation about +0.35 between SST and imbalance. Mauritzen’s suggestion that SST yearly averages are “the result of the energy accumulated in earlier years, combined with any rapid change in forcing (e.g., aerosol emissions, volcanic eruptions or solar forcing)” [15] does not get confirmed by our work either. We do not find a time lag which improves the correlation between SST and imbalance. We estimate an Atlantic SST increase of (+0.17 ± 0.05) K in the last ten years, in line with other major sources of climate monitoring [25]. The decadal imbalance growth is at (+0.79 ± 0.15) Wm–2, the sum of all spectral terms in Table 2, according to Meteosat data. These two values match a spread of the imbalance heat in the upper 170 m, which is close to a common estimate of the oceans boundary layer depth.
7. The imbalance flux guides the short term evolution of the SST, but not in the long term, with time for part of its power warming deeper layers of the ocean in unpredictable ways.
8. Several researchers trace the albedo reduction back to a loss of cloud (and ice or snow in areas outside the MFoV) and to aerosol legal limitations as causes of warming [27]. They mention a “possibly emerging low-cloud feedback”, which affects the climate projections. Our work makes clear that low-cloud is not only affecting the climate warming, but also appears to have been its main driver in the last decade, not precluding any different future influence.
9. Figure 4 and Figure 5 show the lack of connection between the two climate variables cloudiness and SST. Whereas the region north of Venezuelan coast shows SST cooling and cloud loss at all levels, the portion of Indian Ocean included in the MFoV shows an increase of SST with similar cloud losses. We did not find strong correlation of cloud change and imbalance on any region. Only a weak correlation between the MFoV total SST and ToA imbalance (Pearson = +0.41). These negative results also extend to the globally averaged radiances at 10.8 µm and imbalance. [28]
10. We conclude that the deep ocean dynamics need additional studies to ascertain its role in changes on SST, which cannot be explained by the imbalance alone.
Author Contributions
Conceptualization, J.P.; methodology, J.P.; software, J.P.; validation, H.B. and J.P.; formal analysis, J.P. and H.B.; investigation, J.P. and H.B.; resources, H.B. and J.P.; data curation, J.P.; writing—original draft preparation, J.P. and H.B.; writing—review and editing, H.B. and J.P.; visualization, J.P. and H.B.; funding acquisition, H.B. All authors have read and agreed to the published version of the manuscript.
Funding
This research was partially funded by budget funds from the Federal University of Alagoas.
Data Availability Statement
Acknowledgments
This study uses as the main data source the Meteosat store from EUMETSAT, the European Organization for the Exploitation of Meteorological Satellites. Thanks are due to Richard Swifte for his selfless contribution to improve the text and his valuable comments.
Conflicts of Interest
The authors declare no conflict of interest. The funders had no role in the design of the study; in the collection, analyses, or interpretation of data, in the writing of the manuscript, or in the decision to publish the results.
References
- Dewitte, S.; Nevens, S. Earth’s radiation budget from 1979 to present derived from satellite observations. Copernicus Climate Change Service (C3S) Climate Data Store (CDS). 2021. https://doi.org/10.24381/cds.85a8f66e (accessed on 5 August 2025). [CrossRef]
- Xu, JL; Liang, SL; Jiang, B. A global long-term (1981-2019) daily land surface radiation budget product from AVHRR satellite data using a residual convolutional neural network. Earth System Science Data 2022, 14(5), 2315-2341.
- Gupta, S. K.; Ritchey, N. A.; Wilber, A. C.; Whitlock, C. H.; Gibson, G. G.; Stackhouse, P. W. A Climatology of Surface Radiation Budget Derived from Satellite Data. J. Climate 1999, 12(8), 2691-2710. [CrossRef]
- Payez, A.; Dewitte, S.; Clerbaux, N. Dual View on Clear-Sky Top-of-Atmosphere Albedos from Meteosat Second Generation Satellites. Remote Sens. 2021, 13, 1655. [CrossRef]
- Bojinski, S.; Verstraete, M.; Peterson, T.C.; Richter, C.; Simmons, A.; Zemp, M. The Concept of Essential Climate Variables in Support of Climate Research, Applications, and Policy. Bull. Am. Meteorol. Soc. 2014, 95, 1431–1443.
- Schmetz, J.; Pili, P.; Tjemkes, S.; Just, D.; Kerkmann, J.; Rota, S.; Ratier, A. An Introduction to Meteosat Second Generation (MSG). Bull. Am. Meteorol. Soc. 2002, 83, 977–992.
- Harries, J.E.; Russell, J.E.; Hanafin, J.A.; Brindley, H.; Futyan, J.; Rufus, J.; Kellock, S.; Matthews, G.; Wrigley, R.; Last, A.; et al. The Geostationary Earth Radiation Budget Project. Bull. Am. Meteorol. Soc. 2005, 86, 945–960.
- Harries, J. E., H. E. Brindley, P. J. Sagoo, and R. J. Bantges, 2001: Increases in greenhouse forcing inferred from the outgoing longwave radiation spectra of the Earth in 1970 and 1997. Nature, 410, 355-357.
- Brindley, H.E.; Bantges, R.J. The Spectral Signature of Recent Climate Change. Curr Clim Change Rep. 2016, 2, 112–126. [CrossRef]
- Fernández, J. I. P., & Georgiev, C. G. (2023). Evolution of Meteosat Solar and Infrared Spectra (2004–2022) and Related Atmospheric and Earth Surface Physical Properties. Atmosphere, 14(9), 1354. [CrossRef]
- Kidder, S.Q.; von der Haar, T. H. Satellite meteorology - An introduction. Academic Press, 1995; 466 pp.
- Rohde, R. Global Temperature Report for 2022. Berkeley Earth, U.S. non-profit organization focused on environmental data science and analysis. Available online: https://berkeleyearth.org/global-temperature-report-for-2022/.
- Loeb, N. G. (2023). CERES Top-of-Atmosphere Observations and Climate Feedback Analysis [Conference presentation]. CERES Science Team Meeting, May 2023. https://ceres.larc.nasa.gov/documents/STM/2023-05/15_Loeb_Contributed_Science_Presentation_2023.pdf.
- Goessling, H. F., Rackow, T., & Jung, T. (2024). Recent global temperature surge amplified by record-low planetary albedo. Science, 384(6693), 66–70. [CrossRef]
- Mauritsen, T., Tsushima, Y., Meyssignac, B., Loeb, N. G., Hakuba et al. (2025). Earth’s energy imbalance more than doubled in recent decades. AGU Advances, 6(3), Article e2024AV001636. [CrossRef]
- Salack, S., Giannini, A., & Sarr, B. (2016). Rainfall trends in the African Sahel: Characteristics, processes, and causes. Wiley Interdisciplinary Reviews: Climate Change, 7(3), 367–388. [CrossRef]
- Odoulami, R. C., et al. (2024). Strengthening of the hydrological cycle in the Chad Basin. Scientific Reports, 14, Article 75707. https://www.nature.com/articles/s41598-024-75707-4.
- Armour, K; Collins, W.; Dufresne, J-L.; Frame, D.; Lunt, D.J.; Mauritsen, T.; Palmer, M.D.; Watanab, M.; Wild, M.; Zhang, H. et al. The Earth’s Energy Budget, Climate Feedbacks, and Climate Sensitivity. In IPCC Sixth Assessment Report. Working Group 1; Forster, P., Storelvmo, T., Coord. Authors; WMO; UNEP: Geneva, Switzerland, 2007. https://www.ipcc.ch/report/ar6/wg1/chapter/chapter-7/. (accessed on 25 June 2023).
- https://www.nature.com/articles/s41467-023-42891-2 Aerosols overtake greenhouse gases causing a warmer climate and more weather extremes toward carbon neutrality. Pinya Wang, Yang Yang et al.
- Stramma, L., Cornillon, P., Weller, R. A., & Price, J. F. (1997). Observations of Agulhas Current variability. Journal of Geophysical Research: Oceans, 102(C3), 5513–5523. https://oceanrep.geomar.de/id/eprint/6196/.
- Shannon, L. V., & Nelson, G. (1996). The Benguela: Large-scale features and processes and system variability. In A. R. Robinson & K. H. Brink (Eds.), The Sea (Vol. 11, pp. 163–210). https://www.sciencedirect.com/science/article/abs/pii/S0079661109001104.
- Roemmich, D., et al. (2023). Observing the full ocean volume using Deep Argo floats. Frontiers in Marine Science, 10, 1287867. [CrossRef]
- Knutti, R., & Hegerl, G. C. (2008), “The equilibrium sensitivity of the Earth’s temperature to radiation changes” in Nature Geoscience.
- Loeb, N. G., Thorsen, T. J., Kato, S., Rose, F. G., Hodnebrog, Ø., & Myhre, G. (2025). Emerging hemispheric asymmetry of Earth’s radiation. Proceedings of the National Academy of Sciences of the United States of America, 122(40). [CrossRef]
- Berkeley Earth. (2025, July 11). Temperature update for June 2025: Third warmest June in the instrumental record. Berkeley Earth. Retrieved from https://berkeleyearth.org/june-2025-temperature-update/.
- Cheng, L., Abraham, J., Hausfather, Z., & Trenberth, K. E. (2019). How fast are the oceans warming? Science, 363(6423), 128–129. [CrossRef]
- Goessling, H. F., Rackow, T., & Jung, T. (2024). Recent global temperature surge amplified by record-low planetary albedo. Science, 384(6693), 66–70. [CrossRef]
- Copernicus Climate Change Service (C3S). (2025, April 15). Climate indicators: Ocean heat content. Retrieved October 18, 2025, from https://climate.copernicus.eu/climate-indicators/ocean-heat-content.
Figure 1.
Evolution of radiance flux on channel 0.6 µm. (a) Scatter plot of differences (horizontal axis) for slots separated by 10 years ±2 days, compared with the ‘recent’ value (vertical axis), showing a significant radiance reduction (black dot is the distribution center of mass). (b) Scatter plot for the connection between ‘recent’ values (vertical) and standard deviation inside the slot (horizontal). Dot color for (a) and (b) indicates month of the year, with highest values around the equinoxes. (c) Superposition of reflected radiance values at 0.6µm for a time lapse of ten years: orange line for ‘recent’ and blue line for ‘remote’ data, the latter typically higher in values. The yearly cycle of radiances shows two high peaks around the equinoxes in the MFoV.
Figure 1.
Evolution of radiance flux on channel 0.6 µm. (a) Scatter plot of differences (horizontal axis) for slots separated by 10 years ±2 days, compared with the ‘recent’ value (vertical axis), showing a significant radiance reduction (black dot is the distribution center of mass). (b) Scatter plot for the connection between ‘recent’ values (vertical) and standard deviation inside the slot (horizontal). Dot color for (a) and (b) indicates month of the year, with highest values around the equinoxes. (c) Superposition of reflected radiance values at 0.6µm for a time lapse of ten years: orange line for ‘recent’ and blue line for ‘remote’ data, the latter typically higher in values. The yearly cycle of radiances shows two high peaks around the equinoxes in the MFoV.
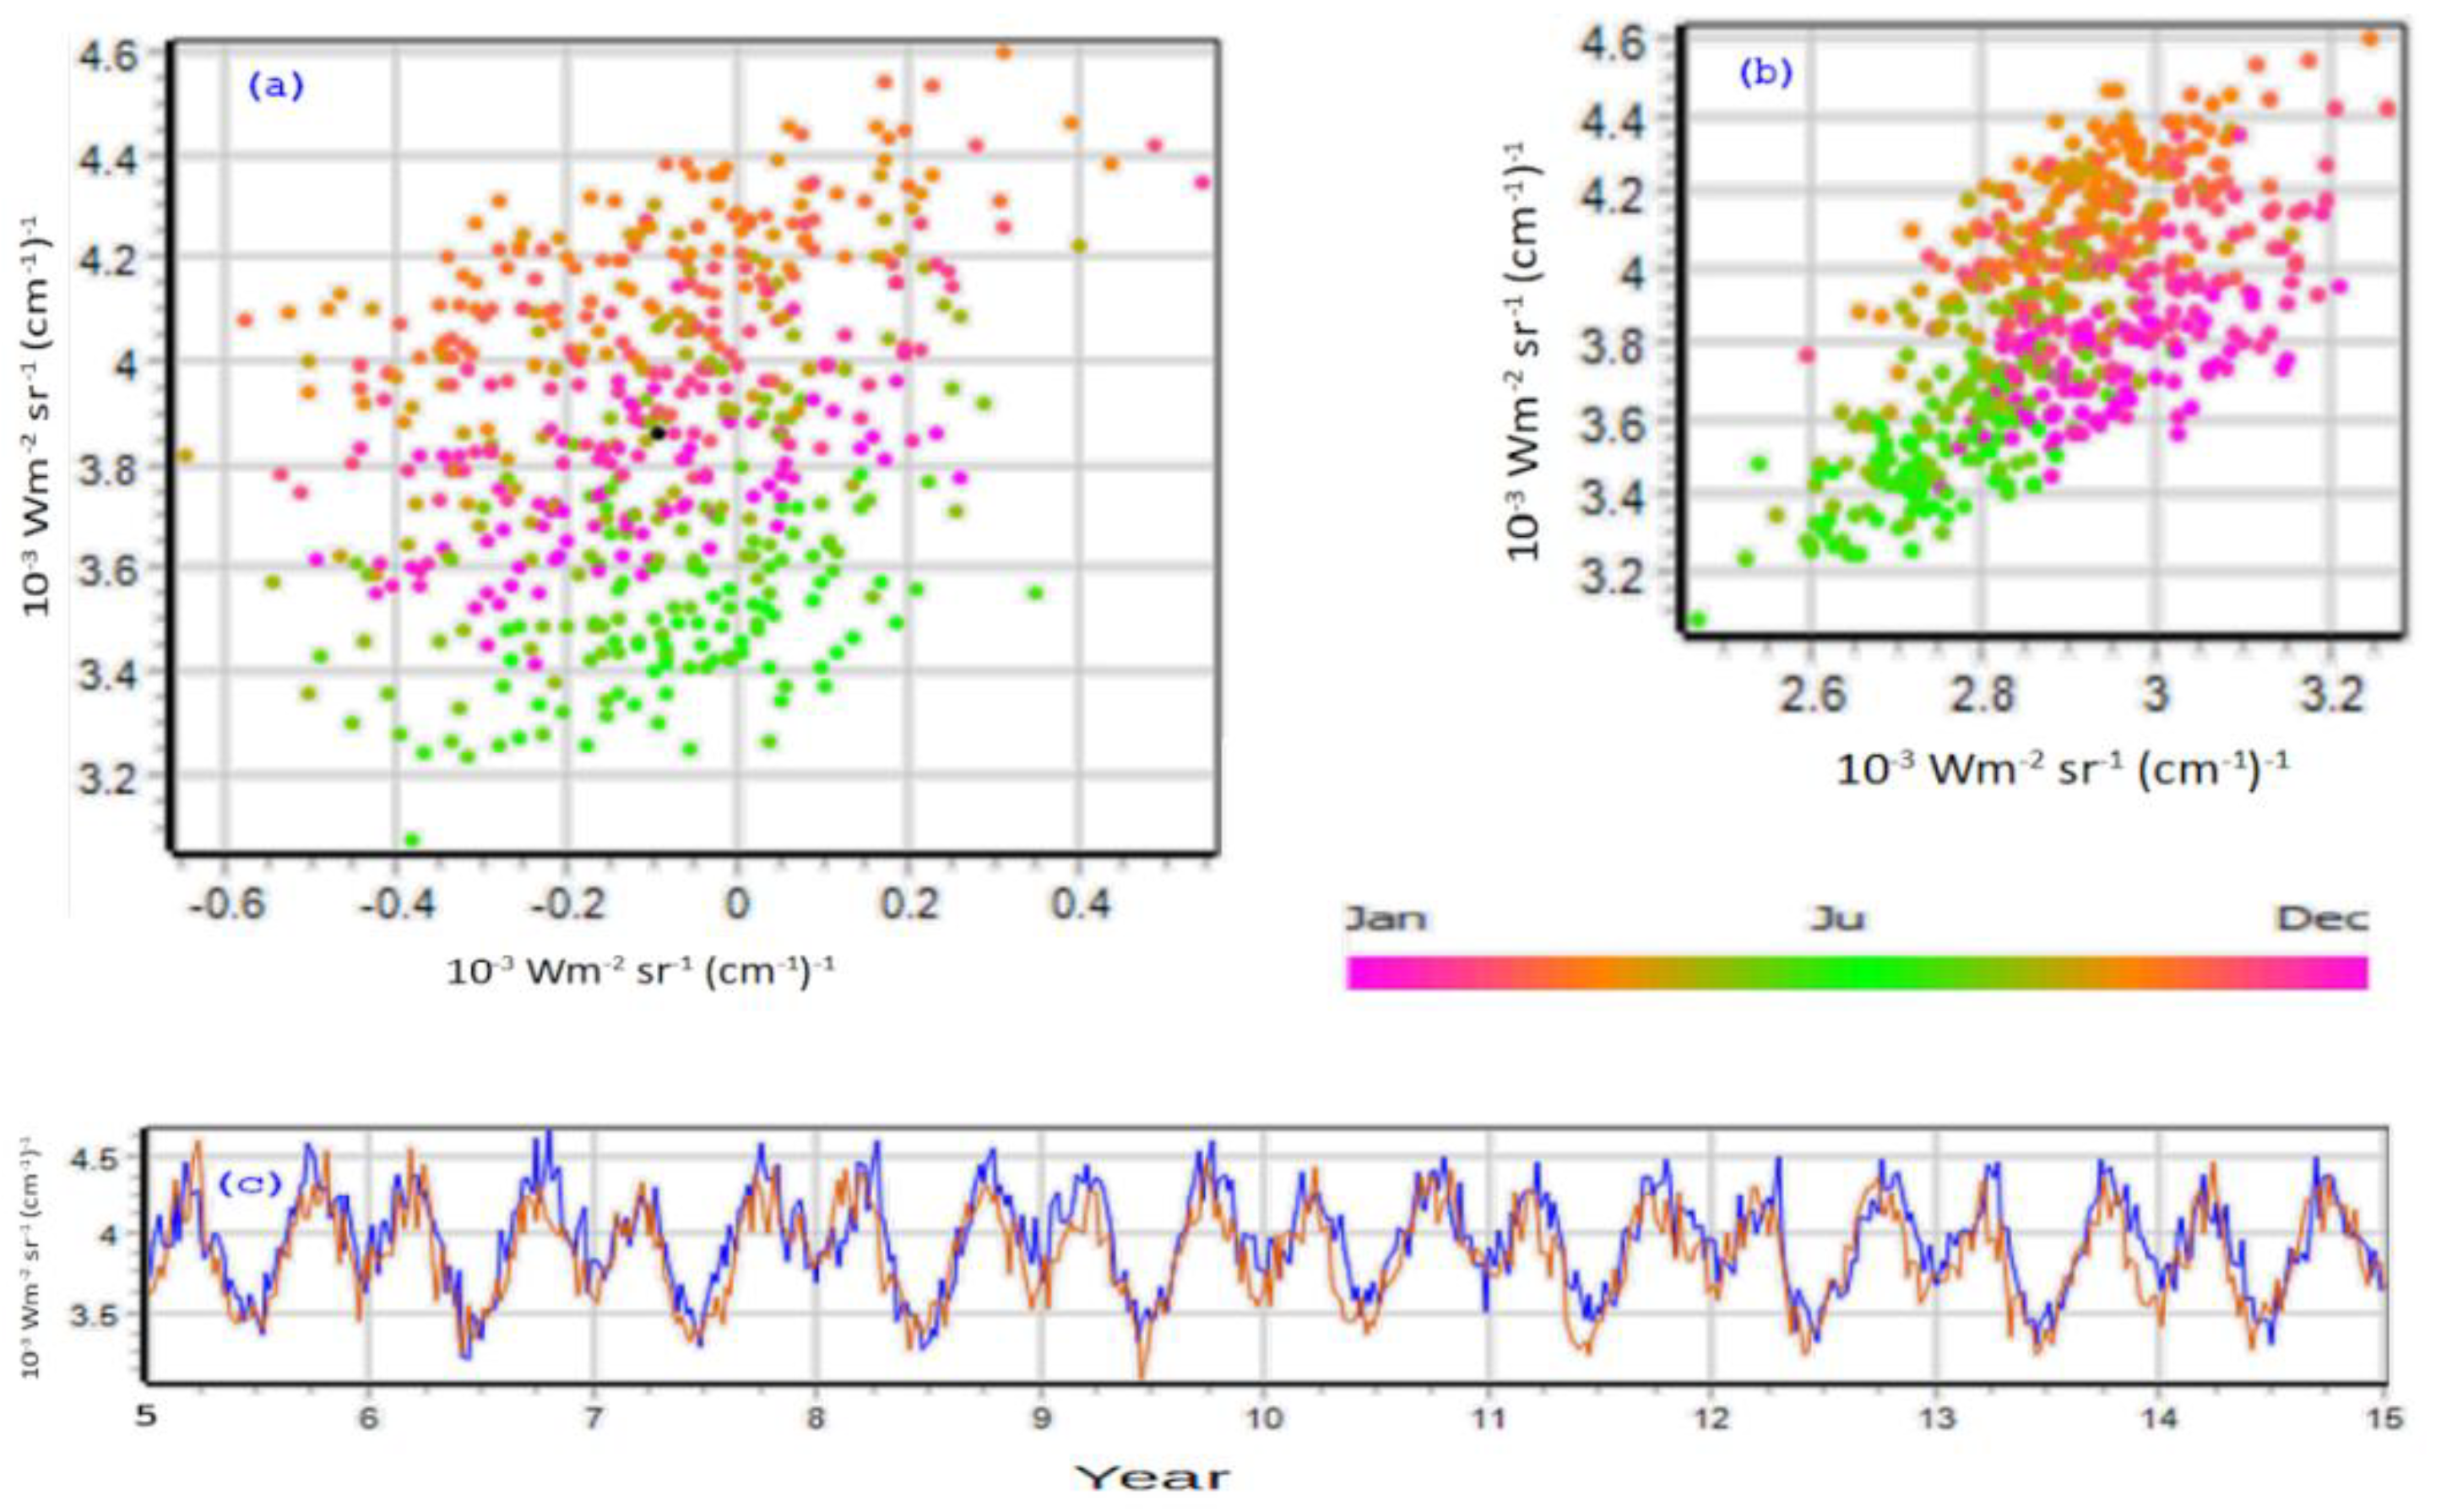
Figure 2.
Relative radiance change from 2005 to 2024 for the eleven MSG channels, as defined in Table 2. Blue bars indicate the integrated radiance around the central wavelength. Red bars show the decadal change, augmented by a factor 50. Labels under the diagram are sums of the 10-year variation in Wm-2 for the solar, water vapor, infrared and CO2 absorption spectral regions. Percentages in the bottom line are marked in red for channel changes above 1%.
Figure 2.
Relative radiance change from 2005 to 2024 for the eleven MSG channels, as defined in Table 2. Blue bars indicate the integrated radiance around the central wavelength. Red bars show the decadal change, augmented by a factor 50. Labels under the diagram are sums of the 10-year variation in Wm-2 for the solar, water vapor, infrared and CO2 absorption spectral regions. Percentages in the bottom line are marked in red for channel changes above 1%.
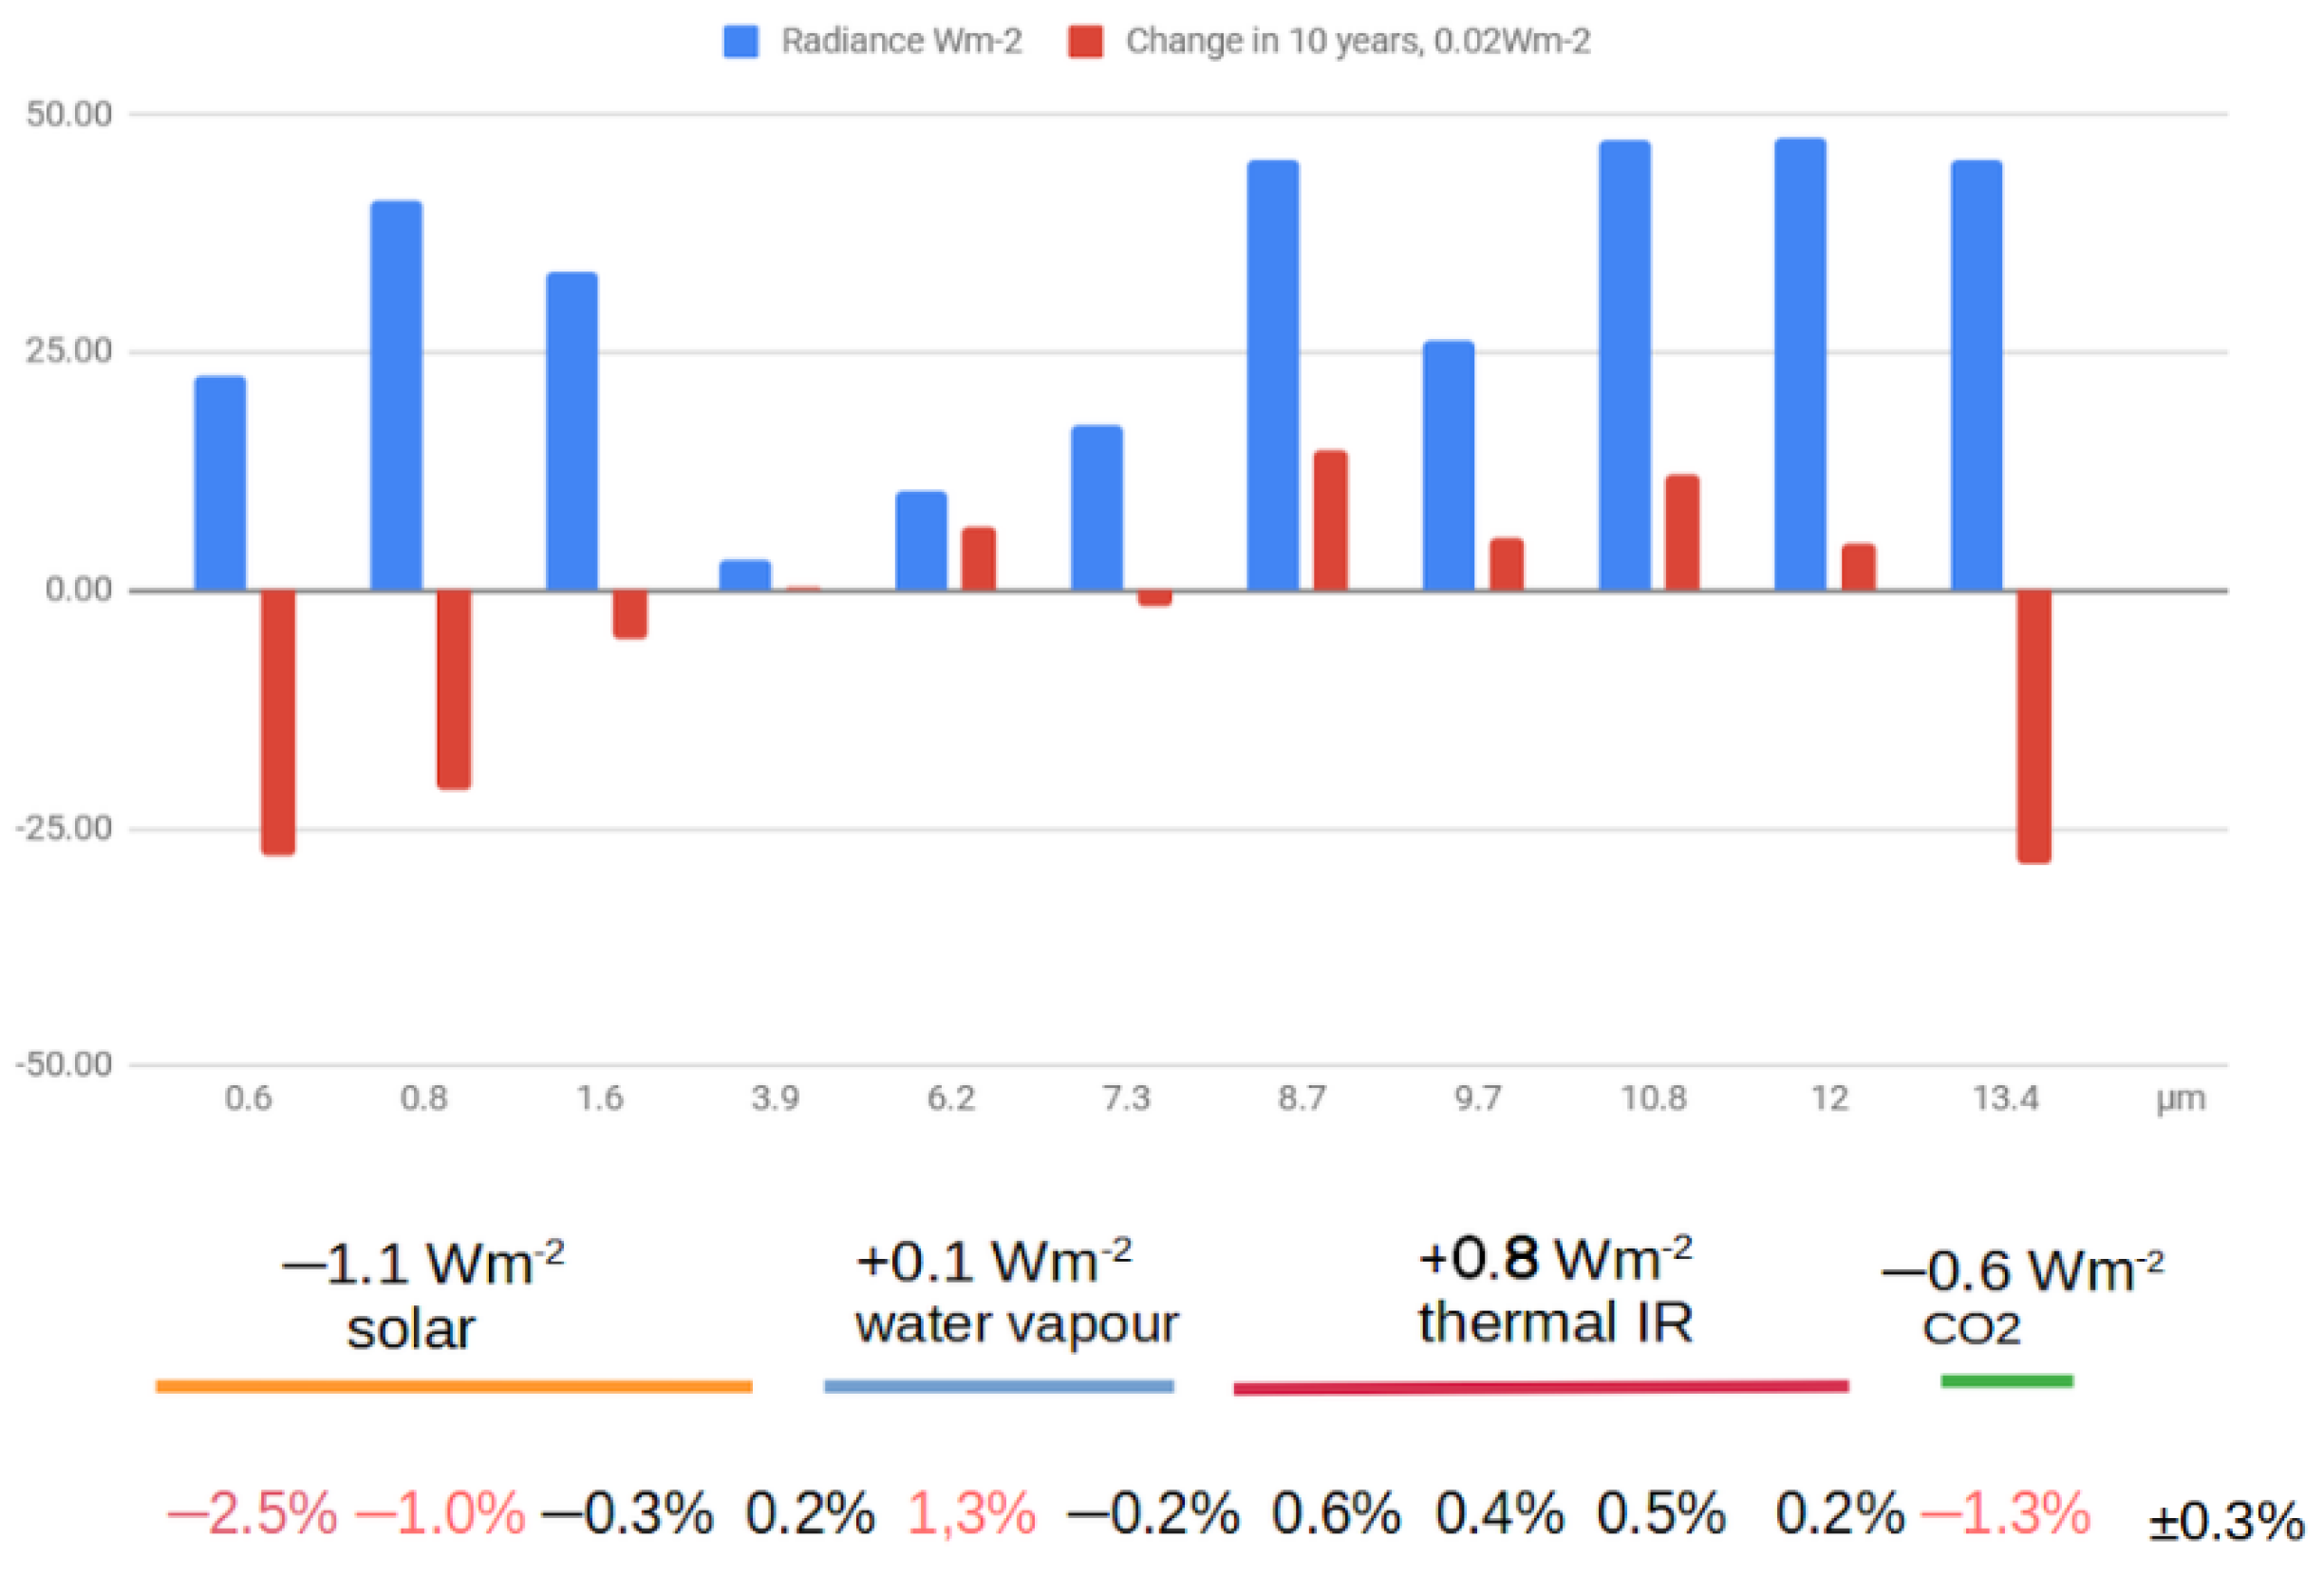
Figure 3.
Decadal trend in percentage according to the color scale. (Left, for channel 0.6 mm) Orange hues indicate a decrease in radiance to space, cyan hues an increase. Pixel color intensity indicates the average pixel reflectivity, from the error margin 0.02 (deep blue) to 0.50 (yellow). (Right, for channel 10.8 µm) Orange hues mean an increase in the outgoing longwave radiation (OLR), green hues a decrease, with average pixel intensity indicating 10.8 µm brightness temperature. From 275 K, in yellow to 300 K in black.
Figure 3.
Decadal trend in percentage according to the color scale. (Left, for channel 0.6 mm) Orange hues indicate a decrease in radiance to space, cyan hues an increase. Pixel color intensity indicates the average pixel reflectivity, from the error margin 0.02 (deep blue) to 0.50 (yellow). (Right, for channel 10.8 µm) Orange hues mean an increase in the outgoing longwave radiation (OLR), green hues a decrease, with average pixel intensity indicating 10.8 µm brightness temperature. From 275 K, in yellow to 300 K in black.
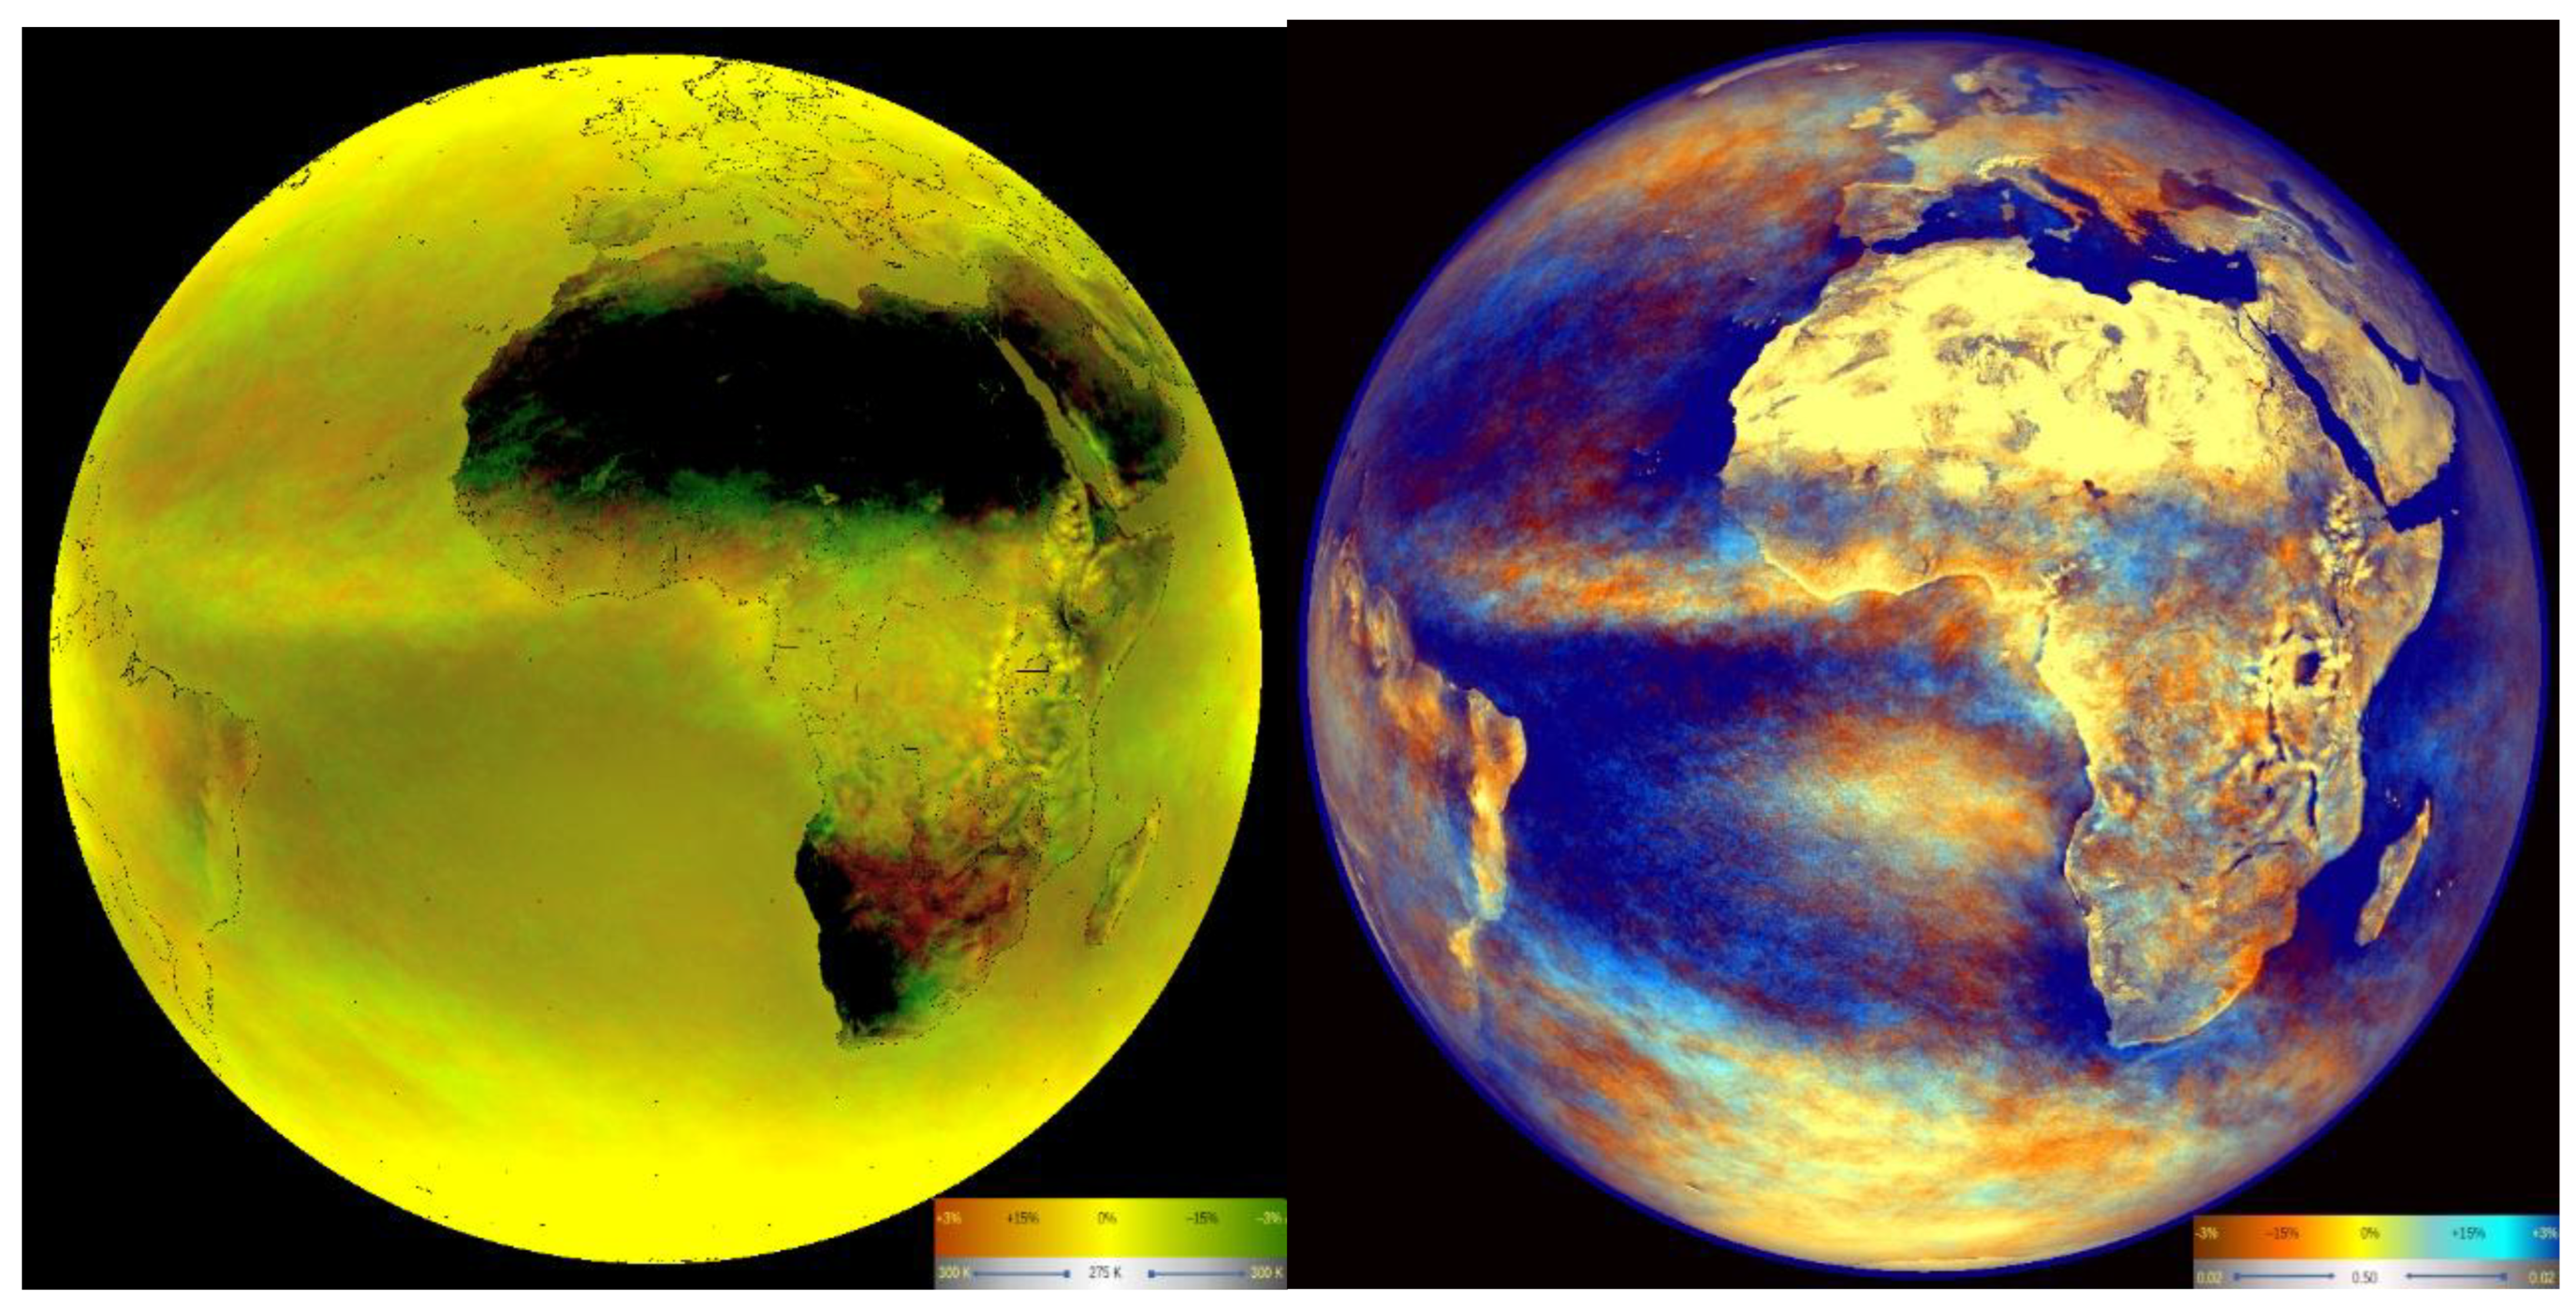
Figure 4.
Geographic diagrams of the cloud change. In all three images pixels are represented by dots in a reflectivity scale from 3% (blue dots) to 60% (red dots). (Top) For each of the 60 square regions in which we divided the MFoV, the graph relates average brightness temperature at 10.8 µm in ten years (vertical axis) with decadal relative change in 0.6 µm reflectivity. See the inset lower-right for the limits. For instance, for Mauritania most pixels are very reflective and warm, and tend to lose 0.6 µm radiance in the ‘recent’ decade. (Middle) The regional graph dots connect the pixel warming or cooling (vertical axis) with the relative variation in reflectivity at 0.6 µm (horizontal). E.g., a vertical value of +1% implies a net decadal increase in the imbalance equivalent to 1% of the solar constant. (Bottom) Connection of change in the split window (channel 10.8 µm – channel 12.0 µm) brightness temperature difference (vertical) with its average value in the pixel (horizontal). Further explanation in the text.
Figure 4.
Geographic diagrams of the cloud change. In all three images pixels are represented by dots in a reflectivity scale from 3% (blue dots) to 60% (red dots). (Top) For each of the 60 square regions in which we divided the MFoV, the graph relates average brightness temperature at 10.8 µm in ten years (vertical axis) with decadal relative change in 0.6 µm reflectivity. See the inset lower-right for the limits. For instance, for Mauritania most pixels are very reflective and warm, and tend to lose 0.6 µm radiance in the ‘recent’ decade. (Middle) The regional graph dots connect the pixel warming or cooling (vertical axis) with the relative variation in reflectivity at 0.6 µm (horizontal). E.g., a vertical value of +1% implies a net decadal increase in the imbalance equivalent to 1% of the solar constant. (Bottom) Connection of change in the split window (channel 10.8 µm – channel 12.0 µm) brightness temperature difference (vertical) with its average value in the pixel (horizontal). Further explanation in the text.
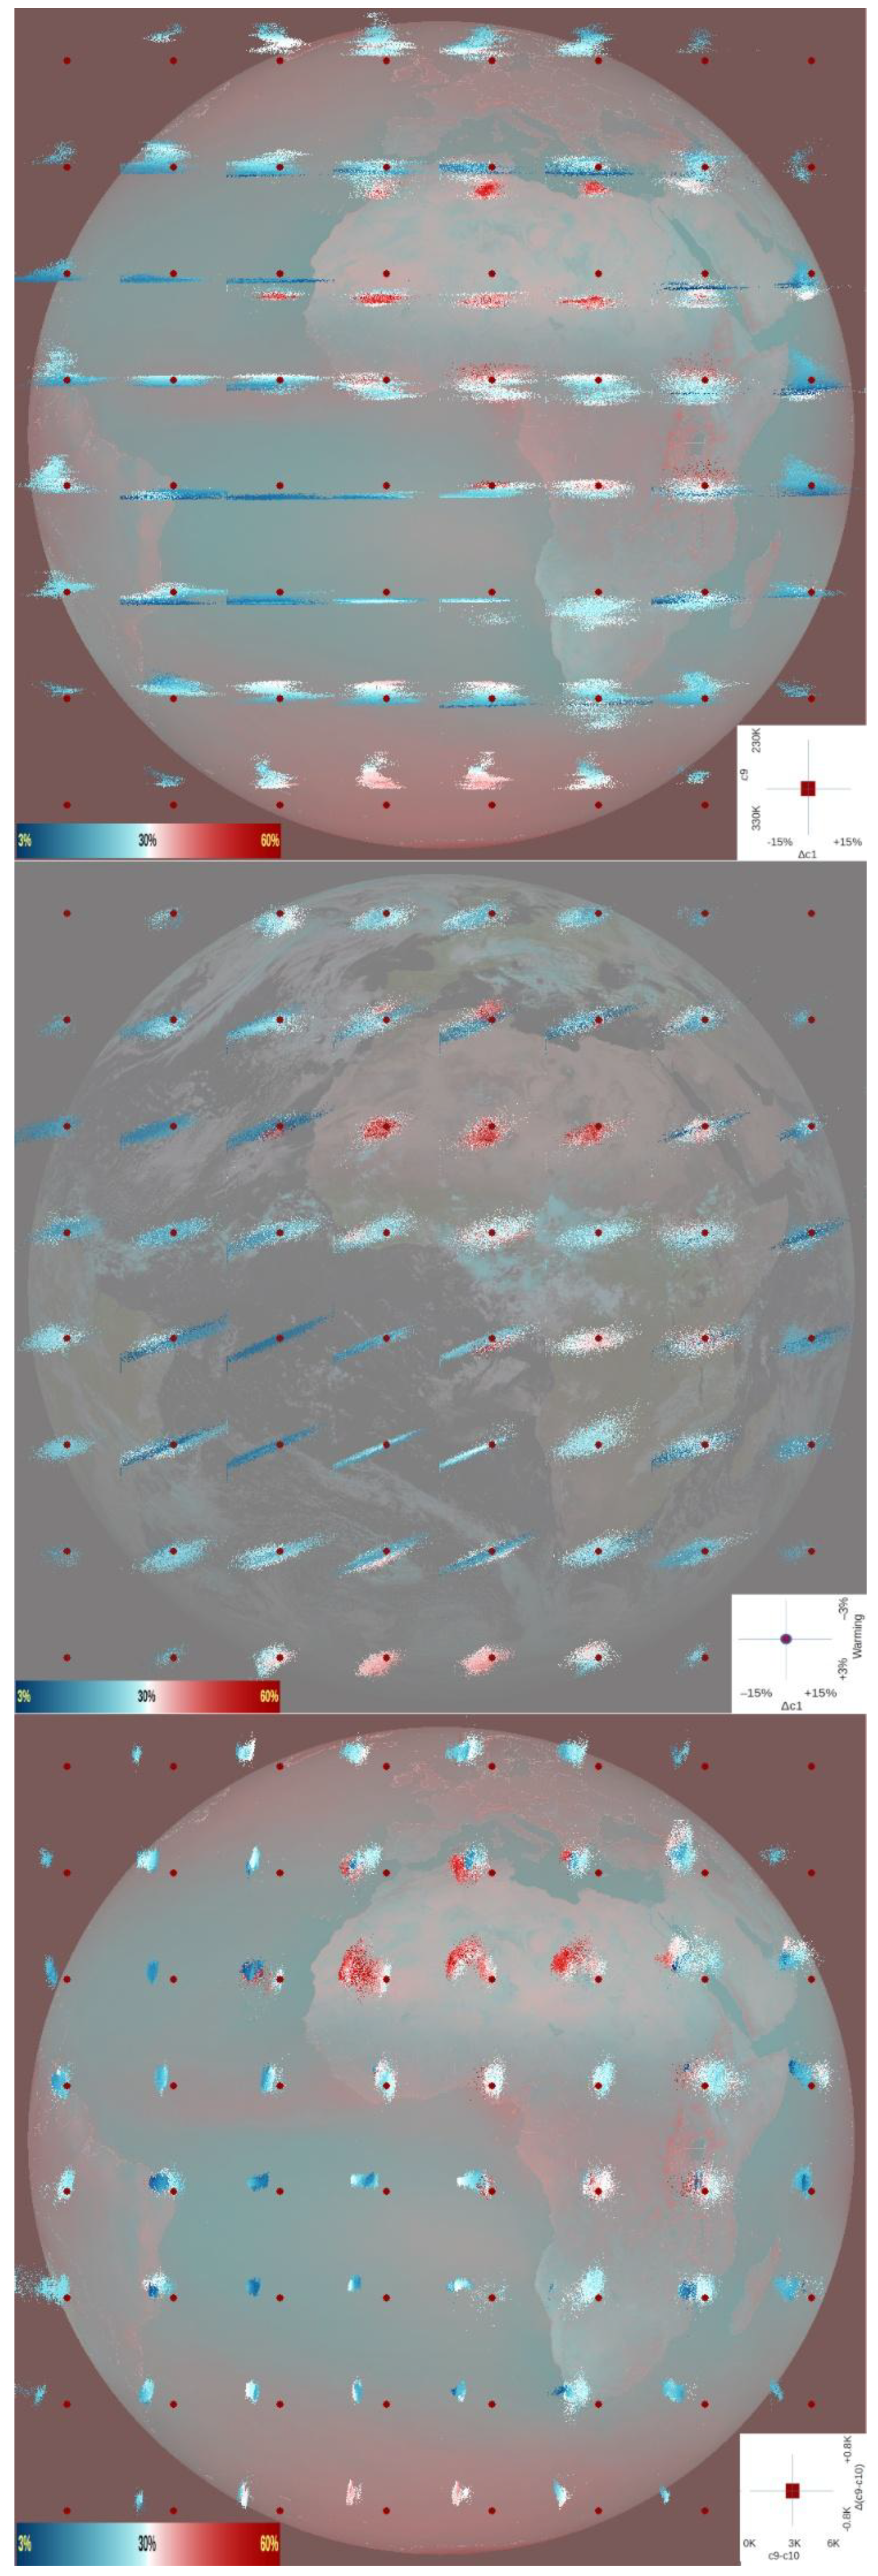
Figure 5.
For sea or lake pixels, (left) average value in the last decade of the sea surface temperature (SST). (Right) Change in SST in a decade.
Figure 5.
For sea or lake pixels, (left) average value in the last decade of the sea surface temperature (SST). (Right) Change in SST in a decade.
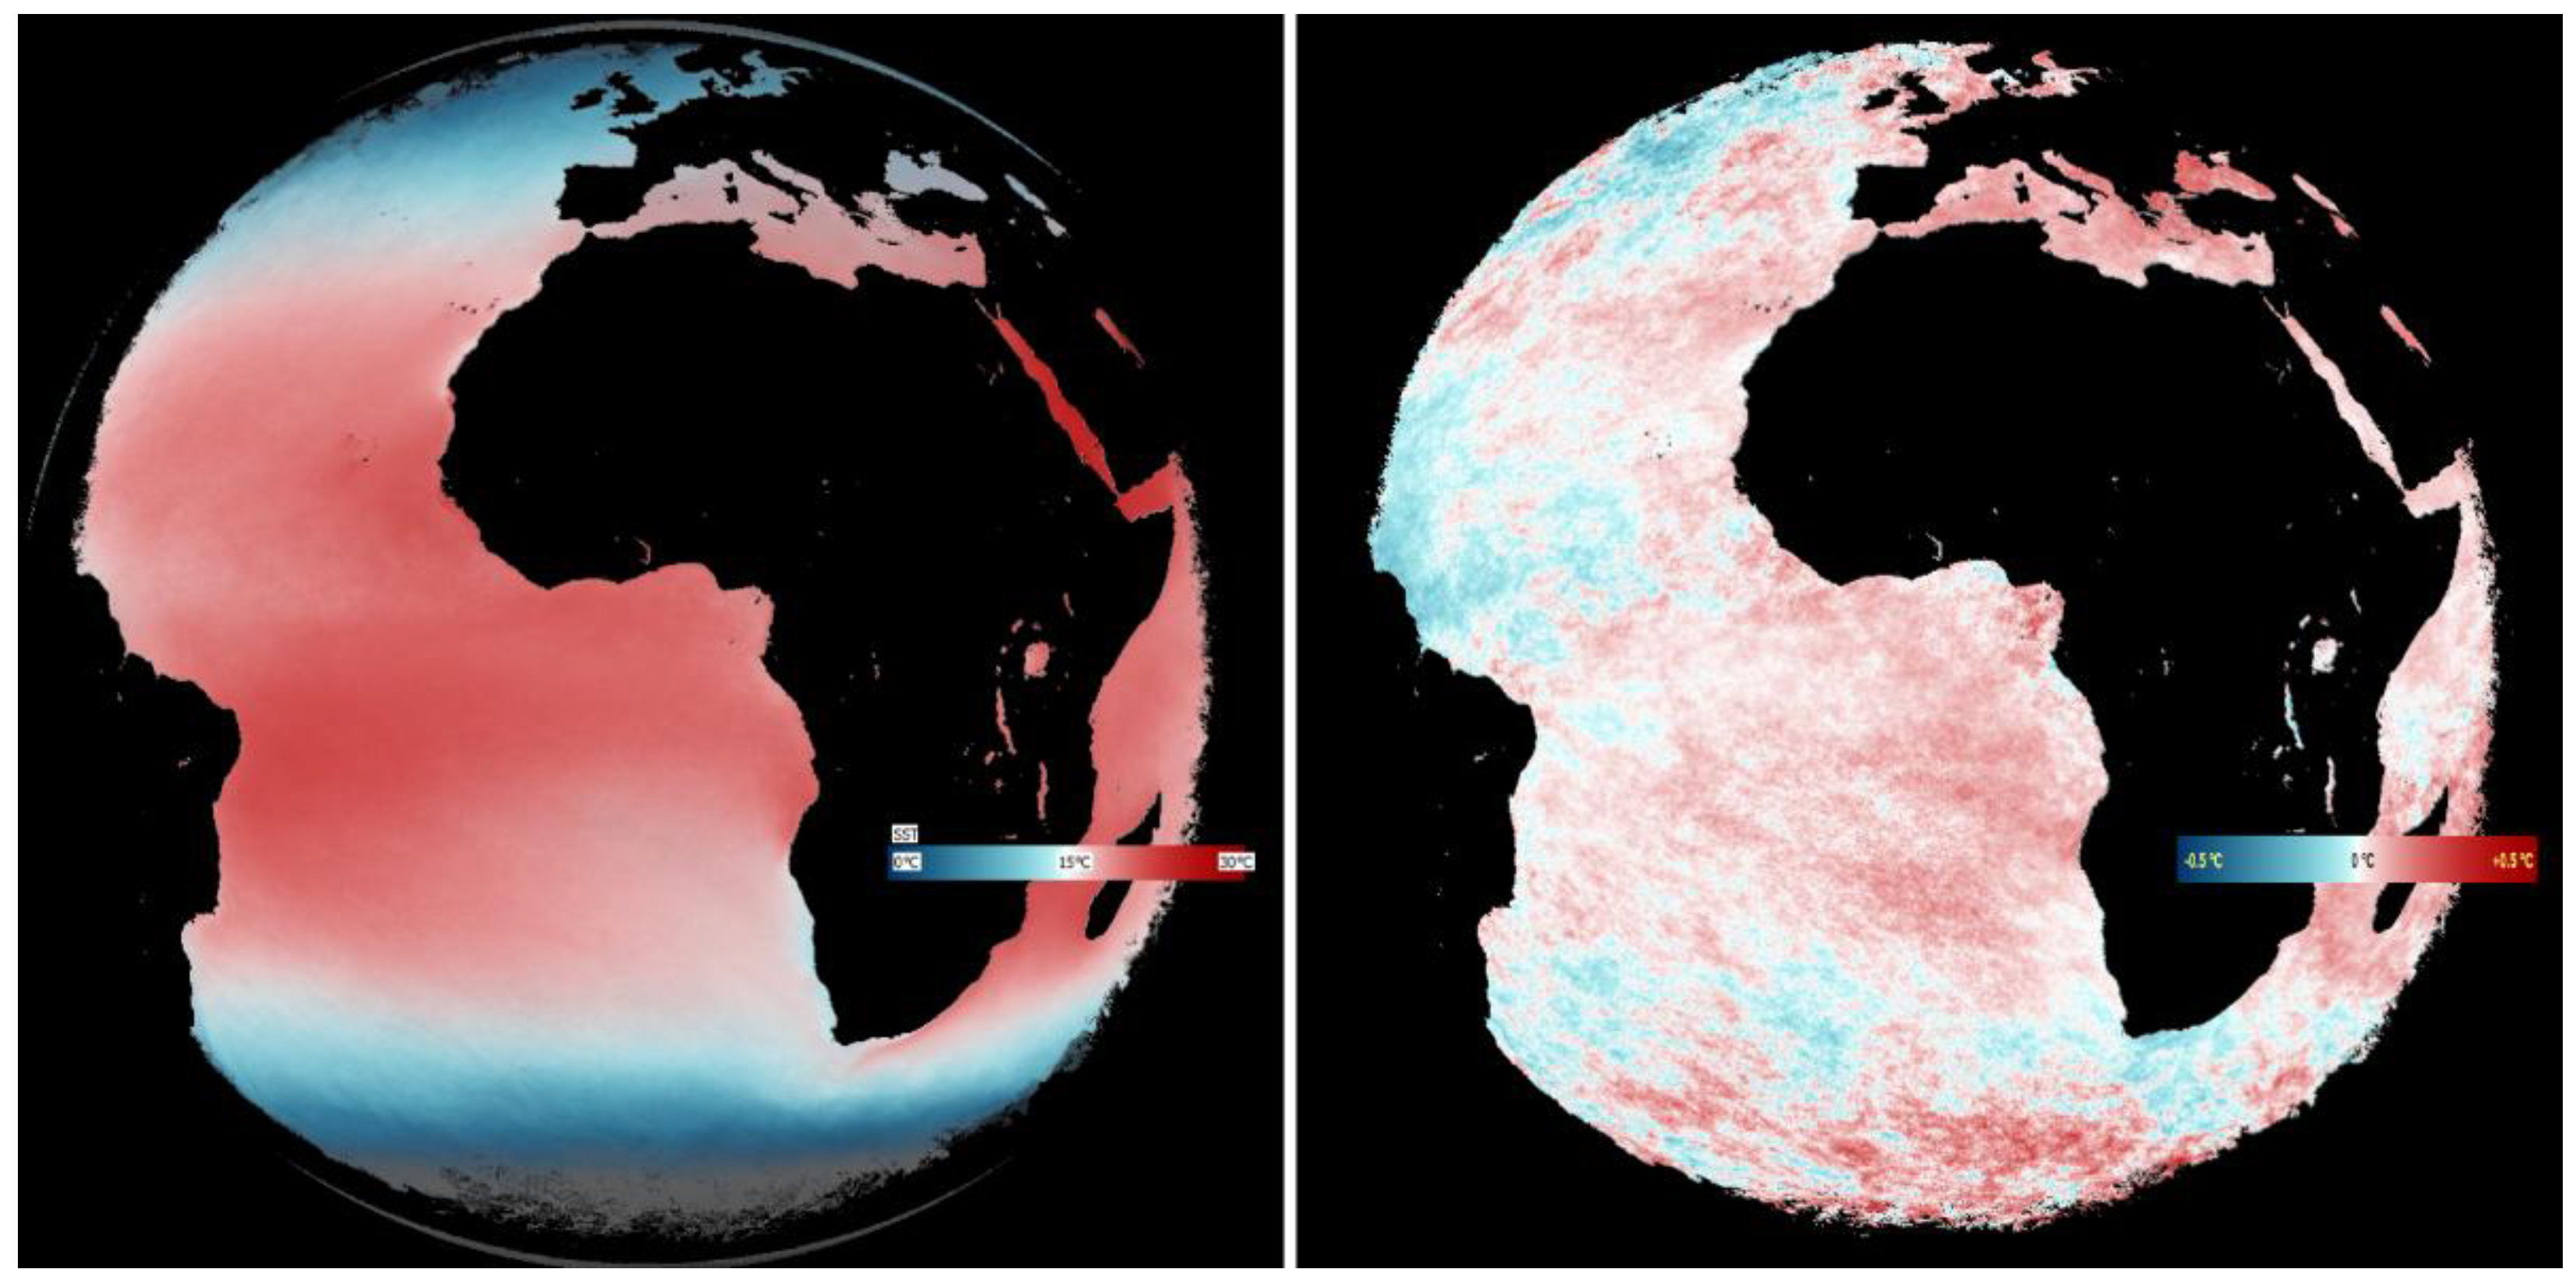
Figure 6.
(Left, A) Evolution of the climate imbalance (2006-2011) in blue, compared with the SST under the MFoV in red, showing the precise correspondence between the positive phases of the imbalance (from October to February) and the SST increase, and similarly for other years. (Right, B) On a longer time scale (2006-2024), with one-year running-averaged data, displaying the modest correlation between SST and imbalance. At the horizontal axes, the location of the year numeral marks the start of that year.
Figure 6.
(Left, A) Evolution of the climate imbalance (2006-2011) in blue, compared with the SST under the MFoV in red, showing the precise correspondence between the positive phases of the imbalance (from October to February) and the SST increase, and similarly for other years. (Right, B) On a longer time scale (2006-2024), with one-year running-averaged data, displaying the modest correlation between SST and imbalance. At the horizontal axes, the location of the year numeral marks the start of that year.
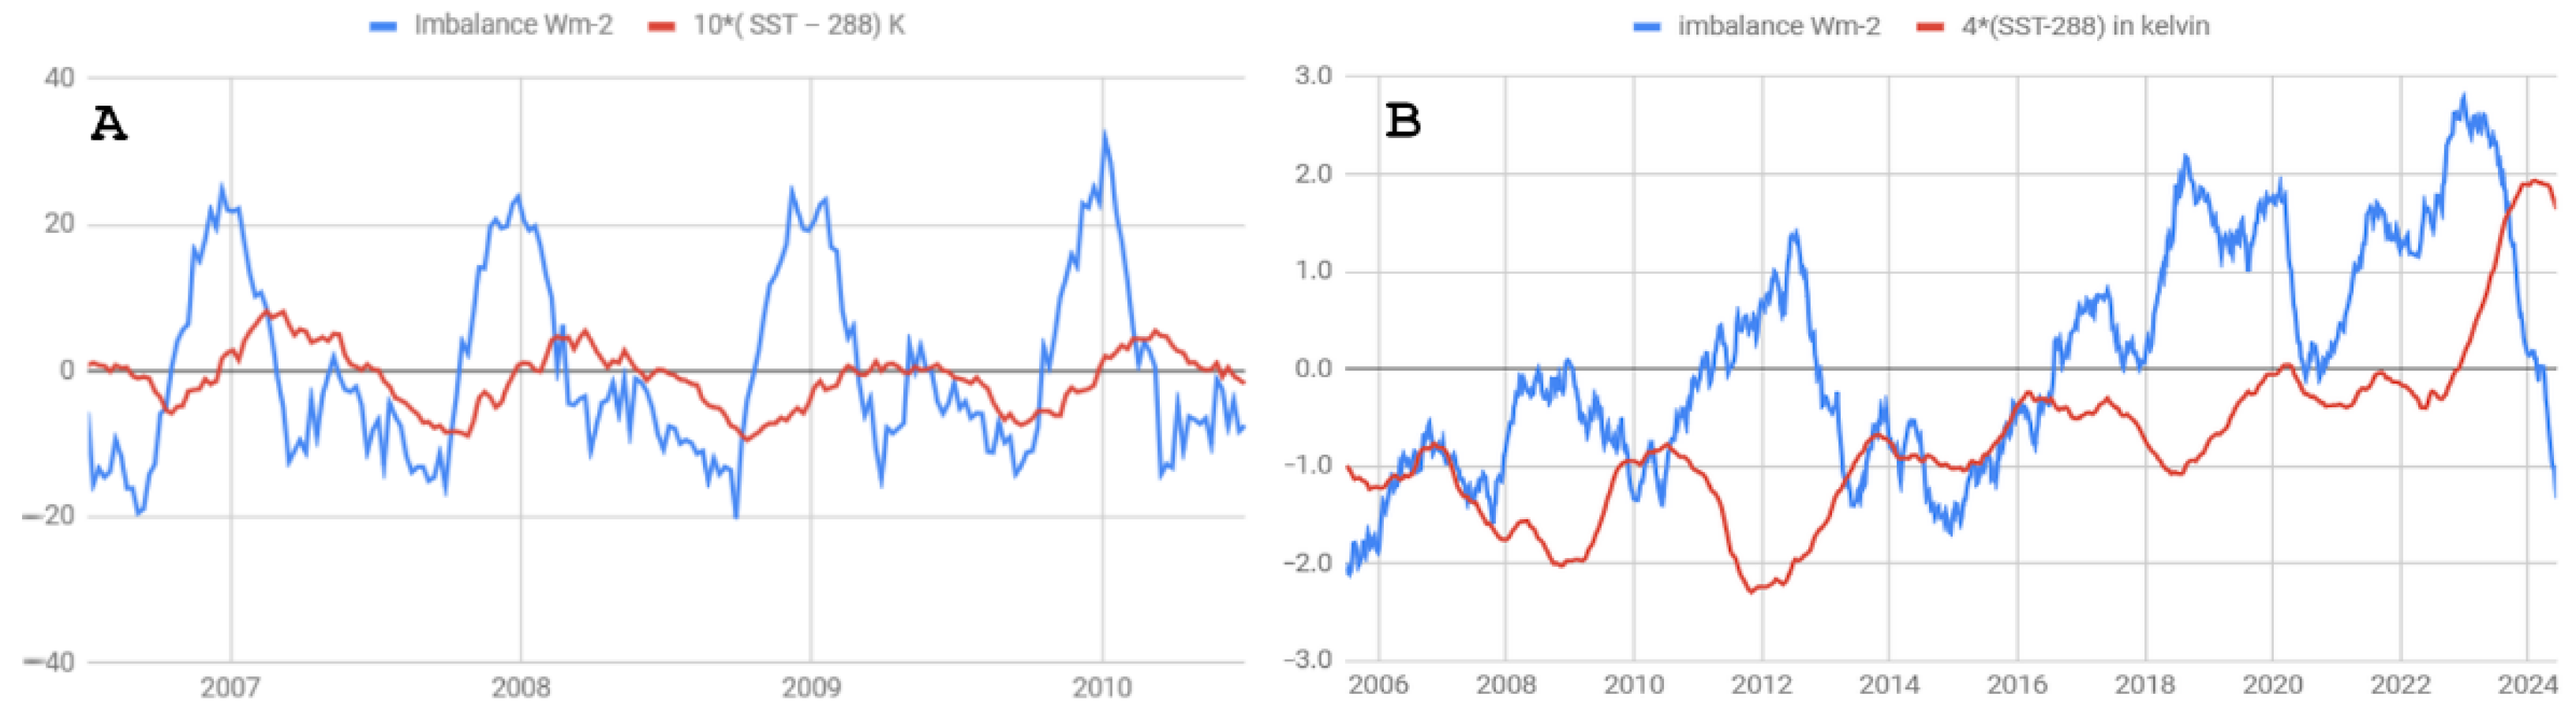
Figure 7.
Evolution from 2020 to mid 2025 of the average SST for separate regions within the MFoV, and for the whole region (‘total’).
Figure 7.
Evolution from 2020 to mid 2025 of the average SST for separate regions within the MFoV, and for the whole region (‘total’).
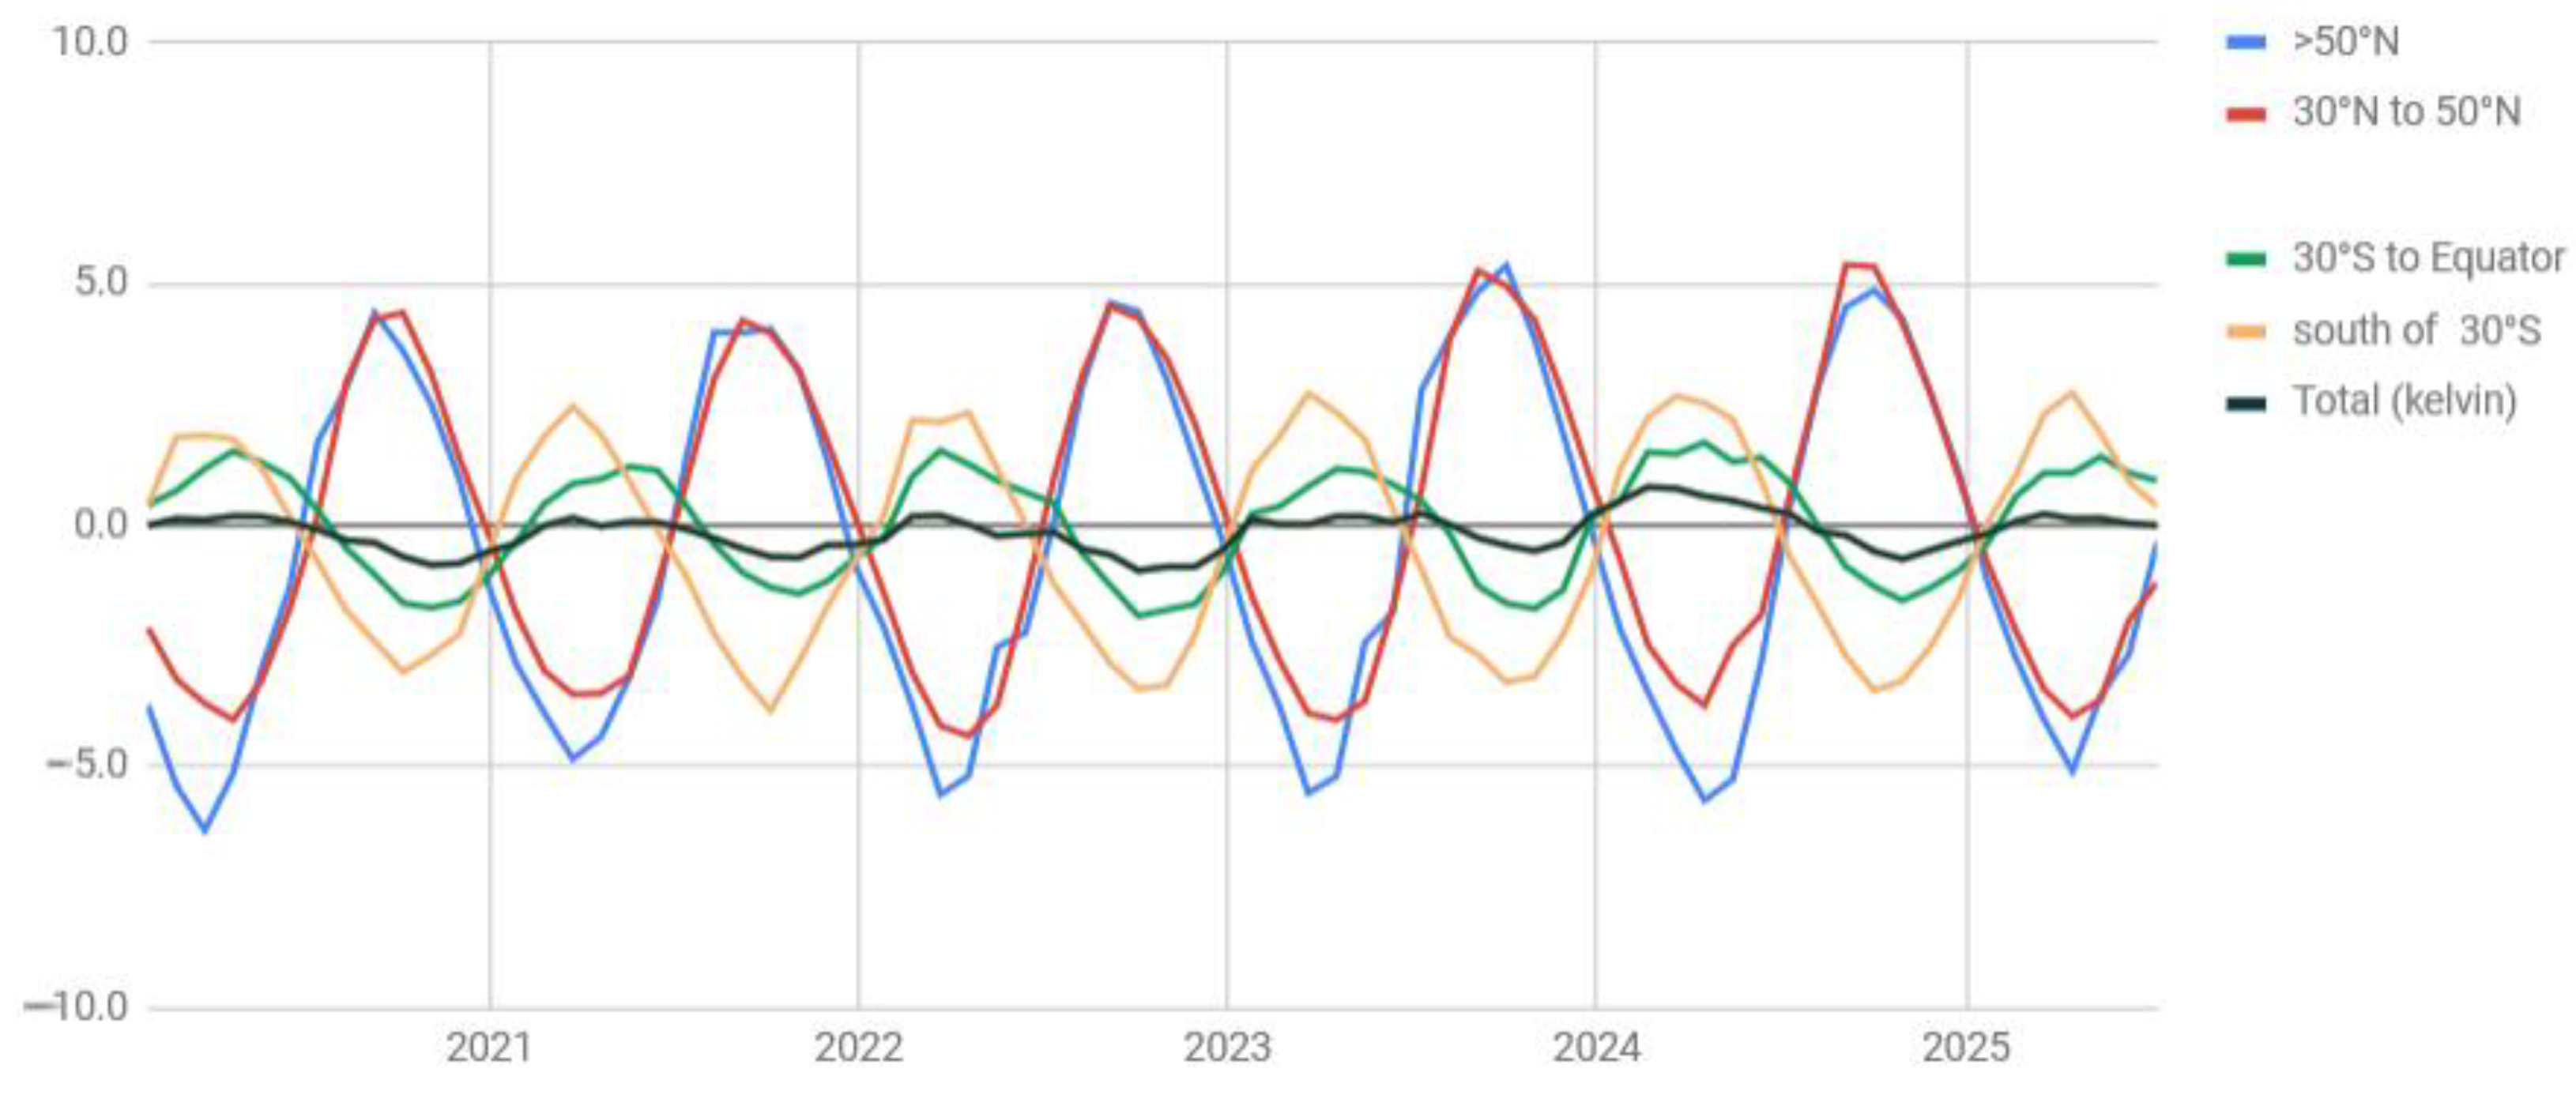

Table 1.
Data set composition (European dates format).
| Meteosat dataset | points | periodicity | start date | end date |
|---|---|---|---|---|
| remote | 522 | weekly | 31.12.2004 | 26.12.2014 |
| recent | 522 | weekly | 02.01.2015 | 27.12.2024 |
Table 2.
Characteristics of Meteosat SEVIRI channels (labeled from 1 to 11) in columns 1st to 4th. Estimates of average values of the spectral radiance (5th column) per channel. Wavenumber-integrated values (in Wm-2) within the channel interval in the 6th column). Integrated radiance variation in 10 years (spectral values for the average difference of the observed pairs, in the 7th column. The 8th (last) column groups the integrated variations by spectral region, from the 7th column.
Table 2.
Characteristics of Meteosat SEVIRI channels (labeled from 1 to 11) in columns 1st to 4th. Estimates of average values of the spectral radiance (5th column) per channel. Wavenumber-integrated values (in Wm-2) within the channel interval in the 6th column). Integrated radiance variation in 10 years (spectral values for the average difference of the observed pairs, in the 7th column. The 8th (last) column groups the integrated variations by spectral region, from the 7th column.
| Domain | Meteosat Channel | Central Wavelength µm | Channel boundaries µm |
Spectral radiance 10-3 Wm-2 sr-1 (cm-1)-1 |
Integrated radiance Wm-2 |
10-year change by channel Wm-2 |
Change by domain Wm-2 |
|---|---|---|---|---|---|---|---|
| solar | 1 | 0.64 | 0.56—0.71 | 3.91 | 22.7 | –0.56 | |
| solar | 2 | 0.81 | 0.74—0.88 | 4.99 | 41.1 | –0.42 | sum solar = –1.07 |
| solar | 3 | 1.64 | 1.50—1.78 | 4.01 | 33.5 | –0.10 | (channels 1-4) |
| solar+infrared | 4 | 3.92 | 3.48—4.36 | 0.83 | 3.2 | 0.01 | |
| water vapor | 5 | 6.25 | 5.35—7.15 | 3.29 | 10.6 | 0.14 | sum WV = 0.11 |
| water vapor | 6 | 7.35 | 6.85—7.85 | 14.32 | 17.4 | –0.03 | (5-6) |
| infrared window | 7 | 8.7 | 8.30—9.10 | 51.72 | 45.4 | 0.30 | |
| infrared ozone | 8 | 9.66 | 9.38—9.94 | 43.82 | 26.5 | 0.11 | sum IR = 0.76 |
| infrared window | 9 | 10.8 | 9.80—11.80 | 86.80 | 47.3 | 0.25 | (7-10) |
| infrared window | 10 | 12.0 | 11.00—13.00 | 98.46 | 47.8 | 0.10 | |
| CO2 absorption | 11 | 13.4 | 12.40—14.40 | 80.37 | 45.2 | –0.58 | CO2 = –0.58 (11) |
Table 3.
Evaluation of the data and methods used in the study.
| Strength | Limitation | |
| Source radiance data (SEVIRI) | High radiance accuracy after calibration and inter-calibration | Only for Meteosat field of view, not whole world surface |
| Spectral integration | More accuracy gained through averaging | Poor representation of SEVIRI channels in parts of the spectrum, e.g., above 15 µm |
| Radiation Transfer simulation | Calibration based in CO2 concentrations from other reliable sources | Disregards cross absorption effects by several gases |
| Temporal data sampling | Large weekly independence, ENSO-Niño neutral on averages of two periods | Potentially exposed to multi-year anomalies in the large MFoV region |
| Connection to climate | Immediate connection of satellite radiances to climate variables, cloud and gas | Too short a period (20 years) for sound climate conclusions or sustained trends |
| Contribution to similar studies | Conclusions on a wider spectral basis than in other studies (e.g., Loeb [13]) | Discrepancies on the cloud evolution and fluctuation compared with other studies |
| Future analyses | Easy translation to sub-regional trends in brightness temperatures | Geographical coverage limited to MFoV, requiring extra use of polar satellites (LEO) for a global analysis |
Disclaimer/Publisher’s Note: The statements, opinions and data contained in all publications are solely those of the individual author(s) and contributor(s) and not of MDPI and/or the editor(s). MDPI and/or the editor(s) disclaim responsibility for any injury to people or property resulting from any ideas, methods, instructions or products referred to in the content. |
© 2025 by the authors. Licensee MDPI, Basel, Switzerland. This article is an open access article distributed under the terms and conditions of the Creative Commons Attribution (CC BY) license (http://creativecommons.org/licenses/by/4.0/).
Copyright: This open access article is published under a Creative Commons CC BY 4.0 license, which permit the free download, distribution, and reuse, provided that the author and preprint are cited in any reuse.