Submitted:
27 October 2025
Posted:
28 October 2025
You are already at the latest version
Abstract
Problematic weight control behaviors during adolescence are associated with an in-creased risk of chronic obesity. Understanding how adolescents with obesity respond to body-related visual cues may offer insights into underlying motivational deficits. This ex-perimental pilot study employed a peripherally measured startle reflex paradigm to as-sess the involuntary emotional responses to images of underweight, normal-weight, and overweight bodies. Twenty female adolescents with obesity and 21 normal-sized control subjects between 14 and 21 years of age were presented with photos of female bodies. Im-ages from the International Affective Picture System served as reference material. The Self-Assessment Manikin was used as subjective measure, while startle reflex magnitude and skin conductance response served as objective measures. A significant interaction emerged for body-related stimuli. In the normal-weight group, underweight and over-weight body images elicited increased skin conductance responses (indicative of height-ened attention) and potentiated startle reflexes (indicative of behavioral avoidance). In contrast, adolescents with obesity exhibited a general physiological down-regulation across all body image categories, suggesting a dysfunction in motivational processing. These findings may reflect reduced emotional salience of body-related cues, potentially undermining intrinsic weight loss motivation. Future research should investigate the neurobiological basis and clinical significance of this response pattern.
Keywords:
adolescents
; body image
; psychophysiology
1. Introduction
1.1. Theoretical Background
Due to the risk of chronicity, problematic weight control behaviors during adolescence are associated with particularly severe somatic [1] and psychological harm [2,3,4]. Between 1975 and 2016, the proportion of overweight children and adolescents increased from 0.7% to 5.6% among girls and 0.9% to 7.8% among boys [5]. A further increase occurred during the COVID pandemic [6], with The Lancet of Gastroenterology and Hepatology [7] even referring to it as a ‘second pandemic’. Approximately 80% of overweight adolescents will remain over-sized into adulthood [8], and according to the Look AHEAD study [9], over 75% of participants who achieved a weight loss of more than 7.5% were unable to maintain this success for longer than four years. Over-eating and reduced physical activity are known as main causes [10], but the underlying motivational mechanisms are still unclear.
Self-report studies suggest that adolescents with obesity experience a broad range of motivational drivers and barriers related to weight loss [11,12]. Motivators span both the incentive system (e.g., attaining a socially accepted body shape) and the behavioral avoidance system (e.g., avoiding body-related teasing or bullying). However, one of the most commonly cited barriers is a lack of internal motivation or self-discipline – a finding consistent across both adolescent and adult populations [13].
To better understand the involuntary components of weight loss motivation, stimulus-response paradigms have been used, particularly those that measure physiological reactions to emotionally charged stimuli. Among these, the affective startle reflex paradigm has demonstrated strong validity [14,15]. The startle reflex – a rapid, involuntary blink response to sudden stimuli such as loud noise – is modulated by affective valence: It is potentiated in negative emotional states and inhibited during positive emotional experiences [14,15], indicating an activation of the behavioral avoidance vs. behavioral approach system [16]. The reflex is primarily controlled by the nucleus reticularis pontis caudalis in the brainstem and is modulated by activation of subcortical emotional structures, such as the amygdala and nucleus accumbens [17]. For example, exposure to aversive stimuli reliably increases amygdala activity [18,19] and potentiates the startle reflex response [20,21], while appetitive stimuli activate dopaminergic systems in the nucleus accumbens [22] and inhibit the reflex [21].
Following Omondi and Freysteinson [23], the sight of a slim body in the mirror can be used as an incentive for weight regulation through food restriction or more physical activity, whereas the sight of an extremely oversized body may serve as an aversive motivator. Healthy individuals generally show aversive physiological responses (e.g., potentiated startle reflex or increased mimic muscle activity indicating disgust) to both overweight [24,25,26,27,28] and underweight bodies [24,25,27]. In contrast, normal-weight bodies were found to be associated with positive evaluations [29,30] and inhibited startle responses [25], suggesting a more positive, incentive-based valuation. This pattern is believed to support healthy body weight regulation.
In individuals with anorexia nervosa, an exaggerated anti-fat bias has been observed on both explicit and implicit levels [29,31]. Neuroimaging findings support these observations, with increased amygdala and medial prefrontal cortex activation during exposure to extreme overweight stimuli [32,33]. Additionally, Reichel et al. [25] found an appetitive response to extremely underweight body images only on implicit measures such as the startle reflex.
In obesity, preliminary evidence indicates that insulin resistance may affect dopaminergic reward pathways [34,35], controlling incentive motivation [22]. Alterations in amygdala function and the hypothalamic-pituitary-adrenal axis, controlling avoidance motivation [18,19], have also been observed in individuals with higher Body Mass Index (BMI) [36,37,38,39]. However, experimental studies investigating motivation in individuals with obesity by using stimulus-response paradigms are sparse and have mainly focused on food cues. While some studies report enhanced reward activation to food stimuli and a positive correlation with future BMI [40,41], others do not [42,43], with age often acting as a moderator [44]. Research using body images as stimuli is limited, often focusing on cognitive evaluations (e.g., via affective priming) [29,30], adult samples, or individuals with binge eating disorder [45,46,47].
Degner et al. [29] and Schwarz [30] found less negative (or even slightly positive) evaluations of overweight bodies in obese adults via affective priming. However, these studies measured attitudes (´liking´) rather than motivational salience (´wanting´) [48,49]. Leehr et al. [50], using a gaze-cue paradigm, found reduced visual attention to body images in obese adults, especially toward normal- and overweight figures. Yet, no study to date has evaluated these attentional effects using peripheral physiological measures such as skin conductance response (SCR).
1.2. Aims
To address these gaps, the present study employed a startle reflex paradigm combined with skin conductance recording to examine implicit emotional and attentional responses to underweight, normal-weight, and overweight body stimuli in obese versus normal-weight adolescent females. This design allowed assessment of involuntary motivational processing through both valence-related (startle reflex [14,15]) and attention- related (SCR [51]) physiological measures.
1.3. Hypotheses
- Hypothesis 2: Obese adolescents will report lower arousal and exhibit reduced SCR to normal- and overweight body images, reflecting diminished attention, as observed in eye-tracking studies [50].
- Hypothesis 3: No specific hypotheses were made regarding underweight body images, as this is the first study to examine responses to these stimuli in adolescents with obesity.
2. Materials and Methods
2.1. Participants
Forty-four female adolescents and young adults (20 obese participants, 24 healthy normal-weight participants) aged 14 to 21 years were recruited for the study. Both groups were matched for age, gender, and level of education. All psychiatric diagnoses were based on ICD-10 criteria and were established by experienced clinical raters.
Sample size calculation. The sample size calculation was based on study [52]. In that project, the subjective and physiological processing of images depicting extremely underweight bodies was investigated in two groups of female adolescents (anorexia nervosa vs. healthy controls). The authors reported high effect sizes for self-report data and low effect sizes for physiological data. Assuming an effect size of η² = .14, α = .05, and 1−β (power) = .80, a one-way univariate variance analysis (ANOVA) would require n = 26 per group (N = 52) to detect a significant effect. Due to drop outs during the measurement period, our final sample size was slightly below this target; accordingly, the limited power for small effects should be acknowledged as a limitation.
Screening questionnaires. The following screening questionnaires were used: Structured Interview for Anorexic and Bulimic Disorders (SIAB) [52], Composite International Diagnostic Interview (CIDI) [53], Inventory of Eating Behavior and Weight Problems (IEG) [54], and Toronto Alexithymia Scale (TAS) [55]. Adolescents with neurological diseases (e.g., history of seizures), severe hearing or visual impairments, medications that influence the startle reflex response [17], recent medication changes within the last two weeks, or insufficient knowledge of German were excluded from the study.
Patient sample. Inclusion criteria for patients included a body weight above the age-corrected 90th BMI percentile. All patients participated in the outpatient therapy program of the Interdisciplinary Obesity Center at Charité Universitätsmedizin Berlin. Patients with documented severe mental disorders (e.g., drug abuse, dementia, schizophrenic psychosis, and intellectual disability) were excluded from the study.
Control sample. For the control sample, only healthy individuals with a body weight between the age-corrected 10th and 90th BMI percentiles and no psychiatric diagnoses according to ICD-10-GM were recruited. Recruitment methods included advertisements in newspapers, newsletters, and postings on university campuses and in Berlin youth leisure centers. Demographic and clinical characteristics of the sample are summarized in Table 1.
2.2. Procedure
Preparation. The authors declare that this study was performed in line with the principles of the Declaration of Helsinki. Approval was granted by the Ethics Committee of the Charite´ University Medicine Berlin with the application number EA2/140/08. Written informed consent was obtained from all individual participants included in the study. For minor participants, written consent was also obtained from their legal guardians. Demographic data were collected, and screening questionnaires were completed. Participants who did not meet the inclusion criteria were excluded from further steps. Participants were then asked to complete body estimation tasks and questionnaires assessing weight- and figure-related attitudes.
Pre-test procedure. Immediately before testing, situational factors such as mood, arousal, hunger, body satisfaction, and motivation to lose weight were assessed using Visual Analogue Scales (VAS).
Stimulus-response experiment. Each participant was placed 1.5 meters away from a 1.5 × 1.7 meter computer screen. Electrodes were attached, and picture presentation and psychophysiological measurements commenced. To elicit the startle reflex, picture presentation was combined with irregularly occurring sounds (white noise, 95 dB, continuous rise time). Pictures accompanied by sound were used to record the electromyographic startle response (electromyographic activity, EMG), while images presented without sound were used to record electrodermal activity (EDA) parameters to prevent sound interference. At the beginning of the measurement period, three startle reflex- triggering sounds were played to minimize potential habituation effects. The 30 images were then presented in alternating sequences with black screens in two pseudo-randomized orders, divided into two balanced blocks separated by a 15-minute break. Each image was displayed for 12 seconds. The duration of the black screens varied randomly between 12, 14, 16, and 18 seconds. Three-quarters of the images in each category and one-quarter of the black screens were paired with startle sounds. To prevent anticipation effects, the sounds occurred at variable times (3.5, 4.0, and 4.5 seconds after the start of the trials). The time interval between the end of trial n and the beginning of trial n + 1 was defined as the inter-trial interval (12 seconds).
Post-test procedure. At the end of the experiment, half of the images from each category were presented again for subjective ratings. Following this step, situational factors such as mood, arousal, hunger, body satisfaction, and motivation to lose weight were reassessed via VAS. Upon request, participants received individual feedback on their results.
2.3. Stimulus Material
For the experimental part of the study, 30 color photographs (1024 × 768 pixels) were presented. The stimulus material consisted of three affective standard picture categories (5 negative, 5 neutral, and 5 positive) and three body picture categories (5 extremely underweight, 5 normal-weight, and 5 extremely over-weight).
Affective standard pictures. Pictures from the International Affective Picture System (IAPS) [56,57] served as affective standard pictures (mean values and standard deviations based on Self-Assessment Manikin [SAM] ratings [58] in brackets): Negative: Image Nos. 2095, 2800, 2811, 6230, 6540, 6550, 9140, 9300, 9301, 9571, 9800, 9810 (mean SAM valence: 1.8 ± 1.33; mean SAM arousal: 6.8 ± 2.22); neutral: Image Nos. 2190, 2200, 2210, 2214, 2215, 2495, 2512, 7006, 7009, 7185, 7187, 7002 (mean SAM valence: 5.1 ± 1.87; mean SAM arousal: 3.1 ± 2.01); positive: Image Nos. 1463, 1710, 4643, 4650, 8040, 8041, 8179, 8180, 8185, 8178, 8490, 8496 (mean SAM valence: 7.3 ± 3.57; mean SAM arousal: 6.1 ± 2.22). Negative and positive pictures were matched for arousal level using SAM scales. Images related to body and food, as well as content unsuitable for young audiences (e.g., blood, mutilation, or age-inappropriate sexual depictions), were excluded from the study.
Body pictures. Whole-body photographs of extremely under-sized, normal-sized, and extremely over-sized individuals were used as body pictures. The images were preselected from so-called ‘Pro-Ana’ websites, which host collections labeled ‘Thinspiration’ (depicting individuals with severe underweight) and ‘Fatspiration’ (depicting individuals with severe overweight), intended to serve as motivational content for further weight loss. From an initial pool of 8,000 retrieved images, a random sample of 50 was drawn. This set was further refined based on expert evaluations, in which the images were assessed for visible signs of cachexia and obesity. The remaining 36 images were presented to a group of 100 healthy female students for subjective rating. The 5 × 3 images that received the most extreme ratings (most negative, most exciting, and most deviant from normal weight) were selected for the study. To protect the anonymity of the subjects, full faces were obscured, and relevant areas were digitally edited using Photoshop software. For copyright reasons, these images were not presented at congresses or seminars. It was ensured that these images did not differ from the standard stimuli in terms of key features, e.g., size, format, or background.
2.4. Instruments
2.4.1. Self-Assessment-Manikin
Subjective emotional reactions were assessed using the valence (from 1: negative to 9: positive, reversed for better comparability) and arousal scale (from 1: low arousal to 9: high arousal) of the SAM by Bradley and Lang [58]. Additionally, five single emotion scales were used to assess picture-elicited admiration, fear, disgust, pity vs. neutral feelings on a dichotomous (yes/no) scale, with multiple responses allowed.
2.4.2. Physiological Measures
The LabLinc V Tower from Coulbourn Instruments was used to record physiological reactions and generate the startle sound. This modular system includes connections for EMG and EDA as well as an audio module. The Human Startle Reflex System (HMS 500) software from Coulbourn Instruments was used to control data collection and evaluation.
Startle reflex. The eyelid closure component of the startle reflex was recorded using Ag/AgCl miniature electrodes to measure the activity of the left orbicularis oculi muscle (lat. musculus orbicularis oculi). To elicit the startle reflex, a 95-decibel tone (white noise) with a continuous rise time of 50 milliseconds was presented binaurally through headphones, following the recommendations of Blumenthal et al. [59]. The Audio Source Module V85-05 from Coulbourn Instruments was used to generate the sound. The raw EMG signal was recorded and processed using the Isolated Bioamplifier V75-04. Digital sampling began 100 milliseconds before the auditory stimulus onset and ended 400 milliseconds afterward. The signal was sampled at a frequency of 1000 Hertz and filtered using a 30 to 500 Hertz bandpass filter. The raw EMG signal was then aligned and integrated with a time constant of 20 milliseconds. The integrated EMG amplitude was evaluated manually based on magnitude and onset latency. ‘EMG magnitude’ was defined as the difference between peak EMG (highest EMG value within 20 to 150 milliseconds after the noise) and baseline EMG (EMG value within the last 100 milliseconds before) consistent with Blumenthal et al. [59]. Trials were categorized as non-responses and set to zero in the analysis if no reflex response occurred, the EMG amplitude was less than 0.1 microvolt, or the onset latency exceeded 150 milliseconds. Trials were considered missing and removed from analysis if they exhibited an onset latency greater than 20 milliseconds, motion artifacts, or excessive baseline activity.
Skin conductivity. EDA was measured using Ag/AgCl standard electrodes placed on the hypothenar surface of the non-dominant palm. The Isolated Skin Conductance Coupler V71-23, with a time constant of 5000 milliseconds, was used for measurement, with a constant voltage of 0.5 volts applied across the electrodes. Digital sampling began 1000 milliseconds before image onset at a frequency of 10 Hertz and continued for 4000 milliseconds afterward. The EDA waveform was evaluated digitally for SCR based on amplitude and peak latency. ‘SCR amplitude’ was defined as the difference between peak SCR (highest EDA value within 900 to 4000 milliseconds after image onset) and baseline SCR (EDA value within the last 1000 milliseconds before). Trials were categorized as non-responses if the amplitude was below 0.1 microSiemens. Trials with motion artifacts or excessive baseline activity were considered missing and removed from analysis.
2.4.3. Potential Confounding Variables
Situational factors prior to testing, as well as other aspects of body image, were considered potential confounding variables.
Situational factors. To control for situational influences, mood (ranging from -50: very bad to +50: very good), arousal (ranging from -50: relaxed to +50: excited), hunger (from -50: hungry to +50: fed up), body satisfaction (from -50: dissatisfied to +50: satisfied), and motivation to lose weight (from -50: low motivation to + 50: high motivation) were assessed both before and after the image presentation using VAS.
Other body image aspects. For the assessment of body-related perceptual distortions, the Body Image Distortion in Children and Adolescents (BID-I) [60] was used. Participants were asked to estimate the size of specific body regions (arm, waist, and thigh) using a piece of string. The actual circumferences of these body parts were then measured, and difference scores were calculated by comparing the estimated and actual measurements. To assess figure- and weight-related attitudes, the German version of the IEG [54] was used. Additionally, the Contour Drawing Rating Scale [61] was used to assess discrepancies between real, ideal, and expected body image.
2.4.4. Statistics
The data were statistically processed using IBM SPSS Statistics 22.0 software.
Descriptive statistics. Group comparisons of descriptive data were conducted using two-tailed ANOVAs or non-parametric methods (Pearson’s chi-square test). For the stimulus-response experiment, the raw data for each subject were averaged per picture category. To avoid confounding with the startle noise, EDA data were analyzed only for non-startle trials.
Inference statistics. The main hypotheses were tested using repeated-ANOVAs. The normality assumption was tested using the Kolmogorov-Smirnov test. Due to positive skewness, physiological SCR data were logarithmically and square root transformed. Before this transformation, a constant of 1 was added to avoid negative values. ‘Picture category’ (positive vs. neutral vs. negative; under-sized vs. normal-sized vs. over-sized) was used as a within-group factor, ‘group’ (patients vs. controls) as a between-group factor, and SAM valence (from 1: negative to 9: positive), SAM arousal (from 1: low arousal to 9: high arousal), startle reflex magnitude, and SCR as dependent variables. For all analyses, p-values < 0.05 (two-tailed) were considered statistically significant. When Bonferroni corrections for multiple comparisons were necessary, the calculated p-value was multiplied by the number of comparisons. If sphericity was violated, the Greenhouse-Geisser correction for degrees of freedom was applied. If Levene’s test for equality of variances was significant, a robust Welch ANOVA was performed. For empirically well-founded hypotheses on general emotional reactivity, contrast analyses were conducted. For all other cases, post-hoc tests were performed as needed.
3. Results
This section may be divided by subheadings. It should provide a concise and precise description of the experimental results, their interpretation, as well as the experimental conclusions that can be drawn.
3.1. Processing of the Affective Standard Pictures
For the manipulation check, a two-factorial mixed-design ANOVA was conducted with ‘picture category’ (positive vs. neutral vs. negative) as a within-group factor and ‘group’ (patients vs. controls) as a between-group factor. Only affective standard pictures were included. The results showed significant valence and arousal changes in both groups, with no significant interaction effects, as summarized in Figure 1, Figure 2, Figure 3 and Figure 4.
3.1.1. SAM Valence Score
For the SAM valence score (ranging from 1: negative to 9: positive), a significant main effect for ‘picture category’ was found (p < .001): Positive pictures were rated as significantly more pleasant (p < .001), negative pictures were rated as significantly more unpleasant (p < .001), both compared to neutral pictures in both groups. The main effect for ‘group’ (p = .460) and the ‘picture category’ x ‘group’ interaction effect (p = .242) were not significant.
Changes in the Self-Assessment Manikin (SAM) valence value for the three standard picture categories (positive, neutral, negative) for both groups (patients, controls). The SAM valence scale is reaching from 1: negative to 9: positive. Values are means with standard error bars.
3.1.2. SAM Arousal Score
Analysis of the SAM arousal score (ranging from 1: low arousal to 9: high arousal) also revealed a significant main effect for ‘picture category’ (p < .001): Negative and positive pictures were rated as significantly more arousing than neutral pictures (p < .001), as expected. No significant main effect for ‘group’ (p = .570) and no significant ‘picture category’ x ‘group’ interaction effect was found (p = .072).
Changes in the Self-Assessment Manikin (SAM) arousal value for the three standard picture categories (positive, neutral, negative) for both groups (patients, controls). The SAM arousal scale is reaching from 1: low arousal to 9: high arousal. Values are means with standard error bars.
3.1.3. Startle Reflex Magnitude
For startle reflex magnitude, a linear increase from positive to neutral to negative pictures was expected, as demonstrated in previous studies [14]. This pattern was replicated: A significant main effect for ‘picture category’ was found (p < .001). Negative pictures induced a higher startle magnitude than positive pictures (p < .001). No significant main effects for ‘group’ (p = .328) and no significant ‘picture category’ x ‘group’ interaction effect were found (p = 1.000).
Changes in the noise-induced baseline-corrected startle reflex magnitude (in µV) for the three standard picture categories (positive, neutral, negative) for both groups (patients, controls). Values are means with standard error bars.
3.1.4. SCR
Analysis of the square root- and logarithmically transformed SCR data revealed a significant main effect for ‘picture category’ (p < .001): Negative pictures induced a significantly higher SCR than neutral pictures (p < .001). No significant difference was found between positive and neutral pictures (p = 1.000). A significant main effect for ‘group’ was observed, with patients showing a significantly lower SCR than controls (p = .004). The ‘group’ x ‘picture category’ interaction effect was not significant (p = .246).
Changes in the sqare root and logarithmically transformed baseline-corrected skin conductance response (SCR) for the three standard picture categories (positive, neutral, negative) for both groups (patients, controls). Values are means with standard error bars.
3.2. Processing of the Body Pictures
The effect of body pictures was examined using a two-factorial mixed ANOVA design with ‘picture category’ (under-sized vs. normal-sized vs. over-sized) as a within-group factor and ‘group’ (patients vs. controls) as a between-group factor. The results are illustrated in Figure 5, Figure 6, Figure 7 and Figure 8.
3.2.1. SAM Valence Score
A significant main effect of ‘picture category’ on the SAM valence score (from 1: negative to 9: positive) was found (p < .001): Over-sized bodies (p < .001) and under-sized bodies (p < .001) were rated as significantly more negative than normal-sized bodies. No significant difference was found between over-sized and under-sized bodies (p = .192). The main effect of ‘group’ was not significant (p = 1.000), and there was no significant ‘picture category’ x ‘group’ interaction effect (p = 1.000).
Changes in the Self-Assessment Manikin (SAM) valence value for the three body picture categories (extremely under-sized, normal-sized, extremely over-sized) for both groups (patients, controls). The SAM valence scale is reaching from 1: negative to 9: positive. Values are means with standard error bars.
3.2.2. SAM Arousal Score
The analysis of the SAM arousal score (ranging from 1: low arousal to 9: high arousal) revealed a significant main effect for ‘picture category’ (p < .001), showing a linear increase in arousal from normal-sized to over-sized to under-sized bodies (under- vs. normal-sized: p < .001; over- vs. normal-sized: p = .020; under- vs. over-sized: p < .001). No significant main effect for ‘group’ was found (p = 1.000). No significant ‘group’ x ‘picture category’ interaction effect was found (p = .084).
Changes in the Self-Assessment Manikin (SAM) arousal value for the three body picture categories (extremely under-sized, normal-sized, extremely over-sized) for both groups (patients, controls). The SAM arousal scale is reaching from 1: low arousal to 9: high arousal. Values are means with standard error bars.
3.2.3. Startle Reflex Magnitude
The analysis of the startle reflex data revealed a significant main effect for ‘picture category’ (p < .001), but no significant main effect for ‘group’ (p = .494) and no significant ‘group’ x ‘picture category’ interaction effect (p = .868): Over-sized (p < .001) and under-sized pictures (p = .006) elicited a significantly higher startle reflex magnitude than normal-sized pictures. Over-sized pictures induced stronger startle potentiation than under-sized pictures (p < .001). Separate analyses for each group, corrected for multiple comparisons, indicated differential effects: In the control group, participants showed a clear emotional differentiation between the three body categories. In the patient group, however, a lack of behavioral avoidance response was observed: Startle potentiation for over-sized bodies compared to normal-sized bodies was no longer significant (p = .082). Startle potentiation for under-sized bodies compared to normal-sized bodies was also not significant (p = .162). Startle reflex responses for over- and under-sized bodies did not differ (p = 1.000).
Changes in the noise-induced baseline-corrected startle reflex magnitude (in µV) for the three body picture categories (extremely under-sized, normal-sized, extremely over-sized) for both groups (patients, controls). Values are means with standard error bars.
3.2.4. SCR
For the SCR data, a significant main effect for ‘picture category’ was found (p = .024): Under-sized bodies elicited a significantly higher SCR than normal-sized bodies (p = .032). However, the SCR increase from normal-sized to over-sized bodies did not reach statistical significance (p = .184). No significant ‘group’ x ‘picture category’ interaction effect was found (p = .640), but a significant main effect for ‘group’ was observed (p = .002): Patients exhibited a significantly diminished SCR across all three body picture categories.
Changes in the sqare root and logarithmically transformed baseline-corrected skin conductance response (SCR) for the three body picture categories (extremely under-sized, normal-sized, extremely over-sized) for both groups (patients, controls). Values are means with standard error bars.
3.2.5. Single Emotion Scales
The data from the five dichotomous single emotion scales were analyzed using Pearson’s chi-square test separately for the three body picture categories (under-sized vs. normal-sized vs. over-sized) corrected for multiple comparisons (Table 2, Table 3 and Table 4). No significant differences were found between groups in their reported fear and pity. However, a significant difference was found for disgust and a trend-level difference for admiration: In the patient group, under-sized bodies elicited significantly more disgust (p = .043), and over-sized bodies elicited admiration (p = .078). The findings are summarized in Table 2, Table 3 and Table 4.
3.3. Quality of the Measurement and Potential Confounders
3.3.1. Internal Consistency
The Self-Assessment Manikin (SAM) is an established instrument for assessing subjective emotional reactions and shows good test-retest reliability (coefficients ≈ .55–.78) as well as solid internal consistency [58]. The BID-I [60], the IEG [54], and the Contour Drawing Rating Scale [61] are established measurement instruments with good internal consistency. For the startle-reflex and SCR measurement, Cronbach’s alpha was computed between odd and even trials (only black screens), indicating acceptable to good internal consistency (startle reflex: α = .730, SCR: α = .947).
3.3.2. Situational Influences
To control for situational influences, VAS scores before and after the experiment were compared using two-tailed univariate ANOVAs, with ‘group’ as the independent factor (Table 5). No significant group differences were found, either before or after the experiment. Moreover, changes in mood and arousal from pre- to post-test did not differ significantly between groups. No significant ‘time × group’ interaction effects were observed.
3.3.3. Influence of Other Body Image Dimensions
On the perceptual level, both groups showed a significant overestimation of specific body parts (upper arms: p < .001, and upper legs: p = .024) in the BID-CA [32] with significantly greater overestimation in the patient group (Table 6). Comparable results were observed for the cognitive aspect of body image: The IEG score [54] in both groups remained below the threshold for pathological eating- and weight-related attitudes, although obese adolescents scored significantly higher (p = .024). On the Contour Drawing Rating Scale [61], patients correctly assessed themselves as larger than controls (Table 7). Consequently, discrepancies between real and ideal body image (p < .001), as well as between expected and real body image (p < .001), were more pronounced in the patient group. However, there were no significant group differences in the absolute ratings of ideal (p = .129) or expected body image (p = .478). Covariance analyses (ANCOVAs) with the above-named variables as covariates showed that these aspects did not influence the performance in the stimulus-response experiment (Table 8 and Table 9).
4. Discussion
This study should be understood as a pilot investigation that expands current knowledge on the motivational underpinnings of unsuccessful weight control behavior in adolescents with obesity. By employing a stimulus-response paradigm, disruptions in the involuntary processing of body-related stimuli were assessed. Participants were presented with images of extremely under-sized, normal-sized, and extremely over-sized female bodies, and both subjective and objective emotional reactions were recorded using a physiological measurement approach. In addition, affective standard pictures from the IAPS were presented.
Processing of the Affective Standard Stimuli
Prior research, such as the study by Giel et al. [62], demonstrated reduced subjective emotional intensity – including diminished disgust -when adults with obesity viewed images from the IAPS. In the current adolescent sample, however, this pattern was not replicated. Neither subjective ratings nor startle reflex responses differed significantly between adolescents with obesity and their normal-weight peers. One group difference did emerge: Adolescents with obesity exhibited lower SCR across all affective picture categories. However, baseline SCR levels were comparable between groups, diverging from previous findings of reduced tonic arousal in obesity [63]. These results suggest that, despite a reduced attention, there is no evidence of a generalized motivational dysfunction in the obese adolescents sample. Physiological and subjective motivational responses to non-body-related affective stimuli appear largely intact.
Processing of the Body Pictures
A distinct pattern emerged for body-related stimuli, where clear and consistent group differences were observed: Among healthy individuals, consistent with previous findings [24,25,26,27,28], both an anti-fat bias and an anti-cachexia bias were observed – that is, over- and under-sized bodies were experienced as more negative and more arousing than normal-sized bodies. These responses were physiologically mirrored by significantly increased startle reflexes (indicating involuntary activation of the behavioral avoidance system [14,15]) and elevated SCR (indicating heightened attention [51]). In contrast, adolescents with obesity showed a discrepancy between subjective and objective responses: Although they rated over- and under-sized bodies as comparably aversive and arousing as the control group, and rated normal-sized bodies – representing the societal beauty ideal – as significantly more arousing and attractive, they did not exhibit the expected physiological avoidance or approach responses. Instead, a generalized emotional down-regulation was observed across all three body categories: Both the startle reflex and SCRs were significantly reduced.
Physiological Downregulation
Several potential mechanisms may explain the observed physiological downregulation in response to body-related stimuli among adolescents with obesity:
1. Habituation: Repeated exposure to the same or similar stimuli can lead to a decrease in skin conductance response (SCR), reflecting reduced attention - a process known as habituation [51,64,65]. From this perspective, the blunted emotional response to overweight body cues may result from adolescents with obesity encountering their own body shape regularly (e.g., in mirrors), leading to desensitization. However, this explanation falls short of accounting for the reduced reactivity to both underweight and normal-weight body images, which are not typically part of these adolescents’ visual routine. Therefore, habituation alone is insufficient to explain the full pattern of results.
2. Emotional avoidance behavior: Avoidance of weight- and body-related cues is a well-documented coping strategy in individuals with obesity, persisting even after weight-loss treatment [66,67]. The reduced attention to body cues observed in the present study - consistent with findings from gaze-cue paradigms [50] - could reflect an unconscious “looking away” strategy intended to protect against the distress of upward social comparison. However, this mechanism typically results in a dissociation: increased physiological reactivity (due to internal conflict) despite reduced subjective arousal [68]. This pattern was not observed in the current study: Here, the physiological responses were blunted. Thus, emotional avoidance may be contributing, but does not fully account for the data.
3. Lack of intrinsic motivational salience: The most compelling explanation may be a body-cue-specific deficit in intrinsic incentive and avoidance motivation among adolescents with obesity. Prior research suggests that obesity – particularly when associated with insulin resistance [34,35] – can lead to functional and structural changes in brain regions critical for motivational processing, including the amygdala and dopaminergic systems [36,37,38,39,69,70,71]. These systems govern both behavioral avoidance [18,19] and reward anticipation [22]. Since adolescence is a critical window for neurodevelopment [72,73], such cerebral vulnerabilities may result in an attenuated motivational response to salient body cues. The physiological blunting observed here may thus reflect neurobiological dysfunction in in body image processing motivational circuits – a hypothesis requiring further investigation.
Subjective vs. Objective Discrepancy
The fact that this blunting was limited to the physiological domain raises an additional question: Why did subjective reports not mirror this disruption? Two interpretations are plausible:
1. Socially desirable response behavior: Social desirability bias may have influenced participants’ self-reporting, leading them to express the “expected” attitudes toward thinness and overweight [74].
2. Wanting vs. linking: Alternatively, the ´wanting´ vs. ´liking´ distinction [48,49] offers a compelling framework. While ´liking´ refers to the conscious experience of pleasure, ´wanting´ reflects the incentive salience attributed to a stimulus – a largely unconscious motivational process that shapes behavior even in the absence of awareness. Previous studies in obesity research have documented similar subjective-objective discrepancies when measuring responses to food cues [75].
Implications
The findings have the following implications: If the perception of extreme overweight as aversive and the perception of normal-weight as desirable are blunted, a key motivational factor for weight loss is diminished. In such cases, the motivation to lose weight may be driven solely by cognitive reasoning (‘I have to lose weight’) or by social desirability pressures, rather than by an intrinsic emotional drive.
To address this issue, effective treatment approaches should incorporate emotion-activating techniques, such as mirror exposure therapy [76], and interventions that raise awareness of body-cue-related emotional blunting. While therapeutic strategies aimed at processing negative body-related emotions (e.g., body image exposure therapy) may be beneficial, the current findings suggest that emotional blunting in adolescents with obesity reflects not an excess of negative affect, but rather a lack of motivational salience in response to body-related stimuli. This distinction is critical for refining intervention strategies. If a link between this blunted physiological reactivity and insulin resistance can be confirmed, it may open the door to pharmacotherapeutic interventions targeting metabolic and motivational systems. Early clinical studies on semaglutides, particularly glucagon-like peptide-1 (GLP-1) receptor agonists, have shown promise in reducing insulin resistance and supporting weight loss in obese adults [77], and their potential use in adolescents is currently under discussion [78].
However, the current findings underscore the need for further research into the neurobiological mechanisms underlying emotional downregulation in obesity. Future studies should incorporate functional neuroimaging, insulin sensitivity markers, and longitudinal designs to better understand whether these motivational disruptions are a cause or consequence of obesity, and whether they are modifiable through combined behavioral and pharmacological interventions.
Limitations
Several limitations must be acknowledged. The pilot study was conducted with a low sample size, and the effects found were small. Due to drop outs during the measurement period, our final sample size was slightly below the calculated target of 26 participants per group; accordingly, the limited power for small effects and especially the increased risk of false-negative effects should be acknowledged as a limitation. The results are limited to a specific demographic (female adolescents), so no conclusions can be drawn for older individuals or males with obesity. Comorbidity with binge eating disorder was not recorded, which may have confounded the results, particularly those related to perceptual body image distortions. Furthermore, the positive standard images used in the study were not sufficiently arousing, especially for control participants, which may have affected the comparability between groups. Participants viewed images of strangers rather than of themselves; therefore, it remains unclear whether viewing one’s own body (e.g., via body morphing techniques) would produce similar patterns of emotional down-regulation. This study does not provide insight into the long-term consequences of emotional blunting in response to body-related stimuli. To evaluate the behavioral relevance of these findings over time, future research should incorporate follow-up assessments, including objective behavioral measures such as actual eating behavior, treatment adherence, and long-term weight trajectories. Moreover, the current design was not suited to investigate the neurobiological mechanisms underlying the observed motivational deficits. To address this gap, future studies should integrate neuroimaging techniques (e.g., fMRI) to measure cerebral activation patterns during exposure to body-related cues. In addition, covariance analyses involving insulin sensitivity markers could clarify the potential role of metabolic dysregulation –particularly insulin resistance – in shaping motivational and emotional processing in obesity.
5. Conclusions
Building on recent neuroimaging research suggesting that insulin resistance may disrupt the incentive and avoidance motivational systems in adolescents with obesity, the present pilot study investigated – for the first time – the involuntary motivational processing of body-related cues in this population. While previous stimulus-response experiments have predominantly focused on food cues [44], this study examined physiological and subjective reactions to extremely underweight, normal-weight, and extremely overweight body images.
A clear dissociation emerged between subjective self-reports and physiological measures: Although obese and non-obese adolescents reported similar emotional experiences, obese participants exhibited a generalized physiological blunting across all body categories. Specifically, startle reflex modulation (reflecting behavioral avoidance and reward system activation) and SCR (indicating attentional engagement) were significantly reduced in the obesity group. In the case of the startle reflex response, this blunting was specific to body stimuli; no group differences were observed in startle reflex response to affective standard images, suggesting that general motivational processing remains intact.
Although limitations such as the small sample size must be considered, these findings provide a promising extension to prior research and highlight the need for further studies exploring the complex interplay between adolescence-related obesity, brain-based motivational deficits, and body-cue-specific emotional reactivity.
Supplementary Materials
The following supporting information can be downloaded at the website of this paper posted on Preprints.org, Table S1: ANOVA Results for the Self-Assessment Manikin Valence Score; Table S2: ANOVA Results for the Self-Assessment Manikin Arousal Score; Table S3: ANOVA Results for the Startle Reflex Magnitude; Table S4: ANOVA Results for the Skin Conductance Response
Author Contributions
V.P. and A.K. conceived and planned the experiment. S.W. helped recruiting participants and supervise the project. Material preparation, data collection and analysis were performed by V.P.. A.H. contributed to the interpretation of the results. R.M. helped analyze the data. The first draft of the manuscript was written by V.P., and all authors commented on previous versions of the manuscript. All authors read and approved the final manuscript. All authors have read and agreed to the published version of the manuscript.
Funding
This research received no external funding.
Institutional Review Board Statement
The study was conducted in accordance with the Declaration of Helsinki, and approved by the Ethics Committee of the CHARITE´ UNIVERSITY MEDICINE BERLIN with the application number EA2/140/08.
Informed Consent Statement
Written informed consent was obtained from all individual participants included in the study. For minor participants, written consent was also obtained from their legal guardians. Written informed consent has been obtained from the patients to publish this paper
Data Availability Statement
The statistical processed data presented in this study are included in the article and the supplementary material. The raw data supporting the conclusions of this article will be made available by the authors on request.
Acknowledgments
Thank you for the adolescents participating in the study.
Conflicts of Interest
The authors declare no conflicts of interest.
Abbreviations
The following abbreviations are used in this manuscript:
| BMI | Body Mass Index |
| SCR | Skin Conductance Response |
| ANOVA | Univariate Analysis of Variance |
| SIAB | Structured Interview for Anorexic and Bulimic Disorders |
| CIDI | Composite International Diagnostic Interview |
| IEG | Inventory of Eating Behavior and Weight Problems |
| TAS | Toronto Alexithymia Scale |
| VAS | Visual Analogue Scales |
| EMG | Electromyographic Activity |
| EDA | Electrodermal Activity |
| IAPS | International Affective Picture System |
| SAM | Self-Assessment Manikin |
| BID-I | Body Image Distortion in Children and Adolescents |
References
- Bastien, M.; Després, J.P.; Lemieux, I.; Poirier, P. Overview of epidemiology and contribution of obesity to cardiovascular disease. Prog Cardiovasc Dis. 2014, 56, 369–381. [Google Scholar] [CrossRef]
- Fulton, S.; Décarie-Spain, L.; Fioramonti, X.; Guiard, B.; Nakajima, S. The menace of obesity to depression and anxiety prevalence. Trends Endocrinol Metab. 2022, 33, 18–35. [Google Scholar] [CrossRef] [PubMed]
- Güngör, N.K. Overweight and obesity in children and adolescents. J Clin Res Pediatr Endocrinol. 2014, 6, 129–143. [Google Scholar] [CrossRef] [PubMed]
- Jebeile, H.; Kelly, A.S.; O'Malley, G.; Baur, L.A. Obesity in children and adolescents: epidemiology, causes, assessment, and management. Lancet Diabetes Endocrinol. 2022, 10, 351–365. [Google Scholar] [CrossRef] [PubMed]
- NCD Risk Factor Collaboration (NCD-RisC). Worldwide trends in body-mass index, underweight, overweight, and obesity from 1975 to 2016: a pooled analysis of 2416 population-based measurement studies in 128·9 million children, adolescents, and adults. Lancet 2017, 390, 2627–2642. [Google Scholar] [CrossRef]
- Nour, T.Y.; Altintaş, K.H. Effect of the COVID-19 pandemic on obesity and it is risk factors: a systematic review. BMC Public Health. 2023, 23, 1018. [Google Scholar] [CrossRef]
- The Lancet Gastroenterology Hepatology. Obesity: another ongoing pandemic. Lancet Gastroenterol Hepatol. 2021, 6, 411. [CrossRef]
- Simmonds, M.; Llewellyn, A.; Owen, C.G.; Woolacott, N. Predicting adult obesity from childhood obesity: a systematic review and meta-analysis. Obes Rev. 2016, 17, 95–107. [Google Scholar] [CrossRef]
- Wadden, T.A.; West, D.S.; Delahanty, L.; Jakicic, J.; Rejeski, J.; Williamson, D.; et al. The Look AHEAD study: a description of the lifestyle intervention and the evidence supporting it. Obesity. 2006, 14, 737–752. [Google Scholar]
- Moschonis, G.; Trakman, G.L. Overweight and Obesity: The Interplay of Eating Habits and Physical Activity. Nutrients. 2023, 15, 2896. [Google Scholar] [CrossRef]
- Cardel, M.I.; Szurek, S.M.; Dillard, J.R.; Dilip, A.; Miller, D.R.; Theis, R.; et al. Perceived barriers/facilitators to a healthy lifestyle among diverse adolescents with overweight/obesity: A qualitative study. Obes Sci Pract. 2020, 6, 638–648. [Google Scholar] [CrossRef]
- Jodkowska, M.; Oblacińska, A.; Nałęcz, H.; Mazur, J. Perceived barriers for physical activity in overweight and obese adolescents and their association with health motivation. Dev Period Med. 2017, 21, 248–258. [Google Scholar] [PubMed]
- Baillot, A.; Chenail, S.; Barros Polita, N.; Simoneau, M.; Libourel, M.; Nazon, E.; et al. Physical activity motives, barriers, and preferences in people with obesity: A systematic review. PLoS One. 2021, 16, e0253114. [Google Scholar] [CrossRef] [PubMed]
- Lang, P.J. The emotion probe: Studies of motivation and attention. American Psychologist. 1995, 50, 372–385. [Google Scholar] [CrossRef] [PubMed]
- Lang, P.J.; Bradley, M.M.; Cuthbert, B.N. Emotion, attention, and the startle reflex. Psychol Rev. 1990, 97, 377–395. [Google Scholar] [CrossRef]
- Feltman, R.; Elliot, A.J. Approach and Avoidance Motivation. In: Seel, NM. Encyclopedia of the Sciences of Learning. Boston: Springer; 2012.
- Davis, M.; Falls, W.A.; Campeau, S.; Kim., M. Fear-potentiated startle: A neural and pharmacological analysis. Behav Brain Res. 1993, 58, 175–198. [Google Scholar] [CrossRef]
- Öhman, A. Human fear conditioning and the amygdala. P. J. Whalen & E. A. Phelps (Eds.). The Guilford Press; 2009. pp. 118-154.
- Davis, M.; Lee, Y. Fear and anxiety: Possible roles of the amygdala and bed nucleus of the stria terminalis. Cognition and Emotion. 1998, 12, 277–305. [Google Scholar]
- Campeau, S.; Davis, M. Involvement of subcortical and cortical afferents to the lateral nucleus of the amygdala in fear conditioning measured with fear-potentiated startle in rats trained concurrently with auditory and visual conditioned stimuli. J Neurosci. 1995, 15, 2312–2327. [Google Scholar] [CrossRef]
- Koch, M.; Schnitzler, H.U. The acoustic startle response in rats - circuits mediating evocation, inhibition and potentiation. Behav Brain Res. 1997, 89, 35–49. [Google Scholar] [CrossRef]
- Berridge, K.C.; Robinson, T.E. What is the role of dopamine in reward: hedonic impact, reward learning, or incentive salience? Brain Res Brain Res Rev. 1998, 28, 309–369. [Google Scholar] [CrossRef]
- Omondi, H.; Freysteinson, W. The mirror and obesity: A systematic review on the effects of mirror exposure on behaviour and obese individuals. J Clin Nurs. 2022, 31, 2367–2376. [Google Scholar] [CrossRef]
- Dauber, A.; Braden, A. Facial EMG startle response and self-report reactions after exposure to severely underweight and severely obese body images in individuals with disordered eating: An examination of motivational responses. Int J Psychophysiol. 2023, 194, 112249. [Google Scholar] [CrossRef] [PubMed]
- Reichel, V.A.; Schneider, N.; Grünewald, B.; Kienast, T.; Pfeiffer, E.; Lehmkuhl, U.; et al. "Glass fairies" and "bone children": adolescents and young adults with anorexia nervosa show positive reactions towards extremely emaciated body pictures measured by the startle reflex paradigm. Psychophysiology. 2014, 51, 168–177. [Google Scholar] [CrossRef] [PubMed]
- Spresser, C.D.; Keune, K.M.; Filion, D.L.; Lundgren, J.D. Startle as an objective measure of distress related to teasing and body image. Int J Eat Disord. 2011, 44, 58–64. [Google Scholar] [CrossRef] [PubMed]
- Dodd, D.R.; Forrest, L.N.; Fussner, L.M.; Smith, A.R.; Velkoff, E.A. Beauty in the eye of the beholder: Using facial electromyography to examine the association between eating disorder symptoms and perceptions of emaciation among undergraduate women. Body Image. 2017, 21, 47–56. [Google Scholar] [CrossRef]
- Masselman, I.; de Jong, P.J.; Glashouwer, K.A. Subjective disgust and facial electromyography responses towards unedited and morphed overweight self-pictures in women with varying levels of eating disorder symptomatology. Eur Eat Disord Rev. 2023, 31, 98–109. [Google Scholar] [CrossRef]
- Schwartz, M.B.; Vartanian, L.R.; Nosek, B.A.; Brownell, K.D. The influence of one's own body weight on implicit and explicit anti-fat bias. Obesity. 2006, 14, 440–447. [Google Scholar] [CrossRef]
- Degner, J.; Wentura, D. Not everybody likes the thin and despises the fat: One's weight matters in the automatic activation of weight-related social evaluations. Social Cognition. 2009, 27, 202–221. [Google Scholar] [CrossRef]
- Cserjési, R.; Lénárd, L.; Luminet, O.; Marechal, C.; Nef, F.; Simon, Y.; Vermeulen, N. Explicit vs. implicit body image evaluation in restrictive anorexia nervosa. Psychiatry Res. 2010, 175, 148–153. [Google Scholar]
- Seeger, G.; Braus, D.F.; Ruf, M.; Goldberger, U.; Schmidt, M.H. Body image distortion reveals amygdala activation in patients with anorexia nervosa - a functional magnetic resonance imaging study. Neurosci Lett. 2002, 326, 25–28. [Google Scholar] [CrossRef]
- Uher, R.; Murphy, T.; Friederich, H.C.; Dalgleish, T.; Brammer, M.J. ; Giampietro, Vv, et al. Functional neuroanatomy of body shape perception in healthy and eating-disordered women. Biol Psychiatry. 2005, 58, 990–997. [Google Scholar]
- Areias, M.F.; Prada, P.O. . Mechanisms of insulin resistance in the amygdala: influences on food intake. Behav Brain Res. 2015, 282, 209–217. [Google Scholar] [CrossRef] [PubMed]
- Romualdo, M.C.; Nóbrega, F.J.; Escrivão, M.A. Insulin resistance in obese children and adolescents. J Pediatr (Rio J). 2014, 90, 600–607. [Google Scholar] [CrossRef] [PubMed]
- Opel, N.; et al. Brain structural abnormalities in obesity: relation to age, genetic risk, and common psychiatric disorders : Evidence through univariate and multivariate mega-analysis including 6420 participants from the ENIGMA MDD working group. Mol Psychiatry. 2021, 26, 4839–4852. [Google Scholar] [CrossRef]
- Ip, C.K.; et al. Amygdala NPY Circuits Promote the Development of Accelerated Obesity under Chronic Stress Conditions. 30th ed. Cell Metab. 2019. pp. 111-128.
- Park, B.Y.; Hong, J.; Park, H. Neuroimaging biomarkers to associate obesity and negative emotions. Sci Rep. 2017, 7, 7664. [Google Scholar] [CrossRef]
- Boitard, C.; Maroun, M.; Tantot, F.; Cavaroc, A.; Sauvant, J.; Marchand, A.; et al. Juvenile obesity enhances emotional memory and amygdala plasticity through glucocorticoids. J Neurosci. 2015, 35, 4092–4103. [Google Scholar] [CrossRef]
- Paslakis, G.; Scholz-Hehn, A.D.; Sommer, L.M.; et al. Implicit bias to food and body cues in eating disorders: a systematic review. Eat Weight Disord. 2021, 26, 1303–1321. [Google Scholar] [CrossRef]
- Burger, K.S.; Stice, E. Relation of dietary restraint scores to activation of reward-related brain regions in response to food intake, anticipated intake, and food pictures. Neuroimage. 2011, 55, 233–239. [Google Scholar] [CrossRef]
- Carbine, K.A.; Duraccio, K.; Mv Kirwan, C.B.; et al. A direct comparison between ERP and fMRI measurements of food-related inhibitory control: implications for BMI status and dietary intake. NeuroImage. 2018, 166, 335–348. [Google Scholar] [CrossRef]
- Boswell, R.G.; Kober, H. Food cue reactivity and craving predict eating and weight gain: a meta-analytic review. Obesity Reviews. 2016, 17, 159–177. [Google Scholar] [CrossRef]
- Morys, F.; García-García, I.; Dagher, A. Is obesity related to enhanced neural reactivity to visual food cues? A review and meta-analysis. Soc Cogn Affect Neurosci. 2020, 18, nsaa113. [Google Scholar] [CrossRef]
- Lewer, M.; Nasrawi, N.; Schroeder, D.; Vocks, S. Body image disturbance in binge eating disorder: a comparison of obese patients with and without binge eating disorder regarding the cognitive, behavioral and perceptual component of body image. Eat Weight Disord. 2016, 21, 115–125. [Google Scholar] [CrossRef] [PubMed]
- Lewer, M.; Bauer, A.; Hartmann, A.S.; Vocks, S. Different Facets of Body Image Disturbance in Binge Eating Disorder: A Review. Nutrients. 2017, 9, 1294. [Google Scholar] [CrossRef] [PubMed]
- Mussell, M.P.; Peterson, C.B.; Weller, C.L.; Crosby, R.D.; de Zwaan, M.; Mitchell, J.E. Differences in body image and depression among obese women with and without binge eating disorder. Obesity Research. 1996, 4, 431–439. [Google Scholar] [CrossRef] [PubMed]
- Robinson, M.J.; Fischer, A. Mv, Ahuja, A. ; Lesser, E.N.; Maniates, H. Roles of "Wanting" and "Liking" in Motivating Behavior: Gambling, Food, and Drug Addictions. Curr Top Behav Neurosci. 2016, 27, 105–136. [Google Scholar]
- Berridge, K.C.; Robinson, T.E.; Aldridge, J.W. Dissecting components of reward: 'liking', 'wanting', and learning. Curr Opin Pharmacol. 2009, 9, 65–73. [Google Scholar] [CrossRef]
- Leehr, E.; Giel, K.E.; Schaeffeler, N.; Mack, I.; Thiel, A.; Zurstiege, G.; et al. Where Do You Look? Visual Attention to Human Bodies across the Weight Spectrum in Individuals with Normal Weight or with Obesity. Obes Facts. 2018, 11, 277–286. [Google Scholar]
- Frith, C.D.; Allen, H.A. The skin conductance orienting response as an index of attention. Biol Psychol. 1983, 17, 27–39. [Google Scholar] [CrossRef]
- Fichter, M.M.; Herpertz, S.; Quadflieg, N.; Herpertz-Dahlmann, B. Structured Interview for Anorexic and Bulimic disorders for DSM-IV and ICD-10: updated (third) revision. Int J Eat Disord. 1998, 24, 227–249. [Google Scholar] [CrossRef]
- Robins, L.N.; Wing, J.; Wittchen, H.U.; Helzer, J.E.; Babor, T.F.; Burke, J.; et al. The Composite International Diagnostic Interview. An epidemiologic Instrument suitable for use in conjunction with different diagnostic systems and in different cultures. Arch Gen Psychiatry. 1988, 45, 1069–1077. [Google Scholar] [CrossRef]
- Diehl, J.M.; Staufenbiel, T. Inventar zum Essverhalten und Gewichtsproblemen (IEG). 4th ed. Eschborn: Dietmar Klotz; 2020.
- Bagby, R.M.; Parker, J.D.; Taylor, G.J. The twenty-item Toronto Alexithymia Scale--I. Item selection and cross-validation of the factor structure. J Psychosom Res. 1994, 38, 23–32. [Google Scholar] [CrossRef]
- Lang, P.J.; Bradley, M.M.; Cuthbert, B.N. International Affective Picture System (IAPS): Technical Manual and Affective Ratings. NIMH Center for the Study of Emotion and Attention; 1997, 39-58.
- Lang, P.J.; Bradley, M.M.; Cuthbert, B.N. International Affective Picture System (IAPS): Instruction manual and affective ratings, Technical Report A-8. Gainesville: The Center for Research in Psychophysiology, University of Florida; 2008.
- Bradley, M.M.; Lang, P.J. Measuring emotion: The Self-Assessment Manikin and the semantic differential. J Behav Ther Exp Psychiatry. 1994, 25, 4959. [Google Scholar] [CrossRef] [PubMed]
- Blumenthal, T.D.; Cuthbert, B.N.; Diane, L.F.; Hackley, S.; Lipp, O.V.; van Boxtel, A. Committee report: Guidelines for human startle eyeblink electromyographic studies. 2005, 42, 1-15.
- Schneider, N.; Martus, P.; Ehrlich, S.; Pfeiffer, E.; Lehmkuhl, U.; Salbach-Andrae, H. The assessment of body image distortion in female adolescents with anorexia nervosa: the development of a Test for Body Image Distortion in Children and Adolescents (BID-CA). Eat Weight Disord. 2009, 14, 128–136. [Google Scholar] [CrossRef] [PubMed]
- Thompson, M.A.; Gray, J.J. Development and validation of a new body-image assessment scale. J Pers Assess. 1995, 64, 258–269. [Google Scholar] [CrossRef]
- Giel, K.E.; Hartmann, A.; Zeeck, A.; Jux, A.; Vuck, A.; Gierthmuehlen, P.C.; et al. Decreased Emotional Perception in Obesity. Eur Eat Disord Rev. 2016, 24, 341–346. [Google Scholar] [CrossRef]
- Aldosky, H.Y. Impact of obesity and gender differences on electrodermal activities. Gen Physiol Biophys. 2019, 38, 513–518. [Google Scholar]
- Thompson, R.F. Habituation: A history. Neurobiol. Learn. Mem. 2009, 92, 127–134. [Google Scholar] [CrossRef]
- Waters, W.F.; McDonald, D.G.; Koresko, R.L. Habituation of the orienting response: a gating mechanism subserving selective attention. Psychophysiology. 1977, 14, 228–236. [Google Scholar] [CrossRef]
- Schumacher, L.M.; Martinelli, M.K.; Convertino, A.D.; Forman, E.M.; Butryn, M.L. Weight-Related Information Avoidance Prospectively Predicts Poorer Self-Monitoring and Engagement in a Behavioral Weight Loss Intervention. Ann Behav Med. 2021, 55, 103–111. [Google Scholar] [CrossRef]
- Latner, J.D. Body checking and avoidance among behavioral weight-loss participants. Body Image. 2008, 5, 91–98. [Google Scholar] [CrossRef]
- Leonidou, C.; Panayiotou, G. Can we predict experiential avoidance by measuring subjective and physiological emotional arousal? Curr Psychol. 2022, 41, 7215–7227. [Google Scholar] [CrossRef]
- Berridge, K.C.; Ho, C.Y.; Richard, J.M.; DiFeliceantonio, A.G. The tempted brain eats: pleasure and desire circuits in obesity and eating disorders. Brain Res. 2010, 1350, 43–64. [Google Scholar] [CrossRef]
- Stice, E.; Burger, K. Neural vulnerability factors for obesity. Clin Psychol Rev. 2019, 68, 38–53. [Google Scholar] [CrossRef]
- Wang, G.J.; Volkow, N.D.; Logan, J.; Pappas, N.R.; Wong, C.T.; Zhu, W.; et al. Brain dopamine and obesity. Lancet. 2001, 357, 354–357. [Google Scholar] [CrossRef] [PubMed]
- Spear, L.P. The adolescent brain and age-related behavioral manifestations. Neurosci Biobehav Rev. 2000, 24, 417–463. [Google Scholar] [CrossRef] [PubMed]
- Foilb, A.R.; Lui, P.; Romeo, R.D. The transformation of hormonal stress responses throughout puberty and adolescence. J Endocrinol. 2011, 210, 391–398. [Google Scholar] [CrossRef] [PubMed]
- Krumpal, I. Determinants of social desirability bias in sensitive surveys: a literature review. Quality & Quantity. 2013, 47, 2025–2047. [Google Scholar]
- Morales, I.; Berridge, K.C. 'Liking' and 'wanting' in eating and food reward: Brain mechanisms and clinical implications. Physiol Behav. 2020, 227, 113152. [Google Scholar] [CrossRef]
- Omondi, H.; Freysteinson, W. The mirror and obesity: A systematic review on the effects of mirror exposure on behaviour and obese individuals. J Clin Nurs. 2022, 31, 2367–2376. [Google Scholar] [CrossRef]
- Carmina, E.; Longo, R.A. Semaglutide Treatment of Excessive Body Weight in Obese PCOS Patients Unresponsive to Lifestyle Programs. J Clin Med. 2023, 12, 5921. [Google Scholar] [CrossRef]
- Woodard, K.; Louque, L.; Hsia, DS. Medications for the treatment of obesity in adolescents. Ther Adv Endocrinol Metab. 2020, 11, 2042018820918789. [Google Scholar] [CrossRef]
Figure 1.
Manipulation Check for Subjective Valence Data.
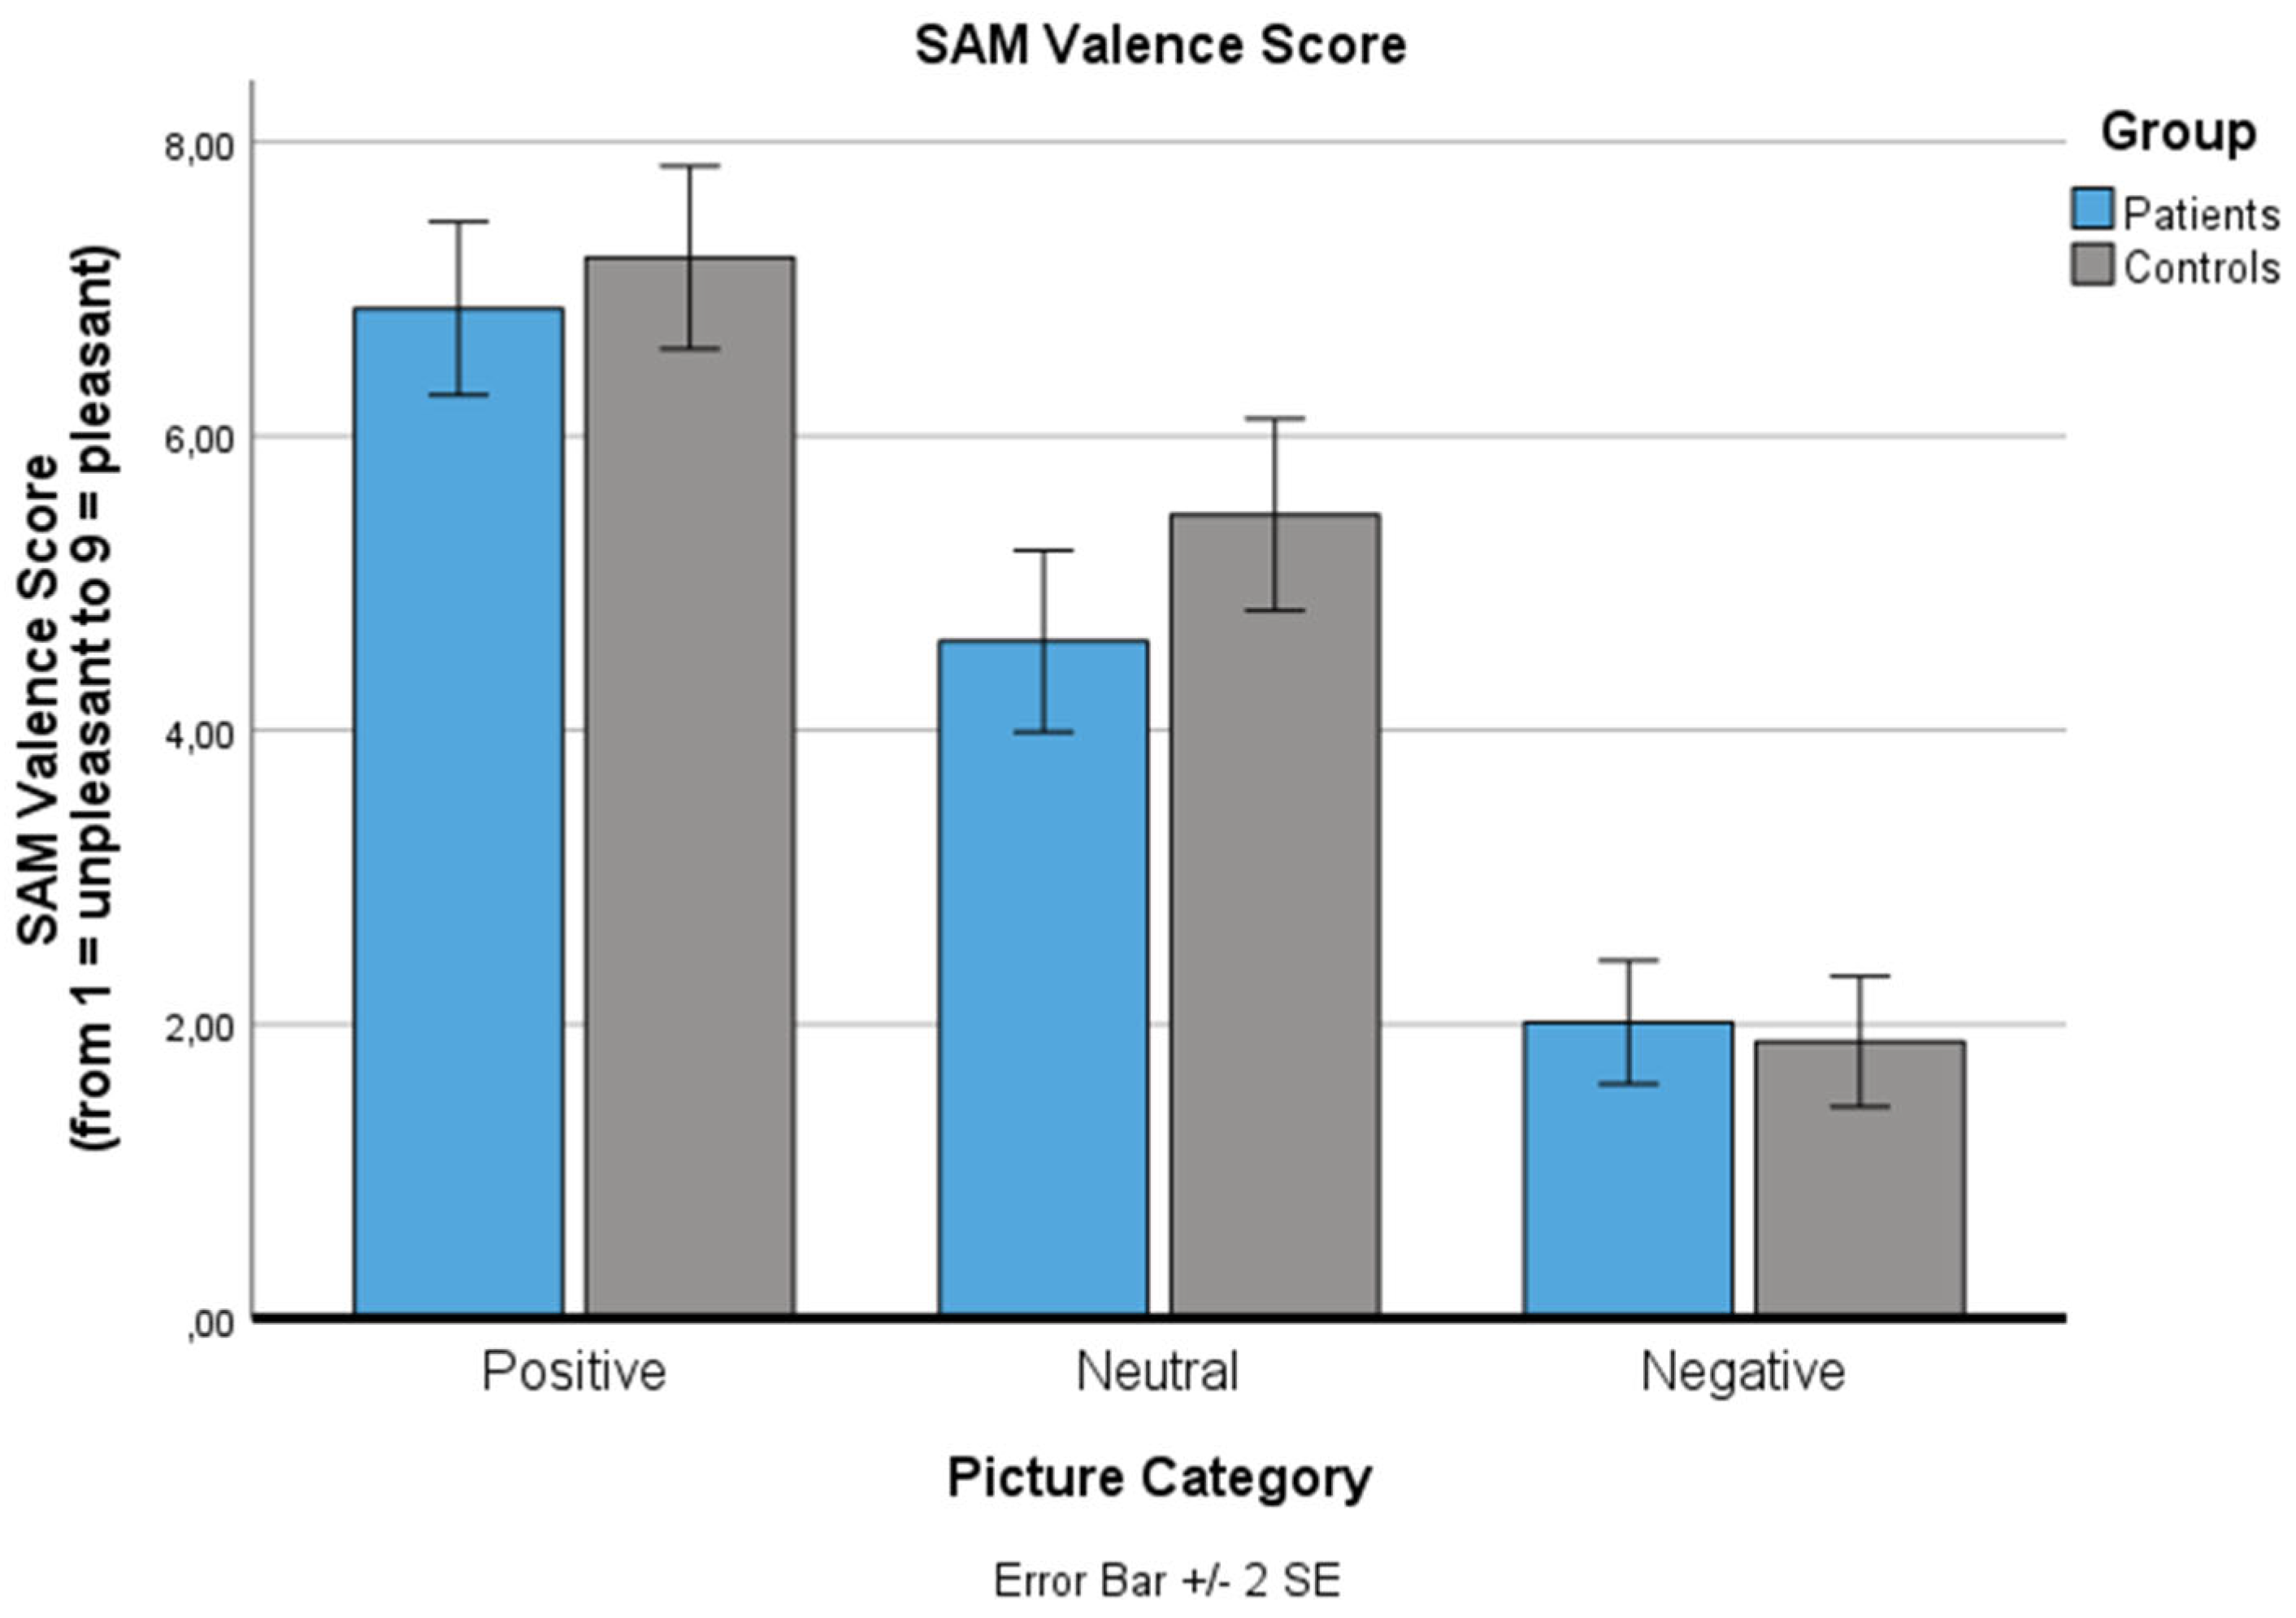
Figure 2.
Manipulation Check for Subjective Arousal Data.
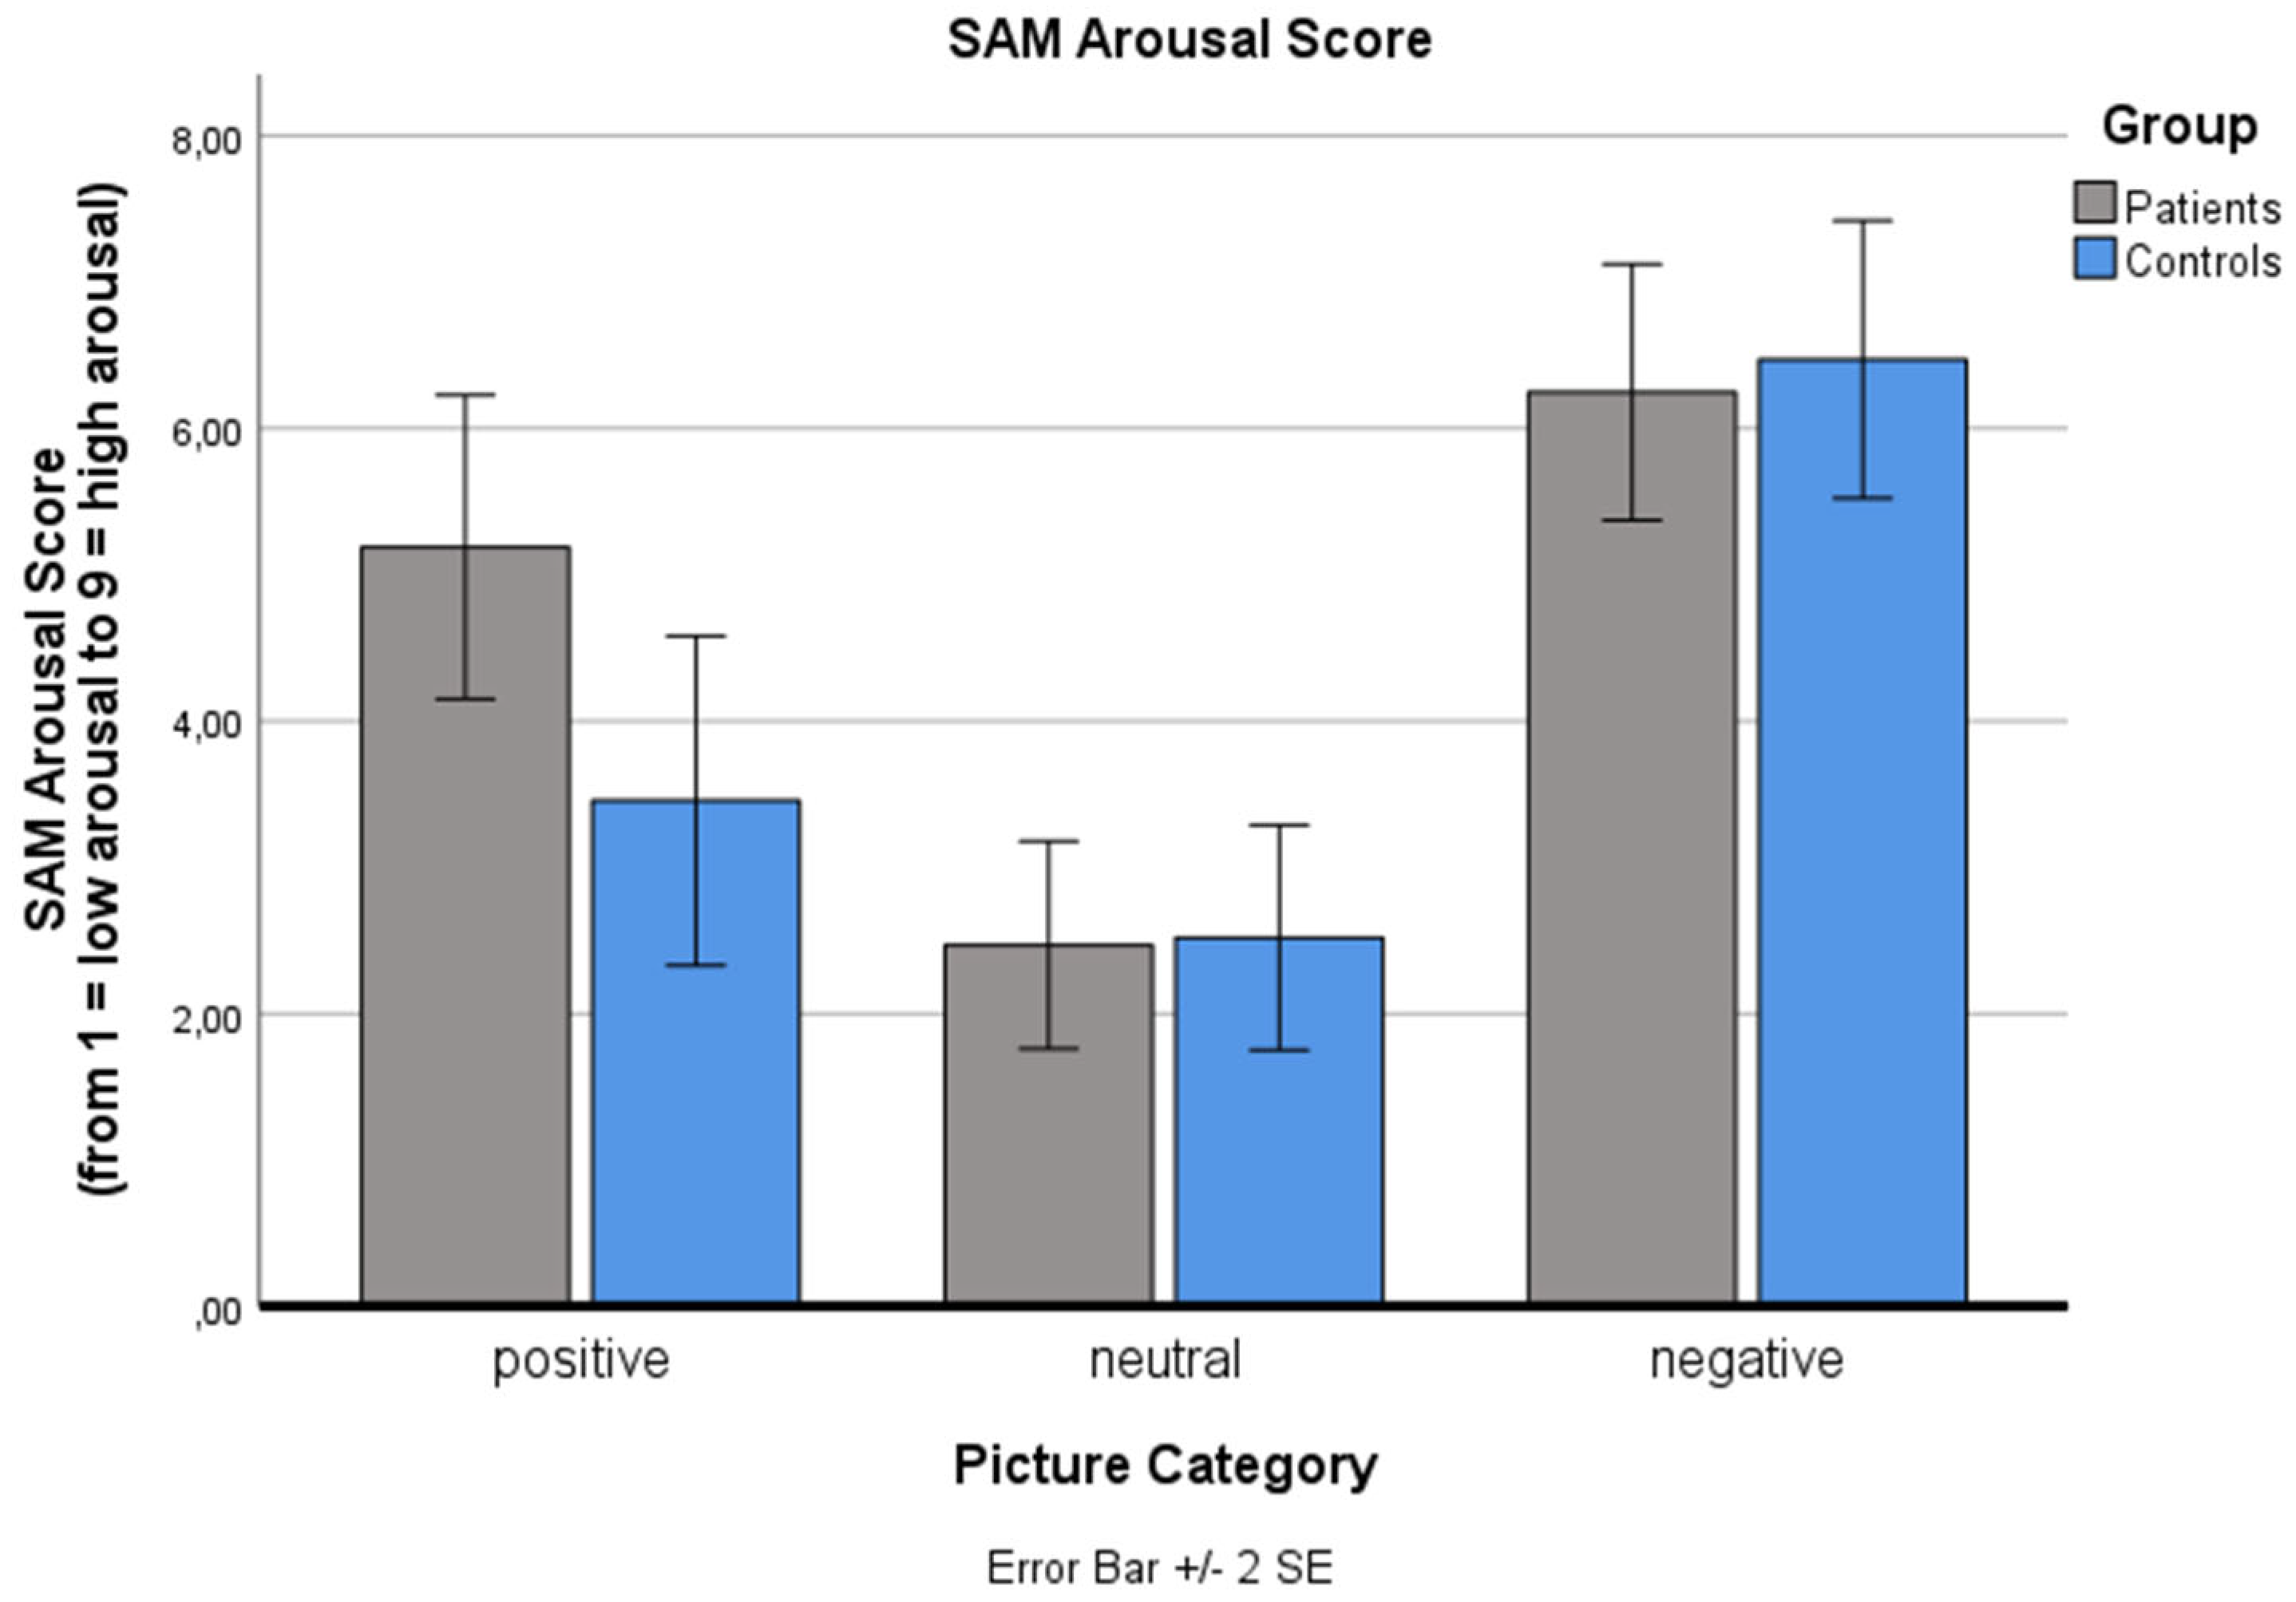
Figure 3.
Manipulation Check for Startle Reflex Data.
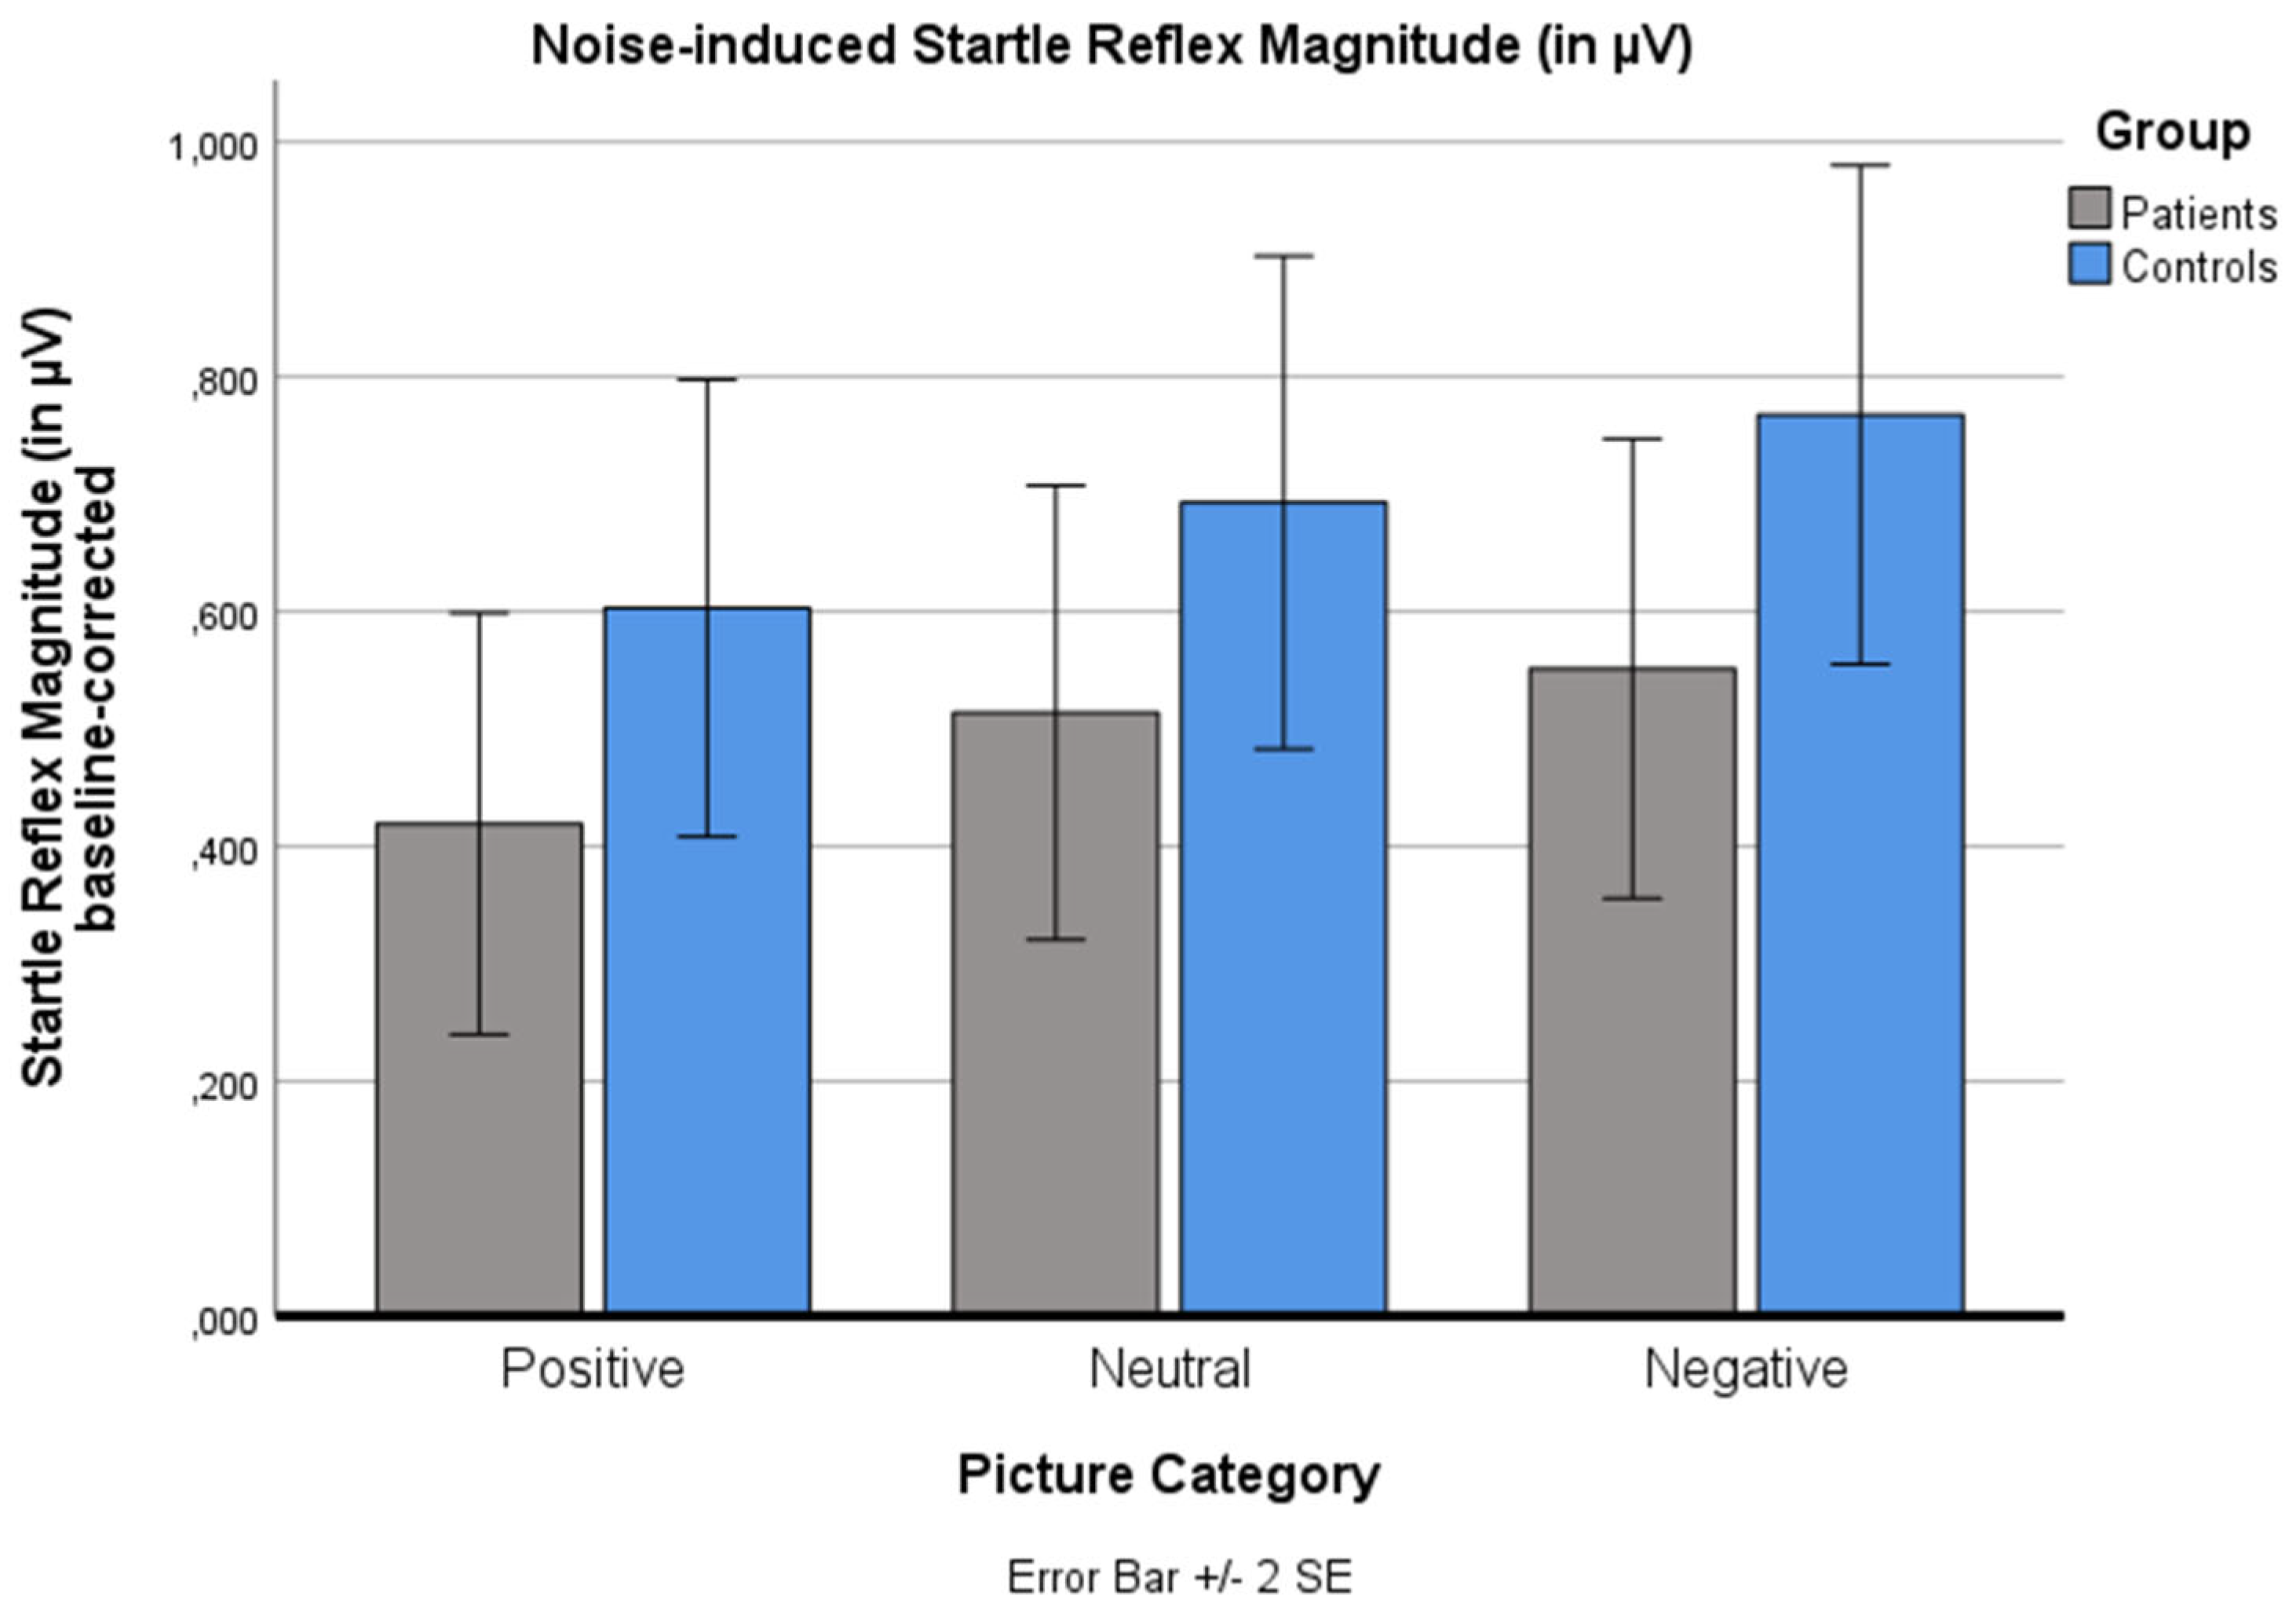
Figure 4.
Manipulation Check for the Skin Conductance Data.
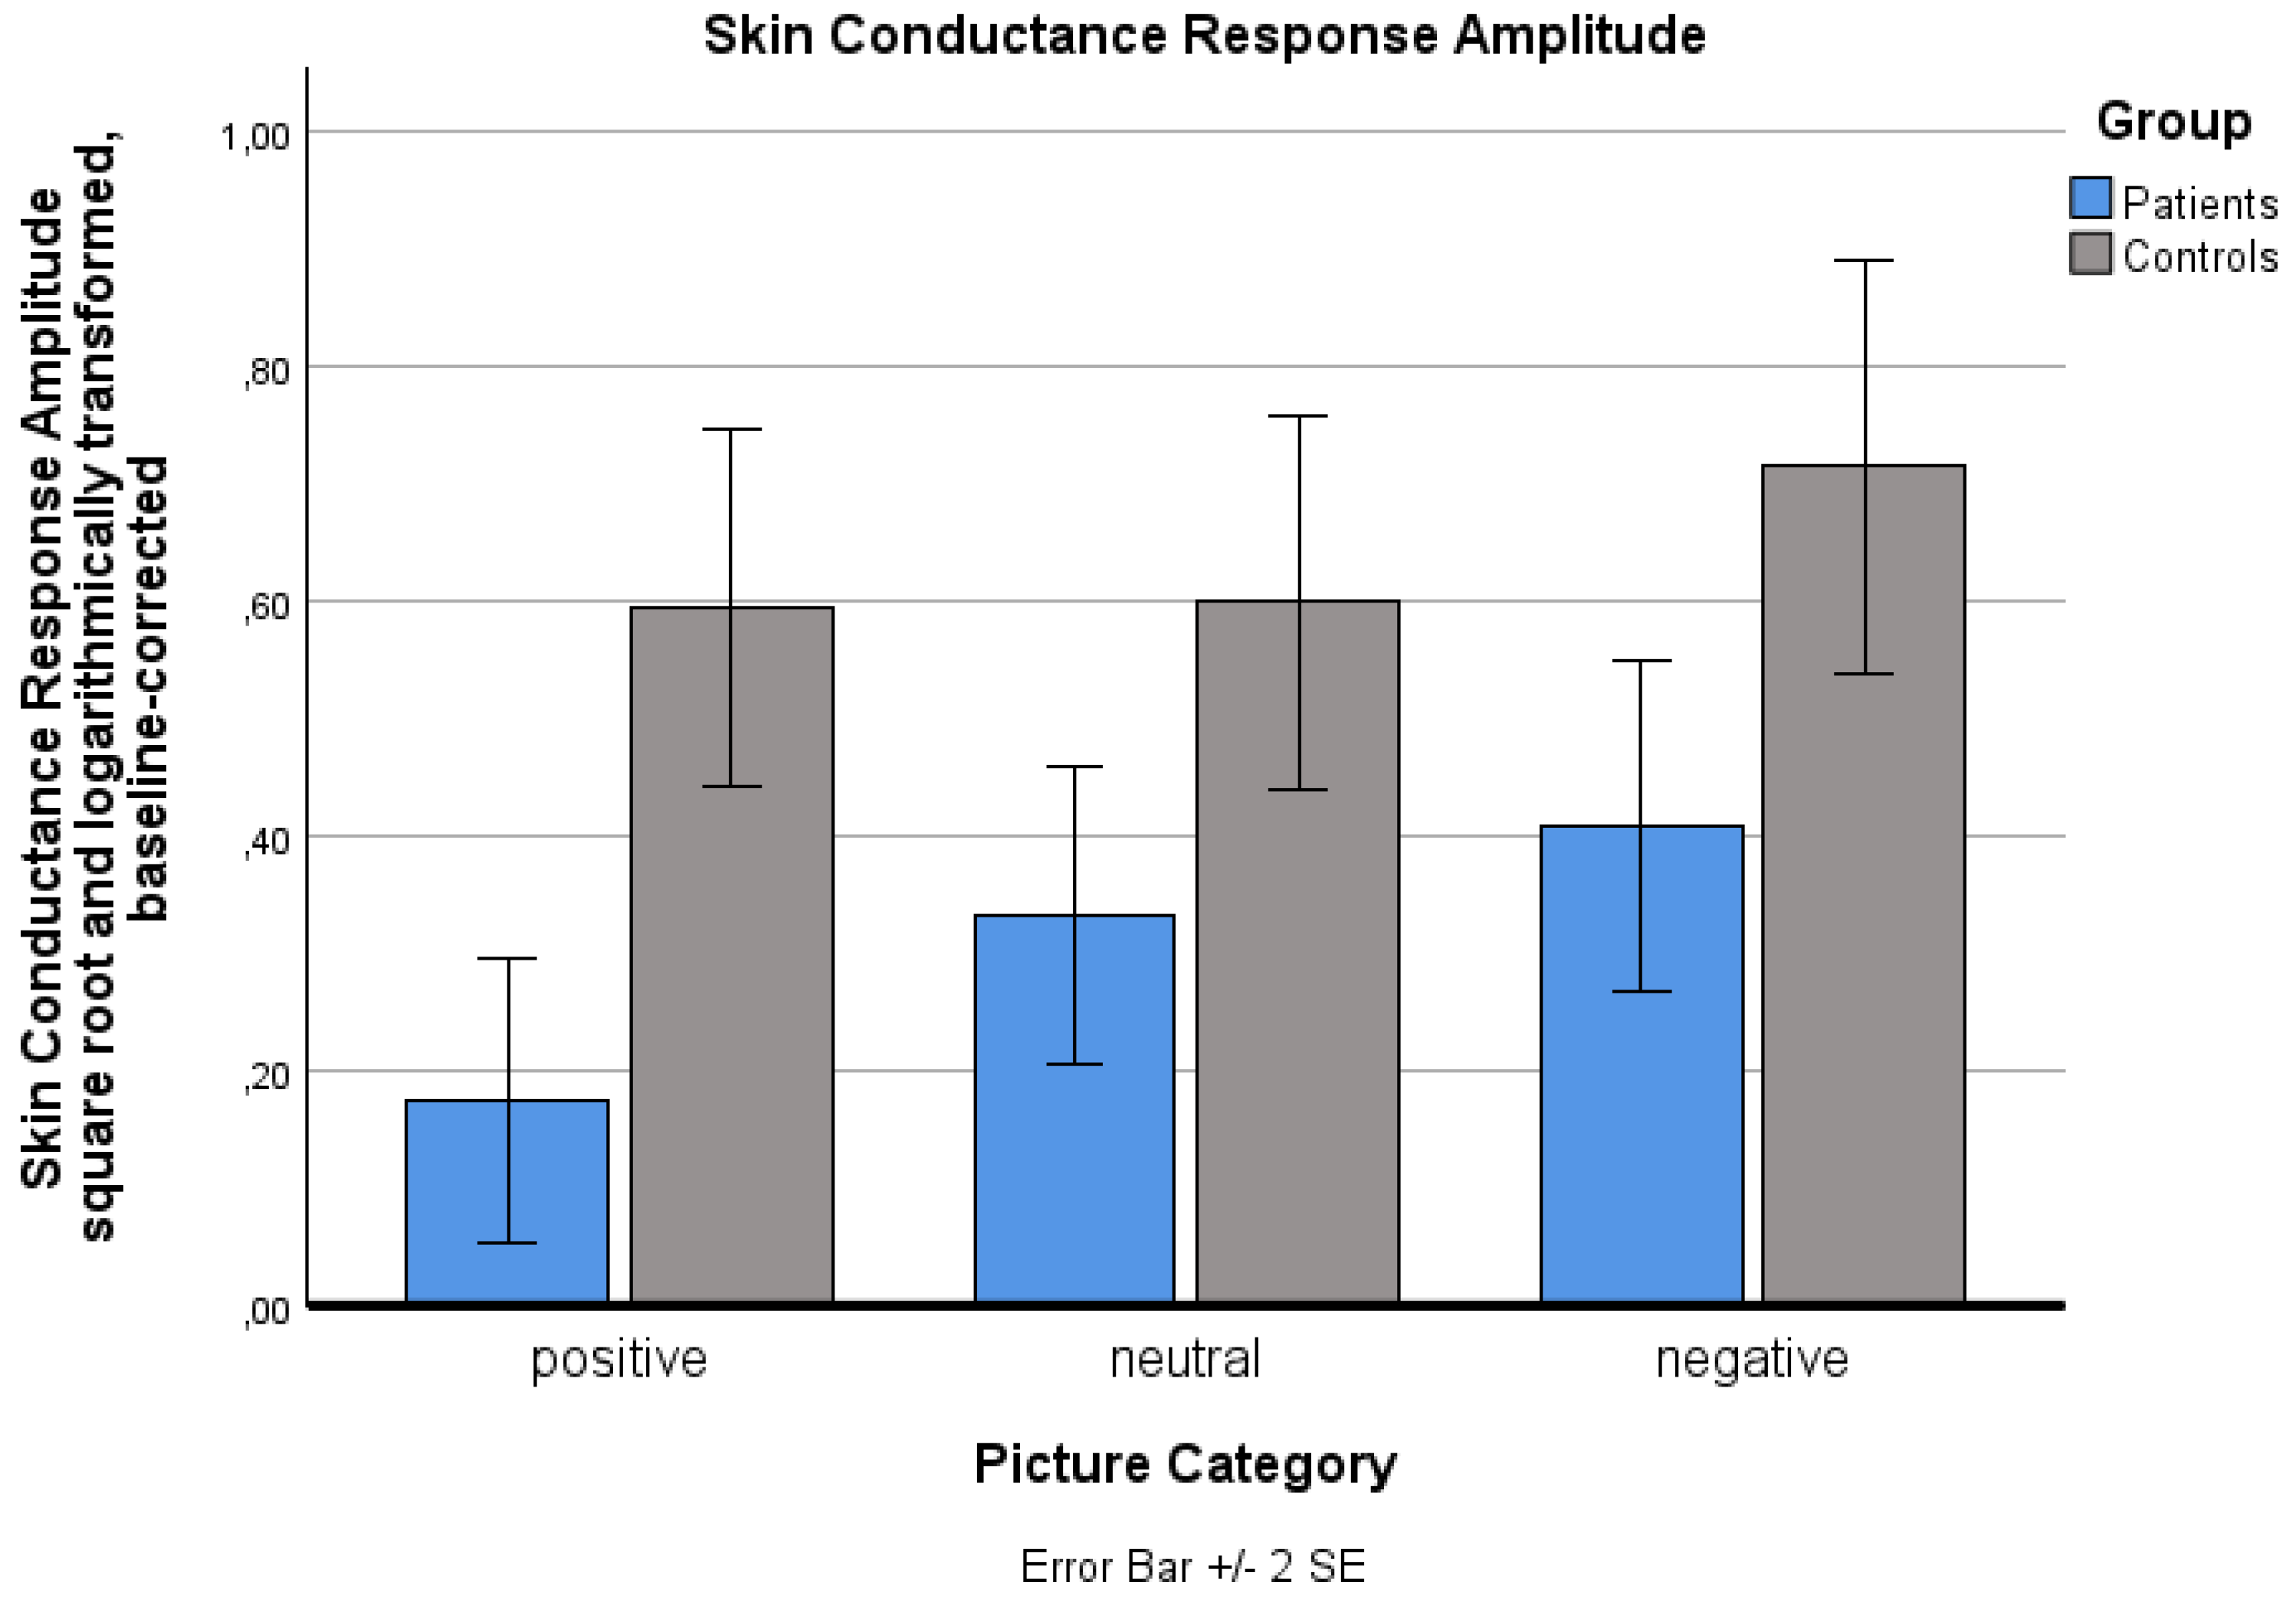
Figure 5.
Subjective Valence Reactions for the three Body Picture Categories.
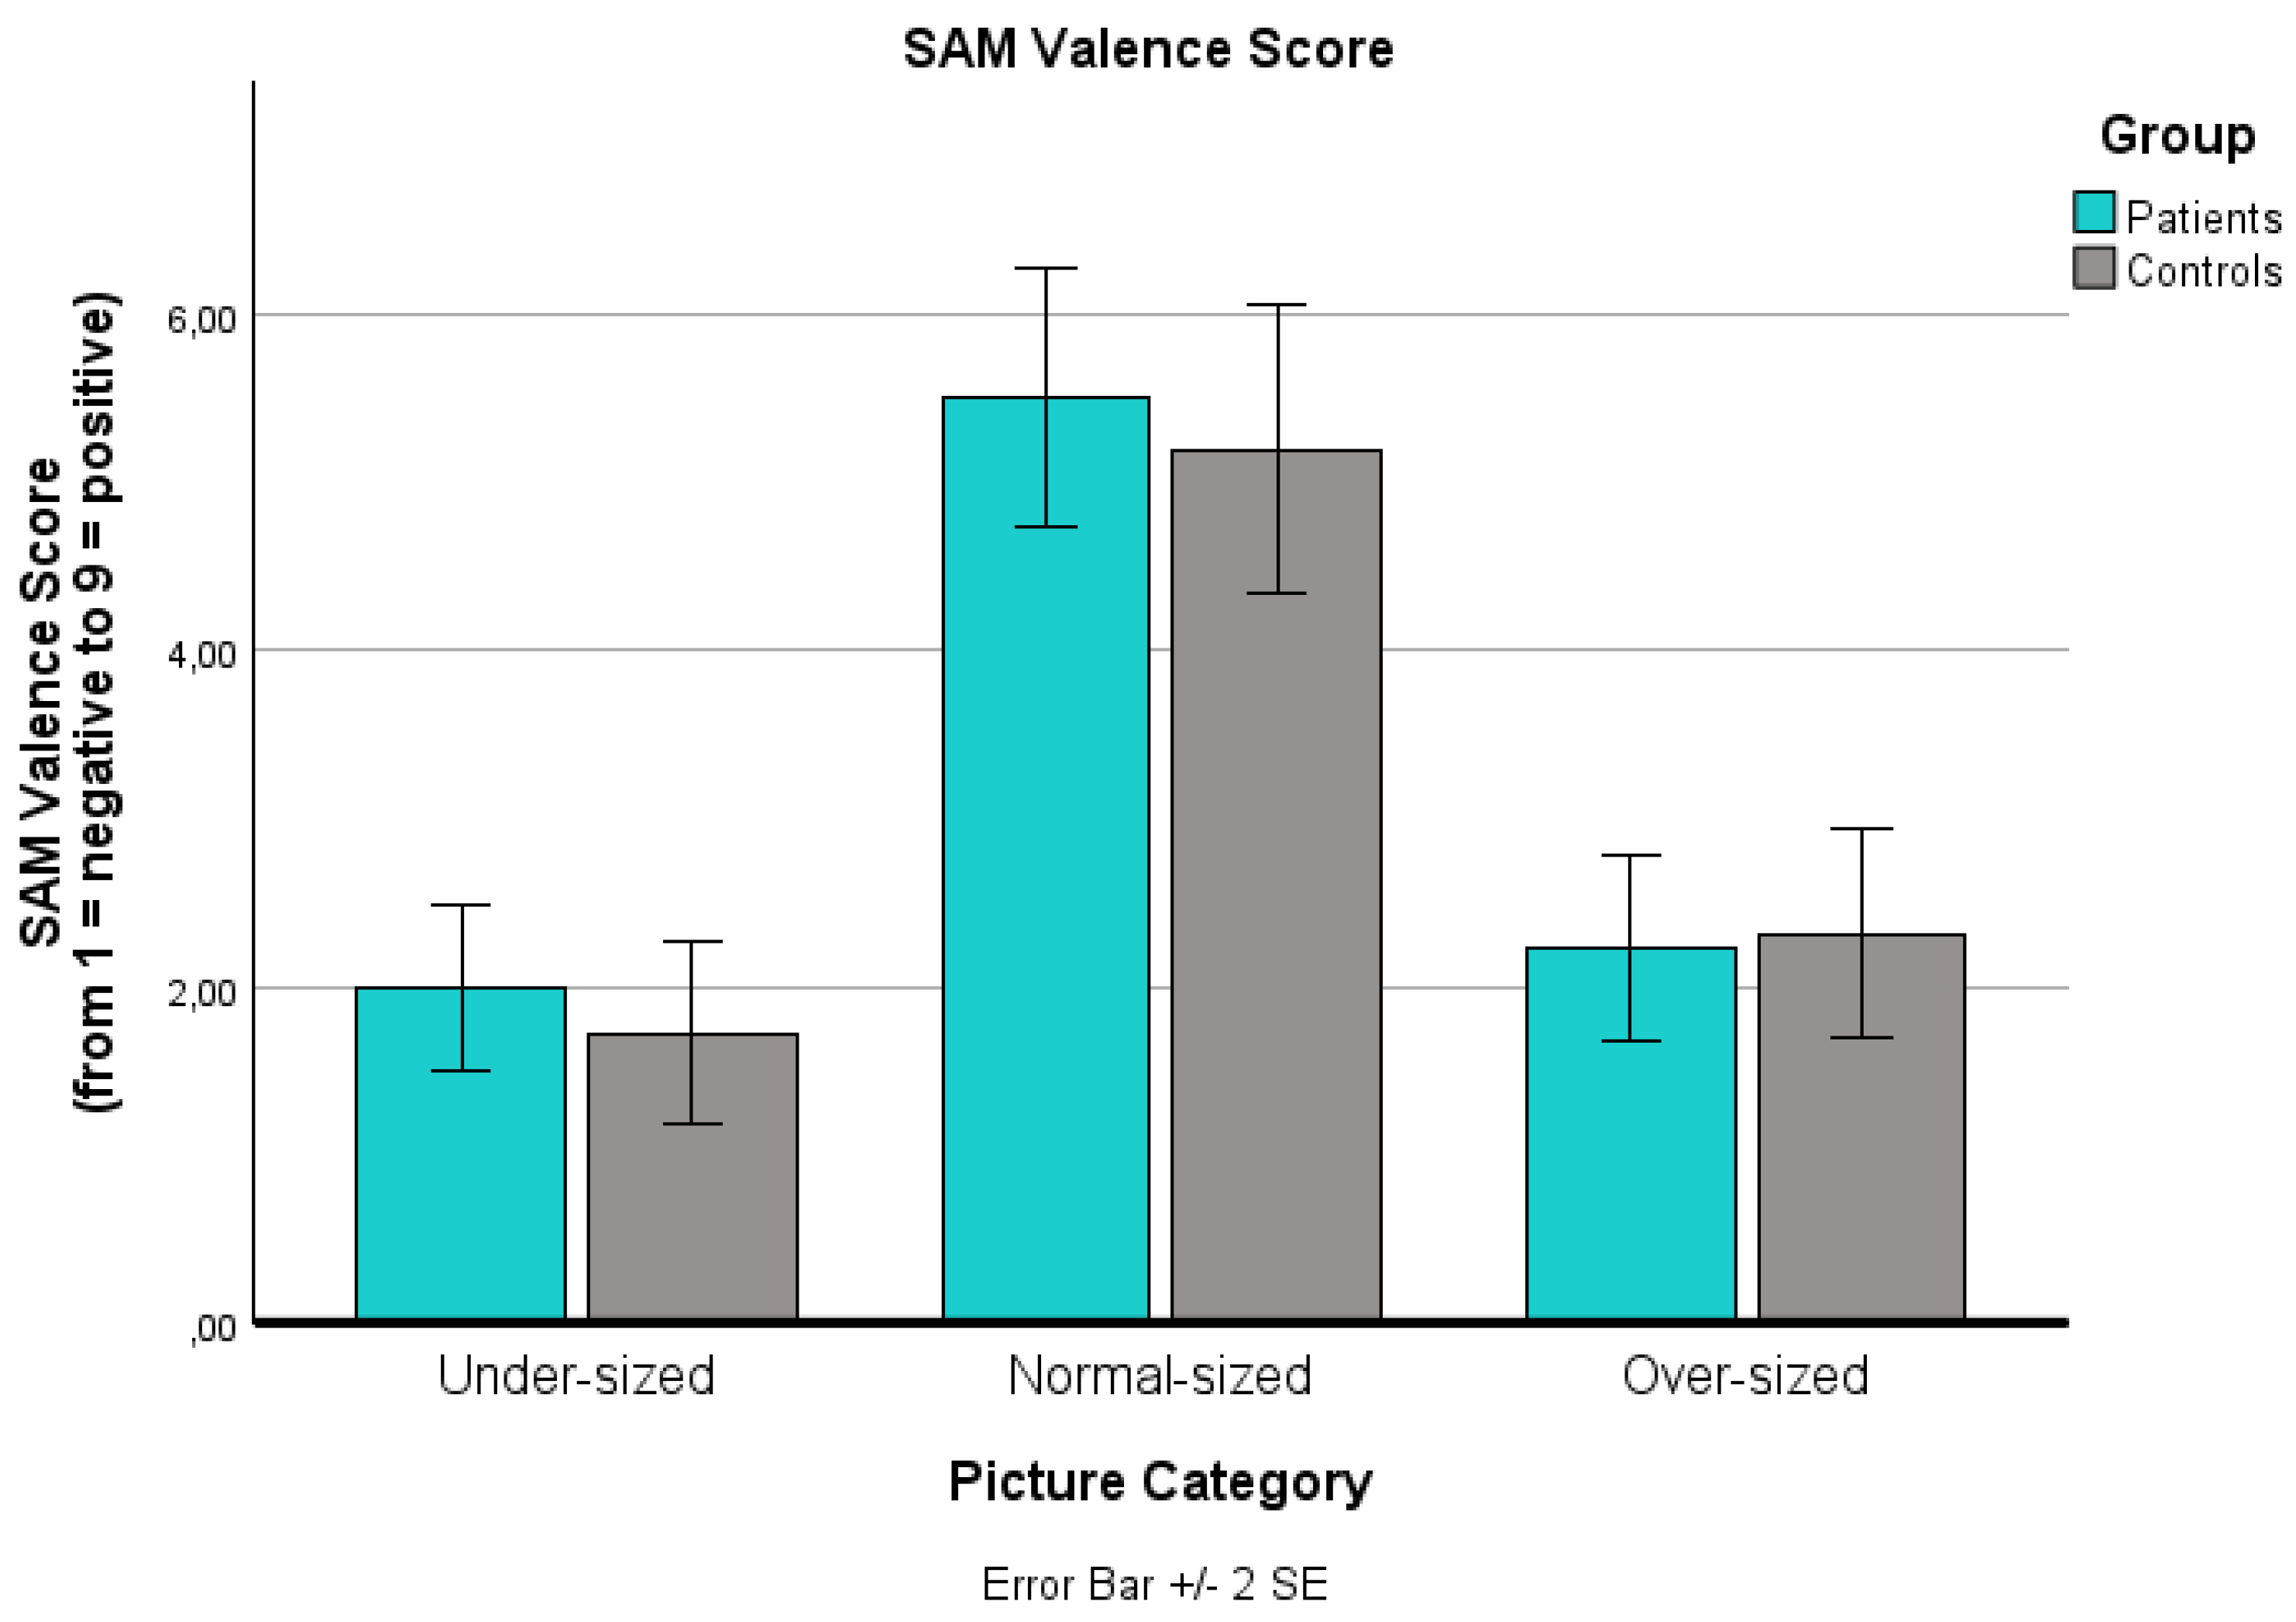
Figure 6.
Subjective Arousal Reactions for the three Body Picture Categories.

Figure 7.
Startle Reflex Reactions for the three Body Picture Categories.
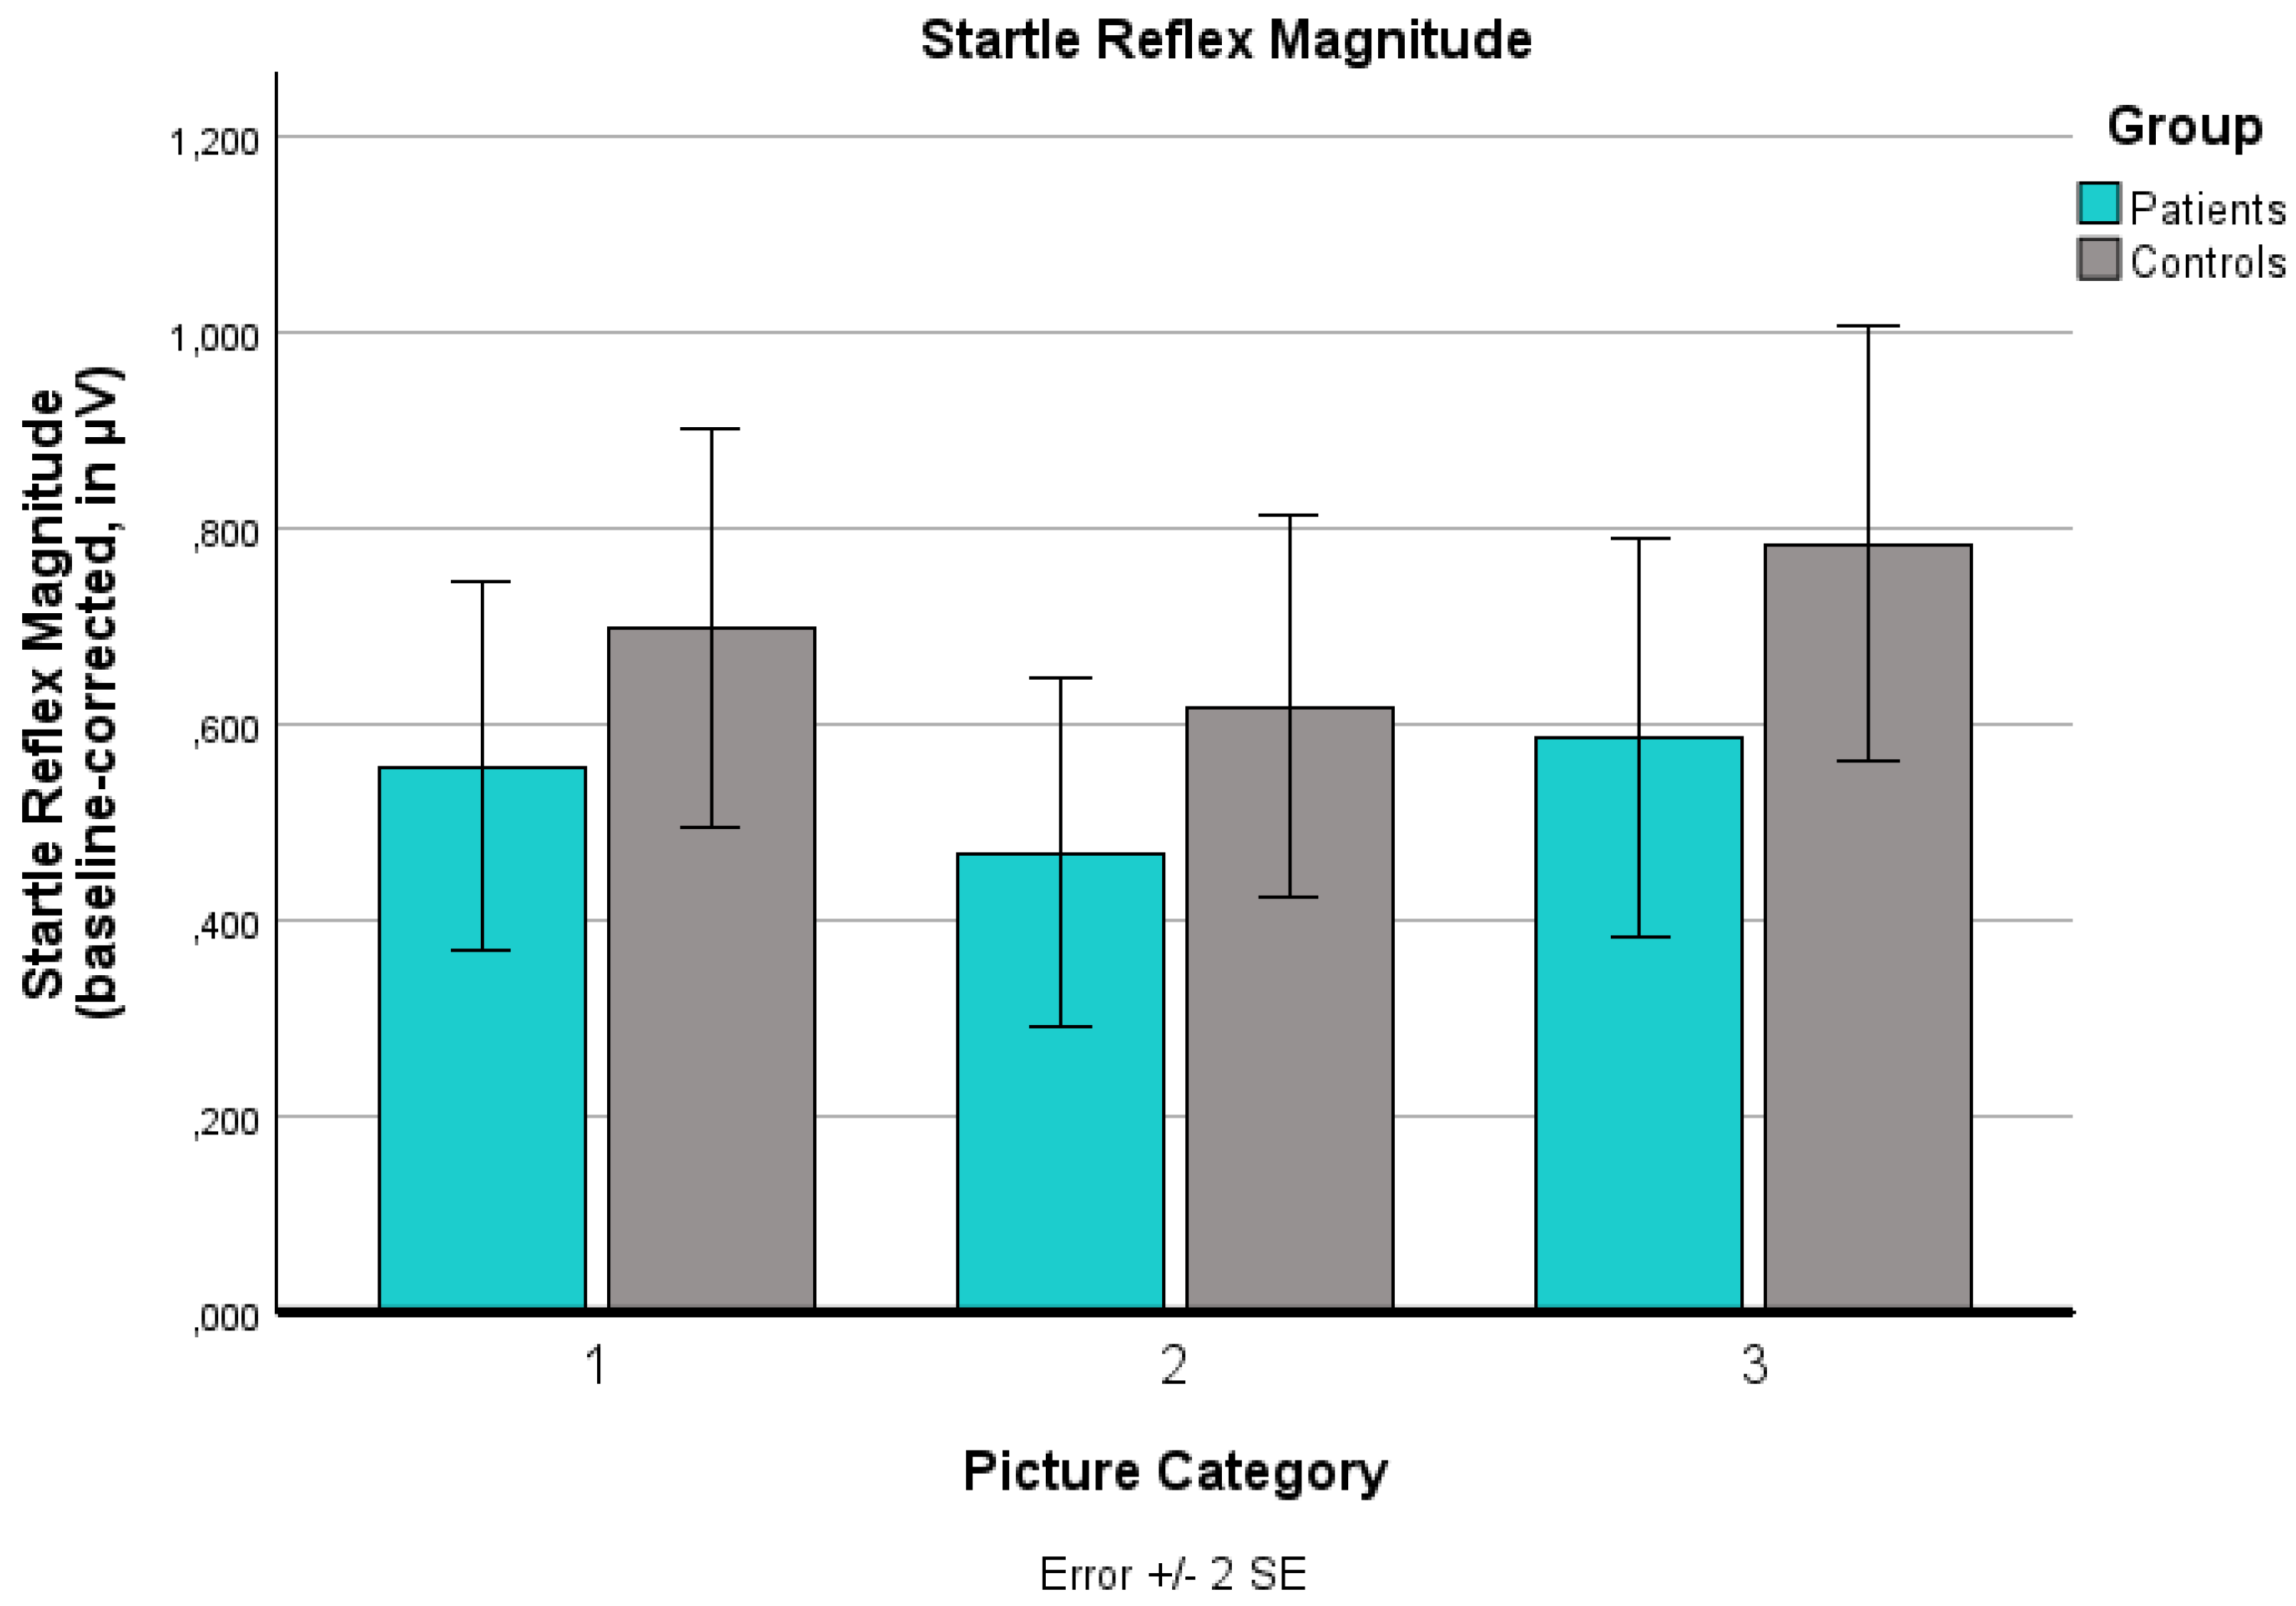
Figure 8.
Skin Conductance Reactions for the three Body Picture Categories.
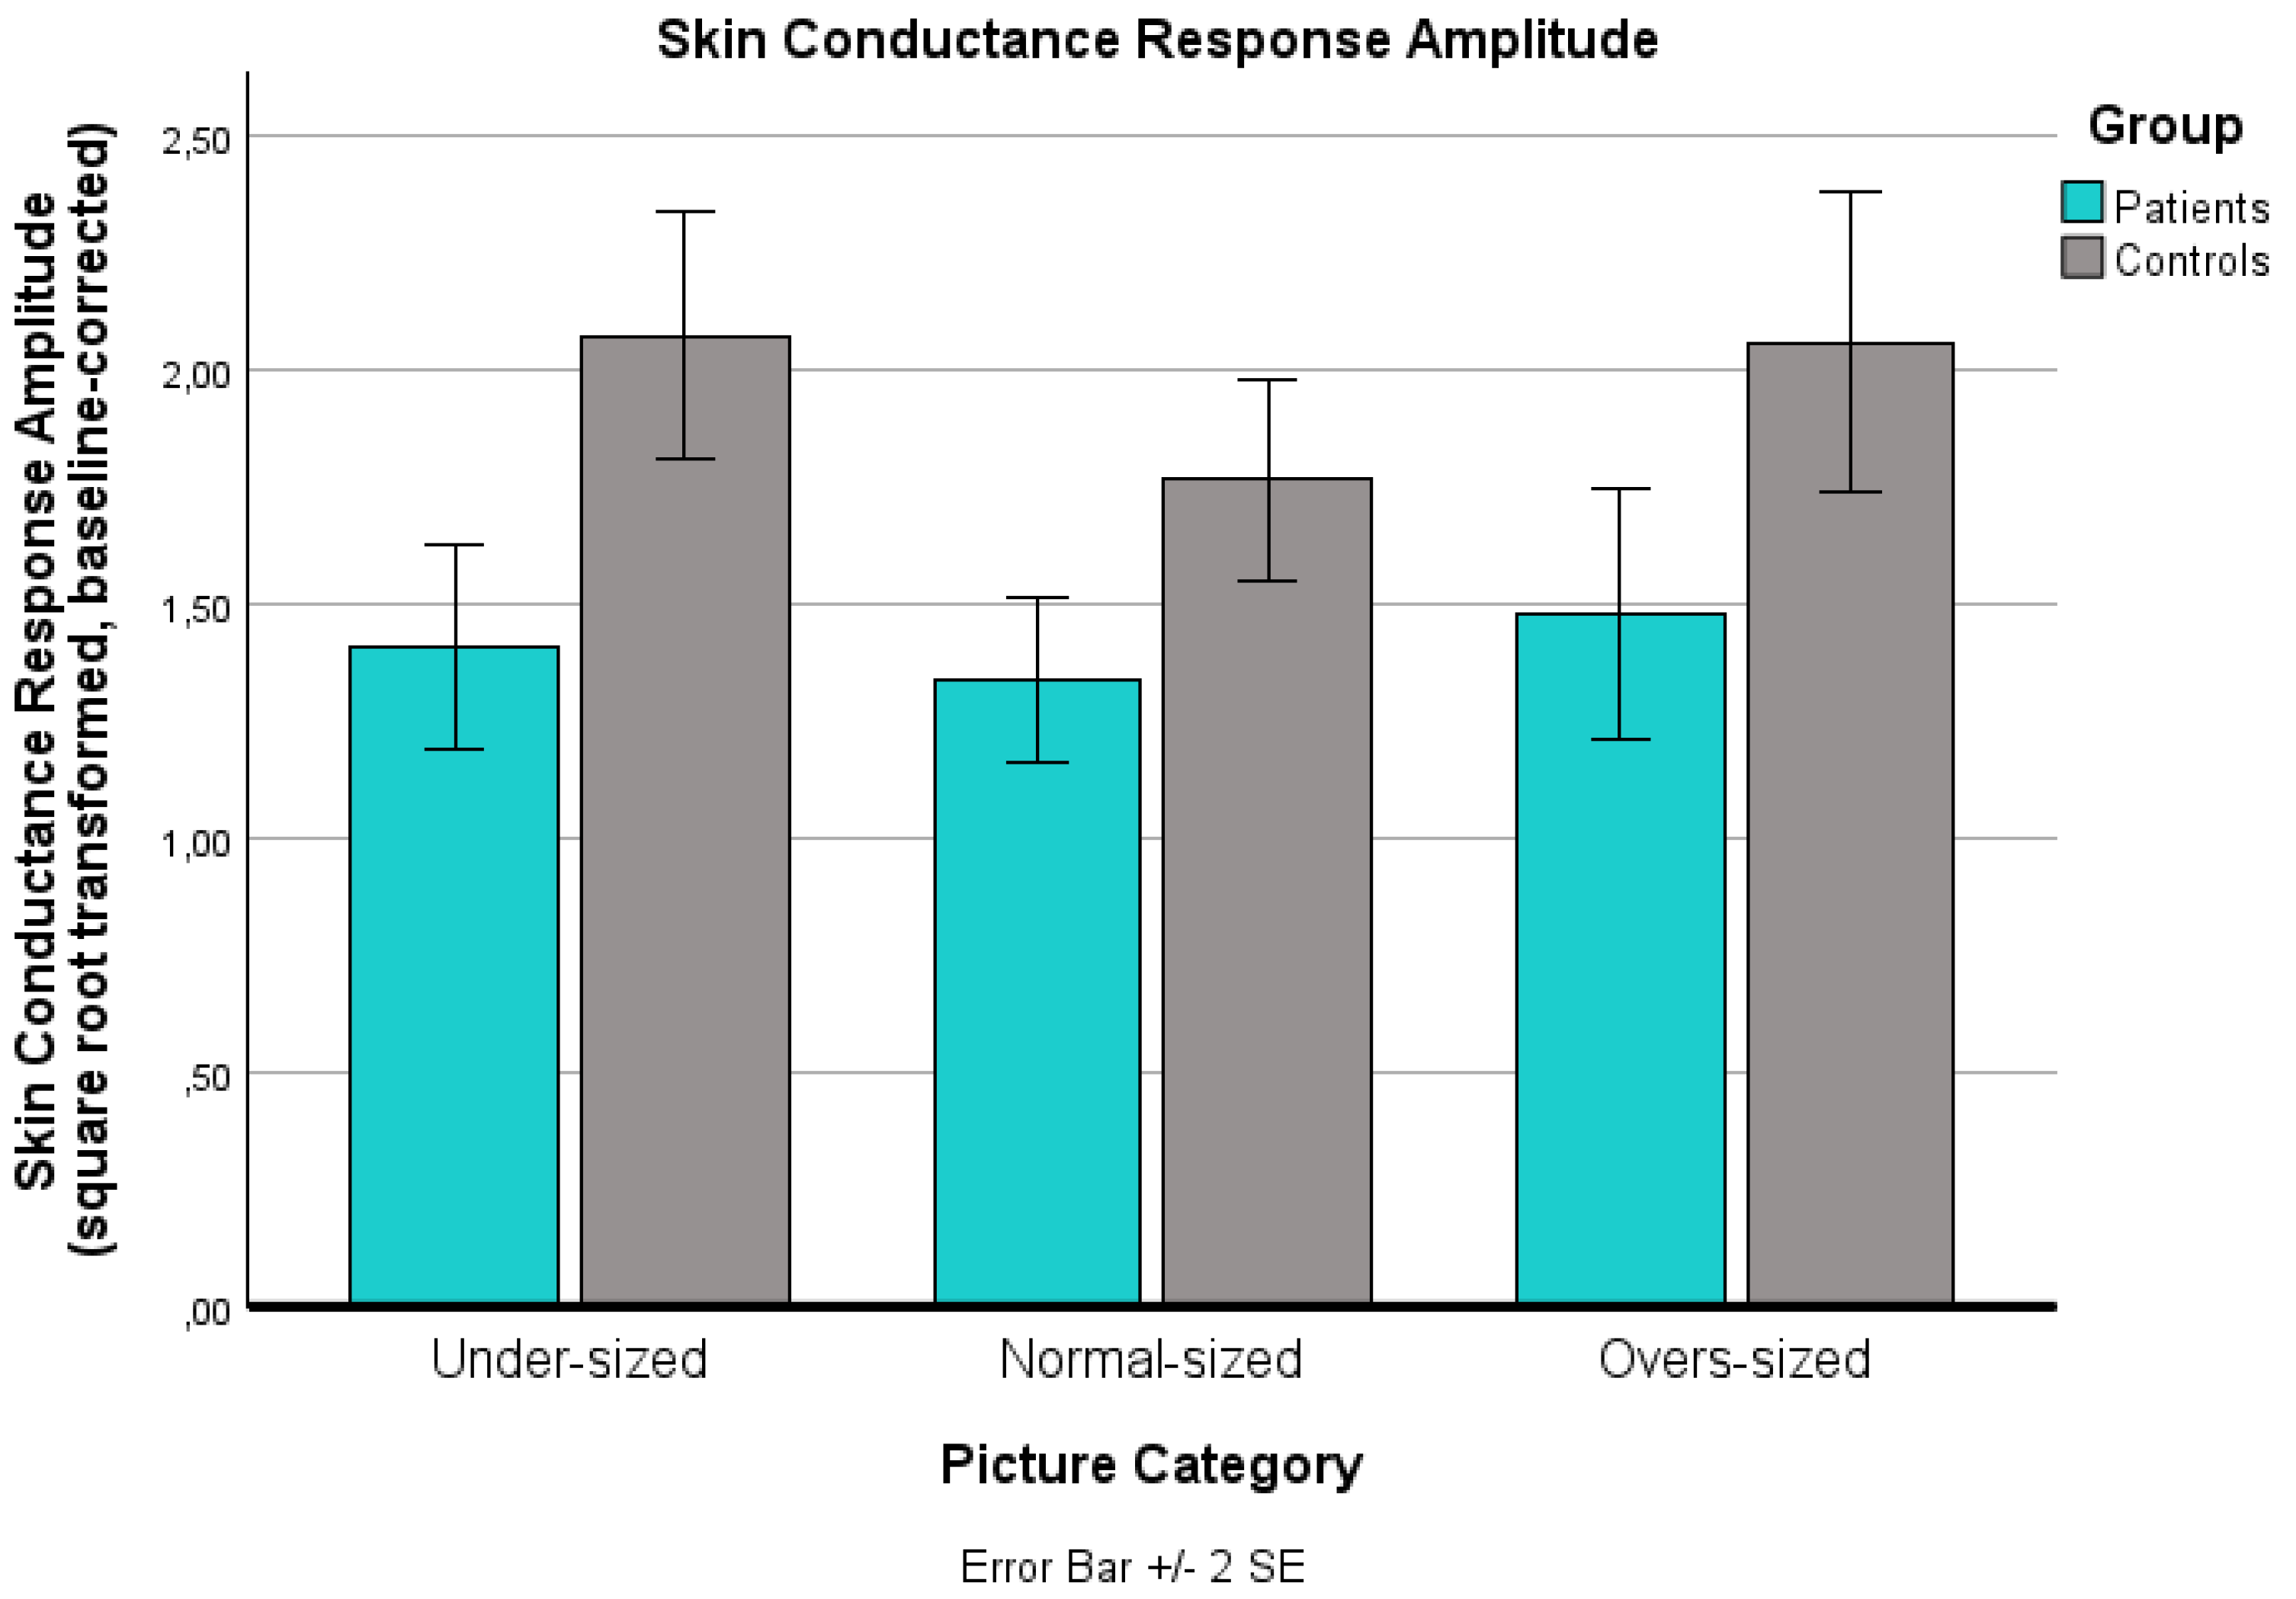

Table 1.
Demographic and Clinical Sample Characteristics.
| Overall | Patients | Controls | pPG vs. CG | |
| Age | 16.3 (2.1) | 15.6 (2.0) | 16.9 (2.0) | .057 |
| BMI | 27.3 (9.8) | 35.2 (7.9) | 19.5 (1.8) | .001** |
|
Education |
16 high level 5 middle level 2 low level |
5 high level 4 middle level 2 low level |
11 high level 1 middle level 0 low level |
.111 |
| Startle (µV) | 21.9 (13.7) | 20.2 (13.8) | 24.4 (13.8) | .432 |
| SCR (µS) | 19.8 (8.8) | 18.7 (9.6) | 21.5 (7.6) | .407 |
| TAS-26 | 58.4 (15.0) | 45.6 (12.1) | 68.6 (7.0) | < .001*** |
| IEG | -72.2 (68.5) | -43.4 (74.5) | -94.1 (56.0) | .024* |
Group differences were tested using univariate variance analyses (ANOVA for age and BMI) or Pearson-Chi-Quadrat test (for education). * p < .05; ** p < .01; *** p < .001.
Table 2.
Specific Subjective Emotions for Over-sized Bodies.
| Overall | Patients | Controls | pPG vs. CG | ||||
| Disgust | 77.8 % | 38.9 % | 38.9 % | 1.000 | |||
| Pity | 52.8 % | 33.3 % | 19.4 % | .561 | |||
|
Fear Admiration |
11.1 % 22.2 % |
8.3 % 19.4 % |
2.8 % 2.8 % |
1.000 .078t |
|||
| Neutral | 19.4 % | 13.8 % | 25.6 % | .813 |
Values indicate the percentage of participants who selected the respective emotion. Group differences were tested using Pearson-Chi-Quadrat test. * p < .05; ** p < .01; *** p < .001, t tendency.
Table 3.
Specific Subjective Emotions for Under-sized Bodies.
| Overall | Patients | Controls | pPG vs. CG | |
| Disgust | 72.2 % | 47.2 % | 25 % | .043* |
| Pity | 77.8 % | 36.1 % | 41.7 % | .459 |
|
Fear Admiration |
41.7 % 11.1 % |
16.7 % 8.3 % |
25 % 2.8 % |
.582 1.000 |
| Neutral | 11.1 % | 8,3 % | 2.8 % | 1.000 |
Values indicate the percentage of participants who selected the respective emotion. Group differences were tested using Pearson-Chi-Quadrat test. * p < .05; ** p < .01; *** p < .001.
Table 4.
Specific Subjective Emotions for Normal-sized Bodies.
| Overall | Patients | Controls | pPG vs. CG | |
| Disgust | 27.8 % | 19.4 % | 8.3 % | . 597 |
| Pity | 25 % | 19.4 % | 5.6 % | .249 |
|
Fear Admiration |
16.7 % 72.2 % |
8.3 % 44.4 % |
8.3 % 27.8 % |
1.000 1.000 |
| Neutral | 75 % | 30.6 % | 44.4 % | .036* |
Regarding the normal-sized bodies, patients (PG) and controls (CG) differed significantly in their report of neutral feelings, but not in their disgust, pity, fear, and admiration. Values indicate the percentage of participants who selected the respective emotion. Group differences were tested using Pearson-Chi-Quadrat test. * p < .05; ** p < .01; *** p < .001.
Table 5.
Visual Analogue Scale (VAS) Ratings Before and After the Experiment.
| Full Sample | Patients | Controls | PG vs. CG | |||||
| M | SD | M | SD | M | SD | pc | ||
| Pre Mood | 19.8 | 21.9 | 12.6 | 26.8 | 24.6 | 12.7 | .182 | |
| Arousal | -12.5 | 23.3 | -13.0 | 22.8 | -11.0 | 24.5 | 1.000 | |
|
Hunger Satisfaction Motivation |
15.2 -1.3 14.6 |
25.7 33.2 32.0 |
24.9 -23.7 39.4 |
23.8 25.9 14.6 |
5.0 22.5 -15.1 |
24.1 21.4 21.3 |
.038 < .001 < .001 |
|
| Post Mood | 8.9 | 18.4 | 6.4 | 21.9 | 11.1 | 14.9 | .876 | |
|
Arousal Hunger Satisfaction |
-5.7 11.1 -2.4 |
22.7 28.0 34.7 |
-0.1 24.3 -26.9 |
26.5 25.6 23.8 |
-11.7 -2.9 23.5 |
16.6 23.8 23.7 |
.266 .006 < .001 |
|
| Diff Mood | -9.5 | 21.5 | -6.2 | 23.6 | -13.0 | 19.0 | .359 | |
|
Arousal Hunger Satisfaction |
6.7 | 18.6 | 12.9 | 27.4 | 0.2 | 29.1 | .193 | |
| -4.2 | 24.3 | -6.1 | 29.1 | -7.9 | 18.1 | .380 | ||
| -1.1 | 18.6 | -3.2 | 23.0 | 1.0 | 12.8 | .516 | ||
| Motivation | -4.2 | 17.0 | -1.9 | 11.7 | -7.0 | 21.8 | .397 | |
Current mood, arousal, hunger, body satisfaction, and motivation to lose weight before and after the experiment in both groups were assessed via Visual Analogue Scales: VAS Mood (from -50: very bad to +50: very good), VAS Arousal (from -50: relaxed to +50: excited), VAS hunger (from -50: hungry to +50: fed up), VAS body satisfaction (from -50, dissatisfied, to +50, satisfied), VAS motivation (from -50: low motivation to + 50: high motivation). Group differences and pre-post-differences were tested using univariate variance analyses (ANOVA). Values are means (M) and standard deviations (SD). * p < .05; ** p < .01; *** p < .001.
Table 6.
Test for Body Image Distortion in Children and Adolescents (BID-CA) [32].
Table 6.
Test for Body Image Distortion in Children and Adolescents (BID-CA) [32].
| Overall | Patiens | Controls | Welch | df1 | df2 | pPG vs. CGc | |
| Overall | 39.3 (22.3) | 47.5 (26.8) | 29.9 (10.3) | 6.2 | 1 | 21.2 | .084 |
| Upper Arms | 8.8 (4.8) | 11.4 (4.4) | 5.8 (3.2) | 17.1 | 1 | 28.8 | < .001** |
| Upper Legs | 14.7 (10.8) | 19.3 (12.0) | 9.4 (6.1) | 9.0 | 1 | 24.3 | .024* |
| Abdomen | 15.8 (12.2) | 16.8 (16.0) | 14.7 (6.0) | < 1 | 1 | 20.9 | 1.000 |
Patients (PG) and controls (CG) differed significantly in their assessment of the own body, assessed by the difference between real and estimated circumference of the upper arms, the upper legs, the abdomen and the whole body (in centimeters). Values are means, standard deviations and degrees of freedom (df) with p-levels corrected for multiple measurements.* p < .05; ** p < .01; *** p < .001.
Table 7.
Contour Drawing Rating Scale [61].
Table 7.
Contour Drawing Rating Scale [61].
| Body Image | Overall | Patients | Controls | pPG vs. CGc |
| Real | 6.5 (1.8) | 8.2 (0.5) | 5.1 (1.1) | < .001*** |
| Ideal | 4.6 (0.9) | 4.9 (0.8) | 4.4 (1.0) | .129 |
| Expected | 5.8 (1.2) | 5.9 (1.5) | 5.7 (0.9) | .478 |
| Real - Ideal | 1.9 (1.6) | 3.4 (1.1) | 0.7 (0.9) | < .001*** |
| Expected - Real | -0.7 (2.0) | -2.3 (1.6) | 0.5 (1.4) | < .001*** |
| Expected - Ideal | 1.2 (1.1) | 1.1 (1.2) | 1.2 (1.0) | .617 |
Patients (PG) and controls (CG) differed significantly in their assessment of their real body, but not in their assessment of their ideal or expected body. The Contour Drawing Rating Scale [61] with values from 1: extremely under-sized to 9: extremely over-sized was used. Values are means and standard deviations with p-levels corrected for multiple measurements. * p < .05; ** p < .01; *** p < .001.
Table 8.
Startle Reflex Magnitude during Viewing of Body Pictures after Inclusion of the BID-CA Score, the IEG Score, and the Contour Drawing Rating Scale Score as Covariates.
Table 8.
Startle Reflex Magnitude during Viewing of Body Pictures after Inclusion of the BID-CA Score, the IEG Score, and the Contour Drawing Rating Scale Score as Covariates.
| Main Effect Body Picture Category | F | df1 | df2 | p | |
|
Patients BID-CA Score IEG Score Contour Drawing Rating Scale |
1.6 1.2 1.2 |
2 2 2 |
30 28 30 |
.210 .324 .309 |
|
|
Controls BID-CA Score IEG Score Contour Drawing Rating Scale |
3.4 3.7 18.2 |
1.3 1.2 1.3 |
23.5 23.5 24.5 |
.067t .059t .001** |
|
After inclusion of the BID-CA score [32], the IEG score [54], and the Contour Drawing Rating Scale score (Thompson and Gray, 1995) as covariates, the startle reflex findings remained stable. The influence of these covariates was tested using analyses of covariance (ANCOVA) with group (patients vs. controls) and picture category (under-sized, normal-sized, over-sized) as factors. Values are F-values (F), degrees of freedom (df), and p-values (p), if necessary, corrected for multiple measurements using Bonferroni (pc). * p < .05; ** p < .01; *** p < .001; t = tendency.
Table 9.
Skin Conductance Response (SCR) during Viewing the Body Pictures after Inclusion of the BID-CA Score, the IEG Score, and the Score of the Contour Drawing Rating Scale as Covariates.
Table 9.
Skin Conductance Response (SCR) during Viewing the Body Pictures after Inclusion of the BID-CA Score, the IEG Score, and the Score of the Contour Drawing Rating Scale as Covariates.
| Main Effect Group | F | df1 | df2 | p |
|
Overall BID-CA Score IEG Score Contour Drawing Rating Scale |
12.2 14.8 7.7 |
1 1 1 |
17 19 21 |
.003** < .001*** .011** |
After inclusion of the BID-CA score [32], the IEG score [54], and the Contour Drawing Rating Scale score (Thompson and Gray, 1995) as covariates, the SCR findings remained stable. The influence of these covariates was tested using analyses of covariance (ANCOVA) with group (patients vs. controls) and picture category (under-sized, normal-sized, over-sized) as factors. Values are F-values (F), degrees of freedom (df), and p-values (p), if necessary, corrected for multiple measurements using Bonferroni (pc). * p < .05; ** p < .01; *** p < .001; t = tendency.
Disclaimer/Publisher’s Note: The statements, opinions and data contained in all publications are solely those of the individual author(s) and contributor(s) and not of MDPI and/or the editor(s). MDPI and/or the editor(s) disclaim responsibility for any injury to people or property resulting from any ideas, methods, instructions or products referred to in the content. |
© 2025 by the authors. Licensee MDPI, Basel, Switzerland. This article is an open access article distributed under the terms and conditions of the Creative Commons Attribution (CC BY) license (http://creativecommons.org/licenses/by/4.0/).
Copyright: This open access article is published under a Creative Commons CC BY 4.0 license, which permit the free download, distribution, and reuse, provided that the author and preprint are cited in any reuse.


