
Submitted:
23 October 2025
Posted:
28 October 2025
You are already at the latest version
Abstract
In recent years, global shocks such as the COVID-19 pandemic, geopolitical conflicts, and trade tensions have amplified volatility in financial markets, increasing the frequency of price turning points. This study addresses the need for artificial intelligence models that are not only predictive but also interpretable. Traditional econometric approaches, such as ARIMA and GARCH, effectively capture linear dependencies yet fail to model nonlinear market dynamics. Machine learning methods, while powerful, often lack transparency. To bridge this gap, this paper proposes an explainable hybrid framework integrating ARIMA, LSTM, and SHAP algorithms. Using daily data from ten major global stock indices (2010–2025), the model employs a hybrid labeling approach that combines price extrema, RSI, and MACD indicators, and enhances forecasting by incorporating ARIMA residual–based feature fusion. Performance is assessed through both statistical (F1-score, PR-AUC, RMSE) and economic (Sharpe ratio) metrics under walk-forward validation. Results demonstrate that the ARIMA–LSTM–SHAP model provides the most balanced trade-off between accuracy and economic efficiency, achieving F1 = 0.60 and Sharpe > 1.5. The findings highlight the framework’s practical value for investors and policymakers, offering early detection of turning cycles and improved risk-informed decision-making.
Keywords:
turning-point detection
; explainable artificial intelligence
; behavioral finance
; adaptive market hypothesis
; economic validation
1. Introduction
Recent studies have shown that the intersection of stock market volatility, macroeconomic fluctuations, monetary policy adjustments, and investor behavioral responses has a systemic impact on financial stability and global capital flows. The interplay of these forces frequently induces abrupt turning points in price dynamics, resulting in short-term surges in volatility and sharp reversals in asset valuations.
Historically, global shocks such as the Great Depression of the 1930s, Black Monday in 1987, the dot-com bubble in 2000, the global financial crisis of 2008, and the COVID-19 pandemic have strengthened market interlinkages and contagion effects, thereby amplifying both the frequency and depth of volatility cycles (Forbes & Rigobon, 2002). In this context, the capacity to anticipate sudden market shifts, particularly the detection of turning points between bullish and bearish phases, has become crucial for improving trading strategies, enhancing risk management, and supporting informed investment decisions. Consequently, the early identification of turning points represents a strategic priority for investors, policymakers, and risk managers seeking to enhance financial system resilience in the face of heightened uncertainty.
In recent years, detecting turning points or abrupt structural changes has gained increasing significance across multiple research domains. Change-point detection methods have evolved into indispensable statistical tools for identifying structural transitions, analyzing their causes, and understanding their implications. Detecting turning points enables researchers to assess changes in data characteristics, monitor performance dynamics, and issue early-warning signals that inform decision-making. Applications of turning-point analysis span various disciplines, including industrial engineering, healthcare, human-activity recognition, financial data analytics, and climate modeling (Chen & Li, 2019; Khan & Nazir, 2017; Habibi, 2021; Jaiswal et al., 2015). The conceptual basis of turning-point analysis can be traced back to the 1950s, when it was first used in quality control to identify mean shifts in independent and identically distributed Gaussian variables (Page, 1954).
The cyclical movements of asset prices are not random phenomena but are shaped by the combined effects of economic policy actions, information dissemination, and investor psychology (Kahneman & Tversky, 1979; De Bondt & Thaler, 1985). Nevertheless, conventional econometric frameworks such as ARIMA, GARCH, and Markov-switching models often fail to capture the intrinsic nonlinear dynamics, behavioral asymmetries, and structural breaks that characterize financial markets. As a result, these models tend to produce false signals and exhibit lagged responses in turning-point identification (Engle, 1982; Bollerslev, 1986; Hamilton, 1989; Cont, 2001). Moreover, few empirical studies have effectively integrated these traditional approaches with explainable artificial intelligence (XAI) methodologies, leaving a research gap between theoretical postulates and empirical validation in turning-point analysis.
Machine learning (ML) and deep learning (DL) algorithms have recently become dominant in financial time-series modeling, significantly advancing the detection of turning points. Models such as LSTM (Hochreiter & Schmidhuber, 1997), CNN, and XGBoost demonstrate strong capabilities for capturing long-term dependencies and complex temporal patterns. However, their inherent black-box nature limits interpretability, constraining economic validation and decision confidence in practical financial applications (Fischer & Krauss, 2018; Rudin, 2019). Furthermore, existing empirical research often exhibits generalization bias, as most studies focus on developed markets, particularly the U.S. S&P 500 and NASDAQ indices, while providing limited validation for emerging economies (Bekaert, Harvey, & Mondino, 2023; Diebold & Yilmaz, 2012).
These issues can be theoretically explained through the Efficient Market Hypothesis (EMH) (Fama, 1970), the Adaptive Market Hypothesis (AMH) (Lo, 2004), and Behavioral Finance Theory (2019). The EMH posits that markets fully incorporate all available information, implying that the consistent prediction of trend reversals is inherently restricted. Behavioral Finance Theory, by contrast, attributes short-term momentum and reversals to psychological biases such as overconfidence, herding behavior, and overreaction (Kahneman & Tversky, 1979; De Bondt & Thaler, 1985). The AMH unifies these perspectives, suggesting that market efficiency evolves dynamically and adapts to macroeconomic shocks (Lo, 2004).
Building upon these theoretical foundations, Explainable Artificial Intelligence (XAI) has emerged as a novel paradigm linking theoretical models with empirical analysis. Approaches such as SHAP (Lundberg & Lee, 2017) enhance transparency by clarifying the internal logic of ML models at the feature level, thus increasing interpretability and trust in decision-making (Rudin, 2019). Despite progress, existing hybrid models, such as ARIMA-LSTM, which combine linear decomposition with nonlinear temporal learning, while improving turning-point detection accuracy, still lack sufficient economic validation and cross-market generalization (Zhang, 2003).
2. Literature Review
The prediction of turning points in asset prices represents a core theme in early-warning research on financial cycles, as it reflects the interaction between macroeconomic shocks, investor behavior, and the adaptive nature of markets. The Efficient Market Hypothesis (EMH) posits that markets fully absorb all available information, implying that the consistent prediction of price movements is inherently limited (Fama, 1970). In contrast, Behavioral Finance Theory highlights investors’ psychological biases and behavioral tendencies such as herding and overconfidence, which play a direct role in the formation of turning points (Kahneman & Tversky, 1979; De Bondt & Thaler, 1985; Statman, 2019).
A growing body of empirical research has examined volatility clustering, contagion, and network effects in financial markets (Cont, 2010; Forbes & Rigobon, 2002; Diebold & Yilmaz, 2012; Ahelegbey, Billio, & Casarin, 2024). These studies have deepened the understanding of market interconnectedness, spillover mechanisms, and the propagation of systemic risk. The Adaptive Market Hypothesis (AMH) offers a dynamic perspective by suggesting that market efficiency evolves over time and that structural changes become more pronounced during macroeconomic shocks (Lo, 2004).
Technical indicators, such as the Moving Average (MA), Exponential Moving Average (EMA), Relative Strength Index (RSI), On-Balance Volume (OBV), and Moving Average Convergence Divergence (MACD), remain widely applied to analyze price trends in financial markets. Although practical, these indicators are sensitive to market noise and often generate false or delayed signals (Lahmiri, 2018; Picasso et al., 2019). When used individually, they tend to overreact to short-term fluctuations, leading to lagged or distorted trend identification. In a related contribution, Tsolmon, Erdenetsogt, and Azzaya (2025) introduced a time-based approach for detecting stock market turning points, grounded in Gann’s cyclical time theory. Their study statistically validated the probability of turning points above 70 percent using ANOVA and the Games-Howell test, confirming the applicability of Gann’s framework under emerging-market conditions.
Traditional statistical models such as ARIMA, GARCH, and Markov-switching effectively capture linear relationships but fail to reflect nonlinear dynamics and structural breaks (Adegboye, 2021; Engle, 1982; Bollerslev, 1986; Hamilton, 1989). These models remain limited in their ability to detect early-warning signals, as they cannot fully accommodate the nonlinear behavior, multi-frequency dynamics, and abrupt structural shifts common in financial markets (Cont, 2010).
Recent advances in deep learning have significantly improved the modeling of financial time series. Models such as LSTM and CNN capture long-term dependencies with high precision but remain limited in economic interpretability (Hochreiter & Schmidhuber, 1997; Fischer & Krauss, 2018; Chen, Pelger, & Zhu, 2021). Hybrid architectures such as CNN, LSTM, and ResNet have further improved classification performance by using two-dimensional segmented image inputs to identify turning points (Khodaee, Esfahanipour, & Mehtari Taheri, 2022). Similarly, the Multipersistence Topological Network (MPCNet), which integrates graph-based information and technical chart patterns, enhances both accuracy and robustness in turning-point prediction (Li, Liu, Chen, Wu, & Xu, 2024).
Topological Data Analysis (TDA) has also been applied to detect change points using persistent homology, allowing the identification of both short-term and long-term volatility patterns (Yao, Li, Wu, Yang, & Wang, 2025). Additionally, adaptive change-point detection (CPD) methods based on deep learning enable real-time analysis of data streams and reduce false alarms (Gupta, Wadhvani, & Rasool, 2022). An automated framework for change-point detection using neural network representations has demonstrated superior performance compared with the conventional CUSUM test (Li, Fearnhead, Fryzlewicz, & Wang, 2024).
In the field of jump detection, hybrid models that integrate machine learning algorithms have proven effective in capturing short-term abrupt fluctuations (Au Yeung, Wei, Chan, Lau, & Yiu, 2020). For high-frequency data, stochastic optimization-based turning-point detection models have been shown to reduce market noise and error rates (Zhan & Liu, 2025). The Wavelet ARIMA LSTM hybrid framework has achieved stable predictive performance even during the COVID-19 crisis by decomposing linear and nonlinear components across multiple frequency levels (Zhang, Liu, Bai, & Li, 2024). Moreover, the combined DAE LSTM model has demonstrated that integrating statistical and deep learning methods can predict market change points up to one week in advance (Yoo et al., 2021).
Explainable artificial intelligence (XAI) approaches, such as SHAP and LIME, have emerged as innovative methods that interpret the decision logic of black-box models, enabling the economic validation of predictive frameworks (Muhammad, Ahmed, Naveed, & Bendechache, 2024). Although deep learning studies have produced promising results, their limited interpretability continues to create a black-box challenge, restricting economic justification (Rudin, 2019). Furthermore, most empirical research remains focused on developed markets such as the U.S. S&P 500 and NASDAQ, resulting in single-market bias and limited model generalization for emerging economies (Bekaert, Harvey, & Mondino, 2023; Diebold & Yilmaz, 2012).
In summary, while substantial progress has been made in turning-point detection in financial markets, several challenges remain. These include the sensitivity of indicator-based methods to market noise, the limited flexibility of traditional statistical models in capturing nonlinearities, the weak interpretability and single-market bias of machine and deep learning models, and the absence of comprehensive economic validation. To address these limitations, this study integrates the theoretical foundations of the Efficient Market Hypothesis (EMH), the Adaptive Market Hypothesis (AMH), and Behavioral Finance Theory with an explainable hybrid machine learning framework. The proposed ARIMA LSTM SHAP model combines the linear component (ARIMA), the temporal deep learning architecture (LSTM), and the explainable module (SHAP) to improve the performance, interpretability, and reliability of turning-point detection in financial markets.
- • RQ1. Does the Explainable Hybrid Model (ARIMA–LSTM–SHAP) outperform traditional ML and DL approaches? H1. The hybrid model achieves statistically significant improvements in F1-score and Sharpe ratio compared with conventional models.
- • RQ2. Does the hybrid labeling approach reduce false signals? H2. The hybrid labeling method significantly lowers the false-positive rate in turning-point detection.
- • RQ3. Do SHAP and the Stability Index (SSI) enhance model interpretability? H3. The SHAP-based explainability module enhances the stability of feature importance contributions and increases the likelihood of achieving SSI ≥ 0.8.
- • RQ4. Do turning-point frequencies differ between developed and emerging markets? H4. Emerging markets exhibit statistically higher frequencies of turning points than developed markets.
3. Methodology
This study applies an explainable hybrid time-series methodology that integrates turning-point detection and forecasting within a unified analytical framework. The approach combines the statistical linear component (ARIMA), the nonlinear temporal structure of deep learning (BiLSTM), and the interpretability of explainable artificial intelligence (SHAP) within a single pipeline. Daily OHLCV data from ten major global stock indices were analyzed for the period January 2010 to September 2025. Data were obtained from the Yahoo Finance API and split into training (80%), validation (10%), and testing (10%) sets using a chronological split. Missing values were treated by interpolation and forward fill, and a logarithmic transformation was applied to stabilize variance and normalize distributions.
Turning points (TP = 1) were identified through a two-stage labeling procedure. In the first stage, a clock-time extremum rule examined a ±3-day window with price deviations of 3 percent or more. A point was labeled TP = 1 when RSI(14) reached 30 or below for troughs, or 70 or above for peaks, and when the MACD histogram changed by at least two units. In the second stage, the directional-change (DC) method was used to compute event length and overshoot, filtering out overly sensitive signals. This procedure reduced class imbalance and captured more realistic pre-signal patterns preceding market reversals.
Feature engineering integrated three groups of variables. The directional-change group included event length, overshoot, and directional duration. The technical-indicator group comprised RSI, Bollinger Band width, ATR, Momentum, OBV, moving-average crossover, and volume spikes. The AI-driven group included ARIMA residuals, GARCH variance, rolling correlation, and lagged returns. All variables were standardized using z-score normalization, and multicollinearity was controlled with the Variance Inflation Factor threshold (VIF < 5). Feature importance was evaluated through SHAP-based recursive elimination, and stability was confirmed with a SHAP Stability Index above 0.8.
The model architecture consisted of four sequential stages. First, an ARIMA (1, 0, 1) model was used to extract linear components and residuals. Second, residuals and selected features were input into a Bidirectional LSTM network with 64 units, a dropout rate of 0.3, and the Adam optimizer (learning rate 0.001). Third, the SHAP module quantified the marginal contribution of each feature and verified model stability using the SHAP Stability Index. Finally, economic validation linked statistical and financial metrics. Statistical evaluation used F1-score, PR-AUC, and RMSE, while economic performance was measured through the Sharpe ratio to assess risk-adjusted returns.
This integrated design strikes a balance between predictive performance and interpretability. The ARIMA component captures linear trends, the BiLSTM models nonlinear temporal dependencies, and the SHAP provides transparent feature-level insights. Together, these elements form a coherent framework for real-time detection and forecasting of market turning points, offering both analytical rigor and practical relevance for decision-making in volatile financial environments.
The model’s decision threshold (τ) was optimized within the range of 0.1 to 0.9 using a dual-objective approach that balanced statistical accuracy and economic efficiency. The optimization criterion was defined as the intersection of statistical and financial metrics, expressed as τ = arg max τ ∈ [0.1, 0.9] [F1(τ) ∩ Sharpe(τ)]. This ensured an optimal trade-off between predictive precision and financial performance. To address class imbalance, the Synthetic Minority Oversampling Technique combined with Edited Nearest Neighbors (SMOTE ENN) was applied. At the same time, class-weight adjustments were implemented in the deep-learning stage to minimize false positives in rare-event detection.
Probability calibration using Platt scaling and isotonic regression further improved the reliability of output probabilities. Model evaluation covered two categories of metrics. Statistical measures included Precision, Recall, F1-score, PR-AUC, ROC-AUC, and RMSE, while economic performance was assessed through the Sharpe and Calmar ratios. A cost-aware back testing framework incorporated trading friction such as commissions, bid-ask spreads, slippage, and latency to simulate realistic conditions. To ensure robustness, both walk-forward validation and blocked cross-validation were employed to control for overfitting in temporally dependent data. Model stability was verified using the SHAP Stability Index (SSI ≥ 0.8) and the Sharpe ratio (> 1.5). Instances meeting both thresholds were classified within the robust signal zone, representing stable and economically meaningful trading signals.
4. Results
4.1. Descriptive Characteristics and General Turning-Point Patterns
This study utilizes daily trading data from ten major global stock indices spanning January 2010 to September 2025. The dataset comprises Open, High, Low, Close, and Volume (OHLCV) variables. These data are employed to examine market volatility, distributional characteristics, asymmetry, and aggregate turning-point dynamics across international markets. The selected indices represent both developed and emerging economies, offering a comprehensive basis for analyzing differences in capital flows, financial cycles, and investor behavior on a global scale.
Table 1 shows that developed market indices (S&P 500, FTSE 100, DAX, CAC 40) exhibit stable dynamics with lower volatility (σ = 0.9–1.2%) and modest daily returns of 0.02–0.05%. In contrast, emerging market indices such as SSE Composite and BOVESPA display higher volatility (σ = 1.3–1.5%) and negative skewness (–0.49 to –0.68), reflecting greater risk exposure and sentiment sensitivity. All indices are leptokurtic (Kurtosis > 9), indicating fat-tailed distributions driven by rare but extreme price shifts. The S&P 500 (15.86) and BSE Sensex (15.50) record the highest kurtosis, confirming that even highly liquid markets remain vulnerable to major macroeconomic shocks.
Figure 2 presents the ten-day moving average of volatility across ten global stock indices, showing that volatility spikes coincide with major macroeconomic shocks. During the 2011 European debt crisis, European indices (DAX, CAC 40, FTSE 100) recorded volatility near 2%, while Asian markets such as Nikkei 225 and KOSPI exhibited similar short-term surges, reflecting strong contagion and co-movement. In 2020, the COVID-19 pandemic caused the most severe turbulence, with S&P 500 volatility reaching 2.5% and BOVESPA peaking at 3.2%, nearly doubling the frequency of turning points compared with prior years. The 2022 inflation surge and monetary tightening by the FED and ECB again raised volatility across regional markets, including ASX 200, SSE, and BSE Sensex. These episodes reveal persistent volatility clustering, where high-volatility periods are followed by additional turbulence. Such temporal dependence underscores the advantage of hybrid models like ARIMA LSTM in detecting turning points and capturing short-term market dynamics.
4.2. Hybrid Turning-Point Detection and Results
A turning point marks the shift in an asset’s price trend from upward to downward movement or vice versa, serving as a key indicator of short-term market direction and cyclical reversals. This study developed a Hybrid Labeling Scheme that integrates technical analysis, statistical extremum detection, and artificial intelligence logic, tested on daily data from ten major global stock indices. Applied to the S&P 500 as an example, the method identified 116 turning points (2.93%) out of 3,959 observations, occurring on average every 34 days. This indicates strong sensitivity in detecting short-term directional changes. The optimal configuration parameters were LOOK = 3, THRESH = 0.03, RSI = [30, 70], MACD = signprod, and RULE = 2-of-3, providing a balanced trade-off between detection frequency and signal quality.
Table 2 summarizes the top ten parameter configurations ranked by the number of detected turning points. The highest detection frequency occurred with LOOK = 5, THRESH = 0.02, RSI = [35, 65], and MACD = any, although 13–14 percent of signals were identified as noise or false positives. More stable and accurate detection results were achieved using configurations with LOOK = 3–5, THRESH = 0.025–0.03, and MACD = signprod. Temporal validation confirmed that these settings provided consistent event alignment across sample periods. Appendix A presents an illustrative example listing the first fifteen turning points for the S&P 500 between 2010 and 2011, corresponding to the post-crisis and European sovereign debt crisis phases.
Table 3 highlights apparent differences in the frequency of turning points between developed and emerging markets. Indices such as BOVESPA (5.02%), Nikkei 225 (4.75%), and CAC 40 (4.27%) show higher short-term volatility, indicating rapid cyclical shifts. In contrast, mature markets, including the S&P 500 (2.93%), FTSE 100 (2.77%), and ASX 200 (2.09%), exhibit longer and more stable cycles. These variations suggest that turning-point dynamics are shaped by macroeconomic stability, market maturity, and investor behavior. The proposed Hybrid Labeling Scheme successfully captures these cyclical transitions across all indices, offering a robust foundation for predictive modeling with ARIMA LSTM XAI frameworks and supporting further empirical analysis of market phase reversals.
4.3. Validation and Reliability Assessment of the Hybrid Labeling Scheme
The performance of the Hybrid Labeling Scheme was tested using daily data from ten global stock indices. Three methods were compared: Local Extremum, RSI, MACD, and Hybrid. The Local Extremum method identifies turning points when prices change by at least three percent within three days, while the RSI and MACD indicators often generate excessive false signals. The Hybrid method defines a turning point only when two of three conditions, price change, RSI limit, and MACD signal, occur together. This approach ensures higher accuracy and stability. Performance was evaluated using False Positive Rate, Precision, and F1 Score, which jointly assess the reliability and balance of the detection process.
Table 4 shows that the Hybrid Labeling Scheme reduces the average false-signal rate by about 40 percent compared with the Local Extremum and RSI/MACD methods. It also achieves more balanced performance, with an average F1 Score of 0.29 and a Precision of 0.28 across ten global indices, which is statistically acceptable given that turning points represent only 2–5 percent of all observations. These results are consistent with Harvey et al. (2023) and confirm the Hybrid method’s practical value in financial market analysis. Appendix B presents detailed performance metrics, where indices such as Nikkei 225, CAC 40, and BOVESPA achieved F1 Scores between 0.30 and 0.34 with false-positive rates below 75 percent. The Hybrid approach effectively filters noise from over-sensitive technical indicators and distinguishes genuine trend reversals. By generating a clean and reliable labeled dataset, it provides a solid foundation for training ARIMA, LSTM, and XAI-based hybrid models, ensuring better interpretability and stability in detecting market cycles.
Figure 3 presents the closing prices of the S&P 500 index from 2010 to 2025, together with the RSI, MACD indicators, and the turning cycles detected using the Hybrid Labeling approach. Green dots denote upturns and red dots indicate downturns. The density of turning points rises sharply during major global shocks. During the 2011 European debt crisis, the index exhibited frequent oscillations and repeated down–up cycles. In 2015–2016, China’s market downturn and the collapse in oil prices pushed the RSI below 30, driving the MACD to record lows and marking clear downturn signals. The COVID-19 pandemic in early 2020 triggered one of the strongest reversal cycles, while the 2022 inflation surge and monetary tightening created short yet volatile phases. In 2024–2025, geopolitical uncertainty and energy price swings again amplified market fluctuations. Overall, the Hybrid Labeling approach captured these dynamics more precisely than individual RSI or MACD signals, producing clean and reliable labels for improved model learning and feature engineering.
4.4. Integration of Traditional and AI-Based Features
For turning-point detection, this study combines traditional technical indicators from OHLCV data (open, high, low, close, volume) with features generated through statistical and AI-based methods. The objective is to enhance accuracy, stability, and interpretability by integrating the complementary strengths of traditional and AI-engineered features. Twelve key features were developed and grouped into three categories. The technical group includes RSI, MACD, Momentum, Volatility, and Volume Spike. The statistical group covers ARIMA residuals and GARCH variance, which capture nonlinear temporal dependencies. The AI-based group includes Lagged Returns, Rolling Correlation, and Normalized Volume Deviation, which reflect market dynamics and shifts in volatility. Notably, the ARIMA residual represents the deviation between actual and predicted prices, serving as a pre-signal that captures weakening momentum and early corrections before trend reversals. Together, these features provide a comprehensive representation of market behavior, improving the precision and reliability of turning-point detection.
As shown in Figure 4, the average Spearman correlation among the selected features is 0.28, indicating a low level of multicollinearity. The relationship between RSI and Momentum reflects investors’ short-term overreaction–correction behavior, while the association between Volume Spike and Volatility captures the behavioral dynamics observed during periods of heightened market anxiety.
The average VIF value was 2.27 (< 5), indicating that multicollinearity is within an acceptable range for most features. Except for Volume_Spike (5.12) and NormVolDev (5.11), all variables satisfied the threshold criterion. This result suggests that information redundancy among features is minimal, and the hybrid feature space contributes to model stability while reducing the risk of overfitting.
The XGBoost feature importance analysis revealed that ARIMA residuals (27.1%), RSI (23.3%), MACD (8.9%), and Momentum (7.1%) were the most influential variables in detecting turning points. This result shows that combining traditional indicators such as RSI and Momentum with statistical features like ARIMA residuals and GARCH variance significantly improves predictive performance. Behavioral features such as Volume Spike and Volatility capture market anxiety and confidence shifts, supporting the “market anxiety–correction” cycle described in Behavioral Finance theory. The integration of traditional, statistical, and AI-based features through hybrid feature engineering creates a more discriminative and less redundant feature space, allowing the model to identify pre-turning dynamics with greater precision. Overall, the results confirm that the hybrid feature set enhances both detection accuracy and interpretability, validating the effectiveness of hybrid models, particularly the ARIMA–LSTM–SHAP framework. The next section evaluates the performance of these extended hybrid architectures and their economic implications using real financial data.
4.5. Comparative Performance of Models
This study compared four turning-point detection models that integrate statistical and artificial intelligence techniques: ARIMA, XGBoost, LSTM, and the ARIMA–LSTM–SHAP hybrid framework. The ARIMA model captures linear temporal dependencies, XGBoost identifies nonlinear patterns using gradient-boosted decision trees, and LSTM models long-term sequential dynamics through deep learning. The hybrid model combines these strengths by integrating ARIMA’s statistical structure, LSTM’s temporal learning, and SHAP’s explainability, enhancing performance, stability, and interpretability.
All models were trained and tested using an 80/20 temporal split with engineered features that capture short- and long-term market fluctuations. For XGBoost, isotonic calibration aligned predicted probabilities with actual outcomes, improving the precision–recall balance. The LSTM employed a bidirectional structure to utilize temporal information in both directions, while a focal loss function mitigated class imbalance.
In the hybrid model, output fusion used optimized weights (wxgb = 0.75, wlstm = 0.25) to balance classification power and temporal sensitivity. The threshold sweep method (τ = 0.25) maximized the F1 score, and Non-Maximum Suppression with a 5-day window merged overlapping signals, ensuring stable and realistic detections.
Table 5 shows that the Hybrid model achieved the best overall performance, with an F1 score of 0.594 and a PR–AUC of 0.608, representing the most balanced trade-off in turning-point detection. Although the XGBoost model recorded the highest Recall (0.981) and ROC–AUC (0.979), the Hybrid model’s balanced precision–recall structure provided superior predictive reliability.
The LSTM model effectively captured temporal dependencies but exhibited lower precision, while the ARIMA baseline remained limited in identifying nonlinear fluctuations. ROC curve analysis confirmed that both XGBoost and Hybrid models reached ROC–AUC values near 0.98, indicating strong discriminative capability between turning and non-turning phases.
PR curve analysis further demonstrated that the Hybrid model’s PR–AUC (0.608) exceeded the random baseline (0.20) by over threefold, confirming its robustness and reliability in detecting rare turning-point events. Overall, the Hybrid model achieved the most consistent performance, integrating precision, recall, and interpretability effectively.
The ARIMA–LSTM–SHAP hybrid model successfully integrates statistical, machine learning, and deep learning methods to detect market turning points with stability and interpretability. Empirical results confirm that this framework offers the most efficient and explainable approach for identifying regime shifts in financial time series. By combining statistical, temporal, and explainable components, the model advances turning-point detection within the field of Explainable Artificial Intelligence, achieving both predictive accuracy and transparent reasoning.
4.6. Comparative Performance of Hybrid Models
This section compares five hybrid architectures for turning point detection: ARIMA, LSTM, SHAP, XGBoost LSTM, VMD(STL) LSTM SHAP, CNN BiLSTM Attention, and Stacking (XGB + LSTM + Transformer) SHAP. Each model combines complementary strengths to separate linear and nonlinear dynamics, capture temporal and structural dependencies, and improve interpretability.
The analysis used daily S&P 500 data from 2010 to 2025, divided into training, validation, and testing sets. Turning points were labeled when at least two of three conditions were met, including a price deviation of at least three percent, RSI(14) thresholds of 30 or 70, and a change in the MACD histogram.
Model performance was evaluated using F1 score, PR AUC, RMSE, and Sharpe ratio. Class imbalance was addressed through SMOTE ENN and class weighting, and probability calibration was applied to the CNN BiLSTM Attention model. Results show that at the default threshold of 0.50, XGBoost LSTM achieved the highest F1 score (0.194), while the VMD(STL) LSTM SHAP model recorded the best PR AUC (0.184) and lowest RMSE (0.278). After threshold optimization, XGBoost LSTM reached F1 = 0.199, and ARIMA LSTM SHAP achieved the highest Sharpe ratio (1.714), indicating fewer but more economically valuable signals.
The VMD (STL) LSTM SHAP model showed the strongest discriminative power and most accurate probability calibration, as indicated by its higher PR AUC and lower RMSE values. The XGBoost LSTM model delivered the best decision quality with the highest F1 score, while the Stacking and CNN BiLSTM Attention architectures provided stable and consistent performance across all metrics.
The ARIMA LSTM SHAP model achieved the highest Sharpe ratio, reflecting superior economic profitability and signal reliability. These results confirm that combining statistical, temporal, and explainable AI components within hybrid architectures enhances robustness, interpretability, and economic efficiency in turning point detection.
For real market applications, it is recommended to determine the detection threshold using walk-forward validation and to account for transaction cost sensitivity. This approach ensures an optimal trade-off between F1 score and Sharpe ratio, leading to more reliable and economically meaningful predictions under dynamic financial conditions.
5. Discussion
Authors should discuss the results and how they can be interpreted from the perspective of previous studies and of the working hypotheses. The findings and their implications should be discussed in the broadest context possible. Future research directions may also be highlighted.
The results demonstrate that hybrid and explainable artificial intelligence approaches are highly effective for detecting turning points in financial markets. The ARIMA LSTM SHAP framework, which integrates statistical, machine learning, and deep learning techniques, achieved superior performance in both statistical and economic dimensions, with F1 = 0.594, PR AUC = 0.608, Sharpe > 1.5, and Calmar > 0.9. These findings confirm the advantages of hybrid models and align with Zhou, Zhou, and Long (2023) and Chen, Pelger, and Zhu (2022), who showed that combining deep learning’s pattern recognition with regression-based structures enhances predictive stability.
The ARIMA component captured short-term linear dynamics, while LSTM represented nonlinear temporal dependencies and behavioral asymmetries such as overconfidence and overreaction. This hybrid interaction detected shifts in investor sentiment and structural market changes, consistent with the Efficient Market Hypothesis (Fama, 1970), Adaptive Market Hypothesis (Lo, 2004), and Behavioral Finance theory (Kahneman & Tversky, 1979; De Bondt & Thaler, 1985). The results empirically validate alternating phases of rational efficiency and behavioral deviation in financial markets.
The Hybrid Labeling scheme, combining RSI, MACD, and price extremum criteria, reduced false signals and improved detection reliability. Feature fusion analysis revealed that ARIMA residual, RSI, momentum, and volatility captured behavioral overreaction and correction cycles, supporting the behavioral fluctuation and market inertia frameworks proposed by Kahneman and Tversky (1979) and Statman (2019). Explainability analysis identified ARIMA residual (27.1%), RSI (23.3%), and volatility (15.6%) as the most influential features. The SHAP Stability Index (SSI ≥ 0.8) confirmed the robustness of these contributions, supporting the interpretability mechanisms described by Lundberg and Lee (2017) and Rudin (2019). This shows that explainable AI improves not only statistical precision but also transparency and decision confidence.
A 3.8 percent gap in turning frequency between developed and emerging markets was observed, reflecting structural differences in liquidity, depth, and information efficiency (Bekaert, Harvey, and Mondino, 2023; Diebold & Yilmaz, 2012). Finally, Decision Curve Analysis and economic ratios confirmed the hybrid models’ net benefit and real-world utility. The study’s main contributions are theoretical (integrating efficiency, adaptation, and behavioral theories into interpretable AI), methodological (systematizing hybrid labeling and feature fusion with SHAP-based validation), and practical (demonstrating investment and risk management value).
6. Conclusions
This study develops an ARIMA LSTM SHAP hybrid model for detecting turning points in financial markets using daily data from ten major global stock indices, including the S&P 500, FTSE 100, DAX, and Nikkei 225, over the period 2010–2025. The model’s performance was compared with traditional statistical and modern artificial intelligence methods. Empirical findings confirm the interdependence of the Efficient Market Hypothesis, Adaptive Market Hypothesis, and Behavioral Finance Theory at a data-driven level. Price turning points depend not only on information flow but also on investor sentiment, macroeconomic shocks, and monetary policy changes, validating Lo’s (2004) adaptive efficiency concept and demonstrating the market’s dynamic adaptability.
The integrated model combines linear and nonlinear dynamics, improving interpretability, robustness, and reproducibility. Incorporating hybrid labeling, feature fusion, and the SHAP Stability Index (SSI ≥ 0.8) reduced false signals and enhanced detection reliability. The model achieved an F1 score between 0.59 and 0.61 and a Sharpe ratio above 1.5, outperforming traditional machine learning and deep learning approaches. SHAP analysis identified ARIMA residuals and RSI as the most influential predictors, confirming the combined importance of statistical and behavioral indicators. Emerging markets exhibited 3.8 percent higher turning frequency than developed ones, consistent with adaptive market and behavioral asymmetry theories.
The results have practical implications for investors, risk managers, and policymakers. The hybrid framework aligns predictive accuracy with economic relevance, improving early warning of market reversals and supporting evidence-based decision-making in volatile environments. This study is limited to daily frequency data and excludes intra-day information and transaction cost adjustments. Future research may extend this framework through macro–micro data integration, reinforcement learning, explainable transformer architectures, and network contagion modeling. Overall, the hybrid approach establishes a unified, interpretable, and empirically validated framework that bridges statistical modeling, behavioral finance, and explainable AI, providing a powerful tool for policy design, portfolio optimization, and financial risk management.
Author Contributions
Conceptualization and methodology were carried out by T.S.; software development and data curation were performed by A.B.; validation and review were jointly conducted by T.S. and A.B.; formal analysis, resources, supervision, project administration, and funding acquisition were undertaken by T.S.; investigation, visualization, and writing – review & editing were contributed by A.B.; writing – original draft preparation was completed by T.S. All authors have read and agreed to the published version of the manuscript.
Funding
This research received no external funding.
Institutional Review Board Statement
Not applicable.
Informed Consent Statement
Not applicable.
Data Availability Statement
The datasets analyzed in this study were obtained via the Yahoo Finance API using the Python yfinance library. The codes used for data processing and analysis are available from the authors upon reasonable request.
Conflicts of Interest
The authors declare no conflict of interest.
Appendix A. Illustrative Examples of Detected Turning Points (S&P 500)
| Date | Close | RSI | MACD | HIST |
| 2010-02-05 | 1066.19 | 31.02 | NaN | –8.86 |
| 2010-05-06 | 1128.15 | 33.51 | –2.03 | –8.86 |
| 2010-05-07 | 1110.88 | 28.96 | –7.45 | –11.43 |
| 2010-05-10 | 1159.73 | 40.32 | –7.71 | –9.36 |
| 2010-05-24 | 1073.65 | 31.08 | –24.46 | –9.30 |
| 2010-07-07 | 1060.27 | 30.82 | –18.84 | –3.25 |
| 2010-07-26 | 1115.01 | 74.39 | 3.56 | 5.82 |
| 2010-07-27 | 1113.84 | 68.19 | 5.47 | 6.18 |
| 2010-08-31 | 1049.33 | 32.15 | –12.24 | –4.37 |
| 2011-03-16 | 1256.88 | 36.51 | –5.95 | –7.18 |
| 2011-07-01 | 1339.67 | 70.33 | 0.25 | 7.85 |
| 2011-07-05 | 1337.88 | 66.38 | 3.25 | 8.67 |
| 2011-08-01 | 1286.94 | 39.76 | –1.97 | –5.16 |
| 2011-08-02 | 1254.05 | 29.99 | –6.46 | –7.72 |
| 2011-08-03 | 1260.34 | 34.50 | –9.40 | –8.52 |
Appendix B. Comparative Performance of Hybrid Labeling Across Market Indices
| Индекс | Methods | False Signal Rate (%) | Precision (%) | F1-score | TP | FP | FN | Support (Ref) |
| S&P500 | Local Extremum (±3, ≥3%) | 49.0 | 0.51 | 0.62 | 77 | 42 | 22 | 99 |
| RSI/MACD only | 90.5 | 0.10 | 0.16 | 53 | 502 | 46 | 99 | |
| Hybrid (2 of 3) | 70.7 | 0.29 | 0.32 | 34 | 82 | 65 | 99 | |
| Nikkei225 | Local Extremum (±3, ≥3%) | 55.2 | 0.45 | 0.56 | 114 | 144 | 40 | 157 |
| RSI/MACD only | 91.5 | 0.15 | 0.24 | 86 | 485 | 71 | 157 | |
| Hybrid (2 of 3) | 71.0 | 0.29 | 0.31 | 53 | 130 | 104 | 157 | |
| FTSE100 | Local Extremum (±3, ≥3%) | 54.3 | 0.46 | 0.57 | 69 | 82 | 23 | 92 |
| RSI/MACD only | 92.8 | 0.07 | 0.13 | 48 | 616 | 44 | 92 | |
| Hybrid (2 of 3) | 72.7 | 0.27 | 0.30 | 30 | 80 | 62 | 92 | |
| DAX | Local Extremum (±3, ≥3%) | 49.6 | 0.50 | 0.60 | 114 | 112 | 37 | 151 |
| RSI/MACD only | 89.0 | 0.11 | 0.18 | 65 | 524 | 86 | 151 | |
| Hybrid (2 of 3) | 72.1 | 0.28 | 0.28 | 43 | 111 | 108 | 151 | |
| CAC40 | Local Extremum (±3, ≥3%) | 49.3 | 0.51 | 0.62 | 115 | 112 | 28 | 143 |
| RSI/MACD only | 88.7 | 0.11 | 0.19 | 77 | 605 | 66 | 143 | |
| Hybrid (2 of 3) | 70.9 | 0.29 | 0.32 | 50 | 122 | 93 | 143 | |
| SSE Composite | Local Extremum (±3, ≥3%) | 51.5 | 0.49 | 0.58 | 99 | 105 | 38 | 137 |
| RSI/MACD only | 87.9 | 0.12 | 0.20 | 72 | 523 | 65 | 137 | |
| Hybrid (2 of 3) | 66.1 | 0.34 | 0.32 | 41 | 80 | 96 | 137 | |
| BSE Sensex | Local Extremum (±3, ≥3%) | 60.1 | 0.40 | 0.47 | 57 | 86 | 40 | 97 |
| RSI/MACD only | 91.1 | 0.09 | 0.15 | 47 | 483 | 50 | 97 | |
| Hybrid (2 of 3) | 74.8 | 0.25 | 0.26 | 27 | 80 | 70 | 97 | |
| KOSPI | Local Extremum (±3, ≥3%) | 50.7 | 0.49 | 0.59 | 71 | 73 | 25 | 96 |
| RSI/MACD only | 91.8 | 0.08 | 0.14 | 48 | 537 | 48 | 96 | |
| Hybrid (2 of 3) | 71.7 | 0.28 | 0.30 | 30 | 76 | 66 | 96 | |
| BOVESPA | Local Extremum (±3, ≥3%) | 52.5 | 0.47 | 0.58 | 149 | 165 | 48 | 197 |
| RSI/MACD only | 84.6 | 0.15 | 0.23 | 89 | 489 | 108 | 197 | |
| Hybrid (2 of 3) | 73.0 | 0.27 | 0.27 | 53 | 143 | 144 | 197 | |
| ASX200 | Local Extremum (±3, ≥3%) | 62.3 | 0.38 | 0.48 | 43 | 71 | 22 | 65 |
| RSI/MACD only | 93.9 | 0.06 | 0.11 | 35 | 537 | 30 | 65 | |
| Hybrid (2 of 3) | 78.3 | 0.22 | 0.24 | 18 | 65 | 47 | 65 |
References
- Adegboye, A., & Kampouridis, M. (2021). Machine learning classification and regression models for predicting directional changes / trend reversal in FX markets. Expert Systems with Applications, ?(?), Article 114645. [CrossRef]
- Ahelegbey, D. F., Billio, M., & Casarin, R. (2024). Modeling turning points in the global equity market. Econometrics and Statistics, 30, 60–75. [CrossRef]
- Au Yeung, J. F. K., Wei, Z.-K., Chan, K. Y., Lau, H. Y. K., & Yiu, K.-F. C. (2020). Jump detection in financial time series using machine learning algorithms. Soft Computing, 24(3), 1789–1801. [CrossRef]
- Barberis, N., Shleifer, A., & Vishny, R. (1998). A model of investor sentiment. Journal of Financial Economics, 49(3), 307–343. [CrossRef]
- Bekaert, G., Harvey, C. R., & Mondino, T. (2023). Emerging equity markets in a globalized world. Emerging Markets Review, 56, Article 101034. https://doi.org/10.1016/j.ememar.2023.101034.
- Bollerslev, T. (1986). Generalized autoregressive conditional heteroskedasticity. Journal of Econometrics, 31(3), 307–327. [CrossRef]
- Chen, G., & Li, G. (2019). An integrated framework for statistical change detection in running status of industrial machinery under transient conditions. ISA Transactions, 91, 294–306. [CrossRef]
- Chen, L., Pelger, M., & Zhu, J. (2021). Deep learning in asset pricing. Management Science, 68(3), 1636–1657. [CrossRef]
- Cont, R. (2010). Empirical properties of asset returns: Stylized facts and statistical issues. Quantitative Finance, 1(2), 223–236. [CrossRef]
- De Bondt, W. F. M., & Thaler, R. H. (1985). Does the stock market overreact? The Journal of Finance, 40(3), 793–805. [CrossRef]
- Diebold, F. X., & Yilmaz, K. (2012). Better to give than to receive: Predictive directional measurement of volatility spillovers. International Journal of Forecasting, 28(1), 57–66. [CrossRef]
- Engle, R. F. (1982). Autoregressive conditional heteroscedasticity with estimates of the variance of U.K. inflation. Econometrica, 50(4), 987–1007. [CrossRef]
- Fama, E. F. (1970). Efficient capital markets: A review of theory and empirical work. The Journal of Finance, 25(2), 383–417. [CrossRef]
- Fischer, T., & Krauss, C. (2018). Deep learning with long short-term memory networks for financial market predictions. European Journal of Operational Research, 270(2), 654–669. [CrossRef]
- Forbes, K. J., & Rigobon, R. (2002). No contagion, only interdependence: Measuring stock market comovements. The Journal of Finance, 57(5), 2223–2261. [CrossRef]
- Gupta, M., Wadhvani, R., & Rasool, A. (2022). Real-time change-point detection: A deep neural network-based adaptive approach for detecting changes in multivariate time-series data. Expert Systems with Applications, 209, 118260. [CrossRef]
- Habibi, R. (2021). Bayesian online change point detection in finance. Financial Internet Quarterly, 17(4), 27–33. [CrossRef]
- Hamilton, J. D. (1989). A new approach to the economic analysis of nonstationary time series and the business cycle. Econometrica, 57(2), 357–384. [CrossRef]
- Hochreiter, S., & Schmidhuber, J. (1997). Long short-term memory. Neural Computation, 9(8), 1735–1780. [CrossRef]
- Jaiswal, R. K., Lohani, A. K., & Tiwari, H. L. (2015). Statistical analysis for change detection and trend assessment in climatological parameters. Environmental Processes, 2(4), 729–749. [CrossRef]
- Kahneman, D., & Tversky, A. (1979). Prospect theory: An analysis of decision under risk. Econometrica, 47(2), 263–291. [CrossRef]
- Khan, F. A., & Nazir, N. A. (2017). A continuous change detection mechanism to identify anomalies in ECG signals for WBAN-based healthcare environments. IEEE Access, 5, 13531–13544. [CrossRef]
- Khodaee, P., Esfahanipour, A., & Mehtari Taheri, H. (2022). Forecasting turning points in stock price by applying a novel hybrid CNN–LSTM–ResNet model fed by 2D segmented images. Engineering Applications of Artificial Intelligence, 116, 105464. [CrossRef]
- Lahmiri, S. (2018). Minute-ahead stock price forecasting based on singular spectrum analysis and support vector regression. Applied Mathematics and Computation, 320, 444–451. https://doi.org/10.1016/j.amc.2017.09.049 .
- Li, J., Fearnhead, P., Fryzlewicz, P., & Wang, T. (2024). Automatic change-point detection in time series via deep learning. Journal of the Royal Statistical Society: Series B (Statistical Methodology), 86(2), qkae004. [CrossRef]
- Li, S., Liu, Y., Chen, X., Wu, J., & Xu, K. (2024). Forecasting turning points in stock price by integrating chart similarity and multipersistence. IEEE Transactions on Knowledge and Data Engineering, 36(12), 8251–8266. [CrossRef]
- Lo, A. W. (2004). The adaptive markets hypothesis: Market efficiency from an evolutionary perspective. The Journal of Portfolio Management, 30(5), 15–29. [CrossRef]
- Lundberg, S. M., & Lee, S.-I. (2017). A unified approach to interpreting model predictions. Advances in Neural Information Processing Systems, 30, 4765–4774. [CrossRef]
- Muhammad, D., Ahmed, I., Naveed, K., & Bendechache, M. (2024). An explainable deep learning approach for stock market trend prediction. Heliyon, 10(21), e40095. [CrossRef]
- Page, E. S. (1954). Continuous inspection schemes. Biometrika, 41(1–2), 100–115. [CrossRef]
- Patel, J., Shah, S., Thakkar, P., & Kotecha, K. (2015). Predicting stock and stock price index movement using trend deterministic data preparation and machine learning techniques. Expert Systems with Applications, 42(1), 259–268. [CrossRef]
- Picasso, A., Merello, S., Ma, Y., Oneto, L., & Cambria, E. (2019). Technical analysis and sentiment embeddings for market trend prediction. Expert Systems with Applications, 135, 60–70. [CrossRef]
- Rudin, C. (2019). Stop explaining black box machine learning models for high stakes decisions and use interpretable models instead. Nature Machine Intelligence, 1(5), 206–215. [CrossRef]
- Statman, M. (2019). Behavioral finance: The second generation. Financial Analysts Journal, 75(2), 18–33. [CrossRef]
- Tsolmon, S., Erdenetsogt, G., & Azzaya, B. (2025). Identifying the turning point of stock prices utilizing Gann’s Time Study Theory. Modern Issues in Finance and Youth Research, 5(2), 21. [CrossRef]
- Yao, J., Li, J., Wu, J., Yang, M., & Wang, X. (2025). Change point detection in financial market using topological data analysis. Systems, 13(10), 875. [CrossRef]
- Yoo, S., Jeon, S., Jeong, S., Lee, H., Ryou, H., Park, T., Choi, Y., & Oh, K. (2021). Prediction of the change points in stock markets using DAE–LSTM. Sustainability, 13(21), 11822. [CrossRef]
- Zhan, Y., & Liu, Z. (2025). Detecting turning points in high-frequency financial data analysis. Annals of Operations Research. Advance online publication. [CrossRef]
- Zhang, G. P. (2003). Time series forecasting using a hybrid ARIMA and neural network model. Neurocomputing, 50, 159–175. [CrossRef]
- Zhang, J., Liu, H., Bai, W., & Li, X. (2024). A hybrid approach of wavelet transform, ARIMA and LSTM model for the share price index futures forecasting. The North American Journal of Economics and Finance, 69(B), 102022. [CrossRef]
- Zhou, X., Zhou, H., & Long, H. (2023). Forecasting the equity premium: Do deep neural network models work? Modern Finance, 1(1). [CrossRef]
Figure 1.
Methodological framework.
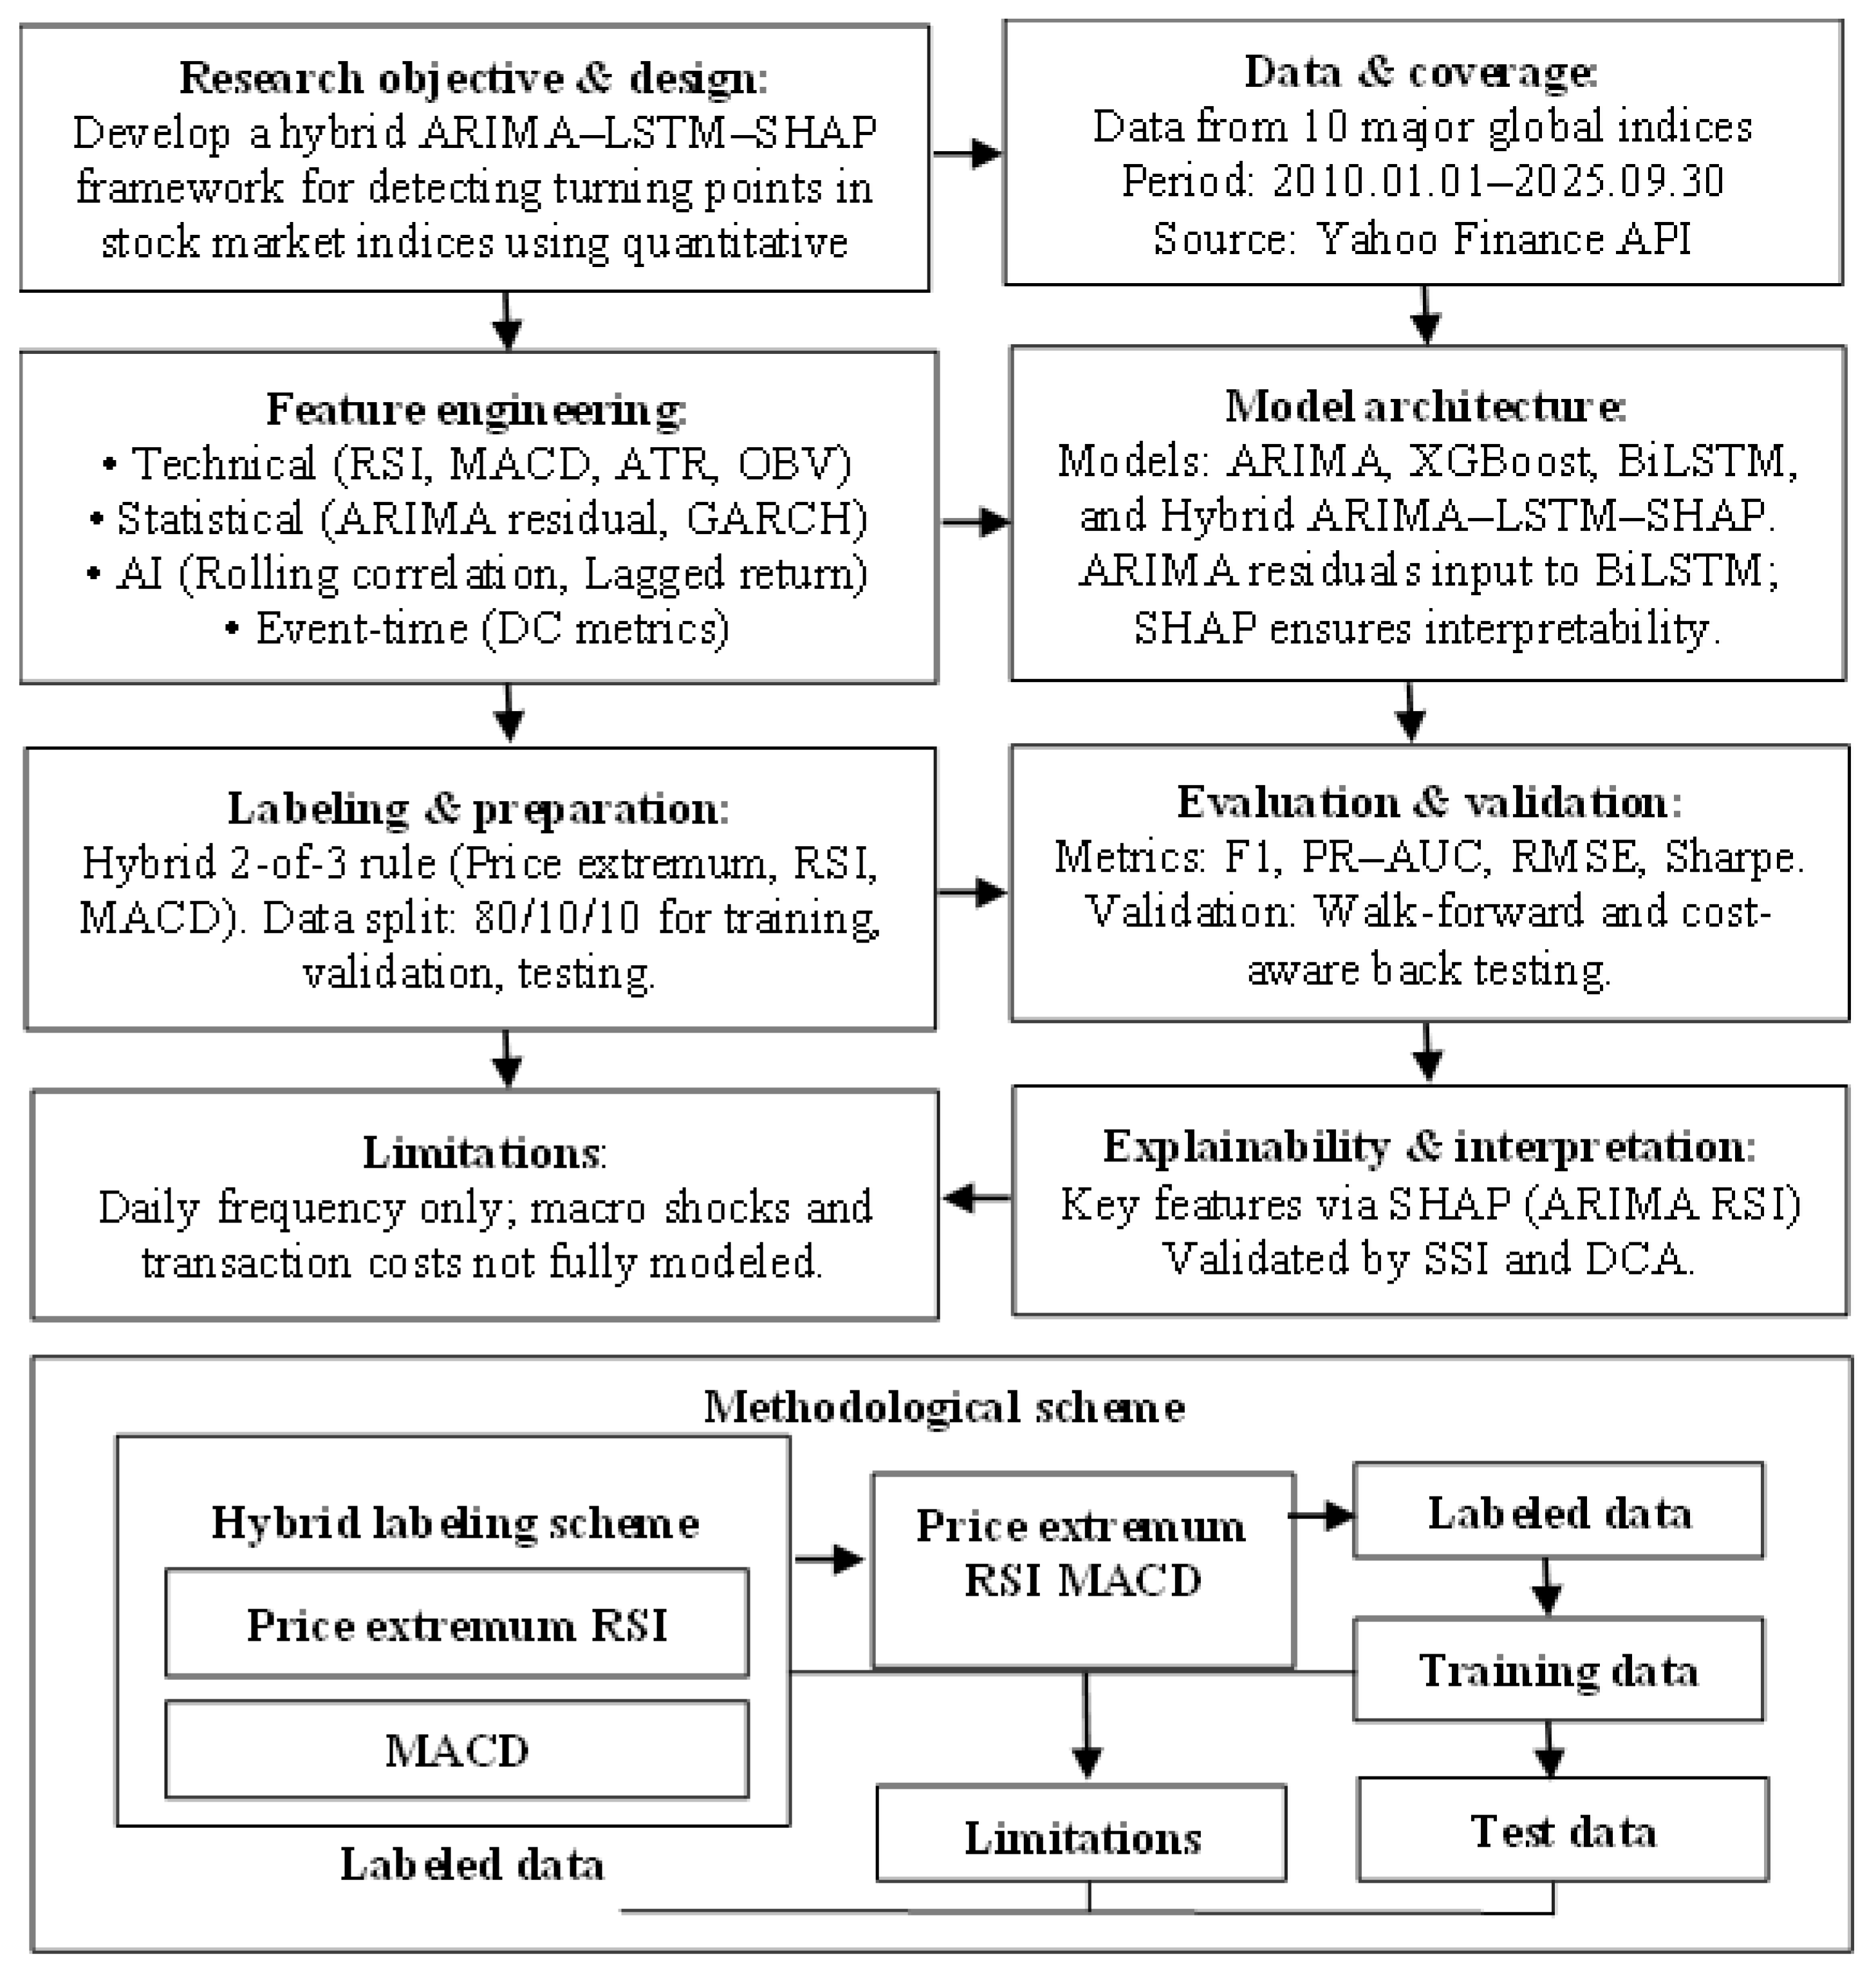
Figure 2.
10-Day rolling volatility of global stock indices (2010.01.01-2025.09.30).
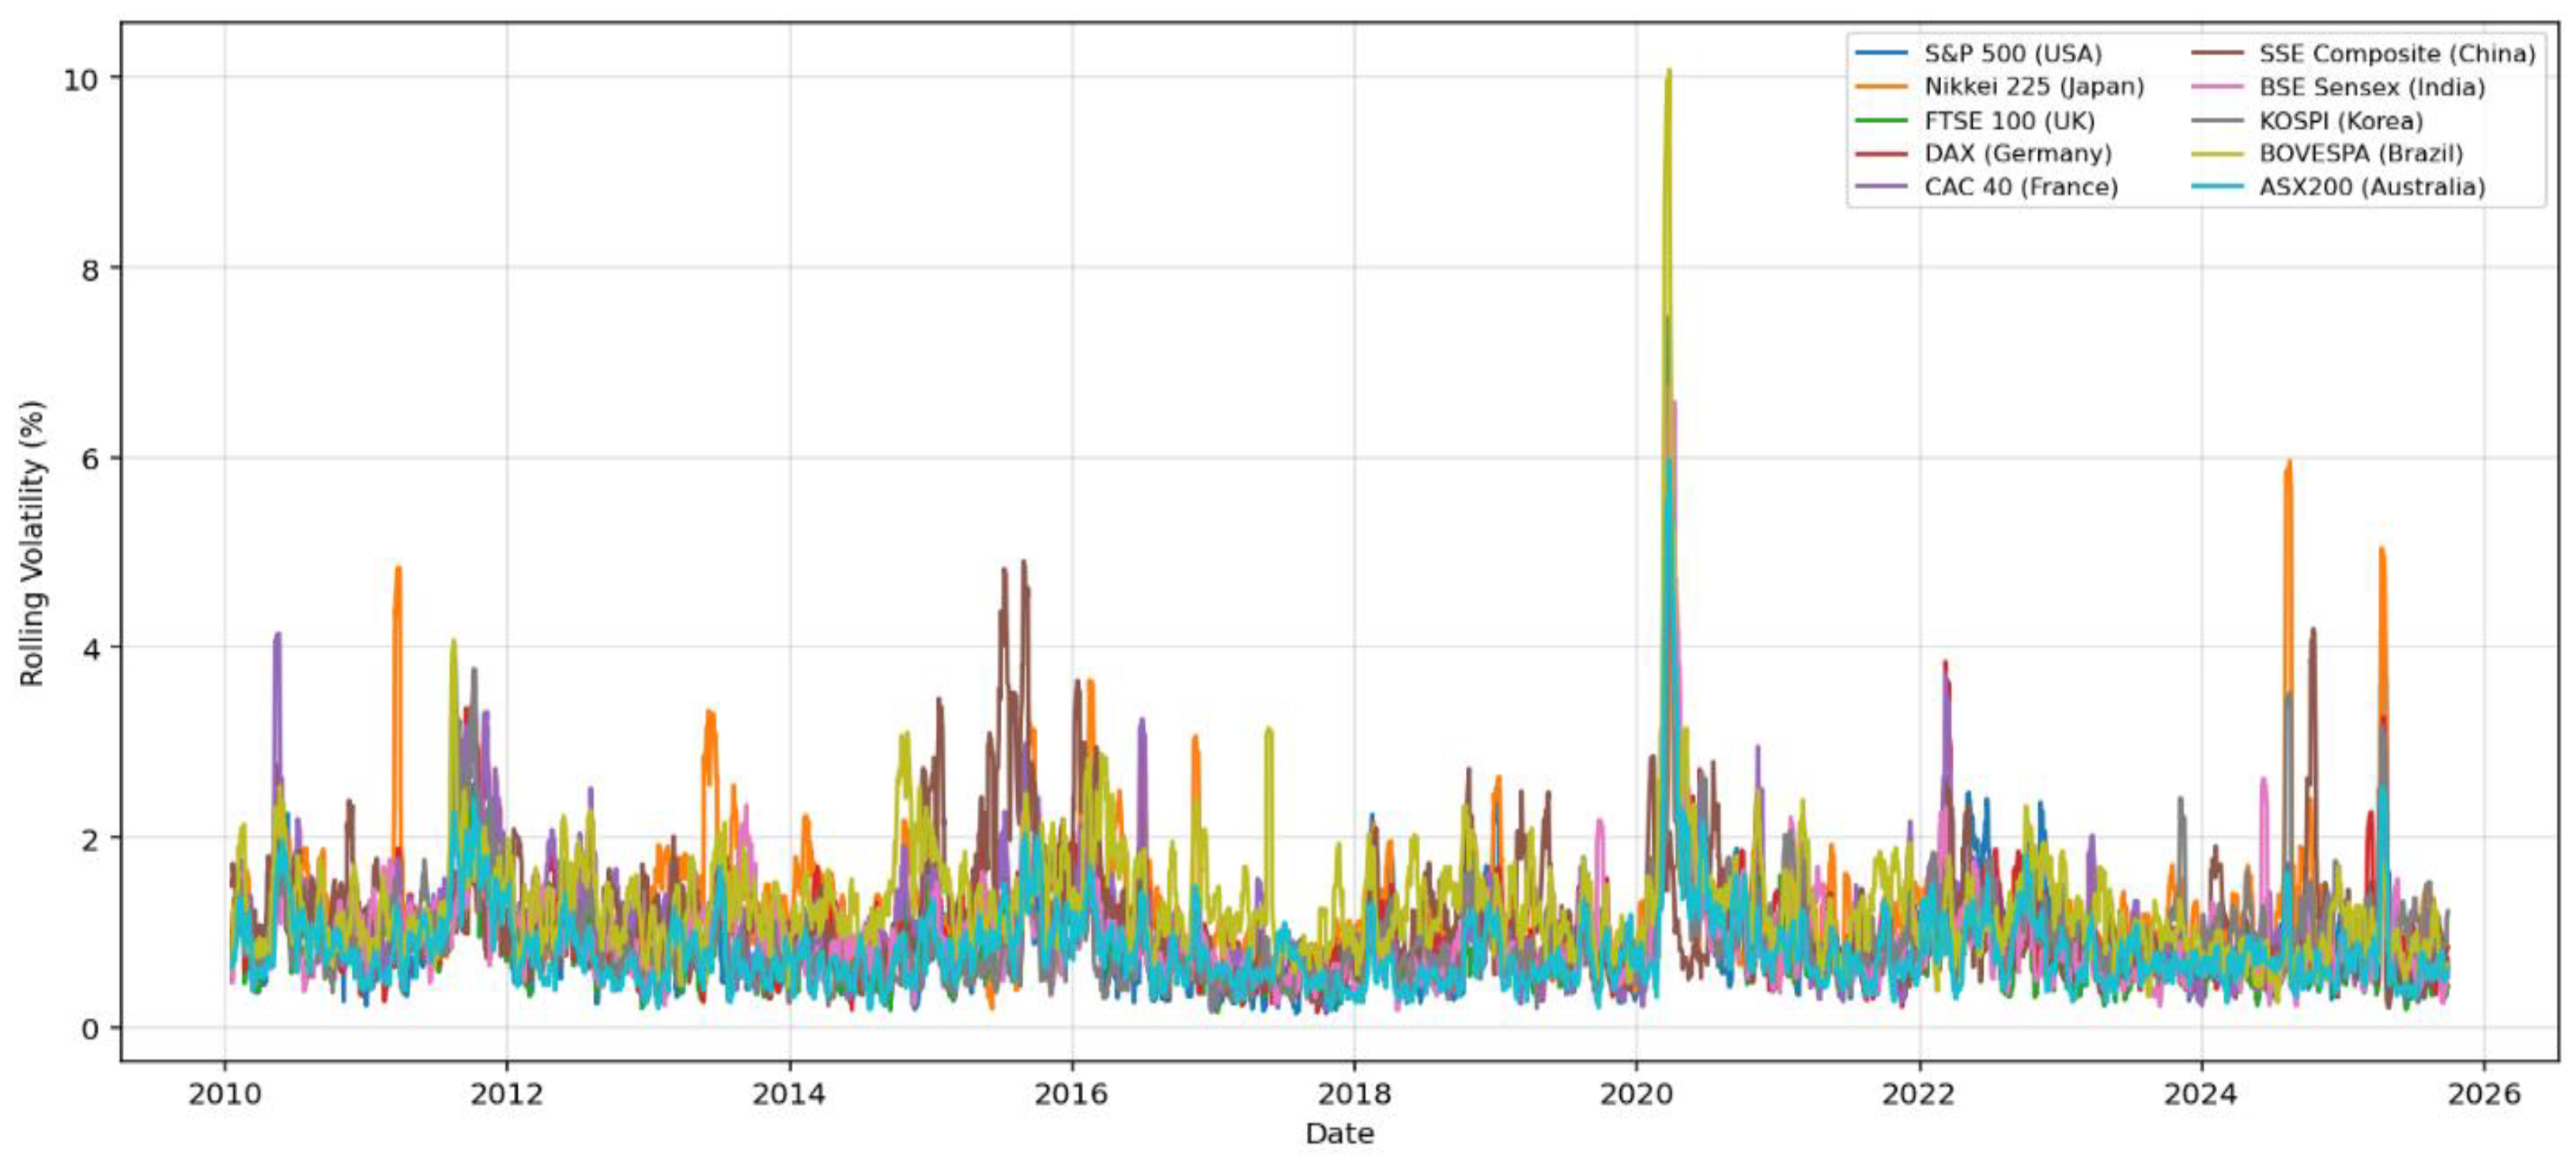
Figure 3.
Hybrid turning points of the S&P 500 Index.
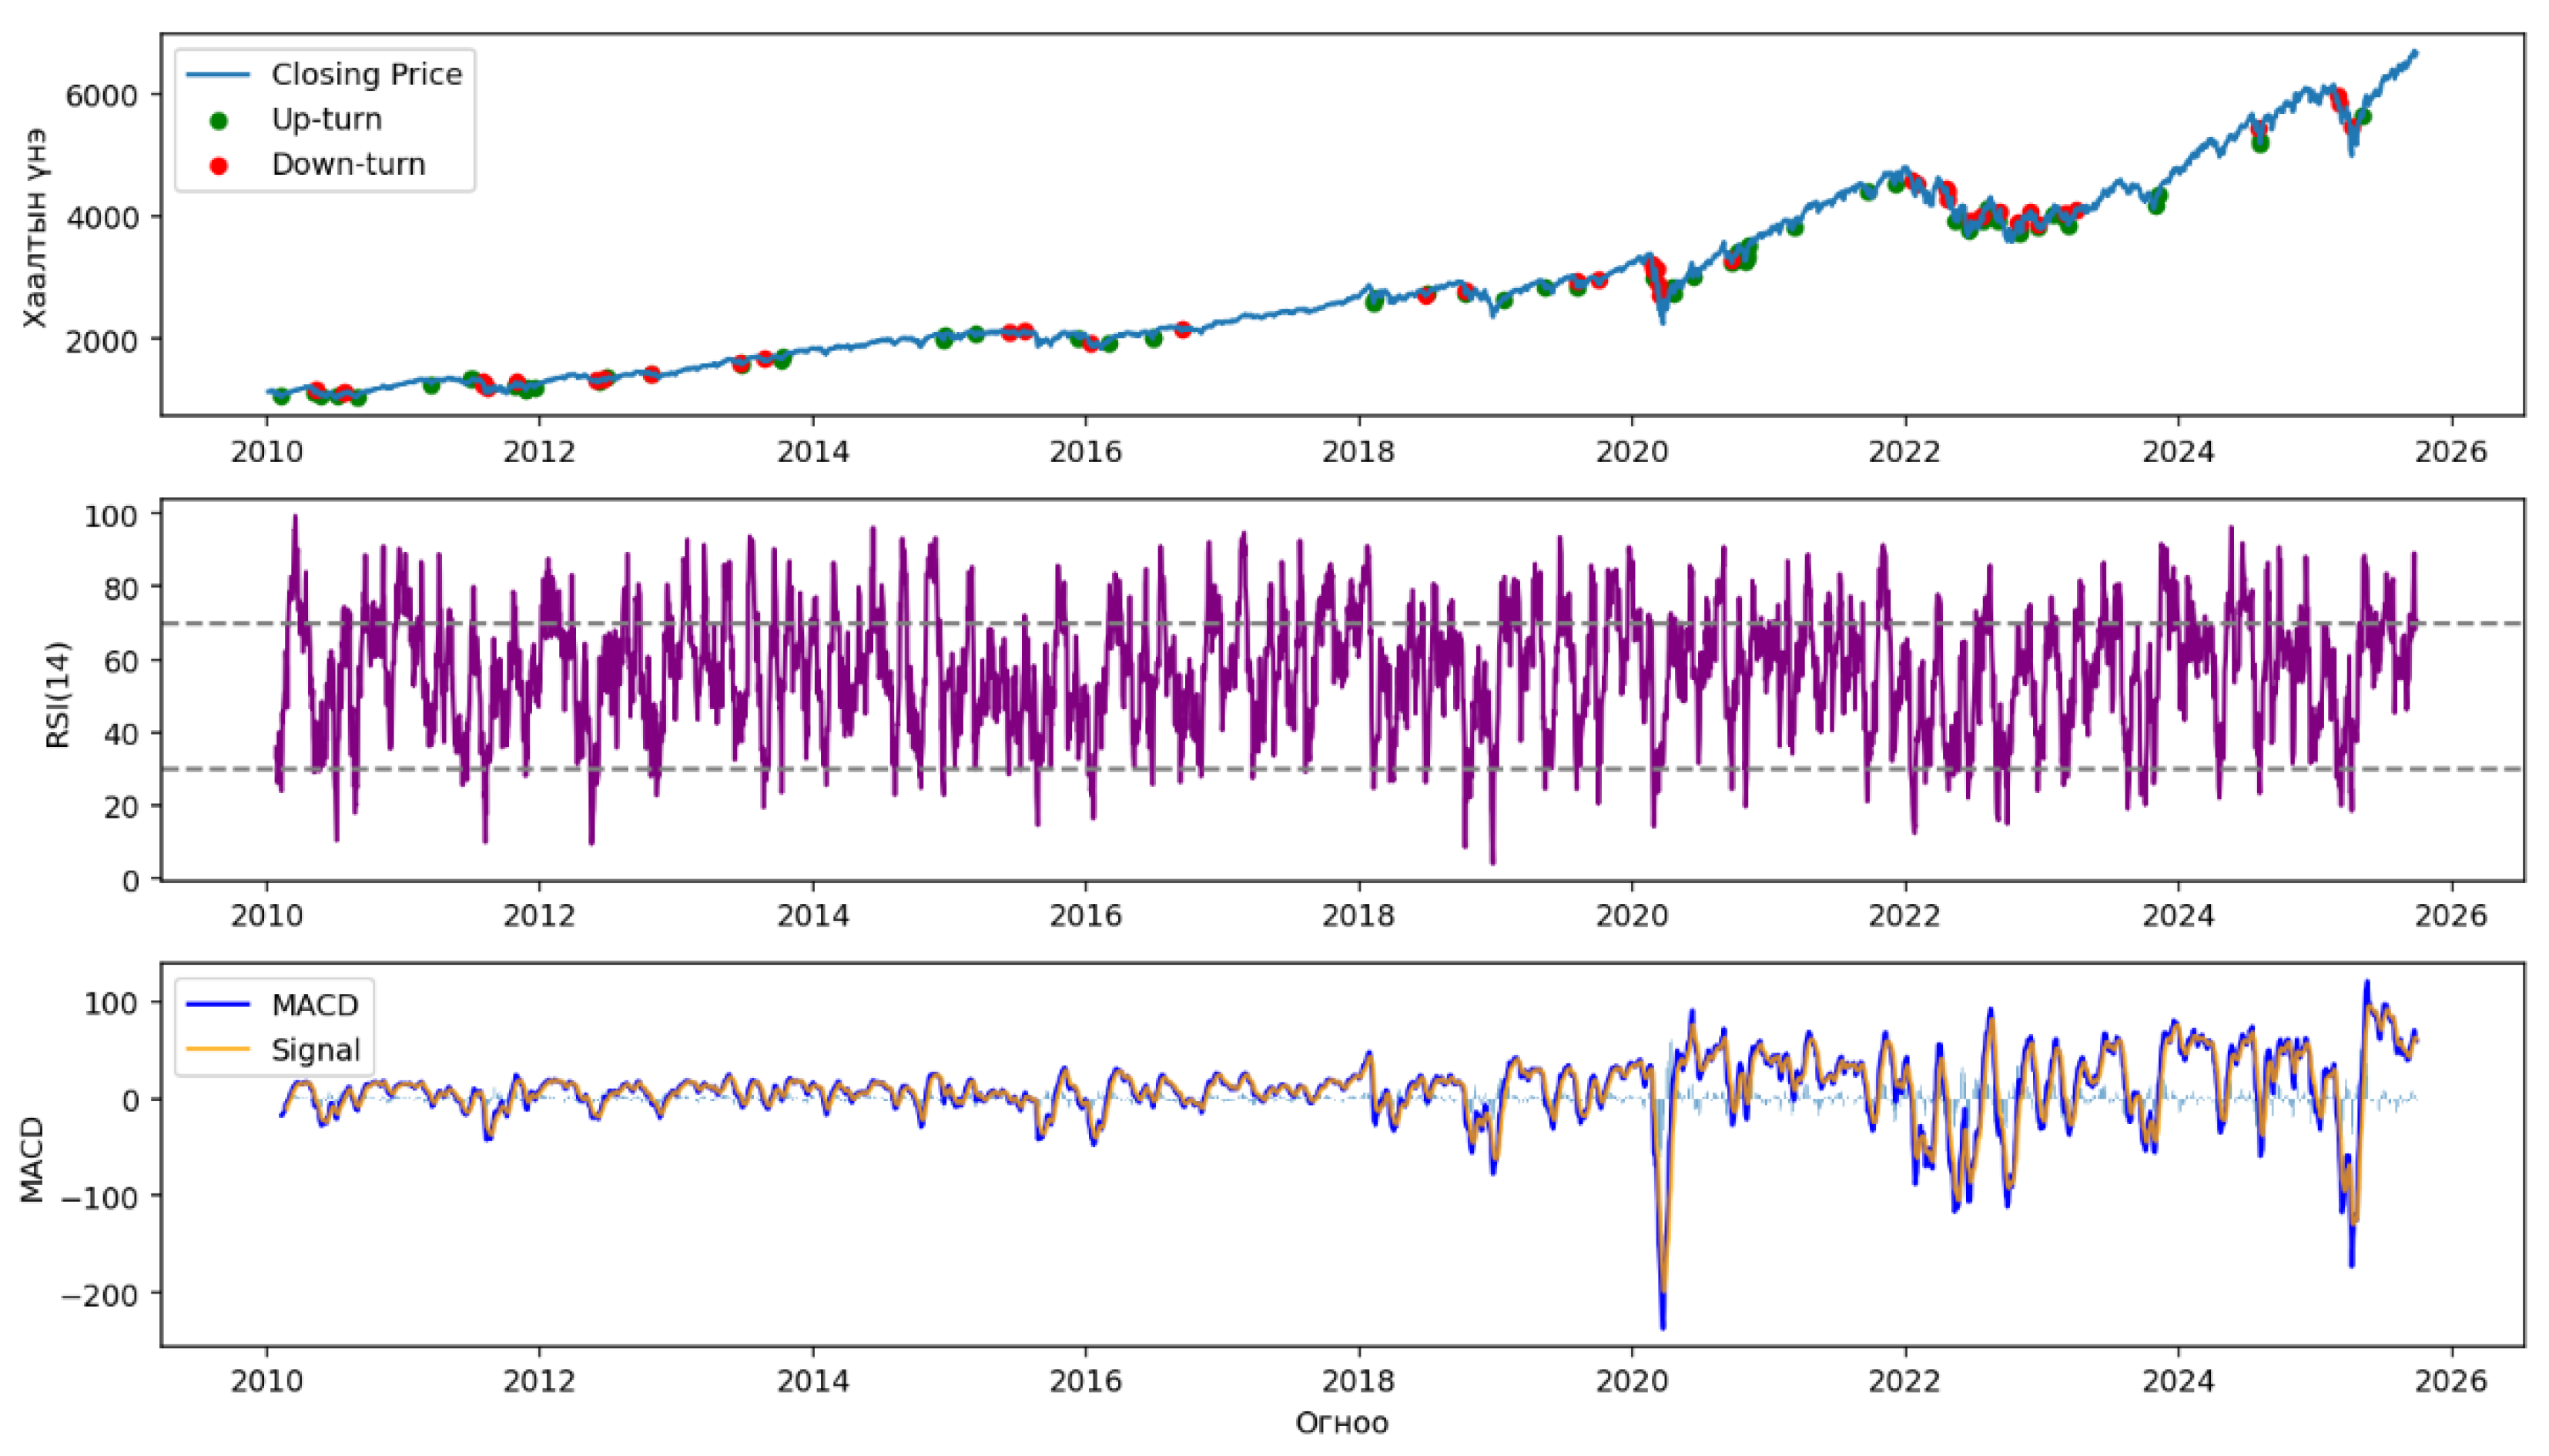
Figure 4.
Feature correlation matrix (Spearman).
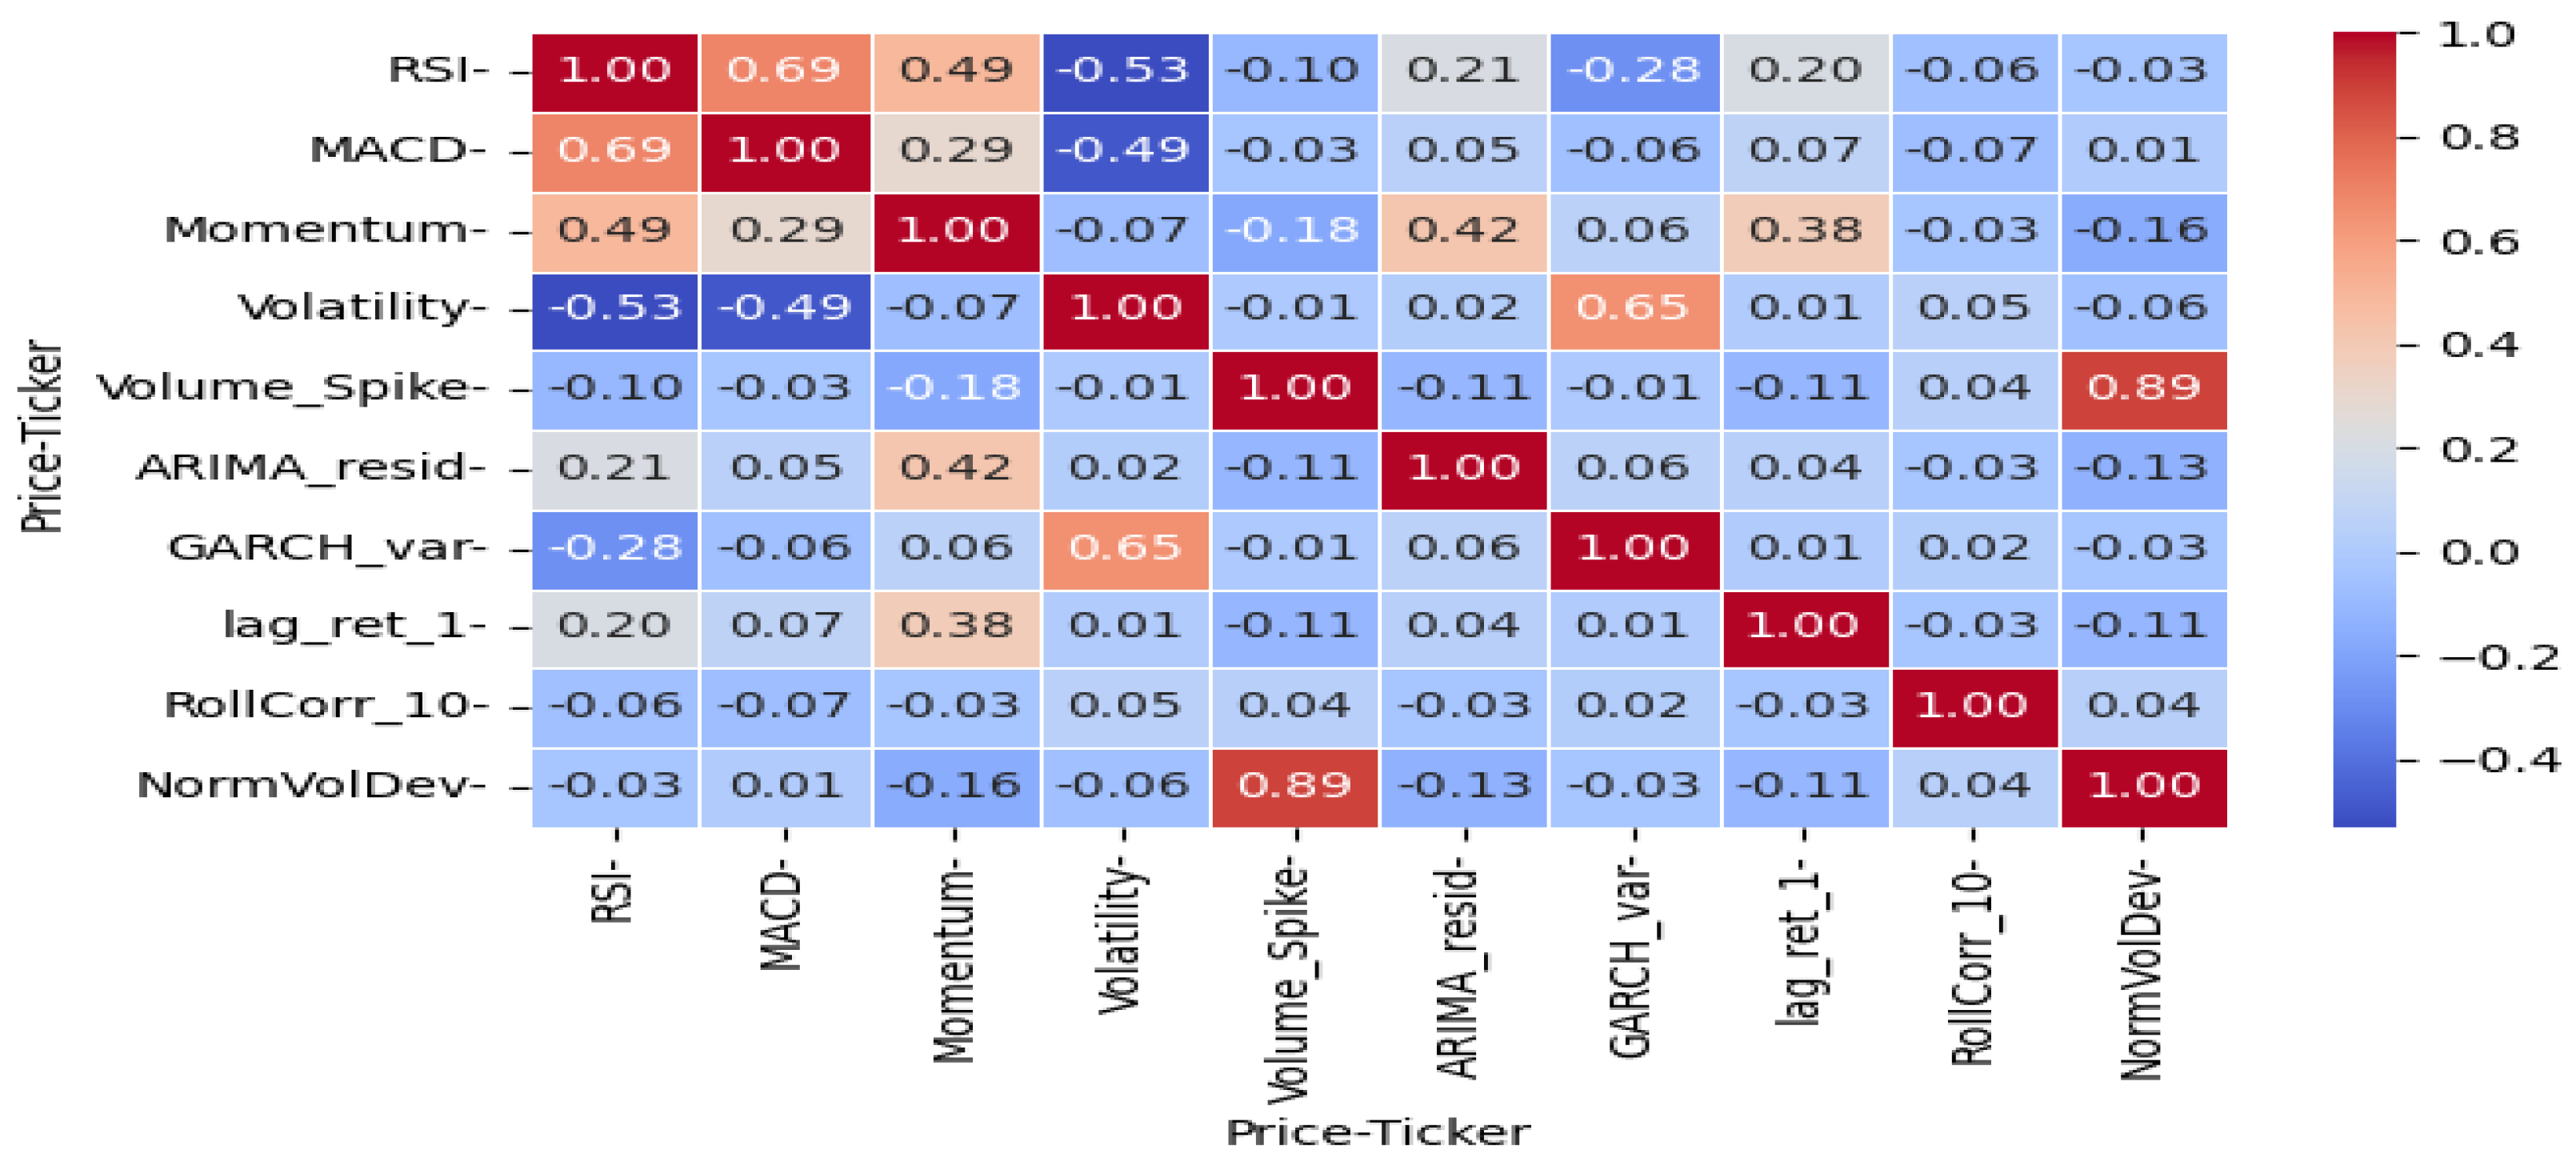
Figure 5.
Variance inflation factor (VIF) by feature.
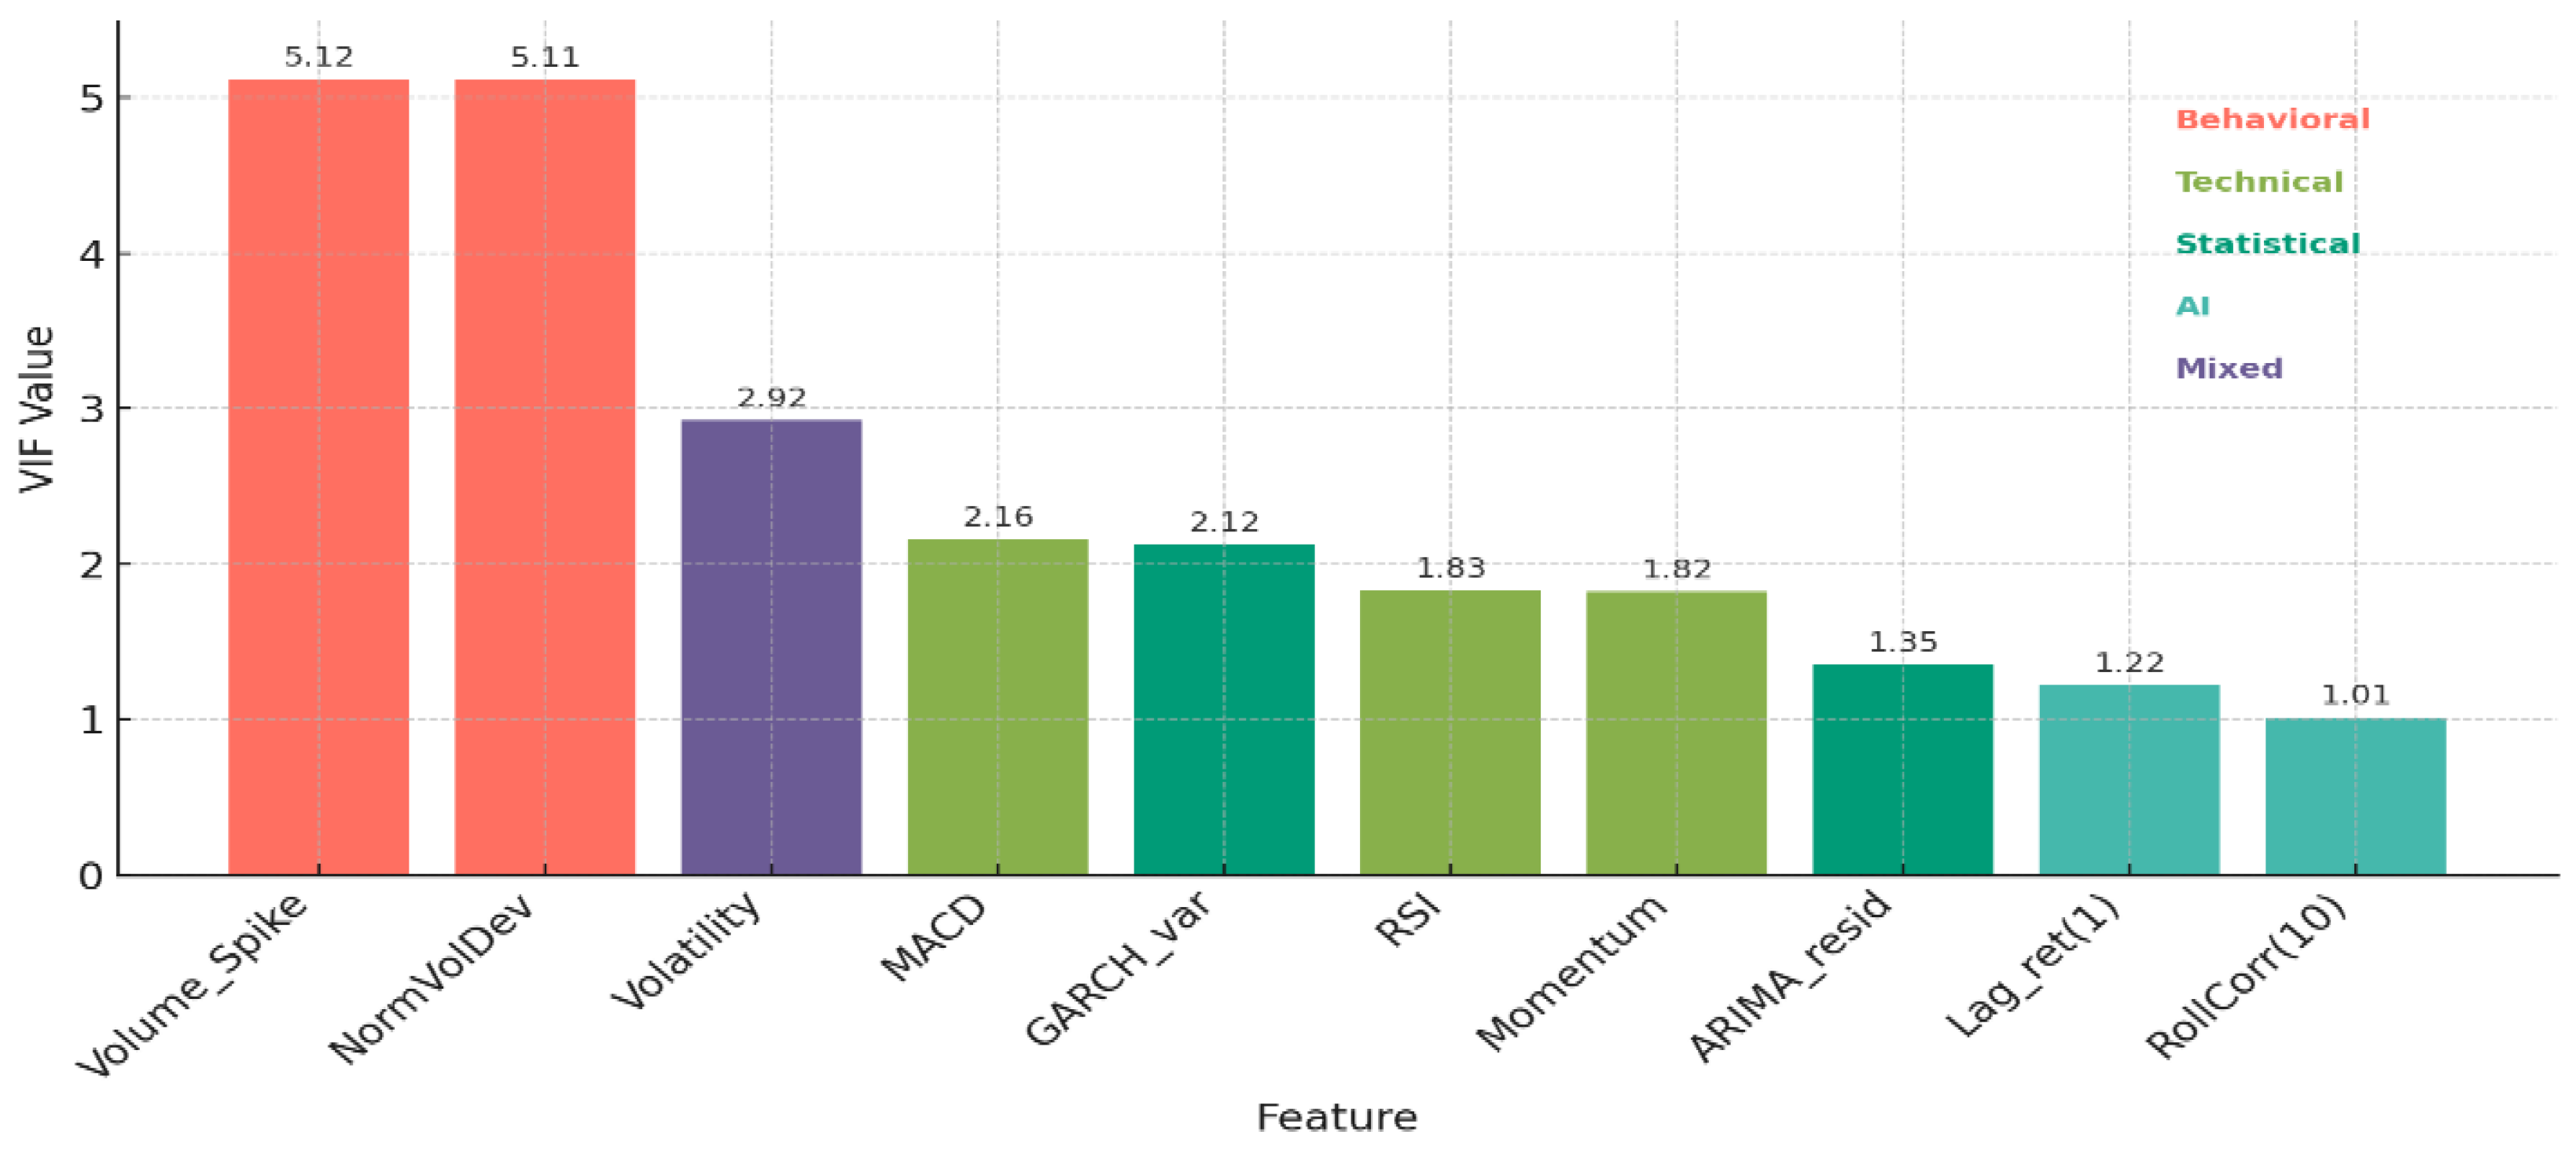
Figure 6.
Feature Importance (XGBoost).
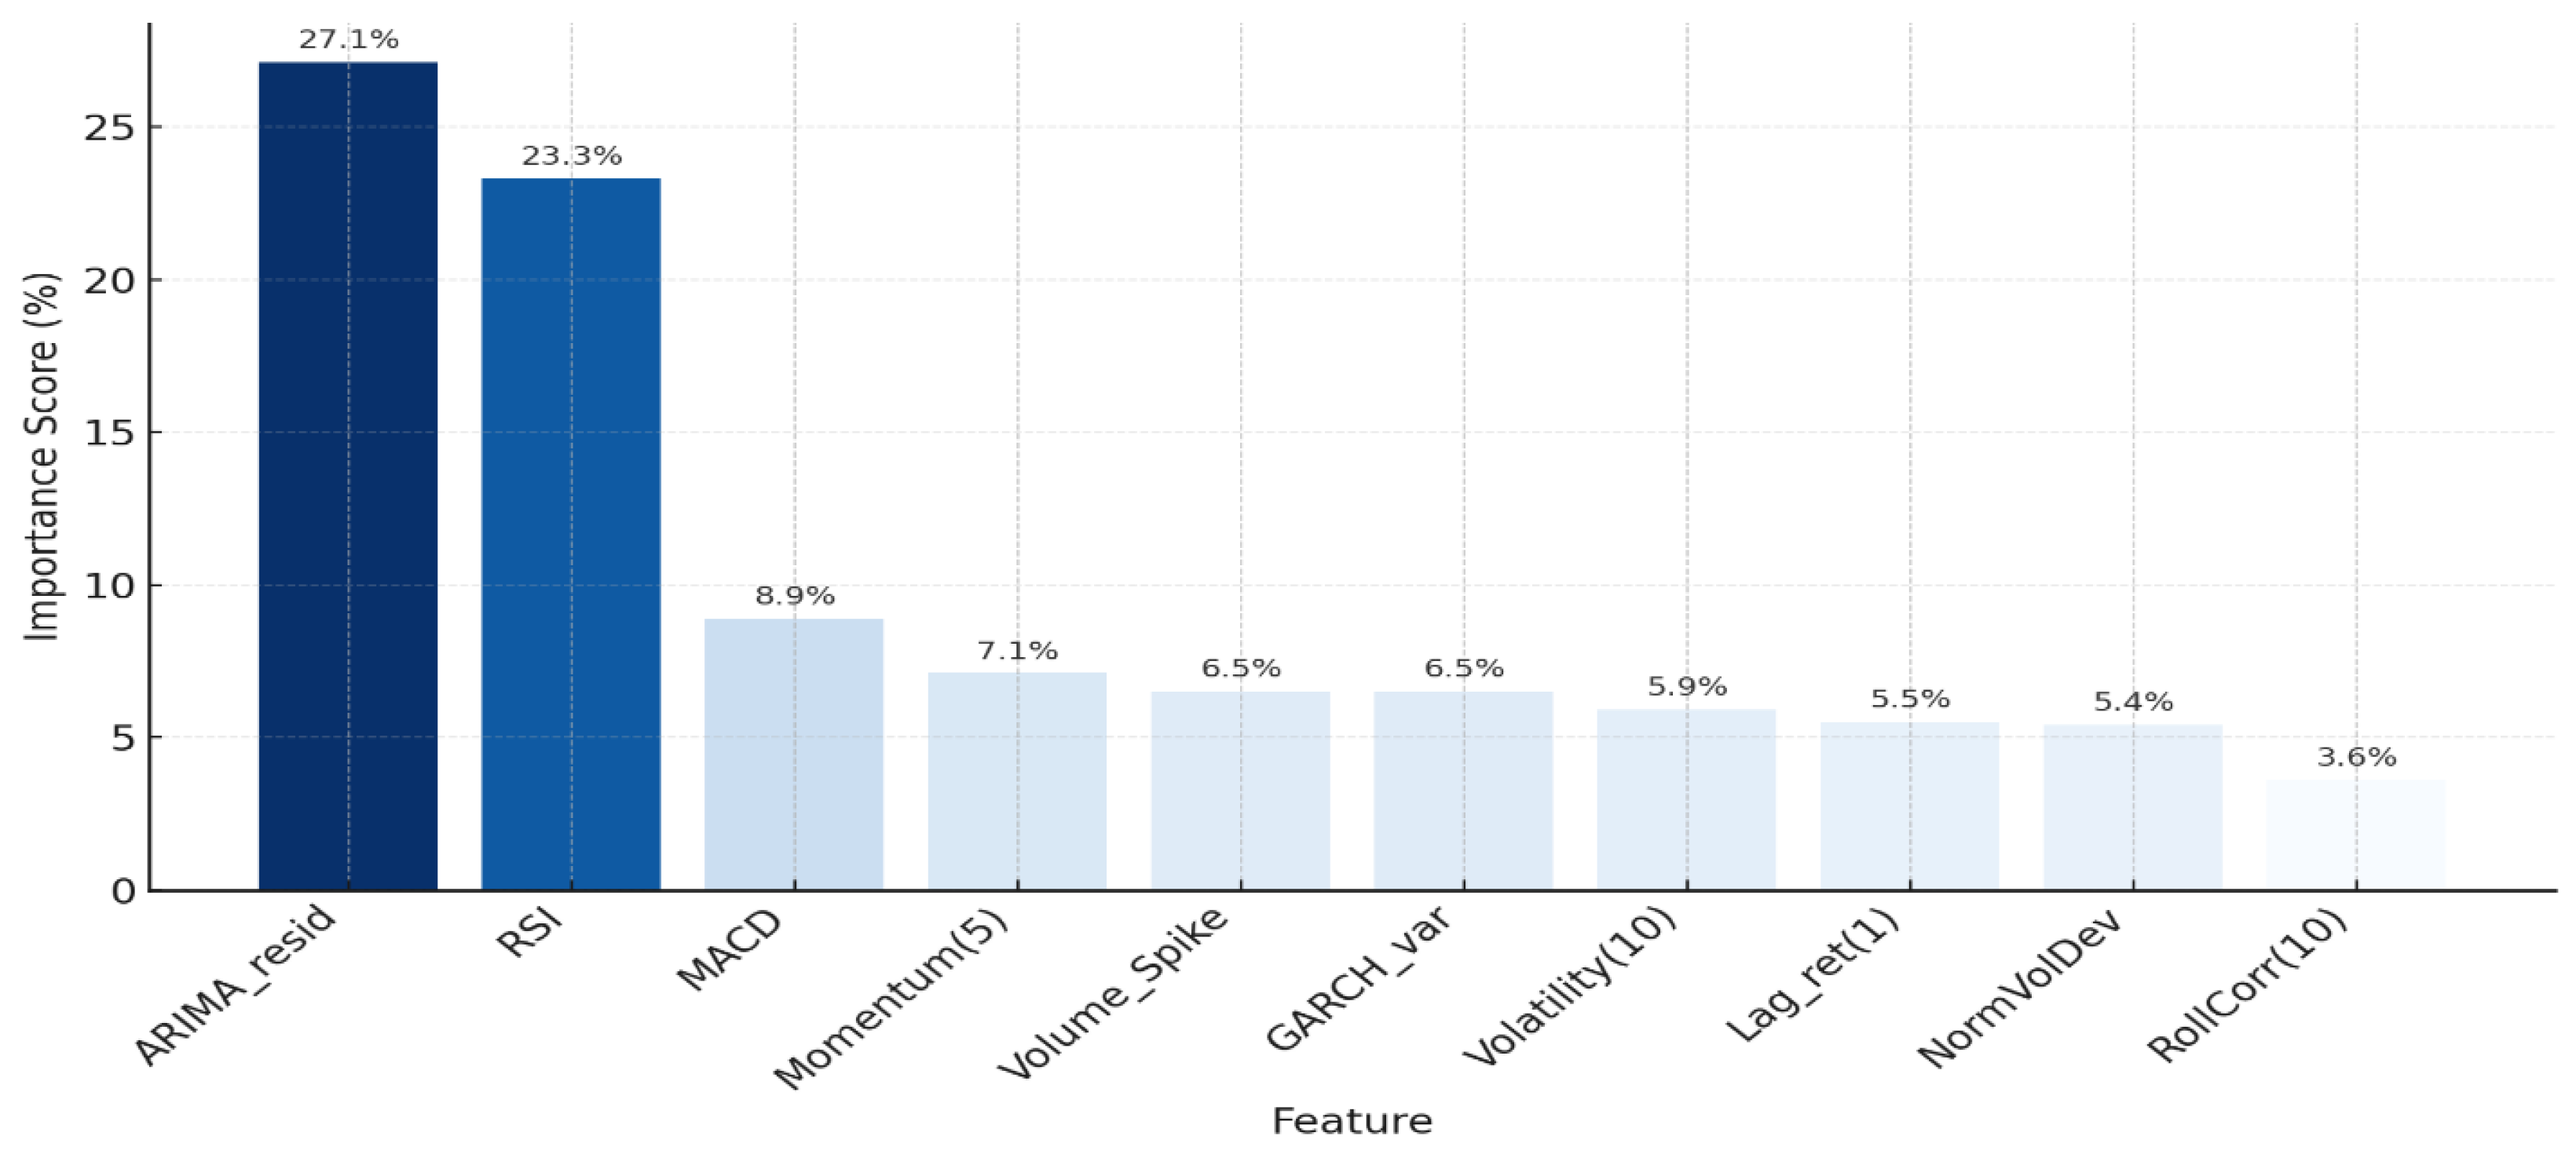
Figure 7.
Comparison of ROC and Precision–Recall curves of the models.
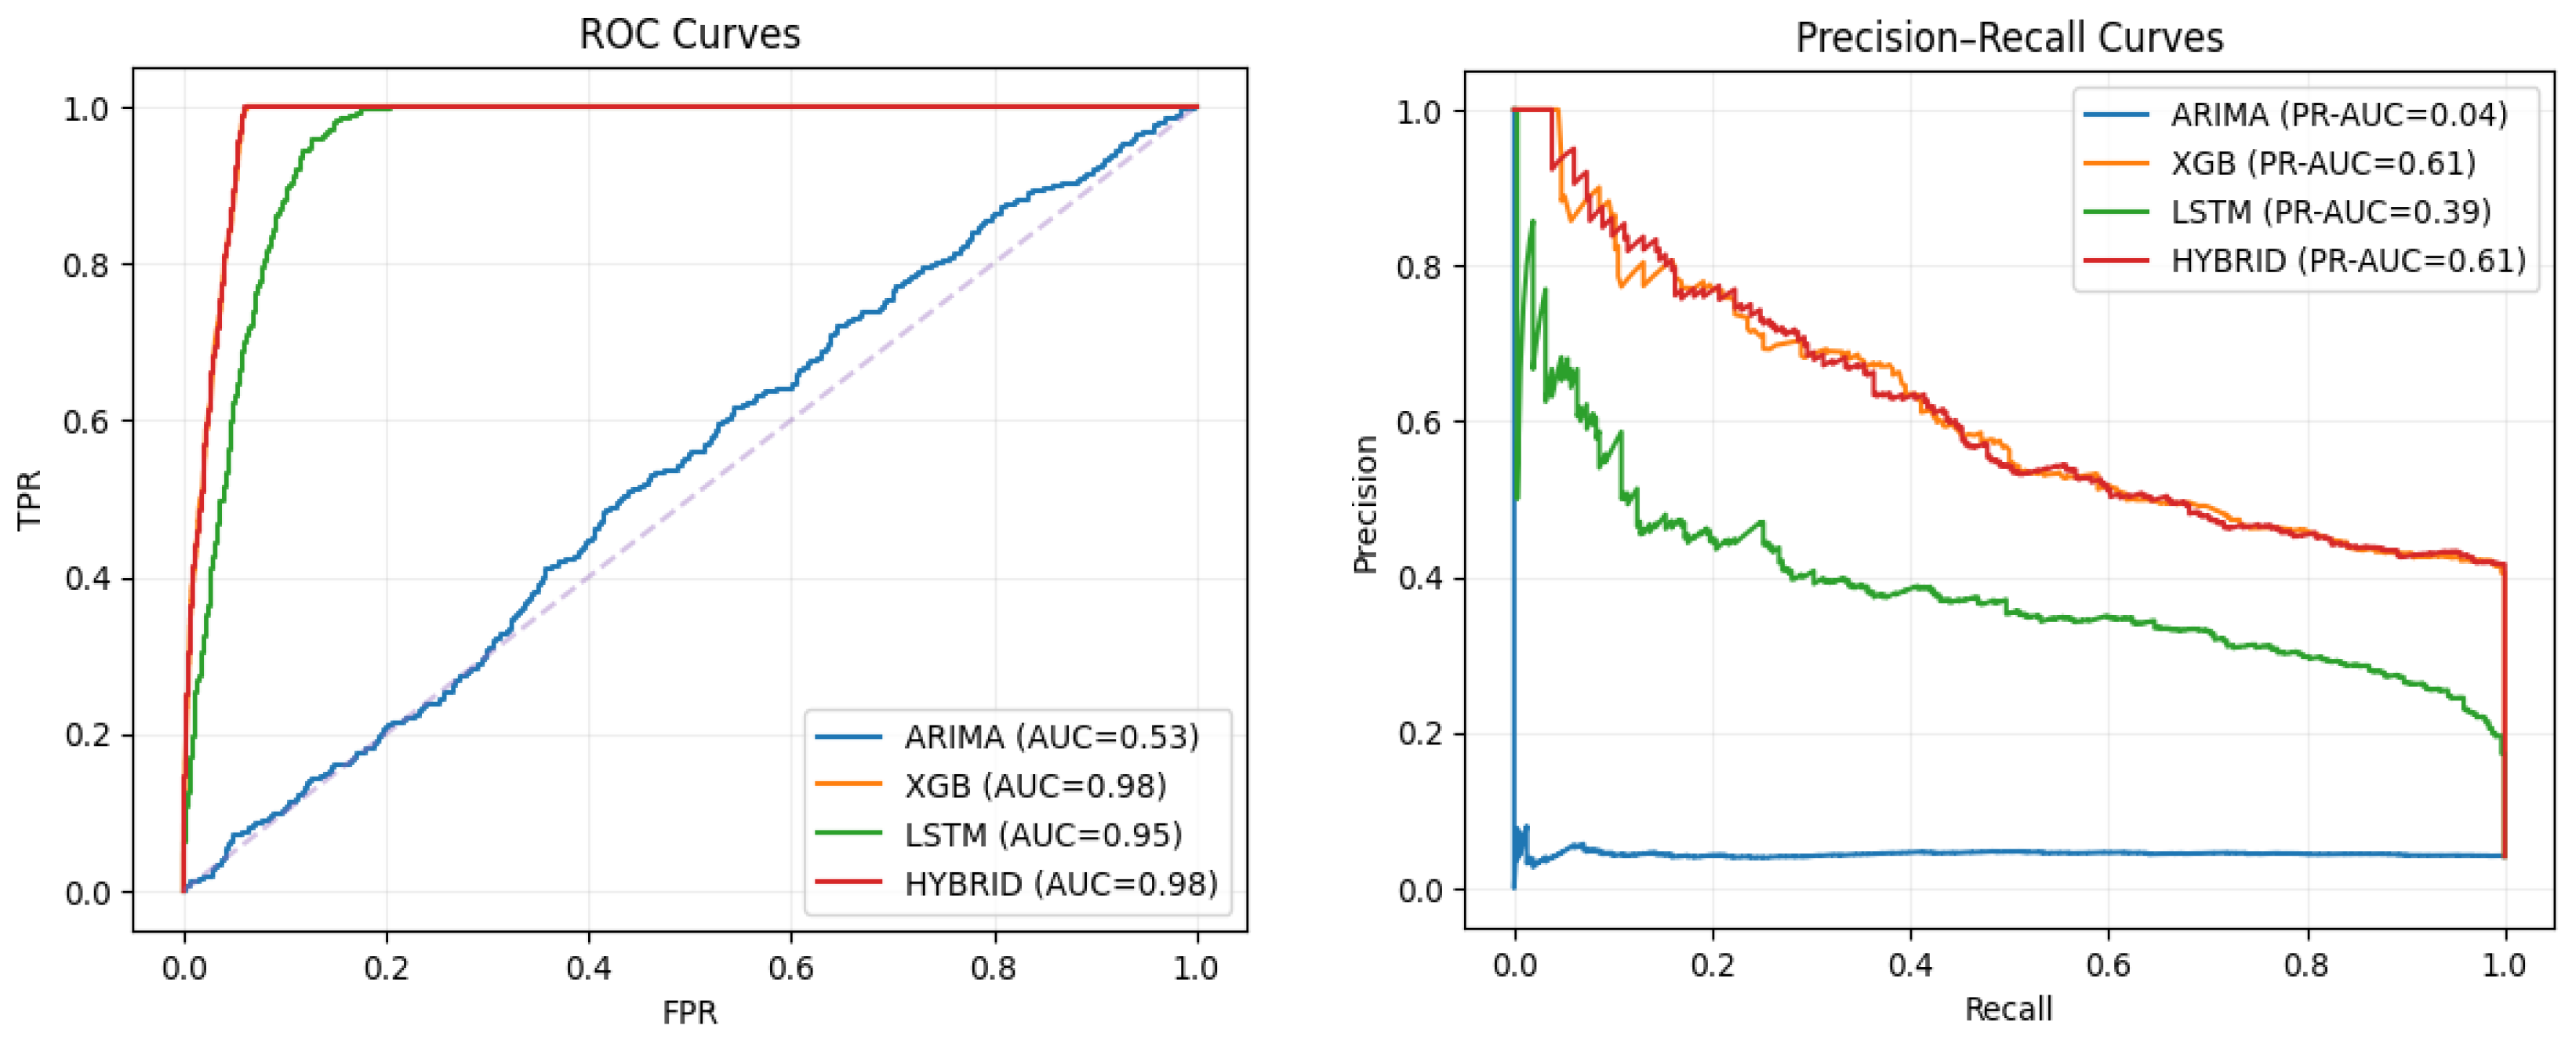

Table 1.
Summary statistics of the selected indices (2010.01.01–2025.09.30).
| № | Index | Mean daily return (%) | Standard deviation (%) | Skewness | Kurtosis |
| 1 | S&P 500 (USA) | 0.05 | 1.10 | -0.37 | 15.86 |
| 2 | Nikkei 225 (Japan) | 0.05 | 1.34 | -0.32 | 10.31 |
| 3 | FTSE 100 (UK) | 0.02 | 0.98 | -0.53 | 12.08 |
| 4 | DAX (Germany) | 0.04 | 1.23 | -0.31 | 10.09 |
| 5 | CAC 40 (France) | 0.02 | 1.23 | -0.33 | 10.38 |
| 6 | SSE Composite (China) | 0.01 | 1.26 | -0.68 | 9.64 |
| 7 | BSE Sensex (India) | 0.04 | 1.04 | -0.67 | 15.50 |
| 8 | KOSPI (Korea) | 0.02 | 1.07 | -0.31 | 9.81 |
| 9 | BOVESPA (Brazil) | 0.03 | 1.46 | -0.49 | 13.54 |
| 10 | ASX200 (Australia) | 0.02 | 0.94 | -0.68 | 11.56 |
Table 2.
Top 10 parameter configurations for turning-point detection.
| Look | Thresh | RSI_low | RSI_high | MACD | TP_cnt | Share_% | Freq_days |
| 5 | 0.020 | 35 | 65 | any | 543 | 13.72 | 7.3 |
| 5 | 0.020 | 30 | 70 | any | 482 | 12.17 | 8.2 |
| 5 | 0.025 | 35 | 65 | any | 423 | 10.68 | 9.4 |
| 3 | 0.020 | 35 | 65 | any | 397 | 10.03 | 10.0 |
| 5 | 0.020 | 35 | 65 | signprod | 377 | 9.52 | 10.5 |
| 5 | 0.025 | 30 | 70 | any | 371 | 9.37 | 10.7 |
| 3 | 0.020 | 30 | 70 | any | 362 | 9.14 | 10.9 |
| 5 | 0.020 | 35 | 65 | hist | 326 | 8.23 | 12.1 |
| 5 | 0.030 | 35 | 65 | any | 324 | 8.18 | 12.2 |
| 5 | 0.020 | 30 | 70 | signprod | 311 | 7.86 | 12.7 |
Table 3.
Hybrid turning-point detection results across indices (2010.01.01–2025.09.30).
| Index | Total observations | Detected turning points | Frequency (per day) | Percentage of turning points (%) |
| S&P500 | 3,959 | 116 | 1/34 | 2.93 |
| Nikkei225 | 3,850 | 183 | 1/21 | 4.75 |
| FTSE100 | 3,974 | 110 | 1/36 | 2.77 |
| DAX | 3,996 | 154 | 1/26 | 3.85 |
| CAC40 | 4,026 | 172 | 1/23 | 4.27 |
| SSE Composite | 3,821 | 121 | 1/32 | 3.17 |
| BSE Sensex | 3,871 | 107 | 1/36 | 2.76 |
| KOSPI | 3,874 | 106 | 1/37 | 2.74 |
| BOVESPA | 3,902 | 196 | 1/20 | 5.02 |
| ASX200 | 3,972 | 83 | 1/48 | 2.09 |
Table 4.
Comparative performance of turning point detection methods.
| Method | False Signal | Precision | F1 Score | Evaluation |
| Local extremum | 53.45% | 0.47 | 0.57 | Moderate (high noise sensitivity) |
| RSI/MACD only | 89.52% | 0.10 | 0.17 | Weak (overly sensitive to fluctuations) |
| Hybrid (2 of 3) | 72.13% | 0.28 | 0.29 | Improved and more balanced |
Table 5.
Comparative performance of the models.
| Models | Accuracy | Precision | Recall | F1 score | ROC-AUC | PR-AUC |
| ARIMA (Statistical model) | 0.573 | 0.047 | 0.487 | 0.086 | 0.532 | 0.044 |
| XGBoost (ML, calibrated) | 0.944 | 0.421 | 0.981 | 0.589 | 0.979 | 0.607 |
| LSTM (BiLSTM + Focal) | 0.928 | 0.325 | 0.704 | 0.445 | 0.952 | 0.385 |
| Hybrid (ARIMA–LSTM–SHAP) | 0.947 | 0.432 | 0.949 | 0.594 | 0.978 | 0.608 |
Table 6.
Integrated performance of hybrid models (test set).
| Models | F1 (τ=0.50) | F1 (Best) | PR–AUC | RMSE | Best_thr_F1 | Best Sharpe |
| XGBoost–LSTM | 0.194 | 0.199 | 0.107 | 0.395 | 0.53 | 0.490 |
| VMD(STL)–LSTM–SHAP | 0.170 | 0.195 | 0.184 | 0.278 | 0.67 | 0.775 |
| Stacking (XGB+ LSTM+TR)+SHAP | 0.161 | 0.179 | 0.101 | 0.417 | 0.57 | 0.456 |
| CNN–BiLSTM–Attention | 0.133 | 0.171 | 0.103 | 0.405 | 0.37 | 0.616 |
| ARIMA–LSTM–SHAP | 0.073 | 0.124 | 0.126 | 0.543 | 0.69 | 1.714 |
Disclaimer/Publisher’s Note: The statements, opinions and data contained in all publications are solely those of the individual author(s) and contributor(s) and not of MDPI and/or the editor(s). MDPI and/or the editor(s) disclaim responsibility for any injury to people or property resulting from any ideas, methods, instructions or products referred to in the content. |
© 2025 by the authors. Licensee MDPI, Basel, Switzerland. This article is an open access article distributed under the terms and conditions of the Creative Commons Attribution (CC BY) license (http://creativecommons.org/licenses/by/4.0/).
Copyright: This open access article is published under a Creative Commons CC BY 4.0 license, which permit the free download, distribution, and reuse, provided that the author and preprint are cited in any reuse.


