Submitted:
24 October 2025
Posted:
27 October 2025
You are already at the latest version
Abstract
Under the national vision of actively implementing "carbon peaking and carbon neutrality," this paper introduces the DFSR model framework and constructs a 15-item evaluation index system for transition finance in the power industry across three dimensions: Driving Force (D), State (S), and Response (R) to construct a 15-item evaluation framework for transition finance in the power industry. The Entropy Weight-TOPSIS method was applied to comprehensively assess the transition finance development data of 64 Chinese power enterprises. Furthermore, the Theil index was employed to analyze disparities and imbalances in transition finance development levels. Results indicate: (1) Driving Force and responses are core dimensions for enhancing transition finance development in power enterprises, with capital allocation efficiency and policy support intensity serving as key influencing indicators; (2) China'spower industry exhibits slow growth in transition finance development, with pronounced internal divergence and uneven progress; (3) Development disparities among enterprises with identical core production assets (thermal power or renewable energy) constitute the primary constraint on transition finance advancement in China's power industry. This research holds significant implications for the green transition of high-carbon industries, enabling sectors to adopt the power industry as a transformative paradigm and pioneer new pathways toward sustainable development.
Keywords:
transition finance
; evaluation indicator system
; entropy weight-TOPSIS method
; theil index
1. Introduction
In 2019, the Organisation for Economic Co-operation and Development (OECD) first introduced the concept of transition finance—financial activities primarily supporting low-carbon transformation for “brown industries” and carbon-intensive sectors to achieve their sustainable development goals. Developing transition finance is an essential pillar for China’s financial support of its “dual carbon” goals. Constrained by the project scope of green finance, which lacks coverage for traditional carbon-intensive industries like power, cement, and steel, transition finance serves as a crucial supplement and extension to green finance. It can address the financing needs of China’s traditional carbon-intensive industries in their low-carbon transition. To achieve green and low-carbon development in high-emission or hard-to-abate sectors, industries and projects should fully leverage transition finance to redirect capital flows from high-carbon to low-carbon pathways, driving corporate energy conservation and emissions reduction. In September 2020, President Xi Jinping announced at the 75th UN General Assembly: “China will enhance its nationally determined contributions and adopt more robust policies and measures to ensure carbon dioxide emissions peak before 2030 and strive to achieve carbon neutrality before 2060.” Transition finance will play a pivotal role in financing channels, just transition, and quantifying risks for achieving these dual carbon goals.
Research on transition finance development, both domestically and internationally, has primarily focused on theoretical studies. Scholars have examined transition finance from different angles: First, from an application perspective, based on theoretical foundations such as its connotation and framework [1], effect mechanisms [2], and practical experience [3], exploring the system construction and strategy research for China’s transition finance development. Second, from a risk perspective, studying the comparison of transition finance risk management domestically and internationally [4], operational mechanisms [5], and risk transmission channels [6]. Shu Hao et al [7]. (2023) argue that corporate low-carbon transitions inevitably create stranded assets, whose risks significantly undermine corporate value. Third, from the perspective of transition finance products, Li Ruijie [8] and Xu Hongfeng [9] systematically analyzed linked transition finance instruments, highlighting the difficulties and challenges in developing such products. In recent years, empirical research on the influencing factors of transition finance has become a prominent trend. Luo Ying [10] et al. (2024) used spatial econometric models to validate that transition finance financing promotes low-carbon transformation in high-carbon industries and generates spatial spillover effects. Ding Pan [11] et al. (2023) demonstrated that transition finance can enhance high-carbon enterprises’ carbon reduction technology levels, thereby lowering corporate carbon emissions. Yang T [12] et al. (2025) argued that transition finance policies can sustainably drive both the quantity and quality of green innovation in brown enterprises. However, research on measuring transition finance remains scarce, primarily confined to provincial-level studies, with a lack of sector-level investigations.
China is a major manufacturing powerhouse and the world’s largest greenhouse gas emitter. According to China’s sectoral carbon emission statistics, the energy sector is the primary contributor, with the power industry ranking first among the eight high-carbon sectors [13] in terms of both carbon emissions and transition risk. Selecting it as the research subject for transition finance development demonstrates significant industry exemplarity. Therefore, this paper employs the Entropy Weight-TOPSIS method, incorporates the DFSR model framework, and utilizes balanced panel data from 64 listed power companies between 2019 and 2022 to construct a system and evaluate indicators for transition finance in China’spower industry. It analyzes key factors influencing the development of transition finance in the power industry and comprehensively examines its current level of development. Finally, the Theil index is applied to further analyze disparities and imbalances in China’spower industry transition finance development, aiming to provide valuable insights for subsequent related research.
2. Construction of the Transition Finance Evaluation Indicator System and Research Methodology
2.1. Indicator Construction
This paper draws upon relevant research by scholars such as Ma Jun [14], aligns with the fundamental nature of low-carbon transformation in the power industry, and adheres to principles combining scientific systematicity, industry adaptability, and data verifiability. It introduces the DFSR model framework to construct a financial evaluation system forpower industry transformation comprising 15 indicators across three dimensions: Driving Force (D), State (S), and Response (R), as shown in Table 1. Specifically, drawing on the research of Xiao Renqiao et al [15], the efficiency of green achievement conversion is calculated using the DEA-SBM model. This model employs the number of green patent applications and green patent authorizations as inputs, sales revenue as the desired output, and pollution emission indices and energy consumption indices as undesired outputs. A higher efficiency value indicates greater efficiency in converting green achievements. Referencing the research of Kong Dongmin et al [16], the quality of green information disclosure is derived by summing the scores from 25 environmental disclosure items across five dimensions of the enterprise, followed by log-transforming the total score. A higher quality value indicates superior green information disclosure.
2.2. Research Methodology
2.2.1. Entropy Weighting-TOPSIS Method
The Entropy Weighting Method determines weights based on data fluctuations across indicators, while the TOPSIS Method calculates comprehensive evaluation indices for assessment objects by constructing standardized matrices. This study employs a weighted combination of Entropy Weighting and TOPSIS to calculate the Transition Finance Development Index for listed enterprises in China’spower industry, allowing for a precise assessment of the sector’s transition finance development trends and levels. First, the entropy weight method incorporating a time variable is used to assign weights and calculate entropy values for each indicator, identifying the primary factors influencing the development of transition finance in the power industry. Second, building upon the entropy weight method, a weighted standardized matrix is constructed. The TOPSIS method is then applied to calculate the relative proximity of the power industry to the optimal solution for each year, enabling both component-specific and comprehensive evaluations of the development level of transition finance in China’s power industry.
There are research subjects and n evaluation indicators, let denote the raw value of indicator j for enterprise i.
To eliminate differences in data units and dimensions, this study applies separate standardization processes to positive and negative indicators. To prevent zero or negative values from affecting subsequent calculations, a minimum unit value is added to the standardized data, with . Specific indicator processing is as follows:
First, standardization:
Positive indicator (1)
Negative indicators (2)
Where represents the standardized value of indicator j for enterprise i ; denotes the maximum value of indicator j ; denotes the minimum value of indicator j.
Second, calculate the proportion of each indicator: (3)
Third, calculate the entropy value for each indicator: (4)
Fourth, calculate the weights for each indicator: (5)
Fifth, construct the weighted standardized matrix: (6)
Sixth, compute positive and negative ideal solutions:
Positive Ideal Solution (7)
Negative ideal solution: (8)
Seventh, calculate the Euclidean distance:
Distance from the optimal solution: (9)
Distance from the worst solution: (10)
Finally, calculate the relative proximity of company i for each year: (11)
Relative proximity represents the comprehensive evaluation index for each sample. Its value ranges from (0, 1). The closer is to 1, the better the evaluation subject performs, indicating a higher level of transition finance development for that enterprise; conversely, a lower value indicates poorer performance. The ranking of values reflects the hierarchical order of transition finance development levels among enterprises.
2.2.2. Theil Index
The Theil Index is a metric for measuring data imbalance between individuals or regions, reflecting disparities in transition finance development levels among enterprises in China’spower industry. Its value ranges from 0 to 1, where a higher index indicates greater disparity and a lower index indicates lesser disparity.
Based on the power generation structure and installed capacity structure of power enterprises, this study categorizes the 64 research samples into two groups: the thermal power group and the renewable energy group, based on whether they are “thermal power-dominant” or “renewable energy-dominant.” The thermal power group includes 32 power enterprises such as Shenzhen Energy, Shennan Electric A, and Suihengyun A. The renewable energy group includes 32 power enterprises such as Dongxu Blue Sky, Sichuan Energy Power, and Solar Energy. Furthermore, the power company transition finance evaluation index was selected as the core variable for the Theil index, with total power generation serving as the weighting variable. This approach addresses the inherent spatial imbalance in power generation distribution while directly reflecting the core output scale of power companies. The specific calculation formula is as follows:
Grouped Tyer Index (12)
Intra-group Variation (13)
Inter-group variance (14)
Total Tiel Index (15)
In Equations (12) to (15), the entire sample is divided into i groups. denotes the comprehensive transformation finance evaluation index of the jth enterprise in group i, represents the sum of comprehensive evaluation indices for all enterprises in group i, and signifies the sum of comprehensive evaluation indices for all power enterprises. indicates the power generation volume of the jth enterprise in group i, denotes the sum of power generation volumes for all enterprises in group i, and signifies the sum of power generation volumes for all power enterprises.
2.3. Data Sources
This study selects A-share listed power companies that went public before 2019 and are not subject to ST, *ST, or PT designations as research subjects. Companies with missing variables during the sample period are excluded. The final dataset comprises balanced panel data on the transition finance development levels of 64 Chinese power companies from 2019 to 2022, containing 256 annual sample observations. Data sources include annual reports, social responsibility reports, sustainability reports of listed companies, and the Guotai An (CSMAR) database. Partially missing data were imputed using linear regression. Data processing and empirical analysis were conducted using Stata 18.
3. Analysis of Transition Finance Development Levels
3.1. Indicator Weight Analysis
This study employs the entropy weight method to calculate the weights of each indicator at all levels, with results presented in Table 2. Within the primary indicator layer of the power industry’s transition finance evaluation framework, Driving Force (D) exerts the greatest influence on transition finance development, with a weight of 0.5330. followed by Response (R) at 0.4353; while State (S) has the least impact, with a weight of only 0.0318. The results indicate that Driving Force (D) and Response (R) are the core dimensions influencing the development level of transition finance across enterprises in the power industry, accounting for a combined weight of 96%. At the secondary indicator level, capital allocation efficiency, policy support intensity, technological innovation capability, and emission reduction implementation effectiveness ranked highest in weight among different primary indicators, at 0.3165, 0.3064, 0.2173, and 0.0998, respectively. All these indicators belong to the primary indicator layers of Driving Force (D) and Response (R). The results indicate that these four indicators are key factors influencing the development level of transition finance in the power industry. At the tertiary indicator level, the largest weights are assigned to environmental governance expenditure share, green subsidy intensity per unit of electricity generated, clean technology R&D expenditure ratio, carbon market participation rate, and carbon asset efficiency, with respective weights of 0.2942, 0.2070, 0.1186, 0.0994, and 0.0988, respectively. These indicators belong to the secondary indicator layers of capital allocation efficiency, policy support intensity, technological innovation capability, and emission reduction implementation effectiveness, as well as the primary indicator layers of driving forces (D) and response (R). The results indicate that these five factors are key indicators influencing the development level of transition finance in the power industry. In addition, it further shows that strengthening policy guidance and effective capital investment remain the two core engines driving China’spower industry toward low-carbon transformation.
3.2. Analysis of Transition Finance Development Level
3.2.1. Comprehensive Evaluation of Transition Finance Development Level
Based on the indicator weights calculated using the entropy weight method, this paper employs the TOPSIS method to derive the evaluation indices and rankings for the transition finance development levels of 64 power enterprises from 2019 to 2022. The annual averages represent the comprehensive evaluation indices for transition finance development in China’spower industry. Furthermore, the top six power enterprises with the highest transition finance evaluation indices in 2022—Shenzhen Energy, Shennan Electric A, Gannan Energy, Suihengyun A, Dison, and Meiyan Jixiang—were compared with the annual comprehensive evaluation indices of China’spower industry, with results shown in Table 3.
Among power companies, Shenzhen Energy’s transition finance evaluation index showed significant fluctuations: it declined by 27.34% from 2019 to 2020, rebounded by 13.83% from 2020 to 2021, and remained stable at 0.3326 in 2022. Its ranking has consistently held within the top two positions, reflecting Shenzhen Energy’s sustained leadership in transition finance development within the industry. Shennan Electric A’s index slightly decreased from 2019 to 2020 but surged significantly to 0.3287 from 2020 to 2021, representing a 55.56% growth rate. It reached 0.3235 in 2022, climbing to second place, demonstrating Shennan Electric A’s notable progress in transition finance development. Although Gannan Energy’s evaluation index has declined annually, its absolute values remain consistently high. It ranked as the top enterprise in the power industry for transition finance development from 2019 to 2021, with a peak index of 0.5009. Its 2022 index of 0.3187 placed it third, indicating a deceleration in its transition finance development pace. Suihengyun A’s evaluation index has shown continuous growth, particularly with a significant increase in 2022. It rose from 0.2362 in 2021 to 0.2969, representing a growth rate of 25.70%. Its ranking fluctuated but rose to fourth place in 2022, reflecting further improvement in Suihengyun A’s performance in transition finance development. Disen’s evaluation index rose steadily from 0.2461 in 2019 to 0.2480, 0.2779, and 0.2903. Although its ranking declined slightly in 2022, it remained in the upper tier overall, indicating a relatively steady improvement in Disen’s transition finance development level; Meiyan Jixiang maintained high growth rates, rising 21.38% from 2020 to 2021 and continuing to increase by 17.00% from 2021 to 2022, consistently ranking sixth. This reflects Meiyan Jixiang’s persistent efforts in advancing transition finance. Within the power industry, China’s transition finance development level showed annual growth from 2019 to 2022, though at a relatively slow pace. It increased from 0.1406 to 0.1695, representing a growth rate of only 20.56%. The 2022 comprehensive evaluation index reached its peak at 0.1695, yet it remained significantly below the transition finance evaluation indices of the top six power enterprises. This indicates pronounced differentiation within China’spower industry regarding transition finance development, with leading enterprises standing out distinctly. The sector as a whole is currently in a critical transitional phase, shifting from “initial development” to “rapid growth.” Comparative analysis reveals pronounced disparities among enterprises in the power industry regarding transition finance development. While a few companies maintain steady progress, most lag behind, exhibit insufficient momentum, or experience intermittent setbacks in transition finance development. This results in a relatively low overall level of transition finance development within China’s power industry.
3.2.2. Sub-Item Evaluation of Transformational Financial Development Level
Building upon the comprehensive evaluation of China’spower industry transition finance development, this study conducts a sub-item evaluation at the primary indicator level. First, the top six power enterprises with the highest transition finance evaluation indices in 2022 were selected as research subjects: Shenzhen Energy, Shennan Electric A, Gannan Energy, Suihengyun A, Dison., and Meiyan Jixiang as research subjects. Second, Equation (6) is applied to the indicator data and weights at the levels of Driving Force (D), State (S), and Response (R), ultimately yielding the sub-evaluation indices and rankings for the development level of transition finance among these six power enterprises from 2019 to 2022. The results are shown in Table 4 and Figure 1.
Overall, from 2019 to 2022, the evaluation indices for driving force, status, and responsiveness across the six power enterprises showed fluctuating upward trends. The development level of transition finance in the power industry is gradually improving, but significant imbalances persist across different indicators and enterprises.
At the Driving Force (D) level, most enterprises saw accelerated growth in their evaluation indices starting in 2021. Shenzhen Energy maintained a consistently high index throughout the four-year period, while Shennan Electric A and Meiyan Jixiang demonstrated the most significant improvement trends, emerging as leading companies in driving force. Regarding the State (S) dimension, the state evaluation index exhibited overall greater volatility and was notably higher than the driving force and response evaluation indices across all companies. This indicates that power companies generally possess a solid foundational level and a favorable current status in the state dimension. Given that the combined weight of driving force and response indicators significantly exceeds that of the state dimension, it further suggests that disparities in the development of transition finance among companies primarily stem from the driving force and response dimensions. These two dimensions are the key decisive factors in evaluating the development of transition finance within power companies. At the Response (R) level, the response evaluation index exhibits scattered and relatively low variations. Gannan Energy demonstrates the strongest response capability, maintaining a leading evaluation index for four consecutive years. Other enterprises show a trend of initial decline followed by rapid improvement, particularly Shennan Electric A and Meiyan Jixiang , which achieved the fastest progress in 2021-2022. Nevertheless, the overall response capability of power enterprises remains relatively weak.
Individually, Shenzhen Energy, Shennan Electric A, and Gannan Energy stand out as the three power companies with the highest transition levels, demonstrating strengths across all three dimensions: driving force, state, and response. Meiyan Jixiang shows the most prominent performance in transition finance development, exhibiting the most significant growth trend. In contrast, Suihengyun A and Dison perform poorly in both driving force and response dimensions.
3.3. Disparities in Transition Finance Development Level
To further analyze disparities and imbalances in transition finance development among China’s power enterprises, the Theil index was applied to Intra-group disparity, Inter-group disparity, Total disparity, and Group disparity, with results shown in Table 5.
The results for Intra-group disparity and Inter-group disparity reveal that the Intra-group Theil index has consistently far exceeded the inter-group Theil index year after year. This indicates that the imbalance in transition finance development within the power industry primarily manifests as severe disparities among enterprises within the thermal power group and the renewable energy group. Although the Intra-group Theil index has shown a declining trend in recent years, it remains the absolute dominant source of overall variation within China’s power industry.
Regarding the Total Theil index, it decreased from 0.2142 in 2019 to 0.1285 in 2022, representing a cumulative reduction of 40.01%. This indicates that disparities and imbalances in the development of transition finance within China’spower industry have been effectively mitigated, with the entire industry progressing toward greater coordination and equilibrium. Compared to both Intra-group disparity and Inter-group disparity, the reduction in the intra-group Theil index has made a more significant contribution to the downward trend in the Total Theil index. This further demonstrates that addressing internal imbalances is crucial for promoting overall equilibrium within the power industry.
Regarding Group disparity, the Theil index for the thermal power group decreased from 0.2237 in 2019 to 0.1172 in 2022, a 47.61% reduction. This reflects the sustained and rapid narrowing of internal gaps among thermal power-dominated enterprises. This trend stems from leading central state-owned enterprises like Guodian Power and Huaneng International taking the initiative in practicing transition finance, thereby establishing a demonstration effect among top-tier companies. The Theil index for the renewable energy group first rose from 0.1836 in 2019 to 0.2558 in 2021, then declined to 0.1395 in 2022. This indicates that the internal disparity among renewable energy-focused enterprises first widened before narrowing, yet remains overall higher than that of the thermal power group. Therefore, the internal development imbalance within the renewable energy group represents a new issue requiring focused attention at this stage.
4. Conclusions and Implications
4.1. Conclusions
In terms of the temporal characteristics of financial transformation development, the development level of transformation finance in China’s power industry shows a slow growth trend. First, the indicator weighting reveals that Drivers (D) and Response (R) are the core dimensions influencing transition finance maturity in the power industry, while Funding Allocation Efficiency (proportion of environmental governance expenditure) and Policy Support Intensity (green subsidy intensity per unit of electricity generated) are the most critical indicators affecting power enterprises’ transition finance maturity. Second, the comprehensive evaluation indicates that China’spower industry transition finance is in a critical transitional phase, with an overall low development level and significant disparities and imbalances within the sector. Third, the sub-item evaluation reveals that power companies generally have a good foundational level and current status at the state level., but exhibit notable shortcomings in the driving force and response dimensions—the two decisive factors in evaluating their transition finance development. Fourth, the Theil index indicates that disparities and imbalances in China’spower industry transition finance are gradually improving annually. However, these imbalances primarily stem from severe developmental disparities among enterprises within thermal power and renewable energy groups.
4.2. Implications
Based on the above findings, this study offers the following policy implications:
(1) Strengthen policy guidance and incentive mechanisms to enhance “driving force” levels. First, considering the current status, characteristics, and challenges of transition for thermal power and renewable energy enterprises, it is recommended that fiscal departments or industry associations formulate differentiated financial support policies such as tailored subsidy schemes, tax incentives, and green credit quotas. Collaborate with financial institutions to establish a “Special Transition Finance Guidance Fund” prioritizing support for clean technology R&D, low-carbon retrofits, and stranded asset disposal projects, while eliminating universal subsidies for inefficient emission reduction initiatives. Second, expand the coverage of the carbon trading market by incorporating more power companies into the mandatory carbon reduction system. It is recommended that participation in the carbon trading market be made a prerequisite for policy support. Companies should be encouraged to reinvest carbon allowance revenues into green investments. Part of a company’s emission reduction performance could be directly converted into low-interest transition loans. Alternatively, specialized indicators linked to transition performance could be incorporated into the evaluation system to create an incentive-constraint mechanism.
(2) Optimize capital allocation and performance evaluation to enhance “response” capabilities. First, given differences among enterprises in technological foundations, emission reduction potential, and financing needs, financial institutions should establish a “transition finance performance evaluation system.” This system should clarify short-, medium-, and long-term financing conditions and compliance requirements for each enterprise, conduct annual assessments of their transition progress, and ensure precise capital allocation. High-performing enterprises should enjoy lower financing rates, while those with inefficient capital utilization should face appropriately increased financing costs. Second, regulatory authorities should mandate environmental disclosures by power companies, particularly regarding key metrics such as transition pathways, market scale of transition bonds, carbon asset efficiency, and energy utilization efficiency. Third-party verification should ensure capital allocation yields quantifiable emission reductions. Additionally, actively promote transition finance instruments like sustainability-linked bonds, transition insurance, and carbon forward contracts to help enterprises hedge transition risks and broaden financing channels.
(3) Establish a collaborative governance system for transition finance to promote balanced industry development. It is recommended that the National Energy Administration, financial regulators, industry associations, major enterprises, and research institutions jointly formulate a “Power Industry Transition Collaboration Plan.” This plan should guide leading enterprises to drive low-level enterprises through technology transfer, joint projects, and resource sharing. For thermal power enterprises, leading companies should assume responsibility for technological demonstration and standard-setting, driving the application of cutting-edge technologies like CCUS and hydrogen energy. Small and medium-sized enterprises should focus on mid-to-short-term transition pathways, such as boiler flexibility upgrades and energy-saving retrofits, avoiding blanket shutdowns. For renewable energy enterprises, direct investment or collaborative development of user-side energy storage, smart microgrids, and V2G projects is essential. Large-scale deployment of digital technologies like AI-powered power forecasting and intelligent operation and maintenance robots should enhance generation efficiency and prediction accuracy. Wind and solar enterprises are encouraged to partner with thermal power plants to form “integrated wind-solar-thermal-storage” projects, thereby boosting system regulation capabilities.
References
- Wang Yao, Zhang Guangxiao. Transition Finance: Definition, Framework, and Future Outlook [J]. Contemporary Economic Science, 2024, 46(3):1-17. [CrossRef]
- Huang Xiao. Cultivating New Quality Productivity and Managing Stranded Asset Risks: The Dual-Effect Mechanism of Transition Finance [J]. Regional Finance Research, 2024(4):32-39.
- Wei Tianlei, Wang Huiqing. Theoretical Foundations, Practical Experiences, and Policy Recommendations for Transition Finance [J]. Enterprise Economics, 2023, 42(1):141-149. [CrossRef]
- Wang Bangyan, Lin Lü. Domestic and International Progress and Lessons in Transition Finance Risk Management [J]. Modern Finance, 2024(9):22-2734.
- Kang Jianping. Theoretical Research and Mechanism Analysis of Transition Finance Risks [J]. Western Finance, 2024(5):27-3237. [CrossRef]
- Wei Hanmei, Liao Yao. Financial Risk Transmission Mechanisms and Empirical Simulation of Transition Finance [J]. Heilongjiang Finance, 2023(8):33-40.
- Shu Hao, Wei Ping, Bie Ao. Impact of Stranded Asset Risks on Corporate Value in the Context of Transition Finance [J]. Research in Financial Economics, 2023, 38(6): 66-81.
- Li Ruijie, Wang Can. Challenges and Countermeasures for Supporting Corporate Low-Carbon Transition through Linked Transition Finance Instruments [J]. China Environmental Management, 2024, 16(1):57-62. [CrossRef]
- Xu Hongfeng, Yi Lei. Innovation, Comparative Analysis, and Development Recommendations for Domestic and International Transition Finance Products [J]. Southwest Finance, 2023(9):15-31.
- Luo Ying, Gao Guangkuo. Study on the Impact of Transition Finance on Low-Carbon Transformation in China’s High-Carbon Industries: Based on Spatial Econometric Models [J]. China Prices, 2024(1):62-66.
- Ding Pan, Li Ling, Pan Qiurong, Chang Yingwei. Environmental Regulation, Transition Finance, and Corporate Carbon Reduction Effects [J]. Southern Finance, 2023(8):41-55.
- Yang T, Zhou B. Does transition finance policies persistently fuel green innovation in brown firms? Investigating the roles of ESG rating and bank connection [J]. Pacific-Basin Finance Journal, 2025, 90102674-102674.
- Du Zhengqi, Huang Huan, Huang Qian, Yuan Xia. Research on Measuring Transition Risks in High-Carbon Industries [J]. Finance and Economics, 2024(11): 60-69. [CrossRef]
- Ma Jun, Guo Jianwei, Zhao Gangzhu. Key Performance Indicators for Transition Finance Instruments [J]. China Finance, 2023, (15): 27-29.
- Xiao Renqiao, Chen Xiaoting, Qian Li. Heterogeneous Environmental Regulation, Government Support, and Corporate Green Innovation Efficiency: A Two-Stage Value Chain Perspective [J]. Research on Finance and Trade, 2022, 33(9): 79-93. [CrossRef]
- Kong Dongmin, Wei Yongxi, Ji Mianmian. Study on the Impact of Environmental Fee-to-Tax Reform on Corporate Green Information Disclosure [J]. Securities Market Herald, 2021(8):2-14.
Figure 1.
Sub-item Evaluation Results for Transition Finance.
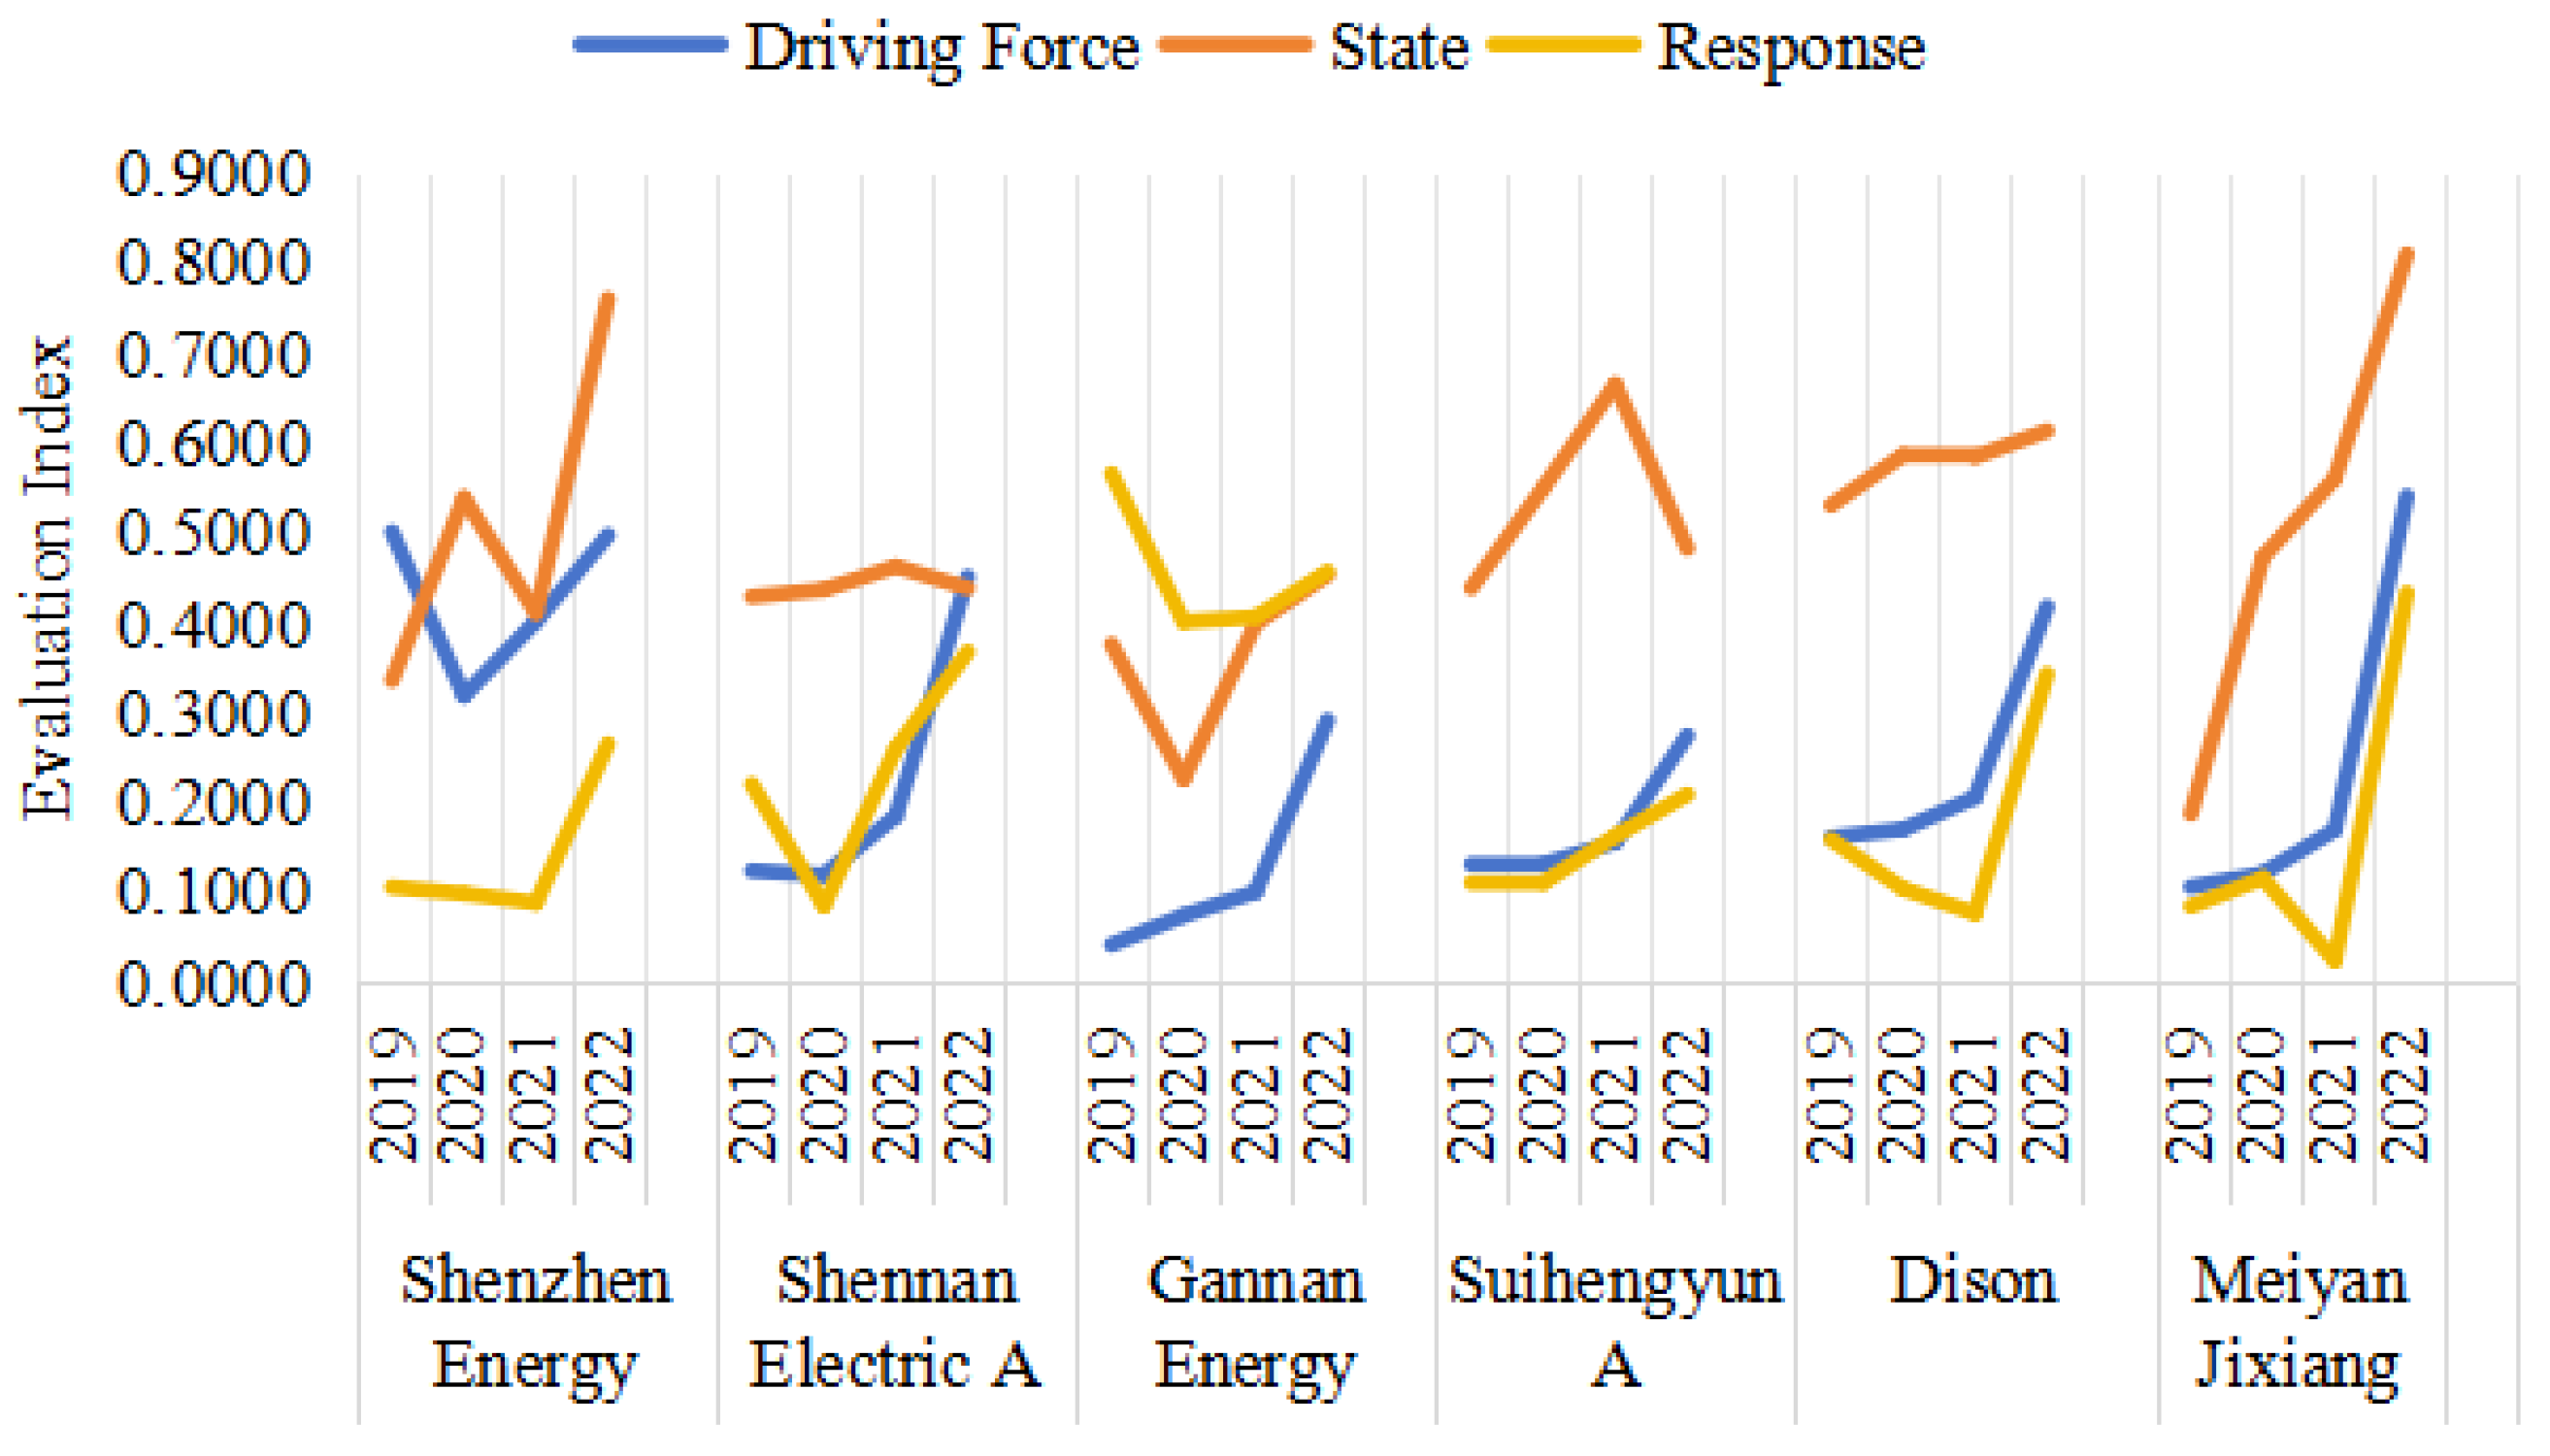

Table 1.
Evaluation Indicator System for Transition Finance in the Power Industry.
| Primary Indicators | Second-Level Indicators | Tertiary Indicators | Indicator Description |
|---|---|---|---|
| Driving Force (D) | Policy Support Intensity | Carbon Trading Market Participation (+) | Whether the province where the enterprise is registered has launched a carbon emissions trading market in the current year |
| Green Subsidy Intensity per Unit of Electricity Generated (+) | Total annual green subsidy received/Total electricity generation | ||
| Technological Innovation Capability | Carbon Performance (+) | The reciprocal of total carbon emissions per million yuan of net sales, measuring the enterprise’s ability to reduce carbon emissions | |
| Clean Technology R&D Expenditure Ratio (+) | Annual R&D expenditure/Total operating revenue | ||
| Digitalization Level | Digital Technology Application Level (+) | Frequency of the keyword “digital technology application” in the company’s annual report plus 1, then take the logarithm | |
| Status (S) | Carbon Pollution Intensity | Carbon Emission Intensity (-) | Total Carbon Emissions/Total Electricity Generation |
| Pollutant Emission Intensity (-) | Total Pollutant Emissions/Total Electricity Generation | ||
| Energy Utilization Efficiency | Power Generation Coal Consumption (-) | Standard coal consumption for power generation/Total power generation | |
| Green financing structure | Green Credit Ratio (+) | Green credit balance/Total credit balance, quantifying the extent of green financing in corporate structures | |
| Response (R) | Fund Allocation Efficiency | Proportion of Environmental Governance Expenditures (+) | Annual environmental governance expenditure/Total operating revenue |
| Green outcome conversion efficiency (+) | Efficiency of converting green patent indicators into final outputs | ||
| Quality of Information Disclosure | ESG Score (+) | Huazheng Corporate ESG Comprehensive Rating | |
| Quality of Green Information Disclosure (+) | ln(Sum of environmental project scores disclosed by 25 enterprises) | ||
| Emissions Reduction Effectiveness | Carbon Intensity Reduction Rate (+) | (1 - Current Period Carbon Intensity/Base Period Carbon Intensity) × 100%, quantifying the actual improvement in corporate carbon emission efficiency | |
| Carbon Asset Efficiency (+) | Total operating revenue/Total carbon emissions, measuring the economic value generated per unit of carbon emissions |
Note: + indicates a positive indicator; - indicates a negative indicator.
Table 2.
Indicator Weights in the Transition Finance Evaluation System for the Power Industry.
| Primary Indicator | Weight | Secondary Indicators | Weight | Tertiary Indicators | Weight |
|---|---|---|---|---|---|
| Driving Force (D) | 0.5330 | Policy Support Intensity | 0.3064 | Carbon Market Participation | 0.0994 |
| Green Subsidy Intensity per Unit of Electricity Generation | 0.2070 | ||||
| Technological Innovation Capacity | 0.2173 | Carbon Performance | 0.0988 | ||
| Clean Technology R&D Expenditure Ratio | 0.1186 | ||||
| Digitalization Level | 0.0092 | Digital Technology Application Level | 0.0092 | ||
| Status (S) | 0.0318 | Carbon Pollution Intensity | 0.0095 | Carbon Emission Intensity | 0.0023 |
| Pollutant Emission Intensity | 0.0073 | ||||
| Energy Utilization Efficiency | 0.0095 | Power Generation Coal Consumption | 0.0095 | ||
| Green Financing Structure | 0.0127 | Green Credit Ratio | 0.0127 | ||
| Response (R) | 0.4353 | Fund Allocation Efficiency | 0.3165 | Proportion of Environmental Governance Expenditures | 0.2942 |
| Green outcome conversion efficiency | 0.0223 | ||||
| Quality of Information Disclosure | 0.0190 | ESG Score | 0.0057 | ||
| Green Information Disclosure Quality | 0.0133 | ||||
| Emissions Reduction Implementation Effectiveness | 0.0998 | Carbon Intensity Reduction Rate | 0.0010 | ||
| Carbon Asset Efficiency | 0.0988 |
Table 3.
Comprehensive Evaluation Index and Ranking of Transition Finance.
| Company | 2019 | 2020 | 2021 | 2022 | ||||
|---|---|---|---|---|---|---|---|---|
| Evaluation Index | Rank | Evaluation Index | Rank | Evaluation Index | Rank | Evaluation Index | Rank | |
| Shenzhen Energy | 0.4071 | 2 | 0.2958 | 2 | 0.3367 | 2 | 0.3326 | 1 |
| Shennan Electric A | 0.2647 | 3 | 0.2113 | 5 | 0.3287 | 3 | 0.3235 | 2 |
| Gannan Energy | 0.5009 | 1 | 0.3588 | 1 | 0.3758 | 1 | 0.3187 | 3 |
| Suihengyun A | 0.2148 | 5 | 0.2117 | 4 | 0.2362 | 6 | 0.2969 | 4 |
| Disen | 0.2461 | 4 | 0.2480 | 3 | 0.2779 | 4 | 0.2903 | 5 |
| Meiyan Jixiang | 0.1988 | 6 | 0.2007 | 6 | 0.2436 | 5 | 0.2850 | 6 |
| … | … | … | … | … | ||||
| Electric Power Industry | 0.1406 | 0.1404 | 0.1489 | 0.1695 | ||||
Table 4.
Sub-item Evaluation Index and Ranking of Transition Finance.
| Primary Indicator | Company | 2019 | 2020 | 2021 | 2022 | ||||
|---|---|---|---|---|---|---|---|---|---|
| Evaluation Index | Rank | Evaluation Index | Rank | Evaluation Index | Rank | Evaluation Index | Rank | ||
| Driving Force (D) | Shenzhen Energy | 0.5008 | 1 | 0.3188 | 1 | 0.4015 | 1 | 0.4971 | 2 |
| Shennan Electric A | 0.1238 | 4 | 0.1191 | 5 | 0.1847 | 3 | 0.4508 | 3 | |
| Gannan Energy | 0.0416 | 6 | 0.0740 | 6 | 0.1003 | 6 | 0.2912 | 5 | |
| Suihengyun A | 0.1311 | 3 | 0.1314 | 3 | 0.1557 | 5 | 0.2742 | 6 | |
| Disen | 0.1611 | 2 | 0.1700 | 2 | 0.2056 | 2 | 0.4175 | 4 | |
| Meiyan Jixiang | 0.1060 | 5 | 0.1208 | 4 | 0.1696 | 4 | 0.5405 | 1 | |
| Status (S) | Shenzhen Energy | 0.3360 | 5 | 0.5386 | 3 | 0.4110 | 5 | 0.7599 | 2 |
| Shennan Electric A | 0.4290 | 3 | 0.4366 | 5 | 0.4623 | 4 | 0.4384 | 6 | |
| Gannan Energy | 0.3758 | 4 | 0.2261 | 6 | 0.3989 | 6 | 0.4531 | 5 | |
| Suihengyun A | 0.4387 | 2 | 0.5500 | 2 | 0.6649 | 1 | 0.4827 | 4 | |
| Disen | 0.5306 | 1 | 0.5864 | 1 | 0.5843 | 2 | 0.6134 | 3 | |
| Meiyan Jixiang | 0.1874 | 6 | 0.4729 | 4 | 0.5606 | 3 | 0.8099 | 1 | |
| Response (R) | Shenzhen Energy | 0.1057 | 5 | 0.0984 | 5 | 0.0882 | 4 | 0.2650 | 5 |
| Shennan Electric A | 0.2201 | 2 | 0.0851 | 6 | 0.2597 | 2 | 0.3675 | 3 | |
| Gannan Energy | 0.5656 | 1 | 0.4011 | 1 | 0.4061 | 1 | 0.4566 | 1 | |
| Suihengyun A | 0.1106 | 4 | 0.1106 | 3 | 0.1625 | 3 | 0.2087 | 6 | |
| Disen | 0.1586 | 3 | 0.1038 | 4 | 0.0764 | 5 | 0.3427 | 4 | |
| Meiyan Jixiang | 0.0844 | 6 | 0.1156 | 2 | 0.0240 | 6 | 0.4329 | 2 | |
Table 5.
Theil index of Transition Finance Development in the power industry.
| Year | Intra-group Disparity | Inter-group Disparity | Total Theil Index | Group Disparity | |
|---|---|---|---|---|---|
| Thermal Power Group | Renewable Energy Group | ||||
| 2019 | 0.2065 | 0.0076 | 0.2142 | 0.2237 | 0.1836 |
| 2020 | 0.1850 | 0.0062 | 0.1912 | 0.1459 | 0.2340 |
| 2021 | 0.1845 | 0.0135 | 0.1980 | 0.1321 | 0.2558 |
| 2022 | 0.1285 | 0.0001 | 0.1285 | 0.1172 | 0.1395 |
Disclaimer/Publisher’s Note: The statements, opinions and data contained in all publications are solely those of the individual author(s) and contributor(s) and not of MDPI and/or the editor(s). MDPI and/or the editor(s) disclaim responsibility for any injury to people or property resulting from any ideas, methods, instructions or products referred to in the content. |
© 2025 by the authors. Licensee MDPI, Basel, Switzerland. This article is an open access article distributed under the terms and conditions of the Creative Commons Attribution (CC BY) license (http://creativecommons.org/licenses/by/4.0/).
Copyright: This open access article is published under a Creative Commons CC BY 4.0 license, which permit the free download, distribution, and reuse, provided that the author and preprint are cited in any reuse.


