
Submitted:
25 October 2025
Posted:
27 October 2025
You are already at the latest version
Abstract
The development of wave energy converters (WECs) requires experimental tests at increasing scales. During the process, wave tanks eventually become inadequate due to size limitations. This study proposes a structured methodology to assess the feasibility of using seaports as testbeds for emerging WEC models, supporting innovation to accelerate sustainable energy transition. The method includes evaluating model requirements, ocean wave conditions at the port entrance, local wind-generated waves, tides, bathymetry, seabed composition, wave propagation within the port, and operational constraints, to identify viable test zones. The methodology was applied to the Port of Sines, Portugal, considering a 1:10 REEFS WEC model. Three potential sites were identified. Shelter is adequate but wave conditions matching the model’s requirements only occur approximately 100 hours per summer, due to the rarity of short-period ocean waves. Wind-generated waves contribute marginally, limited by the short fetch. Upscaling the model may allow testing under longer-period waves, which occur more frequently. A key limitation of port-based testing is the lack of environmental control. Despite statistical planning, suitable conditions during test campaigns cannot be guaranteed. This trade-off offsets the benefits of unrestricted space and no need for a wave-maker. The methodology proved effective, simplifying site assessment and saving resources.
Keywords:
WEC
; testbed
; methodology
; renewable energy
; sustainability
; small-scale model
; REEFS
1. Introduction
The world’s growing energy demand and the urgent need for decarbonization are driving the adoption of renewable energy and fueling the search for new alternatives.
Among renewable energy sources, ocean wave energy stands out as one of the most promising sustainable alternatives [1]. The key advantages of wave energy include: (i) higher power density than wind and solar [2]; (ii) high predictability [3,4]; and (iii) minimal environmental and visual impacts compared to conventional energy sources [5], combined with the added benefit of coastal protection. Specifically, wave farms can reduce shoreline erosion, as evidenced in studies by Rusu and Onea [6] and Iglesias and Carballo [7]. These features highlight the potential of wave energy to the sustainable energy transition, aiming to contribute to the United Nations Sustainable Development Goals (SDGs) [8_new], particularly affordable and clean energy (SDG 7), climate action (SDG 13), and sustainable communities (SDG 11).
1.1. WECs Development Process
In the quest to harness ocean wave energy potential, several wave energy converters (WECs) have been developed over the past decades, employing various concepts, mechanisms, and systems tailored to different wave state scenarios and deployment locations. Recent research has identified around one hundred WECs in different stages of development [9,10].
Despite various technological improvements, the development trajectory of WECs typically follows a similar path. This process begins with mathematical, numerical, and small-scale laboratory models. As understanding and knowledge of both global and specific aspects of the emerging WEC is refined, progressively improved and scaled-up models are developed, eventually leading to prototype and commercial versions. This progression is very well measured by the Technology Readiness Level (TRL) scale, a widely recognized framework used to assess the maturity of technologies over time and monitor their development toward real-world applications [11,12].
1.2. The REEFS WEC Technology
The REEFS (Renewable Electric Energy from the Sea) is a nearshore WEC that consists of a fixed submerged caisson with a prismatic shape placed at low depths directly on the seabed or alternatively supported by pillars. Its enveloping surface is covered by a variable porosity system that controls the entrance and exit of water, creating an inner flow that drives a low-head hydropower turbine installed inside. It can also be seen as an artificial reef, which contributes to shore protection once it originates storm waves breaking [13]. Currently, the REEFS technology is at a TRL of 4.
Some studies have already been published using a small-scale (1:67) laboratory model of the REEFS WEC, such as [13,14,15,16] and [17]. More recently, [18] provides a comprehensive review of the REEFS development pathway, emphasizing both resolved and persisting challenges, while framing its current research development efforts. Studies are being conducted at the University of Coimbra (UC) using two alternative (1:33) small-scale versions of the REEFS WEC. As the model size increases, bigger wave tanks and larger laboratory facilities are needed, leading to a considerable cost increase.
1.3. Using Ports as Testbeds for WECs
The most recent (1:33) small-scale versions of the REEFS WEC have dimensions still compatible with the available wave tank of the Laboratory of Hydraulics, Water Resources and Environment (LHWRE) of the UC which consists of a piston wave flume 36 m long, 1.2 m height, and 1 m large [13]. Unfortunately, the size of the model has already reached the power limit of the piston wave-maker in terms of being able to generate a complete set of operational wave state conditions. The next step for REEFS WEC development is the construction of a (1:10) small-scale model, which turns out to be a problem due to the limitations of the LHWRE wave tank. A possible way to overcome this problem is to look for natural conditions in sheltered waters such as those created inside maritime harbors and ports. In such locations, waves are small enough to directly feed the REEFS (1:10) small-scale model without endangering the integrity of the device. However, control over the wave characteristics is no longer possible, requiring a completely different approach, as we shall describe herein.
Several test sites have been established for the development of WECs. In [19] and [20] a comprehensive list of such locations is provided. Maritime ports may be utilized as test sites for oscillating-water-column (OWC) devices, overtopping devices (OTDs), and wave-activated bodies (WABs), as their design aligns well with port infrastructure and breakwater structures. In [21] a comparative analysis of many of these WEC technologies is presented in various stages of development, with the aim of identifying the most suitable option for integration into the port of Valencia in Spain.
Another notable study is presented in the “Sustainable Energy at Sea Ports” project (Se@Ports) [22], which explores the feasibility of integrating WECs into port infrastructures. The test sites of this project are located in the port of Leixões in Portugal and in the port of Las Palmas de Gran Canaria in Spain.
The use of ports can broaden the opportunities for experimental development of WECs, potentially reducing test costs in non-laboratory environments. The elimination of wave-maker costs potentially enables unlimited hours of tests for many different wave and depth conditions (the latter because of the tide influence). It is also the opportunity to test not only the hydraulic aspects but also deployment, survivability and durability, once the device will be exposed to real sea, which means random waves, salinity, sediments, biofouling, seafloor irregularity, sunlight and local wind. In this sense, they can be a valuable resource for accelerating the development of new wave energy converters (WECs), thereby contributing to the desired sustainable energy transition. However, their utilization requires careful planning and adequate procedures according to each type of WEC.
1.4. Scope of the Article
The main objective of this article is to present and discuss a methodology to analyze the potential of using maritime ports as testbeds for submerged nearshore wave energy converters. The proposed methodology will be applied to the Port of Sines in Portugal, considering the REEFS WEC model as a case study. The main aspects involved in the selection of the deployment zone and testing time window will be described and corresponding conclusions will be drawn.
2. Materials and Methods
In order to check the possibility of using ports as testbeds for WEC models, large amounts of data must be gathered and analyzed. Several aspects are involved such as ocean wave state characterization, ocean wave propagation into the port, computation of local wind effect on waves inside the port, port tide characterization, port bathymetry, port jurisdiction area, port reserved areas for navigation, mooring, docking, fisheries, port seabed morphology and geology. Such analysis is complex, requiring considerable time and resources.
2.1. Methodology
The adoption of a methodological approach based on a structured sequential step-by-step process can be useful to reduce complexity and save time and resources.
Figure 1 presents a flowchart of the methodology proposed by the authors to guide WEC model developers in the analysis of the possibility of using ports as testbeds. The details of this methodology are described in the text herein.
2.1.1. WEC Model Requirements
The first step involves defining the wave requirements for WEC testing based on the geometric scale and similitude law. This includes computing the necessary wave heights, wave periods, wave directions, and water depths required for the WEC model testing. These parameters are critical to ensure that the model testing environment accurately represents the conditions the WEC will encounter in real-world applications.
2.1.2. Ocean Waves at Port Entrance
Since the use of ports as testbeds implies a lack of control over the wave generation process, the wave conditions at the port entrance must be analyzed. This involves a seasonal statistical examination of the wave state (wave height, period, and direction) aloof the port entrance to determine when the required wave periods for WEC testing are available. The focus is on the wave period because port sheltering can reduce the wave height but not the wave period. The analysis should be conducted over months or weeks to identify the most suitable seasonal periods for testing activities.
2.1.3. Local Wind Waves Inside the Port
For WEC models that require small wave periods that may be lacking in the ocean waves at the port entrance, an analysis of local wind-generated waves is necessary. This involves a statistical evaluation of local wind patterns (direction, velocity, duration, and fetch) to estimate the distribution of small wave periods throughout the year.
If incoming ocean waves or local wind waves can provide the required wave periods, the process proceeds to the next step.
2.1.4. Characterize Port Tide
The use of ports as testbeds also implies a lack of control over the mean water level. Therefore, tide characterization is essential for calculating the continuous variation of the sea water level in the port during the test campaigns. Tide charts are readily available from the port authority.
2.1.5. Characterize Port Bathymetry and Geology
The wave propagation within the port is influenced by water depth. Bathymetric charts are used to determine the water depth relative to a fixed datum. However, since sea level varies cyclically due to tides, the characterization of the port’s water depth must also rely on the port’s tide charts.
The geological and geomorphological characteristics of the seabed are also important because WEC foundations or mooring require compatibility with the properties of the substrate.
The mapping of locations meeting given target values of depth and seabed slope can be derived from the data gathered at this stage.
2.1.6. Compute Wave Heights in the Port (Ocean and Local Wind Waves)
Wave propagation simulations within the port require both bathymetry and tide characterization. A numerical model can be used to simulate the propagation of ocean waves from the port entrance to the interior and surrounding areas. This simulation provides a wave height map for the port. For local wind-generated waves, empirical models or modern software packages can be used to estimate wave heights based on water depth, wind direction, fetch, wind velocity and duration. Wave height calculations should be performed for mean sea level, high tide, and low tide, if necessary. The resulting spatial distribution of the local wind wave heights will support the selection of suitable test sites.
2.1.7. Port Requirements Mapping
In addition to meeting the WEC wave requirements, potential test sites must also meet port requirements. These include location within port jurisdiction and avoiding reserved areas for activities such as navigation, mooring, docking, and fisheries.
2.1.8. Identification of Potential Test Sites
The identification of potential sites for testing the WEC model begins with the preliminary delineation of promising zones. These zones are determined by overlaying the areas describing zones with adequate conditions. Subsequently, these zones undergo refinement through on-site inspections and meetings with port authorities. Following this stage, a detailed assessment of the specific characteristics of each site is performed, focusing primarily on wave behavior under various conditions. The objective is to identify locations that provide adequate shelter from extreme wave conditions while remaining sufficiently exposed to ensure enough wave energy resource. In addition, factors such as accessibility, seabed characteristics, available nearby technical infrastructure and required deployment logistics are carefully analyzed.
2.1.9. Evaluate Duration of Situations Satisfying WEC Testing Requirements
Once a potential test site is identified, the total duration of testing periods with wave conditions that meet WEC requirements must be calculated. It should be underlined that the lack of control over the wave generation process, as well as over the depth (which is constantly varying due to the tide), is not necessarily inconvenient. In fact, they can broaden the WEC testing scenarios by creating other operating conditions that may be useful to better understand the response of the model under different operating conditions.
If the duration is sufficient, testing campaigns can be organized. If not, another geometrical model scale may be adopted, and the process repeated. Still, if no adequate site is found, an alternative port should be selected, and a new process initiated.
2.1.10. WEC Model Testing Campaign Organization
Once the location and testing period of the year are defined, final adaptations can be made to the device to ensure its suitability for the specific installation conditions. This stage involves refining technical-constructive aspects, optimizing equipment configuration, defining logistical procedures, and detailing test campaign planning.
2.2. Materials
To apply the proposed methodology, a large amount of data must be gathered. In general, most of the data is held by the port administration. Therefore, the first step involves establishing contact with the port administration to access their receptivity to using the port as a testbed for WEC devices. In case of novel WEC technologies, the port administration may be interested in following the development process to observe in advance the feasibility of future incorporation of such WECs in the port energy system.
Obtaining receptiveness from port administrations facilitates access to extensive port-related data. Data is vast and comprises blueprints of the present and future expansion projects of the port and associated facilities, nautical maps, bathymetry data, tide data, local wave buoy data, local wind data and maps with the constraints associated with the port utilization.
In addition to port administration, several national and international geophysical, meteorological, geological, hydrological, and maritime institutions regularly publish data that can be used to complement port characterization.
In this article, the proposed methodology was applied to the Port of Sines to analyze the possibility of using it as a testbed for the REEFS WEC model. The different kinds of data sources involved will be exemplified in the case study presented in the next section.
3. Results and Discussion
The proposed methodology was applied to the Port of Sines to check its potential as a testbed for a (1:10) small-scale model of the REEFS WEC.
3.1. The Port of Sines
The Port of Sines is located in the city of Sines, in the southwestern region of Portugal and Europe, about 58 nautical miles south of Lisbon, at the convergence of major international maritime routes, both east-west and north-south. As a deep-water port, it leads the country in cargo throughput and serves as the main energy supply hub of Portugal, handling oil, petroleum products, and natural gas. Its strategic location, free of urban constraints, allows long-term expansion opportunities, supported by a well-developed logistics infrastructure [23].
The port infrastructure is composed of multiple ports and terminals. In addition, it is supported by an industrial and logistics zone in its hinterland, spanning over 2000 hectares. Aloof port entrance there is a wave buoy operated by the Hydrographic named “Sines” buoy. At the south-eastern border of the Port of Sines’ jurisdiction area, there is a decommissioned thermal power plant, followed by the São Torpes beach.
Figure 2 summarizes the information presented in this paragraph.
Initial consultations with the Ports of Sines and the Algarve Authority, SA (APS) confirmed their receptiveness to study the possibility of using the port as a testbed for WEC models. In this study the novel REEFS WEC, first mentioned in [13], was considered.
In the next section, we will present the REEFS WEC model requirements which constitute the starting point of the proposed methodology.
3.2. WEC Model Requirements
The REEFS WEC was initially designed considering the typical wave characteristics of the western Portuguese coast near Figueira da Foz. A design wave period of approximately 8 s was assumed, with an operating range from 6 to 12 s and an extreme period of 17 s, propagating over a water depth of 15 – 20 m, with wave heights in a range between 0.75 m to 5.25 m - [14,15,16]. These values were already considered in previous studies therefore, they will be used as a reference in the present one. They can be converted using the geometric scale of (= 1: 10) and a Froude similarity time scale of (), resulting in a period of approximately 2.5 s, with an operating range between 1.9 to 3.8 s and an extreme period of 5.4 s, water depth from 1.5 to 2 m, and wave heights between 7.5 to 52.5 cm (roughly, we will consider periods from 2 to 4 s and wave heights from 7 to 53 cm).
In the western Portuguese coast, the tide is typically semi-diurnal with an average amplitude of approximately 2 m. This means that for the small-scale model (= 1: 10) a tide with a period of 3.8 hours and an average amplitude of 0.2 m would be needed. In a controlled laboratory setup, it is possible to implement such a small tide. Therefore, if a water depth of 1.5 m is considered at low tide, the corresponding water depth at high tide would be 1.7 m. However, in a real maritime environment, such as the Port of Sines, it is not possible to change the natural tide. Therefore, if a water depth of 1.5 m is considered at low tide, the corresponding water depth at high tide will be 3.5 m. This important aspect must be considered ad initio when designing small-scale model testbed campaigns. A possible strategy will be to discard the experimental data collected for water depths greater than 1.7 m. Another approach is to assume that a much wider range of possible deployment water depths is being investigated. A third possible option is to attach the device to a tide-level adjusting system.
Figure 3 presents a perspective drawing of the metallic (1:10) small-scale model of the REEFS WEC.
3.3. Ocean Waves at Port Entrance
Two wave buoys operated by the Hydrographic Institute are deployed near Sines: the “Oceanic Sines” buoy and the “Sines” buoy. The Oceanic Sines’ buoy is too far from the Port of Sines (approximately 81 km). Therefore, in this study only Sines’ buoy data (Figure 2 (b) (c) (d)) was considered [24].
The buoy is moored at coordinates 37°55.3′N 8°55.7′W, approximately 6.5 km aloof Port of Sines at a water depth of approximately 97 m.
The initial analysis characterized wave period distributions (Figure 4) through monthly statistics (minimum, average, and maximum) of significant wave period (), revealing shorter during the summer months (June-August). However, some extreme minimum values of occur outside the summer season as for April (2.6 s) and November (2.9 s).
A key aspect is quantifying the monthly duration of wave states with periods within the WEC requirements (2 - 4 s). Figure 5 presents the monthly distribution derived from wave buoy data. The analysis reveals that the summer months (June-August) contain approximately 70% of annual occurrences.
Once adequate wave period conditions are identified, the next parameter to be investigated is the corresponding significant wave height (). Figure 6 presents the average, maximum and minimum wave heights associated with the situations described in Figure 5.
Directional analysis is also important because the REEFS model achieves optimal efficiency when waves propagate along its longitudinal axis. Figure 7 presents the wave direction distribution (average, maximum and minimum) associated with the situations presented in Figure 6. The extreme directions were computed discarding rare occurrences with relative frequencies lower than or equal to 2%.
3.4. Local Wind Waves Inside the Port
Inside the Port of Sines wind action over the surface of the sheltered waters may produce short period waves with low height. These small waves may be very interesting to feed small-scale tests. Therefore, it is necessary to characterize the direction, duration and speed of the wind inside the port. Next, local wind waves can be estimated by recurring to empirical models based on the fetch length of the water bodies inside the port.
Information for wind characterization was taken from the APS meteorological database, consisting of 10-minute interval measurements from 01/01/2017 at 12:00 A.M to 23/09/2022 at 12:40 P.M on 23 September 2022 (missing data was only 2.6%). Data was analyzed quarterly according to the annual seasons.
In Figure 8, wind characterization in Port of Sines is presented during spring, summer, autumn, and winter through wind roses.
When the wind blows at a constant speed (), for a sufficiently long time, along a fetch length (), the and the can be estimated using empirical models such as Basil Wrigley Wilson formulas [25], where is the acceleration of gravity:
- Significant Wave Height ()
- Significant Wave Period ()
These formulas show that only the upper wind speed class of 30 – 45 km/h can generate relevant waves, because the water bodies located inside the Port of Sines have a short fetch length (2 – 5 km).
During spring and summer, the highest speed class of 30 – 45 km/h presents a dominant NWN wind direction. If testbed zones are considered next to shore, average fetches of 1.9 km to 2.2 km can be estimated (e.g., zones A and B depicted in Figure 9). The corresponding local wind waves in zones A and B of Figure 9 are:
- -
- (A) , for and , for ;
- -
- (B) , for and , for .
If testbed zones are considered far from shore, the fetch can reach up to 5 km. In that case, local wind waves vary from and for up to and for .
During autumn and winter, the wind becomes less frequent and the wind direction associated with the most important speed class of 30 – 45 km/h rotates to N. For this direction, the testbed zones will have a short fetch length leading to irrelevant local wind waves.
Figure 9 illustrates the fetch length for the NWN wind direction and the testbed zones A and B locations.
3.5. Verify if Wave Periods Are Low Enough to Satisfy WEC Requirements
The analysis of the ocean waves at the entrance of the Port of Sines revealed that summer concentrates most of the occurrences of significant wave periods of .
The analysis of local winds showed that during summer the upper wind speed class of 30 – 45 km/h can produce significant wave periods of 1.6 – 2.6 s inside the Port of Sines.
Bearing in mind both contributions (ocean waves and local wind waves), it is possible to consider that wave periods are low enough to meet WEC requirements. Therefore, the process may proceed to the next steps presented herein.
3.6. Characterize Port Tide
The annual tide table forecast is provided by the APS website [27] at the beginning of each year. The tide level is relative to the ZH datum (the “Zero Hidrográfico” (ZH), which means hydrographic zero is the hydrographic chart datum of Portugal). The ZH is located below the water level of the Lowest Astronomical Tide (LAT) [28].
A monthly analysis of tide levels was performed, determining the average amplitude and extreme levels for each month (Table 1). All months exhibited similar patterns, with an average tidal amplitude of approximately 2.08m.
3.7.1. Bathymetry
The REEFS WEC is a fully submerged device that operates under the seabed. Therefore, a previous bathymetry analysis is of prior importance to identify adequate deployment conditions. The APS collaborated in this task providing the Digital Elevation file in TIFF format dated from 2020, with the Projected Coordinate System ETRS 1989 Portugal TM06 and a resolution of 80m x 80 m covering a 226.58 km2 area, englobing the Port of Sines and surrounding areas. Figure 10 presents the corresponding tridimensional view of the bathymetry produced with the mentioned Digital Elevation Model (DEM).
Another way to analyze bathymetry is to compute the contour lines of the DEM and then highlight eligible depths and slopes. In previous studies the deployment depth of the REEFS prototype was considered between 15 – 20 m, as mentioned in Section 3.2. This means that for a (1:10) small-scale model the deployment depths will be 1.5 – 2 m. These deployment depths must be ensured for the extreme low tide of +0.2 m (datum: ZH). In bathymetric charts (datum: MSL – mean sea level) these deployment depths correspond to - 3.3 m (vide Figure 11) up to - 3.8 m.
Figure 12 presents eligible deployment zones with bathymetric depths ranging from -3 to -4 m (approximately the REEFS deployment depth range).
The seabed slope is also important, although flat seafloor is not mandatory because the adjustable legs of the model can adapt to the irregularity of the seabed up to 6%. Figure 13 presents the slope characterization in the Port of Sines. We can perceive that steeper zones concentrate next to the jetties and docks, while flatter zones dominate in vast areas of the port bay as well as in stretches of the coast line with low man-made interventions.
3.7.2. Geology and Geomorphology
Geology and geomorphology data can be collected from previous studies on the evaluation of biophysical and socioeconomic impacts of the Port of Sines expansion [29], from which a seabed composition analysis was derived. The geology of the port is marked by deep water conditions, extensive rocky outcrops, and a history of dredging. Sedimentary patterns vary spatially: the XXI Terminal exhibits thin, discontinuous sandy pockets overlying an irregular rocky substrate, while the General Cargo Terminal features fine silts. Near São Torpes beach, sediments transition from fine to coarse sand on the deeper marine platform. The adjacent continental shelf predominantly comprises sand (73%), with gravel (6%) and silt-clay mixtures (21%). Rocky outcrops dominate the coastal zone of São Torpes, promoting differential erosion and irregular bathymetry (≤ 10m depth) near the shoreline.
Figure 14 presents a map with the rocky outcrops and sedimentary layers in the Port of Sines.
3.8. Compute Wave Height in the Port (Ocean Waves and Local Wind Waves)
3.8.1. Local Wind Waves
Local wind waves have already been estimated in Section 3.4. Summer was identified as the most suitable season to concentrate small period waves from generated by the upper wind class of 30 – 45 km/h. Depending on whether the location of the testbed is near the shore or far away in the port bay, the wave heights may vary from to, respectively. The relative frequency of this wind class (vide Figure 9) corresponds to approximately 60 hours each summer.
3.8.2. Ocean Waves
Ocean waves have been characterized at the entrance of the Port of Sines. However, to study testbed possible locations inside the port it is necessary to propagate the ocean waves into the interior of the port. Following the wave characterization from Sines’ buoy, the propagation of the waves toward the interior of the port was modeled using the coastal hydrodynamic modeling software AQUAVEO [30]. The simulations were conducted by the INEGI team – Institute of Science and Innovation in Mechanical and Industrial Engineering – based on scenarios provided by the DEC-FCTUC team – Department of Civil Engineering of the Faculty of Science and Technology of the University of Coimbra.
The wave propagation model integrates local bathymetry and user-defined wave parameters. To optimize computational effort, a limited number of scenarios were established considering two different objectives: energy harnessing operating conditions and extreme waves conditions.
Energy harnessing operating conditions
The data from the Sines’ buoy (May – October) was filtered to extract significant wave periods between 2 – 4 s (targeting wave energy harnessing operating conditions). Data was categorized into seven directional classes (from 202º – 359°) to cover the recorded wave states. The average and per class were calculated and associated with the corresponding central class direction (e.g., 349° for 338° – 359°). As presented in Figure 5, the total duration of such situations is approximately 100 hours each summer. Figure 15 presents the corresponding distribution of wave directions.
Extreme waves conditions
During simulations of energy harnessing operating conditions (May – October), the WEC model will be exposed to real waves that cannot be controlled. These waves may endanger the physical integrity of the device. Therefore, it is also important to inspect the Sines’ buoy data to select maximum wave heights () and associated periods () for each directional class.
Table 2 summarizes the sea state scenarios, where numbers 1 to 7 present the extreme waves conditions and from 8 to 14 the energy harnessing conditions.
Wave propagation maps in Port of Sines were generated for all scenarios of Table 2. However, for clarity and brevity, only four were selected as illustrative cases. These comprise the scenarios 3 and 10 representing the most frequent wave direction of the fourth quadrant (e.g.,: 303° for 292° – 314°) presented in Figure 16A and Figure 17A and the scenarios 5 and 12 of the most relevant wave direction of the third quadrant (e.g., 257° for 247° – 269°) presented in Figure 16B and Figure 17B.
3.9. Port Requirements Mapping
Eligible areas for WEC model testing must fulfill port requirements such as jurisdictional boundaries, reserved zones for navigation, mooring, docking, fisheries and compatibility with existing or planned infrastructures. To support this study, the APS provided three planning documents: Functional Plan of the Port; Future Expansion Plan and Plan of Exploration, Environmental and Safety Regulations.
Navigation constraints
Navigation channels, maneuver bays, approach routes, and access corridors for merchant and fishing vessels were delineated using the Plan of Exploration, Environmental and Safety Regulations to ensure that the deployment of the WEC avoids conflicts with maritime traffic.
Fishing constraints
The Functional Plan of the Port identifies a fishing port and aquaculture zone within the port jurisdiction area. Although recreational and fishing vessel access routes were not explicitly mapped, they were inferred and incorporated into the global constraints map (Figure 18). Industrial fishing is assigned to aquaculture farms that were considered ineligible for the deployment of the WEC model.
Port infrastructure
Inconvenient resulting from proximity to existing infrastructure (e.g., terminals, docks) was evaluated using the Functional Plan of the Port and the Plan of Exploration, Environmental and Safety Regulations. The Future Expansion Plan further clarified possible expansions of the infrastructure, ensuring that the deployment of the WEC model avoids conflicts with future developments.
All maps were standardized to a common coordinate system and scale. The restricted zones of each document were digitized, overlaid, and aggregated to generate a global constraints map, as shown in Figure 18.
3.9.1. Identification of Potential Test Sites
The identification of potential test sites was initiated by spatial overlaying data and constraints. Concerning geology, no limitations were found because the REEFS model can accommodate both types of seabed constitution: rocky or sandy. However, the target depth (vide Figure 13), combined with the constraint of a maximum admissible seabed slope of 6% limited the potential test sites to elongated zones close to shore and infrastructures. In these elongated zones, the port requirements were overlaid to identify admissible zones.
The Future Expansion Plan was also used to evaluate the present and future availability of possible test sites. After some complementary analysis, based on aerial photographs and field visits, three deployment spots were finally established as shown in Figure 19: Zone 1 – Deactivated pontoon in the southern extremity of the west jetty; Zone 2 - Vicinity of the Multipurpose Terminal; Zone 3 - Near the northern jetty of the decommissioned thermoelectric power plant adjacent to São Torpes beach.
Zone 1 is adjacent to the west jetty at the port entrance and exhibits a steep bathymetric gradient. However, it was chosen because detailed analysis revealed that a deactivated pontoon was available to attach the REEFS model.
Regarding the port expansion plan, Zone 3 is fully available until the end of 2025. Zone 2 is fully available until June 2026. For Zone 1, the start date for the west jetty extension is still unknown. Figure 20 exhibits photographs of zones 1,2 and 3, schematically delimitated in Figure 19. A systematic evaluation of wave characteristics was conducted in Zones 1,2 and 3.
Local wind waves
Regarding local wind waves inside the port, Zones 1 and 3 have an insignificant fetch length for the dominant wind direction of NWN. Therefore, no significant wind waves are expected to occur in these areas. Zone 2 is close to the Zone A depicted in Figure 9, where there will be some local wind waves with and , as calculated in Section 3.4.
Ocean waves
The wave characteristics in Zones 1, 2 and 3 were obtained by inspecting the wave propagation maps for the 14 scenarios presented in Table 2. A comparative assessment is presented in Table 3.
Among the sites evaluated, Zone 1 (Deactivated West Jetty Pontoon) demonstrated the best potential for wave energy harnessing simulation, exhibiting good values of HS is several directions, ranging from . On the other hand, it is the most exposed zone to extreme waves that can reach .
In contrast, Zone 3 (Decommissioned Thermoelectric Power Plant) exhibits null values of in all forth quadrant wave directions. Only the third quadrant wave directions present interesting values that range from . However, it is the least exposed to extreme waves that do not exceed .
Zone 2 (Vicinity of Multipurpose Terminal) exhibited low values of in forth quadrant directions and moderate ones in the third quadrant direction. Globally, ranges from . Exposure to extreme wave conditions is a bit inferior to Zone 1, not exceeding .
Zone 1 emerges as the most favorable location for wave energy harnessing simulations. However, Zones 2 and 3 have lower depths, making them more adequate to simulate the short wavelength required by the model. Zone 2 is next to the Multipurpose Terminal which is very favorable from a logistic point of view, facilitating deployment, observation, and access for maintenance or repair. The depth is adequate, but the natural seabed slope was altered by port construction works. Despite presenting the lowest potential in terms of energy harnessing operating conditions, Zone 3 stands out as the most realistic location because the seabed presents a mild slope that mimics the real seabed slope of coastal zones where the REEFS WEC is intended to be installed. However, it is the most unfavorable location from a logistic point of view because there is no infrastructural support available.
3.9.2. Evaluate Duration of Satisfying WEC Testing Requirements
The analysis presented in Section 3.4 and Section 3.8 showed that local wind waves can meet significant wave height requirements but with wave periods slightly inferior to the minimum REEFS model requirements. They correspond to approximately 60 hours each summer.
Regarding small ocean waves, previous analysis showed that they can meet REEFS model significant wave height and period requirements during approximately 100 hours each summer, except for Zone 3 where significant wave height is too small in case of fourth quadrant wave directions.
Despite being small, the duration of situations satisfying WEC testing requirements can be considered acceptable bearing in mind the concept proof purpose of the tests.
3.9.3. WEC Model Testing Campaign Organization
Summer was identified as the most suitable season to conduct the tests of the small-scale REEFS model. In terms of location, three potential zones were identified. Before proceeding with the installation of the REEFS model, site visits are required in each of these three zones to gather additional information. Measurements of local sea state conditions and observations of seabed constitution and configuration, using submarine video cameras, should be made to complement the previous estimates. Local depth surveys must also be conducted to validate the bathymetric analysis based on digital models of the seabed. Depending on site-specific characteristics, adaptations can be made to improve device installation. This stage involves refining technical-constructive aspects and equipment configuration, establishing logistical procedures, and detailing planning scheduling.
4. Conclusion
A methodology was presented and discussed to analyze the potential of using ports as testbeds for wave energy.
The proposed methodology was applied to the Port of Sines considering the case of the (1:10) small-scale model of the REEFS WEC. The implementation of the methodology proved to be feasible. The results indicated that the Port of Sines can be used as a testbed for this technology. However, the total number of hours with adequate energy harnessing operating conditions is low because the short waves required by the (1:10) small-scale model are not abundant. This limitation can be overcome by increasing the geometrical scale of the model to allow operation with larger wave periods that are much more frequent.
The application of the methodology revealed that a key limitation of using ports as a testbed is the lack of control over the environmental conditions to which the model will be exposed. Despite the extensive statistical analysis of environmental parameters, such as sea state and wind, these remain probabilistic forecasts, therefore, it is not possible to ensure that during the test campaign they will occur. Furthermore, depending on local conditions, it may not be possible to replicate all the desired environmental scenarios, especially when very small-scale models are involved.
Regarding estimated local wind waves, despite the considerable dimensions of the Port of Sines, they are still very short, although with significant wave heights within the required range. They can be a complement to the lower bound of required periods, but they are insufficient to generate the (1:10) small-scale model energy harnessing operating periods.
The proposed methodology is based on a sequential structured step-by-step process that can be useful to reduce complexity and save time and resources.
5. Patents
The REEFS—Renewable Electric Energy From Sea—was the subject of a patent application that was subsequently granted in 2019 (Invention patent EP3078844—Artificial coastal protection reef with energy generation unit with or without direct contact with seawater).
Author Contributions
Conceptualization, J.P.P.G.L.d.A., V.G.M. and A.M.d.C.S.; methodology, J.P.P.G.L.d.A., V.G.M. and A.M.d.C.S.; software, J.S.; validation J.P.P.G.L.d.A., A.M.d.C.S. and J.P.A.; formal analysis, J.P.P.G.L.d.A., A.M.d.C.S. and V.G.M.; investigation, J.P.P.G.L.d.A., V.G.M., A.M.d.C.S. and J.S.; resources, J.P.A.; writing—original draft preparation, J.P.P.G.L.d.A., and V.G.M.; writing—review and editing, J.P.P.G.L.d.A., V.G.M., A.M.d.C.S., J.S., and J.P.A.; visualization, V.G.M. and J.S.; supervision, J.P.P.G.L.d.A. and A.M.d.C.S.; project administration, J.P.A.; funding acquisition, J.P.P.G.L.d.A. All authors have read and agreed to the published version of the manuscript.
Funding
Content produced within the scope of the Agenda “NEXUS—Pacto de Inovação—Transição Verde e Digital para Transportes, Logística e Mobilidade”, financed by the Portuguese Recovery and Resilience Plan (PRR), with no. C645112083-00000059 (investment project no. º 53).
Data Availability Statement
The original contributions presented in this study are included in the article. Further inquiries can be directed to the corresponding author.
Conflicts of Interest
The authors declare no conflicts of interest.
References
- Bouhrim, H.; El Marjani, A.; Nechad, R.; Hajjout, I. Ocean Wave Energy Conversion: A Review. J. Mar. Sci. Eng. 2024, 12, 1922. [Google Scholar] [CrossRef]
- Barua, A.; Rasel, M.S. Advances and challenges in ocean wave energy harvesting. Sustain. Energy Technol. Assess. 2024, 61, 103599. [Google Scholar] [CrossRef]
- López, I.; Andreu, J.; Ceballos, S.; Martínez de Alegría, I.; Kortabarria, I. Review of wave energy technologies and the necessary power-equipment. Renew. Sustain. Energy Rev. 2013, 27, 413–434. [Google Scholar] [CrossRef]
- Sheng, W. Wave energy conversion and hydrodynamics modelling technologies: A review. Renew. Sustain. Energy Rev. 2019, 109, 482–498. [Google Scholar] [CrossRef]
- Clément, A.; McCullen, P.; Falcão, A.; Fiorentino, A.; Gardner, F.; Hammarlund, K.; Lemonis, G.; Lewis, T.; Nielsen, K.; Petroncini, S.; Pontes, M.-T.; Schild, P.; Sjöström, B.-O.; Sørensen, H.C.; Thorpe, T. Wave energy in Europe: current status and perspectives. Renew. Sustain. Energy Rev. 2002, 6, 405–431. [Google Scholar] [CrossRef]
- Rusu, L.; Onea, F. Assessment of the performances of various wave energy converters along the European continental coasts. Energy 2015, 82, 889–904. [Google Scholar] [CrossRef]
- Iglesias, G.; Carballo, R. Wave farm impact: The role of farm-to-coast distance. Renew. Energy 2014, 69, 375–385. [Google Scholar] [CrossRef]
- United Nations. “Sustainable Development Goals.”. Available online: https://sdgs.un.org/goals (accessed on 14 October 2025).
- Rusu, E.; Onea, F. A review of the technologies for wave energy extraction. Clean Energy 2018, 2, 10–19. [Google Scholar] [CrossRef]
- Ahamed, R.; McKee, K.; Howard, I. Advancements of wave energy converters based on power take off (PTO) systems: A review. Ocean Eng. 2020, 204, 107248. [Google Scholar] [CrossRef]
- Nilchiani, R.; Caddell, J.; Taramsari, H.B. Beyond Technology Readiness Level 9: Measuring Aging and Contextual Relevance in System of Systems. In Proceedings of the 2024 19th Annual System of Systems Engineering Conference (SoSE), Denver, CO, USA, 24–27 June 2024; pp. 184–189. [Google Scholar] [CrossRef]
- Mankins, J.C. Technology readiness assessments: A retrospective. Acta Astronaut. 2009, 65, 1216–1223. [Google Scholar] [CrossRef]
- Lopes de Almeida, J.P.P.G. REEFS: An artificial reef for wave energy harnessing and shore protection—A new concept towards multipurpose sustainable solutions. Renew. Energy 2017, 114, 817–829. [Google Scholar] [CrossRef]
- Lopes de Almeida, J.P.P.G.; Mujtaba, B.; Oliveira Fernandes, A.M. Preliminary laboratorial determination of the REEFS novel wave energy converter power output. Renew. Energy 2018, 122, 654–664. [Google Scholar] [CrossRef]
- Lopes de Almeida, J.P.P.G.; Santos Martinho, M.F.E. Experimental evaluation of the shore protection potential of the novel REEFS wave energy converter. Ocean Eng. 2020, 217, 107918. [Google Scholar] [CrossRef]
- Lopes de Almeida, J.P.P.G.; Abrantes, J.R.C.B.; Bento, J.G.S.E.S. A simplified model for expedient computational assessment of the novel REEFS wave energy converter power output. Renew. Energy 2020, 157, 43–54. [Google Scholar] [CrossRef]
- Oliveira, D.; Lopes de Almeida, J.P.P.G.; Santiago, A.; Rigueiro, C. Development of a CFD-based numerical wave tank of a novel multipurpose wave energy converter. Renew. Energy 2022, 199, 226–245. [Google Scholar] [CrossRef]
- Lopes de Almeida, J.P.P.G.; Machado, V.G. Addressing Development Challenges of the Emerging REEFS Wave Energy Converter. Inventions 2025, 10, 85. [Google Scholar] [CrossRef]
- Aderinto, T.; Li, H. Review on power performance and efficiency of wave energy converters. Energies 2019, 12, 4329. [Google Scholar] [CrossRef]
- Test Site — Project-Scale | Tethys. Available online: https://tethys.pnnl.gov/project-scale/test-site (accessed on 14 October 2025).
- Cascajo, R.; García, E.; Quiles, E.; Correcher, A.; Morant, F. Integration of marine wave energy converters into seaports: A case study in the Port of Valencia. Energies 2019, 12, 787. [Google Scholar] [CrossRef]
- SE@Ports: Wave Energy Converters in Port Infrastructure. IMDC. Available online: https://imdc.be/en/reference/se-ports-wave-energy-converters-in-portinfrastructure (accessed on 14 October 2025).
- Porto de Sines – Características Gerais. APSines Algarve. Available online: https://www.apsinesalgarve.pt/porto-de-sines/o-porto/caracter%C3%ADsticas-gerais/ (accessed on 14 October 2025).
- Boias (- Portugal Hydrographic Institute). Available online: https://www.hidrografico.pt/boias (accessed on 14 October 2025).
- Townson, J.M.; Wilson, B.W.; Stevenson; JONSWAP. The Stevenson formula for predicting wave height. Technical note. Discussion. Proc. Inst. Civ. Eng. 1982, 73, 485–487. [Google Scholar] [CrossRef]
- Google Earth. (n.d.). Coordinates 37.94055539, 8.85947186 — Earth view. Available online: https://earth.google.com/web/@37.94055539,8.85947186,2.18382387a,12505.3465359d,35y,0h,0t,0r/data=OgMKATA (accessed on 14 October 2025).
- Tabela de Marés Sines 2025. APSines Algarve. Available online: https://www.apsinesalgarve.pt/media/4840/tabela-de-mar%C3%A9ssines_2025.pdf (accessed on 14 October 2025).
- Instituto Hidrográfico. (n.d.). Informação nº 47. Available online: https://www.hidrografico.pt/info/47 (accessed on 14 October 2025).
- Relatório de Síntese do Estudo de Impacte Ambiental — AIA2773. Available online: https://siaia.apambiente.pt/AIADOC/AIA2773/rs_27732014111311158.pdf (accessed on 14 October 2025).
- Aquaveo. Available online: https://aquaveo.com/ (accessed on 14 October 2025).
Figure 1.
Methodology flowchart for analyzing the possibility of using ports as testbeds for WEC models.
Figure 1.
Methodology flowchart for analyzing the possibility of using ports as testbeds for WEC models.
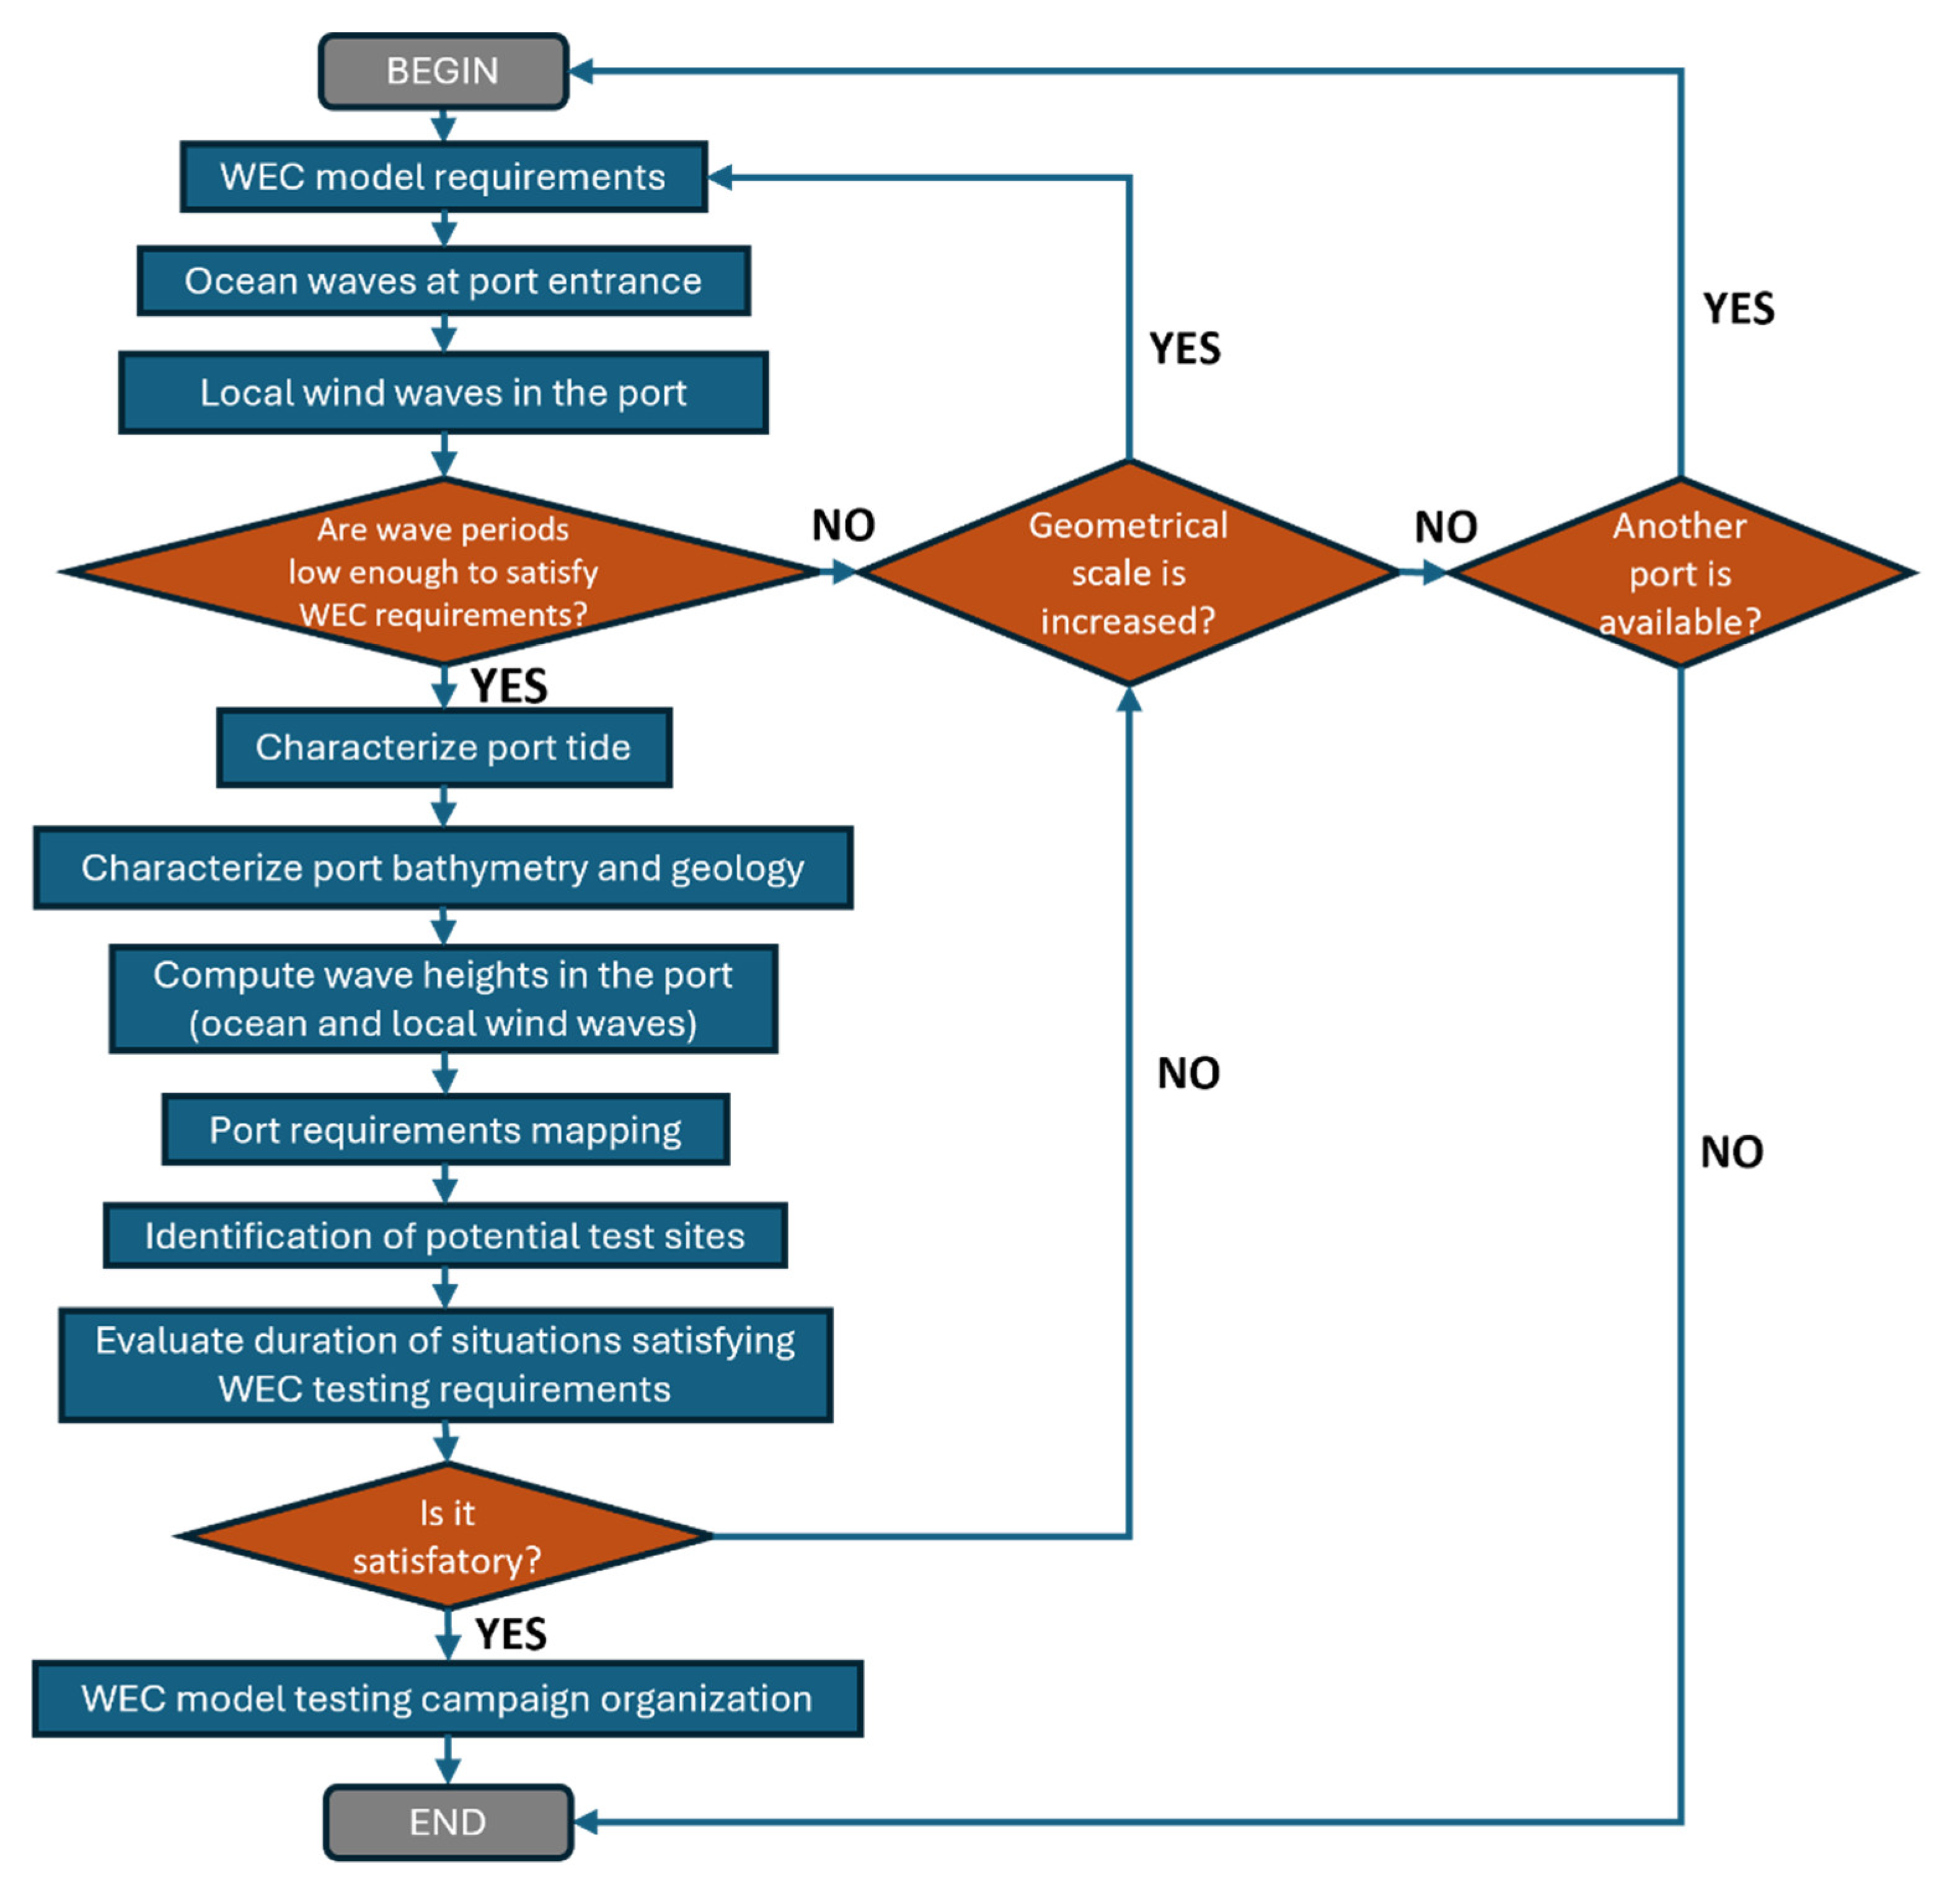
Figure 2.
(a) Port of Sines constitution; (b) Port of Sines location in Portugal; (c) Port and Sines buoy location in Setúbal district; (d) Port and Sines buoy location in Sines municipality - Lisboa Hayford Gauss IgeoE coordinate system, Tranverse Mercator projection.
Figure 2.
(a) Port of Sines constitution; (b) Port of Sines location in Portugal; (c) Port and Sines buoy location in Setúbal district; (d) Port and Sines buoy location in Sines municipality - Lisboa Hayford Gauss IgeoE coordinate system, Tranverse Mercator projection.
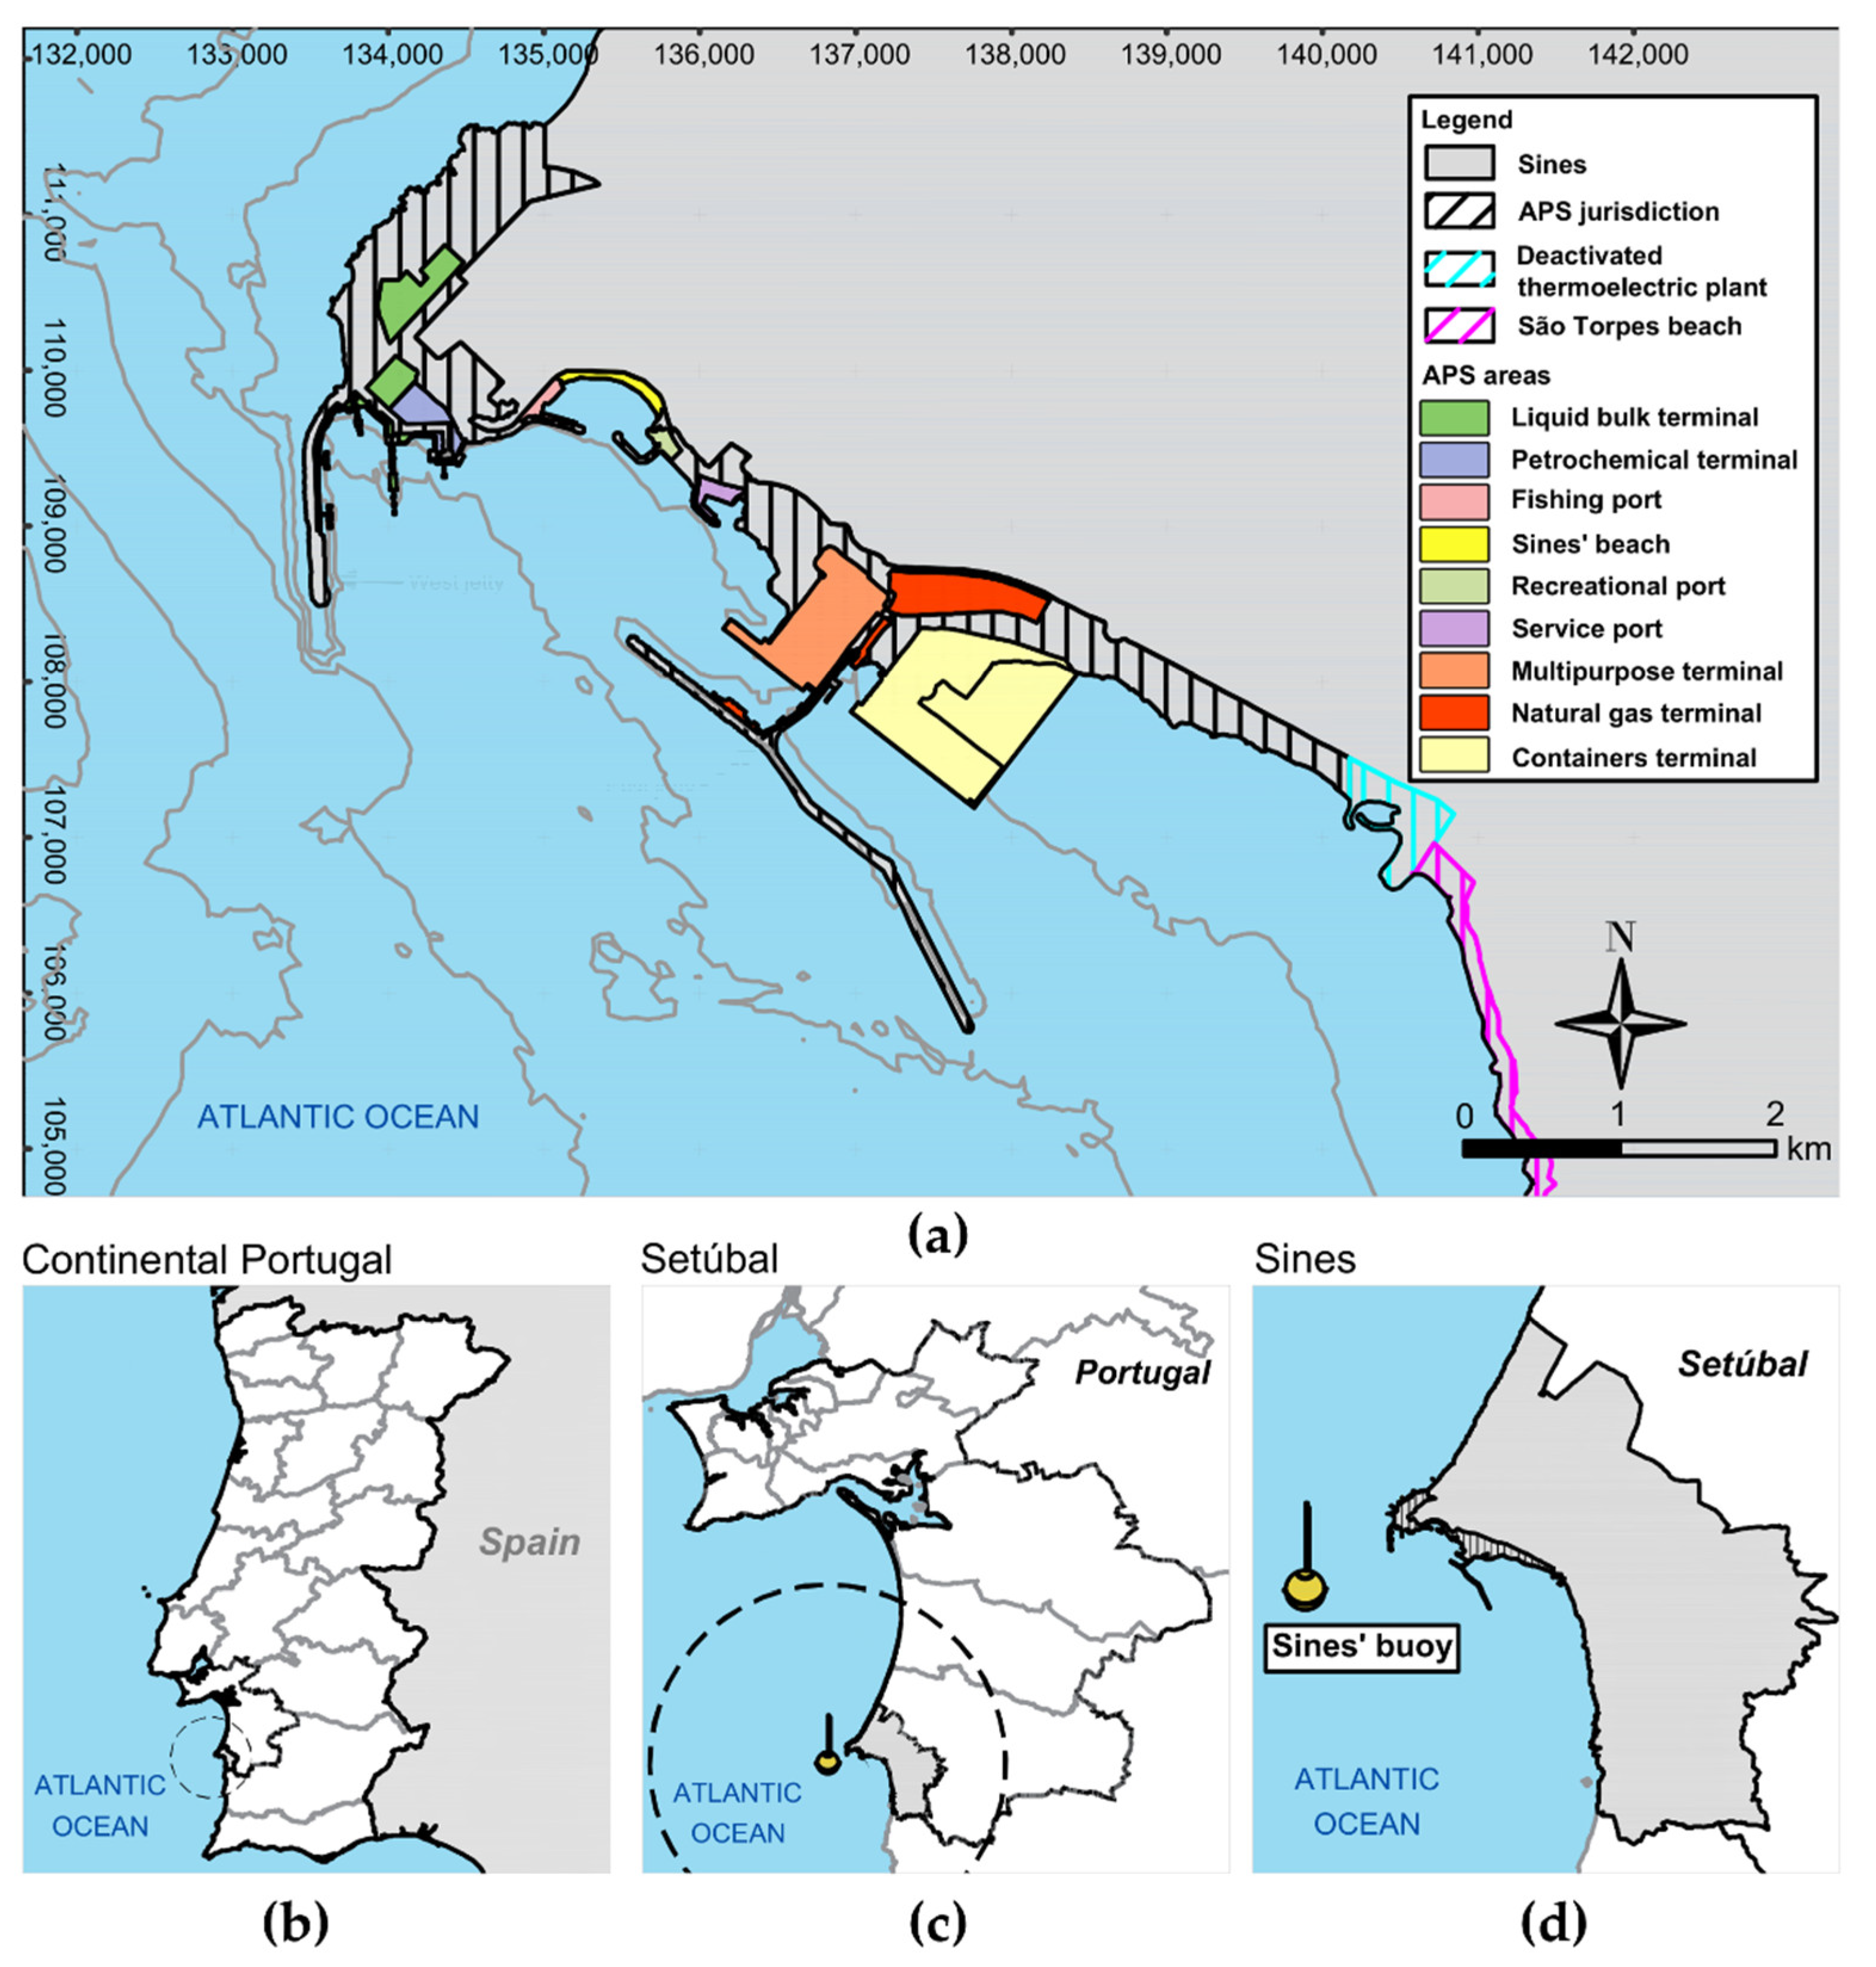
Figure 3.
Perspective view of the metallic (1:10) small-scale model of the REEFS WEC.
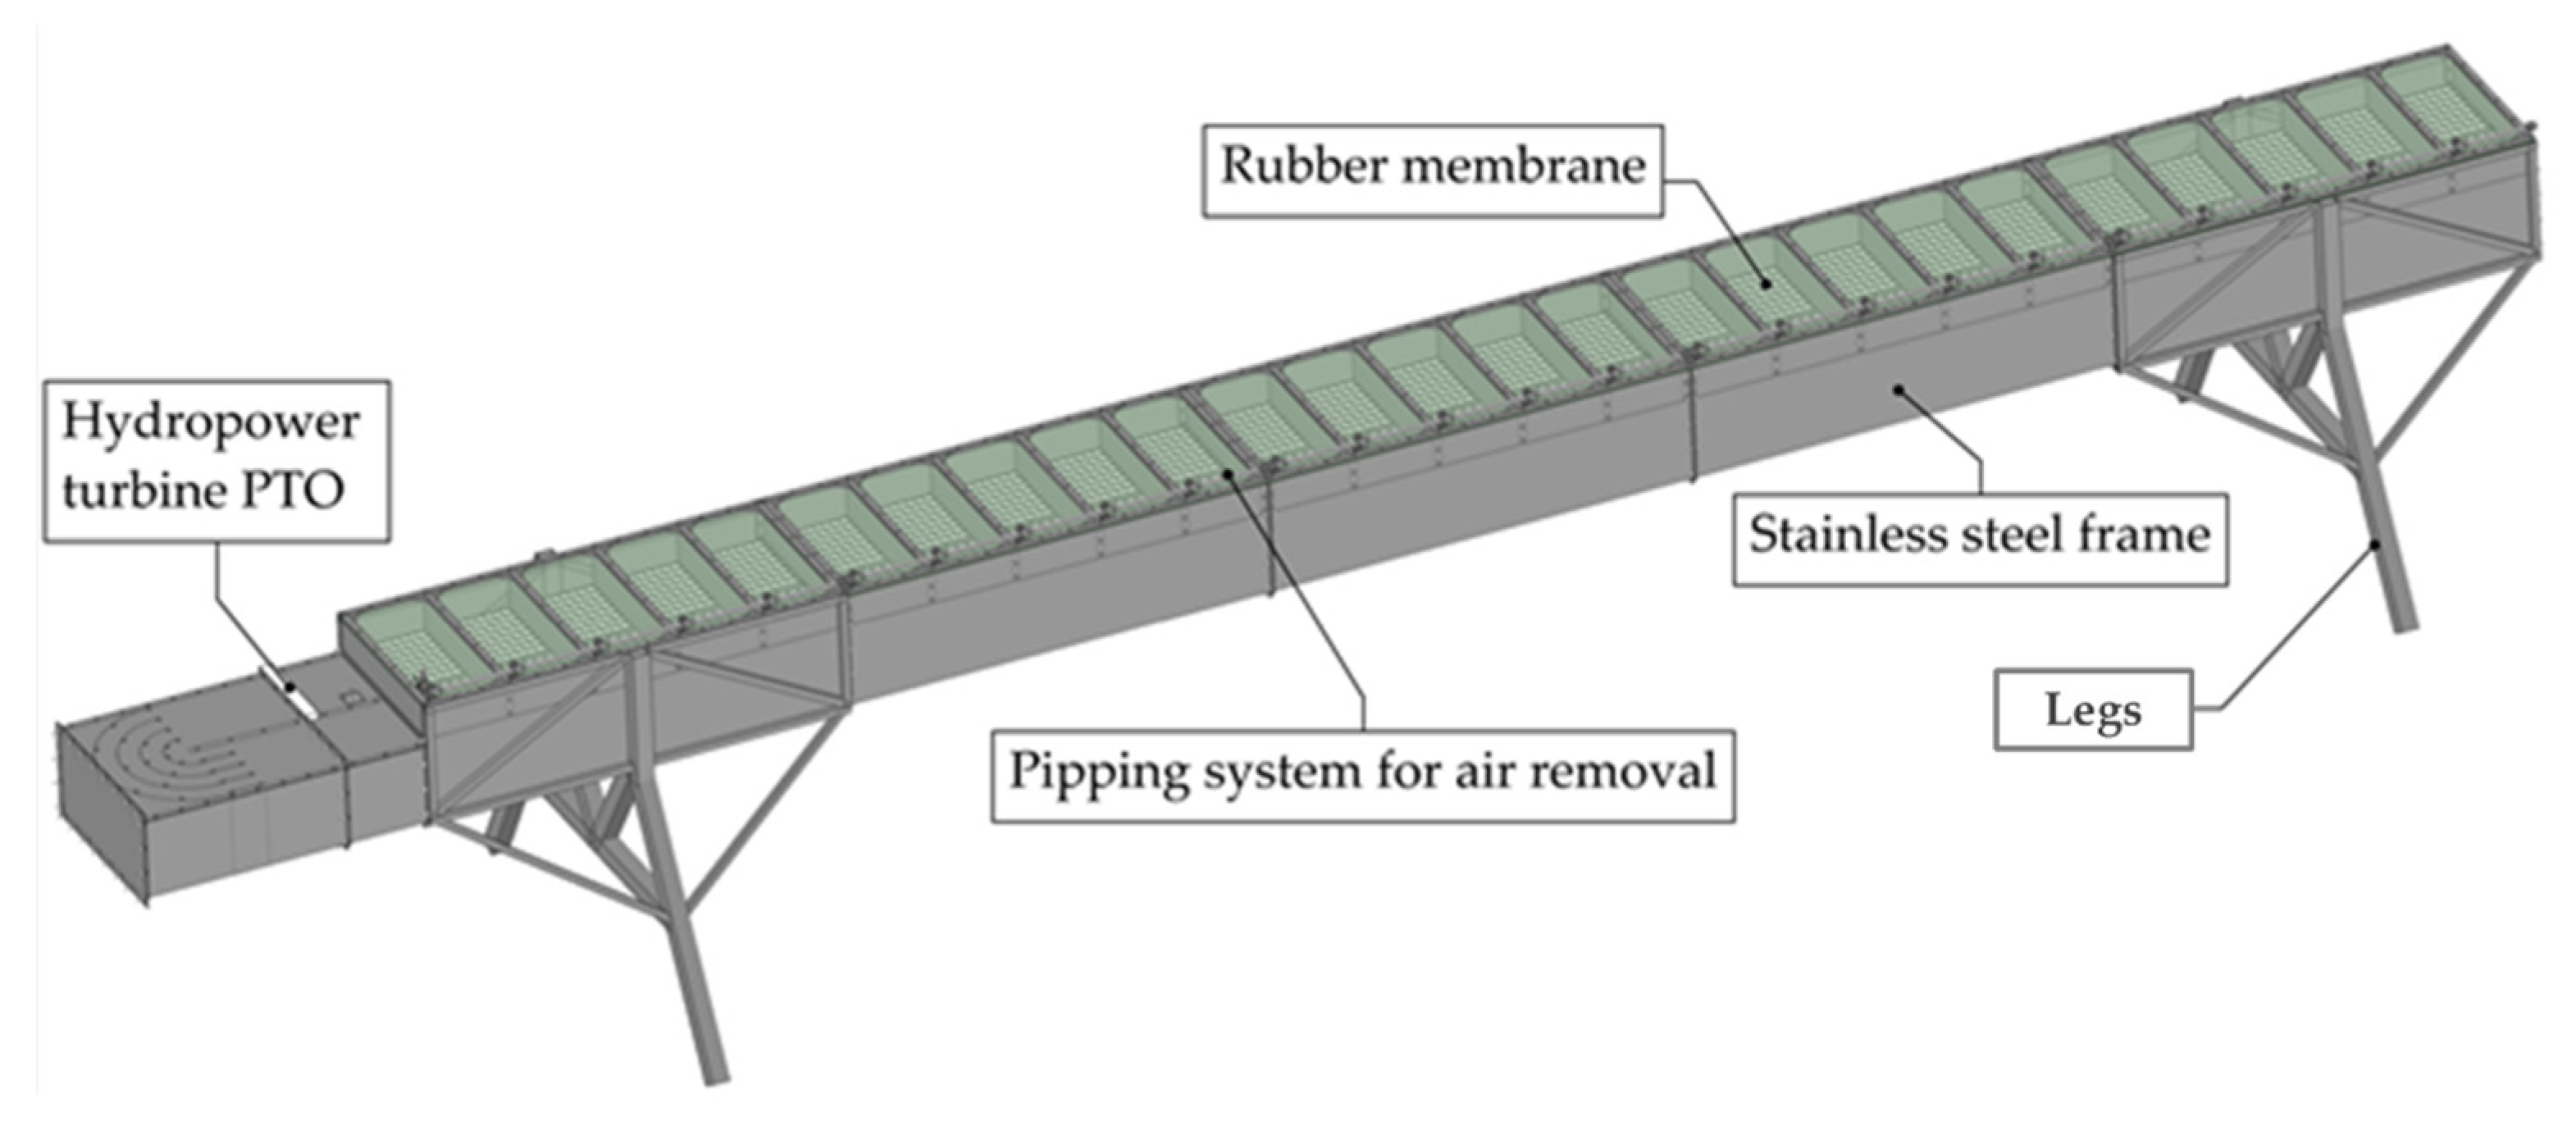
Figure 4.
Significant wave period, (minimum, average, and maximum values) at Sines’ buoy – Portugal.
Figure 4.
Significant wave period, (minimum, average, and maximum values) at Sines’ buoy – Portugal.
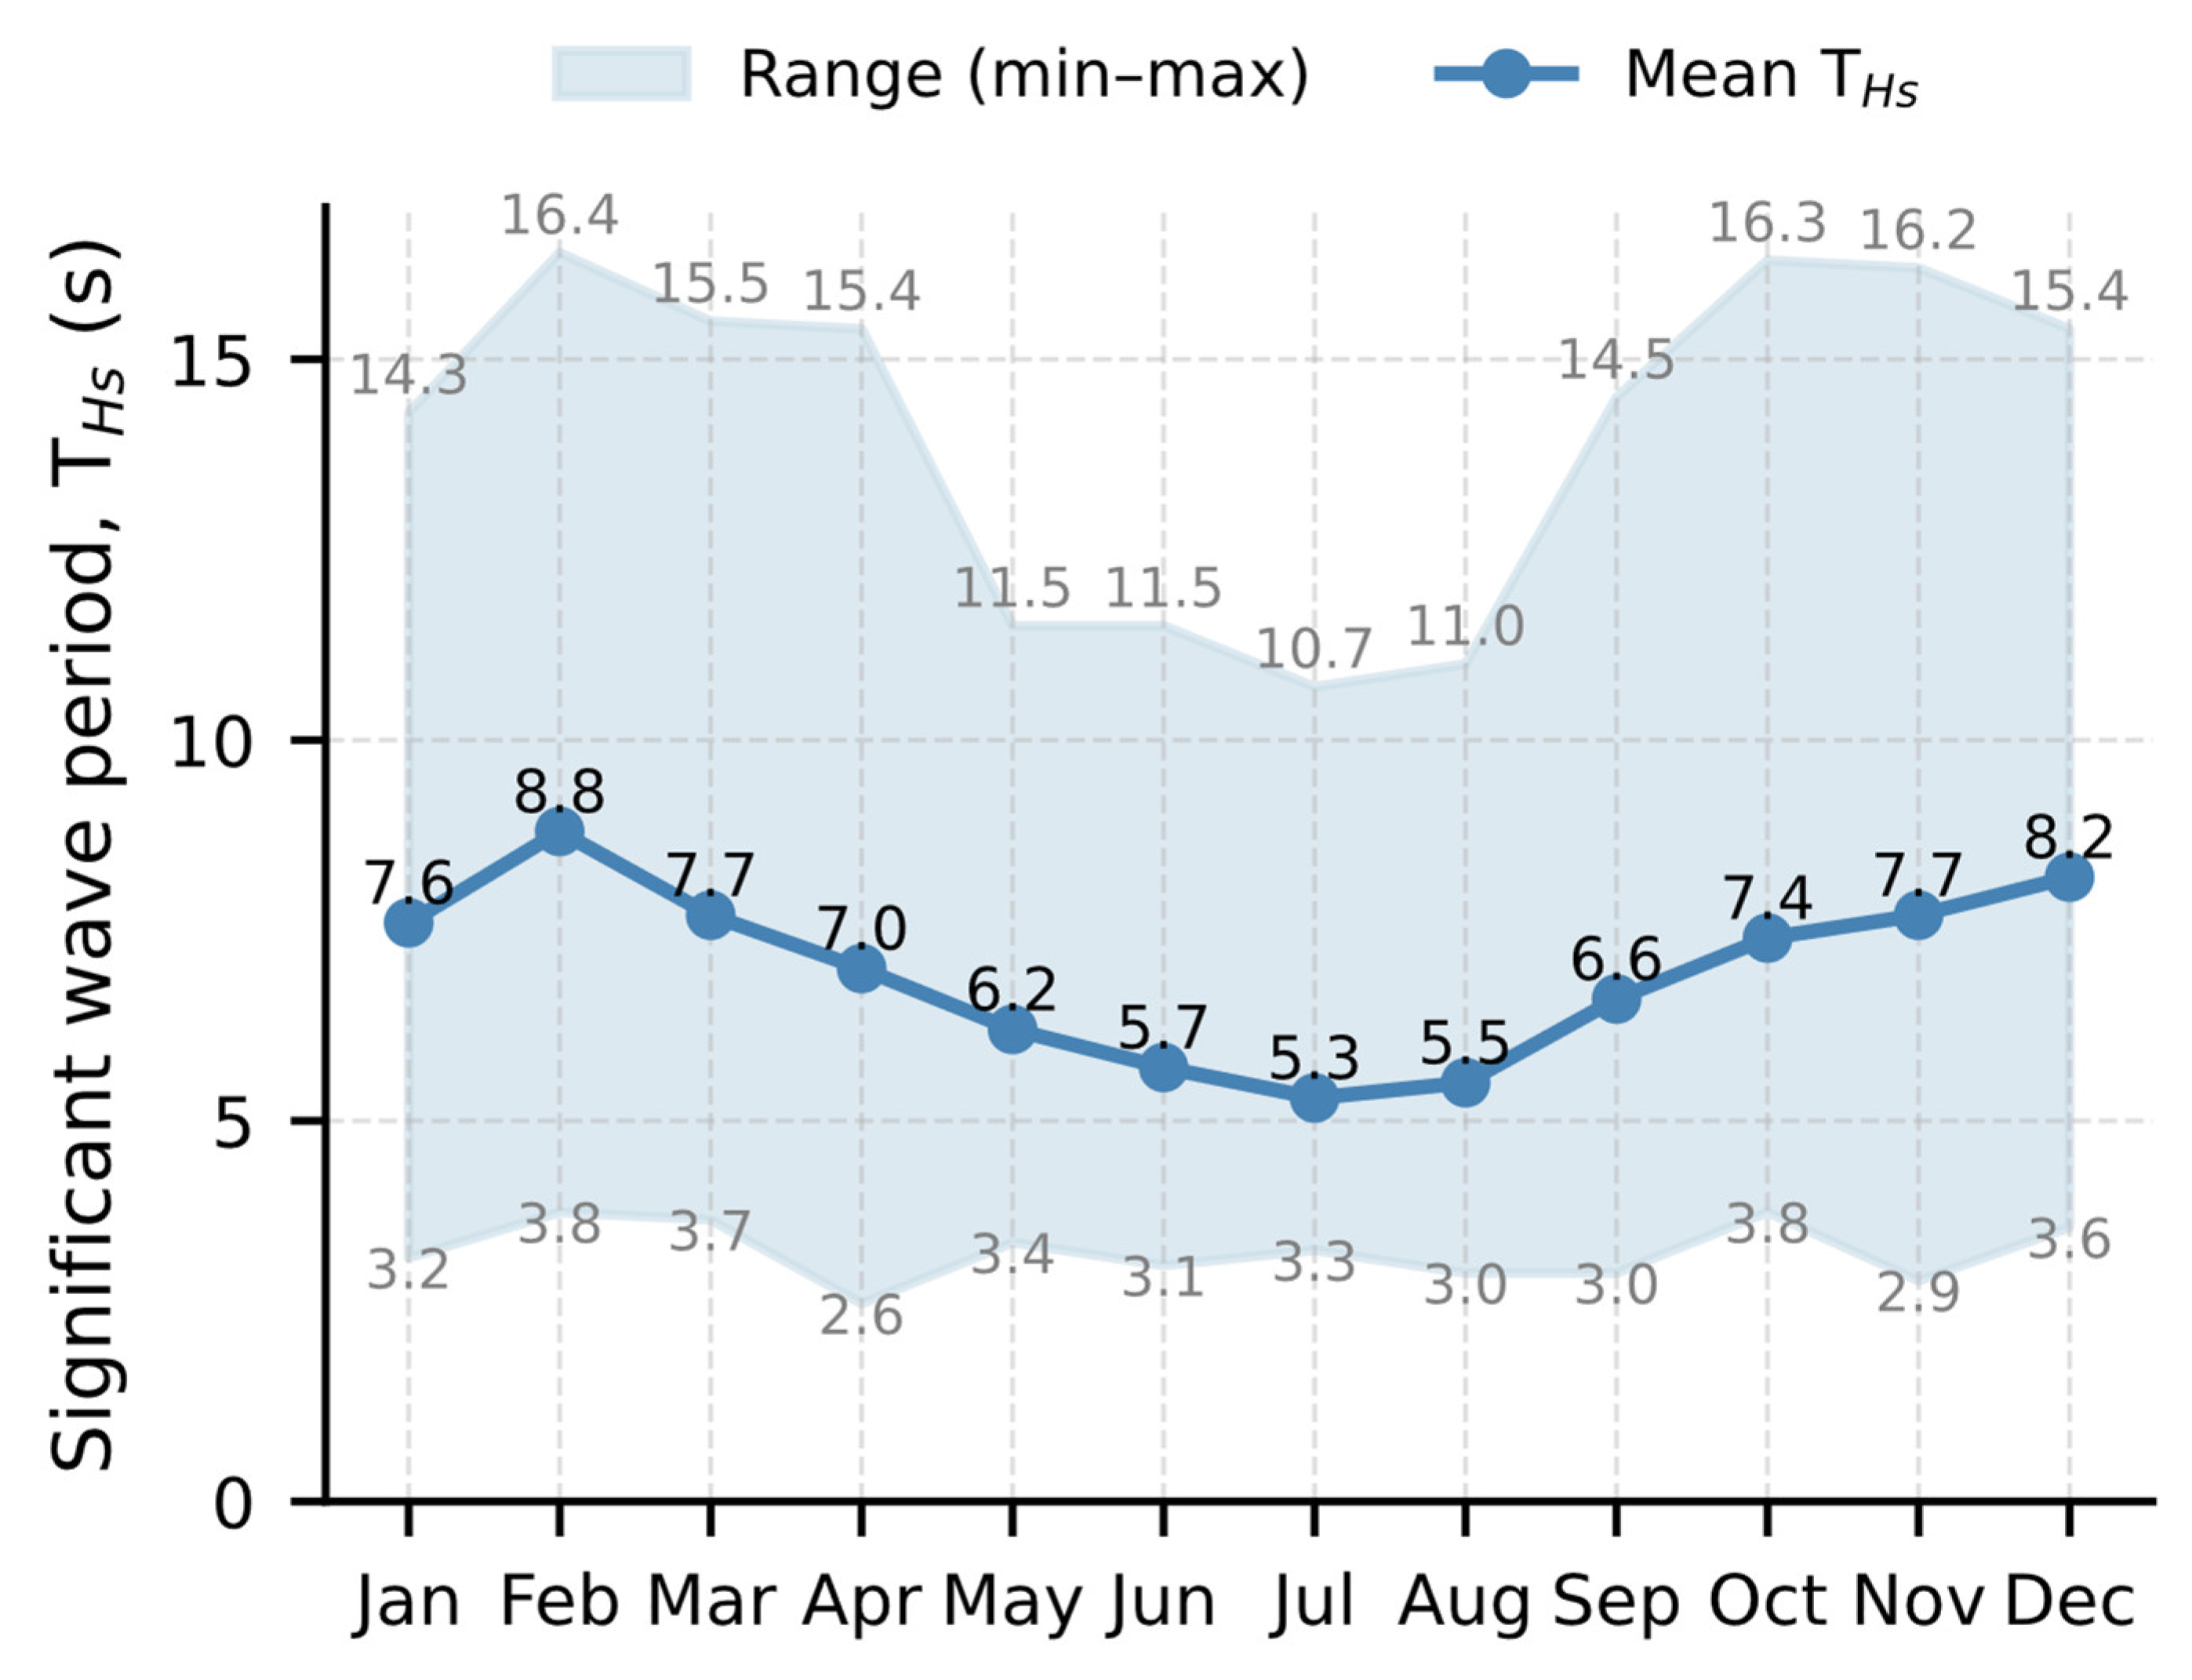
Figure 5.
Monthly number of hours of sea states with 2 s ≤ ≤ 4 s at Sines’ buoy – Portugal.
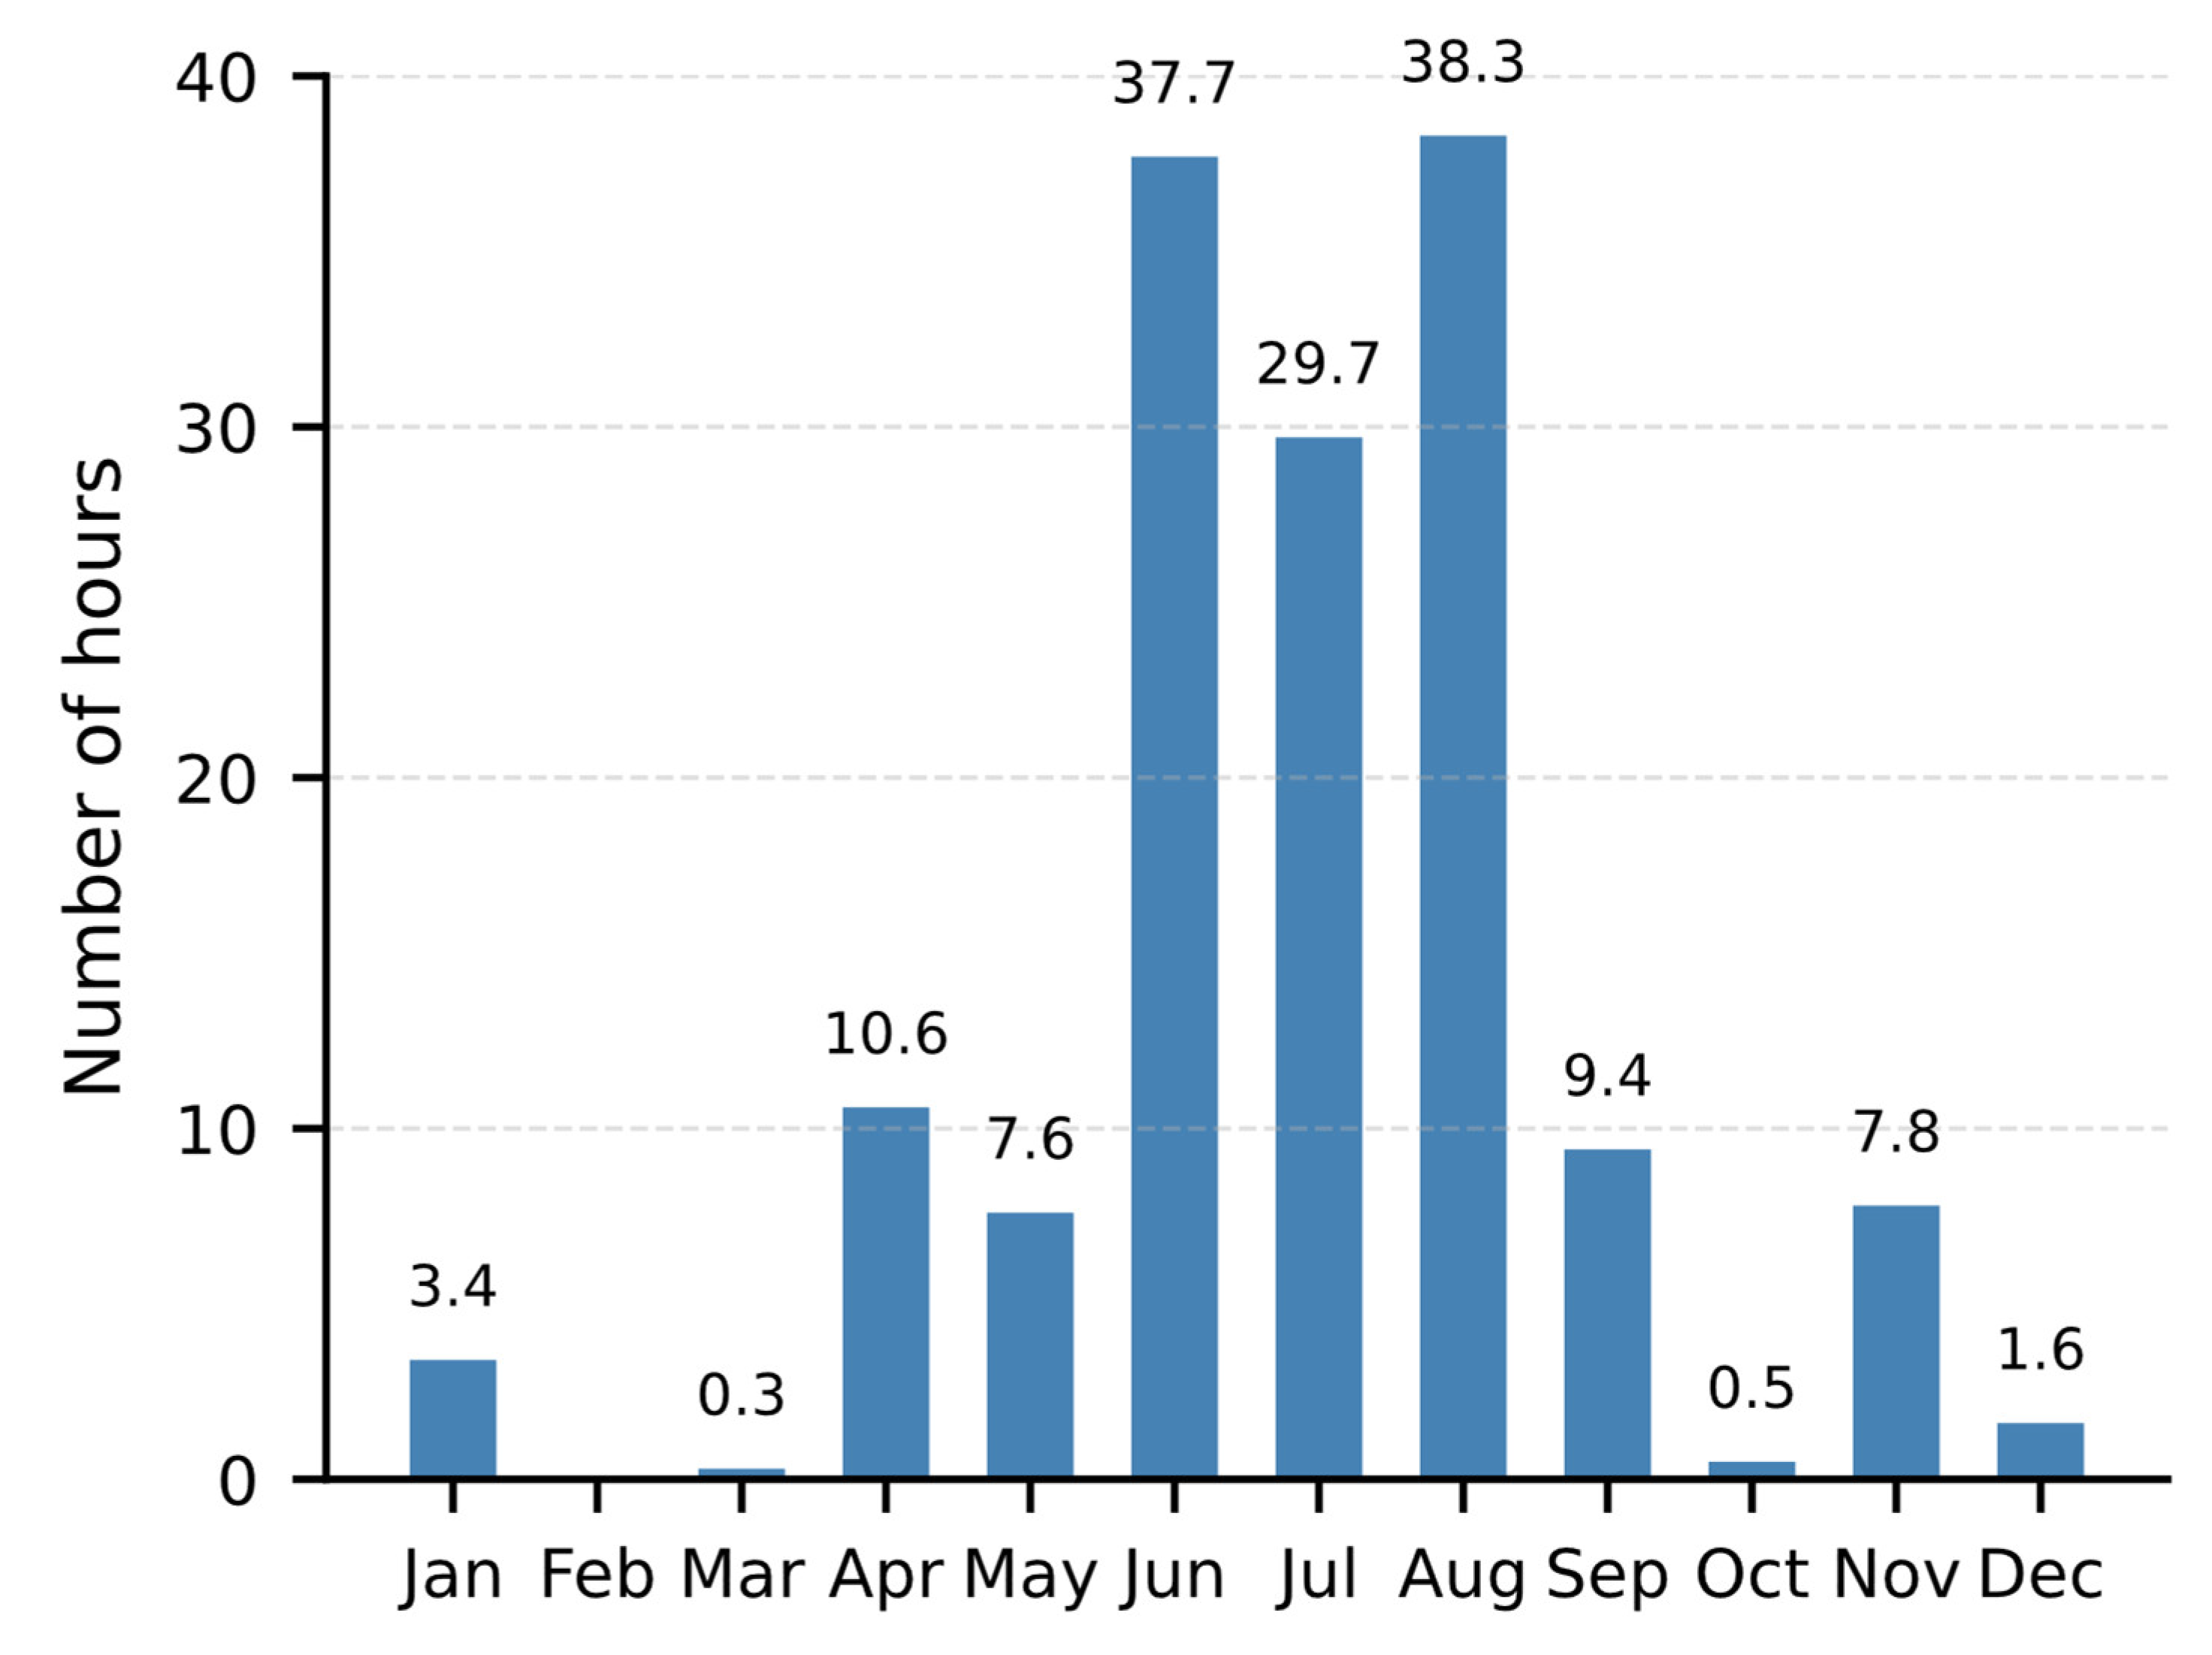
Figure 6.
Significant wave height, (minimum, average and maximum) at Sines’ buoy for 2 s ≤ ≤ 4 s (2017 - 2022).
Figure 6.
Significant wave height, (minimum, average and maximum) at Sines’ buoy for 2 s ≤ ≤ 4 s (2017 - 2022).
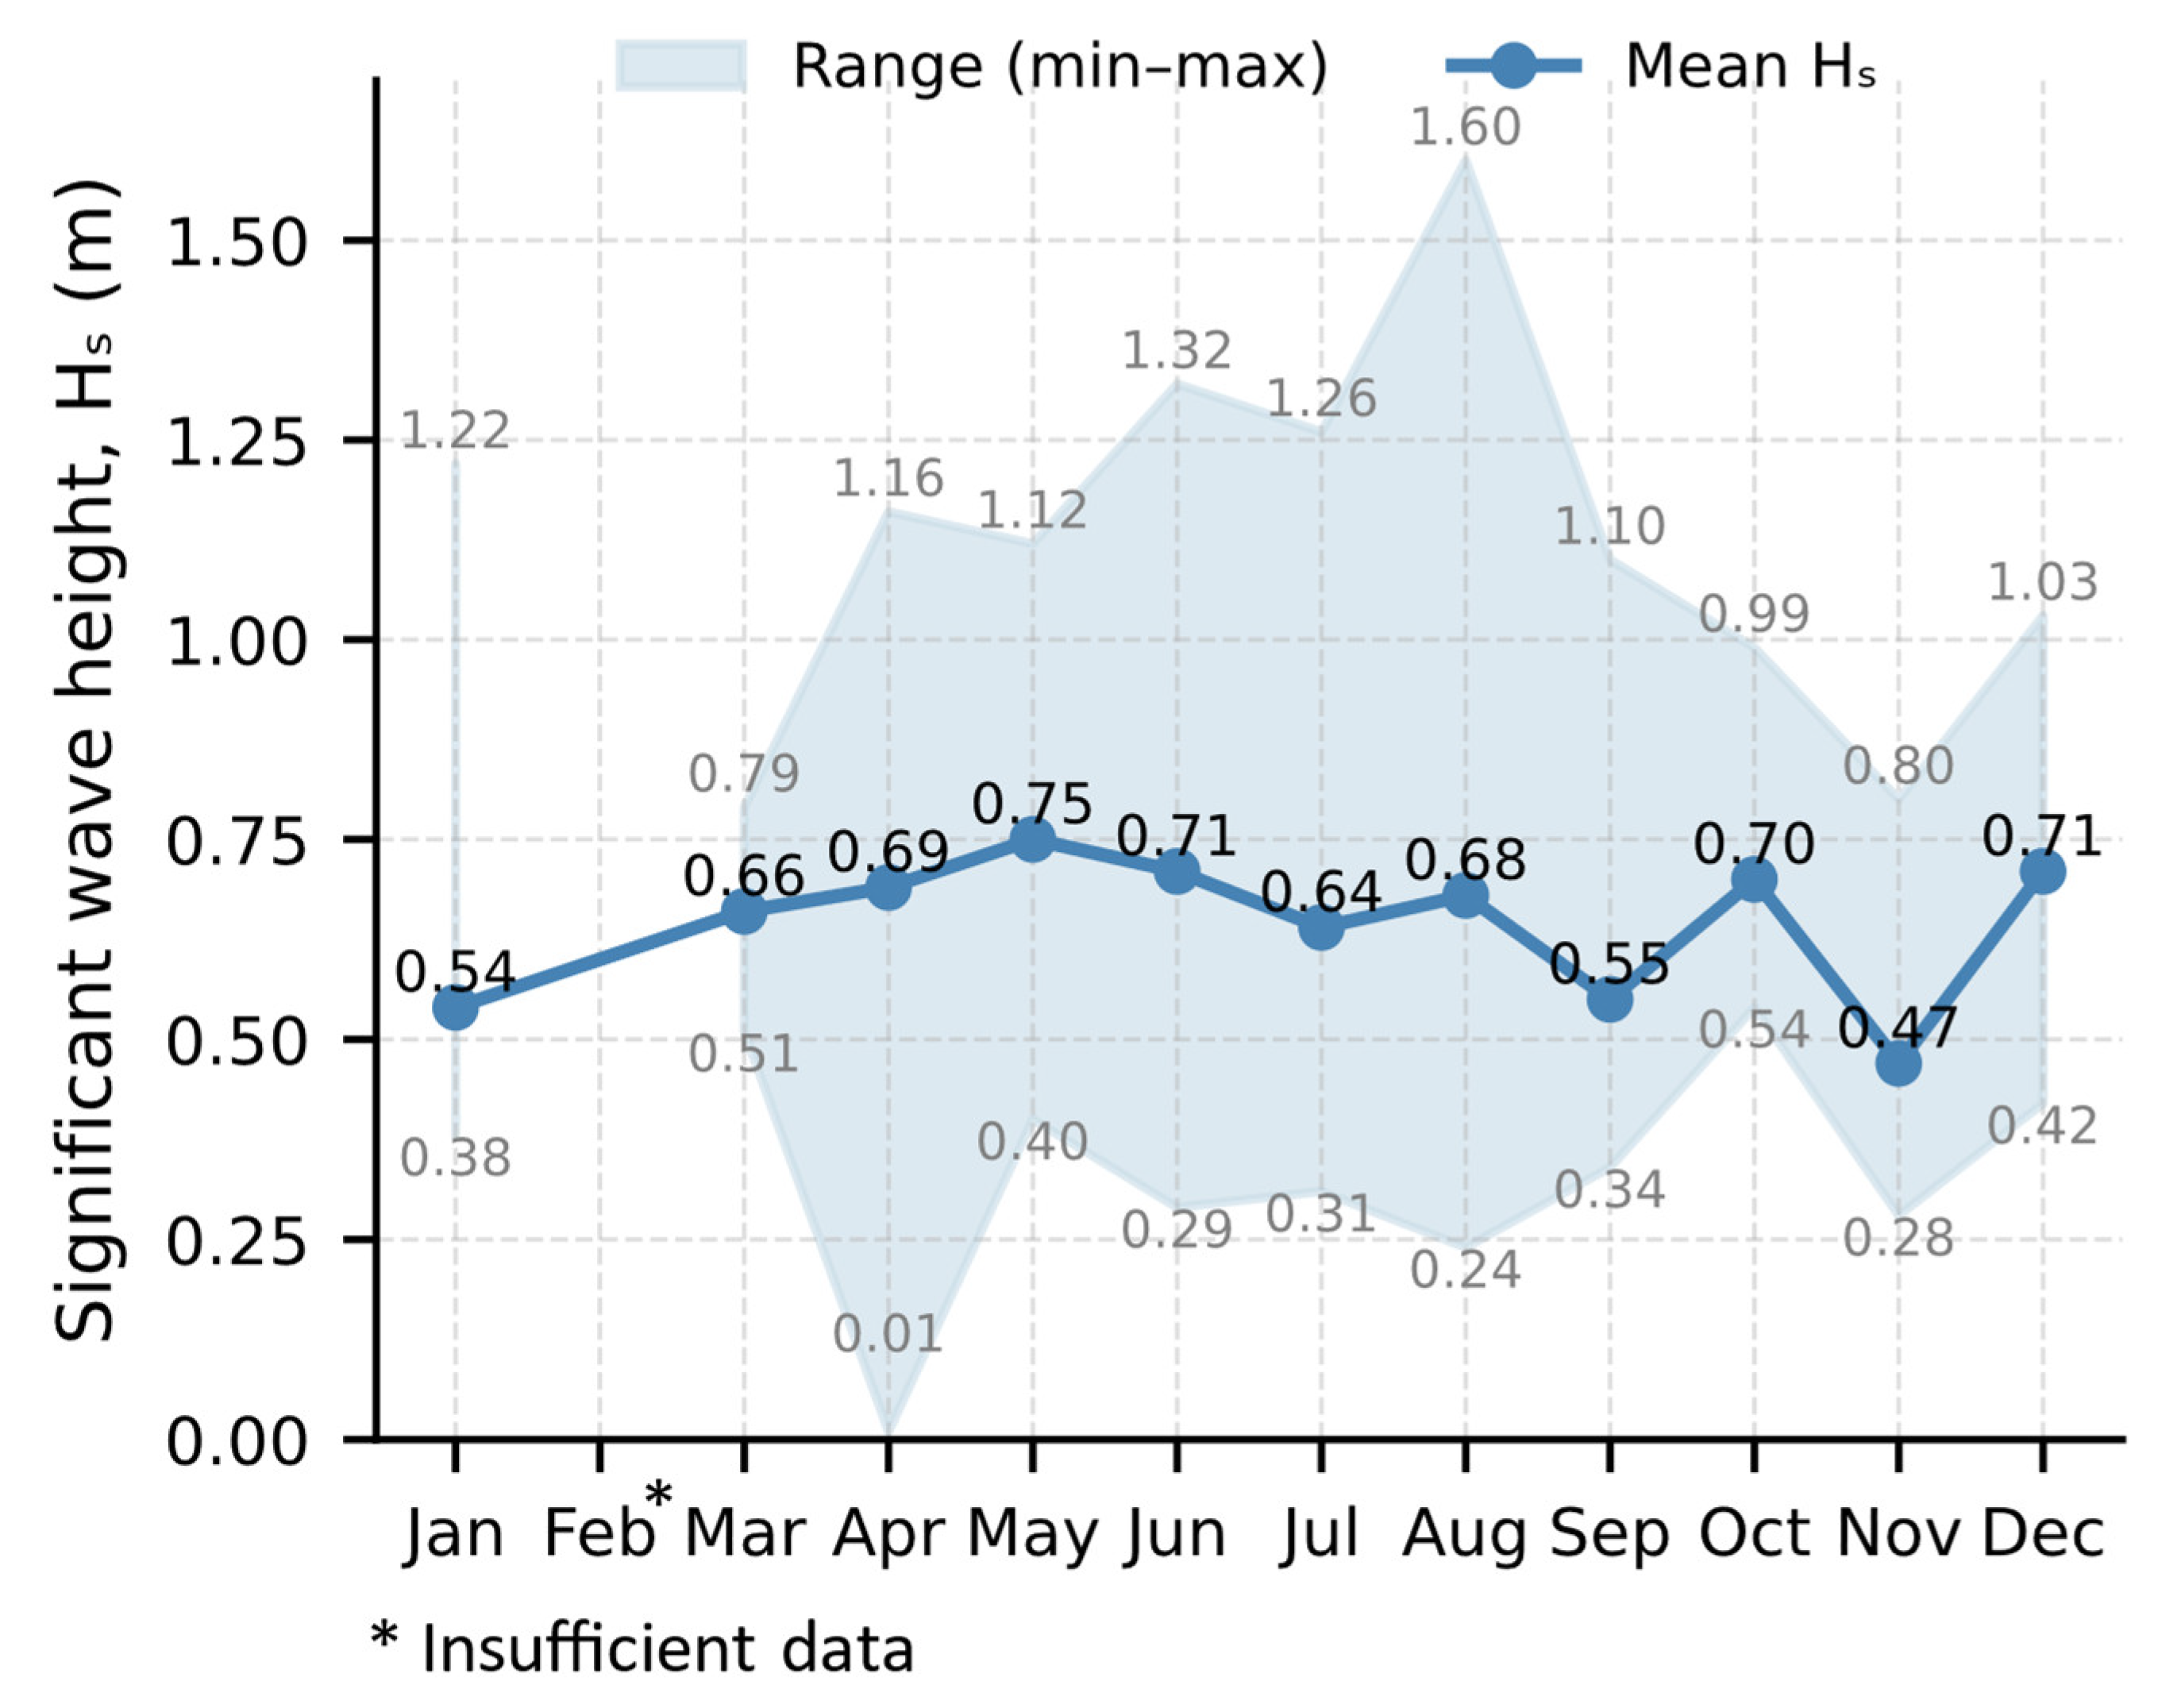
Figure 7.
Significant wave direction (minimum, average and maximum) at Sines’ buoy for 2 s ≤ ≤ 4 s (2017 - 2022).
Figure 7.
Significant wave direction (minimum, average and maximum) at Sines’ buoy for 2 s ≤ ≤ 4 s (2017 - 2022).
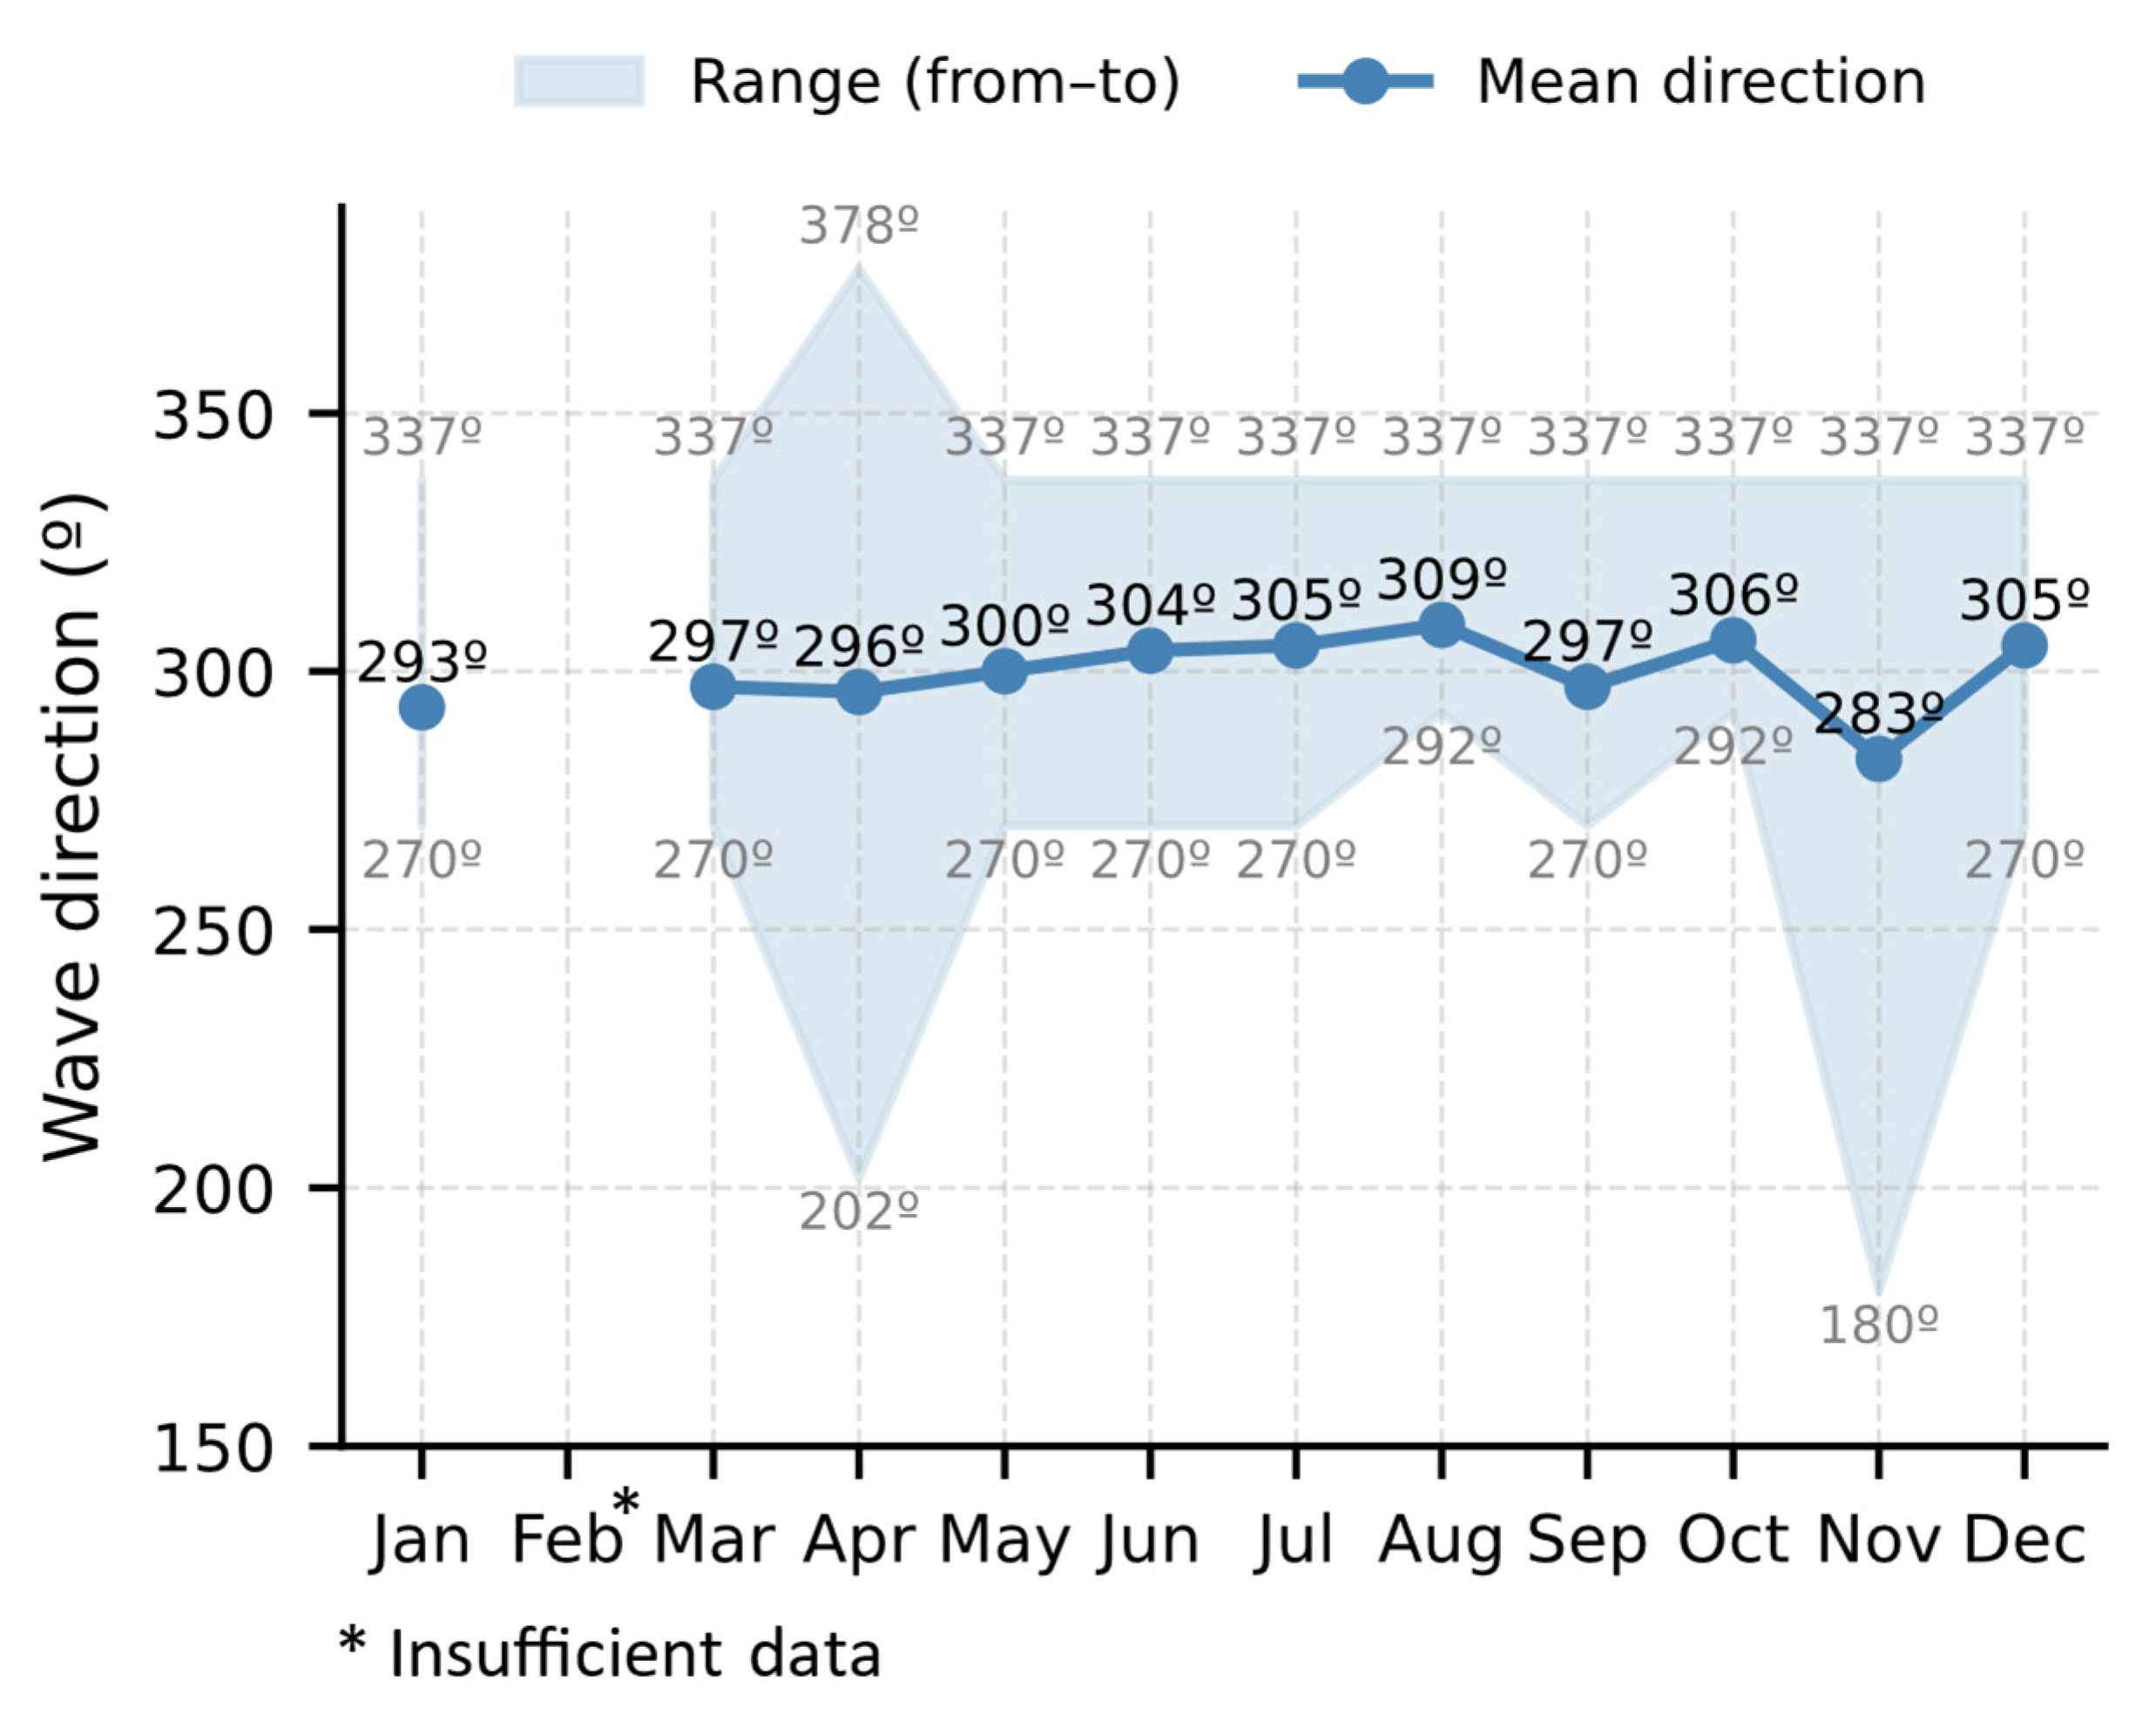
Figure 8.
Wind characterization in Port of Sines computed from APS meteorological database (2017 - 2022).
Figure 8.
Wind characterization in Port of Sines computed from APS meteorological database (2017 - 2022).
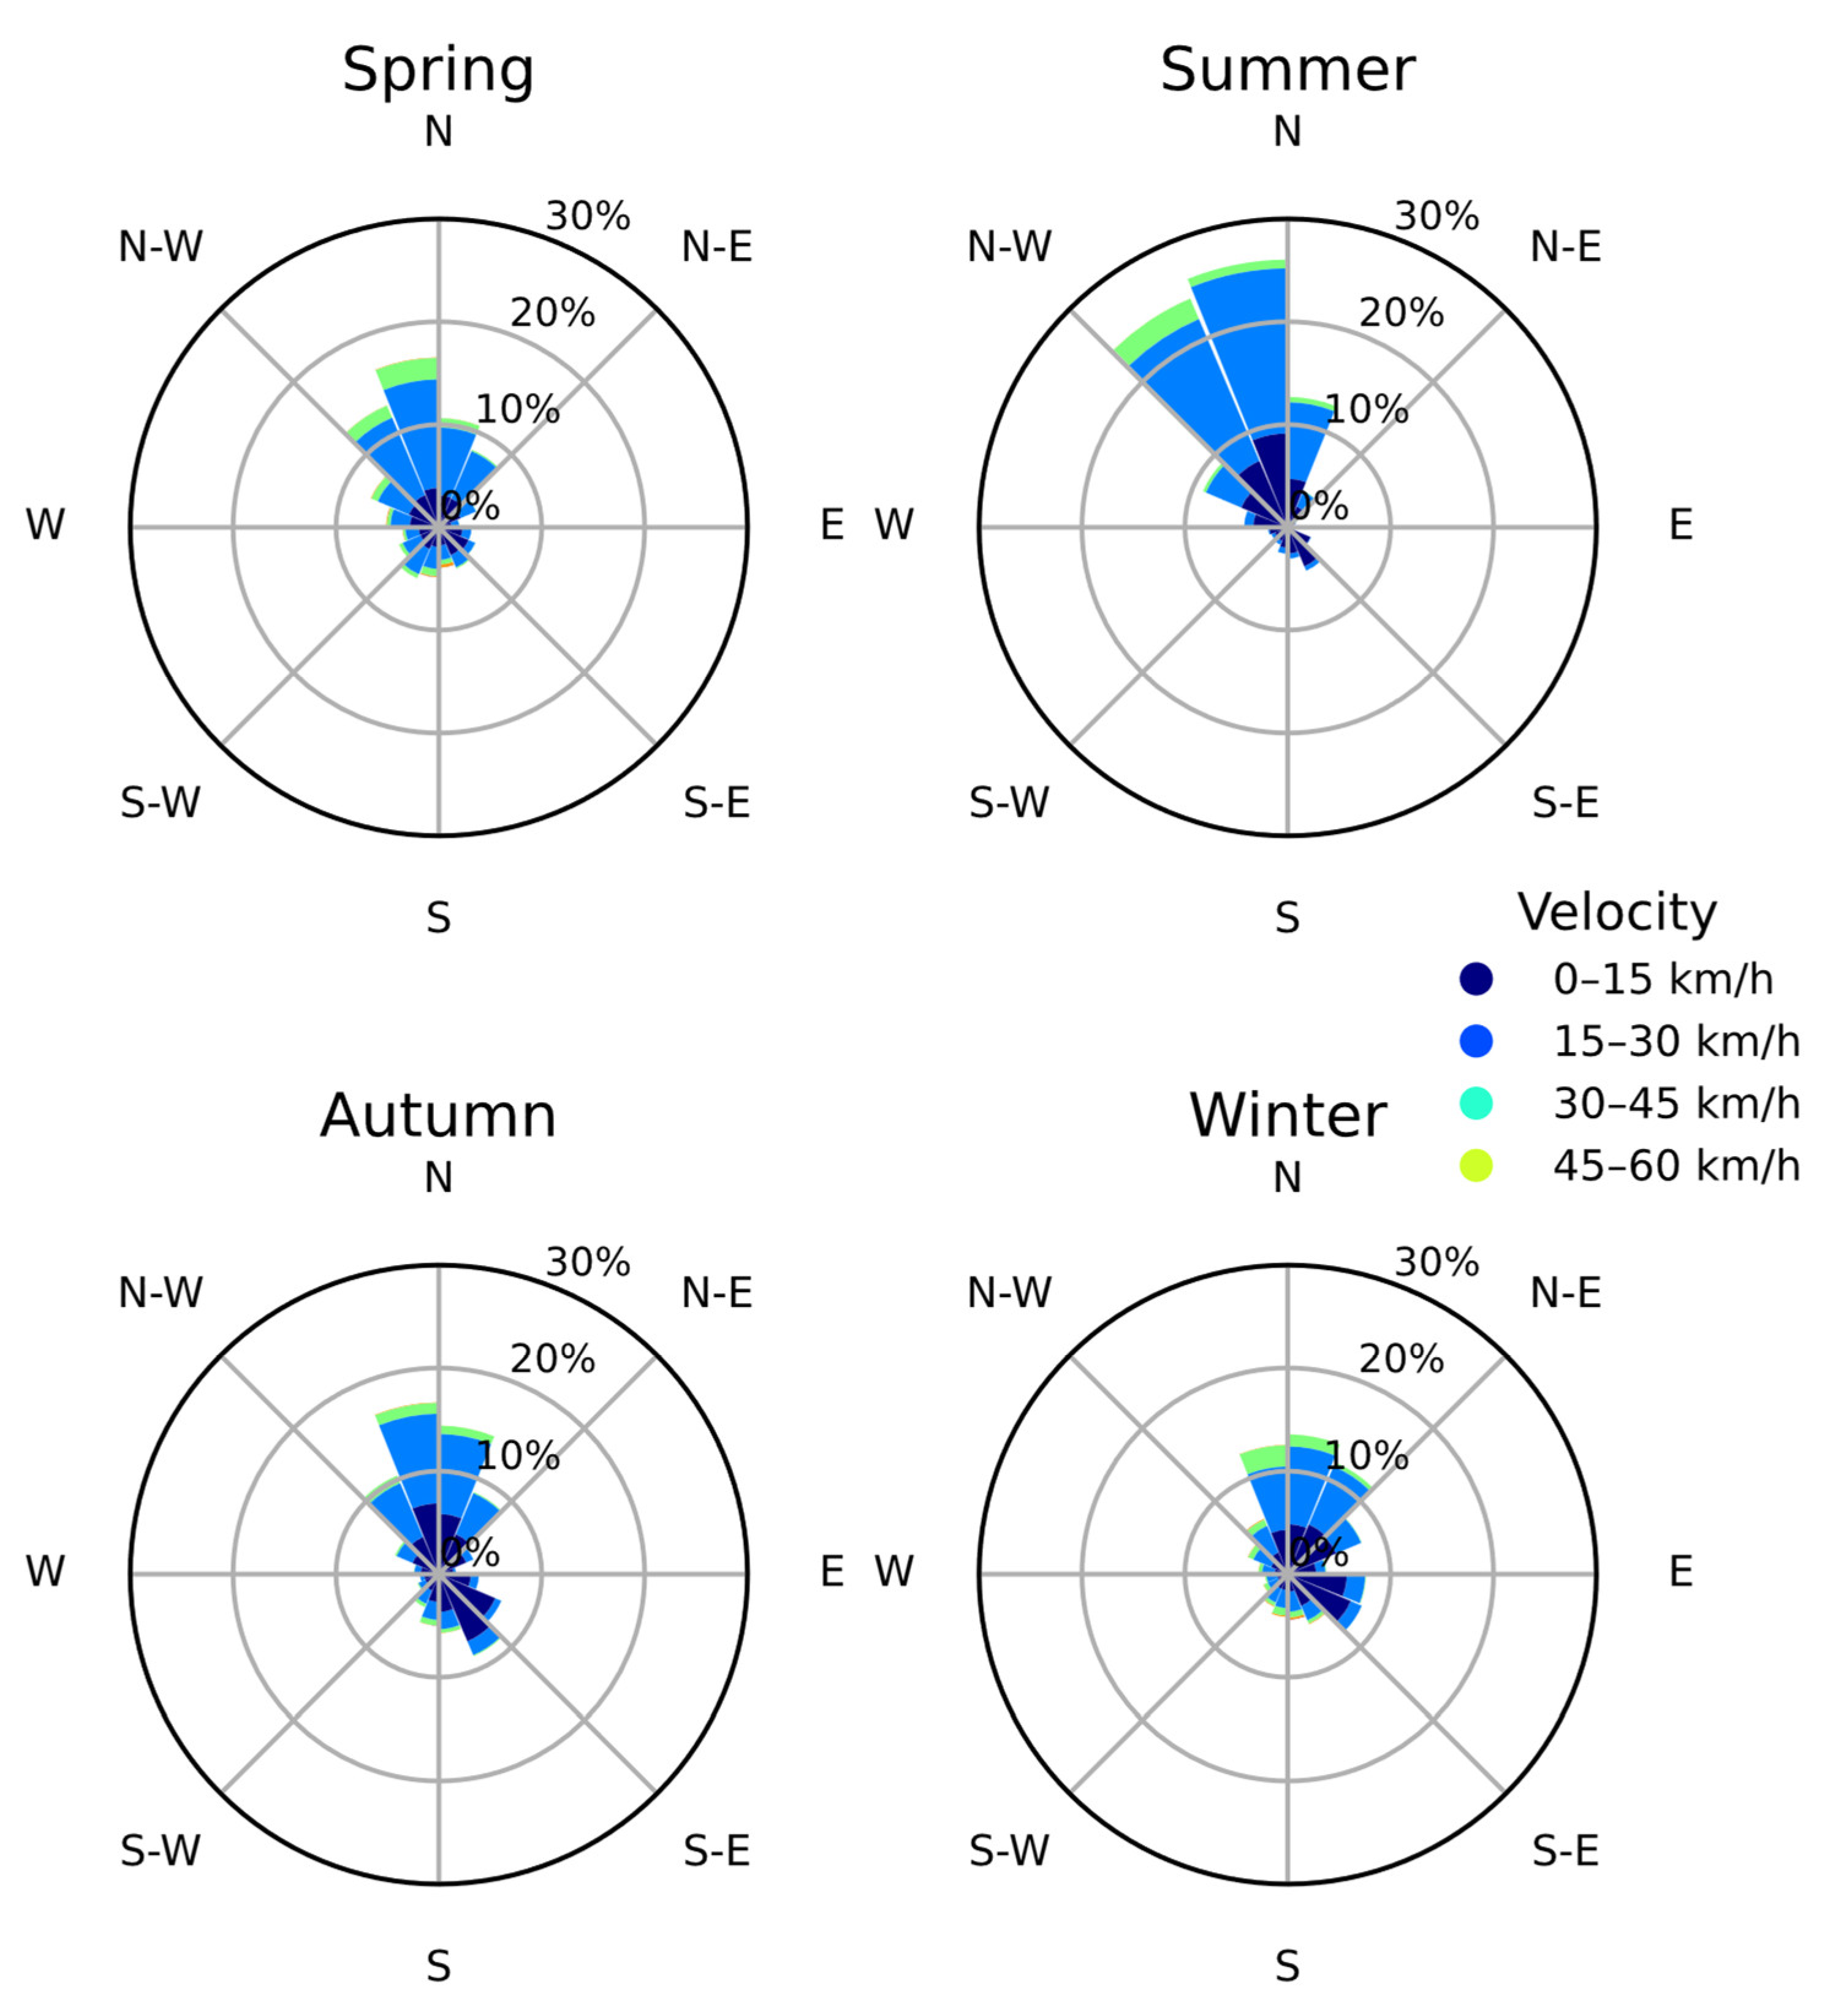
Figure 9.
Illustration of fetch length for NWN wind direction and testbed zones A and B next to shore. Adapted from [26].
Figure 9.
Illustration of fetch length for NWN wind direction and testbed zones A and B next to shore. Adapted from [26].
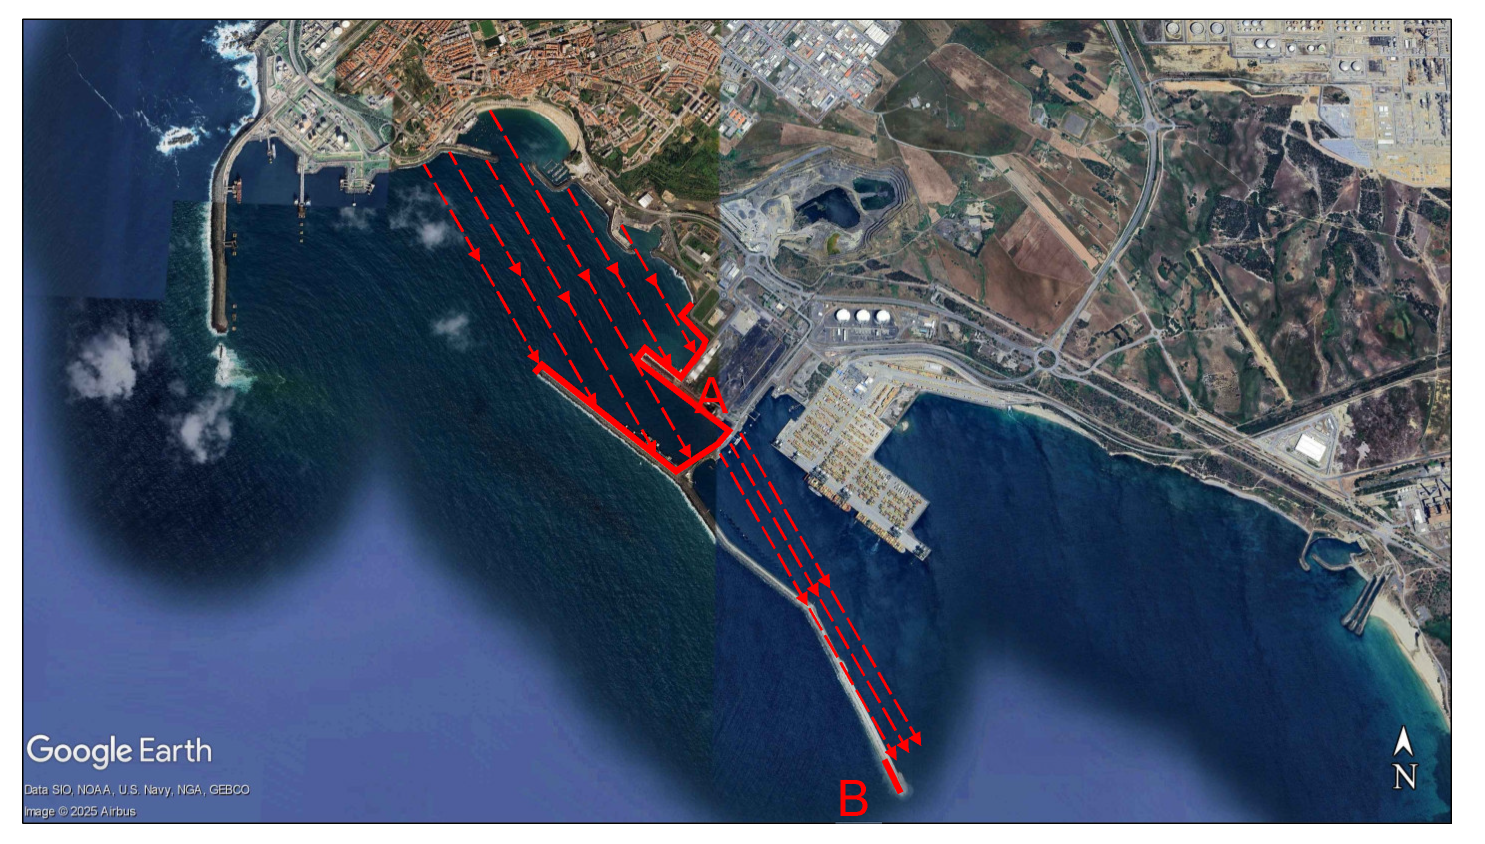
Figure 10.
Digital elevation model of the Port of Sines (vertical scale increased by 15x).
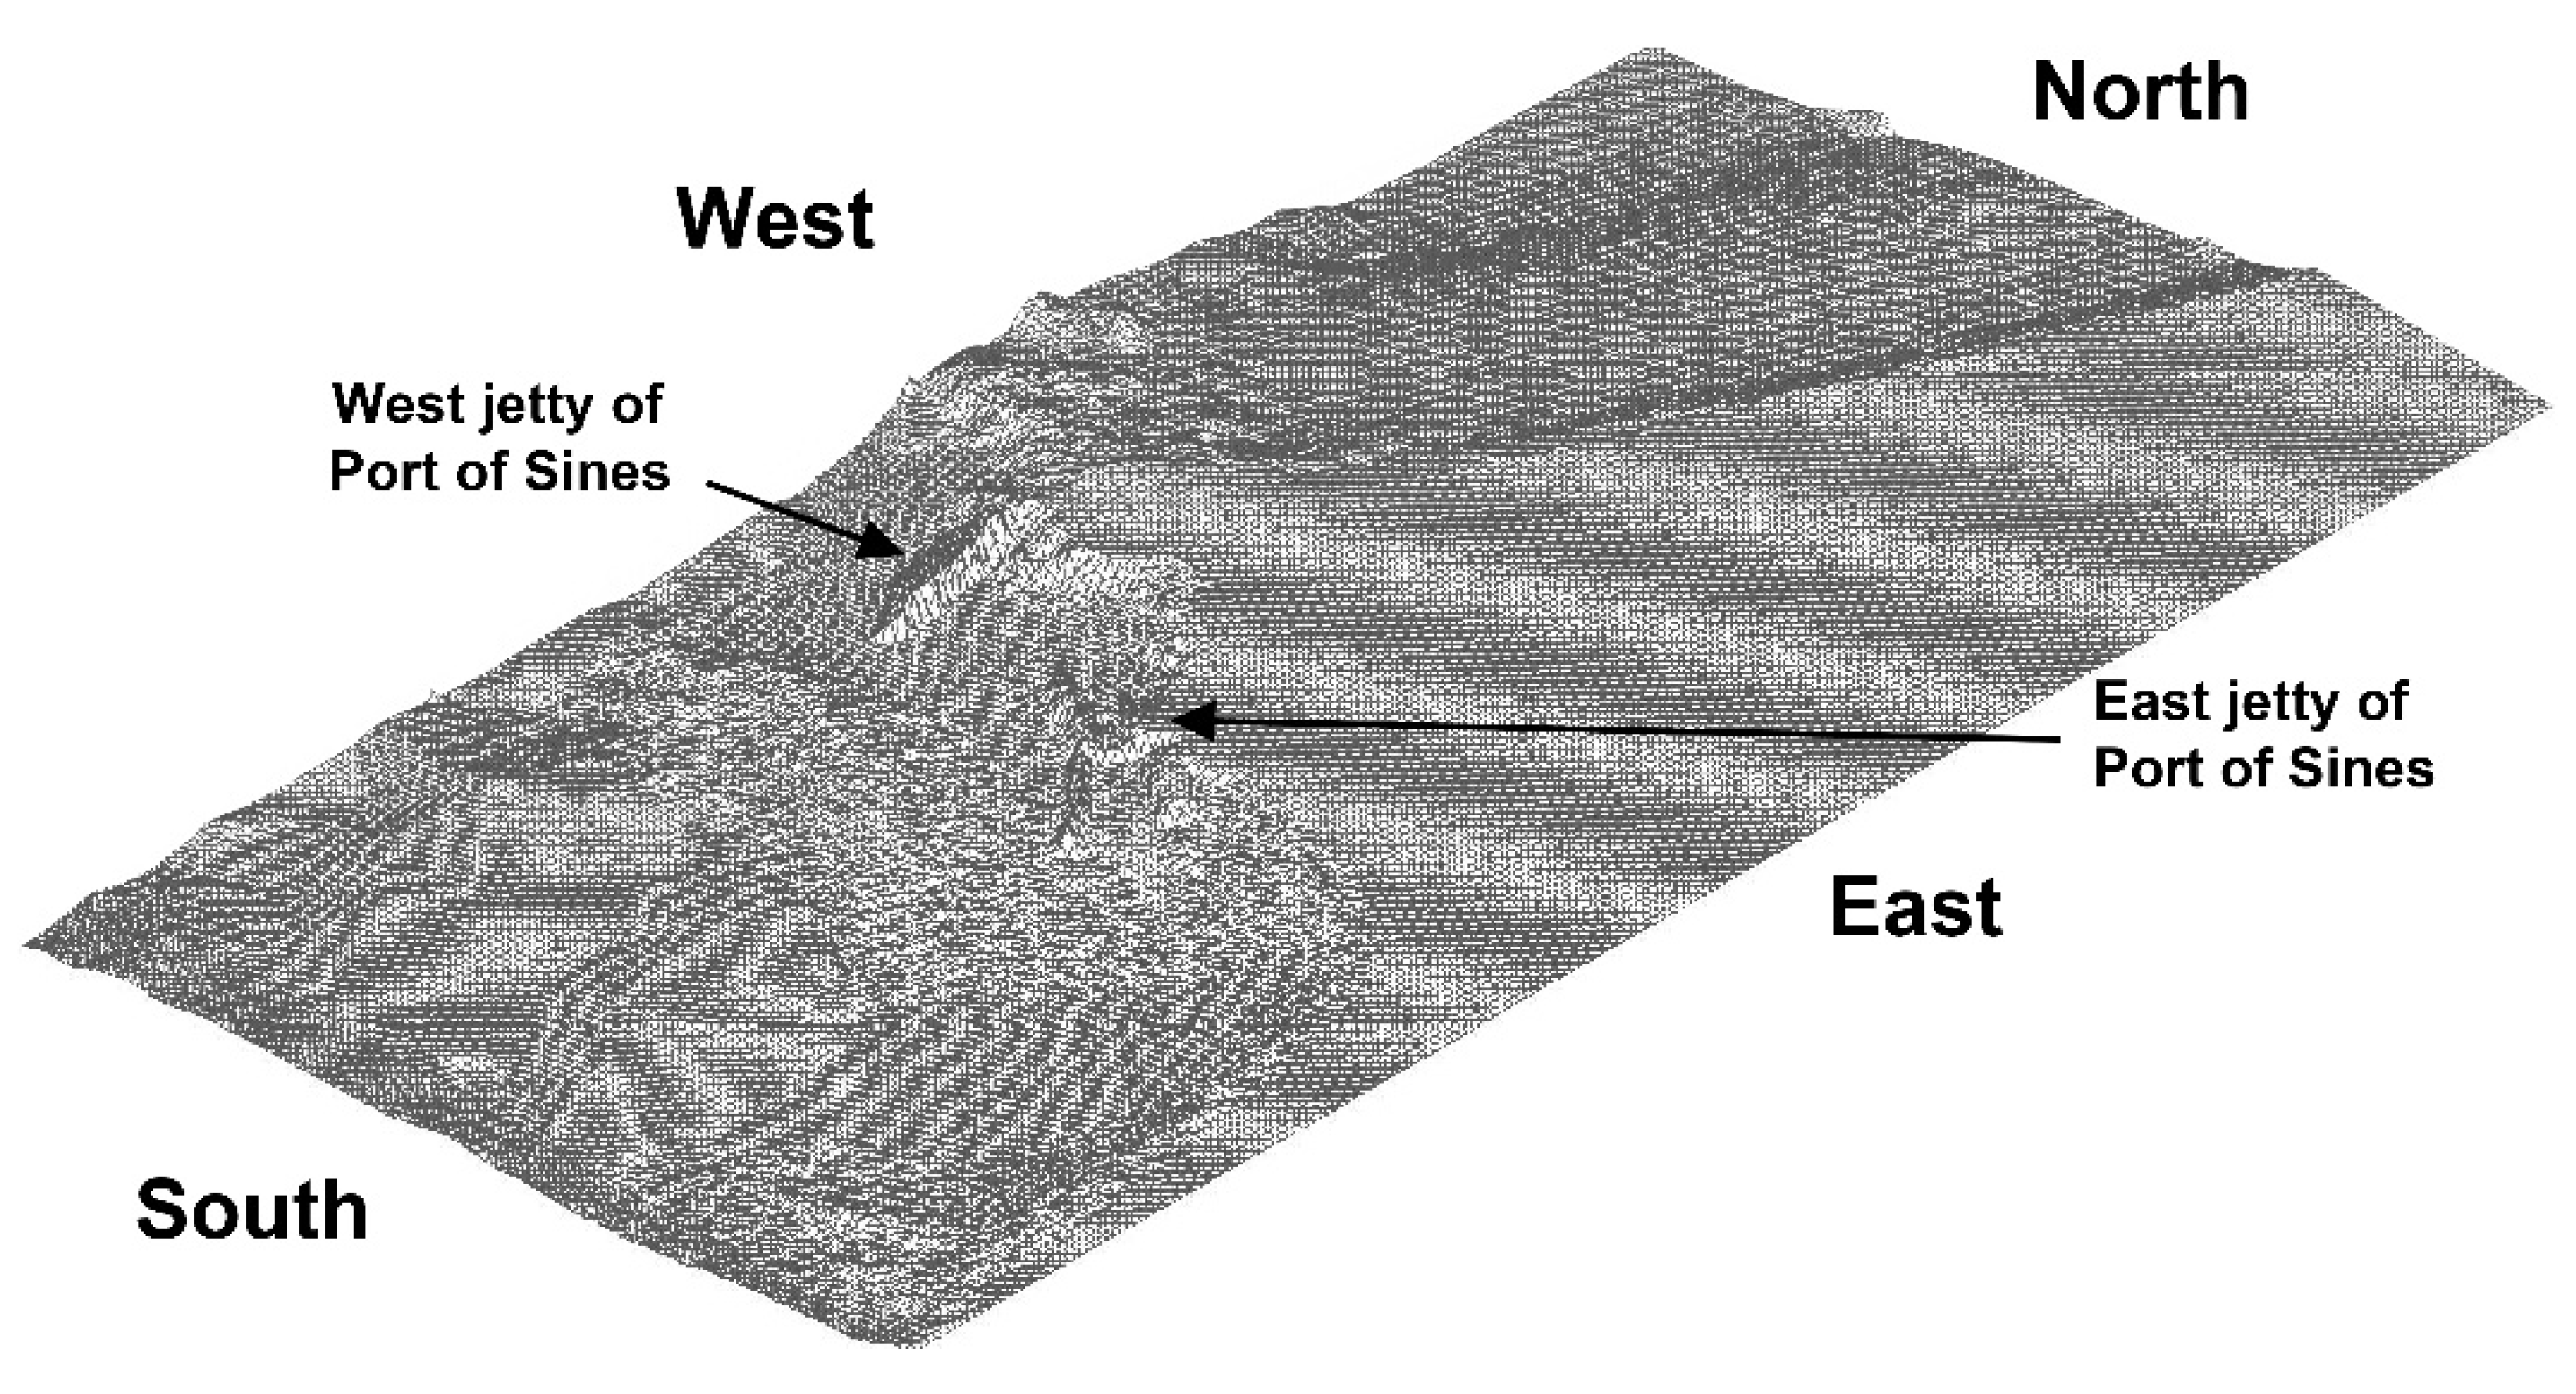
Figure 11.
Depth of 1.5 m in extreme low tide (datum: ZH) and corresponding bathymetric depth of -3.3 m (datum: MSL).
Figure 11.
Depth of 1.5 m in extreme low tide (datum: ZH) and corresponding bathymetric depth of -3.3 m (datum: MSL).
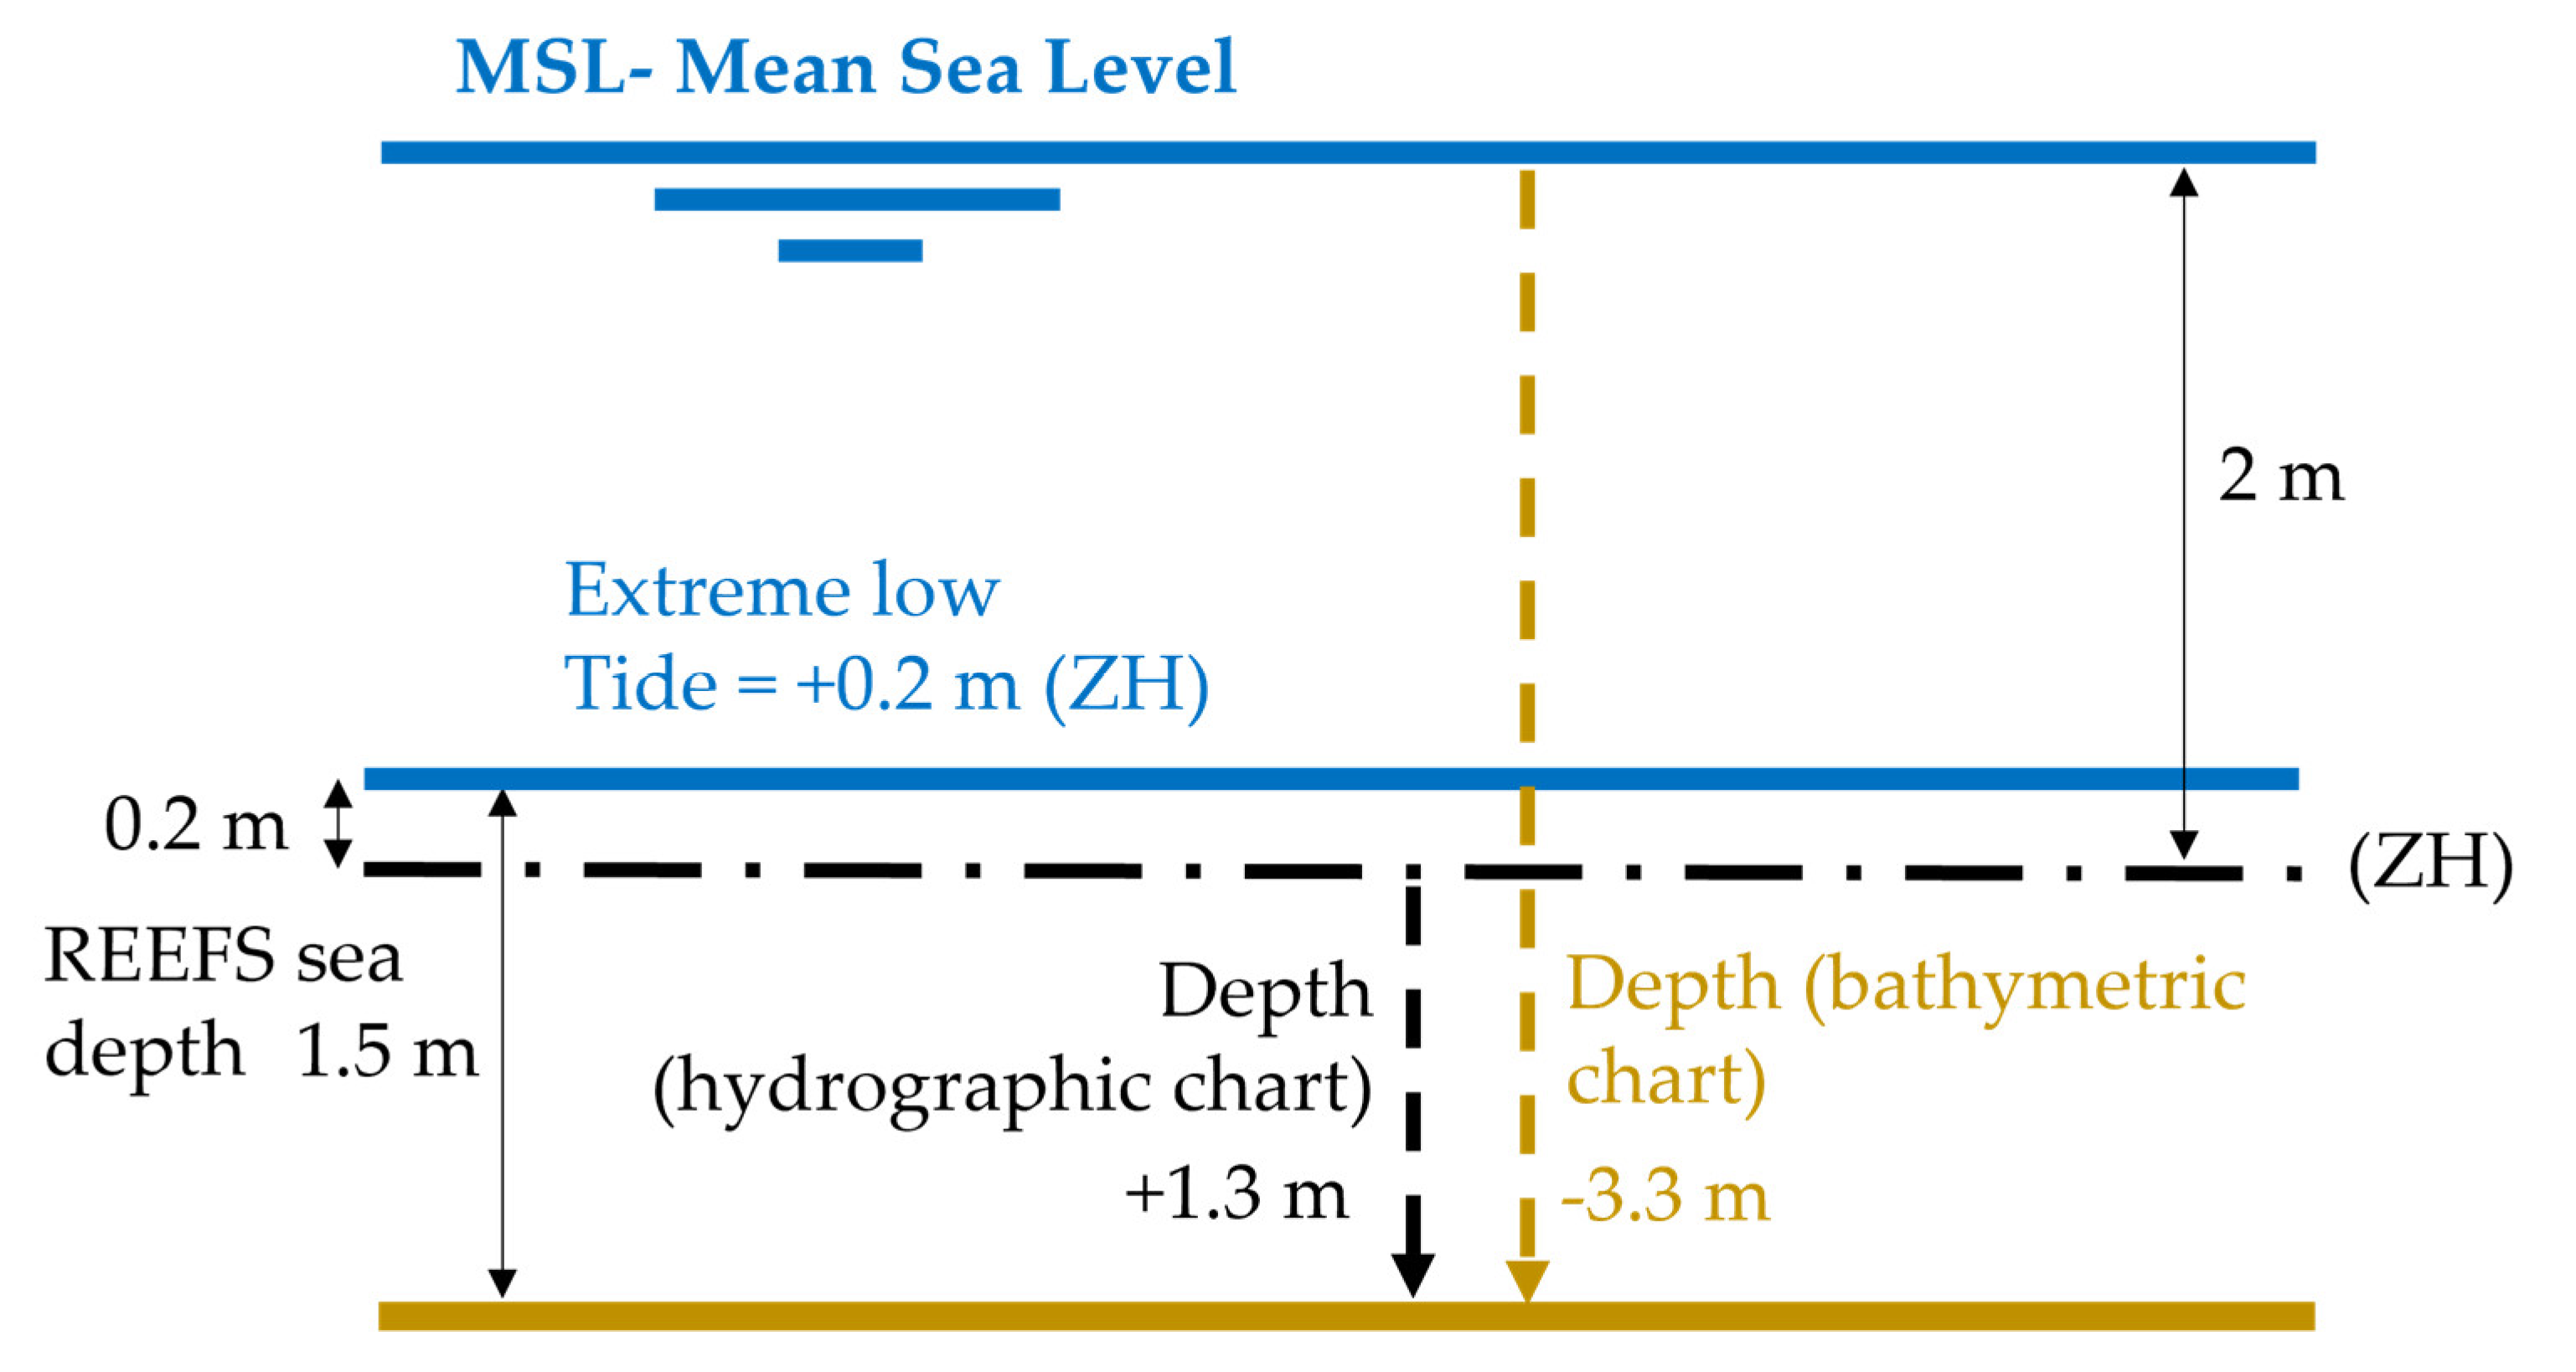
Figure 12.
Eligible deployment zones with bathymetric depths varying from -3 to -4 m generated from the digital elevation model and from the bathymetry survey provided by APS. Lisboa Hayford Gauss IgeoE coordinate system, Tranverse Mercator projection.
Figure 12.
Eligible deployment zones with bathymetric depths varying from -3 to -4 m generated from the digital elevation model and from the bathymetry survey provided by APS. Lisboa Hayford Gauss IgeoE coordinate system, Tranverse Mercator projection.
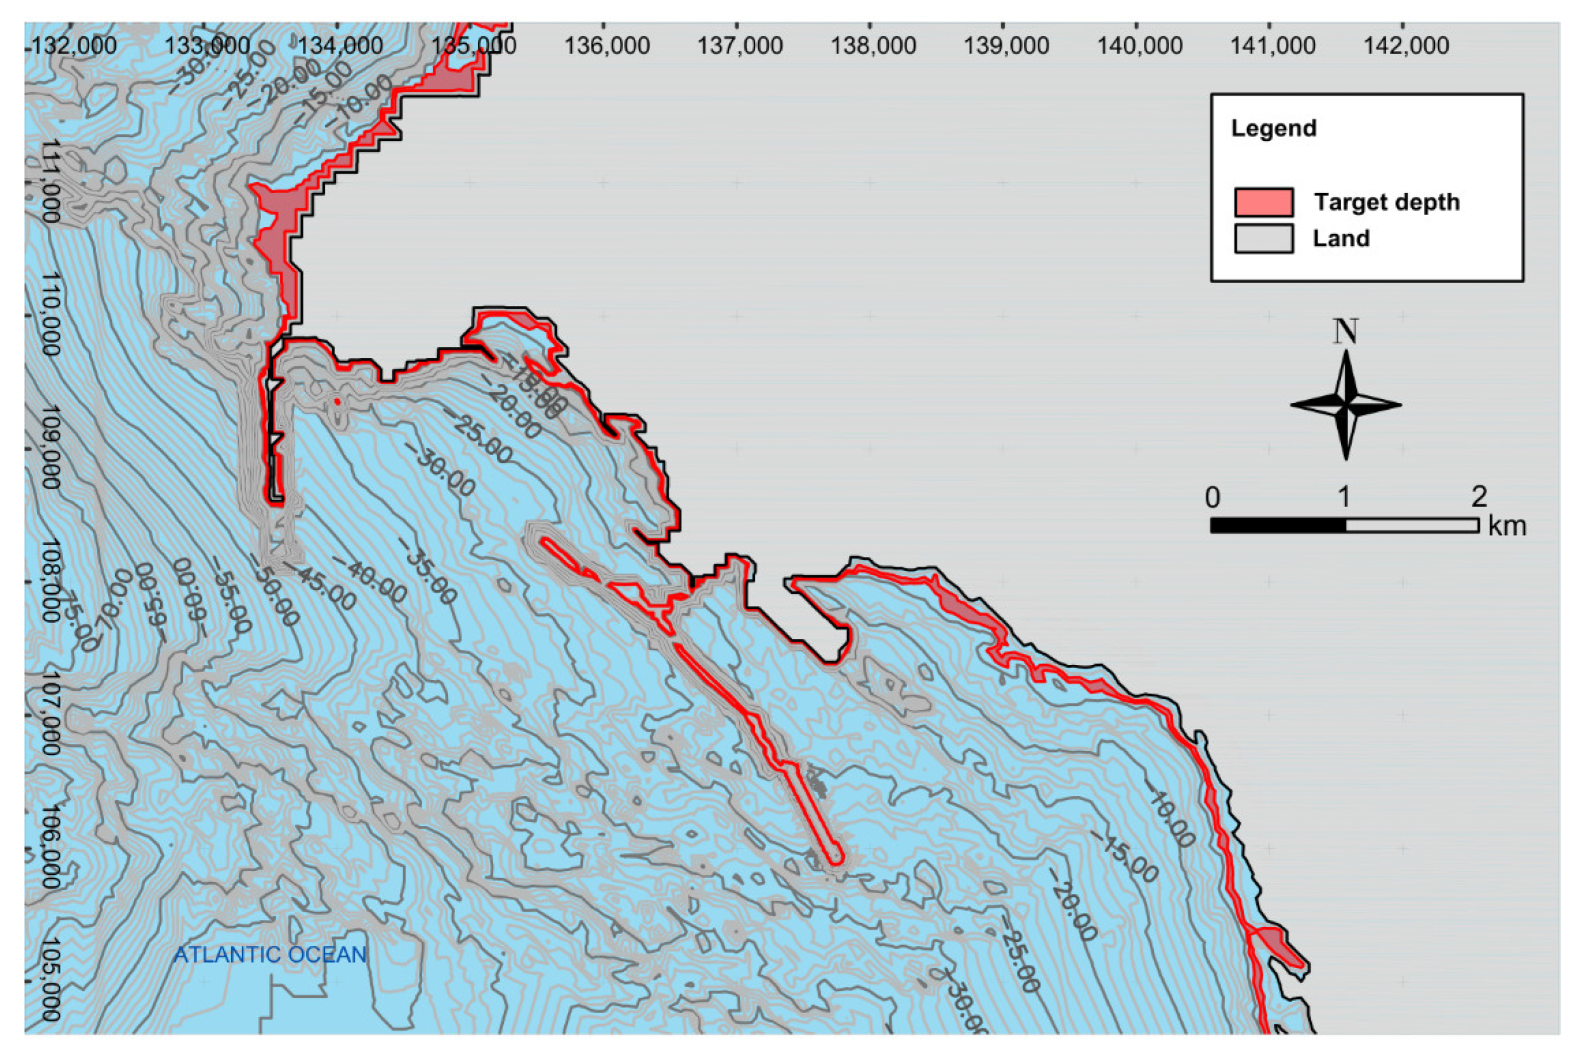
Figure 13.
Slope map of Port of Sines generated from the digital elevation model and on the bathymetry survey provided by APS. Lisboa Hayford Gauss IgeoE coordinate system, Tranverse Mercator projection.
Figure 13.
Slope map of Port of Sines generated from the digital elevation model and on the bathymetry survey provided by APS. Lisboa Hayford Gauss IgeoE coordinate system, Tranverse Mercator projection.
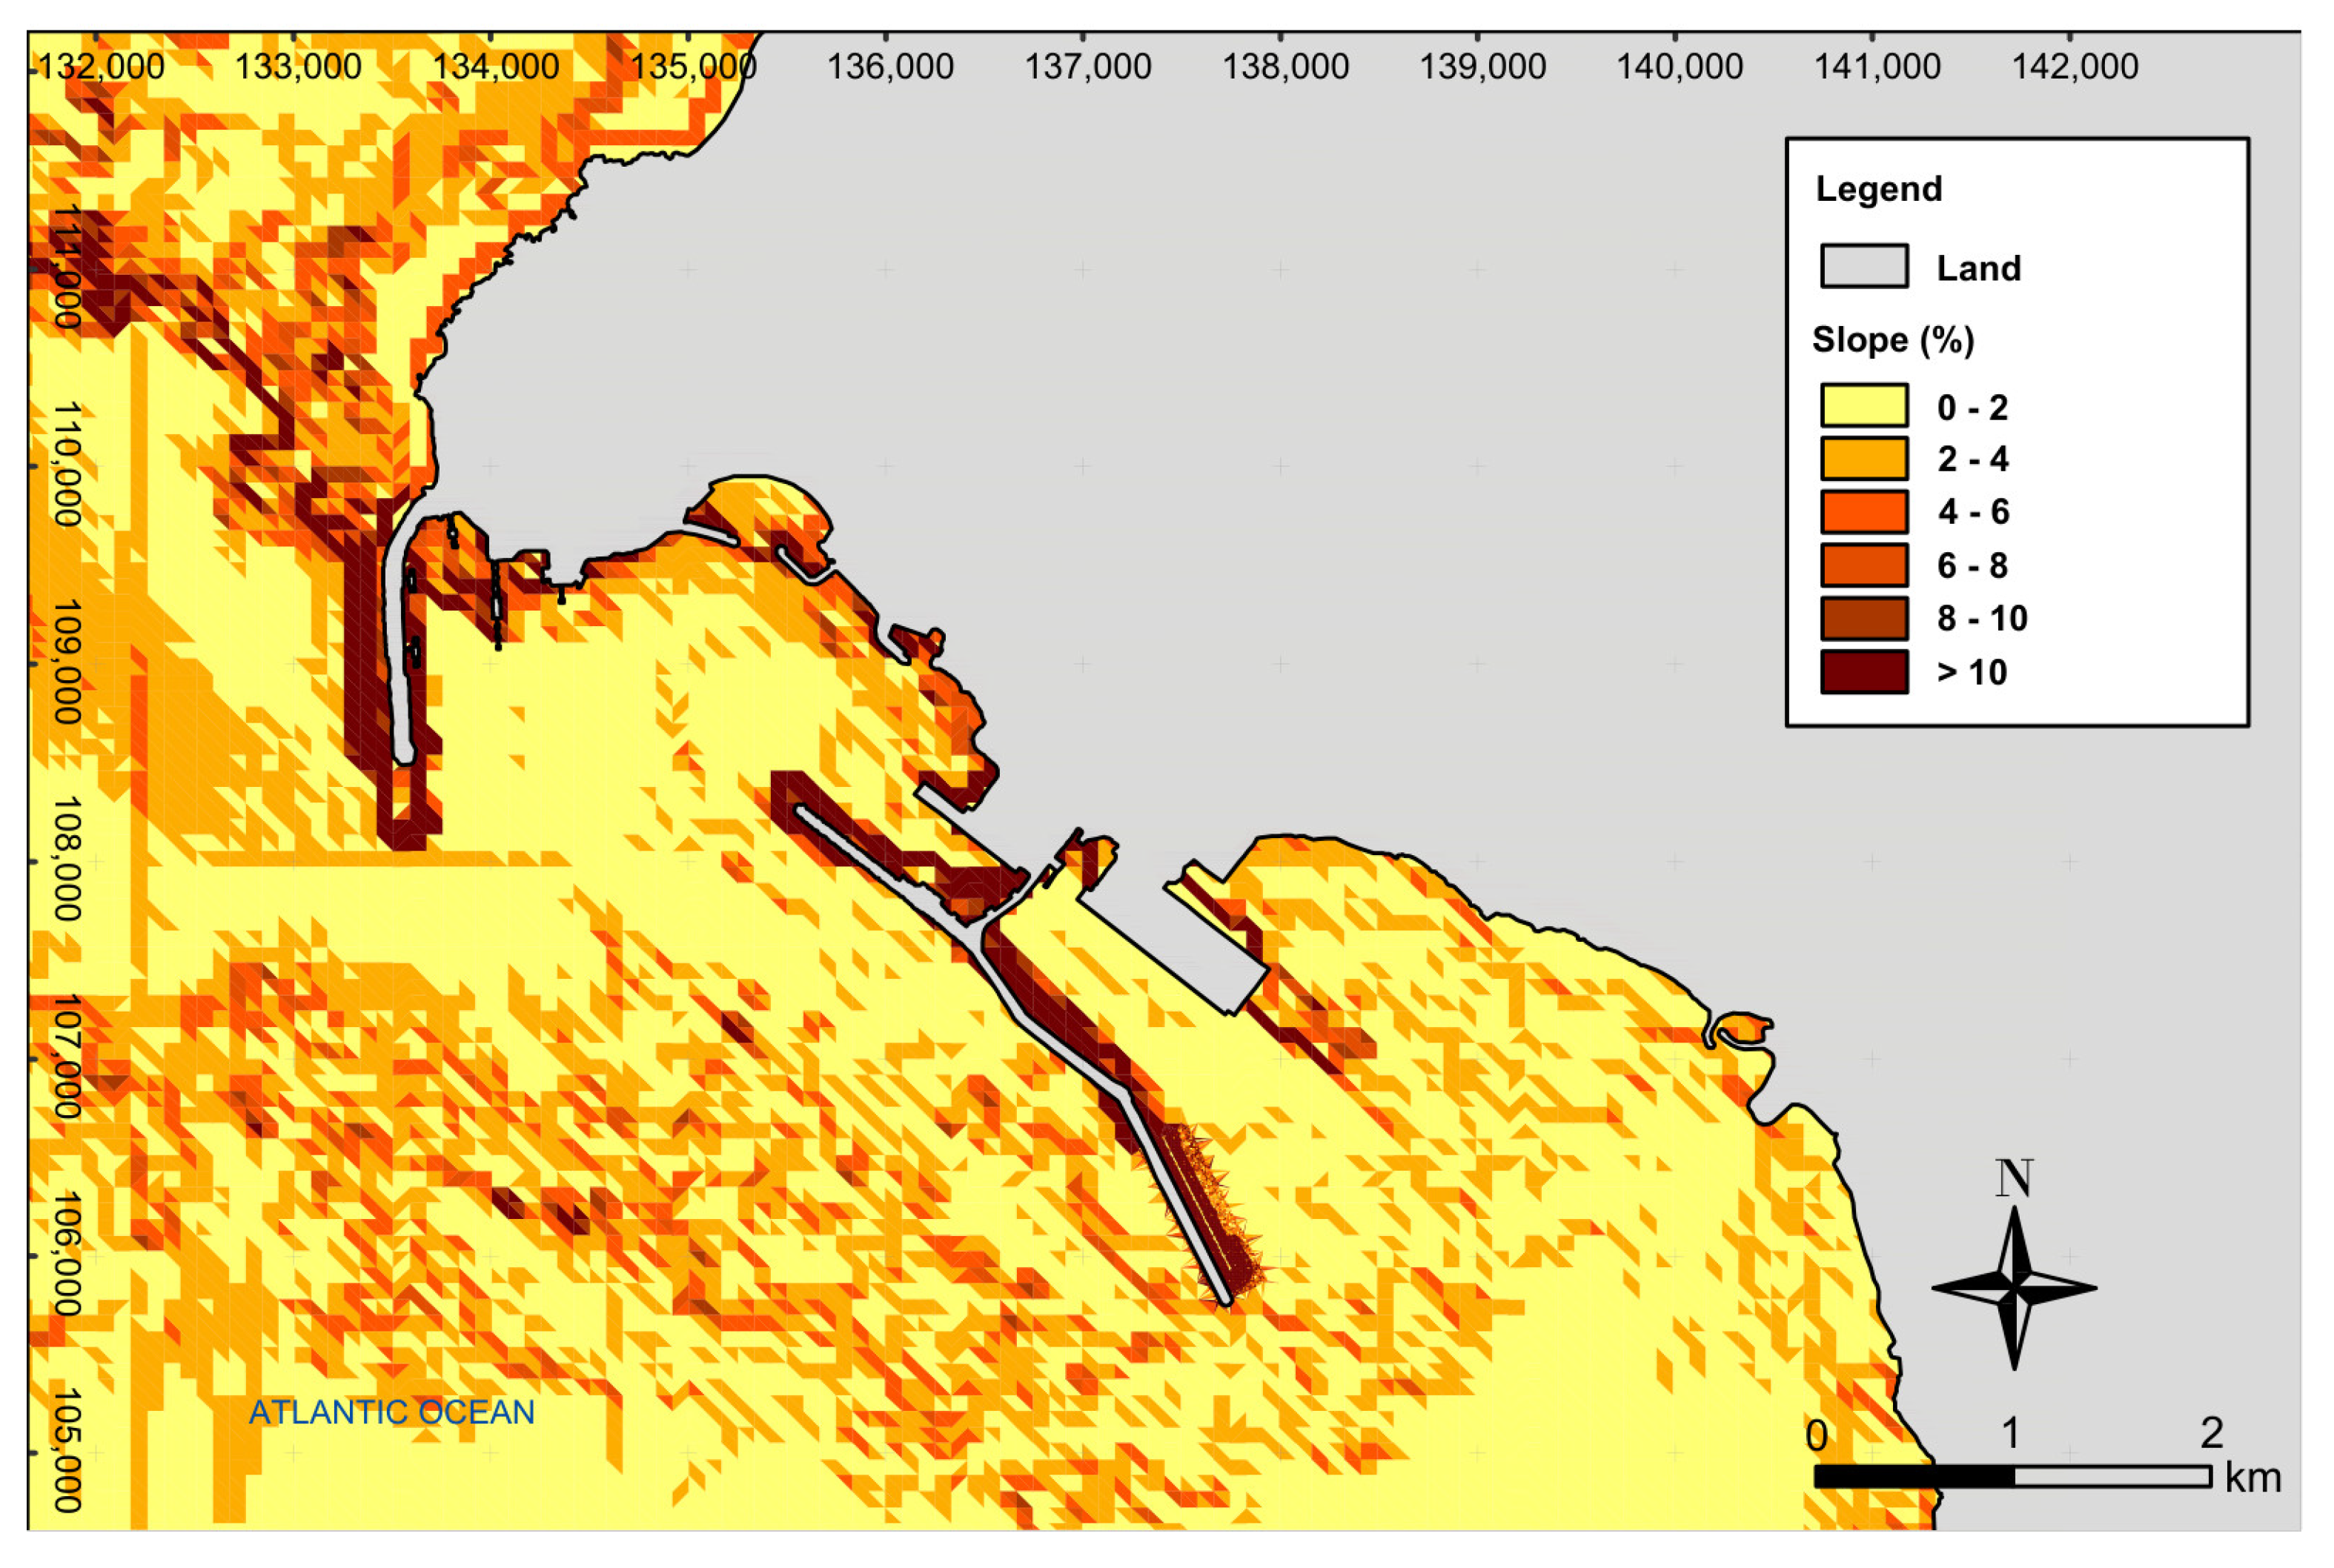
Figure 14.
Illustration of the rocky outcrops and sedimentary layers in Port of Sines adapted from [29] – Coordinate system: TM06-PT, Datum ETRS89.
Figure 14.
Illustration of the rocky outcrops and sedimentary layers in Port of Sines adapted from [29] – Coordinate system: TM06-PT, Datum ETRS89.
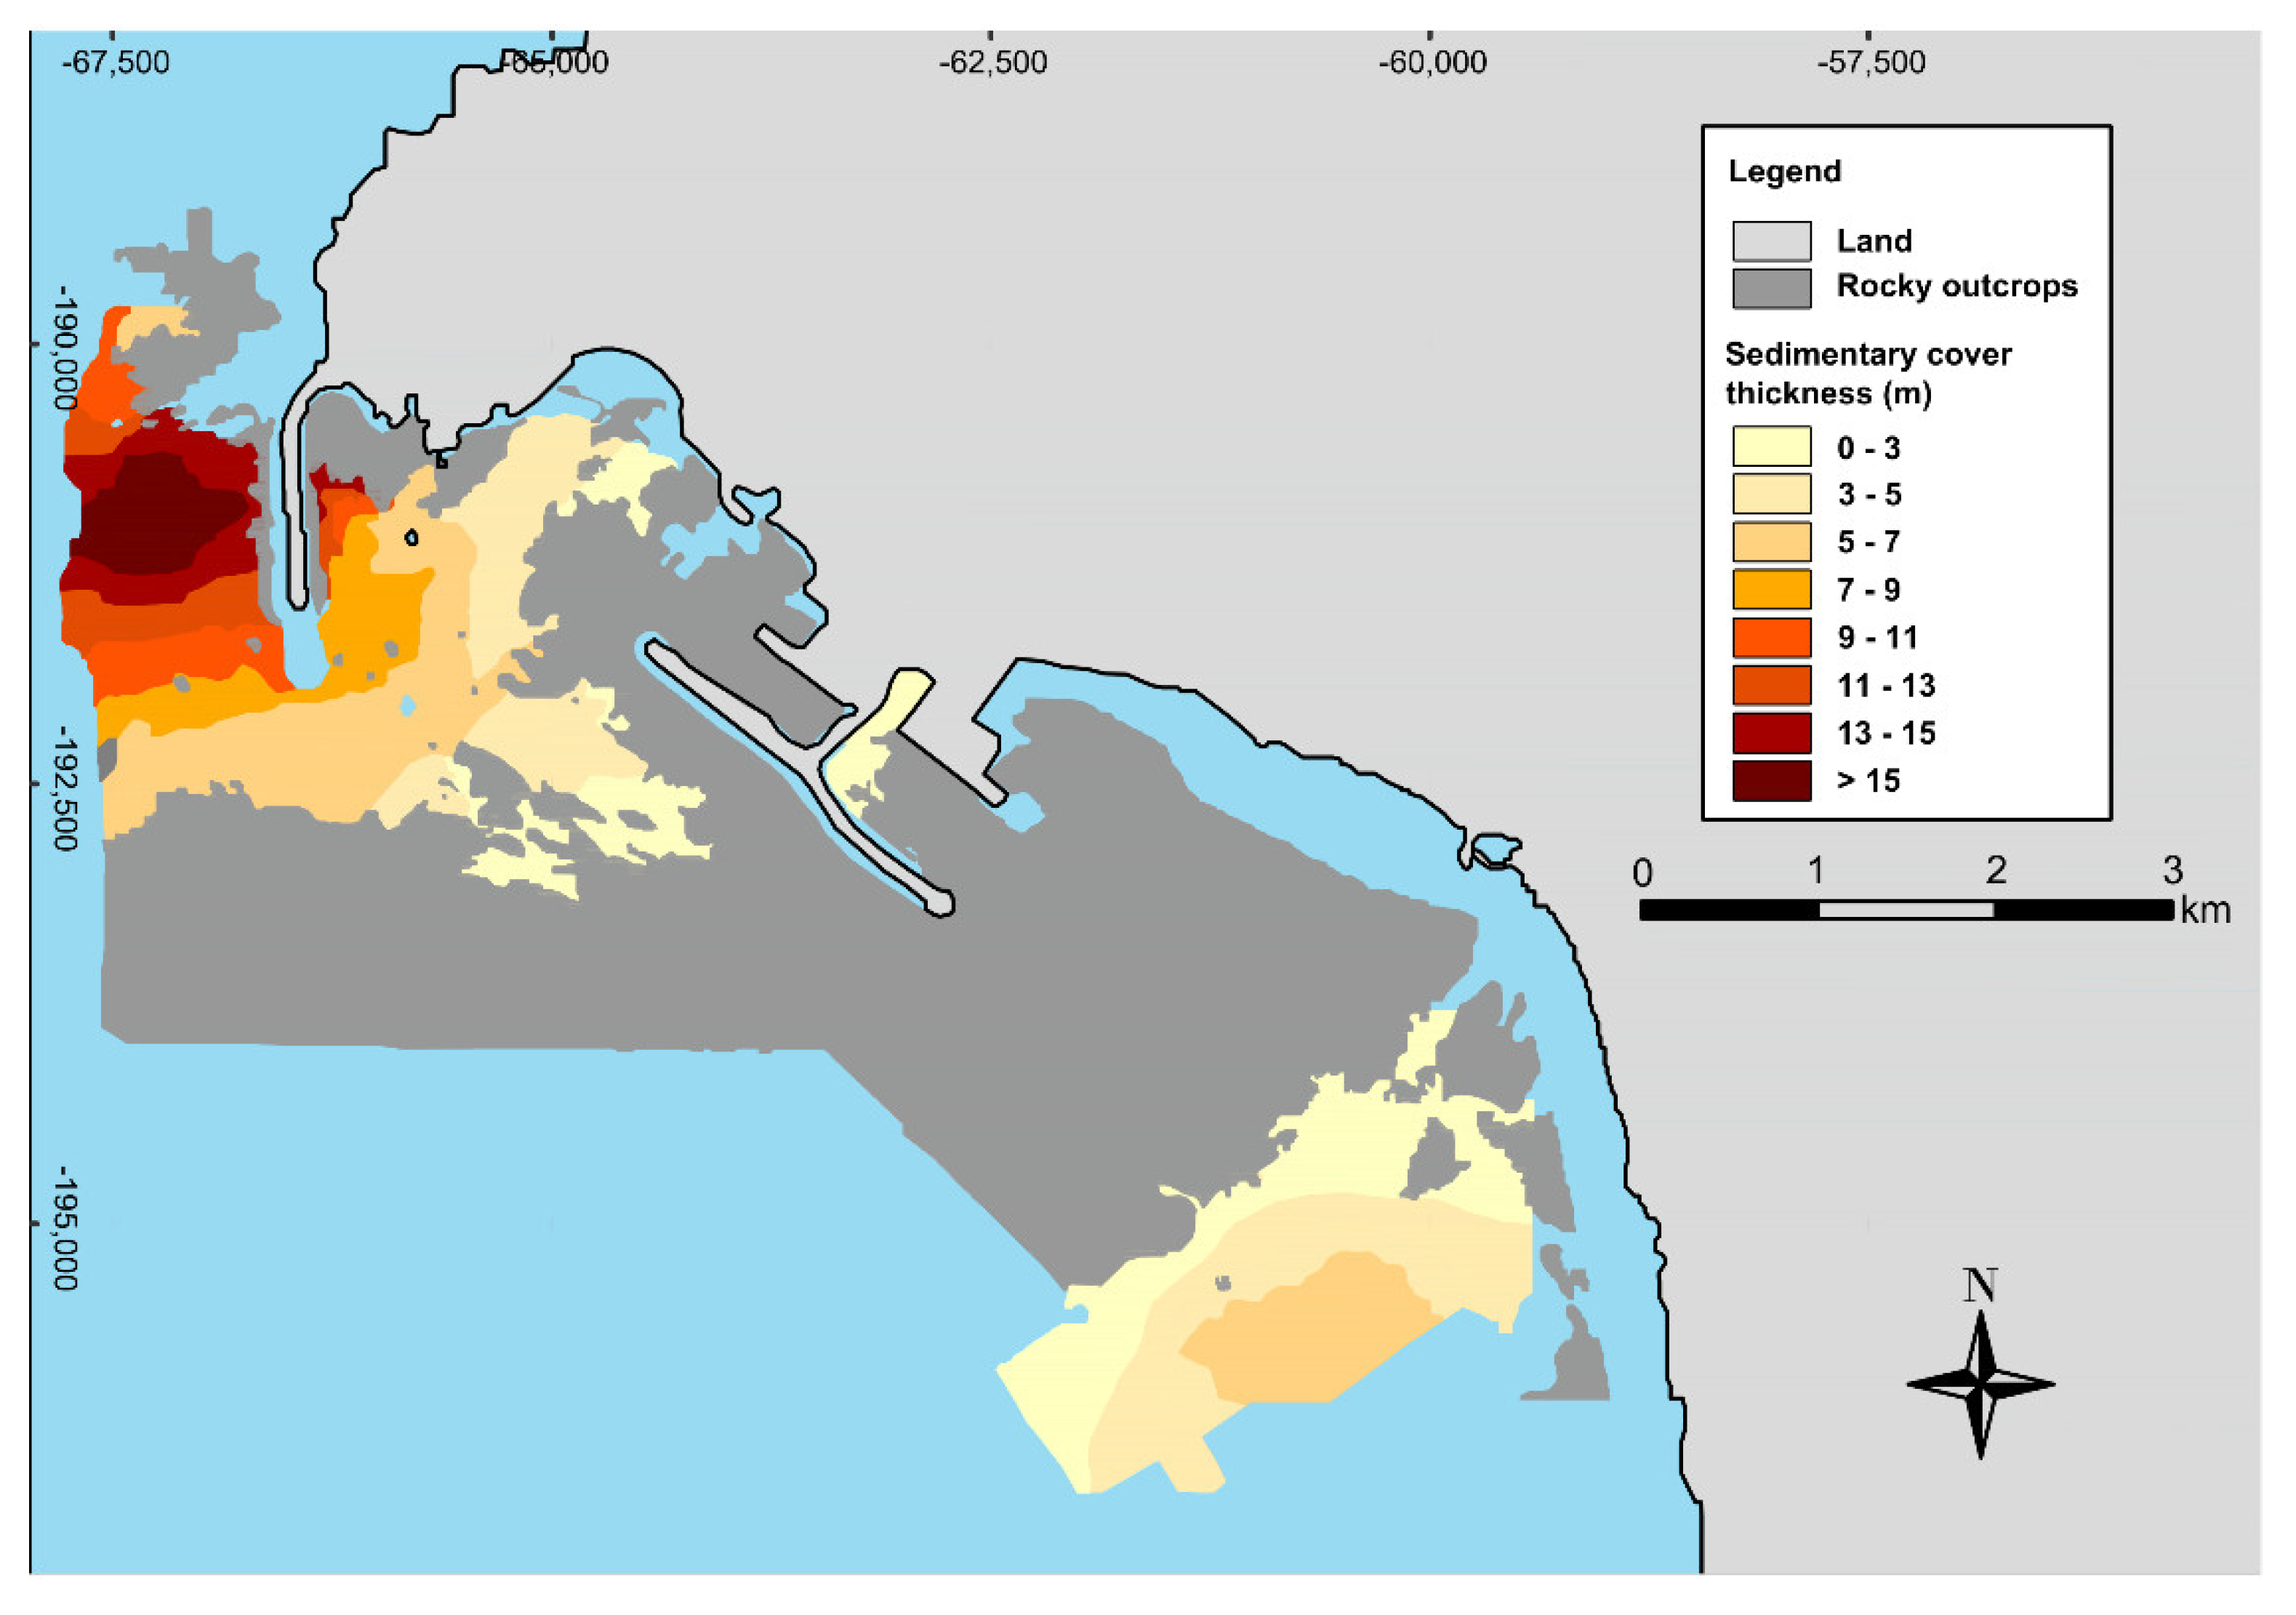
Figure 15.
Wave directional distribution at Sines’ buoy for from May to October (2017 - 2022).
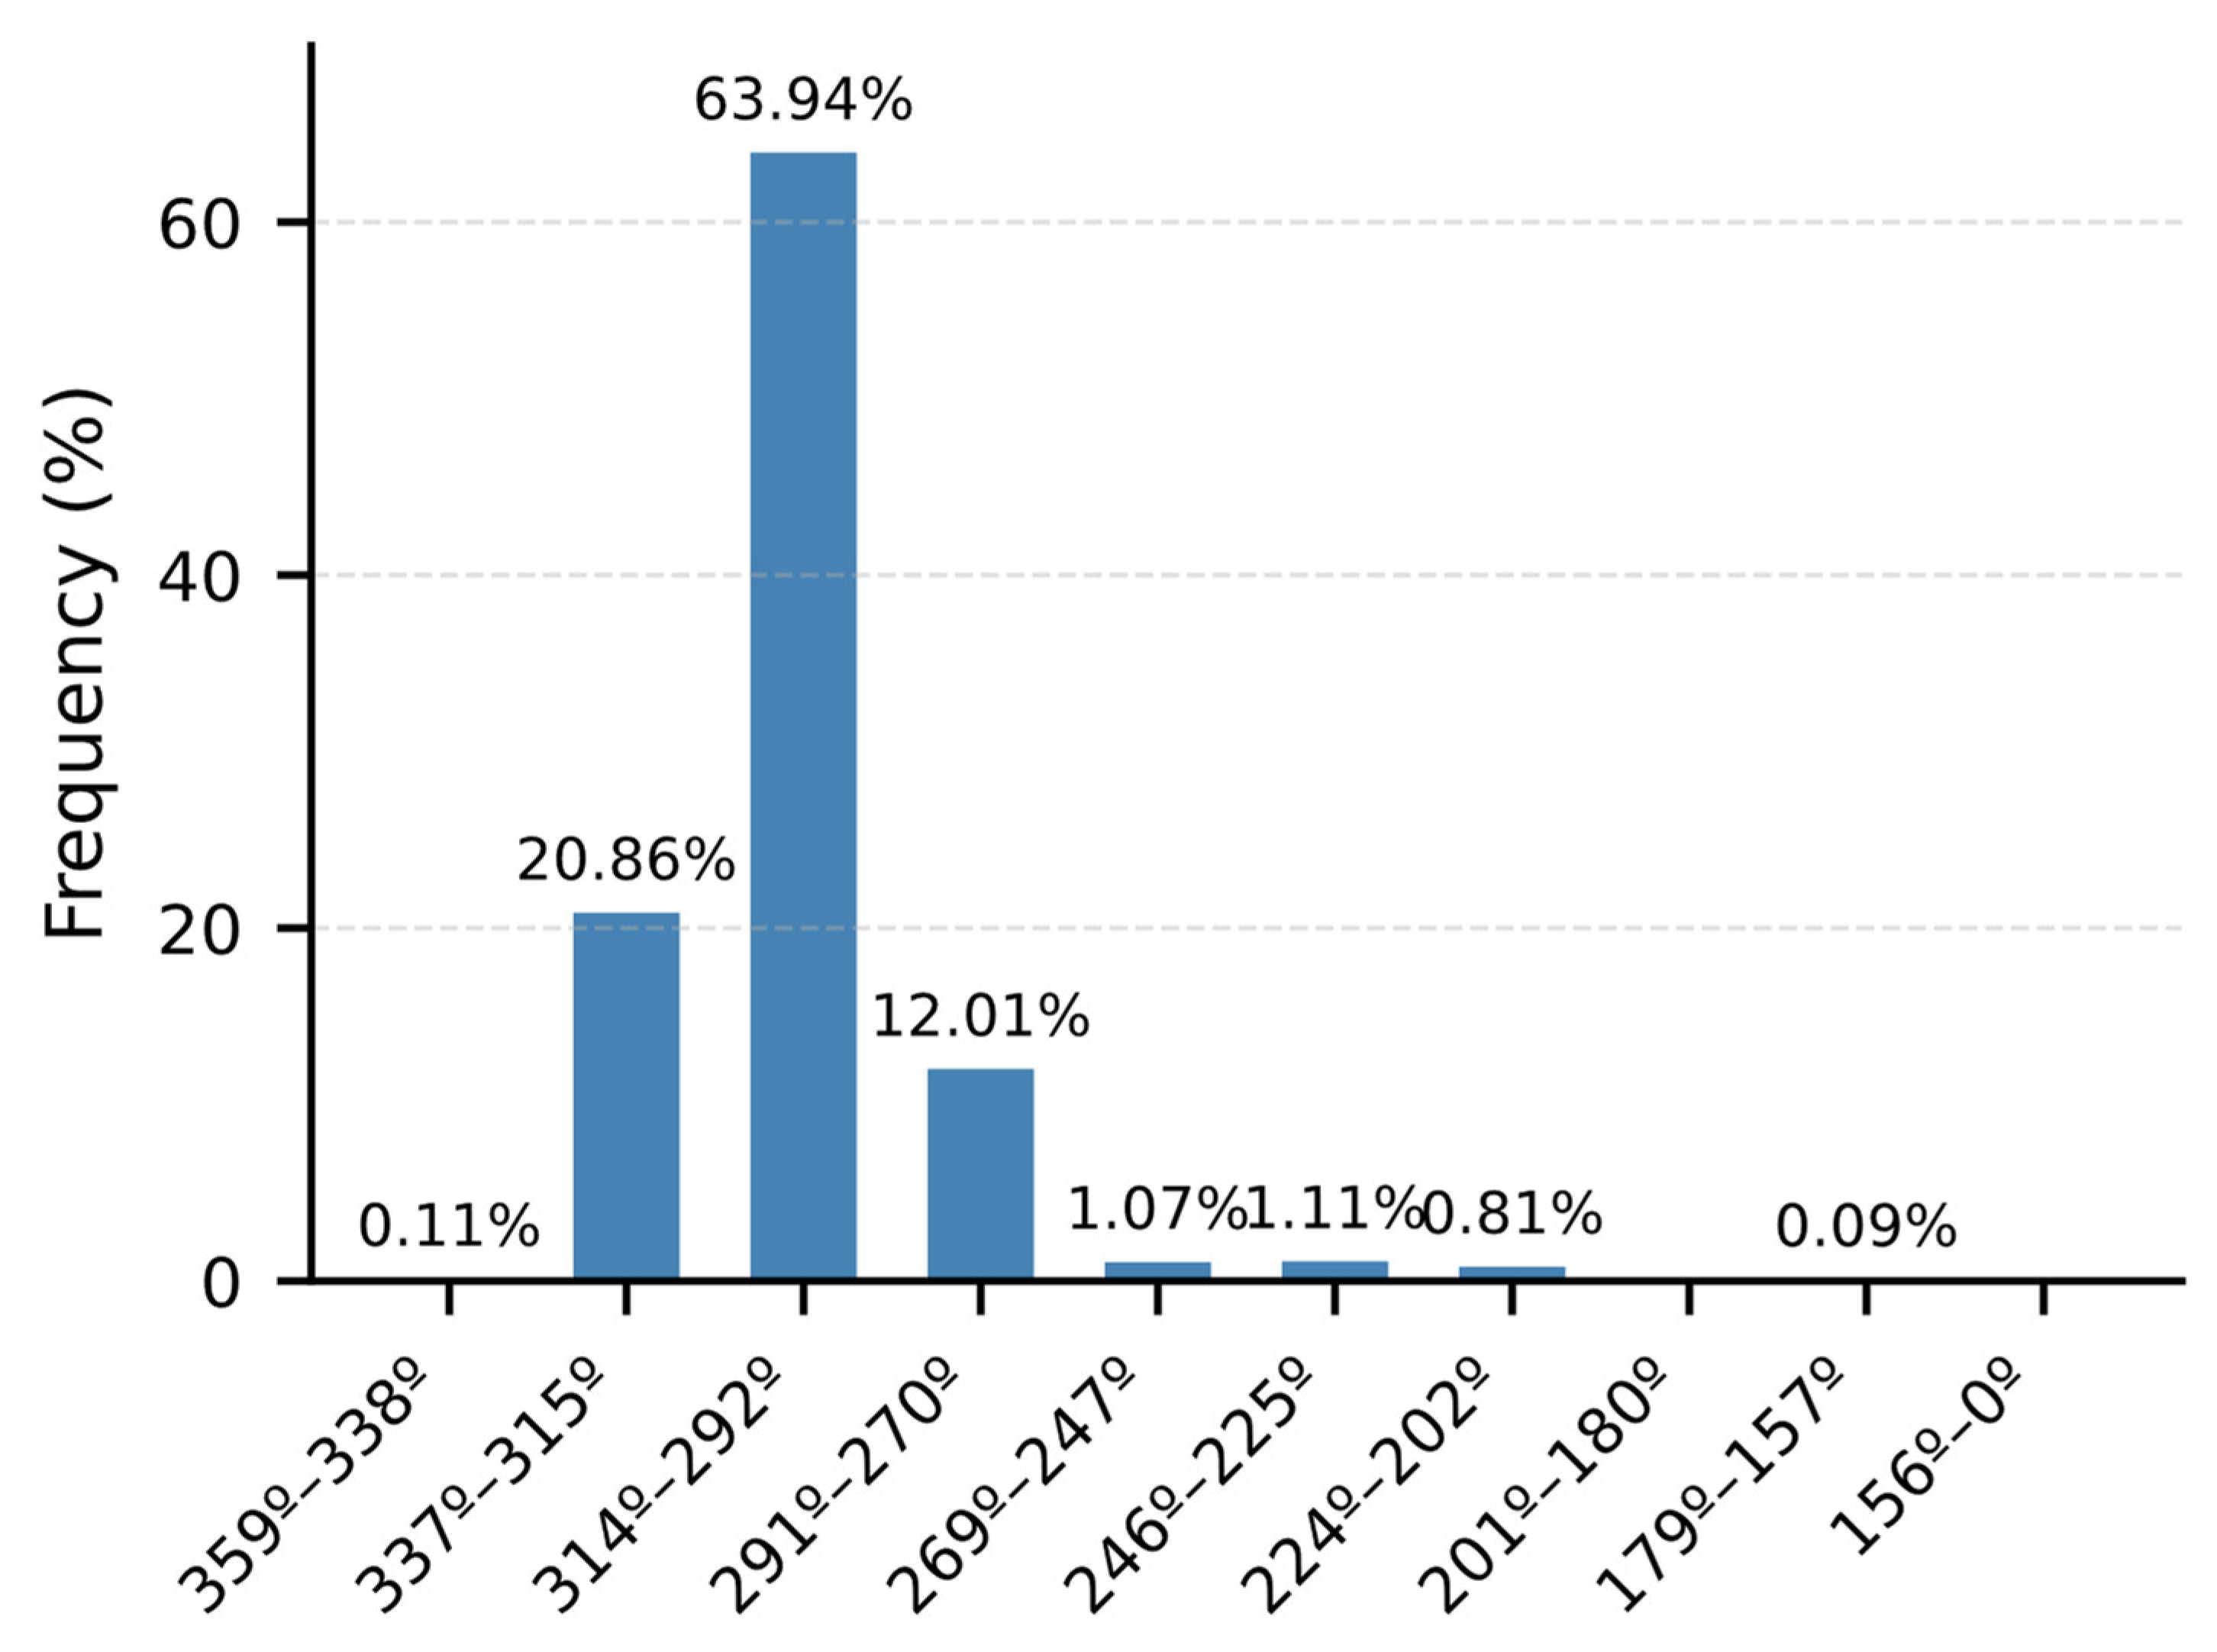
Figure 16.
Numerical simulation of sea state conditions within the Port of Sines. Wave directions are represented by vectors, while significant wave heights are shown using a chromatographic color scale. Results are presented for (A) Scenario 3 and (B) Scenario 5 (see Table 2).
Figure 16.
Numerical simulation of sea state conditions within the Port of Sines. Wave directions are represented by vectors, while significant wave heights are shown using a chromatographic color scale. Results are presented for (A) Scenario 3 and (B) Scenario 5 (see Table 2).
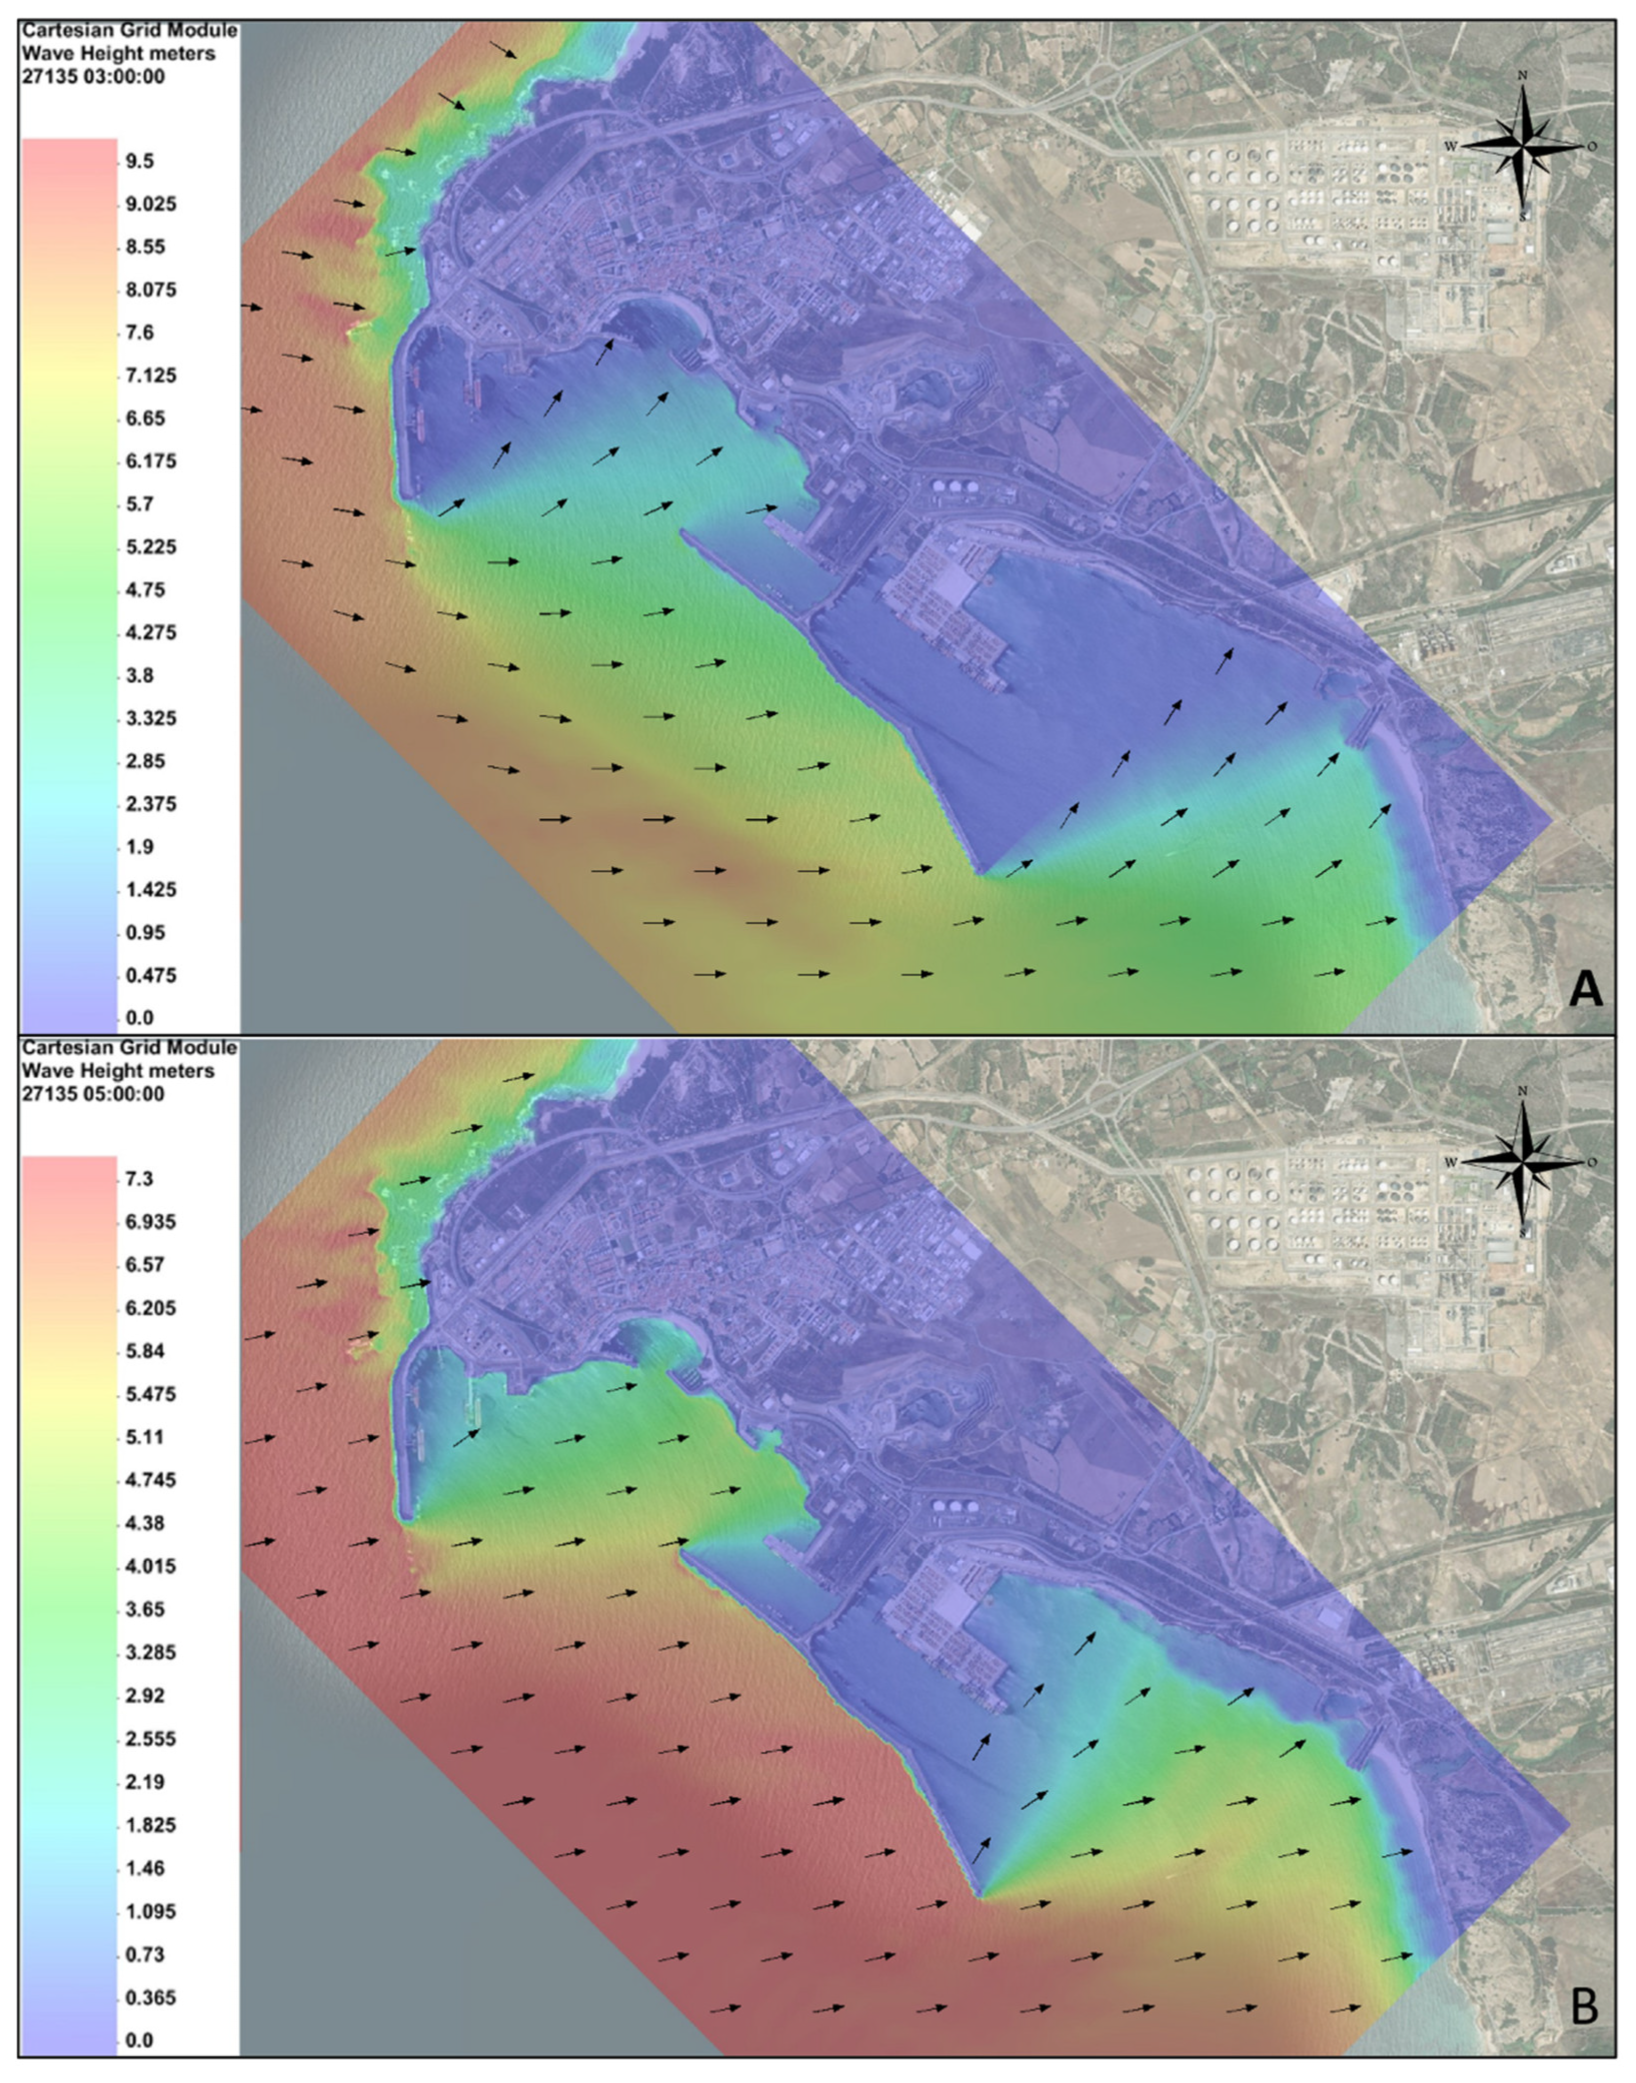
Figure 17.
Numerical simulation of sea state conditions within the Port of Sines. Wave directions are represented by vectors, while significant wave heights are shown using a chromatographic color scale. Results are presented for (A) Scenario 10 and (B) Scenario 12 (see Table 2).
Figure 17.
Numerical simulation of sea state conditions within the Port of Sines. Wave directions are represented by vectors, while significant wave heights are shown using a chromatographic color scale. Results are presented for (A) Scenario 10 and (B) Scenario 12 (see Table 2).
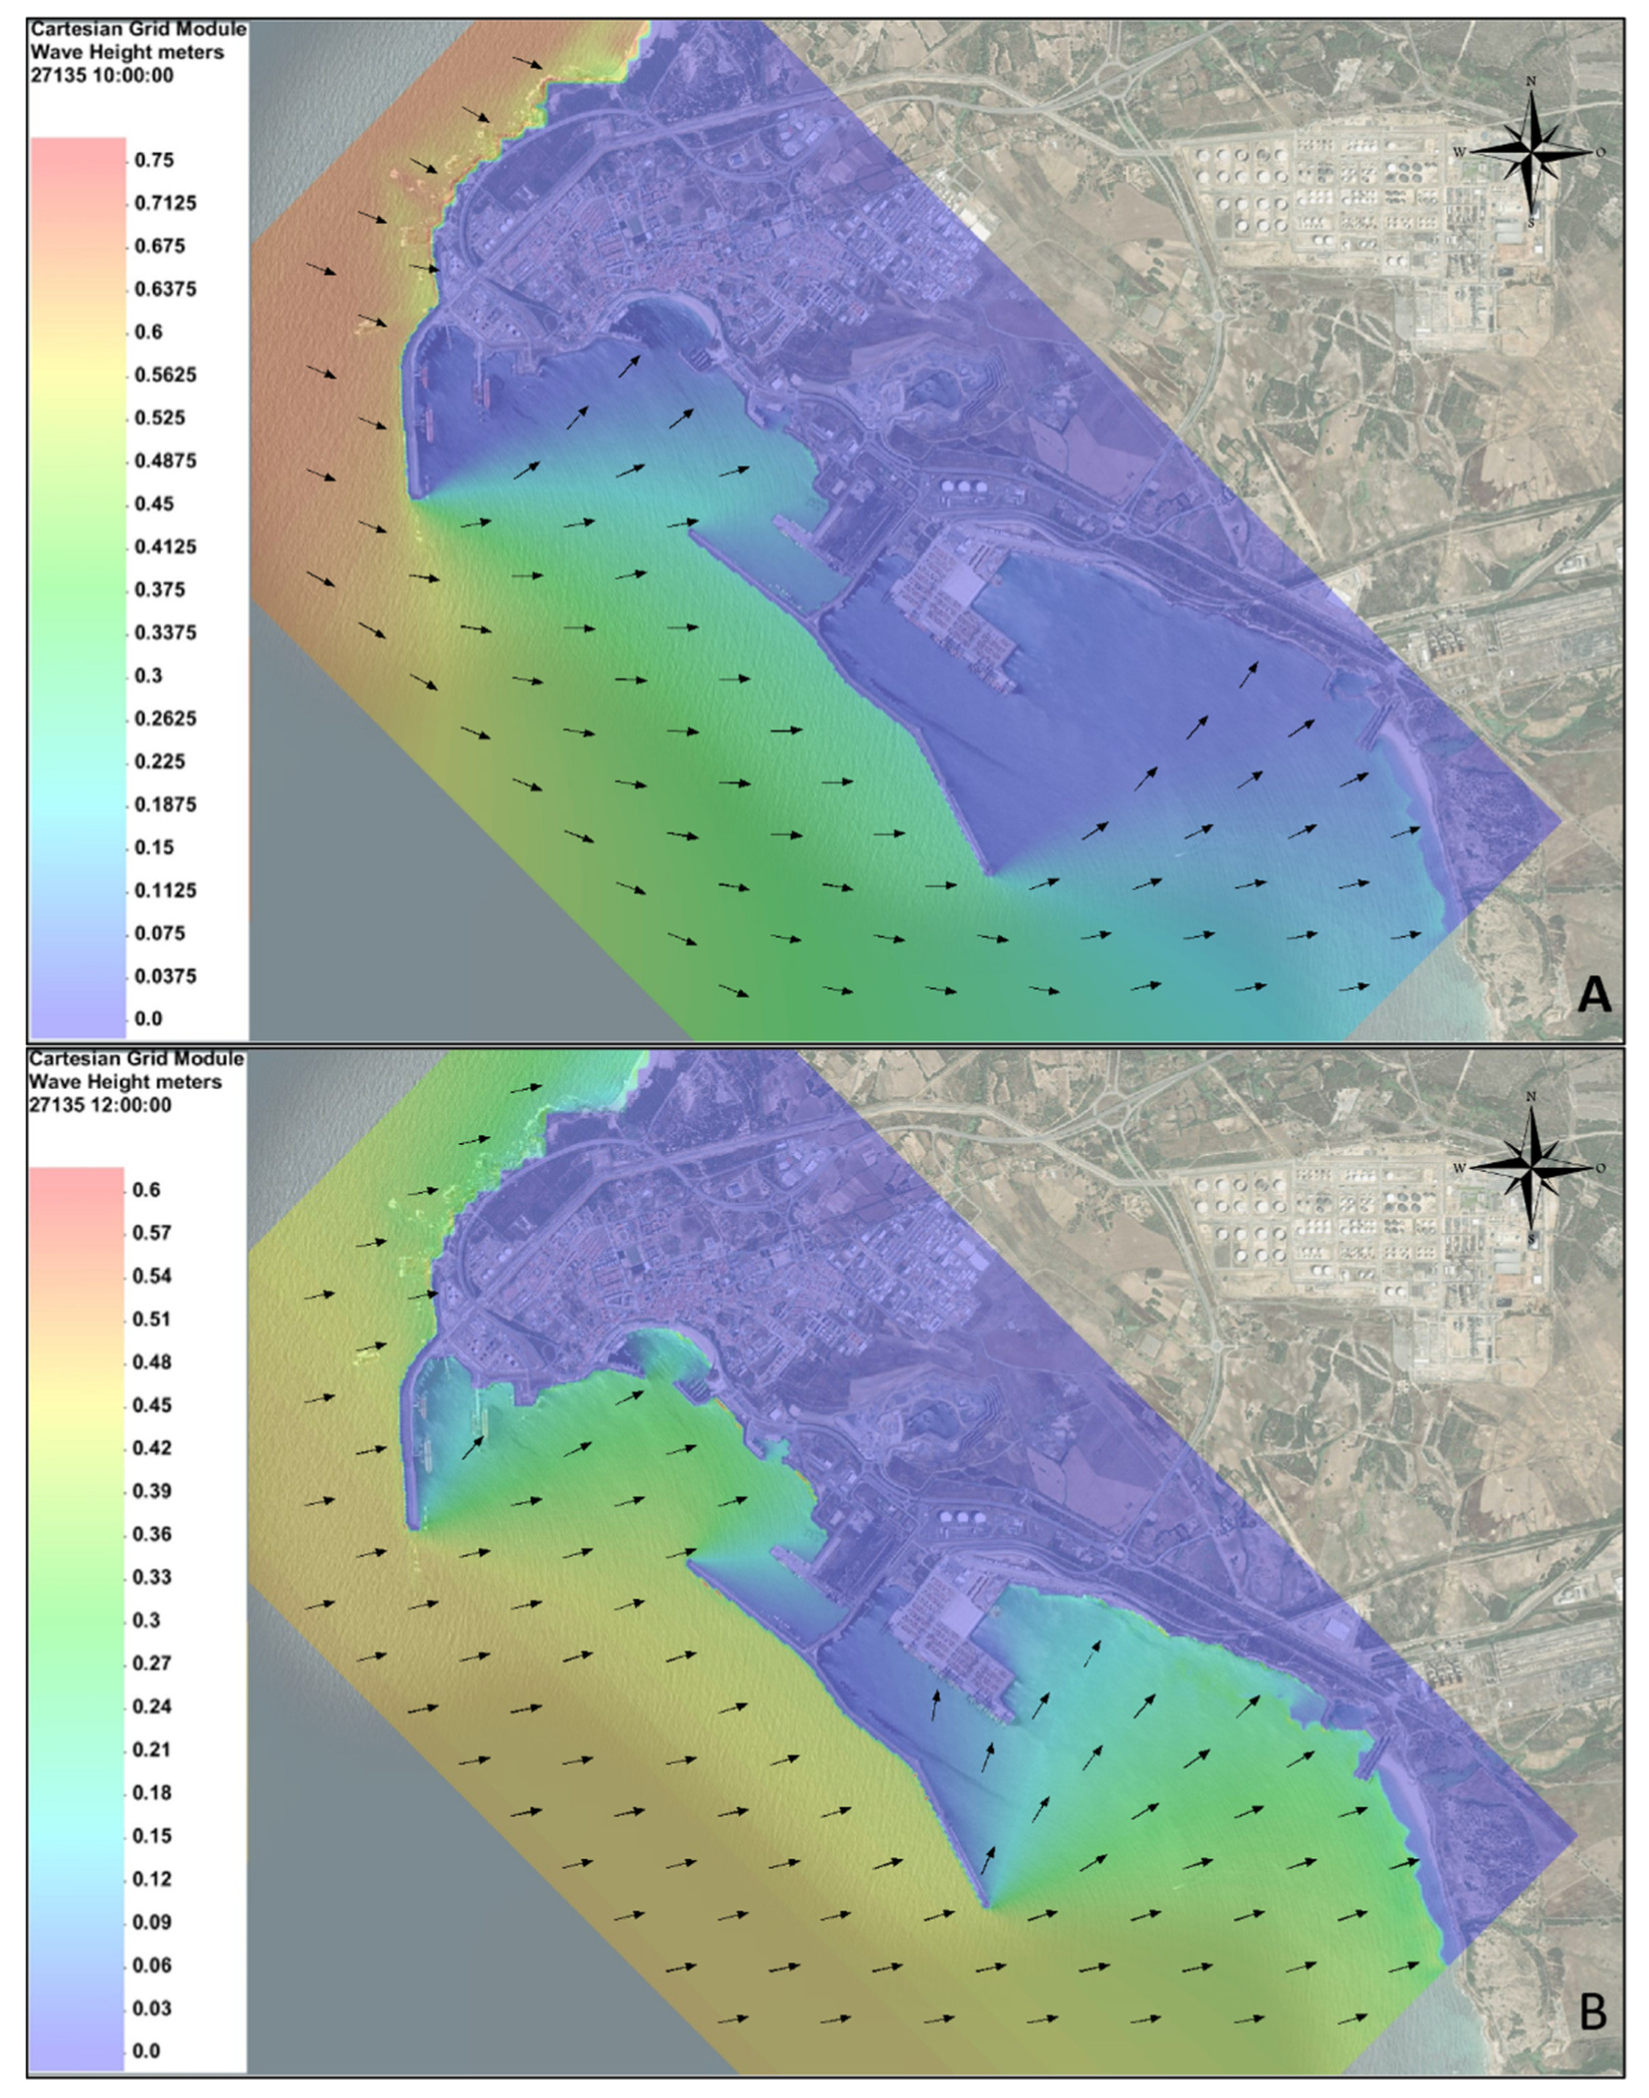
Figure 18.
Global constrains map (navigation, fishing, port infrastructure and expansion plan) of Port of Sines, based on APS mapping data and [26]. Lisboa Hayford Gauss IgeoE coordinate system, Tranverse Mercator projection.
Figure 18.
Global constrains map (navigation, fishing, port infrastructure and expansion plan) of Port of Sines, based on APS mapping data and [26]. Lisboa Hayford Gauss IgeoE coordinate system, Tranverse Mercator projection.
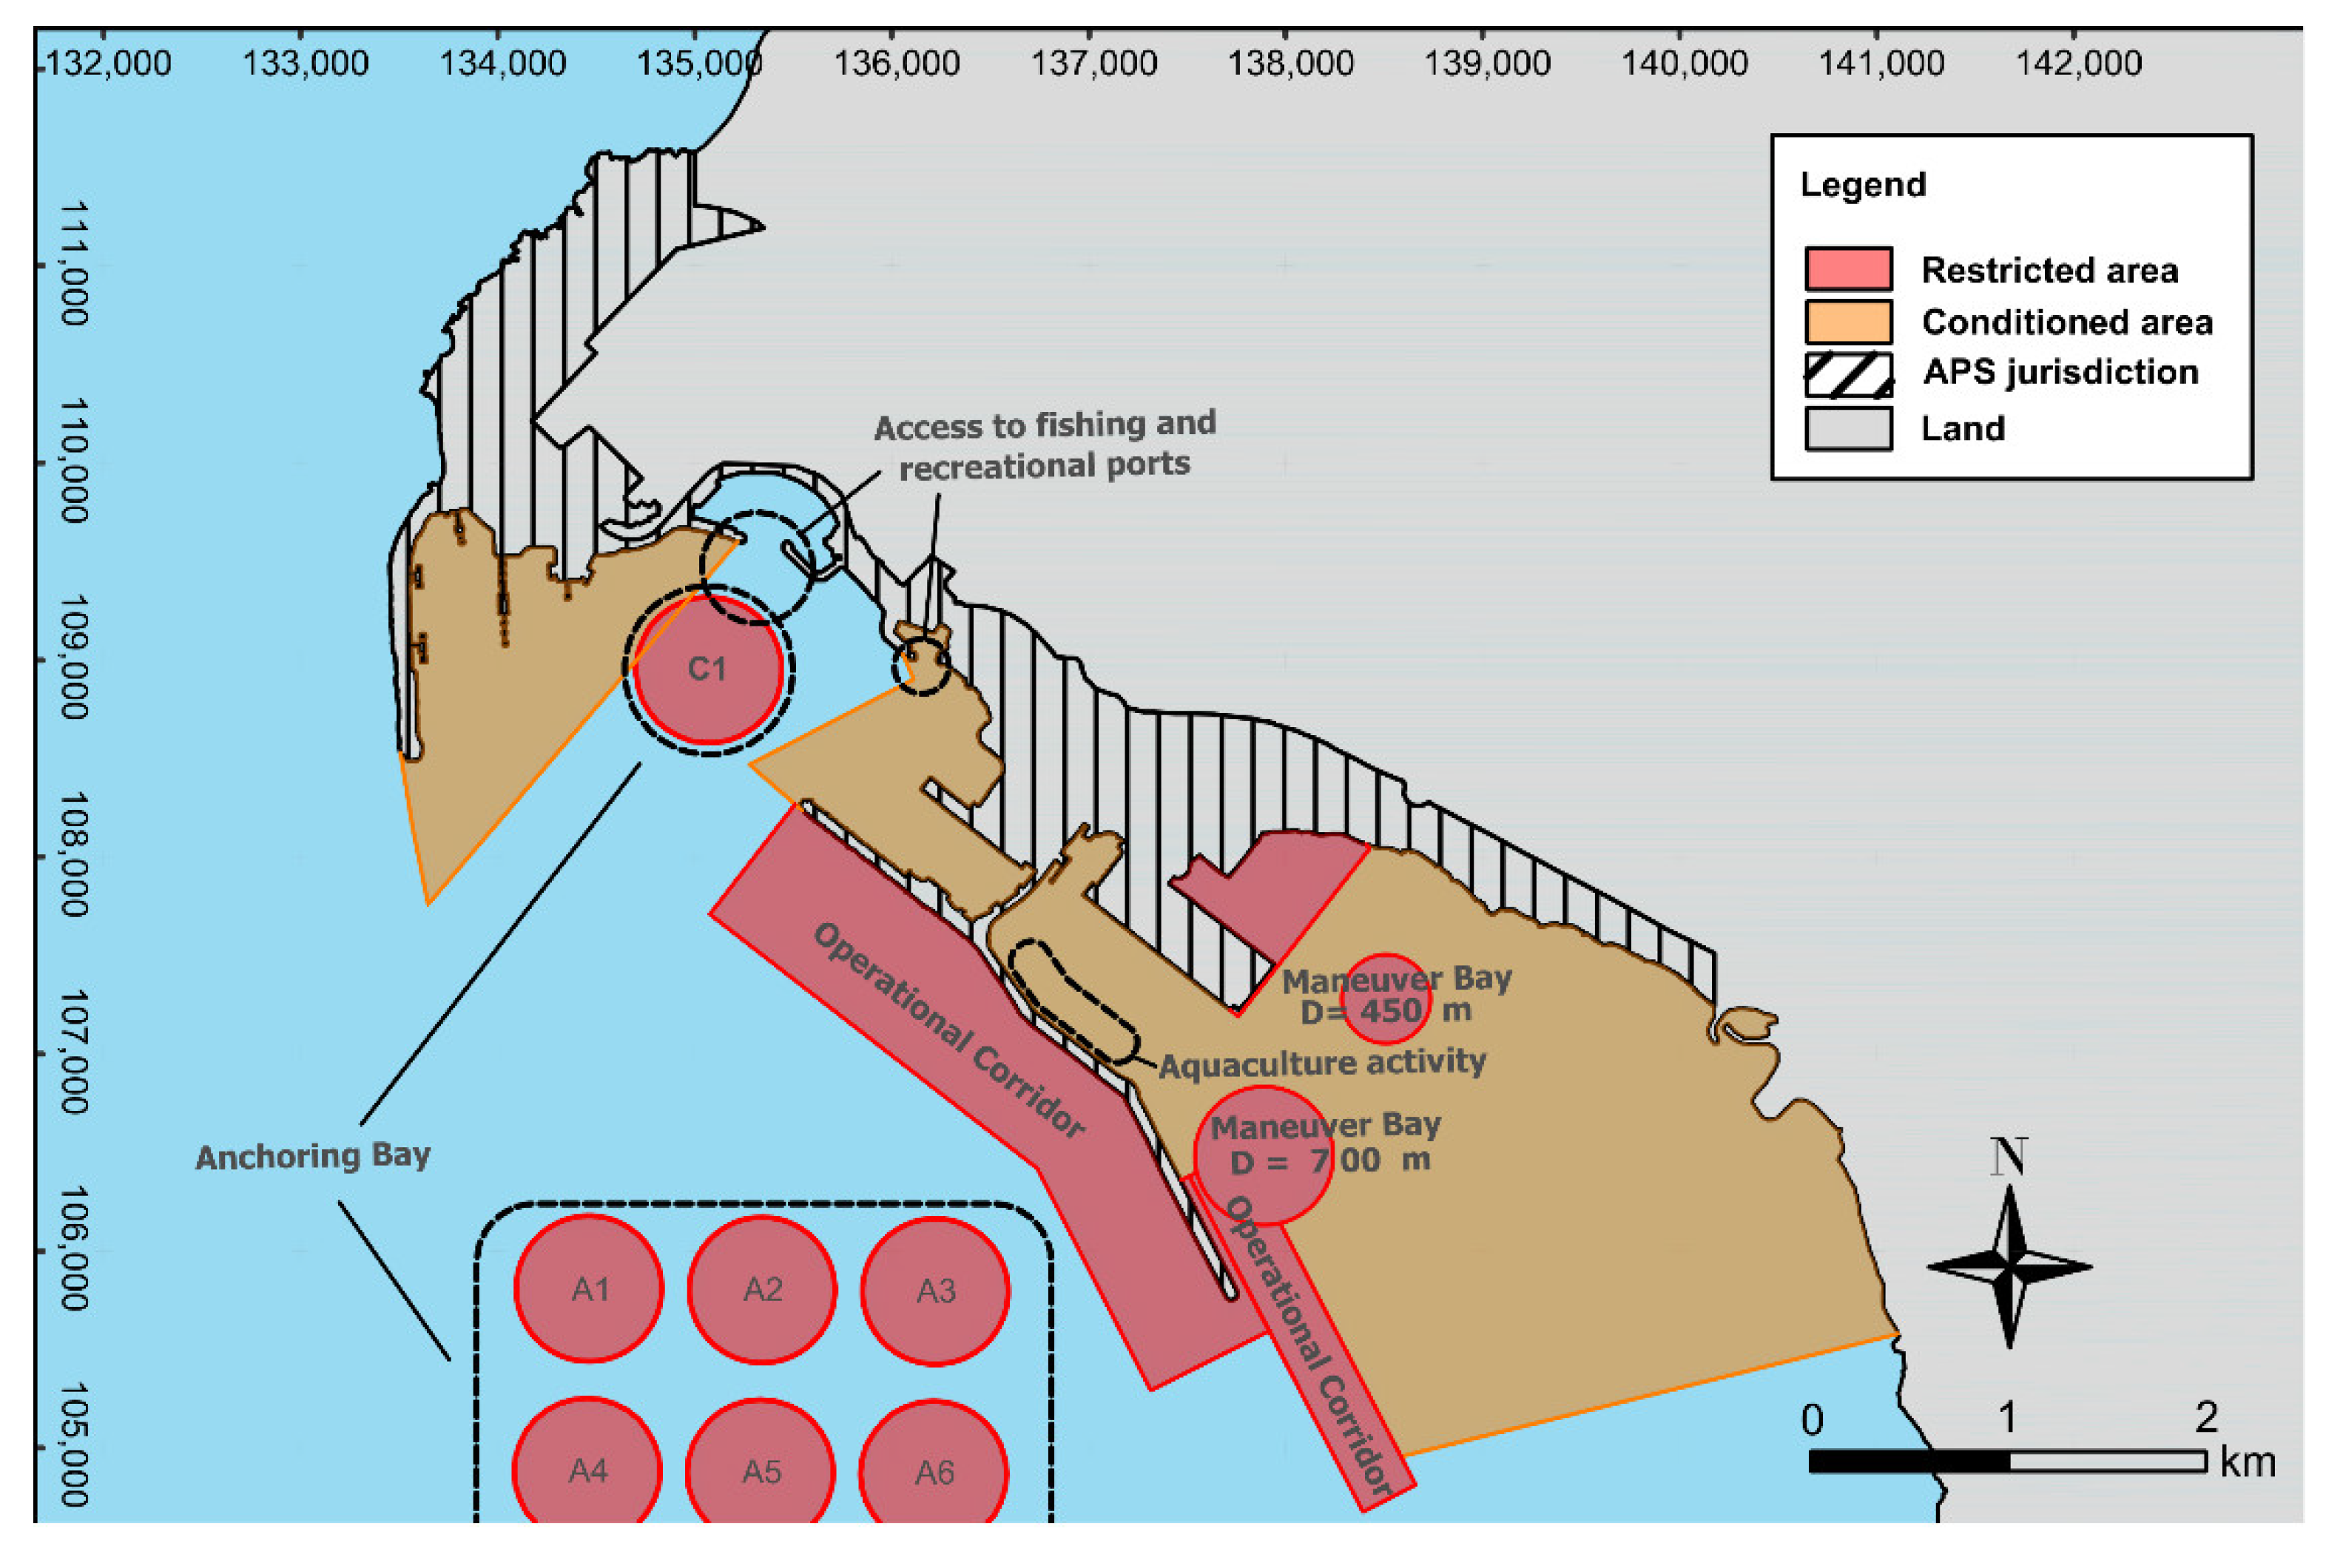
Figure 19.
Possible Test Sites adapted from APS mapping data. Lisboa Hayford Gauss IgeoE coordinate system, Tranverse Mercator projection.
Figure 19.
Possible Test Sites adapted from APS mapping data. Lisboa Hayford Gauss IgeoE coordinate system, Tranverse Mercator projection.
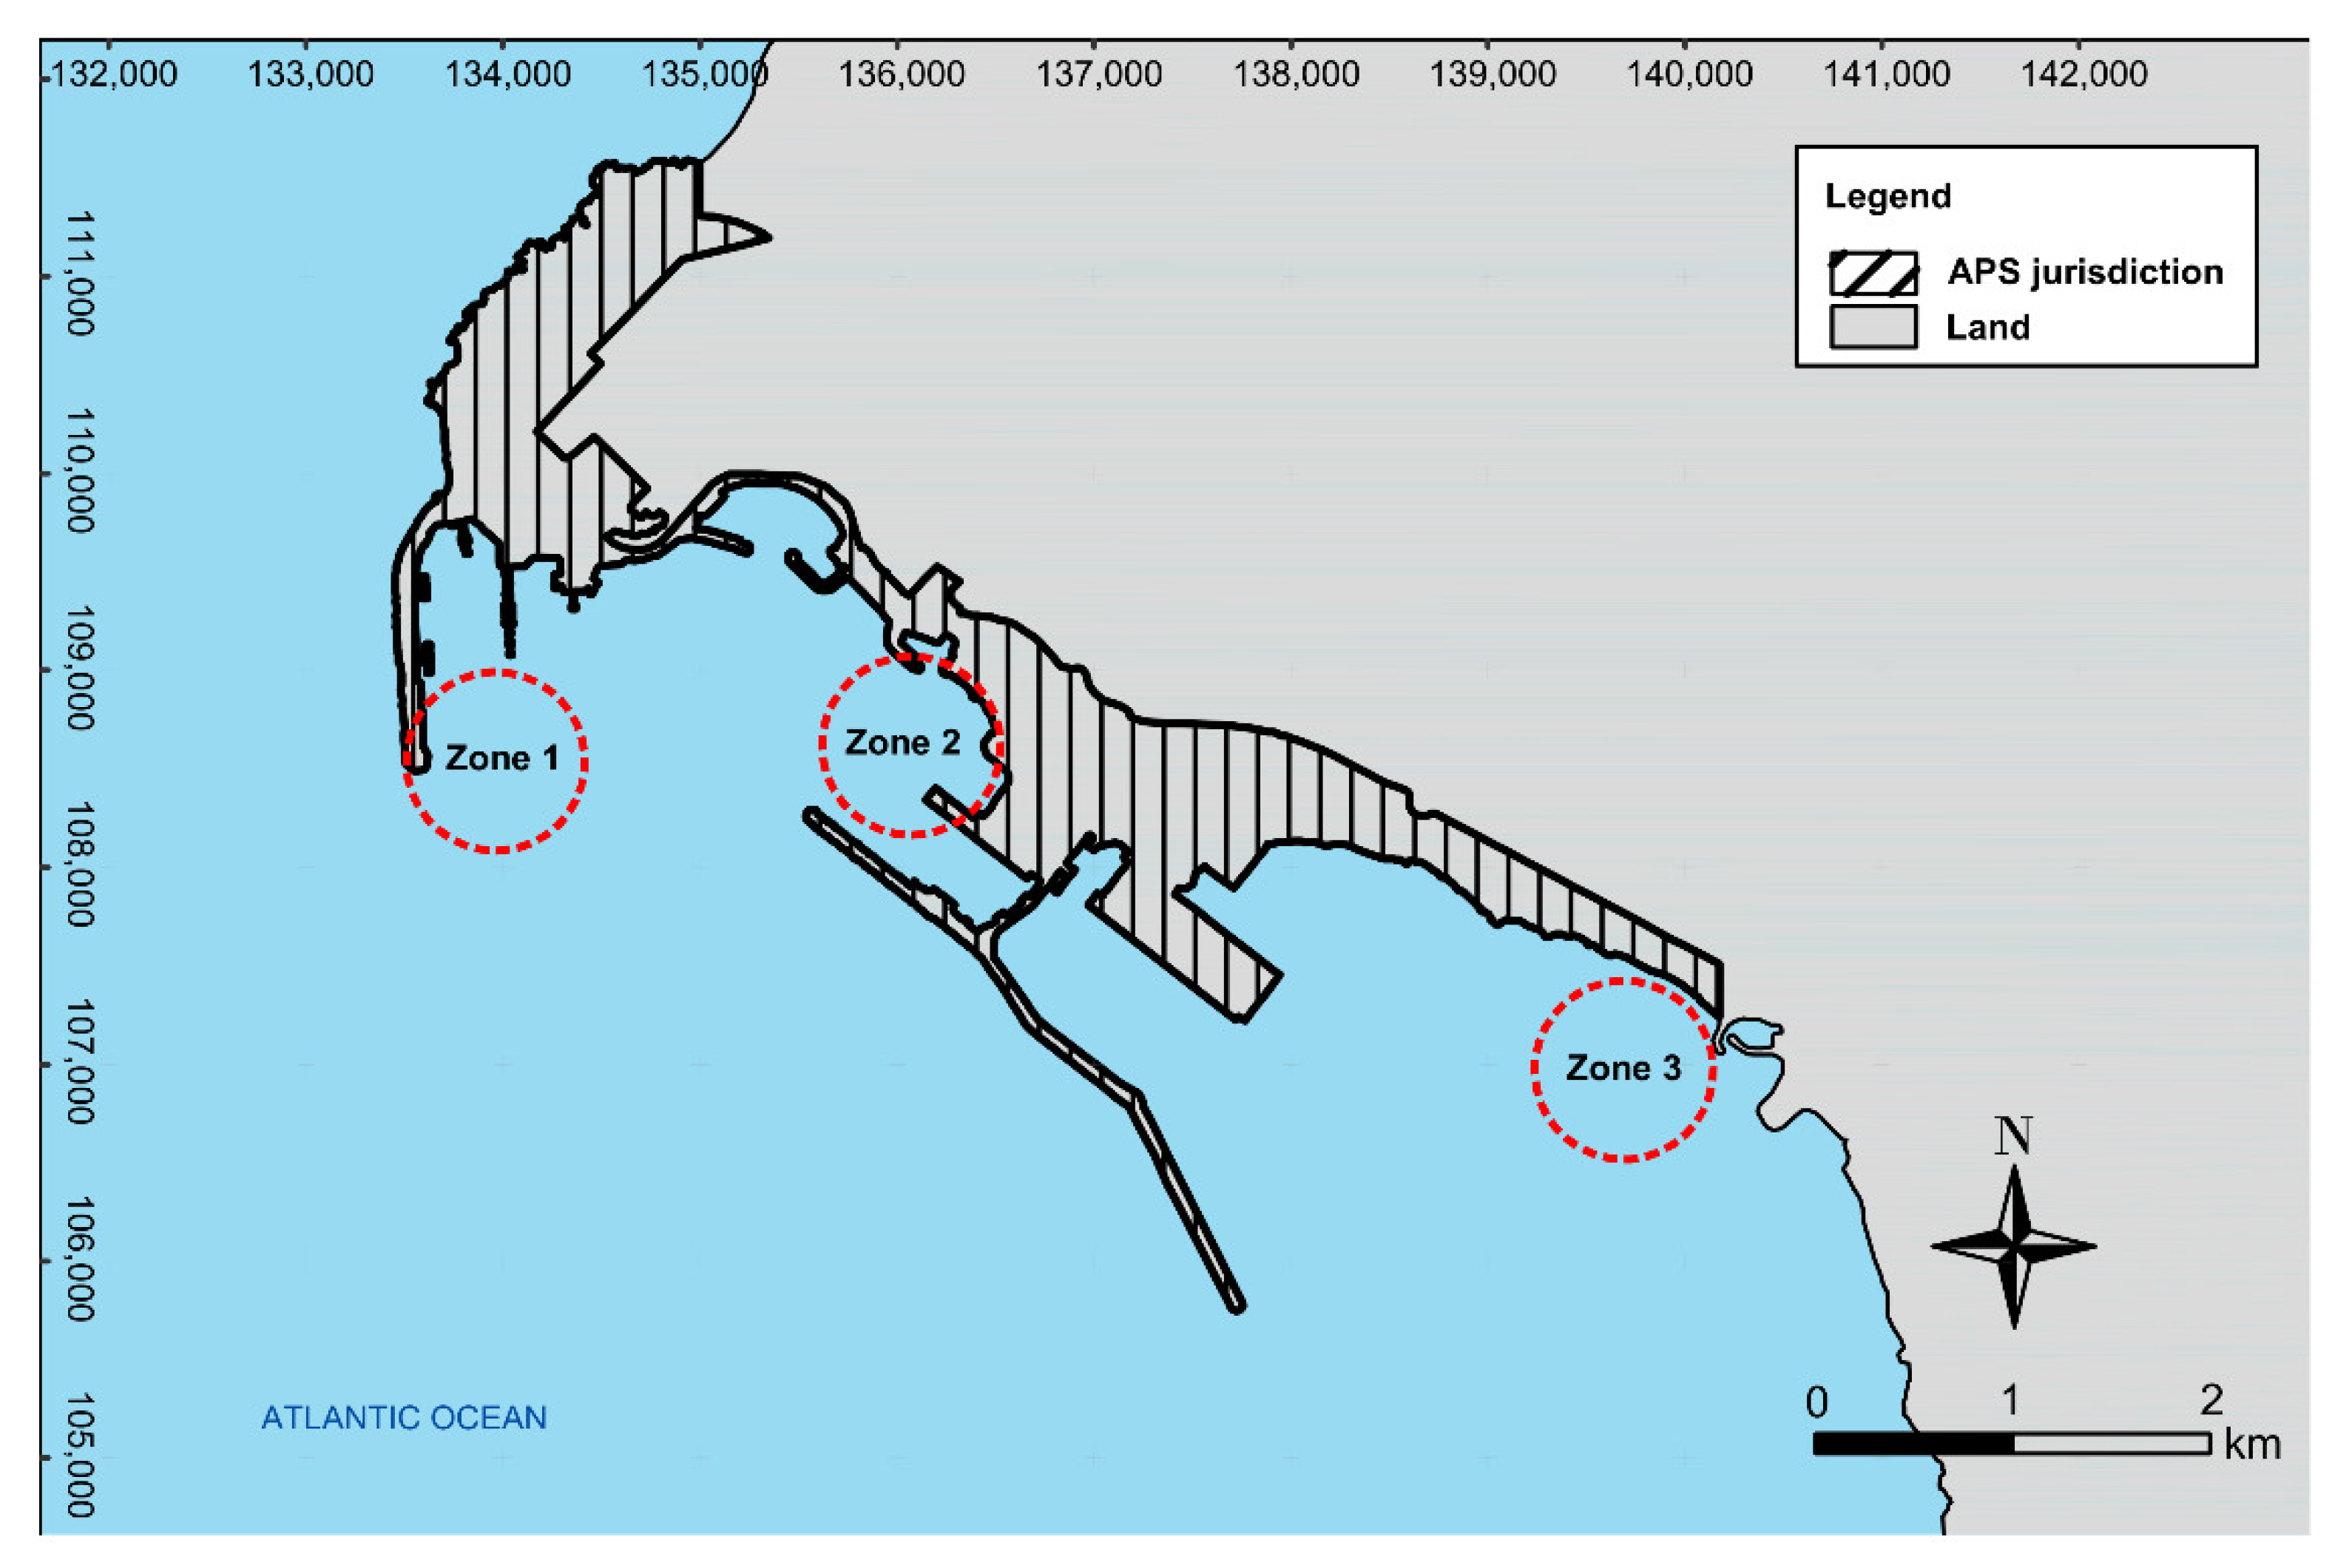
Figure 20.
Possible Test Sites: Zone 1 - Deactivated pontoon in West jetty extremity; Zone 2 Vicinity of the Multipurpose Terminal; Zone 3 - Near jetty of decommissioned Thermoelectric Power Plant of São Torpes beach.
Figure 20.
Possible Test Sites: Zone 1 - Deactivated pontoon in West jetty extremity; Zone 2 Vicinity of the Multipurpose Terminal; Zone 3 - Near jetty of decommissioned Thermoelectric Power Plant of São Torpes beach.
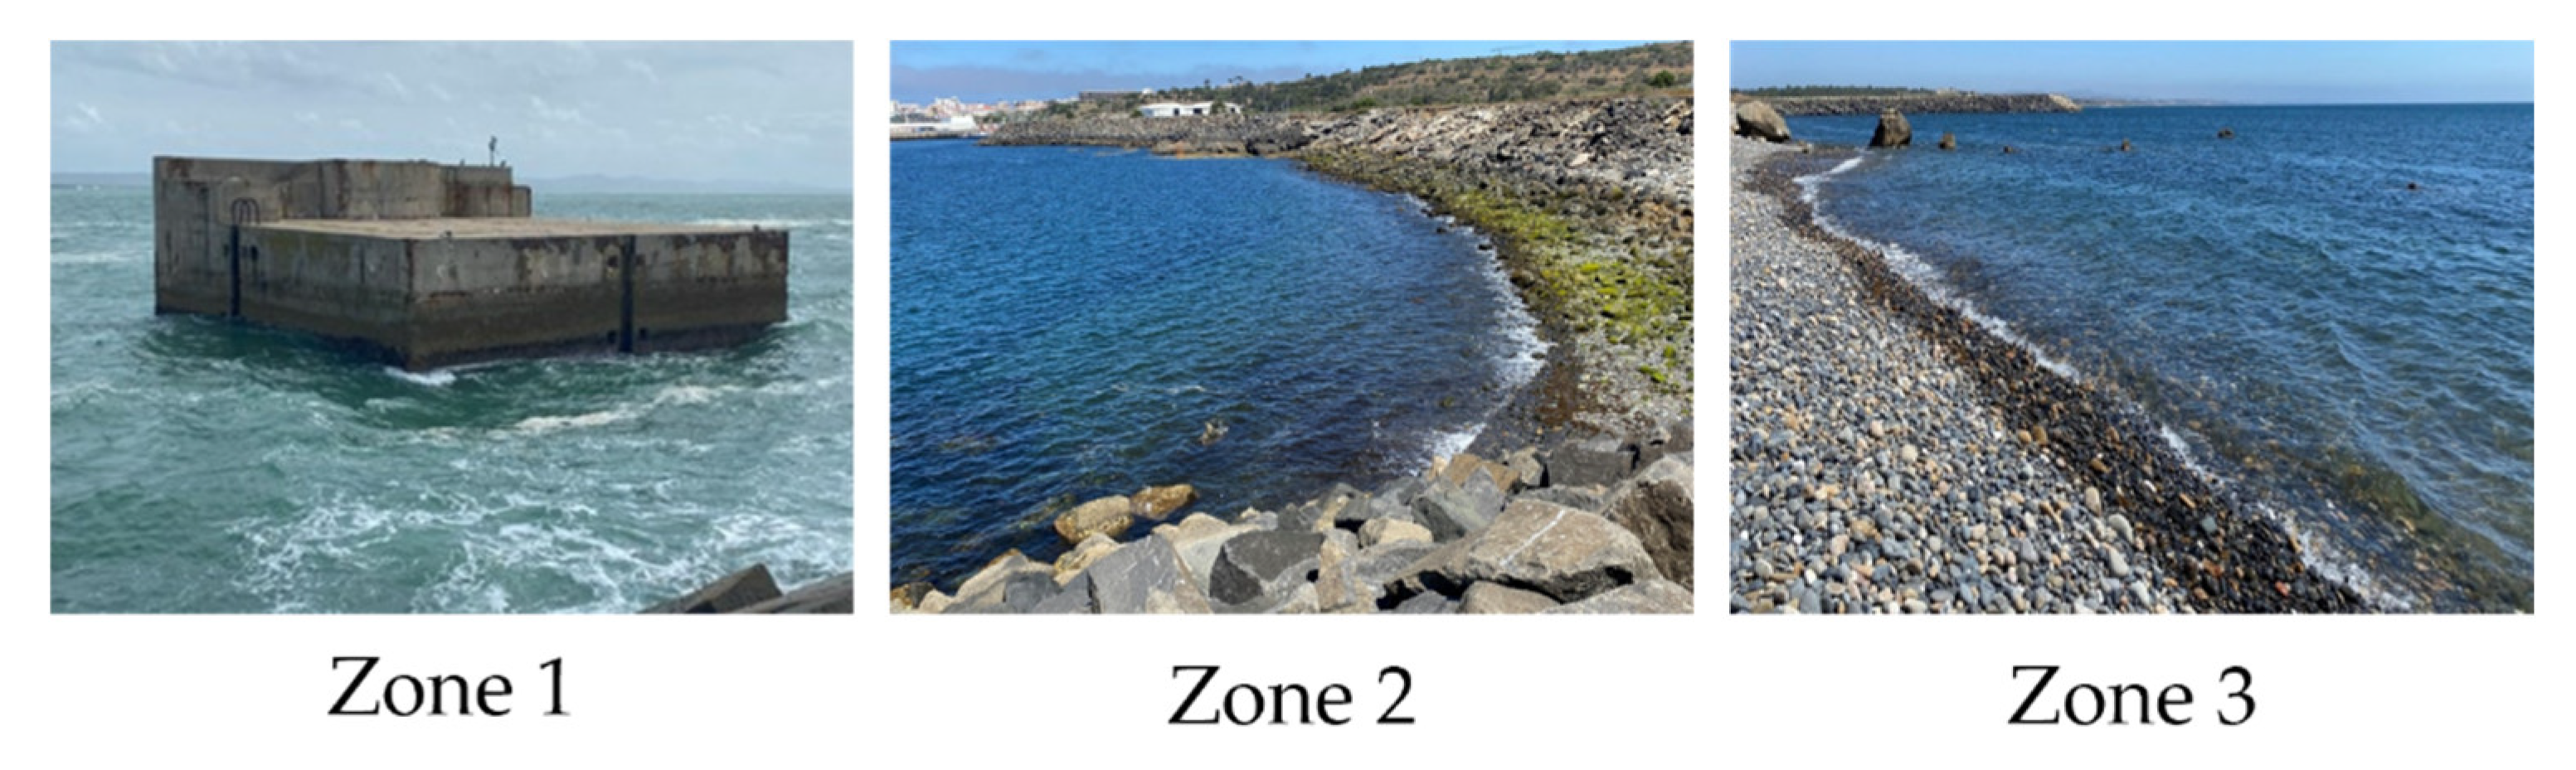

Table 1.
Tide average amplitude and extreme levels during the months of year 2025 according to tide table forecast provided by the APS website [27].
Table 1.
Tide average amplitude and extreme levels during the months of year 2025 according to tide table forecast provided by the APS website [27].
| Month | Average Amplitude (m) | Max (m Z.H) | Min (m Z.H) |
|---|---|---|---|
| Jan | 2.0 | +3.5 | +0.4 |
| Feb | 2.0 | +3.6 | +0.3 |
| Mar | 2.2 | +3.7 | +0.2 |
| Apr | 2.1 | +3.6 | +0.3 |
| May | 2.1 | +3.5 | +0.4 |
| Jun | 2.1 | +3.5 | +0.5 |
| Jul | 2.0 | +3.5 | +0.6 |
| Aug | 2.1 | +3.5 | +0.5 |
| Sep | 2.1 | +3.6 | +0.3 |
| Oct | 2.1 | +3.7 | +0.3 |
| Nov | 2.1 | +3.6 | +0.3 |
| Dec | 2.0 | +3.6 | +0.4 |
Table 2.
Selected sea state conditions at Sines’ buoy for the (1:10) small-scale REEFS model.
| Scenario – Characteristics at buoy (37°55.3′N, 8°55.7′W) | |||
|---|---|---|---|
| Nº | Direction (°) | (m) | (s) |
| 1 | 349 | 4.93 | 12.50 |
| 2 | 326 | 8.94 | 11.70 |
| 3 | 303 | 9.02 | 12.50 |
| 4 | 280 | 7.92 | 10.90 |
| 5 | 257 | 7.29 | 11.70 |
| 6 | 234 | 6.03 | 8.60 |
| 7 | 211 | 5.66 | 7.80 |
| Nº | Direction (°) | (m) | (s) |
| 8 | 349 | 0.98 | 4.00 |
| 9 | 326 | 0.75 | 3.80 |
| 10 | 303 | 0.68 | 3.83 |
| 11 | 280 | 0.49 | 3.76 |
| 12 | 257 | 0.50 | 3.77 |
| 13 | 234 | 0.50 | 3.79 |
| 14 | 211 | 0.46 | 3.79 |
Table 3.
Wave characteristics in Zones 1, 2 and 3, for the 14 scenarios presented in paragraph 8.4.
| Sines buoy | Zone 1 | Zone 2 | Zone 3 | ||||||
|---|---|---|---|---|---|---|---|---|---|
| Nº | Direc. (º) | (m) | (s) | Direc. (º) | (m) | Direc. (º) | (m) | Direc. (º) | (m) |
| 1 | 349 | 4.93 | 12.5 | 282 | 1.5 | 282 | 1.1 | 238 | 0.75 |
| 2 | 326 | 8.94 | 11.7 | 245 | 0.9 | 263 | 2.7 | 245 | 2.30 |
| 3 | 303 | 9.02 | 12.5 | 213 | 0.9 | 245 | 3.0 | 227 | 2.62 |
| 4 | 280 | 7.92 | 10.9 | 190 | 0.9 | 225 | 3.5 | 204 | 2.60 |
| 5 | 257 | 7.29 | 11.7 | 235 | 4.5 | 257 | 4.4 | 257 | 3.65 |
| 6 | 234 | 6.03 | 8.6 | 219 | 4.7 | 234 | 3.15 | 234 | 3.47 |
| 7 | 211 | 5.66 | 7.8 | 189 | 4.4 | 211 | 2.98 | 202 | 2.90 |
| Nº | Direc. (º) | (m) | (s) | Direc. (º) | (m) | Direc. (º) | (m) | Direc. (º) | (m) |
| 8 | 349 | 0.98 | 3.8 | 291 | 0.3 | 291 | 0.1 | 268 | 0.0 |
| 9 | 326 | 0.75 | 3.8 | 268 | 0.22 | 268 | 0.12 | 259 | 0.02 |
| 10 | 303 | 0.68 | 3.83 | 240 | 0.23 | 245 | 0.11 | 236 | 0.00 |
| 11 | 280 | 0.55 | 3.8 | 217 | 0.18 | 231 | 0.12 | 213 | 0.00 |
| 12 | 257 | 0.39 | 3.76 | 257 | 0.39 | 257 | 0.27 | 240 | 0.36 |
| 13 | 234 | 0.5 | 3.77 | 234 | 0.30 | 234 | 0.16 | 234 | 0.16 |
| 14 | 211 | 0.46 | 3.79 | 193 | 0.46 | 211 | 0.27 | 189 | 0.36 |
Disclaimer/Publisher’s Note: The statements, opinions and data contained in all publications are solely those of the individual author(s) and contributor(s) and not of MDPI and/or the editor(s). MDPI and/or the editor(s) disclaim responsibility for any injury to people or property resulting from any ideas, methods, instructions or products referred to in the content. |
© 2025 by the authors. Licensee MDPI, Basel, Switzerland. This article is an open access article distributed under the terms and conditions of the Creative Commons Attribution (CC BY) license (http://creativecommons.org/licenses/by/4.0/).
Copyright: This open access article is published under a Creative Commons CC BY 4.0 license, which permit the free download, distribution, and reuse, provided that the author and preprint are cited in any reuse.


