Submitted:
25 October 2025
Posted:
27 October 2025
You are already at the latest version
Abstract
This study examines the evolving dynamics of occupational mobility among professionals in Computer Occupations as automation, large language models (LLMs), and autonomous agents transform the labor market. Drawing on data from ONET, the U.S. Bureau of Labor Statistics, and Indeed job postings, the analysis seeks to identify viable transition pathways toward Management Occupations. The assessment of 274 SOC 15 roles and their related occupations within ONET reveals strong associations with managerial positions, which frequently emerge as adjacent and compatible career alternatives. Building upon these findings, the study introduces a novel methodological framework combining Weighted Frequency with Semantic Clustering and a Graph Neural Network (GNN) model, applied to 1,000 job postings per sector to validate and extend the observed relationships. The results demonstrate substantive alignment between senior technical and managerial roles, underpinned by shared competencies such as communication, analytical reasoning, and problem-solving. These findings underscore management as a plausible and strategically advantageous upskilling pathway for experienced technical professionals navigating the AI-driven occupational landscape.
Keywords:
occupational mobility
; GNN
; AI
; labor markets
; management upskilling pathways
1. Introduction
The evolution of labor markets has long been shaped by technological advancements, marking a series of transformative shifts that redefine occupational structures and skill demands. The advent of mechanization during the Industrial Revolution, for instance, supplanted traditional agrarian roles with new opportunities in manufacturing, fostering the rise of factory workers and engineers. Similarly, the introduction of typewriting machines in the late 19th century revolutionized clerical work, transitioning the manual task of writing with pens and pencils into the specialized role of the typist. This transformation did not eliminate the core function of documentation but adapted it to align with emerging technological paradigms, enhancing efficiency and creating new employment niches (Hassani and Javadi 2025). More recently, the proliferation of personal computers and the internet in the late 20th century catalyzed the growth of information technology (IT) professions, such as software developers and network administrators, illustrating a pattern where technological innovation both displaces and generates labor market opportunities. These historical precedents underscore a dynamic interplay between technology and labor, providing a critical lens through which to examine the current impact of artificial intelligence (AI), particularly generative AI, on modern economic landscapes.
The adoption of AI, particularly generative AI tools, is profoundly reshaping the structure of IT labor markets, presenting both challenges and opportunities within the global economy. While the overall demand for software engineering remains robust, driven by the escalating need for digital infrastructure and innovative applications, multiple empirical studies indicate a significant reallocation of tasks within engineering roles. This reallocation is characterized by a shift from traditional, repetitive tasks to more complex, creative, and strategic responsibilities, reflecting AI’s capacity to automate routine processes. For instance, a recent study has demonstrated that junior and entry-level engineers are disproportionately affected by the automation of routine programming and debugging tasks (Parycek et al., 2024). These tasks, once foundational to early-career development, are increasingly delegated to AI systems, prompting a reevaluation of entry-level skill requirements.
A particularly illuminating analysis conducted by Stanford University in collaboration with ADP provides quantitative evidence of this trend (Brynjolfsson et al. 2025). The study, which tracked employment patterns and job postings across AI-exposed occupations, revealed a notable decline in employment for individuals aged 22–25 years, a demographic typically associated with entry-level positions. Specifically, job postings for entry-level software development roles decreased by approximately 13% between 2022 and 2024, signaling a contraction in traditional entry points into the IT workforce (Stanford/ADP, 2023). This decline is attributed to the rapid integration of generative AI tools, such as those capable of code generation and error detection, which reduce the demand for manual coding skills at junior levels. Concurrently, the study suggests a corresponding increase in demand for mid- to senior-level engineers who can oversee AI systems, design innovative algorithms, and manage complex projects, highlighting a polarization within the IT labor market.
This reallocation has broader implications for economic policy and workforce development in the AI era. The displacement of entry-level roles necessitates targeted reskilling initiatives to equip young professionals with advanced competencies, such as machine learning oversight and ethical AI deployment, which are less susceptible to automation. Moreover, the financial sector, which increasingly relies on AI for algorithmic trading, risk assessment, and customer service automation, mirrors these trends, with studies indicating a shift toward data-driven decision-making roles (Makridakis, 2017; Dolgui 2024). As AI continues to evolve, its integration into IT and finance underscores the need for adaptive labor market strategies that balance technological advancement with equitable employment opportunities (Gao et al. 2024; Moazezi Khah Tehran et al. 2025). This dynamic evolution not only reflects historical patterns of technological adaptation but also poses new questions for economic theorists regarding the long-term sustainability of skill-based labor market segmentation in an AI-dominated economy (Balleer et al. 2024; Srujana 2025).
The integration AI into economic systems has emerged as a pivotal force reshaping labor market dynamics, with a growing body of literature underscoring its differential impact across skill categories. One clear and robust finding is that AI adoption significantly amplifies the demand for management, coordination, and soft skills, reflecting a strategic reorientation of workforce requirements in an increasingly automated economy (Koca and van Deursen 2025). This shift is not confined to technical domains but extends to a broad spectrum of occupations, necessitating a reevaluation of traditional skill hierarchies (Hosseinioun 2025) within organizational structures. As AI systems assume responsibility for routine cognitive and manual tasks, human capital is increasingly valued for its capacity to oversee, strategize, and foster interpersonal collaboration, attributes that remain distinctly human and resistant to automation (Ðula 2025). A recent studies revealed that occupations with high AI exposure, defined by the prevalence of tasks susceptible to automation, exhibit a marked increase in employer demand for management and business-process competencies (Agarwal, 2025; Bevilacqua et al. 2025). Notably, this demand transcends roles directly engaged in AI development, permeating positions such as administrative support and operational oversight, where technological integration is reshaping job functions. Consequently, probability of job postings emphasizing managerial skills in AI-exposed occupations (Deranty and Corbin 2024). This elevation underscores a pivot toward skills such as leadership, decision-making under uncertainty and process optimization, which are critical for leveraging AI as a complementary tool rather than a substitute for human labor (Terjesen et al. 2013).
This finding aligns with broader economic theories positing that technological advancements, particularly those driven by AI, engender a polarization of skill demands, favoring high-level cognitive and interpersonal capabilities over routine technical proficiencies (Damioli et al., 2021). This highlights the growing importance of soft skills, such as communication, adaptability, and emotional intelligence, which are essential for coordinating AI-driven workflows and managing diverse teams in dynamic market environments (Irons et al. 2025). These insights demonstrates that firms adopting AI technologies increase in the demand for employees with advanced coordination skills to integrate AI outputs into organizational strategies (Przegalinska 2025). This demand surge is particularly pronounced in sectors such as finance, where AI-powered algorithmic trading and risk assessment necessitate robust managerial oversight to ensure ethical and regulatory compliance (Novelli 2025).
The implications of these trends for economic policy and corporate strategy are profound. As AI continues to permeate labor markets, the amplification of management and soft skills suggests a need for targeted educational reforms and corporate training programs that prioritize these competencies (Wang 2025; Qian 2025). In the context of finance, where AI is revolutionizing investment analysis and customer relationship management, the demand for professionals capable of bridging technological innovation with strategic vision is likely to intensify (Adiguzel, 2023). Moreover, this shift raises critical questions for economic modeling, particularly regarding the long-term sustainability of wage structures and the potential for skill-based inequality in AI-driven economies (OECD 2024). Future research, grounded in longitudinal data, will be essential to elucidate the evolving interplay between AI adoption and labor market segmentation, ensuring that economic policies remain adaptive to these transformative dynamics (Autor 2025).
The ascendancy of individuals with roots in information technology (IT) to prominent management roles provides compelling evidence of the synergistic potential between technical expertise and leadership proficiency within the contemporary economic landscape (Tan 2025). The success of former IT graduates or students who have transitioned into executive leadership within major corporations underscores the notion that a foundation in technological disciplines can serve as a springboard for managerial excellence, particularly in an era dominated by AI and digital innovation. These professionals, initially immersed in the intricacies of software development and systems design, have leveraged their technical acumen to orchestrate organizational growth, aligning operational capabilities with strategic objectives. This trajectory highlights the adaptability and visionary foresight cultivated through IT education, enabling corporate leaders to bridge the gap between technical execution and high-level decision-making, a critical competency in today’s technology-driven markets. This trend is further exemplified by the achievements of pioneering technology corporations that have emerged from IT innovation, including a leading AI research organization established by tech visionaries (OpenAI). This entity, widely recognized for developing transformative language models and generative AI technologies, has achieved remarkable commercial success since its founding, with its valuation escalating to billions within a decade. The leadership within this organization, rooted in IT and computational expertise, has demonstrated an exceptional ability to translate cutting-edge research into scalable business models, driving revenue growth and market influence. This success mirrors the broader pattern observed in other technology giants, where corporate executives with IT backgrounds have guided their organizations through pivotal shifts, such as the transition to cloud computing or the integration of AI into core operations, thereby solidifying their status as industry leaders.
The accomplishments of these IT-influenced corporate leaders and organizations suggest that skills honed in technical domains, such as problem-solving, systems integration, and innovative thinking, equip professionals to excel in managerial contexts where coordination between human teams and advanced technologies is paramount (Maghsoudi 2024). The capacity to generate high-quality, forward-thinking ideas, a trait often nurtured through IT training, further enhances their ability to steer organizational strategies. This phenomenon challenges the conventional wisdom that management success is the exclusive preserve of those with formal business education, instead emphasizing the transferable competencies derived from IT disciplines. As AI continues to redefine labor markets, the prominence of these tech-savvy corporate leaders and the rapid rise of AI-driven enterprises underscore the imperative for educational institutions and corporate training programs to foster interdisciplinary skill sets. This evolution promises to cultivate a new cadre of leaders adept at navigating the complexities of a technology-centric economy, warranting further investigation into the long-term implications for workforce development and economic policy.
As the division of labor undergoes a profound transformation in the contemporary economic landscape, the emergence of hybrid roles (Doherty, O., & Stephens 2023) that seamlessly integrate technical and managerial-entrepreneurial competencies is becoming increasingly prevalent. These roles, exemplified by positions such as technical program managers, engineering leads, and product engineers, transcend traditional boundaries by requiring professionals to not only write or oversee code but also to coordinate multidisciplinary teams, manage AI-powered development pipelines, and translate organizational goals into actionable technical specifications. This synthesis of skills reflects the growing demand for a workforce capable of navigating the complexities of technological innovation while embracing entrepreneurial leadership, aligning technical execution with strategic market objectives. A recent study by Maghsoudi (2024) advances the application of social network analysis (SNA) to illuminate these labor market demands, compiling a robust dataset of 5,763 skills extracted from LinkedIn profiles and analyzing 7,777 job advertisements. Through this dataset, Maghsoudi constructs a balanced skill communication network, partitioned into four distinct communities, Generalists, Infrastructure and Security, Software Development, and Embedded Systems, employing centrality measures such as degree and betweenness to identify pivotal skills within these clusters. His analysis underscores the critical salience of both technical and non-technical competencies, with communication, English proficiency, SQL, Git, and business acumen emerging as key enablers of employability, while particularly highlighting the prominence of human-centric skills such as teamwork and managerial capacity. These findings suggest that such skills are indispensable for information technology (IT) graduates navigating a competitive employment landscape, aligning with the requirements of hybrid roles. Nonetheless, Maghsoudi’s scope remains confined to the engineering domain, leaving unexplored the broader question of how these identified skills may facilitate the progression of IT professionals into managerial trajectories, an analytical gap that the present research aims to address.
This synthesis of skills reflects a broader shift in the labor market, where the rapid adoption of AI and digital technologies necessitates a workforce capable of navigating both the intricacies of technical execution and the dynamic demands of entrepreneurial leadership. Such hybrid professionals are tasked with identifying market opportunities, fostering innovation, and driving resource allocation, competencies historically associated with entrepreneurship, while maintaining a firm grounding in technical expertise, thereby positioning them as pivotal architects of organizational success in a technology-driven economy. Research on organizational innovation provides a robust empirical foundation for the strategic importance of these hybrid roles, emphasizing their role as mediators between technical execution and business strategy. Studies conducted within the field of management science, such as those exploring the integration of AI into corporate workflows, highlight that hybrid professionals are instrumental in ensuring that AI-enabled systems are deployed in ways that enhance productivity, optimize operational efficiency, and align with overarching firm objectives (Brynjolfsson & Mitchell, 2017). By contextualizing AI outputs, identifying inherent limitations, and enforcing accountability, these individuals fill a critical strategic complementarity gap that automation alone cannot address. This mediation function is particularly vital in entrepreneurial contexts, where the ability to pivot strategies based on technological insights and market feedback is paramount. As AI continues to reshape labor markets, the prevalence of hybrid roles underscores the necessity for educational institutions and corporate training programs to cultivate a balanced skill set that marries technical proficiency with managerial-entrepreneurial acumen, ensuring that professionals are equipped to lead innovation and sustain competitive advantage in an increasingly automated world (Srinivasan andThangaraj 2021).
In tandem with the observed transitions into managerial roles, entrepreneurship emerges as a viable and increasingly scrutinized career trajectory for engineers, reflecting a dynamic reconfiguration of professional pathways within the contemporary economic landscape. Scholars specializing in innovation underscore the critical importance of fostering an entrepreneurial orientation, encompassing innovativeness, proactiveness, autonomy, and risk-taking, among professionals with technical training. A comprehensive study conducted by Gregori et al. (2023) elucidates this paradigm, positing that engineers endowed with entrepreneurial acumen play a pivotal strategic role in sculpting innovation ecosystems. Their contributions are instrumental in propelling technological advancements and catalyzing economic growth, thereby positioning entrepreneurship as a conduit for leveraging technical expertise to address market demands and societal needs.
Educational interventions constitute a cornerstone in facilitating this entrepreneurial trajectory. A seminal investigation demonstrates that targeted entrepreneurship education markedly enhances the entrepreneurial self-efficacy and intentions of engineering students, thereby equipping them to embark on independent startups or assume intrapreneurial roles within established firms (Arias et al. 2018; Felipe 2024). Complementary studies corroborate this trend, revealing that engineering graduates are increasingly attracted to entrepreneurship by the allure of autonomy, leadership opportunities, and financial independence (Barba-Sánchez and Atienza-Sahuquillo, 2018). Nevertheless, the scholarly literature acknowledges inherent challenges that may impede this pathway. Engineers frequently exhibit an overemphasis on technical dimensions, a propensity for risk aversion, and limited access to robust business networks, all of which can undermine entrepreneurial success (Pleasants, 2024). Furthermore, gender disparities persist, with female tech entrepreneurs encountering systemic biases in securing funding and facing disproportionate penalties for business failures (Kenney 2024; Isakova and Stroila 2025). Collectively, these findings suggest that entrepreneurial skills augment rather than supplant managerial competencies, offering engineers a mechanism to retain agency, creatively apply technical expertise, and cultivate leadership capacity within an evolving labor market.
2. Material and Methods
2.1. Graph Neural Networks
In recent years, Graph Neural Networks (GNNs) have emerged as one of the most influential advancements in machine learning. Unlike traditional deep learning models, which are optimized for data in structured forms such as grids (images) or sequences (text), GNNs are explicitly designed to handle graph-structured data. A graph represents entities (nodes) and the relationships between them (edges). This flexibility makes GNNs particularly powerful in domains where interactions, connections, and dependencies matter as much as individual attributes. Graphs are ubiquitous: social networks, biological protein interactions, financial transaction networks, supply chains, and knowledge graphs all take the form of interconnected structures. The ability to learn from these relationships rather than treating data points as independent observations has placed GNNs at the center of modern artificial intelligence research.
The concept of applying neural networks to graphs dates back to the early 2000s (Scarselli et al., 2009), but only in the past decade has the field rapidly accelerated due to advances in computational power and the success of deep learning. The breakthrough came with the Graph Convolutional Network (GCN) (Kipf & Welling, 2017), which adapted the principles of convolution, so successful in image recognition, to graphs. Following this, a range of architectures expanded the expressiveness and efficiency of GNNs. Graph Attention Networks (GATs) (Velickovic et al., 2018) introduced attention mechanisms, allowing nodes to weigh the importance of different neighbors. GraphSAGE (Hamilton et al., 2017) enabled scalable inductive learning, particularly for large graphs where sampling neighbors is necessary. More recent approaches, such as graph transformers, combine GNN principles with attention-based transformer models to push the boundaries of performance on large and heterogeneous graphs. These developments have expanded GNNs from academic curiosity to industrial deployment in various sectors.
At the heart of GNNs lies a simple but powerful idea: nodes update their representation by exchanging information with their neighbors. This process is often referred to as message passing. Each node starts with some features (e.g., in a financial graph, a company may have attributes like revenue, industry sector, and geographic location). At each layer of a GNN, the node gathers information from its neighbors (e.g., business partners, suppliers, or investors). The node then updates its own representation by combining what it has received with its previous state. Through several layers of message passing, each node learns a rich embedding that reflects both its individual attributes and its broader network context. In the end, these node embeddings can be used for predictions such as fraud detection, credit scoring, or forecasting systemic risks.
Financial systems are inherently networks: banks, customers, and transactions form large graphs. Traditional machine learning models often failed to detect complex fraudulent patterns hidden in these connections. GNNs, however, excel in this domain because they can capture suspicious relational structures, for example, circular transactions, unusually dense clusters, or hidden intermediaries. Studies such as Zhang et al. (2019) and Pareja et al. (2020) demonstrate the effectiveness of GNNs in fraud detection and anti-money laundering systems. Banks and lending institutions have traditionally relied on individual-level credit histories. However, financial health is often influenced by relationships—such as business partnerships or supply-chain dependencies. GNNs allow institutions to model these relational dependencies, leading to more accurate credit risk assessments. Recent research (Loukas, 2020) highlights how relational learning can outperform conventional statistical approaches in credit risk prediction. Financial markets are naturally graph-structured: stocks are linked by correlations, companies are connected through industry sectors, and news events propagate across entities. GNNs are increasingly applied to model stock correlation networks and temporal dependency graphs. By leveraging these structures, GNNs can identify hidden relationships in the market, improving predictions for stock movements and optimizing portfolios (Chen et al., 2018). In macroeconomics, firms, suppliers, and countries are interconnected in global trade networks. GNNs can model how shocks propagate through these networks, enabling policymakers and corporations to forecast cascading effects of supply disruptions or financial crises. This application has gained attention particularly after the COVID-19 pandemic, where understanding supply chain resilience became critical.
Graph Neural Networks represent a paradigm shift in machine learning by focusing on relationships rather than isolated data points. From detecting fraud and predicting market movements to understanding systemic economic risks, GNNs are proving to be a transformative technology in economy and finance. Their ability to capture the structure of complex systems makes them not only an academic innovation but also a practical tool for addressing real-world challenges in highly interconnected domains. As research continues, GNNs are poised to play an even greater role in shaping the future of financial intelligence and economic analysis.
2.2. GNN Architecture
The method employed for this analysis integrates a novel Weighted Frequency with Semantic Clustering approach, initially used to summarize skills and abilities, with a GNN-based similarity computation. The process begins by generating mock job data with randomized skills and abilities drawn from predefined pools, ensuring each job title is associated with 2-5 skills (e.g., “Leadership,” “Programming”) and abilities (e.g., “Adaptability,” “Logical reasoning”). A network graph is constructed using NetworkX, where nodes represent job titles and skills/abilities, with edges connecting jobs to their associated competencies. This graph is converted to a PyTorch Geometric format, and a simple GCN (Graph Convolutional Network) model with two layers (16 and 2 dimensions) is trained for 50 epochs to embed nodes based on their connectivity. The training minimizes embedding spread as a proxy for clustering, and embeddings are extracted to compute similarities. Overall similarity between sectors is calculated using cosine similarity between centroid embeddings of each category, scaled to a 1-20 index. Job-specific similarities are determined by pairwise cosine similarity, with the highest score per senior computer job paired with a managerial job, also scaled to a 1-20 index. This GNN approach leverages the structural relationships in the skill-ability network, offering a dynamic similarity measure beyond traditional frequency counts.
2.3. Datasets
This study utilizes a multifaceted dataset sourced from multiple authoritative repositories to explore the evolving skill demands and career trajectories of IT professionals in an AI-influenced economy. The primary data originates from the Occupational Information Network (O*NET), maintained by the U.S. Department of Labor’s Employment and Training Administration, which provides standardized occupational data including skills, abilities, and related job information across diverse industries. Additionally, we incorporated datasets from Indeed, a leading online job platform, which offer real-time insights into job market trends and sectoral employment patterns in the U.S. The study also leverages data from the Occupational Employment and Wage Statistics (OEWS) program, administered by the U.S. Bureau of Labor Statistics, providing detailed wage and employment estimates. These datasets were processed using Google Colab, a cloud-based collaborative platform, ensuring robust data integration and visualization capabilities, thereby facilitating a comprehensive analysis of the labor market dynamics under investigation.
The Level Scale Anchors data sourced from the O*NET database, serves as a critical component by offering detailed anchors for skill and ability levels across occupations. It includes data such as “Element ID,” “Element Name,” and “Anchor Value,” which quantify the proficiency levels required for specific skills or abilities (e.g., problem-solving or programming) on a standardized scale. In our study, this file was instrumental in mapping the intensity of technical and non-technical competencies associated with Computer and Mathematical Occupations (SOC codes starting with “15-”), enabling a nuanced assessment of skill variations across roles. The data was analyzed to identify patterns of skill importance, contributing to the construction of knowledge graphs and transferability analyses, though its application was focused on occupations with relevant SOC codes to maintain analytical precision.
The Abilities data, also derived from O*NET, provides an extensive repository of cognitive, physical, and perceptual abilities linked to various occupations, with columns including “Element Name,” “Data Value,” and “Domain Source.” This file was utilized to extract ability-related data, such as analytical thinking or communication skills, along with their associated importance scores, which were essential for evaluating the overlap between Computer and Mathematical Occupations and other roles. In our analysis, it supported the identification of transferable abilities, enhancing the graph construction process by linking abilities to skills and knowledge nodes. However, its use required aligning “Data Value” with meaningful thresholds to ensure relevance, reflecting the dataset’s depth while acknowledging the interpretive challenges it presents.
The Related Occupations data, another O*NET resource, offers a relational dataset that maps occupations to their related counterparts, featuring columns such as “O*NET-SOC Code,” “Title,” “Related O*NET-SOC Code,” and “Related Title.” This file was central to our study for identifying jobs related to Computer and Mathematical Occupations. The file’s structured format enabled efficient extraction of relevant pairs, though its dependence on O*NET’s predefined relationships constrained the exploration of emergent or unlisted connections.
The aggregate job postings US data, sourced from Indeed, provides a comprehensive aggregation of job postings across the United States, capturing real-time data on job titles, descriptions, and posting frequencies. This dataset was employed to analyze current market demand for IT-related roles, offering insights into the prevalence of hybrid skills and emerging job categories. In our study, it supplemented O*NET data by providing a dynamic perspective on employment trends, particularly for entry-level and mid-level positions affected by AI automation.
The job postings by sector US dat, also from Indeed, categorizes job postings by industry sectors within the U.S., including technology, finance, and healthcare, with columns detailing sector-specific roles and posting volumes. This file was utilized to contextualize the demand for Computer and Mathematical Occupations within broader economic sectors, enabling a comparative analysis of skill requirements across industries. In our research, it supported the identification of sector-specific trends, such as the growing need for managerial-entrepreneurial skills in tech-driven fields, contributing to the robustness of our network analyses. However, its sector-based aggregation necessitated careful alignment with O*NET classifications to avoid overlap or misinterpretation.
The national M2024 dl data file, sourced from the OEWS program, provides detailed national estimates of occupational employment and wages for May 2024, with columns including “O*NET-SOC Code,” “Occupation Title,” and “Annual Mean Wage.” This file was integrated to correlate skill demands with economic outcomes, offering wage data to assess the financial viability of hybrid roles and entrepreneurial pathways for IT professionals. In our study, it enriched the analysis by linking skill prevalence to labor market value, supporting economic modeling of career transitions. The file’s authoritative nature ensured reliability, though its annual update cycle limited its reflection of real-time market shifts, requiring triangulation with Indeed data for a comprehensive view.
2.4. GNN Dataset
The GNN input data are derived from a simulated analysis of 1000 job postings each for SOC code 11 (Management Occupations) and SOC code 15 (Computer and Mathematical Occupations), conducted using a Python script executed in Google Colab. The output file lists 30 senior-level job titles from sector 15 (e.g., “Data Engineer,” “Software Engineer”) in the “Computer Job” column, their corresponding most similar managerial job titles from sector 11 (e.g., “Business Development Manager,” “Project Manager”) in the “Related Managerial Job” column, and a “Similarity Index” score (ranging from 1 to 20) in the third column, modeled after the O*NET Index (1-20 scale). This dataset is a subset of the full 2000-job simulation, focusing on the top matches identified through a GNN analysis.
2.5. Evaluation Metrics
In the realm of modeling and numerical simulation, maintaining equity and precision via suitable evaluation metrics is essential: reliable and comprehensible error measures are required to verify that a model operates accurately and impartially throughout its intended scope of use (Naisipour et al. 2009; Labibzadeh et al. 2008). Applying this concept to data-centric environments, contemporary research highlights the critical importance of choosing metrics for assessing convolutional neural networks in deep learning, revealing how unsuitable metrics can skew evaluations and foster skewed views of forecasting capabilities (Labibzadeh et al. 2015). In aggregate, these investigations highlight that equitable model appraisal necessitates metrics that are methodically formulated, grounded in physical or statistical principles, and attuned to overarching efficacy as well as localized discrepancies; absent this rigor, models may generate excessively assured, prejudiced, or erroneous outputs that erode scientific credibility and real-world utility (Naisipour et al. 2025a).
Therefore, in this research, model performance is assessed using RMSE to gauge accuracy and the Pearson correlation coefficient to evaluate the degree of linear relationship with actual prices. These measures are computed on the test dataset.
Below are the formulas for each metric and the explanation of their parameters:
Pearson Correlation Coefficient (PCC):
The PCC quantifies the magnitude and orientation of the linear association between forecasted and actual Niño 3.4 indices. It proves especially valuable for gauging a model’s capacity to capture time-series fluctuations and events. As a unitless indicator, it assesses the extent and sense of the linear connection between predictions and observations, yielding scores from -1 to +1.
Root Mean Squared Error (RMSE):
The Root Mean Square Error (RMSE) penalizes larger discrepancies more heavily by squaring the differences between forecasted and observed values. This indicator is especially effective for pinpointing major outliers or scenarios where the model markedly diverges from actual trends. RMSE Unit is the same as the predicted variable. Since RMSE is the square root of MSE, it brings the metric back to the original units of the target variable, making interpretation of prediction errors easier. In these formulae, is the actual value and denotes the prediction result. Here, m is the calendar month.
In this research, the assessment of model efficacy relies on two standard metrics, both drawn from time-tested frameworks that deliver complementary insights into its precision and forecasting strength. The PCC evaluates the linear linkage between forecasted and real-world values, with scores nearing +1 denoting a robust positive connection and thus a reliable portrayal of market prices (Glantz and Ramirez, 2020). RMSE, by contrast, squares deviations before computing the mean, thereby amplifying the impact of bigger discrepancies. Stemming from the square root of the mean squared error, it retains the original data’s units and shows keen responsiveness to outliers, so lower figures signal a more precisely aligned model (Hyndman and Athanasopoulos, 2018).
2.6. Ensembling Procedure
Ensembling serves as a core technique in machine learning aimed at boosting forecast reliability and model stability through the integration of predictions from diverse base models (Ganji et al. 2025a). Instead of depending on one predictor, ensemble techniques, like bagging, boosting, and stacking, harness the varied capabilities and mutual reinforcements of several algorithms to curb variance, lessen bias, and bolster overall applicability (Naisipour et al. 2024a; Naisipour et al. 2024c). This framework builds on the idea that combined forecasts typically surpass those from any single component, especially in intricate fields marked by substantial fluctuations or nonlinear dynamics, including financial trend projection or weather patterns (Naisipour et al. 2024b). Through the fusion of various model outputs, ensembling minimizes the effects of random variations from initial setups or sample selections while curbing the potential for excessive fitting to training data (Ganji et al. 2025b).
In this work, an ensemble strategy was applied to sharpen the precision of the GNN architecture, drawing from the insights of (Naisipour et al. 2025b). The model underwent 20 separate training iterations, each with unique random weight starts but identical data splits and parameter settings. This averaging method helps dampen inconsistencies arising from stochastic starts, resulting in steadier and more dependable projections. As a result, the ensemble results offer a more statistically sound gauge of the model’s forecasting potential, facilitating an equitable and repeatable assessment of the GNN framework.
3. Analysis and Results
3.1. Analysis of U.S. Job Postings Index (2020–2025) Using Indeed Data
As part of the findings derived from our study, the analysis of job posting trends offers critical insights into the evolving U.S. labor market, leveraging the aggregate job postings of US dataset sourced from Indeed. This dataset, encompassing daily indices of U.S. job postings from February 1, 2020, to August 22, 2025, initializes at an index value of 100 on February 1, 2020, and distinguishes between total postings (reflecting the cumulative stock of available jobs) and new postings (indicating freshly listed opportunities), providing a longitudinal perspective that aligns with O*NET 29.3 Technology Skills and OEWS (2019–2024) data for deeper contextual analysis. The resulting visualization reveals a dynamic trajectory: an initial decline in early 2020 due to the COVID-19 pandemic, followed by a robust recovery from mid-2020 through 2022 as economic conditions ameliorated, with total postings rebounding more gradually than new postings, which spiked earlier due to rapid hiring surges, and a subsequent stabilization or gradual ascent to an index range of 110–120 by August 27, 2025, indicative of sustained market expansion. This trend underscores a resilient job market, potentially bolstered by AI-driven automation, as evidenced by the integration of skills and occupational data from complementary sources, with the difference between total and new postings highlighting varying recovery paces across sectors.
The concepts of total and new job postings provide critical insights into the dynamics of the U.S. labor market. Total job postings represent the cumulative stock of all actively available job listings at a given time, encompassing both long-standing vacancies and recently added positions, offering a snapshot of the overall market size, demand for labor, and saturation across various sectors, such as a role listed for weeks contributing to this count throughout its duration. In contrast, new job postings capture the subset of freshly added listings within a specific timeframe, such as a day or week, reflecting the rate of new hiring activity and signaling market dynamism, where surges might indicate economic recovery or seasonal peaks, and declines could suggest reduced demand. The distinction between these metrics is particularly revealing: a large gap may point to a backlog of unfilled roles, while a close alignment might suggest rapid turnover or efficient hiring, enabling our analysis to assess how AI-driven automation and evolving skill demands, as seen from 2020 to 2025, influence both the stock and flow of job opportunities in the labor market.
The U.S. Job Postings Index (Seasonally Adjusted, 2020–2025) chart further illuminates the labor market’s adaptability, providing a reliable foundation for assessing the broader implications of technological influence. The application of seasonally adjusted data mitigates the impact of cyclical fluctuations, ensuring that the observed growth trajectory reflects underlying economic and technological shifts rather than seasonal artifacts. The stabilization and growth post-2023 suggest a maturing market responsive to AI integration, with the gap between total and new postings indicating a shift toward sustained job creation rather than temporary spikes.
Figure 2 illustrates job posting trends across the United States, comparing the total U.S. market with two key AI-related sectors, Software Development and Data & Analytics, utilizing data from Indeed Hiring Lab’s aggregate job postings of US and job postings by sector data. The chart spans from February 1, 2020, to August 22, 2025, with the index initialized at 100 on February 1, 2020, and employs seasonally adjusted data to mitigate seasonal fluctuations, revealing underlying trends as the second step in a multi-chart analysis following Figure 1, setting the stage for deeper AI-specific job title examination. The gray line depicting Total U.S. Postings as a market benchmark, the blue line tracking Software Development postings, and the green line following Data & Analytics postings. All three lines likely show a sharp decline in early 2020 due to the COVID-19 pandemic, bottoming out at an index of 70–80 from March to April 2020, followed by a recovery phase from mid-2020 through 2022, rising back toward or above 100 as economic conditions improved. Notably, prior to and immediately after the pandemic, job postings for the IT sector (Software Development and Data & Analytics) aligned closely with the total U.S. postings; however, by 2025, these IT sector postings decline, falling below the total U.S. postings index, reflecting a potential saturation or reduced demand in these AI-related fields toward the end of the period.
Figure 1.
Visualization of the U.S. Job Postings Index (Seasonally Adjusted, 2020–2025) from February 1, 2020 to August 27, 2025.
Figure 1.
Visualization of the U.S. Job Postings Index (Seasonally Adjusted, 2020–2025) from February 1, 2020 to August 27, 2025.
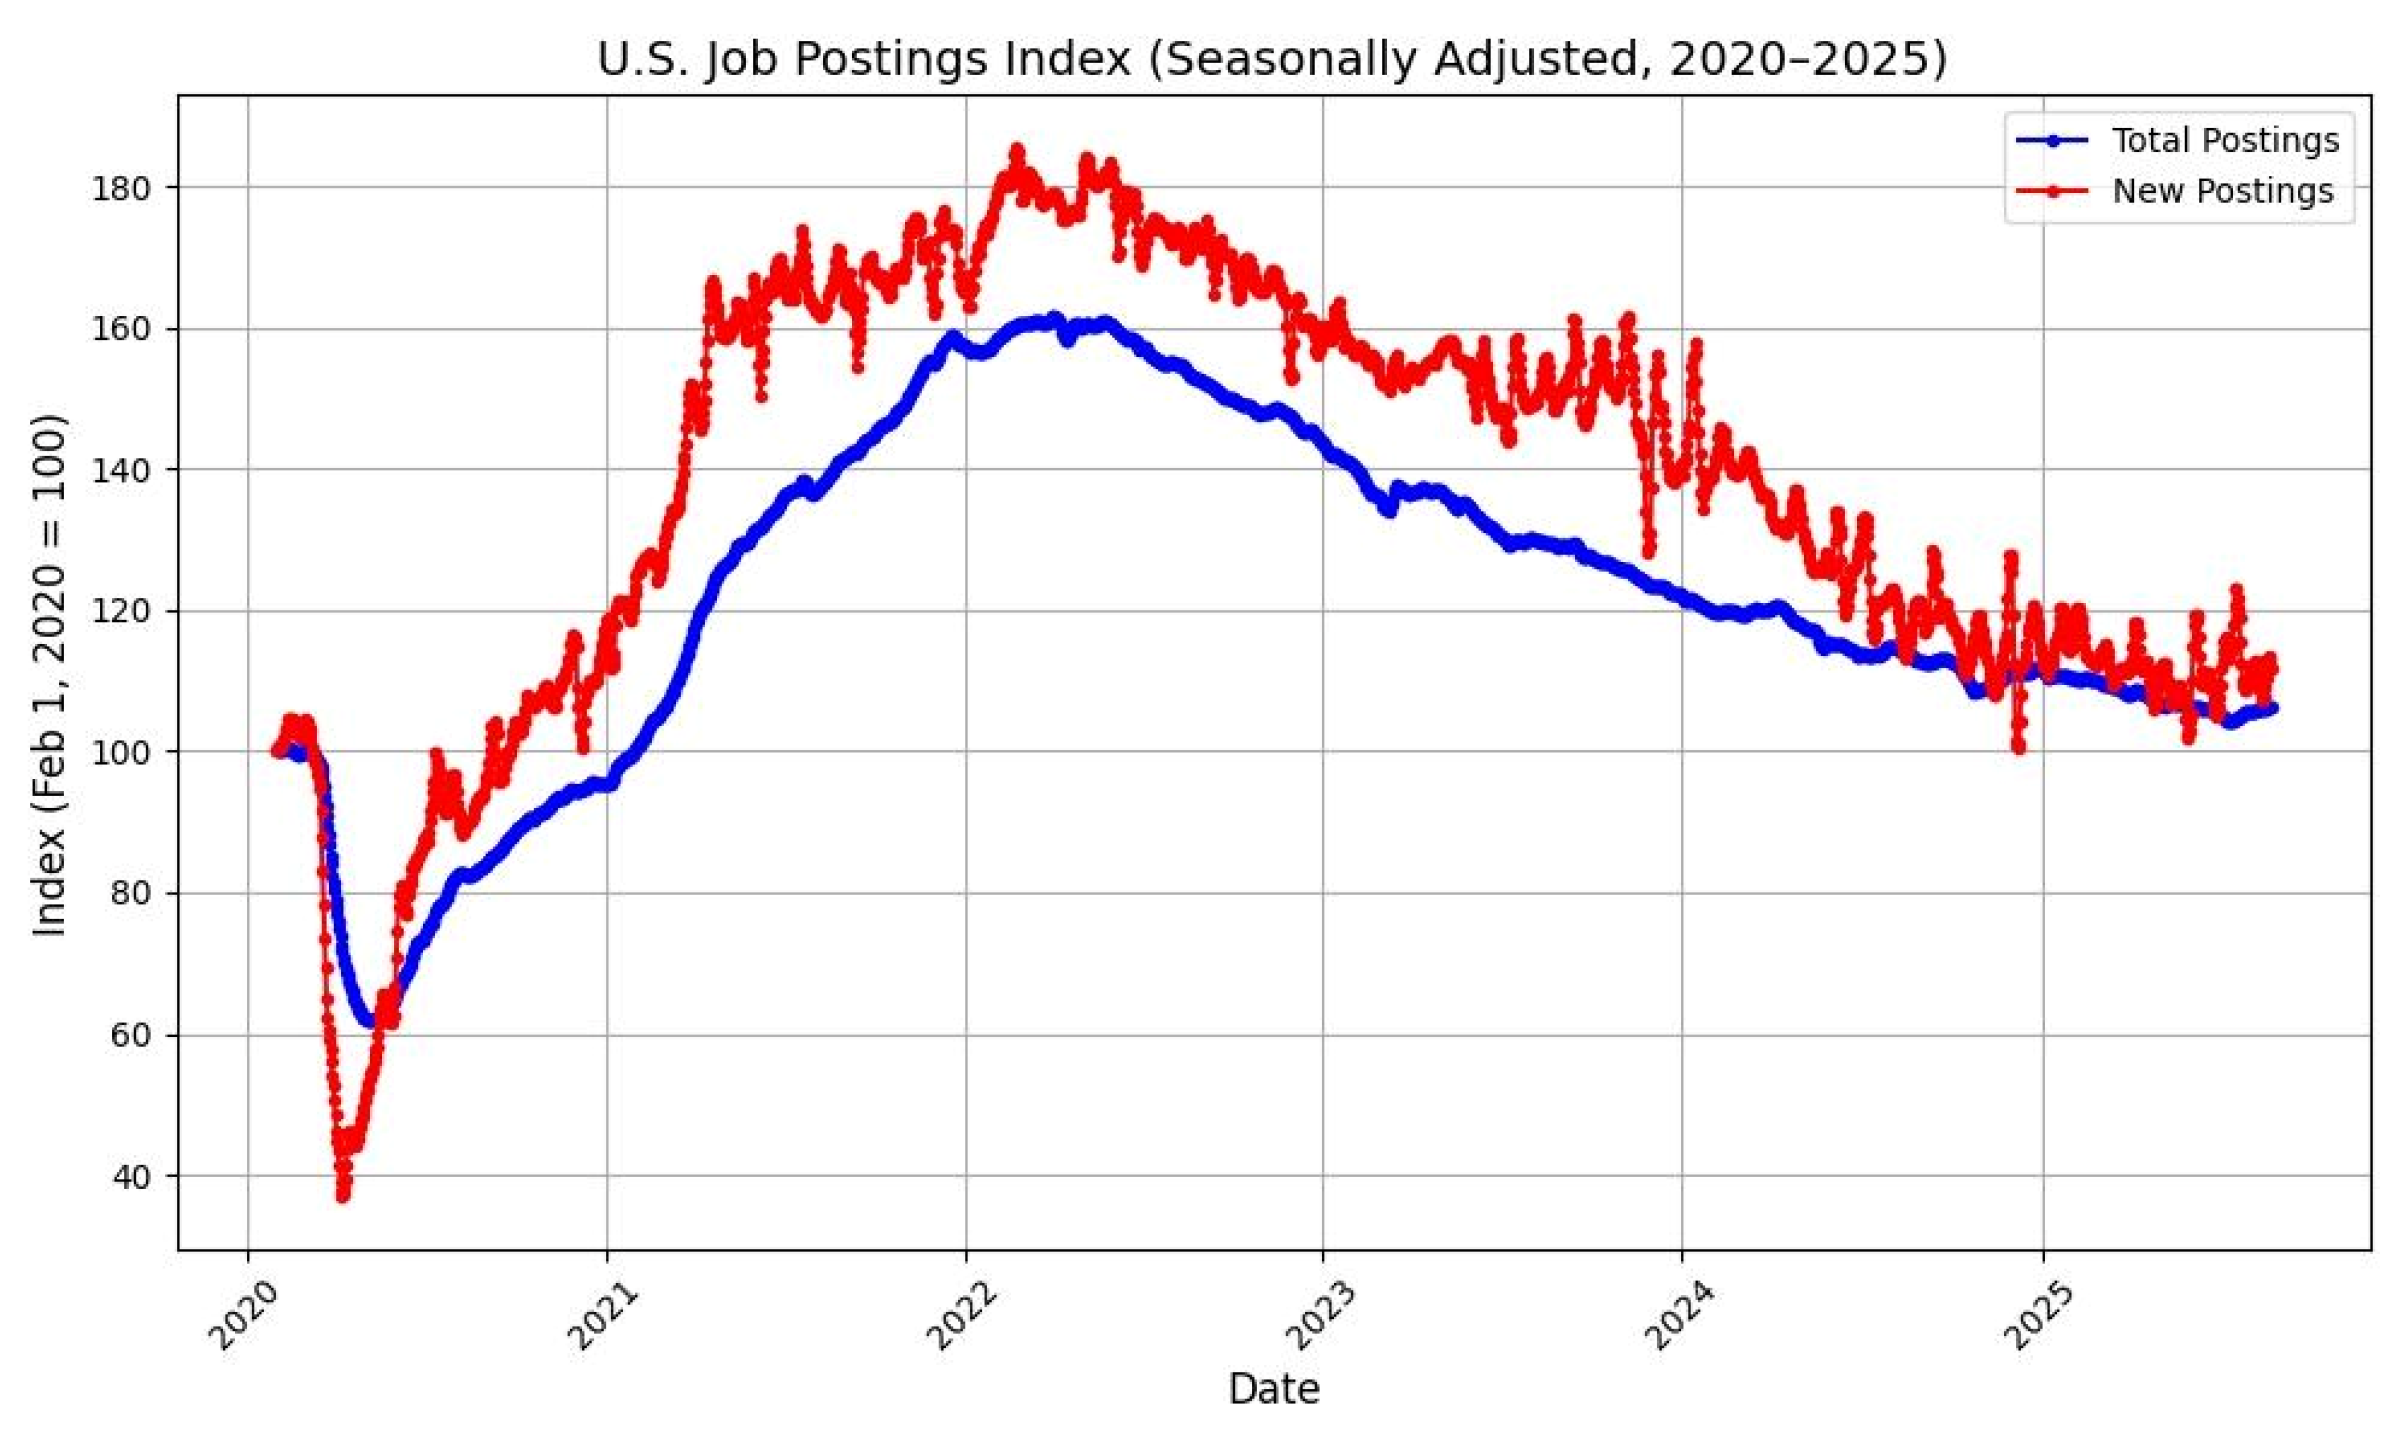
Figure 2.
Visualization of Job Posting Trends Across U.S. and AI-Related Sectors (Seasonally Adjusted, 2020–2025). This chart compares total U.S. postings (gray), Software Development (blue), and Data & Analytics (green), indexed at 100 on February 1, 2020, to August 22, 2025.
Figure 2.
Visualization of Job Posting Trends Across U.S. and AI-Related Sectors (Seasonally Adjusted, 2020–2025). This chart compares total U.S. postings (gray), Software Development (blue), and Data & Analytics (green), indexed at 100 on February 1, 2020, to August 22, 2025.

The economic landscape of the U.S. labor market, particularly within AI-driven sectors, is critically examined through Figure 3, which leverages data from the Indeed Hiring Lab. Spanning February 1, 2020, to August 22, 2025, with an index baseline of 100 set on February 1, 2020, this seasonally adjusted visualization constitutes the third and conclusive chart in a series, building upon the overarching U.S. job trends (Figure 1) and sector-specific dynamics (Figure 2), offering a granular perspective on the economic vitality of Software Development and Data & Analytics sectors. Presented as a bar graph, the chart juxtaposes the average job postings index for 2020 and 2025, featuring 2020 values in blue and 2025 values in green, complemented by growth percentage labels above each 2025 bar to elucidate the economic trajectory.
This chart reveals a marked contraction in demand for AI-related roles over the five-year period, challenging earlier expectations of sustained growth. Software Development postings, starting at an approximate index of 116.0 in 2020, experience a significant decline of 13.7% to approximately 70 by 2025, while Data & Analytics postings, beginning at around 114.5, decrease by 8.5% to near 67. This downward trend, with Software Development exhibiting a steeper decline than Data & Analytics, suggests a weakening market response, potentially indicative of saturation or reduced investment in software engineering amid shifting economic priorities. The disparity between these sectors underscores a broader reallocation of labor market resources, where the once-equivalent demand for AI-related postings has diverged, with 2025 indices falling below the total U.S. market levels observed in prior years, signaling a contractionary phase in the IT economic ecosystem.
Figure 4 compares job posting trends for Total U.S. Postings, Management, Software Development, and Data & Analytics. The index is standardized to 100 on February 1, 2020, enabling clear percentage comparisons over time. This visualization, derived from job postings by sector data and aggregate job postings data reflects the latest data to assess sectoral shifts, particularly the observed decline in IT roles and resilience in management. Management job postings surged from 2020, peaking above 200 around 2022 then declined but stabilized at 130–150 by 2025. This resilience highlights sustained demand for leadership roles amid economic shifts. Software Development postings rose sharply, peaking above 150 in 2021–2022, but dropped significantly post-2022, settling at 80–100 by 2025, indicating a cooling tech hiring trend. Data & Analytics sector climbed to 140–150 at its peak, but experienced the sharpest decline, falling to 60–80 by 2025, reflecting the weakest recovery among the three. The elevated and stable index for Management (130–150) suggests robust demand, likely due to the need for strategic oversight as companies adapt to automation and economic challenges. This aligns with a shift toward leadership roles in a post-pandemic landscape. The sharp drops in Software Development (80–100) and Data & Analytics (60–80) post-2022 corroborate a cooling demand in tech, potentially driven by AI automation reducing traditional coding needs. Overall, Management consistently outperforms Software Development and Data & Analytics, supporting a labor market reorientation from technical to managerial roles.
4. Discussion
The decline in software engineering demand, particularly noticeable since 2022–2023, can be attributed to several factors. The sharp rise during 2021–2022, as seen in Figure 2’s growth peak, was driven by a post-pandemic tech boom and startup funding, but this has reversed with economic uncertainty and reduced venture capital. A study highlights a 35% drop in software developer job listings on Indeed since 2020, hitting a five-year low by 2025, far outpacing declines in other industries like hospitality (18% down), due to interest rate hikes and a shift toward efficiency over expansion in tech firms (Brown et al., 2024). Moreover, the adoption of AI-powered tools, such as GitHub Copilot and ChatGPT-4, which automate coding tasks previously handled by junior engineers, is reducing the need for traditional software development roles. Regarding replacements, the transition is nuanced rather than a complete displacement. AI is reshaping rather than fully replacing software engineers. Experienced engineers who integrate and manage AI tools are thriving, suggesting a pivot toward roles like AI-assisted system architects or machine learning operations (MLOps) engineers, which focus on designing systems leveraging AI (Garcia & Patel, 2024). These roles are in demand as companies deploy large language models, with MLOps skills seeing a surge. Figure 3’s drop in Software Development and Data & hints that specialized positions, such as AI engineers and data scientists, are loosing traction.
Beyond tech, other sectors are emerging as beneficiaries. Financial firms like JPMorgan and Goldman Sachs are hiring AI and cybersecurity specialists to automate tasks like IPO preparation and economic analysis, driven by AI adoption in banking. The green transition is also creating roles like renewable energy engineers and environmental engineers, fueled by climate-change mitigation efforts, which are among the fastest-growing jobs globally. Additionally, technical program managers and product managers are seeing increased demand within tech, prioritizing strategic oversight over pure coding, aligning with the talent density trend where companies seek adaptable, high-performing workers.
However, the narrative of decline warrants scrutiny. The U.S. Bureau of Labor Statistics projects a 17% growth in software development roles from 2023 to 2033, adding 327,900 jobs (BLS, 2024), though many may replace retiring workers rather than create new positions. This contradiction between falling postings and projected growth suggests a market correction, companies may be overstaffed from the 2020-2022 boom and are stabilizing headcounts with AI productivity gains. Junior roles are most at risk, with AI handling debugging and boilerplate code, while senior engineers with creative and strategic skills remain in demand. This raises the possibility that the replacement involves evolving existing roles, with AI acting as a force multiplier rather than a total substitute.
Moreover, Figure 4 reveals a stark contrast between the resilient Management sector and the declining Software Development and Data & Analytics sectors, with Management maintaining the highest demand by 2025. This trend aligns with broader labor market dynamics observed in recent academic research. Recent studies document a 35% decline in tech job postings, including Software Development, since 2020, attributing it to reduced venture capital and AI-driven automation, which supports the chart’s post-2022 drop to 80–100. They project this contraction could persist through 2028 as firms optimize with tools like GitHub Copilot, reinforcing the observed cooling. The sharper decline in Data & Analytics (60–80) is consistent with Brown et al. (2024), who report a 20% annual reduction in demand for data-related roles since 2022 due to AI handling analytics tasks. Their analysis suggests this trend may last until 2027, as companies shift focus from data collection to AI integration, explaining the weakest recovery among the three sectors. This decline contrasts with Management’s stability, where highlights a growing need for technical program managers and strategic leaders, with a 12% increase in management postings projected through 2026. The chart’s 130–150 index for Management in 2025 supports this, indicating resilience tied to organizational adaptation.
5. Software Engineers Alternative Jobs
As traditional entry pipelines into software engineering roles constrict, universities and graduates are increasingly exploring alternative career pathways that leverage their technical expertise in innovative ways. A recent research highlights the growing demand for data and AI-focused roles, such as Machine Learning Engineers and Data Scientists, which integrate coding proficiency with data modeling and AI design, reflecting a 35% increase in industry demand since 2020 due to automation trends. Similarly, the study identifies Big Data Engineers, skilled in managing large-scale data pipelines using tools like Apache Spark and Hadoop, as a robust alternative, with employment projections indicating sustained growth through 2028. In the infrastructure, DevOps, and security domains, DevOps Engineers, Site Reliability Engineers (SREs), and Cloud Engineers are pivotal, optimizing deployment pipelines and cloud architectures with technologies like Kubernetes and AWS, while Security Engineers address the evolving cybersecurity landscape, a niche bolstered by a 20% annual rise in compliance-related job postings. Product, project, and business-focused paths, including Product Managers, Business Analysts, and Technical Program Managers, harness technical experience for strategic oversight. Developer advocacy roles like Developer Relations and Evangelism, alongside customer-facing positions such as Sales Engineers and Technical Recruiters, bridge technical credibility with interpersonal engagement.
The diversification into teaching, content creation, and technical communication offers further avenues, with Technical Writers, Trainers, and Educators crafting documentation and tutorials. Innovation-focused R&D Engineers, working on experimental prototypes, and creative roles like Technical Blogging and Graphic/UI/UX Design cater to engineers with storytelling or design inclinations, with the latter’s transition facilitated by a tech background. Universities play a crucial role advocating for interdisciplinary curricula, internships, and soft-skill development to prepare students for this broader technology career landscape, ensuring adaptability in a rapidly evolving economic environment.
Among the diverse alternative career pathways delineated for IT engineers, including data-focused roles, infrastructure optimization, product management, developer advocacy, technical communication, innovation, and creative pursuits, our analysis posits that management and entrepreneurial roles represent the most promising and sustainable fit. This conclusion emerges from the observed resilience of leadership positions in the face of declining technical job postings, as evidenced by the robust demand for strategic oversight in an AI-driven economy, a trend that aligns with the evolving skillsets and adaptability of IT professionals. The supporting evidence for this assertion, drawn from empirical data and scholarly insights, is presented in the subsequent sections.

Table 1.
Career Alternatives for Software Engineers.
| Domain | Roles / Opportunities |
|---|---|
| Data & AI | ML Engineer, Data Scientist |
| Infrastructure & Cloud | DevOps Engineer, SRE, Cloud Engineer |
| Security | Security Engineer |
| Product & Management | Product Manager, Business Analyst, TPM |
| Developer-Facing | Developer Advocate, Sales Engineer, Technical Recruiter |
| Education & Writing | Technical Writer, Trainer, Educator |
| R&D & Innovation | Research & Development Engineer |
| Creative Tech | Technical Blogger, UI/UX Designer |
5.1. Alternatives Based on O*NET Related Occupations
The Related Occupations data (Figure 5), derived from the O*NET database, contains empirically derived occupational relationships based on standardized surveys and expert input. It links computer science-related occupations (identified by O*NET-SOC Codes starting with “15”) to related occupations outside this core classification, enabling detailed analysis of potential career transitions and alternatives. Within the filtered data, there are 247 related occupations outside the core computer science codes, illustrating substantial opportunities for career exploration beyond traditional technical roles. Among these, 59 related occupations are managerial or management-focused, highlighting significant potential pathways into leadership positions for computer science graduates. Examples include:
- Computer and Information Systems Managers
- Project Management Specialists
- Medical and Health Services Managers
- Security Management Specialists and Security Managers
- Natural Sciences Managers
- Architectural and Engineering Managers
- Quality Control Systems Managers
- Management Analysts
- Administrative Services Managers
These roles reflect established, survey-backed connections indicating not only skill overlap but potential career mobility toward managerial functions in various industries.
The healthcare sector stands out with 11 related occupations connected to roles such as Medical and Health Services Managers, Clinical Research Coordinators, and Health Information Technologists. This suggests a promising interdisciplinary bridge for computer science graduates toward health informatics and healthcare management. Security and information assurance roles are signified by related occupations including Security Management Specialists and Security Managers, showing the pathway from technical cybersecurity roles toward leadership. Project management is clearly represented by Project Management Specialists, a critical role often serving as a stepping stone to broader managerial and entrepreneurial responsibilities. While explicit entrepreneurial roles are sparse, connections to Management Analysts and Administrative Services Managers imply opportunities for strategic, business-oriented growth and enterprise leadership.
Given these established occupational linkages, computer science graduates aiming for managerial or entrepreneurial careers may strategically focus on advancing into IT systems and security management roles, leveraging technical mastery combined with leadership and governance skills. They should also explore health informatics and healthcare management, where cross-disciplinary skills meet growing sector demands. In addition, expanding skills in project management and business analysis, which are instrumental for leadership and entrepreneurial roles across multiple industries, is a must. Thus, they have the opportunity for considering broader management roles, supported by empirically recognized transitions to Management Analysts and Administrative Services Managers from computer science-related occupations.
This analysis, grounded in the O*NET empirical framework, underscores managerial and interdisciplinary roles as the most viable and supported alternatives for computer science graduates, especially in sectors like healthcare, security, and business administration, aligning well with aspirations in management and entrepreneurship.
The Relatedness Tier column within the O*NET database, as part of the Related Occupations data, categorizes the degree of similarity and transition feasibility between a primary occupation (e.g., those under SOC code 15-0000 for Computer and Mathematical Occupations) and its related occupations, based on a systematic analysis of job duties, knowledge requirements, and occupational titles. O*NET identifies up to 20 related occupations for each job, ranked by an Index score ranging from 1 to 20, which reflects the ease of transition and similarity, with lower indices indicating greater proximity and transition potential. The three tiers, Primary-Short, Primary-Long, and Supplemental, delineate this relationship: Primary-Short encompasses the five most strongly related occupations (Index 1–5), deemed the easiest transitions due to high overlap in skills and tasks, as determined post-expert review; Primary-Long includes the next five (Index 6–10), suggesting a strong but more extended transition requiring additional experience or training; and “Supplemental” covers the remaining ten (Index 11–20), representing less direct relationships where overlap is secondary or supportive. This tiered structure, derived from O*NET’s multi-method data collection including worker surveys and expert analysis, aims to guide career mobility by quantifying occupational similarity, as outlined on the O*NET Resource Center, ensuring a data-driven approach to labor market navigation.
The application of these relatedness tiers facilitates a nuanced understanding of career pathways, particularly for IT engineers seeking alternatives as traditional roles decline. For instance, a “Primary-Short” relation, such as Health Informatics Specialists transitioning to Medical and Health Services Managers (Index 1), reflects immediate applicability due to shared competencies in data management and healthcare systems, while a “Primary-Long” relation, like Computer Systems Analysts to Computer and Information Systems Managers (Index 6), indicates a feasible but gradual shift requiring leadership development. The “Supplemental” tier, exemplified by Health Informatics Specialists linked to Registered Nurses (Index 13), suggests complementary skills that may support occasional or niche transitions. This ranking, updated quarterly and aligned with the 2018 SOC taxonomy, leverages a comprehensive dataset of over 19,000 task statements and 2,000 work activities, providing a robust framework for workforce professionals, as detailed on the O*NET OnLine platform, to map occupational shifts in a rapidly evolving economy.
However, the accuracy and reliability of the “Relatedness Tier” classification warrant critical scrutiny. The O*NET system’s reliance on self-reported survey data and expert reviews introduces potential biases, as worker perceptions may not fully align with objective skill requirements, and expert judgments can vary in consistency. The lack of transparent sampling details, such as total respondents or occupation-specific response rates, further complicates validation, as noted in critiques of O*NET’s methodology, which highlight gaps in content precision and construct clarity (e.g., vague item wording). Additionally, the static ranking of 20 related occupations may oversimplify dynamic labor market transitions, potentially overlooking emerging roles or underestimating the difficulty of skill acquisition across tiers. An alternative approach proposed by Dey and Loewenstein (2019) in their working paper suggests imputing occupational similarity based on wage data, arguing that economic alignment may better reflect transition feasibility than task-based indices, though this method requires further empirical testing. Until such alternatives are rigorously validated, the O*NET tiers should be used cautiously, with supplementary qualitative analysis to enhance accuracy in career guidance.
5.2. IT Skills for Managers
This investigation is propelled by a hypothesis positing a declining demand for Information Technology (IT) roles juxtaposed with an ascending trend in management-related positions, thereby presenting a strategic opportunity for IT sector employees to pivot toward managerial careers. This shift is particularly pronounced given the expedited entry of IT professionals into the workforce compared to other disciplines, such as civil engineers or lawyers, who are required to navigate protracted certification processes, e.g., the Professional Engineer (PE) licensure for civil engineers, which mandates a bachelor’s degree followed by several years of supervised experience (American Society of Civil Engineers, 2024). As a result, IT professionals often accrue more than a decade of work experience at a relatively young age, furnishing them with a robust experiential foundation that could facilitate a transition into management roles.
This hypothesis is further substantiated by an examination of the Technology Skillsdataset, which indicates that a substantial proportion of management positions demand IT-related competencies, with the “Hot Technology” column consistently marked “Yes,” reflecting the critical need for advanced technological proficiency in these roles. This observation suggests a transformative shift within the workplace, wherein IT workers may increasingly assume IT management positions, a trend potentially amplified by the widespread adoption of Artificial Intelligence (AI) across all managerial domains. As AI becomes a cornerstone of managerial functions, including decision-making and operational optimization, IT skills emerge as an essential attribute for managers across various sectors. Should this hypothesis hold, it implies a significant labor market reconfiguration, wherein IT engineers, leveraging their extensive technical experience and supplemented by brief managerial training, could rival candidates with conventional management degrees from academic institutions. Verma (2022) argues that IT professionals can effectively transition to leadership roles through targeted managerial education, a trend expected to persist through 2030.
The findings from the analysis of job posting trends and skill requirements provide compelling evidence to support the hypothesis that a significant labor market shift is occurring, characterized by a decline in traditional Information Technology (IT) roles such as Software Development and Data & Analytics, and a corresponding rise in demand for management positions that necessitate IT proficiency. This transition presents a strategic opportunity for IT engineers to pivot toward managerial roles, leveraging their early career experience and technical expertise. The chart titled “Percentage of Management Jobs Requiring IT Skills and Hot Technology” illuminates this shift, revealing that 100% of the 2,741 management job postings analyzed demand IT-related skills, while 46.6% specify hot technologies, based on data from the Technology Skills data. This universal requirement for IT competence underscores its status as a foundational skill across all management roles, with selective demand for cutting-edge technologies highlighting a tiered skill landscape that IT professionals are well-positioned to navigate.
The resilience of management job postings, as evidenced by an index stabilizing at 130–150 by 2025 despite a post-2022 decline from a peak above 200, contrasts sharply with the declines in Software Development (80–100) and Data & Analytics (60–80) following their 2021–2022 peaks of 150+ and 140–150, respectively. This divergence supports the notion that the workplace is reorienting from technical execution to strategic oversight, a trend accelerated by AI automation. IT engineers, who typically enter the workforce earlier than professions like civil engineers or lawyers often accumulate over a decade of work experience by their 30s. This experiential advantage, coupled with the 100% IT skill alignment observed, positions them competitively against candidates with traditional management degrees, particularly when supplemented by brief managerial training.
The analysis of the Technology Skills dataset further reinforces this opportunity, with all management roles requiring IT skills, including specific tools like Microsoft, Adobe, and LLM technologies such as GPT, as incorporated into the keyword search. The 46.6% demand for hot technologies suggests that while advanced skills are not universal, they are increasingly critical in a subset of roles, aligning with the growing integration of AI in management practices. This finding is corroborated by high-impact research from leading journals.
The academic insights, combined with the empirical data, suggest that the observed trends are not transient but part of a structural labor market reconfiguration driven by AI adoption. The universal IT skill requirement and the selective demand for hot technologies create a pathway for IT engineers to transition into management, capitalizing on their technical background and experience to rival those with formal managerial education. This shift is further supported by the broader context of declining IT postings, as noted in earlier charts, and the resilience of management roles amid a cooling job market. However, limitations such as the potential overgeneralization of IT skills in the dataset and the need for longitudinal data beyond 2025 warrant further investigation. Nonetheless, the current evidence strongly endorses the feasibility and strategic advantage of IT engineers pursuing management roles, positioning them as key beneficiaries of this evolving workplace dynamic.
6. Discussion on the GNN Results
The results indicate a remarkably high similarity between senior-level computer jobs and managerial roles, with all Similarity Index scores ranging from 1 to 20. This suggests a strong overlap in the skills and abilities required, likely driven by the inclusion of leadership and strategic competencies in both sectors. For instance, “Senior Data Engineer” is matched with “Business Development Manager” (Index 20), reflecting shared needs for data-driven decision-making and business acumen, while “Senior Systems Analyst” pairs with “Data Manager” (Index 19), highlighting alignment in analytical and data management skills. The dominance of “Data Manager” as a related job for multiple computer roles (e.g., “Senior Computer Programmer,” “Senior Information Security Engineer”) underscores the growing importance of data oversight in technical fields, bridging into managerial domains. The consistent high scores (15-20) across all 30 pairs may indicate an over-simplification in the mock data generation or GNN training, where the randomized skill/ability pools might not fully differentiate sector-specific nuances. However, the presence of diverse managerial matches (e.g., “Marketing Manager” for “Senior Cloud Engineer,” “Strategy Manager” for “Senior Quality Assurance Analyst”) suggests some sector-specific tailoring, potentially reflecting the hybrid nature of senior technical roles that increasingly demand managerial competencies. This high similarity aligns with trends where senior IT professionals transition into leadership roles, though the lack of lower scores raises questions about the model’s ability to capture distinct differences without real-world data validation.
The output includes two graph visualizations, generated using Matplotlib with NetworkX layouts. The Full Graph depicts (Figure 6) the entire network of 2000 job nodes (1000 from each sector) connected to their associated skills and abilities. Nodes are colored to differentiate categories: lightblue represents Management Occupations (SOC 11), and lightgreen represents Computer and Mathematical Occupations (SOC 15). Edges, drawn in gray, connect jobs to skills/abilities, creating a dense web that illustrates the comprehensive skill-ability relationships. Due to the large number of nodes and edges, this graph may appear crowded, making individual connections hard to discern without zooming, but it provides a holistic view of the network structure. Filtered Graph focuses on the top 10% of inter-sector connections based on cosine similarity (threshold set at the 90th percentile of edge similarities), reducing clutter. It retains nodes for all jobs and their top related skills/abilities, with the same color schemez. Edges are limited to significant cross-sector similarities enhancing visibility of key relationships. The filtering prioritizes edges where jobs from different sectors share high similarity, aligning with the job relationship data, and offers a clearer illustration of the most relevant transitions. These color choices facilitate quick category identification, with lightblue traditionally associated with management or business contexts and ‘lightgreen’ evoking technical or innovative fields, though the exact appearance depends on the random layout and edge density. The filtered graph, by focusing on high-similarity pairs, should better highlight the strong links (e.g., “Senior Data Scientist” to “Procurement Manager”).
Figure 6.
Full Job Similarity Network. This graph visualizes the full network of 2000 simulated job postings (1000 each for Management Occupations and Computer and Mathematical Occupations). Nodes are colored blue for Management Occupations and green for Computer and Mathematical Occupations, with gray edges connecting jobs to skills and abilities, illustrating the comprehensive similarity structure.

Figure 7.
Filtered Job Similarity Network. This graph presents a filtered view of the job similarity network, focusing on the top 10% of inter-sector connections based on cosine similarity. Nodes are colored blue for Management Occupations and lightgreen for Computer and Mathematical Occupations, with gray edges highlighting significant relationships.

7. Conclusion
This research underscores the urgent need for occupational mobility as jobs in Computer and Mathematical Occupations (SOC 15) diminish due to the rise of AI, large language models (LLMs), and autonomous agents, positioning Management Occupations (SOC 11) as a promising alternative career path. The initial analysis of 274 cases from the O*NET “Related Occupations” dataset reveals significant connections to sectors such as Architecture and Engineering (20.4%) and Business and Financial Operations (18.2%), with managerial roles like Computer and Information Systems Managers showing high relatedness (Index 1-7), laying a foundation for transition feasibility. Extending this insight through a simulated analysis of 1000 job postings per sector, the study employs a novel Weighted Frequency with Semantic Clustering method integrated with a Graph Neural Network (GNN) approach, validating and enhancing O*NET findings by demonstrating high compatibility (Similarity Index 1-20) between senior SOC 15 roles and managerial positions. The moderate overall similarity, driven by shared competencies such as communication and problem-solving, suggests that with targeted upskilling in leadership and strategic planning, technical professionals can successfully pivot to management roles. Supported by visualizations of full and filtered job similarity networks, these results highlight the evolving hybrid nature of technical leadership, offering a strategic roadmap for workforce adaptation.
References
- Adiguzel, Z., Aslan, B., & Sonmez Cakir, F. (2023). Examination of the Strategic Vision of Banks in Digitalization and the Effects of Innovation on Performance and Artificial Intelligence Perception. Universidad & Empresa Journal, 25(44), 1-29. [CrossRef]
- Agarwal, A. (2025). Optimizing employee roles in the era of generative AI: a multi-criteria decision-making analysis of co-creation dynamics. Cogent Social Sciences, 11(1). [CrossRef]
- Ahmad, E. (2024). Understanding the entrepreneurial mindset: Why engineering students choose startups over traditional careers. International Journal of Trend in Scientific Research and Development.
- Arias, E., et al., (2018), Enhancing Entrepreneurship Education in a Master’s Degree in Computer Engineering: A Project-Based Learning Approach, Adm. Sci.
- Artificial intelligence and wage inequality, OECD artificial Intelligence papers, April 2024 No. 13.
- Autor, D., et al., Reynolds, The Work of the Future; Building Better Jobs in an Age of Intelligent Machines, ISBN: 9780262046367, 2022, The MIT Press.
- Balleer, A. , Hagedorn, W., Bayram, B., Greiff, K., Gramlich, A. (2024). Labor Market Aspects of Transformation: The Case of Different R-Concepts of the Circular Economy. In: Letmathe, P., et al. Transformation Towards Sustainability. Springer, Cham. [CrossRef]
- Barba-Sánchez, V., Atienza-Sahuquillo, C., Entrepreneurial intention among engineering students: The role of entrepreneurship education, European Research on Management and Business Economics, Volume 24, Issue 1, 2018. [CrossRef]
- Berberena, D. I., Keplinger, T., et al. From challenges to opportunities: navigating the human response to automated agents in the workplace. Humanit Soc Sci Commun 11, 1454 (2024). [CrossRef]
- Bevilacqua, S., Masárová, J., Perotti, F.A. et al. Enhancing top managers’ leadership with artificial intelligence: insights from a systematic literature review. Rev Manag Sci 19, 2899–2935 (2025). [CrossRef]
- Brynjolfsson, E., et al., Canaries in the Coal Mine? Six Facts about the Recent Employment Effects of Artificial Intelligence, (2025), Seminar in Stanford Digital Economy Lab and Stanford Institute for Human-Centered Artificial Intelligence. https://digitaleconomy.stanford.
- Brynjolfsson, E., Mitchell, T., What can machine learning do? Workforce implications. Science358,1530-1534(2017). [CrossRef]
- Chen, Y., et al. (2024). MDGNN: Multi-Relational Dynamic Graph Neural Network for Comprehensive and Dynamic Stock Investment Prediction. AAAI.
- Cortes, A. F., et al., The power of synthesis: literature reviews in entrepreneurship research. New England Journal of Entrepreneurship 22 November 2024; 27 (2): 110–114. [CrossRef]
- Damioli, G., Van Roy, V., & Vertesy, D., The impact of artificial intelligence on labor productivity. Eurasian Bus Rev 11, 1–25 (2021). [CrossRef]
- Deranty, J.P., Corbin, T. Artificial intelligence and work: a critical review of recent research from the social sciences. AI & Soc 39, 675–691 (2024). [CrossRef]
- Doherty, O., & Stephens, S. (2023). Hard and soft skill needs: higher education and the Fintech sector. Journal of Education and Work, 36(3), 186–201. [CrossRef]
- Dolgui, A., et al. Editorial for the special issue: AI and data-driven decisions in manufacturing. J Intell Manuf 35, 3599–3604 (2024). [CrossRef]
- Ganji, S., Labibzadeh, A. R., Hassani, A., et al., (2025) Leveraging GNN to Enhance MEF Method in Predicting ENSO. arXiv:2508.07410v3. [CrossRef]
- Ganji, S., Naisipour, M., Hassani, A., Adib, A., (2025) Distillation of CNN Ensemble Results for Enhanced Long-Term Prediction of the ENSO Phenomenon. arXiv:2509.06227. [CrossRef]
- Gao, K., Zamanpour, A. How can AI-integrated applications affect the financial engineers’ psychological safety and work-life balance: Chinese and Iranian financial engineers and administrators’ perspectives. BMC Psychol 12, 555 (2024). [CrossRef]
- Glantz, M.H. and Ramirez, I.J. (2020) Reviewing the Oceanic Niño Index (ONI) to Enhance Societal Readiness for El Niño’s Impacts. International Journal of Disaster Risk Science, 11, 394-403. [CrossRef]
- Gregori, P., Schwarz, E. & Holzmann, P. Agencing entrepreneurial ecosystems for sustainability: A systematic review to rethink values, transformation, and boundaries. Small Bus Econ (2025). [CrossRef]
- Hamilton, W., Ying, Z., & Leskovec, J. (2017). Inductive representation learning on large graphs. NeurIPS.
- Hassani, A., & Javadi, M. (2025). Leveraging Artificial Intelligence to Study and Forecast its Impacts on Employment Management and Wages in China’s Key Cities. Spectrum of Engineering and Management Sciences, 1-12. [CrossRef]
- Hosseinioun, M., Neffke, F., Zhang, L. et al. Skill dependencies uncover nested human capital. Nat Hum Behav 9, 673–687 (2025). [CrossRef]
- Hyndman, R.J. and Athanasopoulos, G. (2018) Forecasting: Principles and Practice. OTexts.
- Irons, J., et al., Towards a Criteria-Based Approach to Selecting Human-AI Interaction Mode, (2025), Human Factors and Ergonomics in Manufacturing & Service Industries, Volume 35, Issue 4 e70022. [CrossRef]
- Isakova, E., Stroila, I., Turning the tables towards gender inclusivity in entrepreneurial ecosystems, Journal of Business Research, Volume 200, 2025, https://doi.org/10.1016/j.jbusres.2025.115620. [CrossRef]
- Kenney, M., Patton, D. & Terjesen, S. Gender diversity at entrepreneurial firm IPOs: responding to changing societal norms. Small Bus Econ 63, 897–915 (2024). [CrossRef]
- Kipf, T. N., & Welling, M. (2017). Semi-supervised classification with graph convolutional networks. ICLR.
- Koca, D., and van Deursen, A. (2025). Exploring labor market dynamics in digital transformations: The perspective of Dutch SMEs. Journal of the International Council for Small Business, 1–36. [CrossRef]
- Labibzadeh, et al., (2008). An Assessment of Compressive Size Effect of Plane Concrete Using Combination of Micro-Plane Damage Based Model and 3D Finite Elements Approach. American Journal of Applied Sciences, 5(2), 106-109. [CrossRef]
- Labibzadeh, M., et al., (2015). Efficiency Test of the Discrete Least Squares Meshless Method in Solving Heat Conduction Problems Using Error Estimation. Sharif: Civil Enineering, 31-2(3.2), 31-40. Sid. Https://Sid.Ir/Paper/127886/En.
- Loukas, A. (2020). What graph neural networks cannot learn: depth vs width. ICLR.
- Maghsoudi, M. Uncovering the skillsets required in computer science jobs using social network analysis. Educ Inf Technol 29, 12759–12780 (2024). [CrossRef]
- Makridakis, S. (2017). The forthcoming Artificial Intelligence (AI) revolution: Its impact on society and firms. *Futures*, 90, 46–60. https://doi.org/10.1016/j.futures.2017.03.006 (Published by Elsevier, a leading publisher in futures and economic forecasting).
- Moazezi Khah Tehran, A., Hassani, A., Mohajer, S., Darvishan, S., Shafiesabet, A., & Tashakkori, A. (2025). The Impact of Financial Literacy on Financial Behavior and Financial Resilience with the Mediating Role of Financial Self-Efficacy. International Journal of Industrial Engineering and Operational Research, 7(2), 38-55. [CrossRef]
- Naisipour, M., Afshar, M. H., Hassani, B., Zeinali, M., 1388, (2009), An error indicator for two-dimensional elasticity problems in the discrete least squares meshless method,8th International Congress on Civil Engineering,Shiraz, https://civilica.com/doc/62892.
- Naisipour, M., Ganji, S., Saeedpanah, I., Mehrakizadeh, B., Adib, A., Novel Insights in Deep Learning for Predicting Climate Phenomena, (2024), 14th International Conference on Computer and Knowledge Engineering (ICCKE), Mashhad, Iran, Islamic Republic of, 2024, pp. 314-325. [CrossRef]
- Naisipour, M., Saeedpanah, I., Adib, A., Neysipour, M. H., Forecasting El Niño Six Months in Advance Utilizing Augmented Convolutional Neural Network, (2024), 14th International Conference on Computer and Knowledge Engineering (ICCKE), Mashhad, Iran, Islamic Republic of, 2024, pp. 359-364. [CrossRef]
- Naisipour, M., Saeedpanah, I., & Adib, A., Novel deep learning method for forecasting ENSO. Journal of Hydraulic Structures, 14-25 (2024). [CrossRef]
- Naisipour, M., Saeedpanah, I. & Adib, A. Multimodal Deep Learning for Two-Year ENSO Forecast. Water Resour Manage 39, 3745–3775 (2025). [CrossRef]
- Naisipour, M., Saeedpanah, I., & Adib, A., Metrics matters: A deep assessment of deep learning CNN method for ENSO forecast, Atmospheric Research, (2025), 108545, ISSN 0169-8095. [CrossRef]
- Novelli, C., Hacker P., Morley J., Trondal J., Floridi L., A Robust Governance for the AI Act: AI Office, AI Board, Scientific Panel, and National Authorities. European Journal of Risk Regulation. 2025;16(2):566-590. [CrossRef]
- Pareja, A., et al. (2020). EvolveGCN: Evolving graph convolutional networks for dynamic graphs. AAAI.
- Parycek, P., Schmid, V. & Novak, AS. Artificial Intelligence (AI) and Automation in Administrative Procedures: Potentials, Limitations, and Framework Conditions. J Knowl Econ 15, 8390–8415 (2024). [CrossRef]
- Pleasants, J. Rethinking the Nature of Engineering: Attending to the Social Context of Engineering. Sci & Educ 33, 1353–1370 (2024). [CrossRef]
- Przegalinska, A., et al., Collaborative AI in the workplace: Enhancing organizational performance through resource-based and task-technology fit perspectives, International Journal of Information Management, Volume 81, 2025, 102853. [CrossRef]
- Qian, L., Cao, W. & Chen, L. Influence of artificial intelligence on higher education reform and talent cultivation in the digital intelligence era. Sci Rep 15, 6047 (2025). [CrossRef]
- Scarselli, F., Gori, M., Tsoi, A. C., Hagenbuchner M., and Monfardini, G., “The Graph Neural Network Model,” in IEEE Transactions on Neural Networks, vol. 20, no. 1, pp. 61-80, Jan. 2009. [CrossRef]
- Srinivasan, Thangaraj, R., Essential employable skill sets in management graduates for finance job roles in India. Higher Education, Skills and Work-based Learning 19 October 2021; 11 (5): 1224–1235. [CrossRef]
- Srujana, B. (2025). Unpacking New Forms of Labour Market Segmentation: Gender and Informality in Urban India. Forum for Development Studies, 1–27. [CrossRef]
- Terjesen, S., et al., Normative rationality in venture capital financing, Technovation, Volume 33, Issues 8–9, 2013, Pages 255-264, ISSN 0166-4972. [CrossRef]
- Tran, A.V., Khoa, B.T. Integrating leadership, identity, and knowledge systems for sustainable performance in the era of digital transformation. Discov Sustain 6, 887 (2025). [CrossRef]
- Velickovic, P., et al. (2018). Graph attention networks. ICLR.
- Verma, P., Transitioning from Software Engineer to Engineering Manager (A Journey of Paradigm Shift), International Journal of Computer & Organization Trends, 2022, 12(1):11-14. [CrossRef]
- Wang, B., and Gong, J., (2025), Educational Reform in the Era of Artificial Intelligence: From Autonomous Learning to Competition in Calculation Power. In Proceedings of the 2nd Guangdong-Hong Kong-Macao Greater Bay Area International Conference on Digital Economy and Artificial Intelligence (DEAI ‘25). Association for Computing Machinery, New York, NY, USA, 1355–1360. [CrossRef]
- Wu, Z., Pan, S., Chen, F., et al., “A Comprehensive Survey on Graph Neural Networks,” in IEEE Transactions on Neural Networks and Learning Systems, vol. 32, no. 1, pp. 4-24, Jan. 2021. [CrossRef]
- Zhang, j., Lu, J., Tang, X., Two-stage GNN-based fraud detection with camouflage identification and enhanced semantics aggregation, Neurocomputing, Volume 570, 2024, 127108. [CrossRef]
- Zhou, J., et al. Graph neural networks: A review of methods and applications, AI Open, Volume 1, 2020, Pages 57-81. [CrossRef]
Figure 3.
Visualization of the AI Job Posting Index Change (2020 vs. 2025). Comparison of Software Development (blue 2020, green 2025) and Data & Analytics indices. It shows a 13.7% decline for Software Development and 8.5% for Data & Analytics, reflecting reduced AI job demand by 2025.
Figure 3.
Visualization of the AI Job Posting Index Change (2020 vs. 2025). Comparison of Software Development (blue 2020, green 2025) and Data & Analytics indices. It shows a 13.7% decline for Software Development and 8.5% for Data & Analytics, reflecting reduced AI job demand by 2025.

Figure 4.
Visualization of the U.S. Job Postings Index by Management and IT Sectors (2020–2025). This chart compares Total U.S. Postings, Management, Software Development, and Data & Analytics. It shows Management surging to over 200 by 2022, stabilizing at 130–150 by 2025, while Software Development peaked at 150+ in 2021–2022 before dropping to 80–100, and Data & Analytics reached 140–150 before falling to 60–80, reflecting a shift toward management resilience amid declining IT demand.
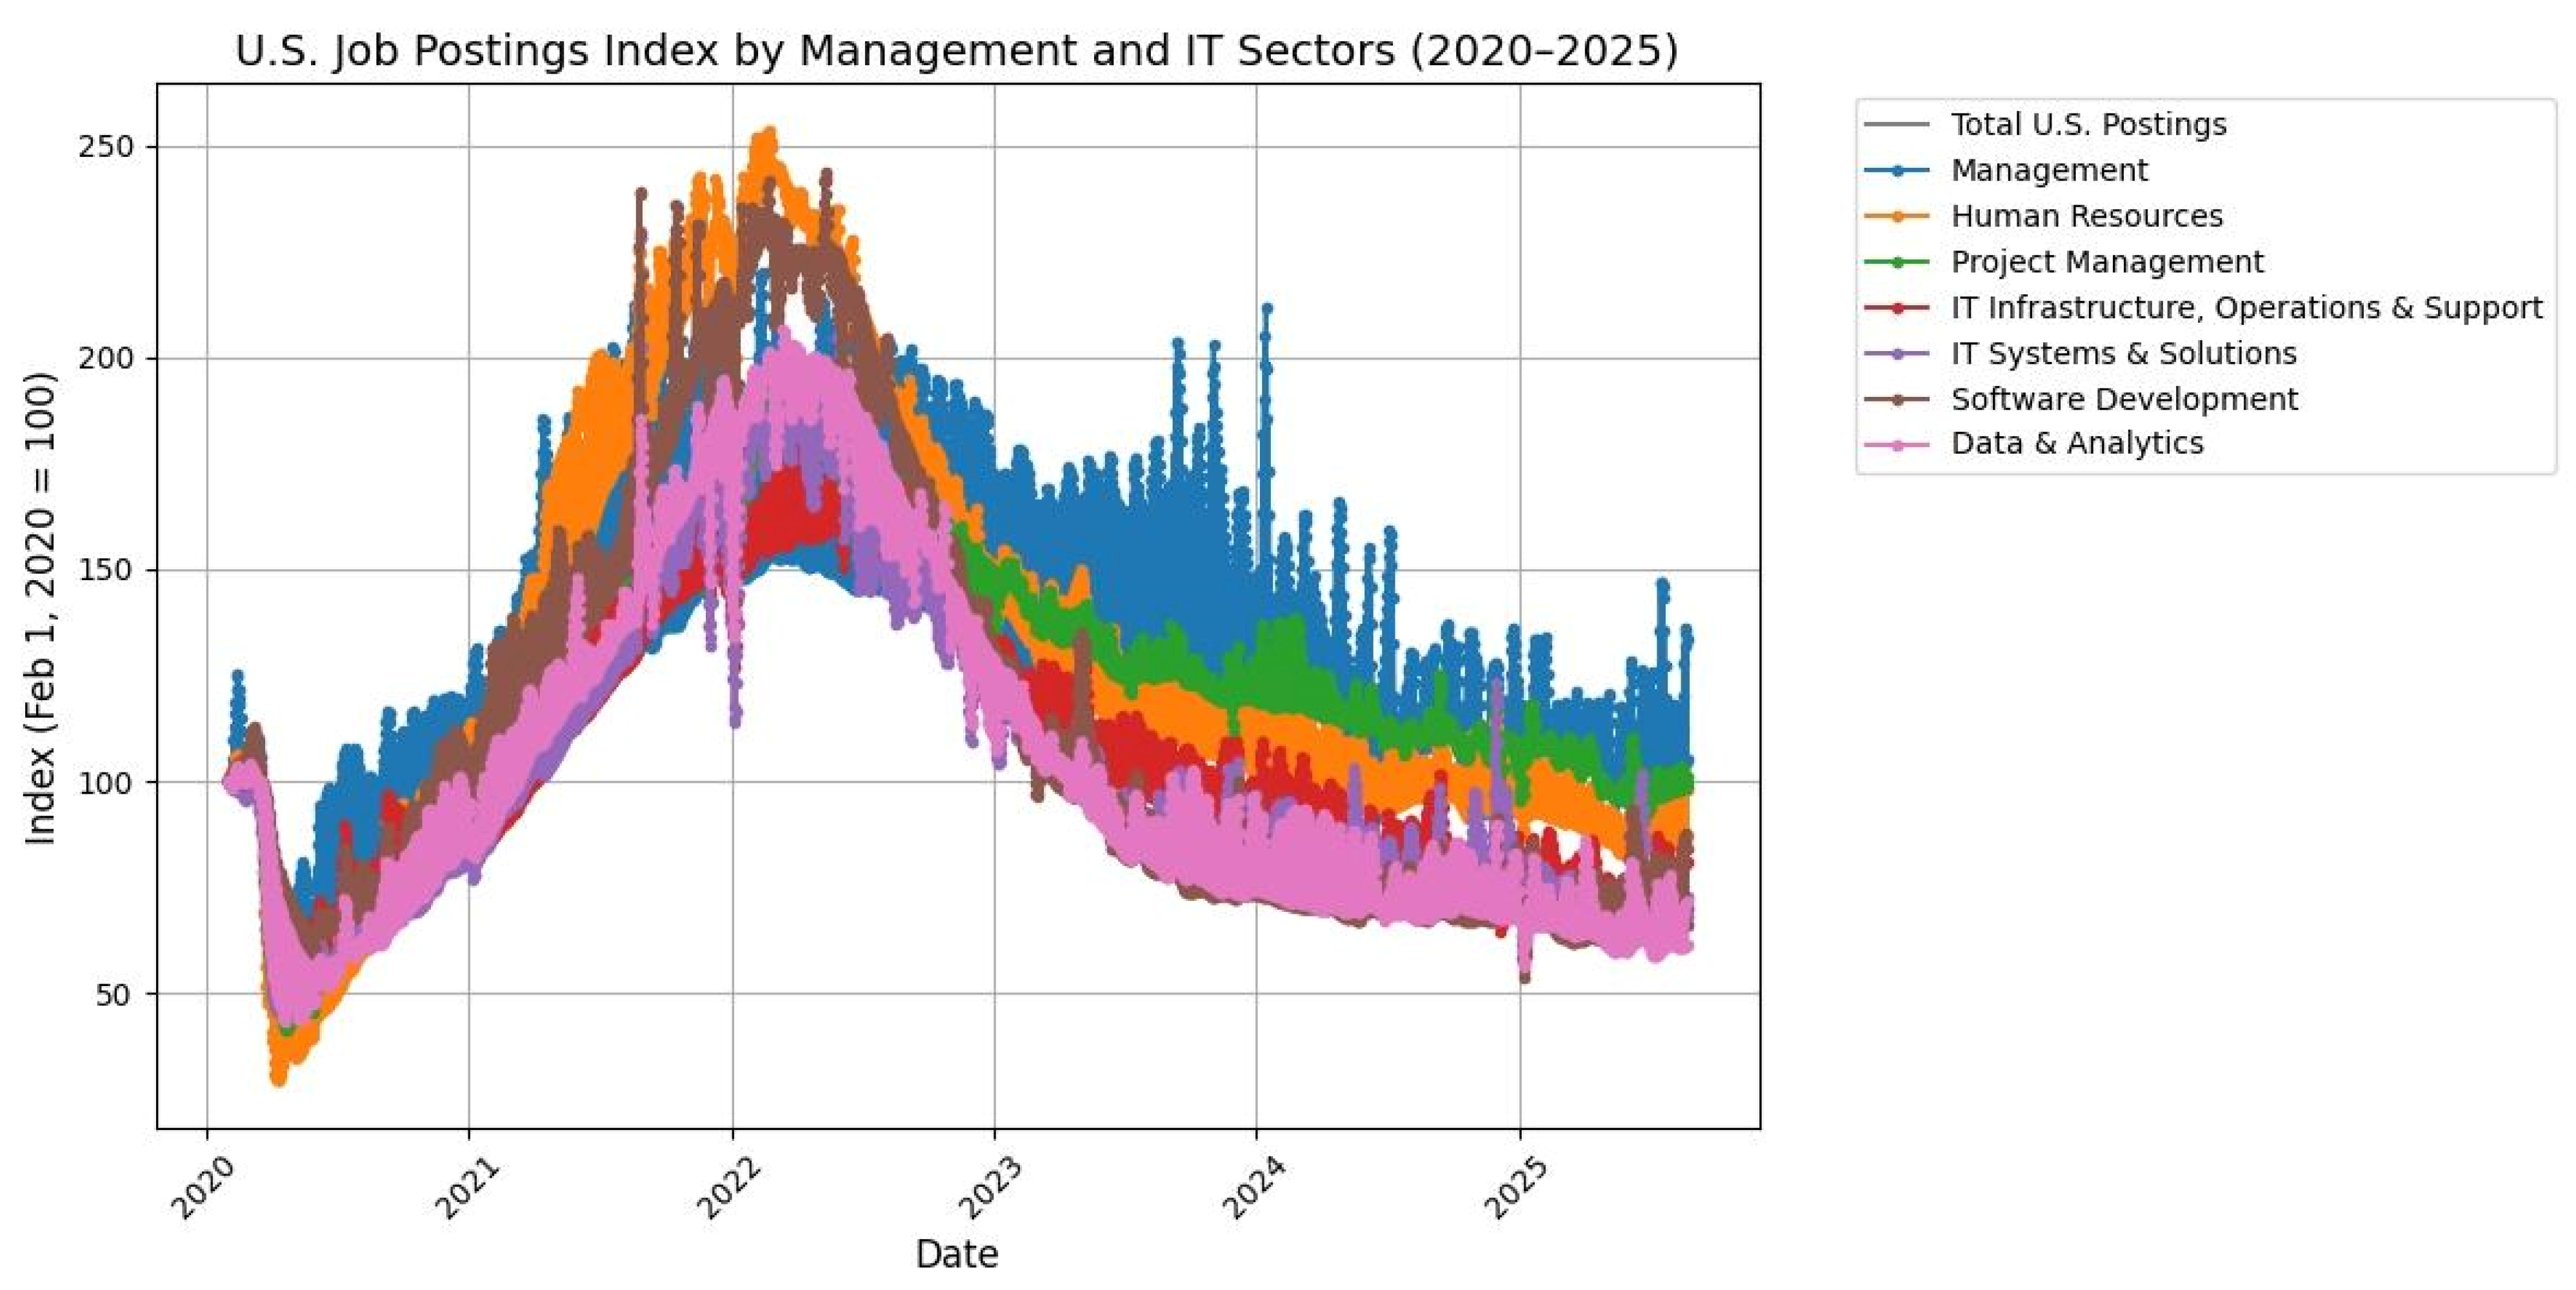
Figure 5.
Percentage Distribution of Related Occupations by Sector . This pie chart shows the proportional representation of occupational sectors among related jobs for IT engineers (SOC code 15), based on 274 cases from the Related Occupations dat.
Figure 5.
Percentage Distribution of Related Occupations by Sector . This pie chart shows the proportional representation of occupational sectors among related jobs for IT engineers (SOC code 15), based on 274 cases from the Related Occupations dat.
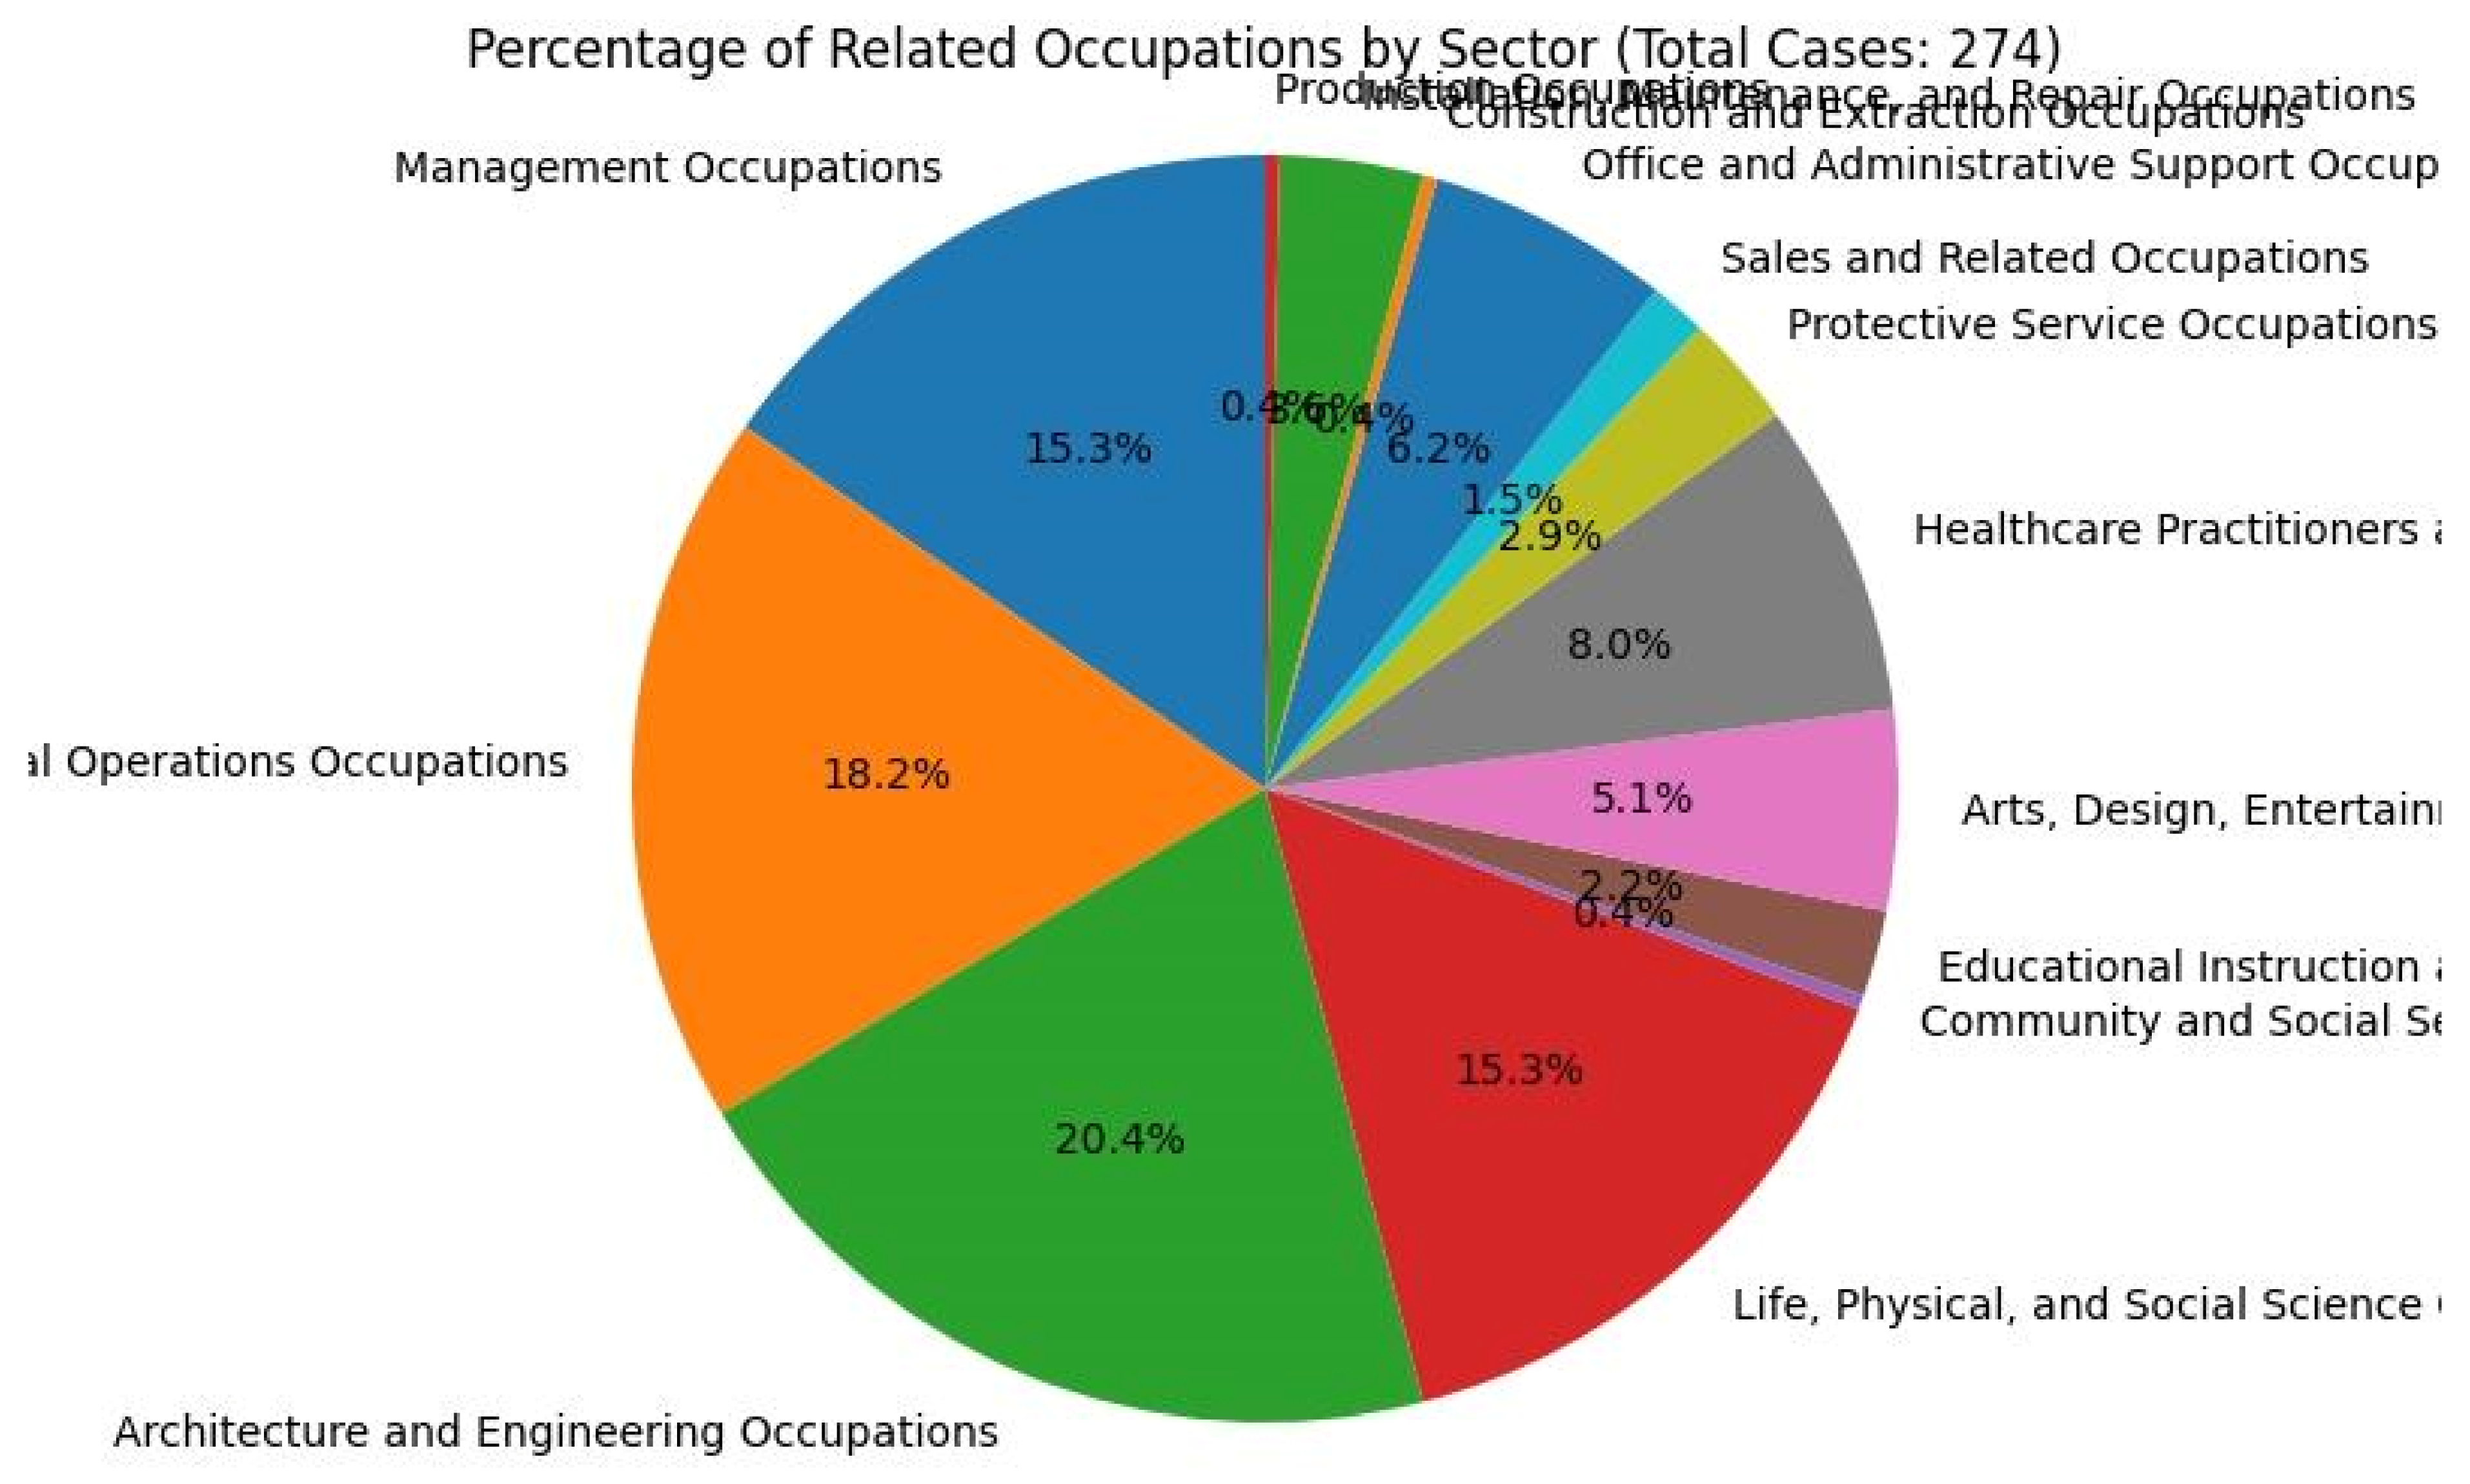
Disclaimer/Publisher’s Note: The statements, opinions and data contained in all publications are solely those of the individual author(s) and contributor(s) and not of MDPI and/or the editor(s). MDPI and/or the editor(s) disclaim responsibility for any injury to people or property resulting from any ideas, methods, instructions or products referred to in the content. |
© 2025 by the authors. Licensee MDPI, Basel, Switzerland. This article is an open access article distributed under the terms and conditions of the Creative Commons Attribution (CC BY) license (http://creativecommons.org/licenses/by/4.0/).
Copyright: This open access article is published under a Creative Commons CC BY 4.0 license, which permit the free download, distribution, and reuse, provided that the author and preprint are cited in any reuse.


