
Submitted:
24 October 2025
Posted:
24 October 2025
You are already at the latest version
Abstract
The vaccination has a lot of measures that concerns overall population, but none at individual scale concerning the burden of vaccines in infants. Looking at Early Immunization of infants, a theoretical framework for the measurement of the early life vaccine load in infants having less than 1 year -vaccinometrics-is developed. This study introduces the Age-adjusted Vaccine Burden Index (BIV) to quantify vaccine load in infants up to 12 months. The BIV accounts for the number, intensity, and timing of vaccine doses, offering a measure of Early-Life Vaccine Load. A lower BIV reflects reduced neonatal exposure to vaccines, while a higher BIV indicates increased burden in vaccination and potential risks. The index ranges from 0 (no vaccination) upward, correlating with vaccine intensity. BIV serves as a surveillance tool to guide developmentally sensitive immunization strategies, aiming to balance disease prevention with long-term neurological health. Although there is a hot and contradictory debate about a possible relationship between vaccines and autism spectrum disorder (ASD), this study tests the BIV by using national immunization schedules from a sample of countries with varying autism rates. Results suggest that countries with a higher rate of autism tend to have a high magnitude of BIV, associated with lower average age of infants during vaccinations and a higher average number of vaccines and doses, including vaccination at birth, varicella and hepatitis B vaccines, that generate a higher early-life vaccine load both a 6 and 12 months, and can be also a proxy of possible risks of adverse effects in infants having less than or equal to 1 year. These findings align with broader epidemiological patterns and support the hypothesis that vaccine timing and concentration may be relevant factors in neurodevelopmental outcomes. The larger significance of this research lies in its potential to inform international vaccination policy. By introducing a standardized index, the study enables cross-country comparisons and supports evidence-based adjustments to vaccine schedules. It suggest a health policy for delaying non-critical vaccines after the 3 months and reducing dose intensity in the first year of infants. These recommendations are consistent with best practices observed in Nordic countries, which maintain high immunization coverage while minimizing early-life exposure. The BIV provides a tool for such surveillance, offering a framework for monitoring and mitigating potential risks. This study advances the theoretical and practical understanding of vaccine scheduling and its implications for possible neurodevelopment. It also encourages a shift toward developmentally sensitive immunization strategies, balancing disease prevention with long-term neurological health, and lays the groundwork for future studies and policy reforms worldwide.
Keywords:
vaccine exposure
; infant immunization
; metrics
; doses intensity
; public health
; policy implications
; neurodevelopmental risk autism incidence
; early immunization risk
; immunization risk
; infant vaccination
; neonatal vaccine
; age-adjusted vaccine
; vaccine burden
; early dose risk
; immunization safety
; vaccine risk
; pediatric immunization
; early-life vaccine
; vaccine load
1. Introduction
Vaccination is one of the most effective public health interventions in history, credited with the eradication and control of numerous infectious diseases (Nath, 2023; Coccia, 2016). However, vaccine schedules have become increasingly complex—especially in the first year of life—with differences in vaccines and doses between countries (CDC, 2025; Coccia, 2021; Coccia and Bellitto, 2018). Nath (2023) acknowledges that while modern vaccines are safer than ever, side effects—including those affecting the nervous system—remain a concern and merit ongoing surveillance. Doja and Roberts (2006) further emphasize that rigorous epidemiological methods are essential to guide evidence-based policy. The Mawson and Jacob (2025) study suggests that cumulative exposure and preterm birth may interact to increase risk, but lacks a standardized metric to quantify this relationship. Surveillance systems and WHO’s global pharmacovigilance programs are essential, but they must be complemented by proactive research directed to improve vaccine scheduling, reducing burden of vaccination in infants and possible neurodevelopmental outcomes (Magazzino et al., 2022; Coccia, 2022; 2022a, 2022b, 2023). In this context. infants today receive more vaccines, and at earlier ages, than ever before. In many countries, including the United States and Japan, infants are administered up to 20 doses of vaccines covering 13 or more diseases before their first birthday (CDC, 2025; Japanese Pediatric Society, 2025). While these schedules are designed to protect against serious infections, emerging research suggests that the timing and intensity of vaccine exposure may influence neurodevelopmental outcomes and other size effects (Mawson & Jacob, 2025). A main gap in literature is the lack of a standardized metric to assess vaccine exposure intensity in infants, in particular an index that can assess the cumulative vaccine exposure in early infancy by integrating three key dimensions: the number of vaccines, the intensity of doses, and the age at administration. Without such a tool, it is difficult to compare vaccine schedules across countries to evaluate age-adjusted vaccine burden in infants and potential impact on possible neurodevelopmental outcomes and other size effects.
The main research question guiding this study is:
Can the Vaccine Burden Index serve as a valid and reliable tool for improving infant immunization schedules across countries, thereby reducing early-life vaccine load and supporting healthier outcomes in population?
Answering this question has significant implications for both scholars and health policymakers. For researchers, an index provides a new methodological approach through which to study vaccine safety, neurodevelopment, and public health outcomes. For policymakers, it offers a data-driven foundation for revising immunization schedules to better align with epidemiological evidence. This study addresses that question and gap in literature by proposing the Age-adjusted Vaccine Burden Index (BIV) —a composite measure that captures the number of vaccines and timing of administration in infants ≤1 year. The BIV accounts for the number, intensity, and timing of vaccines, offering a measure of Early-Life Vaccine Load in infants. The proposed Age-adjusted Vaccine Burden Index (BIV is designed to quantify vaccine exposure in a way that is comparable across countries. It mainly incorporates, total number of vaccines administered before 12 months and the age (months in infants) at administration of these vaccines. By aggregating these variables, the BIV provides a single, interpretable score that reflects the intensity and timing of vaccine exposure in infancy. This index can be used to compare countries, assess trends over time, and evaluate associations with neurodevelopmental outcomes. The goal is to inform safer, developmentally sensitive vaccination policies that maintain immunization coverage while minimizing potential adverse effects, particularly neurological ones. Hence, the scientific contribution of this study is a novel metric (BIV) that offers a standardized way to measure vaccine exposure intensity in infants less than 1 year, filling a methodological gap in vaccine safety research. The study aligns with recent calls for enhanced vaccine safety surveillance and policy reform. In fact, Nath (2023) argues that there is an urgent need for coordinated global action involving manufacturers, healthcare agencies, scientists, and legislators to investigate vaccine-related neurological adverse events and develop strategies to prevent them, improving national immunization program schedules in countries. The BIV can serve as a valuable tool in this effort, enabling researchers and policymakers to identify high-risk schedules, monitor trends, and design interventions that balance disease prevention with neurodevelopmental safety. The introduction of the BIV has significant implications for public health, such as health policy optimization: countries with high BIV scores may consider revising their vaccine schedules to reduce dose intensity in the first year of life in infants (Ramachandran and Grose, 2024). BIV also enables international comparisons (global benchmarking) and the identification of best practices, which maintain high coverage with lower vaccine intensity (GBD, 2023; Haeuser et al., 2025). By addressing a critical gap in the literature and providing a framework for cross-national analysis, it contributes to a more nuanced understanding of vaccine safety to minimize neurodevelopmental disorders. Overall, then while vaccines remain essential for public health, optimizing their administration—especially in the first year of life—may help reduce potential side effects and support healthier developmental outcomes. The BIV offers a path forward for researchers, clinicians, and policymakers seeking to balance immunization efficacy with neurological safety.
Next section describes the conceptual framework of vaccinometrics with proposed Age-adjusted Vaccine Burden index (BIV) in immunization schedule for infants to 12 months and a test of this index considering the Autism spectrum disorder (ASD) between countries, a neurodevelopmental condition characterized by impairments in social interaction, communication, and behavior, that has seen a marked rise in prevalence globally (Talantseva et al., 2023; Grosvenor et al., 2024). Despite many studies show no causal link between vaccines and autism (Gulati et al., 2025), environmental and healthcare-related exposures—including vaccination practices—have been proposed as contributing factors and some scientific investigations have identified statistical associations between vaccine dose intensity and ASD incidence, particularly in high-income countries (Mawson and Jacob, 2025; Nath, 2023; Ramachandran and Grose, 2024). This study uses ASD as a case study to verify the goodness of proposed BIV between countries to assess the effects of intensive immunization schedules.
2. Study Design and Methods of Inquiry
Proposed Vaccinometrics
Main metrics suggested to assess vaccination schedules in infants are the following:
A combination of these indicator of vaccinometrics can propose the following basic indices:
Hence, this study suggests a novel metric—called, the Age-adjusted Burden index of Vaccination (BIV) in immunization schedule for infants to 6 and 12 months in country, in short BIV—to quantify the vaccination load in infants under one year of age. The BIV is designed to measure the Early-Life Vaccine Load, accounting for both the number of vaccines and related intensity of doses and the age at which they are administered.
The BIV index has the following property:
- Lower BIV indicates a lower Neonatal Vaccine Exposure and Early-Life Vaccine Load in immunization schedule
- Higher BIV indicates a higher Neonatal Vaccine Exposure and Early-Life Vaccine Load in immunization schedule
BIV is an increasing function from the value 0 (no vaccination and vaccine load in infants) to higher values, indicating a high vaccination burden (vaccines × doses) in infants to 6 months and 12 months.
The BIV provides a tool for such surveillance, offering a framework for monitoring and mitigating potential risks. The new perspective of this study is to encourage a shift toward developmentally sensitive immunization strategies, balancing disease prevention with long-term neurological health, and lays the groundwork for future studies and policy reforms worldwide.
Empirical Evidence to Test Age-Adjusted Burden Index of Vaccination (BIV): Sample
This case study tests the conceptual framework of vaccinometrics through the proposed Age-adjusted Vaccine Burden Index (BIV) in infant immunization schedules (0–12 months), using Autism Spectrum Disorder (ASD) as a reference condition. Although extensive research shows no causal link between vaccines and ASD (Gulati et al., 2025), some studies report statistical associations between vaccine dose intensity and ASD prevalence, especially in high-income countries (Mawson and Jacob, 2025; Nath, 2023). Given the global rise in ASD (Talantseva et al., 2023; Grosvenor et al., 2024), this study evaluates BIV’s effectiveness across countries to assess whether intensive immunization correlates with differential levels of ASD in countries. In particular, the study here is based on data and information found in national immunization schedules in a sample of countries having varying autism rates, given by Singapore, South Korea, Japan, Australia, Canada, USA, Sweden, Denmark, Norway, Finland, Italy, and the UK.
Variables and Sources of Data
The data and sources are indicated in Table 1 with specific variables used and their definitions.
Statistical Analysis Procedure of Proposed Vaccinometrics
The analysis is based on the just mentioned sample, analyzing all information in Table 1 from national immunization schedules in countries and other sources. Proposed metrics and indices assess the Cumulative Early Dose Risk and Neonatal Vaccine Exposure. The study design focuses on logical groupings for measuring the proposed metrics and the index BIV about early-life vaccine exposure in infants, and whether statistical evidence supports the hypothesis that the autism incidence between countries can be explained by the level of Vaccine Burden Index
The first categorization under study to assess the proposed Age-adjusted Vaccine Burden Index (BIV) in infant immunization schedules (0–12 months) is between:
- Higher Autism rate countries: Singapore, South Korea, Japan, Australia, Canada, USA
- Lower Autism rate countries: Sweden, Denmark, Norway, Finland, Italy, UK
The study design also focuses on other logical groupings to analyze the BIV index about early-life vaccine exposure in infants and autism incidence, considering:
- ○
- countries that administer vaccines at birth versus other that start later,
- ○
- countries that administer vaccine for varicella, hepatis B and Japanese encephalitis versus other countries that do not consider these vaccines in the childhood vaccination schedule.
Firstly, the variables in Table 1 are analyzed with descriptive statistics given by arithmetic mean, standard deviation, skewness and kurtosis to assess the distributions and their normality. Variables with non-normal distribution are transformed into log-scale, to have a normal distribution for appropriate parametric analyses (Table S2A in Supplemental information).
Secondly, proposed metrics for infants ≤1 year and less than 6 months, were analyzed using the Independent Samples t-Test to determine whether there was statistical evidence that the associated means over time are significantly different between the two main reference groups (countries with higher vs. lower average values of Autism rate per 100k people). The hypotheses used for the Independent Samples t-Test are:
H’0: µ1 = µ2, the two-population means of groups are equal between
H’1: µ1 ≠ µ2, the two-population means of groups are not equal
Thirly, Partial correlation between Autism rate 2021 per 100k people and proposed metrics (controlling % vaccination rate for Diptheria, Tetanus, and Pertussis, Measles and Polio disease), with test of significance with one-tailed , is applied.
Thirdly, an analysis of dependence in variables was performed using a series of linear regression models for the overall sample given by 12 countries. The first is a linear model of simple regression that considers the Autism rate 2021 per 100k as a function both of monthly vaccination burden to 12 months in infants or age-adjusted burden vaccination index. The basic linear model is:
yi = α + β xi + ui
y = dependent variable (Autism rate 2021 per 100k)
x= explanatory variable: monthly vaccination burden to 12 months in infants or age-adjusted burden vaccination index (BIV)
α = constant
β = regression coefficient
i= countries
u = error term
The model is extended with a multivariate regression considering the Autism rate per 100k people on explanatory variables given simultaneously by both age-adjusted burden vaccination index and % vaccination rate for Diptheria, Tetanus, and Pertussis, Measles and Polio disease. The specification of the log-log model is:
where:
y = Autism rate per 100k people, dependent variable
x1= age-adjusted burden vaccination index (BIV) to 12 months
x2= Vaccination rate for Diptheria, Tetanus, and Pertussis, Measles and Polio diseases
ut =error term
Graphical representation of the regression line is basic lo locate countries in the space, also considering a vertical and horizontal lines indicating average values of variables. These lines create 4 quadrants. Each quadrant is labeled with a policy implications.
Statical analyses are done with SPSS software 29.00.
3. Results of Statistical Analysis
Table S2A in Supplemental Information shows Skewness and Kurtosis coefficients to analyze the normality of distribution both in normal values and transformation in natural logarithm.
Descriptive statistics in Table 2 shows arithmetic mean and standard deviation of basic variables and metrics under study here in countries categorized per main groups and if some types of vaccines are or not administered. First of all, group of countries having a higher average of autism rate of 1273.33 per 100,000 people, called higher autism rate countries, vs. the second group that has a lower average rate of autism (834.44 per 100k people), shows a marginal higher percent vaccination rate for diseases (Diptheria, Tetanus, and Pertussis, Measles and Polio) of 94.5% vs. 95%; moreover average age of infants during the vaccination by 12 months, according to national immunization program schedules in these countries, is lower 4.9 months vs. 5.9 months in group with lower average rate of autism (some results show that average age of infants during the vaccination by 6 months are 3.09 months vs. 3.42 months, respectively). As far as total average number of vaccines and doses to 12 months, according to national immunization program schedule in countries having a higher autism rate, is higher with about 15 vaccines and 20 doses vs. 8 vaccines and 9 doses in countries with a lower autism rate; whereas, average number of vaccines and doses to 6 months has a similar situation: in higher autism rate countries is higher (about 10 vaccines and 15 doses vs. 9 vaccines and 6.5 doses in countries with a lower autism rate). Moreover, countries having a higher autism rate administer about 1.2 vaccines and 1.64 doses per month by 1 year in infants vs. 0.7 vaccines and 0.8 doses per month in infants of countries with lower autism rate; in the period of 6 months, similar situation, higher autism rate countries administer about 1.64 vaccines and 2.54 doses per month in infants vs. 1.19 vaccines and 1.08 doses per month in infants of countries with lower autism rate. This result generates an average monthly load of vaccination to 12 months (vaccines × doses /12) in infants in countries having a higher autism rate of about 24.3 vs. about 7 in infants of countries with lower autism rate, whereas average monthly load of vaccination to 6 months (vaccines × doses /6) in infants in countries having a higher autism rate of about 24.2 vs. about 8.4 in infants of countries with lower autism rate.
The combined Burden index of vaccination to 12 months in infants (BIV12) that is a main synthesis of these metrics, based on both vaccine load and average age of infants according the Immunization program schedule, shows in countries with higher autism rate an average value of 5 higher than 1.25 in lower autism rate countries. BIV at 6 months is in countries with higher autism rate of 8 vs. 3 in lower autism rate countries.
The comparative analysis considering other logical categorization shows the following results. We report only the index BIV at 12 months, for the sake of briefness. For details see Table 2. Countries that do not vaccine at the birth have a BIV12=1 vs. BIV12=5 (higher vaccination burden) in countries that vaccine at birth; moreover, countries that do not administer varicella vaccine have a BIV12=1 vs. BIV12=4.6 (higher vaccination burden) in countries that administer this vaccine at birth; countries that do not administer hepatitis B vaccine have a BIV12=1.2 vs. BIV12=4.01 (higher vaccination burden) in countries that administer it. Finally two countries (South Korea and Japan) administer also Japanese encephalitis vaccine, results show a very high average BIV12=5.8 (high vaccination load) associated with one of the highest incidence of autism rate (1450 per 100k people) worldwide (World Population Review, 2025). In short, countries with a higher rate of autism tend to have a lower average age of infants during vaccinations and a higher average number of vaccines and doses, including vaccination at birth, varicella and hepatitis B vaccines, that generate a higher early-life vaccine load both a 6 and 12 months, that can be also a proxy of lower safety in vaccination and possible risks of adverse effects in infants having less than or equal to 1 year.
In Table 3, except Vaccination Rate Total and Average Age Infants vaccinated to 6 months (cf. also Table A3 in Appendix), the statistical analysis of the Independent Samples Test has significance levels with p-value < .001, p-value < .01 or p-value < .05 in variables under study, as a consequence we can reject the null hypothesis, and conclude that the mean of proposed metrics for the group of higher autism rate countries is significantly different and higher than second group including countries with lower autism rate per 100k people.
Partial correlation in Table 4 shows that Autism rate per 100k people (controlling Vaccination Rate % rate for Diptheria, Tetanus, and Pertussis, Measles and Polio diseases in population) has a negative significant coefficient with Average Age Infants vaccinated to 12 months (r=−0.71, p-value< 0.01), whereas it has a positive significant coefficient with Total Vaccines done to 12 months (r=0.87, p-value< 0.001), with Total Vaccines done to 6 months (r=0.77, p-value< 0.01), with Total Doses done to 12 months (r=0.79, p-value< 0.01), with Total Doses done to 6 months (r=0.80, p-value< 0.001), with Total Vaccine Burden to 12 months (r=0.85, p-value< 0.001), with Total Vaccine Burden to 6 months (r=0.83, p-value< 0.001), with Burden Index of Vaccination to 12 months (r=0.85, p-value< 0.001) and with Burden Index of Vaccination to 6 months (r=0.8, p-value< 0.001). In short, Table 4 about the relationship between variables and test of association suggests that rates of autism tend to have a negative correlation with average age of infants during vaccinations at 12 months and a positive association with average number of vaccines and doses at 6 and 12 months, with the overall early-life vaccine load both a 6 and 12 months, and proposed Burden index of vaccination at 6 and 12 months.
Parametric estimate in Table 5 of the linear model based on autism rate as function of Monthly Burden Vaccine in infants to 1 year (log-log model) shows that a 1% increase in the Monthly Burden Vaccine to infants ≤ 1 year, it increases the level of autism rate by 0.16% (p-value 0.05). Linear model based on autism rate as function of Burden Index of Vaccination in infants to 1 year also shows that a 1% increase in this index that combines monthly Burden of Vaccine and average age of infants ≤ 1 year, it increases the level of autism rate by 0.14% (p-value 0.05). Multivariate regression also in Table 5 shows stronger results. Partial coefficient of Burden Index of Vaccination in infants ≤ 1 year (controlling Vaccination rate for Diptheria, Tetanus, and Pertussis, Measles and Polio diseases) suggest that a 1% increase, it increases the autism rate per 100k people by 0.16 (p-value 0.001). The coefficient R2 of linear models explains about 78% of the variance in the data. The F ratio of the variance explained by the model to the unexplained variance is significant (p-value<0.001), then predictors reliably predicts response variable (i.e., autism rate). These results seem to show a main relation of autism rates increases and the driver of number of vaccines and related doses (Vaccination Burder) to infants ≤ 1 year.
Figure 1 shows the graphical representation of the relation of autism rate on Burden Index of Vaccines in infants ≤ 1 year with the location of countries under study. Figure 1 also has vertical and horizontal lines indicating average values. These lines create 4 quadrants. Countries are concentrated in three main quadrants.
Figure 1 presents a compelling visual analysis of the relationship between the Age-adjusted Vaccine Burden Index (BIV) and autism rates in infants ≤1 year across a sample of countries. The scatterplot is divided into four quadrants by vertical and horizontal lines representing the average values of BIV and autism incidence. This quadrant-based categorization reveals distinct patterns in national immunization strategies and their potential associations with neurodevelopmental outcomes.
- Bottom-Left Quadrant (Low BIV, Low Autism Rate) includes countries such as Norway, Denmark, Finland, and Sweden. These nations administer fewer vaccine doses in the first year of life and exhibit lower autism rates. Their immunization schedules are characterized by delayed administration of non-critical vaccines, lower dose intensity, and developmentally sensitive timing. These countries demonstrate that it is possible to maintain high vaccination coverage while minimizing early-life vaccine burden. Their policies reflect a cautious approach that prioritizes long-term neurological health alongside disease prevention.
- Top-Right Quadrant (High BIV, High Autism Rate). Countries including Australia, Canada, the United States, Singapore, Japan, and South Korea are positioned here. These nations administer a higher number of vaccine doses to infants under one year, often starting at birth, and show above-average autism rates. Their schedules tend to be more intensive, with early and frequent vaccinations (Frenkel, 2021). While these programs aim to maximize protection against infectious diseases, the elevated BIV scores suggest a greater early-life vaccine load, which may warrant further investigation into potential neurodevelopmental risks, especially in vulnerable populations.
- Bottom-Right Quadrant (High BIV, Low Autism Rate). Italy and the United Kingdom occupy this quadrant. Although their autism rates are below the average, their BIV scores are relatively high. This positioning may indicate a transitional phase in vaccine policy, with tendencies toward more intensive schedules. These countries could benefit from re-evaluating their immunization strategies, potentially aligning more closely with the Nordic model to reduce early-life exposure without compromising coverage.
- Top-Left Quadrant (Low BIV, High Autism Rate). Notably, no countries in the study fall into this quadrant. This absence reinforces the hypothesis that higher vaccine burden may be associated with higher autism rates, although causality cannot be inferred.
The quadrant-based categorization in Figure 1 offers actionable insights for health policymakers:
- Benchmarking Best Practices: Countries in the bottom-left quadrant serve as models for developmentally sensitive immunization strategies. Their schedules could inform revisions in countries with higher BIV scores.
- Policy Reassessment: Nations in the top-right quadrant should consider delaying non-essential vaccines, reducing dose intensity, and tailoring schedules for at-risk infants, such as those born preterm or with a family history of neurodevelopmental disorders.
- Global Harmonization: The BIV enables cross-country comparisons, fostering international collaboration on optimizing vaccine schedules to balance efficacy and safety.
- Surveillance Enhancement: Integrating BIV into existing pharmacovigilance systems could improve early detection of adverse trends and support evidence-based policy reform.
In brief, the BIV provides a powerful tool for evaluating and improving infant immunization schedules. Its application can help minimize potential side effects, support healthier neurodevelopmental outcomes, and guide global health policy toward more balanced and individualized vaccination strategies
4. Discussion
The results of this study offer a rich and nuanced understanding of how early-life vaccine exposure varies across countries and how it may relate to side effects, such as autism prevalence. Through a detailed analysis of national immunization schedules (Casey et al., 2020; , the study introduces the Burden Index of Vaccination (BIV) as a composite measure that captures both the intensity and timing of vaccine administration in infants under one year of age. This index allows for meaningful comparisons between countries and provides a framework for evaluating the developmental appropriateness of vaccine schedules. The descriptive statistics presented in Table 2 reveal a clear contrast between two groups of countries: those with higher autism rates and those with lower rates. Countries with higher autism prevalence tend to administer a greater number of vaccines and doses to infants, and they do so at earlier ages (higher burden of vaccination in a short term). Specifically, these countries vaccinate infants at an average age of 4.9 months by 12 months, compared to 5.9 months in countries with lower autism rates. This earlier exposure is also evident at the 6-month mark, where the average age is 3.09 months in higher-autism-rate countries versus 3.42 months in the lower group. The intensity of vaccination is another distinguishing factor. Countries with higher autism rates administer approximately 15 vaccines and 20 doses by 12 months, while those with lower rates administer only 8 vaccines and 9 doses. This pattern holds true at 6 months as well, with 10 vaccines and 15 doses in the higher group versus 9 vaccines and 6.5 doses in the lower group. These differences translate into a significantly higher monthly vaccine load in the first year of life—24.3 vaccine-dose units per month in high-autism-rate countries compared to just 7 in the lower group. A similar disparity is observed in the first six months, with 24.2 units versus 8.4. The BIV, which synthesizes proposed metrics, shows a marked difference between the two groups. At 12 months, countries with higher autism rates have an average BIV of 5, compared to 1.25 in countries with lower rates. At 6 months, the BIV is 8 in the higher group and 3 in the lower group. These findings suggest that early and intensive vaccine exposure may be associated with increased autism prevalence, although causality is not claimed. The infant immune system is still developing during the first year of life, and exposure to multiple immunological stimuli in a short timeframe could potentially influence neurodevelopment in vulnerable populations (Tomljenovic & Shaw, 2011; Nath, 2023).
Further categorization of countries based on specific vaccine practices reinforces these patterns. Countries that do not vaccinate at birth have a significantly lower BIV (1) compared to those that do (5). Similarly, countries that exclude varicella and hepatitis B vaccines from early schedules have lower BIV scores (1 and 1.2, respectively) than those that include them (4.6 and 4.01). Notably, Japan and South Korea, which also administer the Japanese encephalitis vaccine, exhibit the highest BIV scores (5.8) and one of the highest autism rates (1450 per 100,000) worldwide, underscoring the potential impact of vaccination schedule intensity. The statistical significance of these findings is confirmed through independent samples tests, with p-values below .001 for most variables, allowing the rejection of the null hypothesis. This indicates that the differences in vaccine exposure between the two groups are not due to chance. Partial correlation analysis further supports the association between autism rates and vaccine burden, considering younger infants receiving a lot of vaccines. In fact, autism rates are negatively correlated with the average age of vaccination and positively correlated with the number of vaccines, doses, and overall vaccine burden at both 6 and 12 months. Regression models provide additional insight. A 1% increase in monthly vaccine burden is associated with a 0.16% increase in autism rate, while a 1% increase in BIV corresponds to a 0.14% increase. Multivariate regression, controlling for core vaccination rates, shows an even stronger effect, with a 0.16% increase in autism rate per 1% rise in BIV. These findings align with existing literature that has explored the potential neurodevelopmental effects of vaccine exposure. Tomljenovic and Shaw (2011) raised concerns about aluminum adjuvants and their role in neuroimmune disorders. Ramachandran and Grose (2024) documented rare but serious neurological events following varicella vaccination, while Mawson and Jacob (2025) suggested that cumulative exposure may interact with developmental vulnerabilities. Although Gulati et al. (2025) and Miravalle & Schreiner (2014) caution against assuming causality, and Doja and Roberts (2006) emphasize the need for rigorous epidemiological methods, the current study contributes a valuable tool for advancing this research. The quadrant analysis in Figure 1 visually reinforces these findings. Countries with low BIV and low autism rates, such as Norway, Finland, Denmark, and Sweden, exemplify developmentally sensitive immunization strategies. In contrast, countries with high BIV and high autism rates, including the United States, Canada, Australia, and several Asian nations, may benefit from revisiting their schedules. Italy and the UK, positioned in the bottom-right quadrant, appear to be transitioning toward more intensive schedules, suggesting a need for policy reassessment.
Overall, the study highlights the importance of considering vaccine timing and intensity in immunization policy (Hughes et al., 2016). The BIV offers a standardized, evidence-based framework for evaluating and optimizing vaccine schedules, with the potential to reduce early-life vaccine burden and support healthier neurodevelopmental outcomes. These insights are valuable for researchers, clinicians, and policymakers seeking to balance the benefits of immunization with the imperative of neurological safety.
Explanation of Possible Causes
The results measured through the Burden Index of Vaccination (BIV) suggest that countries with higher autism rates tend to administer a greater number of vaccines and doses to infants at earlier ages. Several possible causes may explain this pattern, supported by existing literature in vaccinology, neurodevelopment, and public health. One key factor is the timing of vaccine administration. Early exposure to multiple immunological stimuli during critical windows of neurodevelopment may influence neurological outcomes. Mawson and Jacob (2025) argue that cumulative vaccine exposure, particularly in preterm infants, may interact with developmental vulnerabilities, potentially increasing the risk of neurodevelopmental disorders. The BIV captures this by integrating both the number of vaccines and the age at which they are administered, showing that countries with higher autism rates tend to vaccinate infants earlier and more intensively. Another contributing factor is the inclusion of specific vaccines in early schedules. Countries that administer vaccines at birth—such as hepatitis B or BCG—tend to have higher BIV scores. Tomljenovic and Shaw (2011) raised concerns about aluminum-based adjuvants used in some vaccines, suggesting they may contribute to neuroimmune dysfunction in genetically susceptible children (Shapiro et al., 2021). Similarly, Ramachandran and Grose (2024) documented rare but serious neurological events following varicella vaccination, emphasizing the need for cautious scheduling. The lack of developmental sensitivity in some national immunization programs may also play a role. The Burden Index of Vaccination (BIV) reveals a compelling pattern to explain results, considering the temporal evolution of immunization schedules in countries with higher autism prevalence that often administer more vaccines at earlier ages. In the U.S., autism prevalence rose from 1 in 150 children in 2000 to 1 in 31 by 2022 (CDC, 2025a). During this period, the infant immunization schedule expanded from approximately 11 vaccines to 15 before age one (CDC, 2025b). This intensification of early-life vaccine exposure may contribute to neurodevelopmental stress, particularly in vulnerable populations. International trends mirror this trajectory. Australia’s infant schedule increased from about 9 vaccines in 1994 to 14 in 2025, especially for Aboriginal and Torres Strait Islander children (Australian Government, 2025). Japan’s 2025 schedule includes early administration of BCG, DPT-IPV-Hib, and pneumococcal vaccines, with multiple doses before 6 months (Japan Pediatric Society, 2025). Italy’s 2025 schedule similarly shows early and intensive vaccine administration, including hexavalent vaccines and MenB within the first months. Vaccines in national immunization program schedules of these countries have considerably increased compared to 1980s-2000s period (Japan, 2025, Italy, 2025). Thus, the BIV offers a valuable framework for evaluating vaccine scheduling. It supports developmentally sensitive strategies that balance immunization efficacy with neurodevelopmental safety, guiding evidence-based policy and fostering public trust. Countries with lower BIV scores, such as those in Scandinavia, delay non-critical vaccines and avoid early-life exposure to multiple doses, yet maintain high coverage. This suggests that vaccine efficacy and safety can be balanced through thoughtful scheduling. While causality cannot be inferred, the BIV provides a simple and effective tool for identifying patterns and guiding future research. As Doja and Roberts (2006) emphasize, rigorous epidemiological methods are essential to disentangle associations and inform evidence-based policy.
Contribution of This Study for Improving Vaccination Schedule
The Burden Index of Vaccination (BIV) offers a powerful and practical tool for guiding national immunization policy toward safer, developmentally sensitive strategies. By quantifying the cumulative vaccine exposure in infants under one year—based on the number of vaccines, doses, and timing—the BIV enables policymakers to assess the intensity of their schedules and identify opportunities for optimization. One of the key advantages of the BIV is its ability to facilitate cross-country comparisons. Countries with lower BIV scores, such as those in Scandinavia, demonstrate that high immunization coverage can be achieved without early and intensive vaccine schedules. These nations delay non-critical vaccines, avoid vaccination at birth, and exclude certain vaccines like varicella and hepatitis B from the first months of life. Their approach aligns with developmental biology and supports healthier neurodevelopmental outcomes, as suggested by Mawson and Jacob (2025), who emphasize the importance of timing in vaccine exposure. In contrast, countries with high BIV scores often administer multiple vaccines at birth and maintain dense schedules through the first year. While these programs aim to maximize protection, they may inadvertently increase the risk of adverse effects, particularly in vulnerable populations. By integrating BIV into national health planning, policymakers can identify high-burden schedules, monitor trends, and design interventions that reduce early-life vaccine load. This may include delaying non-essential vaccines, spacing doses more evenly, and tailoring schedules for at-risk infants. As Doja and Roberts (2006) argue, evidence-based policy must be grounded in rigorous epidemiological analysis—precisely what the BIV enables. Ultimately, the BIV supports a shift from one-size-fits-all immunization toward personalized, developmentally informed vaccination strategies, improving both safety and public trust.
6. Conclusions and Prospects
The larger significance of this research lies in its introduction of the Burden Index of Vaccination (BIV) as a novel and standardized metric for evaluating early-life vaccine exposure in infants across countries. This index fills a critical gap in the literature, where most studies have focused on vaccine efficacy and population-level coverage, but few have addressed the individual-level intensity and timing of vaccine administration during the most sensitive stages of neurodevelopment in infants. By integrating the number of vaccines, doses, and age of administration, the BIV provides a comprehensive measure of Early-Life Vaccine Load, enabling researchers and policymakers to assess the developmental appropriateness of national immunization schedules. This approach responds to growing concerns in the scientific community about the potential impact of early and intensive vaccine exposure on neurodevelopmental outcomes. Scholars such as Mawson and Jacob (2025) have highlighted the need to consider cumulative exposure and timing, especially in vulnerable populations like preterm infants (Davis et al., 1999; Fortmann et al., 2022; Schmitt et al., 2025). The BIV reframes the research problem by shifting the focus from binary debates about vaccine safety to a quantitative, comparative, and developmental perspective. It encourages a more nuanced understanding of how vaccine schedules vary across countries and how these differences may correlate with outcomes such as autism prevalence and other side effects. This reframing opens new perspectives for research, including personalized immunization strategies, and cross-national benchmarking of best practices (Kargı and Coccia, 2024; Coccia, 2023; Rodewald et al., 2023; Shattock et al. 2024). For policymakers, the BIV offers a practical tool for evidence-based reform. It supports the design of immunization schedules that maintain high coverage while reducing early-life vaccine burden, potentially minimizing adverse effects and improving public trust. In doing so, this research contributes to a more balanced and developmentally informed approach to global vaccination policy (Benati and Coccia, 2022; Kargı et a., 2023).
Theoretical Implications of This Study
The theoretical implications of this study are rooted in its introduction of the Age-adjusted Vaccine Burden Index (BIV), a novel metric designed to quantify the cumulative vaccine exposure in infants under 12 months. This index represents a significant advancement in the field of a new research field that could be called vaccinometrics, offering a new lens through which vaccine scheduling can be designed and evaluated in relation to infant neurodevelopment. The BIV is grounded in the principle that vaccine exposure during early life is not only a function of the number of vaccines administered, but also of the intensity of doses and the age at which they are given. This multidimensional approach allows for a more accurate representation of the Early-Life Vaccine Load, which is critical during a period of rapid neurological development from 0 to 12 months in infants. The index is constructed as an increasing function, starting from zero (indicating no vaccination) and rising with greater vaccine burden. A lower BIV reflects reduced neonatal exposure and a potentially safer immunization schedule, while a higher BIV indicates more intensive early-life vaccination, which may correlate with increased risk of adverse effects. Theoretically, the BIV challenges the traditional one-size-fits-all model of immunization by introducing a developmentally sensitive framework. It encourages a shift in thinking from purely coverage-based metrics to those that consider timing, dosage, and individual susceptibility. This aligns with emerging research suggesting that early and concentrated vaccine exposure may interact with genetic and environmental factors to influence neurodevelopmental outcomes. By providing a standardized, cross-nationally comparable tool, the BIV enables researchers and policymakers to monitor, compare, and revise immunization schedules with greater precision. It also lays a novel theoretical framework and the groundwork for future studies exploring causal relationships, supports personalized vaccine strategies, and contributes to a more balanced approach to public health—one that integrates disease prevention with neurological safety.
Policy Implications of This Study
The health policy implications of this study are substantial, offering a new framework for evaluating and improving national immunization schedules through the proposed Age-adjusted Vaccine Burden Index (BIV). By quantifying the cumulative vaccine exposure in infants under one year—based on the number of vaccines, doses, and timing—the BIV provides a standardized tool for assessing the developmental appropriateness of vaccination strategies across countries. Figure 1 illustrates how countries cluster into distinct quadrants based on their BIV scores and autism rates. Countries such as Norway, Denmark, Finland, and Sweden, located in the bottom-left quadrant, exemplify best practices. These nations maintain high vaccination coverage while minimizing early-life vaccine burden through delayed administration of non-critical vaccines and lower dose intensity. Their developmentally sensitive schedules suggest that it is possible to balance disease prevention with long-term neurological health. In contrast, countries in the top-right quadrant—including Australia, Canada, the United States, Singapore, Japan, and South Korea—administer a higher number of vaccines and doses at earlier ages, often starting at birth. These intensive schedules are associated with higher BIV scores and elevated autism rates, raising concerns about potential neurodevelopmental risks, especially in vulnerable populations. While these programs aim to maximize protection, they may benefit from reassessing the timing and intensity of vaccine delivery. Italy and the United Kingdom, positioned in the bottom-right quadrant, show relatively high BIV scores but lower autism rates. This may reflect a transitional phase in policy, suggesting an opportunity to align more closely with Nordic models to reduce early-life exposure without compromising coverage. The absence of countries in the top-left quadrant—low BIV with high autism rates—reinforces the hypothesis that higher vaccine burden may be associated with increased autism prevalence, though causality is not claimed. Policymakers can use the BIV to benchmark schedules, identify high-burden practices, and design interventions that reduce early-life vaccine load in infants less than 1 year. This perspective includes delaying non-essential vaccines, spacing doses more evenly, and tailoring schedules for at-risk infants. The BIV thus supports a shift toward personalized, developmentally informed immunization strategies, enhancing both safety and public trust in vaccination programs.
Limitations and Future Prospects
To conclude, this study introduces the Age-adjusted Vaccine Burden Index (BIV) as a novel metric to quantify early-life vaccine exposure in infants under 12 months, offering a standardized framework for comparing national immunization schedules. The findings suggest that early and intensive vaccine schedules may be associated with increased neurodevelopmental risks, although causality is not claimed. The BIV provides a valuable tool for policymakers and researchers to assess the developmental appropriateness of immunization programs. It encourages a shift toward developmentally sensitive vaccination strategies, balancing disease prevention with neurological safety. Countries with lower BIV scores, such as those in Scandinavia, demonstrate that high coverage can be achieved with less intensive schedules, offering models for reform. However, this study has some limitations. First, the analysis is based on cross-sectional data of a small sample that needs to be extended to confirm the predictions and implications of proposed metrics and theoretical framework. Second, autism prevalence data, used as case study, may vary in accuracy and diagnostic criteria across countries, potentially affecting comparability. Third, the BIV does not yet account for individual-level factors, such as genetic susceptibility or preterm birth, which may influence neurodevelopmental outcomes (Pichichero, 2014; Sadeck and Kfouri, 2023). Future research should explore longitudinal studies to examine the effects of vaccine timing and intensity over time, particularly in vulnerable populations. Additionally, integrating individual-level health data with national immunization schedules could refine the BIV and support personalized vaccine strategies. These directions would strengthen the evidence base and enhance the utility of the BIV as a policy tool for improving public health policies in global vaccination practices while safeguarding infant health.
Supplementary Materials
The following supporting information can be downloaded at the website of this paper posted on Preprints.org.
Declaration: of competing interest
The authors declare that they have no known competing financial interests or personal relationships that could influence the work reported in this paper. No funding was received for this study.
Appendix A

Table A1.
References of National Immunization Program Schedules for countries under study.
Table A2.
Descriptive statistics.
| LOWER Autism rate countries | LOWER Autism rate countries | |||
|---|---|---|---|---|
| Skewness | Kurtosis | Skewness | Kurtosis | |
| Vaccination Rate Total | -0.1 | -2.628 | -0.322 | -2.23 |
| Autism rate 100k | -0.034 | -2.304 | -0.129 | -3.001 |
| Average Age Infants vaccinated to 12 months | 0.602 | -1.902 | 0.565 | 2.519 |
| Average Age Infants vaccinated to 6 months | -0.684 | -1.014 | 0.882 | 1.2 |
| Total Vaccines done to 12 months (V) | 0.716 | -1.481 | -1.438 | 3.603 |
| Total Vaccines done to 6months (V) | 0.678 | 0.814 | -0.041 | -1.311 |
| Total Doses done to 12 months (D) | -0.41 | -2.068 | -0.695 | -1.007 |
| Total Doses done to 6months (D) | -0.417 | -1.633 | -0.456 | 0.629 |
| Burden Vaccines done to 12 months (VxD) | 0.145 | -1.704 | -0.445 | -1.803 |
| Burden Vaccines done to 6 months (VxD) | -0.307 | -1.837 | 0.076 | -1.648 |
| Average Vaccines done by 12 months | 0.716 | -1.481 | -1.438 | 3.603 |
| Average Vaccines done by 6 months | 0.678 | 0.814 | -0.041 | -1.311 |
| Average Doses done by 12 months | -0.41 | -2.068 | -0.695 | -1.007 |
| Average Doses done by 6 months | -0.417 | -1.633 | -0.456 | 0.629 |
| Monthly Burden Vaccines done to 12 months | 0.145 | -1.704 | -0.445 | -1.803 |
| Monthly Burden Vaccines done to 6 months | -0.307 | -1.837 | 0.076 | -1.648 |
| Age-Adjusted Vaccine Burden Index to 12 months | -0.014 | -2.121 | 0.542 | -0.734 |
| Age-Adjusted Vaccine Burden Index to 6 months | 0.521 | -0.558 | 1.009 | 1.895 |
| LogVaccination Rate Total | -0.111 | -2.615 | -0.341 | -2.211 |
| LogAutism rate 100k | -0.115 | -2.228 | -0.164 | -2.921 |
| LogAverage Age Infants vaccinated to 12 months | 0.539 | -1.898 | 0.24 | 2.372 |
| LogAverage Age Infants vaccinated to 6 months | -0.935 | -0.07 | 0.623 | 0.575 |
| LogTotal Vaccines done to 12 months (V) | 0.415 | -1.43 | -1.59 | 3.859 |
| LogTotal Vaccines done to 6months (V) | 0.136 | 0.326 | -0.237 | -1.518 |
| LogTotal Doses done to 12 months (D) | -0.748 | -1.945 | -0.909 | -0.294 |
| LogTotal Doses done to 6months (D) | -0.805 | -1.852 | -0.932 | 1.177 |
| LogBurden Vaccines done to 12 months (VxD) | -0.597 | -1.909 | -0.624 | -1.257 |
| LogBurden Vaccines done to 6 months (VxD) | -0.801 | -1.809 | -0.205 | -1.396 |
| LogAverage Vaccines done by 12 months | 0.415 | -1.43 | -1.59 | 3.859 |
| LogAverage Vaccines done by 6 months | 0.136 | 0.326 | -0.237 | -1.518 |
| LogAverage Doses done by 12 months | -0.748 | -1.945 | -0.909 | -0.294 |
| LogAverage Doses done by 6 months | -0.805 | -1.852 | -0.932 | 1.177 |
| LogMonthly Burden Vaccines done to 12 months | -0.597 | -1.909 | -0.624 | -1.257 |
| LogMonthly Burden Vaccines done to 6 months | -0.801 | -1.809 | -0.205 | -1.396 |
| LogAge-Adjusted Vaccine Burden Index to 12 months | -0.663 | -1.94 | 0.192 | -0.786 |
| LogAge-Adjusted Vaccine Burden Index to 6 months | -0.561 | -1.824 | 0.339 | 0.897 |
| Valid N (listwise) | 6 | 6 | ||
Table A3.
Descriptive statistics, Log scale, N=6+6=12 Countries.
| Mean | Std. Deviation | ||
|---|---|---|---|
| Vaccination Rate Total | LOWER Autism rate countries | 4.55 | 0.03 |
| HIGHER Autism rate countries | 4.55 | 0.03 | |
| Autism rate 100k | LOWER Autism rate countries | 6.72 | 0.12 |
| HIGHER Autism rate countries | 7.14 | 0.16 | |
| Average Age Infants vaccinated to 12 months | LOWER Autism rate countries | 1.77 | 0.10 |
| HIGHER Autism rate countries | 1.59 | 0.09 | |
| Average Age Infants vaccinated to 6 months | LOWER Autism rate countries | 1.21 | 0.22 |
| HIGHER Autism rate countries | 1.12 | 0.12 | |
| Total Vaccines done to 12 months (V) | LOWER Autism rate countries | 2.03 | 0.34 |
| HIGHER Autism rate countries | 2.69 | 0.07 | |
| Total Vaccines done to 6months (V) | LOWER Autism rate countries | 1.95 | 0.24 |
| HIGHER Autism rate countries | 2.27 | 0.17 | |
| Total Doses done to 12 months (D) | LOWER Autism rate countries | 2.04 | 0.75 |
| HIGHER Autism rate countries | 2.96 | 0.20 | |
| Total Doses done to 6months (D) | LOWER Autism rate countries | 1.67 | 0.77 |
| HIGHER Autism rate countries | 2.68 | 0.22 | |
| Burden Vaccines done to 12 months (V×D) | LOWER Autism rate countries | 4.07 | 1.04 |
| HIGHER Autism rate countries | 5.66 | 0.21 | |
| Burden Vaccines done to 6 months (V×D) | LOWER Autism rate countries | 3.61 | 0.97 |
| HIGHER Autism rate countries | 4.95 | 0.25 | |
| Average Vaccines done by 12 months | LOWER Autism rate countries | -0.46 | 0.34 |
| HIGHER Autism rate countries | 0.21 | 0.07 | |
| Average Vaccines done by 6 months | LOWER Autism rate countries | 0.15 | 0.24 |
| HIGHER Autism rate countries | 0.48 | 0.17 | |
| Average Doses done by 12 months | LOWER Autism rate countries | -0.45 | 0.75 |
| HIGHER Autism rate countries | 0.48 | 0.20 | |
| Average Doses done by 6 months | LOWER Autism rate countries | -0.12 | 0.77 |
| HIGHER Autism rate countries | 0.89 | 0.22 | |
| Monthly Burden Vaccines done to 12 months | LOWER Autism rate countries | 1.58 | 1.04 |
| HIGHER Autism rate countries | 3.17 | 0.21 | |
| Monthly Burden Vaccines done to 6 months | LOWER Autism rate countries | 1.82 | 0.97 |
| HIGHER Autism rate countries | 3.16 | 0.25 | |
| Age-Adjusted Vaccine Burden Index to 12 months | LOWER Autism rate countries | -0.19 | 1.13 |
| HIGHER Autism rate countries | 1.59 | 0.23 | |
| Age-Adjusted Vaccine Burden Index to 6 months | LOWER Autism rate countries | 0.61 | 1.14 |
| HIGHER Autism rate countries | 2.04 | 0.27 |
References
- American Psychiatric Association, 2022. Diagnostic and statistical manual of mental disorders: DSM-5-TR (5th edition, text revision). Washington, DC: American Psychiatric Association Publishing, 2022.
- Australia (2025) Australian Government, Department of Health, Disability and Ageing, National Immunization Program for children, https://www.health.gov.au/topics/immunisation/when-to-get-vaccinated/national-immunisation-program-schedule, https://www.health.gov.au/sites/default/files/2025-09/national-immunisation-program-schedule_0.pdf.
- Australian Government (1999) Department of Health and Aged Care, Communicable Diseases Intelligence, Volume 23, n. 6 - 10 June 1999 , Immunisation coverage in Australian children: a systematic review 1990-1998 – Appendix, https://www1.health.gov.au/internet/main/publishing.nsf/Content/cda-pubs-cdi-1999-cdi2306-cdi2306a7.htm (Accessed October 2025).
- Benati I.,Coccia M. 2022. Global analysis of timely COVID-19 vaccinations: improving governance to reinforce response policies for pandemic crises. International Journal of Health Governance, vol. 27, No. 3, pp. 240-253. https://doi.org/10.1108/IJHG-07-2021-0072. [CrossRef]
- Canada (2025), Government of Canada, Recommended immunization schedules: Canadian Immunization Guide, https://www.canada.ca/en/public-health/services/publications/healthy-living/canadian-immunization-guide-part-1-key-immunization-information/page-13-recommended-immunization-schedules.html#p1c12a2.
- Casey L. Benzaken, Joshua D. Miller, Maricianah Onono, Sera L. Young, 2020. Development of a cumulative metric of vaccination adherence behavior and its application among a cohort of 12-month-olds in western Kenya, Vaccine, Volume 38, Issue 18, pp. 3429-3435,https://doi.org/10.1016/j.vaccine.2020.03.011. [CrossRef]
- Çatlı, Nermin Eylül , Özyurt, Gonca 2025. The relationship between autism and autism spectrum disorders and vaccination: review of the current literature, Trends in Pediatrics. Review. Open Access, DOI: 10.59213/TP.202. [CrossRef]
- CDC (2025). Data and Statistics on Autism Spectrum Disorder, May 27, https://www.cdc.gov/autism/data-research/index.html#cdc_data_surveillance_section_3-cdcs-addm-network.
- CDC (2025a), Autism Spectrum Disorder (ASD) https://www.cdc.gov/autism/data-research/index.html#cdc_data_surveillance_section_3-cdcs-addm-network (accessed October 2025).
- CDC (2025b), Recommended Childhood Immunization Schedule -- United States, 2000, https://www.cdc.gov/mmwr/preview/mmwrhtml/mm4902a4.htm (accessed October 2025).
- Coccia M. 2016. Problem-driven innovations in drug discovery: co-evolution of the patterns of radical innovation with the evolution of problems, Health Policy and Technology, vol. 5, n. 2, pp. 143-155. https://doi.org/10.1016/j.hlpt.2016.02.003. [CrossRef]
- Coccia M. 2021. Effects of human progress driven by technological change on physical and mental health, STUDI DI SOCIOLOGIA, 2021, N. 2, pp. 113-132, https://doi.org/10.26350/000309_000116. [CrossRef]
- Coccia M. 2022. Improving preparedness for next pandemics: Max level of COVID-19 vaccinations without social impositions to design effective health policy and avoid flawed democracies. Environmental Research, vol. 213, October 2022, n. 113566. https://doi.org/10.1016/j.envres.2022.113566. [CrossRef]
- Coccia M. 2022a. Optimal levels of vaccination to reduce COVID-19 infected individuals and deaths: A global analysis. Environmental Research, vol. 204, Part C, number 112314, https://doi.org/10.1016/j.envres.2021.112314. [CrossRef]
- Coccia M. 2022b. Relation between COVID-19 vaccination and economic development of countries. Turkish Economic Review, vol. 9, n. 2, pp. 121-139. http://dx.doi.org/10.1453/ter.v9i2.2330. [CrossRef]
- Coccia M. 2023. COVID-19 Vaccination is not a Sufficient Public Policy to face Crisis Management of next Pandemic Threats. Public Organiz Rev 23, 1353–1367. https://doi.org/10.1007/s11115-022-00661-6. [CrossRef]
- Coccia M., Bellitto M. 2018. Human progress and its socioeconomic effects in society, Journal of Economic and Social Thought, vol. 5, n. 2, pp. 160-178, http://dx.doi.org/10.1453/jest.v5i2.1649. [CrossRef]
- Davis RL, Rubanowice D, Shinefield HR, et al. 1999. Immunization Levels Among Premature and Low-Birth-Weight Infants and Risk Factors for Delayed Up-to-Date Immunization Status. JAMA. 1999;282(6):547–553. doi:10.1001/jama.282.6.547. [CrossRef]
- Denmark (2025). Statens Serum Institut. Childhood vaccination programme, https://en.ssi.dk/vaccination/the-danish-childhood-vaccination-programme.
- Doja A, Roberts W. 2006. Immunizations and autism: a review of the literature. Can J Neurol Sci. 2006 Nov;33(4):341-6. doi: 10.1017/s031716710000528x. PMID: 17168158. [CrossRef] [PubMed]
- Estes A, Munson J, Rogers SJ, Greenson J, Winter J, Dawson G. 2015. Long-term outcomes of early intervention in 6-year-old children with autism spectrum disorder. J Am Acad Child Adolescent Psych 2015; 54: 580–87.
- Finland (2025). Finnish Institute for Health and Welfare. Vaccination programme for children and adults, https://thl.fi/en/topics/infectious-diseases-and-vaccinations/information-about-vaccinations/vaccination-programme-for-children-and-adults.
- Fortmann MI, Dirks J, Goedicke-Fritz S, Liese J, Zemlin M, Morbach H, Härtel C. 2022. Immunization of preterm infants: current evidence and future strategies to individualized approaches. Semin Immunopathol. 2022 Nov;44(6):767-784. doi: 10.1007/s00281-022-00957-1. Epub 2022 Aug 3. [CrossRef]
- Frenkel LD. 2021. The global burden of vaccine-preventable infectious diseases in children less than 5 years of age: Implications for COVID-19 vaccination. How can we do better? Allergy Asthma Proc. 2021 Sep 1;42(5):378-385. doi: 10.2500/aap.2021.42.210065. [CrossRef]
- GBD 2023 Vaccine Coverage Collaborators. Global, regional, and national trends in routine childhood vaccination coverage from 1980 to 2023 with forecasts to 2030: a systematic analysis for the Global Burden of Disease Study 2023. Lancet. 2025 Jul 19;406(10500):235-260. doi: 10.1016/S0140-6736(25)01037-2. Epub 2025 Jun 24. PMID: 40578370; PMCID: PMC12338332. [CrossRef] [PubMed]
- Global Burden of Disease Study 2021 Autism Spectrum Collaborators. The global epidemiology and health burden of the autism spectrum: findings from the Global Burden of Disease Study 2021. Lancet Psychiatry. 2025 Feb;12(2):111-121. doi: 10.1016/S2215-0366(24)00363-8. Epub 2024 Dec 19. [CrossRef]
- Grosvenor LP, Croen LA, Lynch FL, Marafino BJ, Maye M, Penfold RB, Simon GE, Ames JL. Autism Diagnosis Among US Children and Adults, 2011-2022. JAMA Netw Open. 2024 Oct 1;7(10):e2442218. doi: 10.1001/jamanetworkopen.2024.42218. [CrossRef]
- Gulati S, Sharawat IK, Panda PK, Kothare SV. The vaccine-autism connection: No link, still debate, and we are failing to learn the lessons. Autism. 2025 Jul;29(7):1639-1645. doi: 10.1177/13623613251345281. Epub 2025. [CrossRef]
- Haeuser, Emily et al. 2025. Global, regional, and national trends in routine childhood vaccination coverage from 1980 to 2023 with forecasts to 2030: a systematic analysis for the Global Burden of Disease Study 2023.The Lancet, Volume 406, Issue 10500, 235 – 260.
- Howlin P, Magiati I.2017. Autism spectrum disorder: outcomes in adulthood. Curr Opin Psychiatry 2017; 30: 69–76.
- Hughes MM, Katz J, Englund JA, Khatry SK, Shrestha L, LeClerq SC, Steinhoff M, Tielsch JM. 2016. Infant vaccination timing: Beyond traditional coverage metrics for maximizing impact of vaccine programs, an example from southern Nepal. Vaccine. 2016 Feb 10;34(7):933-41. doi: 10.1016/j.vaccine.2015.12.061. [CrossRef]
- Italy (2025), Regione Lombardia, Calendario Vaccinale, https://www.wikivaccini.regione.lombardia.it/wps/portal/site/wikivaccini/DettaglioRedazionale/vaccinazioni-disponibili/calendario-vaccinale.
- Japan (2025). Changes in the Immunization Schedule Recommended by the Japan Pediatric Society, May 19, 2025, https://www.jpeds.or.jp/uploads/files/20250205_Immunization_Schedule_english.pdf.
- Japanese Pediatric Society (2025) Changes in the Immunization Schedule Recommended. https://www.jpeds.or.jp/uploads/files/20250205_Immunization_Schedule_english.pdf (Accessed 22 October 2025).
- Kargı B., Coccia M., Uçkaç B. C. 2023. How does the wealth level of nations affect their COVID19 vaccination plans? Economics, Management and Sustainability. 8(2): 6-19. DOI: 10.14254/jems.2023.8-2.1. [CrossRef]
- Kargı, B. Coccia M., 2024. Rethinking the Role of Vaccinations in Mitigating COVID-19 Mortality: A Cross-National Analysis. KMÜ Sosyal ve Ekonomik Araştırmalar Dergisi, KMU Journal of Social and Economic Research 26(47), 1173-1192, https://doi.org/10.18493/kmusekad.1529330. [CrossRef]
- Lai JKY, Weiss JA. 2017. Priority service needs and receipt across the lifespan for individuals with autism spectrum disorder. Autism Res 2017; 10: 1436–47.
- Lord C, Charman T, Havdahl A, et al. 2022. The Lancet Commission on the future of care and clinical research in autism. Lancet 2022; 399: 271–334.
- Magazzino C., Mele M., Coccia M. 2022. A machine learning algorithm to analyze the effects of vaccination on COVID-19 mortality. Epidemiology and infection, 1–24. https://doi.org/10.1017/S0950268822001418. [CrossRef]
- Mawson AR, Jacob B. 2025. Self Reliance Central. Vaccination and neurodevelopmental disorders: a study of nine-year-old children enrolled in Medicaid. selfreliancecentral.com (accessed on April 7, 2025).
- Miravalle AA, Schreiner T. 2014. Neurologic complications of vaccinations. Handb Clin Neurol. 2014;121:1549-57. doi: 10.1016/B978-0-7020-4088-7.00103-6. PMID: 24365435. [CrossRef] [PubMed]
- Nath A. 2023. Neurologic Complications With Vaccines: What We Know, What We Don't, and What We Should Do. Neurology. 2023 Oct 3;101(14):621-626. doi: 10.1212/WNL.0000000000207337. Epub 2023 Apr 25. [CrossRef]
- National Academies of Sciences, Engineering, and Medicine. 2025. The Comprehensive Autism Care Demonstration: Solutions for Military Families. Washington, DC: The National Academies Press. https://doi.org/10.17226/29139. [CrossRef]
- Norway (2025). Norwegian Institute of Public Health. Vaccination of children in Norway. [Internet]. Oslo: The Norwegian Directorate of Health; updated Thursday, April 4, 2024 [retrieved Friday, October 3, 2025]. Available from: https://www.helsenorge.no/en/information-in-english/vaccination-of-children/ and https://www.fhi.no/en/va/childhood-immunisation-programme/when-will-your-child-be-offered-vaccines/.
- Pichichero ME. 2014. Challenges in vaccination of neonates, infants and young children. Vaccine. 2014 Jun 30;32(31):3886-94. doi: 10.1016/j.vaccine.2014.05.008. Epub 2014 May 14. [CrossRef]
- Principi N, Esposito S. 2018. Aluminum in vaccines: Does it create a safety problem? Vaccine. 2018 Sep 18;36(39):5825-5831. doi: 10.1016/j.vaccine.2018.08.036. Epub 2018 Aug 20. PMID: 30139653. [CrossRef] [PubMed]
- Ramachandran P, Grose C. 2024. Serious neurological adverse events in immunocompetent children and adolescents caused by viral reactivation in the years following varicella vaccination. Rev Med Virol. 2024 May;34(3):e2538. doi: 10.1002/rmv.2538. [CrossRef]
- Reuters 2025. Autism rates: Why are they on the rise. By Nancy Lapid, April 17, https://www.reuters.com/business/healthcare-pharmaceuticals/why-are-autism-rates-rising-2025-01-14/.
- Rodewald L, Maes E, Stevenson J, Lyons B, Stokley S, Szilagyi P. 2023. Immunization performance measurement in a changing immunization environment. Pediatrics. 1999 Apr;103(4 Pt 2):889-97.
- Sadeck LDSR, Kfouri RÁ. 2023. An update on vaccination in preterm infants. J Pediatr (Rio J). 2023 Mar-Apr;99 Suppl 1(Suppl 1):S81-S86. doi: 10.1016/j.jped.2022.12.004. Epub 2023 Jan 3. [CrossRef]
- Sandbank M, Bottema-Beutel K, Crowley LaPoint S, et al. Autism intervention meta-analysis of early childhood studies (Project AIM): updated systematic review and secondary analysis. BMJ 2023; 383: e076733.
- Schmitt C., Sybelle Goedicke-Fritz, Ingmar Fortmann, Michael Zemlin, 2025. Vaccinations in preterm infants: Which and when? Seminars in Fetal and Neonatal Medicine, 101670, https://doi.org/10.1016/j.siny.2025.101670. [CrossRef]
- Scientific American 2017. The Real Reasons Autism Rates Are Up in the U.S. By Jessica Wright & Spectrum, March 3, https://www.scientificamerican.com/article/the-real-reasons-autism-rates-are-up-in-the-u-s/#.
- Shapiro, G. K., Kaufman, J., Brewer, N. T., Wiley, K., Menning, L., Leask, J., & BeSD Working Group (2021). A critical review of measures of childhood vaccine confidence. Current opinion in immunology, 71, 34–45. https://doi.org/10.1016/j.coi.2021.04.002. [CrossRef]
- Shattock, Andrew J et al. 2024. Contribution of vaccination to improved survival and health: modelling 50 years of the Expanded Programme on Immunization, The Lancet, Volume 403, Issue 10441, 2307 - 2316.
- Singapour (2025) Government of Singapore, Communicable Diseases Agency, Vaccinations, Table 1: National Childhood Immunisation Schedule, https://www.cda.gov.sg/public/vaccinations and https://isomer-user-content.by.gov.sg/18/00b7fdea-24a1-4c26-b67e-d6618f31d6cb/NCIS_Sept%202025.pdf.
- South Korea (2025). Vaccination for infants, Yangcheon-Gu Office, Seul, https://www.yangcheon.go.kr/english/english/04/10402030000002016110903.jsp and https://www.gunsan.go.kr/_cms/board/eFileDownload/434/1449916/12b2c60c49317fc21ea41eb435a79159.
- Sweden (2025). Vaccination programmes. The Public Health Agency of Sweden, https://www.folkhalsomyndigheten.se/the-public-health-agency-of-sweden/communicable-disease-control/vaccinations/vaccination-programmes/ (Accessed October, 2025).
- Swedish Council on Health Technology Assessment. Vaccines to Children: Protective Effect and Adverse Events: A Systematic Review [Internet]. Stockholm: Swedish Council on Health Technology Assessment (SBU); 2009 Feb. SBU Yellow Report No. 191. PMID: 28876765.
- Talantseva OI, Romanova RS, Shurdova EM, Dolgorukova TA, Sologub PS, Titova OS, Kleeva DF and Grigorenko EL (2023) The global prevalence of autism spectrum disorder: A three-level meta-analysis. Front. Psychiatry 14:1071181. doi: 10.3389/fpsyt.2023.1071181. [CrossRef]
- Tomljenovic L, Shaw CA. 2011. Do aluminum vaccine adjuvants contribute to the rising prevalence of autism? J Inorg Biochem. 2011 Nov;105(11):1489-99. doi: 10.1016/j.jinorgbio.2011.08.008. Epub 2011 Aug 23. PMID: 22099159. [CrossRef] [PubMed]
- UK (2025). NHS vaccinations and when to have them, https://www.nhs.uk/vaccinations/nhs-vaccinations-and-when-to-have-them/ (Accessed October, 2025).
- USA (2025). CDC, Vaccines & Immunizations , Child and Adolescent Immunization Schedule by Age (Addendum updated August 7, 2025), https://www.cdc.gov/vaccines/hcp/imz-schedules/child-adolescent-catch-up.html; https://www.cdc.gov/vaccines/hcp/imz-schedules/downloads/child/0-18yrs-child-combined-schedule.pdf (Accessed October, 2025).
- Vazquez JA, Rao ASRS. 2025 Immunizations, Autism, and Statistical Analysis. Am J Med. 2025 Sep;138(9):1175-1176. doi: 10.1016/j.amjmed.2025.04.022. Epub 2025 Apr 26. PMID: 40294881. [CrossRef] [PubMed]
- World Population Review (2025), Autism Rates by Country 2025, https://worldpopulationreview.com/country-rankings/autism-rates-by-country.
- World Population Review (2025a), Vaccination Rates by Country 2025, https://worldpopulationreview.com/country-rankings/vaccination-rates-by-country.
Figure 1.
Regression line of the autism rate on Burden Index of Vaccines in infants ≤ 1 year with the location of countries under study. Note: Each quadrant is labeled with policy implications: Critical Burden Zone – High vaccine exposure and high autism rates; Low Burder Zone with Protective Policy Group – Low vaccine exposure and low autism rates, Transitional Burden Zone – High vaccine exposure but currently low autism rates; Emerging Risk Group –not populated in current data.
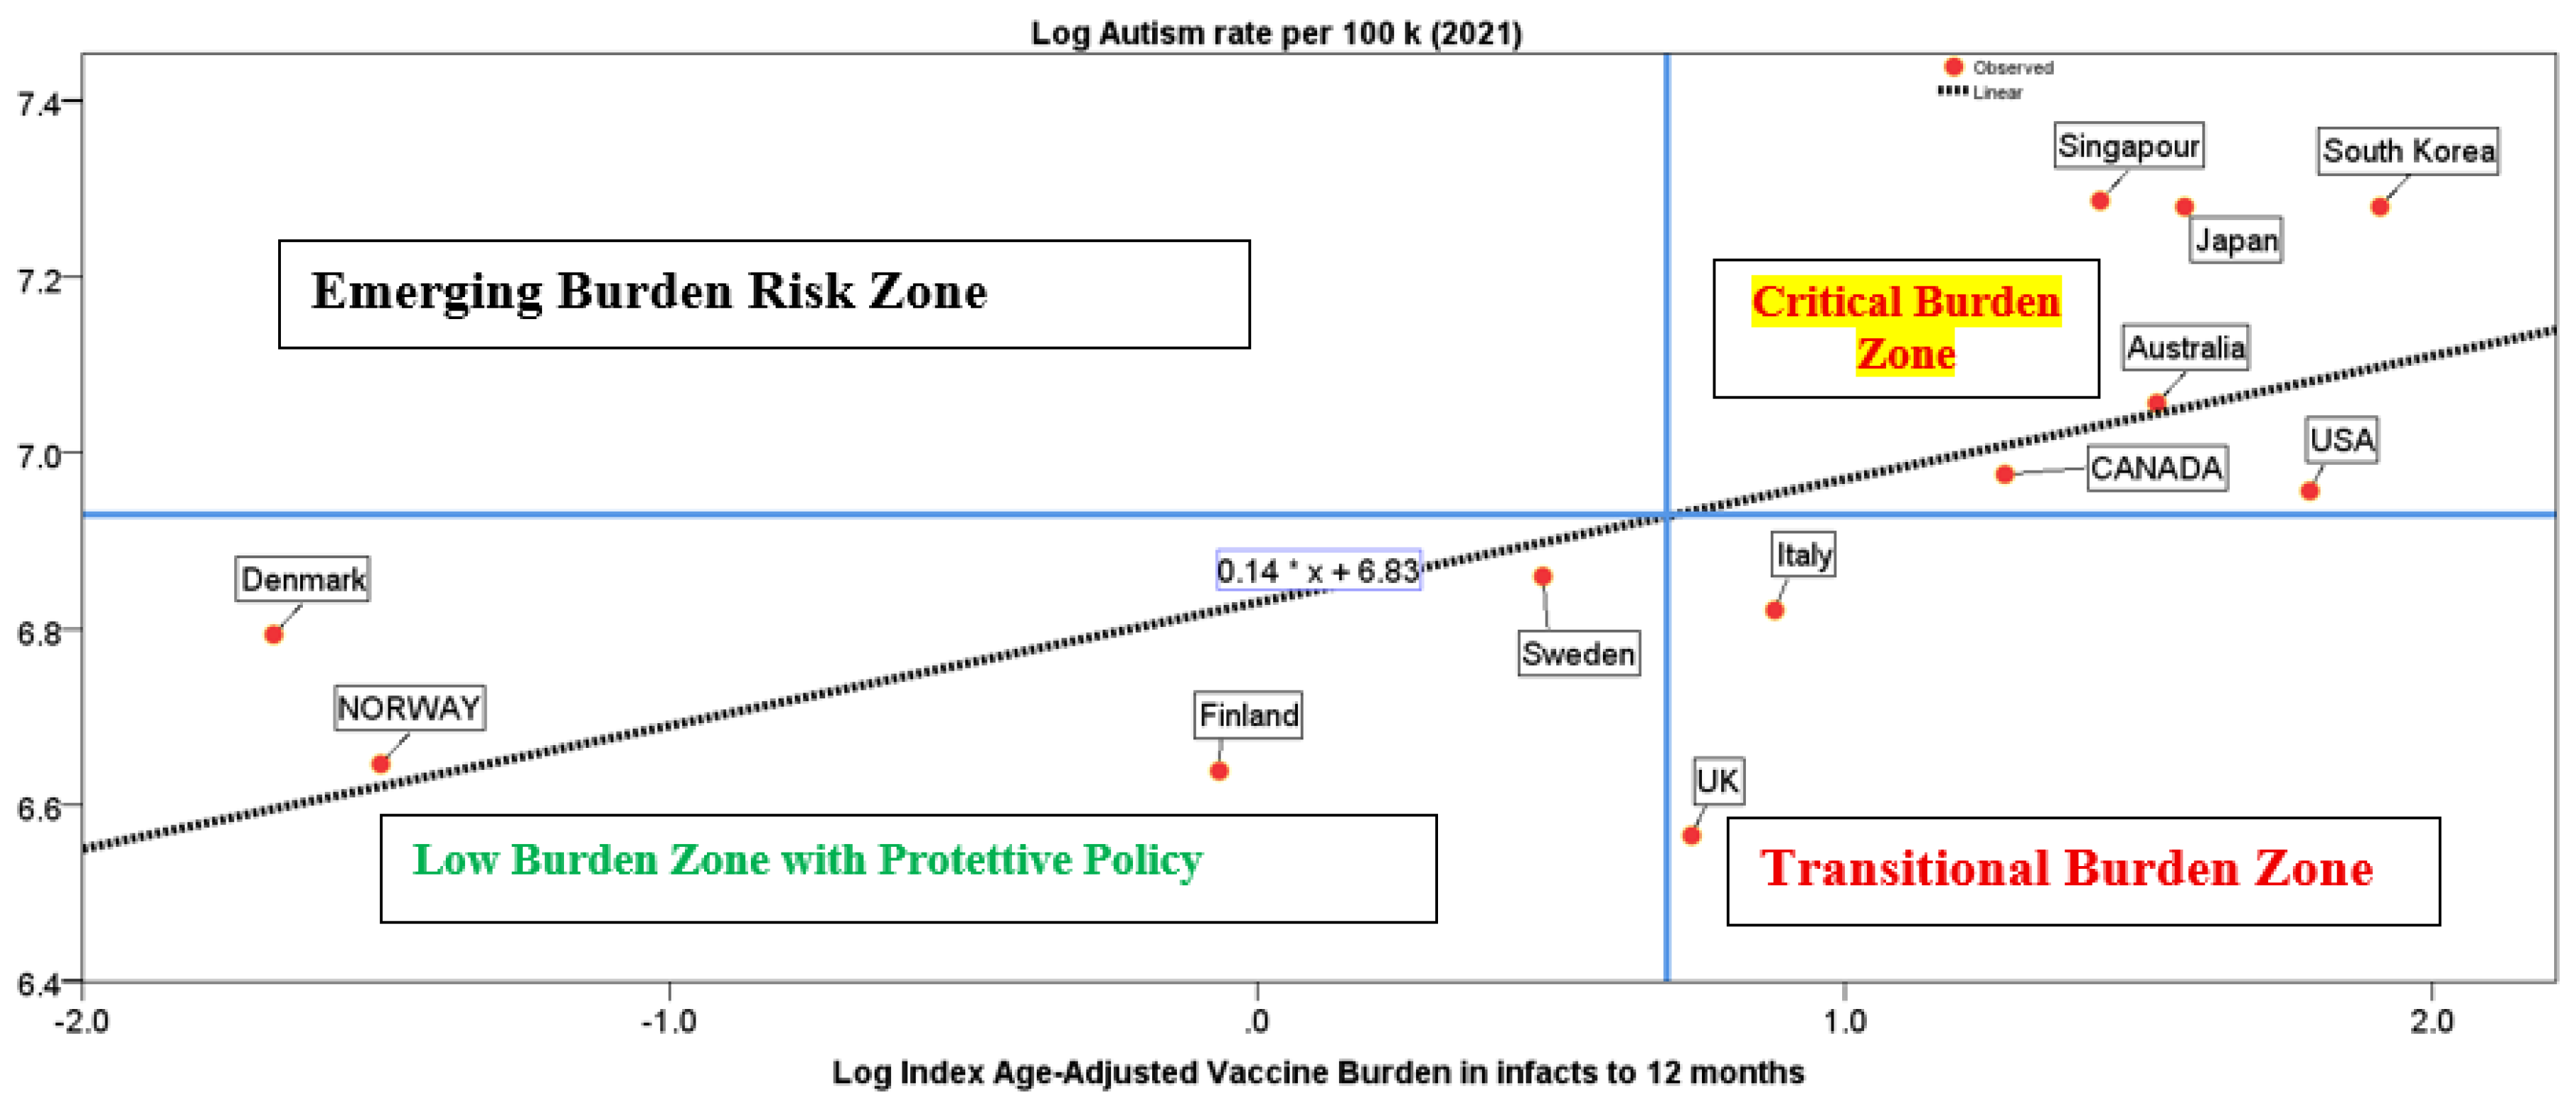
Table 1.
Variables and sources.
| Variables and sources | Description |
|---|---|
| Period under study | Year 2020, 2021 (last year available) |
| Countries. Source: World Population Review (2025), https://worldpopulationreview.com/country-rankings/autism-rates-by-country | Higher Autism rate countries: Singapore, South Korea, Japan, Australia, Canada, USA Lower Autism rate countries: Sweden, Denmark, Norway, Finland, Italy, and the UK |
| Autism rate 2021 per 100k people in countries under study, Source: World Population Review (2025), https://worldpopulationreview.com/country-rankings/autism-rates-by-country |
Rates shown indicate the number of children out of 100,000 who have been diagnosed at any age with autism in 2021. |
| Months of infants (having ≤ 1 year) in immunization dates | Month of infants (having ≤ 1 year) to which vaccines are administered, set according to the country's recommended childhood vaccination schedule and designed by public health bodies. |
| Total Number of vaccines to infants from birth to 6 months and from birth to 12 months | Total number of vaccines administered to infants having less than 1 year (recommended or compulsory) from national childhood immunization schedule in sample of countries under study. Sources of data to next line. |
| Number of doses of vaccines to infants ≤ 1 year from birth to 6 months and from birth to 12 months | Total number of doses of vaccines administered to infants having less than 1 year (recommended or compulsory) from national childhood immunization schedule in sample of countries under study. Sources of data: |
| Vaccination Rates (%), Source: World Population Review (2025a), Vaccination Rates by Country 2020, https://worldpopulationreview.com/country-rankings/vaccination-rates-by-country | Average Percentage of Vaccination Rates 2020, Vaccinations address the following diseases: DTP3 - Diphtheria, Tetanus, and Pertussis; MCV1 - Measles and POL3 – Polio; Data estimates from WHO/UNICEF Estimates of National Immunization Coverage |
| Details for National Immunization Program Schedules for children | See Table S1A in Supplemental Information |
Table 2.
Descriptive statistics.
| Countries | Vacc Rate % | Autism Rate |
Average Age infants 12 months |
Average Age infants 6 months | Total Vacc. to 12 months | Total Vacc. to 6 months | Total Doses. to 12 months | Total Doses. to 6 months | Burden Vaccines to 12 months | |
|---|---|---|---|---|---|---|---|---|---|---|
| LOWER Autism rate | M | 94.56 | 834.33 | 5.90 | 3.42 | 8.00 | 7.17 | 9.33 | 6.50 | 83.50 |
| SD | 2.40 | 98.78 | 0.63 | 0.70 | 2.83 | 1.72 | 5.32 | 3.73 | 62.22 | |
| HIGHER Autism rate | M | 95.00 | 1273.33 | 4.90 | 3.09 | 14.83 | 9.83 | 19.67 | 14.83 | 291.50 |
| SD | 2.89 | 200.67 | 0.45 | 0.39 | 0.98 | 1.60 | 3.67 | 3.06 | 56.94 | |
| NO varicella vaccine | M | 94.80 | 817.80 | 5.91 | 3.63 | 7.20 | 6.60 | 8.40 | 6.00 | 66.60 |
| SD | 2.60 | 100.73 | 0.70 | 0.50 | 2.28 | 1.14 | 5.37 | 3.94 | 51.94 | |
| Varicella Vaccine | M | 94.76 | 1222.43 | 5.03 | 2.98 | 14.43 | 9.86 | 18.86 | 14.00 | 273.86 |
| SD | 2.71 | 227.37 | 0.54 | 0.45 | 1.40 | 1.46 | 3.98 | 3.56 | 69.86 | |
| NO Hep. B Vaccine | M | 94.25 | 829.75 | 5.73 | 3.54 | 7.50 | 6.75 | 9.75 | 7.00 | 78.75 |
| SD | 2.64 | 112.14 | 0.65 | 0.53 | 2.52 | 1.26 | 5.12 | 3.74 | 51.11 | |
| Hepatitis B Vaccine | M | 95.04 | 1165.88 | 5.24 | 3.11 | 13.38 | 9.38 | 16.88 | 12.50 | 241.88 |
| SD | 2.63 | 264.38 | 0.76 | 0.55 | 3.25 | 1.92 | 6.71 | 5.37 | 111.20 | |
| NO Birth Vaccines | M | 94.80 | 817.80 | 5.91 | 3.63 | 7.20 | 6.60 | 8.40 | 6.00 | 66.60 |
| SD | 2.60 | 100.73 | 0.70 | 0.50 | 2.28 | 1.14 | 5.37 | 3.94 | 51.94 | |
| Birth Vaccine | M | 94.67 | 1238.00 | 4.75 | 2.96 | 14.80 | 9.60 | 19.20 | 14.60 | 283.80 |
| SD | 3.10 | 202.41 | 0.28 | 0.24 | 1.10 | 1.67 | 3.90 | 3.36 | 60.06 | |
| Unclear | M | 95.00 | 1183.50 | 5.74 | 3.04 | 13.50 | 10.50 | 18.00 | 12.50 | 249.00 |
| SD | 2.36 | 376.89 | 0.09 | 1.00 | 2.12 | 0.71 | 5.66 | 4.95 | 114.55 | |
| Burden Vaccines to 6 months | Average vaccines by 12 months | Average vaccines by 6 months | Average Doses by 12 months |
Average Doses by 6 months |
Monthly Burden Vaccines to 12 months | Monthly Burden Vaccines to 6 months | Burden Vaccine Index to 12 months | Burden Vaccine Index to 6 months | ||
| LOWER Autism rate | M | 50.33 | 0.67 | 1.19 | 0.78 | 1.08 | 6.96 | 8.39 | 1.25 | 2.83 |
| SD | 33.38 | 0.24 | 0.29 | 0.44 | 0.62 | 5.19 | 5.56 | 0.95 | 2.32 | |
| HIGHER Autism rate | M | 145.00 | 1.24 | 1.64 | 1.64 | 2.47 | 24.29 | 24.17 | 5.00 | 7.91 |
| SD | 34.77 | 0.08 | 0.27 | 0.31 | 0.51 | 4.74 | 5.80 | 1.18 | 2.18 | |
| NO Varicella vaccine | M | 42.40 | 0.60 | 1.10 | 0.70 | 1.00 | 5.55 | 7.07 | 1.01 | 2.11 |
| SD | 30.34 | 0.19 | 0.19 | 0.45 | 0.66 | 4.33 | 5.06 | 0.84 | 1.68 | |
| Varicella Vaccine | M | 137.14 | 1.20 | 1.64 | 1.57 | 2.33 | 22.82 | 22.86 | 4.63 | 7.70 |
| SD | 37.95 | 0.12 | 0.24 | 0.33 | 0.59 | 5.82 | 6.32 | 1.46 | 2.07 | |
| NO Hep. B Vaccine | M | 50.00 | 0.63 | 1.13 | 0.81 | 1.17 | 6.56 | 8.33 | 1.21 | 2.52 |
| SD | 29.02 | 0.21 | 0.21 | 0.43 | 0.62 | 4.26 | 4.84 | 0.83 | 1.64 | |
| Hepatitis B Vaccine | M | 121.50 | 1.11 | 1.56 | 1.41 | 2.08 | 20.16 | 20.25 | 4.08 | 6.80 |
| SD | 56.50 | 0.27 | 0.32 | 0.56 | 0.90 | 9.27 | 9.42 | 2.06 | 3.18 | |
| NO Birth Vaccines | M | 42.40 | 0.60 | 1.10 | 0.70 | 1.00 | 5.55 | 7.07 | 1.01 | 2.11 |
| SD | 30.34 | 0.19 | 0.19 | 0.45 | 0.66 | 4.33 | 5.06 | 0.84 | 1.68 | |
| Birth Vaccine | M | 138.80 | 1.23 | 1.60 | 1.60 | 2.43 | 23.65 | 23.13 | 5.03 | 7.93 |
| SD | 34.97 | 0.09 | 0.28 | 0.32 | 0.56 | 5.01 | 5.83 | 1.32 | 2.44 | |
| Unclear | M | 133.00 | 1.13 | 1.75 | 1.50 | 2.08 | 20.75 | 22.17 | 3.63 | 7.13 |
| SD | 60.81 | 0.18 | 0.12 | 0.47 | 0.82 | 9.55 | 10.14 | 1.72 | 0.98 |
Table 3.
Independent Samples Test based on average mean of variables under study in Higher and Lower Autism rate countries, log scale.
Table 3.
Independent Samples Test based on average mean of variables under study in Higher and Lower Autism rate countries, log scale.
| Levene’s Test for Equality of Variances | t-test for Equality of Means | |||||
|---|---|---|---|---|---|---|
| Equal Variances | F | Sig. | t-test | Degrees of Freedom | Sig. (2-tailed) |
|
| Vaccination Rate Total |
assumed | 0.394 | 0.544 | -0.282 | 10 | 0.784 |
| not assumed | -0.282 | 9.679 | 0.784 | |||
| Autism rate 100k |
assumed | 3.81 | 0.079 | -5.133 | 10 | 0.001 |
| not assumed | -5.133 | 9.246 | 0.001 | |||
| Average Age Infants vaccinated to 12 months | assumed | 0.871 | 0.373 | 3.224 | 10 | 0.009 |
| not assumed | 3.224 | 9.822 | 0.009 | |||
| Average Age Infants vaccinated to 6 months | assumed | 2.962 | 0.116 | 0.854 | 10 | 0.413 |
| not assumed | 0.854 | 7.807 | 0.418 | |||
| Total Vaccines done to 12 months (V) | assumed | 10.742 | 0.008 | -4.654 | 10 | 0.001 |
| not assumed | -4.654 | 5.4 | 0.005 | |||
| Total Vaccines done to 6months (V) | assumed | 0.214 | 0.654 | -2.78 | 10 | 0.019 |
| not assumed | -2.78 | 8.933 | 0.022 | |||
| Total Doses done to 12 months (D) | assumed | 13.241 | 0.005 | -2.927 | 10 | 0.015 |
| not assumed | -2.927 | 5.704 | 0.028 | |||
| Total Doses done to 6months (D) | assumed | 13.914 | 0.004 | -3.09 | 10 | 0.011 |
| not assumed | -3.09 | 5.817 | 0.022 | |||
| Burden Vaccines done to 12 months (V×D) | assumed | 12.262 | 0.006 | -3.691 | 10 | 0.004 |
| not assumed | -3.691 | 5.391 | 0.012 | |||
| Burden Vaccines done to 6 months (V×D) | assumed | 14.469 | 0.003 | -3.282 | 10 | 0.008 |
| not assumed | -3.282 | 5.641 | 0.018 | |||
| Average Vaccines done by 12 months | assumed | 10.742 | 0.008 | -4.654 | 10 | 0.001 |
| not assumed | -4.654 | 5.4 | 0.005 | |||
| Average Vaccines done by 6 months | assumed | 0.214 | 0.654 | -2.78 | 10 | 0.019 |
| not assumed | -2.78 | 8.933 | 0.022 | |||
| Average Doses done by 12 months | assumed | 13.241 | 0.005 | -2.927 | 10 | 0.015 |
| not assumed | -2.927 | 5.704 | 0.028 | |||
| Average Doses done by 6 months | assumed | 13.914 | 0.004 | -3.09 | 10 | 0.011 |
| not assumed | -3.09 | 5.817 | 0.022 | |||
| Monthly Burden Vaccines done to 12 months | assumed | 12.262 | 0.006 | -3.691 | 10 | 0.004 |
| not assumed | -3.691 | 5.391 | 0.012 | |||
| Monthly Burden Vaccines done to 6 months | assumed | 14.469 | 0.003 | -3.282 | 10 | 0.008 |
| not assumed | -3.282 | 5.641 | 0.018 | |||
| Age-Adjusted Vaccine Burden Index to 12 months | assumed | 13.406 | 0.004 | -3.767 | 10 | 0.004 |
| not assumed | -3.767 | 5.426 | 0.011 | |||
| Age-Adjusted Vaccine Burden Index to 6 months | assumed | 11.263 | 0.007 | -2.975 | 10 | 0.014 |
| not assumed | -2.975 | 5.541 | 0.027 | |||
Note: T-test groups are based on Higher vs. Lower Autism Rate Countries; Group Statistics see Table A2 in Appendix.
Table 4.
Partial Bivariate Correlation, (1-tailed), controlling Vaccination Rates (%) in population, Log Scale. Note: values in log scale, Note:***=p-value <0.001, * p-value =0.05.
Table 4.
Partial Bivariate Correlation, (1-tailed), controlling Vaccination Rates (%) in population, Log Scale. Note: values in log scale, Note:***=p-value <0.001, * p-value =0.05.
| Control Variables General vaccination rate in population |
A | B | C | D | E | F | G | H | I | L | M | ||
|---|---|---|---|---|---|---|---|---|---|---|---|---|---|
| Autism Rate | A | r | 1 | -0.71 | -0.39 | 0.87 | 0.77 | 0.79 | 0.80 | 0.85 | 0.83 | 0.85 | 0.80 |
| sig. | . | 0.01 | 0.12 | 0.00 | 0.00 | 0.00 | 0.00 | 0.00 | 0.00 | 0.00 | 0.00 | ||
| Average Age infants by 12 months | B | r | 1 | 0.60 | -0.78 | -0.57 | -0.84 | -0.84 | -0.85 | -0.81 | -0.88 | -0.82 | |
| sig. | 0.03 | 0.00 | 0.03 | 0.00 | 0.00 | 0.00 | 0.00 | 0.00 | 0.00 | ||||
| Average Age infants by 6 months | C | r | 1 | -0.62 | -0.52 | -0.64 | -0.60 | -0.65 | -0.60 | -0.66 | -0.70 | ||
| sig. | 0.02 | 0.05 | 0.02 | 0.03 | 0.02 | 0.03 | 0.01 | 0.01 | |||||
| Average Vaccine infants 12 months | D | r | 1 | 0.91 | 0.86 | 0.85 | 0.94 | 0.90 | 0.94 | 0.90 | |||
| sig. | 0.00 | 0.00 | 0.00 | 0.00 | 0.00 | 0.00 | 0.00 | ||||||
| Average Vaccine infants 6 months | E | r | 1 | 0.81 | 0.80 | 0.88 | 0.88 | 0.85 | 0.87 | ||||
| sig. | 0.00 | 0.00 | 0.00 | 0.00 | 0.00 | 0.00 | |||||||
| Average Doses infants 12 months | F | r | 1 | 1.00 | 0.98 | 0.99 | 0.98 | 0.99 | |||||
| sig. | 0.00 | 0.00 | 0.00 | 0.00 | 0.00 | ||||||||
| Average Doses infants 12 months | G | r | 1 | 0.97 | 0.99 | 0.97 | 0.98 | ||||||
| sig. | 0.00 | 0.00 | 0.00 | 0.00 | |||||||||
| Burden Vaccines to 12 months | H | r | 1 | 0.99 | 1.00 | 0.99 | |||||||
| sig. | 0.00 | 0.00 | 0.00 | ||||||||||
| Burden Vaccines to 6 months | I | r | 1 | 0.98 | 0.99 | ||||||||
| sig. | 0.00 | 0.00 | |||||||||||
| Age-Adjusted Vaccine Burden Index to 12 months | L | r | 1 | 0.99 | |||||||||
| sig. | 0.00 | ||||||||||||
| Age-Adjusted Vaccine Burden Index to 6 months | M | r | 1 | ||||||||||
| sig. | . |
Table 5.
Parametric estimates of the linear model considering as response variables Autism rate 2021 per 100k people with simple and multivariate regression (log-log linear model).
Table 5.
Parametric estimates of the linear model considering as response variables Autism rate 2021 per 100k people with simple and multivariate regression (log-log linear model).
| Simple regression | Explanatory variable: Monthly Burden Vaccine in infants to 1 year | ||||
|---|---|---|---|---|---|
| Dependent variable | Constant, α | Coefficient, β1 | Stand. Coeff. Beta | R2 | F |
| Autism rate 2021 per 100k | 6.16*** | 0.16* | 0.68 | 0.46 | 8.38* |
| Explanatory variable: Index Burden Vaccine in infants to 1 year | |||||
| Constant, α | Coefficient, β1 | Stand. Coeff. Beta | R2 | F | |
| Autism rate 2021 per 100k | 6.83*** | 0.14* | 0.67 | 0.46 | 8.34* |
| Multivariate regression | Response variable: Autism rate 2021 per 100k | ||||
| Predictors | |||||
| Constant | −18.24* | ||||
| Burden Index of Vaccines in infants to 1 year | 0.16*** | ||||
| Vaccination rate for Diptheria, Tetanus, and Pertussis, Measles and Polio diseases | 5.51** | ||||
| R2 | 0.78 | ||||
| F | 16.31*** | ||||
Note: ***=p-value<0.001, **=p-value<0.01,*=p-value<0.05.
Disclaimer/Publisher’s Note: The statements, opinions and data contained in all publications are solely those of the individual author(s) and contributor(s) and not of MDPI and/or the editor(s). MDPI and/or the editor(s) disclaim responsibility for any injury to people or property resulting from any ideas, methods, instructions or products referred to in the content. |
© 2025 by the authors. Licensee MDPI, Basel, Switzerland. This article is an open access article distributed under the terms and conditions of the Creative Commons Attribution (CC BY) license (http://creativecommons.org/licenses/by/4.0/).
Copyright: This open access article is published under a Creative Commons CC BY 4.0 license, which permit the free download, distribution, and reuse, provided that the author and preprint are cited in any reuse.


