
Submitted:
23 October 2025
Posted:
24 October 2025
You are already at the latest version
Abstract
Cytotoxic T cells are fully immunocompetent only after full activation. In order to study this activation process and to identify the major changes in gene expression upon activation, human peripheral blood CD8+ T cells were purified and activated in vitro by anti-CD2, CD3 and CD28 coupled beads alone or in combination with recombinant IL-12 and IL-18. The changes in the transcriptomes were then analyzed by quantitative transcriptomics during the first 24 hours of stimulation. Major changes in expression were only seen in a remarkably low number of genes including primarily granzyme B (GZMB) and a few inflammatory cytokines and chemokines. GZMB increased 30-40 fold already after 4-hours stimulation whereas the other four human granzymes remained unchanged or even decreased in expression. This stimulation of GZMB was further increased 2-3 times by the addition of IL-18 and IL-12. Interestingly, there was only a minor 2-fold increase in the expression of perforin, the pore forming molecule enabling the entry of the granzymes into the target cell. In sharp contrast, a remarkably strong increase was detected for a few inflammatory cytokines and chemokines: 1000-fold increase for Interferon- (IFN-, almost 1500-fold for IL-2, >100-fold for TNF-α, >10-fold for CCL3 and 30-100-fold for CCL4. A minor increase in the levels of IL-3, IL-4, IL-5, IL-10, and IL-13 were also seen and a quite strong increase in IL17F at 4 hours which then rapidly dropped almost to preincubation levels by 24 hours. A quite dramatic 100-fold increase was also seen in one of the micro RNAs, the MIR155HG. These findings strongly support the notion that GZMB is the major player in the apoptosis induction in target cells and that the other granzymes may primarily have other functions in T cell mediated immunity, unrelated to apoptosis. It also shows that cytotoxic T cells, upon activation, are major producers of a selective array of proinflammatory cytokines and chemokines.
Keywords:
cytotoxic T cells
; CD8+ T cells
; IL-2
; IFN-r
; TNF-a
; MIR155HG
; activation
; anti-CD28
; Anti-CD3
; IL-12
1. Introduction
Cytotoxic T cells, also named CD8+ T cells, are major players in the defense against intracellular pathogens such as viruses and intracellular bacteria. By recognizing peptides from these pathogens presented on MHC class I molecules, the cytotoxic T cells strongly attach to the surface of the target cell and transfer granule-stored material, primarily granzymes, into the target cell by holes formed by the pore-forming protein perforin. Hence, perforin is important for facilitating the entrance of the granzymes into the target cell to initiate the apoptosis process. The human genome contains five genes for granzymes, the granzymes A, K, B, H and M and all of them are expressed by CD8+ T cells [1,2]. Apoptosis-related functions have been identified for several of these granzymes [3]. However, the most compelling evidence for their role in apoptosis has been obtained for GZMB [3]. GZMB is involved in both caspase-dependent and independent activation of apoptosis in target cells [3].
The killing of infected cells needs to be tightly controlled as the presence of fully activated cytotoxic T cells under non-inflammatory condition could potentially cause severe tissue damage by unwanted killing of healthy cells. The process of activation thereby needs to be tightly controlled to make sure that cytotoxic T cells with full killing capacity are only present when needed. High level storage of the apoptosis-inducing granzymes should therefore be confined to activated cells, and cytokine production to recruit and activate other inflammatory cells should only occur upon full activation.
By analysis of the material stored in cytotoxic T cells, evidence has accumulated that the amount of several granule-stored proteins increase upon activation of the cells, either by T cell receptor signaling or by the interaction between antigen presenting cells and the cell surface proteins CD2 CD3, and CD28 [4,5,6]. In addition, several inflammatory cytokines have been found to increase this activation further, including the cytokines IL-12 and IL-18 [7,8]. In order to more closely identify which genes are being upregulated by these cell surface interactions and by these cytokines we here present a quantitative transcriptomic study of purified human CD8+ T cells activated by anti-CD2, CD3 and CD28 antibodies coupled onto beads, either alone or in combination with the cytokines IL-12 and IL-18.
Interestingly, a relatively limited number of genes were affected by cell activation, however, the mRNA-levels for these genes changed quite dramatically as seen for GZMB (100-fold), IFN-γ (1000-fold) and IL-2 (almost 1500-fold). We also observed a strong upregulation of a limited number of CC-chemokines but not of any of the CXCL chemokines. IFN-γ actually became the most highly expressed gene almost 3 times higher than the most highly expressed gene in unstimulated cells which was beta-2-microglobulin, which shows that IFN-γ is expressed at extremely high levels in these activated cells.
We here show that GZMB is the primary and only granzyme that is upregulated upon stimulation, and that the addition of IL-12 and IL-18 has a major boosting effect on the expression of GZMB, IL-17F and IFN-γ.
2. Results
2.1. Isolation of Human Peripheral Blood CD8+ T Cells
Leucocyte enriched human peripheral blood samples were obtained from one healthy male and one healthy female donor from the hospital blood bank in the form of buffy coats. Mononuclear cells (PBMCs) were first isolated by density gradient centrifugation using Ficoll-Paque. CD8⁺ T cells were then positively selected from PBMCs using the CD8⁺ T Cell Isolation Kit (Figure 1). The purity of the isolated CD8⁺ T cell population was >96%, as confirmed by flow cytometry (96.7 % and 98.2 % for the two samples, Figure 2). Purified cells were immediately used for downstream culture and activation experiments.
2.2. Activation of CD8+ T Cells
The purified CD8⁺ T cells were cultured in vitro under standard cell culture conditions and cells were collected at 0 hours (baseline), 4 hours, and 24 hours for subsequent analyses. For activation, cells were stimulated using MACS Beads coupled with biotinylated antibodies targeting human CD2, CD3, and CD28. Two cultures of CD8+ T cells were further activated by a combination of the above-described beads and two recombinant cytokines, IL-12 and IL-18.
At the designated time points, cells were harvested for analysis of their transcriptome using bulk RNA sequencing. The number of normalized reads for the respective genes were then transferred to an Excel file for analysis. The entire list of approximately 21 000 genes was then analyzed for genes that changed markedly in expression after activation and for genes of particular interest for the role of CD8+ T cells in the defense against intracellular pathogens such as viruses and intracellular bacteria.
2.3. Effect on Granule-Stored Proteins by Activation of CD8+ T Cells
Strikingly, a very limited number of genes were increased in their expression upon activation, indicating a very specific response by these freshly isolated human CD8+ T cells. We started by looking at the expression levels of the different granule-stored proteins, the granzymes and perforin. To our big surprise we could only detect a marked increase in the expression of one of the five human granzymes, the GZMB, which increased by 30-40 times by activation with the beads and almost 100 times by beads combined with IL-12 and IL-18 (Table 1). GZMB did after 4-hour stimulation become one of the most highly expressed genes in these cells reaching 17579 reads in one of the samples (Table 1). The other four granzymes showed no increase, a minor increase or even a decrease in their expression upon cell activation. GZMA decreased 5-fold at the 24-hour timepoint compared to unstimulated cells (Table 1). We observed a 3-fold increase of GZMH at the 4-hour time point but the expression was back to background level at the 24-hour time point (Table 1). Of the other granule-stored proteins we observed a 2-3-fold increase in the membrane permeabilizing protein perforin (Table 1) [10,11]. We also observed a minor 2-3-fold increase in the mRNA levels for the core protein for chondroitin sulphate synthesis, the serglycin (SGRN), which is of importance for granule storage of the granzymes (Table 1) [12]. We did not see any increase in another membrane permeabilizing protein, granulysin, which is of importance for the killing of cells infected with intracellular bacteria such as tuberculosis and lepra bacteria [13].
2.4. Effect on Cytokines, Chemokines and Cytokine Receptors
Activation of CD8+ T cells caused a quite dramatic increase in several cytokines, including IFN-γ, IL-2, TNF-α, lymphotoxin A (LTA), leukemia inhibitory factor (LIF), TNF superfamily member 14 (TNFSF14) and IL-17F (Table 2). IFN-γ increased by approximately a factor 100 by the anti-CD2, CD3 and CD28 beads only and with an additional approximately 20-fold increase, by addition of IL12 and IL-18 to a total factor of 1000 to 3000 at the 4-hour time point (Table 2). Notably, IFN-γ was thereby the most highly expressed genes of all genes in these cells with over 47000 reads in one of the samples (Table 2). For the beads only, the expression of IFN-γ had doubled by 24 hours compared with the 4-hours time point, however after the addition of IL-12 and IL-18 the expression level decreased by approximately a factor 3 between the 4- and 24-hour time points (Table 2). For IL-2 the situation was the opposite; after a slow increase the maximum expression was reached at the 24-hour time point (Table 2). IL-2 levels increased by approximately a factor 100 by 4 hours of stimulation and increased even stronger at the 24-hour time point to a several thousand-fold increase from very low initial levels close to zero. TNF-α was increased by a factor of 20-30 at the 4-hours time point and was additionally increased by 3-5 times after 24 hours (Table 2). LTA also named TNF-β, showed its maximum expression by 4 hours stimulation with an almost 50-fold increase and this was followed by an almost 10-fold drop by 24 hours (Table 2). LIF also showed a maximal expression at the 4-hour time point with a very strong increase of more than 2000-fold when stimulated by both beads and the cytokines IL-12 and IL-18. The same pattern of expression was seen for IL-17F with a very transient strong upregulation by a factor of 30-200 at 4-hours and then back to almost base line expression after 24 hours of stimulation (Table 2). For IL-17F the addition of IL-12 and IL-18 also gave a more than 5-fold increase in expression at the 4-hour time point (Table 2). We also observed strong inductions of IL-3, IL-4, IL-5, IL-10 and IL-13 but from very low starting levels and reaching only moderate levels, between 7 and 334 reads, after stimulation (Table 2). Among these cytokines only IL-3 reached expression levels above 55 reads and this was mainly seen after 24 hours of stimulation and both with or without addition of the cytokines IL-12 and IL-18. TNF super family member 14 (TNFSF14, also named LIGHT-CD258) was upregulated by a factor 20-30 at the 4-hour time point and an additional upregulation by a factor 2-3 at the 24-hour time point, with no additional effect on expression levels by the addition of IL-12 and IL-18 (Table 2). No major change in any of the other cytokines was observed in response to stimulation. However, we observed an upregulation in non-stimulated cultures for three of the classical inflammatory cytokines and chemokines, IL-1α, IL-1β, IL-6 and IL-8, reaching a maximum at the 24-hour time point and with expression levels of 749, 152 and 670 reads for IL-1β, IL-6 and IL-8, respectively (Table 2). Interestingly, stimulation of the cells resulted in a dramatic downregulation at the 4-hour time point of these inflammatory cytokines and chemokines (Table 2).
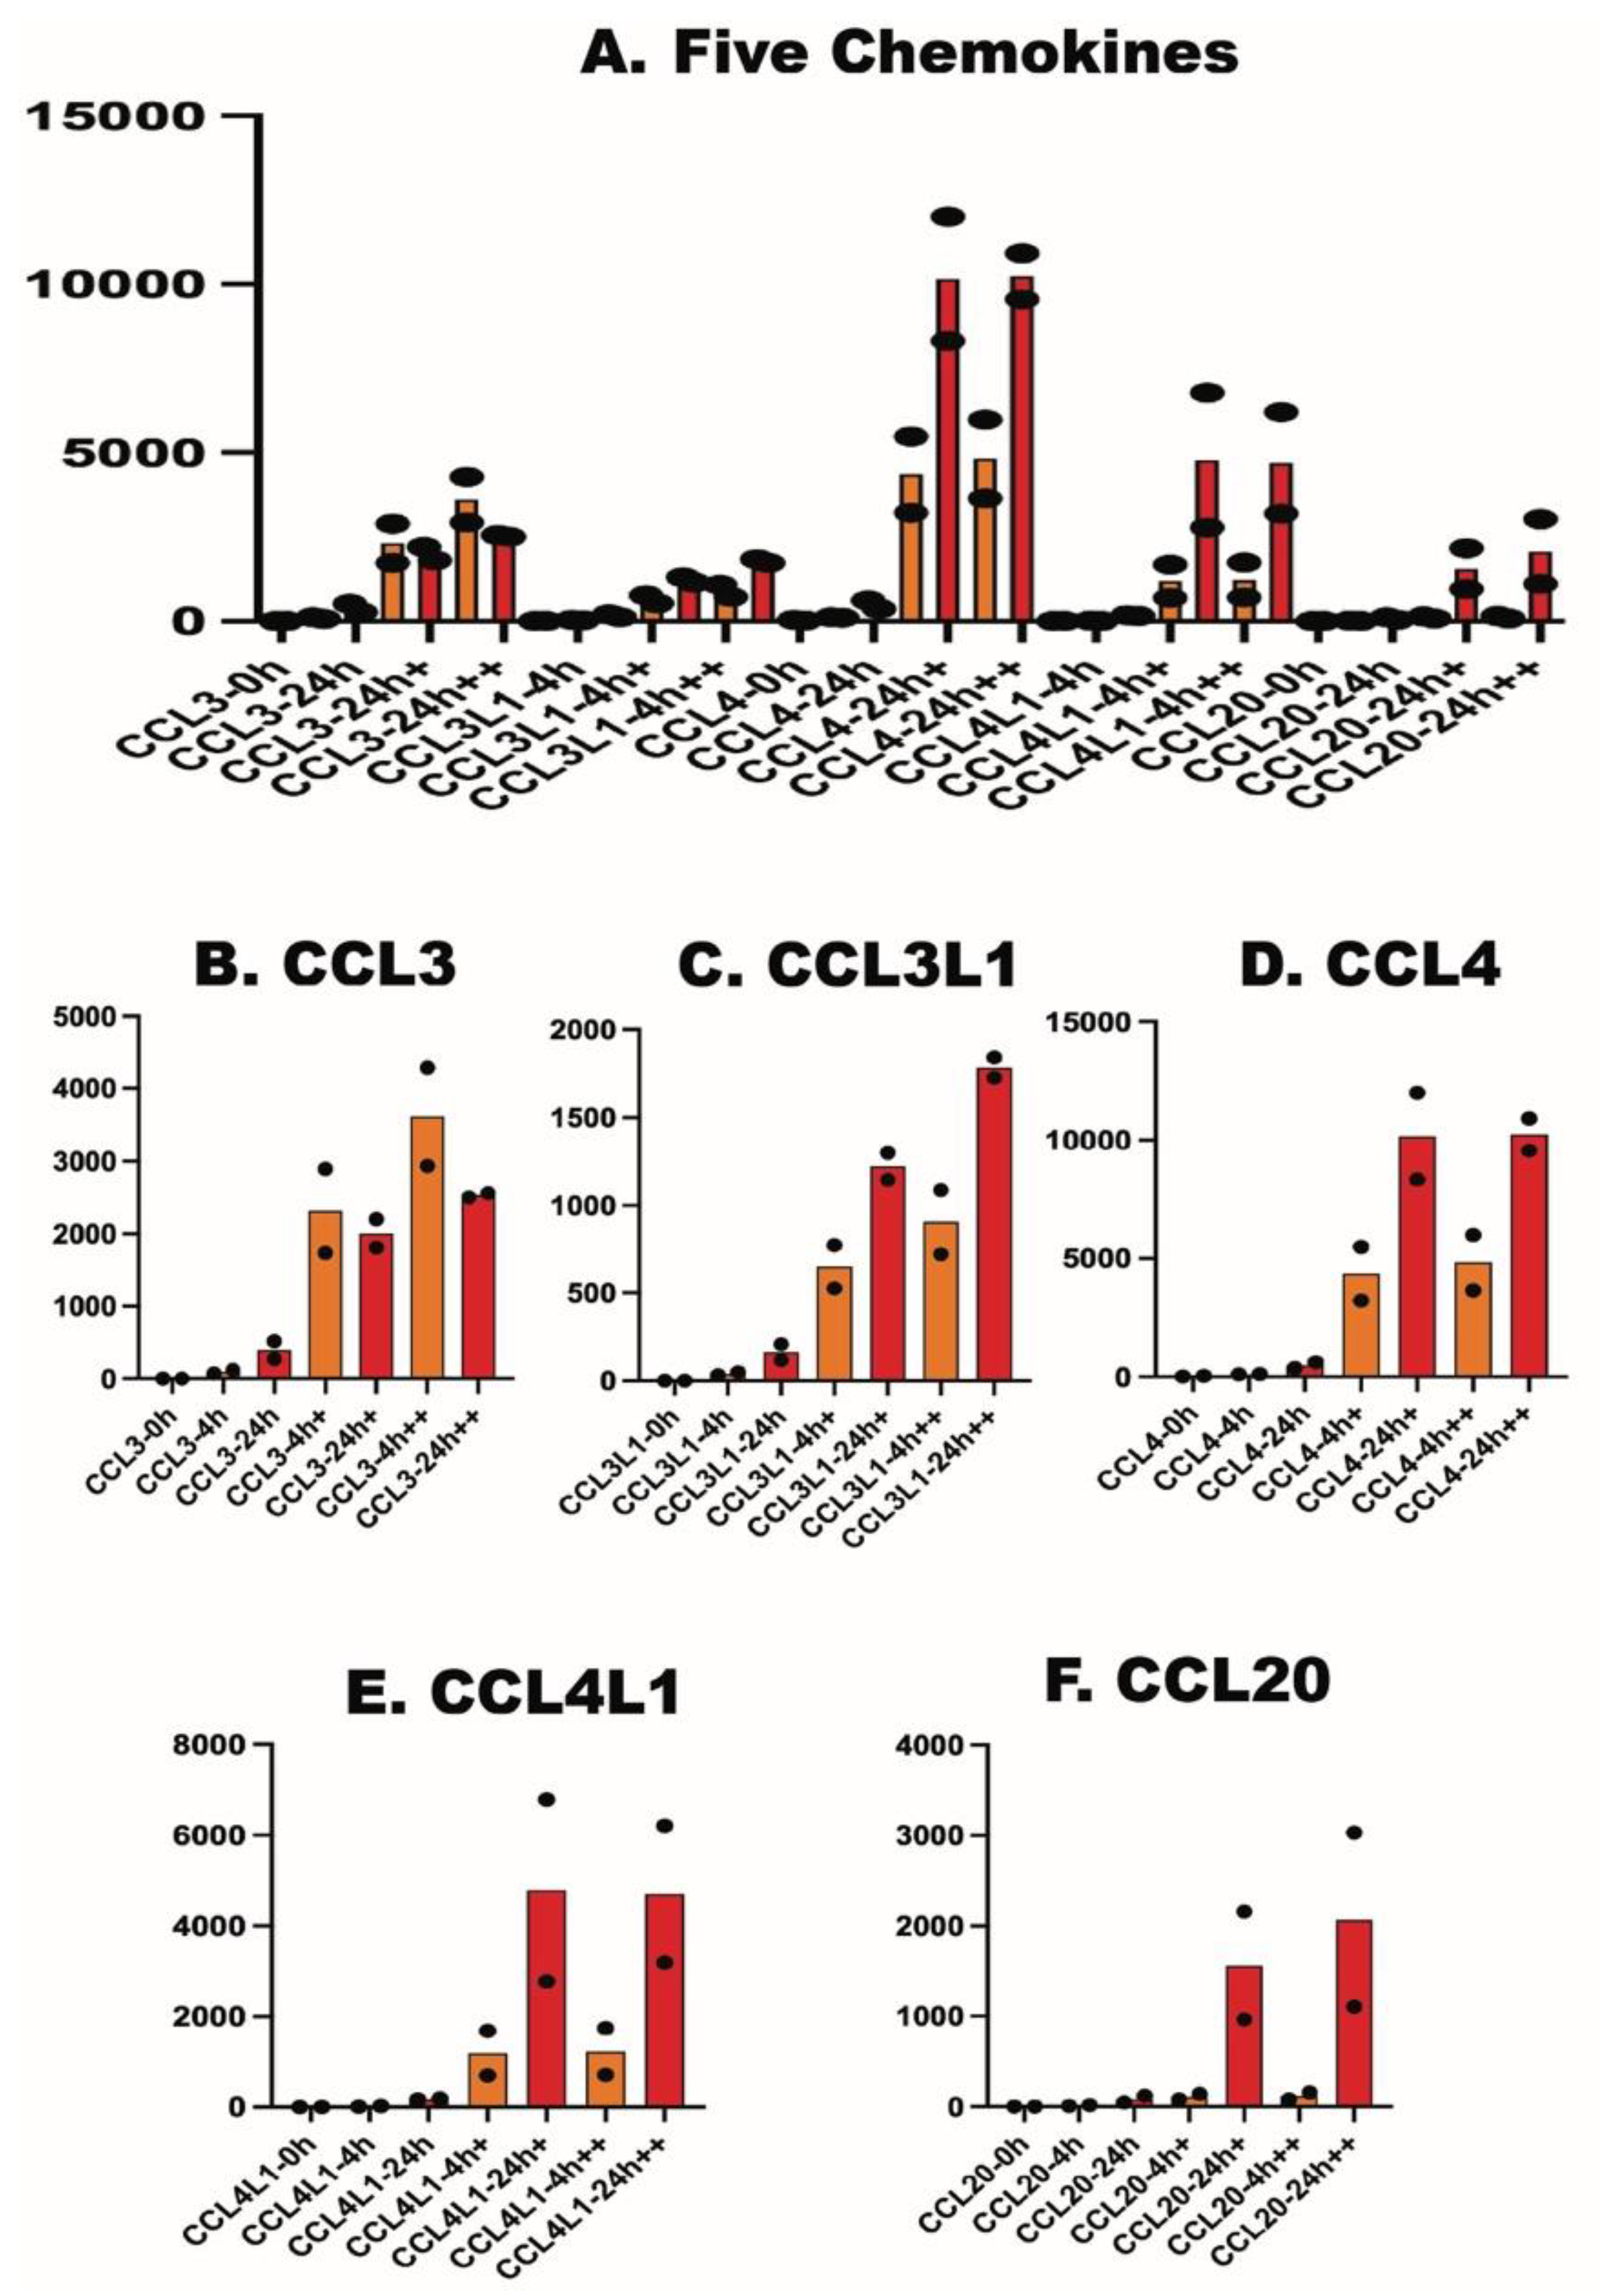
A marked increase in the expression of five chemokines was observed, all belonging to the CC subfamily of chemokines (none from the CXC subfamily); CCL3, CCL3L1, CCL4, CCL4L1 and CCL20 (Table 2). CCL3, also known as macrophage inflammatory protein 1-alpha (MIP-1-alpha), is involved in the recruitment of polymorphonuclear granulocytes [14]. CCL3L1 has in contrast been shown to recruit lymphocytes and macrophages and to induce MCP1 and RANTES [15]. CCL4 is also known as macrophage inflammatory 1-beta (MIP-1-beta). It has been shown to attract NK-cells, monocytes and other inflammatory cells to the site of infection, and to interact with CCL3 [16,17]. CCL4L1 seems to have very similar or even identical functions as CCL4 [18]. CCL20 is also known as macrophage inflammatory protein 3A (MIP3A) and has been shown to be strongly chemotactic to lymphocytes and weakly to neutrophils [19]. Very high levels of these chemokines were observed upon activation with maximal levels reaching between almost 2000 reads to over 12000 reads (Table 2).
Interestingly, we could also observe a quite dramatic increase in the expression of the high affinity receptor subunit for IL-2, the alpha chain of the IL-2 receptor (IL2RA) (Table 2). A very minor increase was also seen for the beta-chain (IL2RB) but no increase for the gamma-chain (IL2RG) (Table 2). The expression of the IL-2 receptor alpha chain reached its maximum at the 4-hour time point and decreased slightly at the 24 hour-time point, indicating that the expression of the IL-2 receptor did occur prior to its ligand IL-2, which instead reached maximum expression at the 24-hour time point (Table 2).
2.5. Effect on Two TNF Receptor Superfamily Members
We observed a 10-50-fold upregulation of two TNF receptor superfamily members, the member 4 and member 18, but from very low levels to a maximum of 171 reads upon activation (Table 3). TNFRSF4 is a T cell costimulatory receptor also named OX-40 or CD134 [20,21]. TNFRSF18, also named glucocorticoid-induced TNF-related protein (GITR) is another member of this large gene family with 29 members in humans, which has been shown to be upregulated on both CD4+ and CD8+ T cells upon activation [21].
2.6. Effect on Micro RNAs and Transcription Factors
One of the micro RNAs, the MIR155HG, increased quite dramatically by almost 100 times, to quite high final levels with one sample reaching 880 reads (Table 4). MIR155HG expression in T cells have been linked to severe graft versus host disease indicating a potent role in T cell biology [22]. A potent upregulation of two transcription factors was also observed, the TBX21 and ZBED2, reaching levels of almost 400 reads, with at least ZBED2 starting from very low background levels (Table 4). TBX21, also known as T-bet, which is essential for TH1 immune responses and an activator of IFN-γ expression, showed an approximately 10-fold upregulation after stimulation (Table 4) [23,24]. Zinc finger BED-type 2, ZBED2, is a zinc finger gene, for which the protein has been found to act as a transcriptional repressor inhibiting interferon responses by being an antagonist to IRF1 [25]. ZBED2 belongs to a small family of regulatory proteins with diverse functions in vertebrates that has expanded in numbers by a transposon-dependent mechanism [26].
2.7. Effect on House-Keeping Genes Used as Reference Genes in Northern Blots and q-PCR.
Several house-keeping genes have been used as reference genes in Northen blot and q-PCR studies. Two of the most frequently used genes are beta-actin (ACTB) and the glyceraldehyde-3-phosphate dehydrogenase (GAPDH). Our results demonstrate that they are not adequate genes for the use as reference as they increase and show an extensive variation in gene expression levels upon T cell activation (Table 5). The beta-actin increased by a factor three at the 4-hour time point and GAPDH by almost a factor ten. For comparison, we included two of the ribosomal protein genes, the large subunit genes 10 and 15, which showed a much more stable expression with only minor differences in expression between time-points and in response to activation (Table 5). In Table 5 we also included the reads for the transcript that showed the highest expression levels of all genes in the non-stimulated sample (around 20000 reads), which was the beta-2-microglobulin (B2M), the light chain of the major histocompatibility genes of class I. The expression levels for B2M were included for comparison and to appreciate the extremely high expression levels observed for both GZMB and IFN-γ, which for GZMB was in the same range as for B2M, and for IFN-γ was almost 3 times higher than for B2M after activation (Table 2 and Table 5).
2.8. Effect on Solute Carriers.
The activation of cells probably also involved some metabolic upregulation, which could be seen in the upregulation of the two house-keeping genes beta-actin and GAPDH. In line with such an activation we also observed a marked upregulation of a few of the solute transporters (Table 6). A relatively strong upregulation in mRNA levels was primarily seen for the following five solute carriers: SLC1A5, a neutral amino acid transporter that increased approximately 20 times [27]; SLC16A1, a member of the SLC16 family of monocarboxylate transporters that increased 4-5 times [28]; SLC25A5, belonging to a small family of mitochondrial ADP/ATP carriers, that increased 3-4 times [29]; SLC25A10, a dicarboxylate transporter including glutathione of mitochondria, that increased almost 10 times [30]; and finally SLC29A1, a nucleoside transporter that increased approximately 20 times [31] (Table 6).
To summarize, we have here presented the results for the genes showing the most-clear changes in expression in response to activation of human CD8+ T cells. However, there were numerous other genes with minor changes in expression, which we did not highlight in this communication. However, all data for the approximately 21 000 genes for both individuals analyzed can be found in an Excel file included as supplementary material to make it available for further analysis by other labs interested in the activation of cytotoxic T cells.
3. Discussion
The activation of cytotoxic T cells needs to be highly regulated due to the danger of having cells with full killing capacity in the circulation when not urgently needed to combat infections by viruses or intracellular bacteria. First step in the activation normally occurs in contact with infected tissues and requires direct cell to cell contact, involving several cell surface receptors such as the T-cell receptor and the costimulatory receptors CD2 and CD28, but can also potentially be further enhanced by inflammatory cytokines in the area of infection such as IL-12 and IL-18. Once at the area of infection the response of activated cells should be fast and potent to limit the local and systemic spread of the infectious agents. To obtain this goal the concerted simultaneous action of several of these stimuli will provide the most potent T cell activation. The lack of one or several of these components should signal risk of an aberrant activation. We have here analyzed this process by quantitative transcriptomics to obtain a better understanding of the magnitude and timing of the different changes in gene activation that occur upon activation of human CD8+ T cells. The response was found to be very rapid, very potent and also very specific, involving only a relatively limited number of genes.
One of the main findings in this study was the detection of a major increase in gene expression for only one of the five human granzyme genes, and that was for GZMB (Table 1 and Figure 3). GZMB is the granzyme for which the most compelling evidence exists for its role in apoptosis induction of infected cells, coming from both knockout and in vitro experiments [3]. GZMB was very strongly upregulated and reached an expression of 17579 reads, which is at the same level as the most highly expressed gene in non-induced cells, the beta-2-microglobulin (Table 1 and 5). Findings from our previous studies suggest that GZMB was the first of the hematopoietic serine proteases to appear in the chymase locus, where it is found already in amphibians, and a similar enzyme with similar specificity for negatively charged amino acids is also found in reptiles [32,33]. Moreover, another GZMB-like enzyme, that seems to have appeared from another locus in fish by convergent evolution, may also be an apoptosis-inducing enzyme produced by NK-like cells in fish [34].
The total lack of activation-induced expression observed for granzyme A, K and M in the present study is intriguing. For two of them, A and K, we even observed a marked decrease in expression upon activation (Table 1 and Figure 3). This finding puts serious doubts on the role of these granzymes in apoptosis induction and instead points to other roles in immunity. GZMA was initially described as an apoptosis-inducing granzyme [35]. However, by using more physiological concentrations of GZMA its role in apoptosis was questioned, and instead it was shown to be involved in inducing cytokine production [36]. However, even this role was recently contested by work from our group as the induction of the major inflammatory cytokines in human monocytes by purified GZMA was very minor compared to the same effect by LPS [37]. Also, we could not exclude the possibility that the induction of the very low amounts of the inflammatory cytokines, IL-1, IL-6 and TNF-α, could have been caused by small amount of contaminating LPS in the GZMA preparation [37]. The actual roles for several of the granzymes in T cell immunity are therefore still an open question.
The relatively modest 2-fold upregulation of perforin, the pore forming protein needed for the entry of GZMB into the target cell, may seem a bit surprising when comparing with the marked upregulation of GZMB (Table 1). However, it is possible that the amount of perforin stored in resting cells is sufficient for potent targeting of the infected cells once GZMB has reached sufficient levels for efficient apoptosis-induction. The expression of another pore forming protein, granulysin, did not increase upon activation, but instead a transient decrease was observed at the 4-hour time point, indicating that granulysin, which primarily seems to be involved in killing cells infected with intracellular bacteria, is differently regulated compared to anti-viral responses [13].
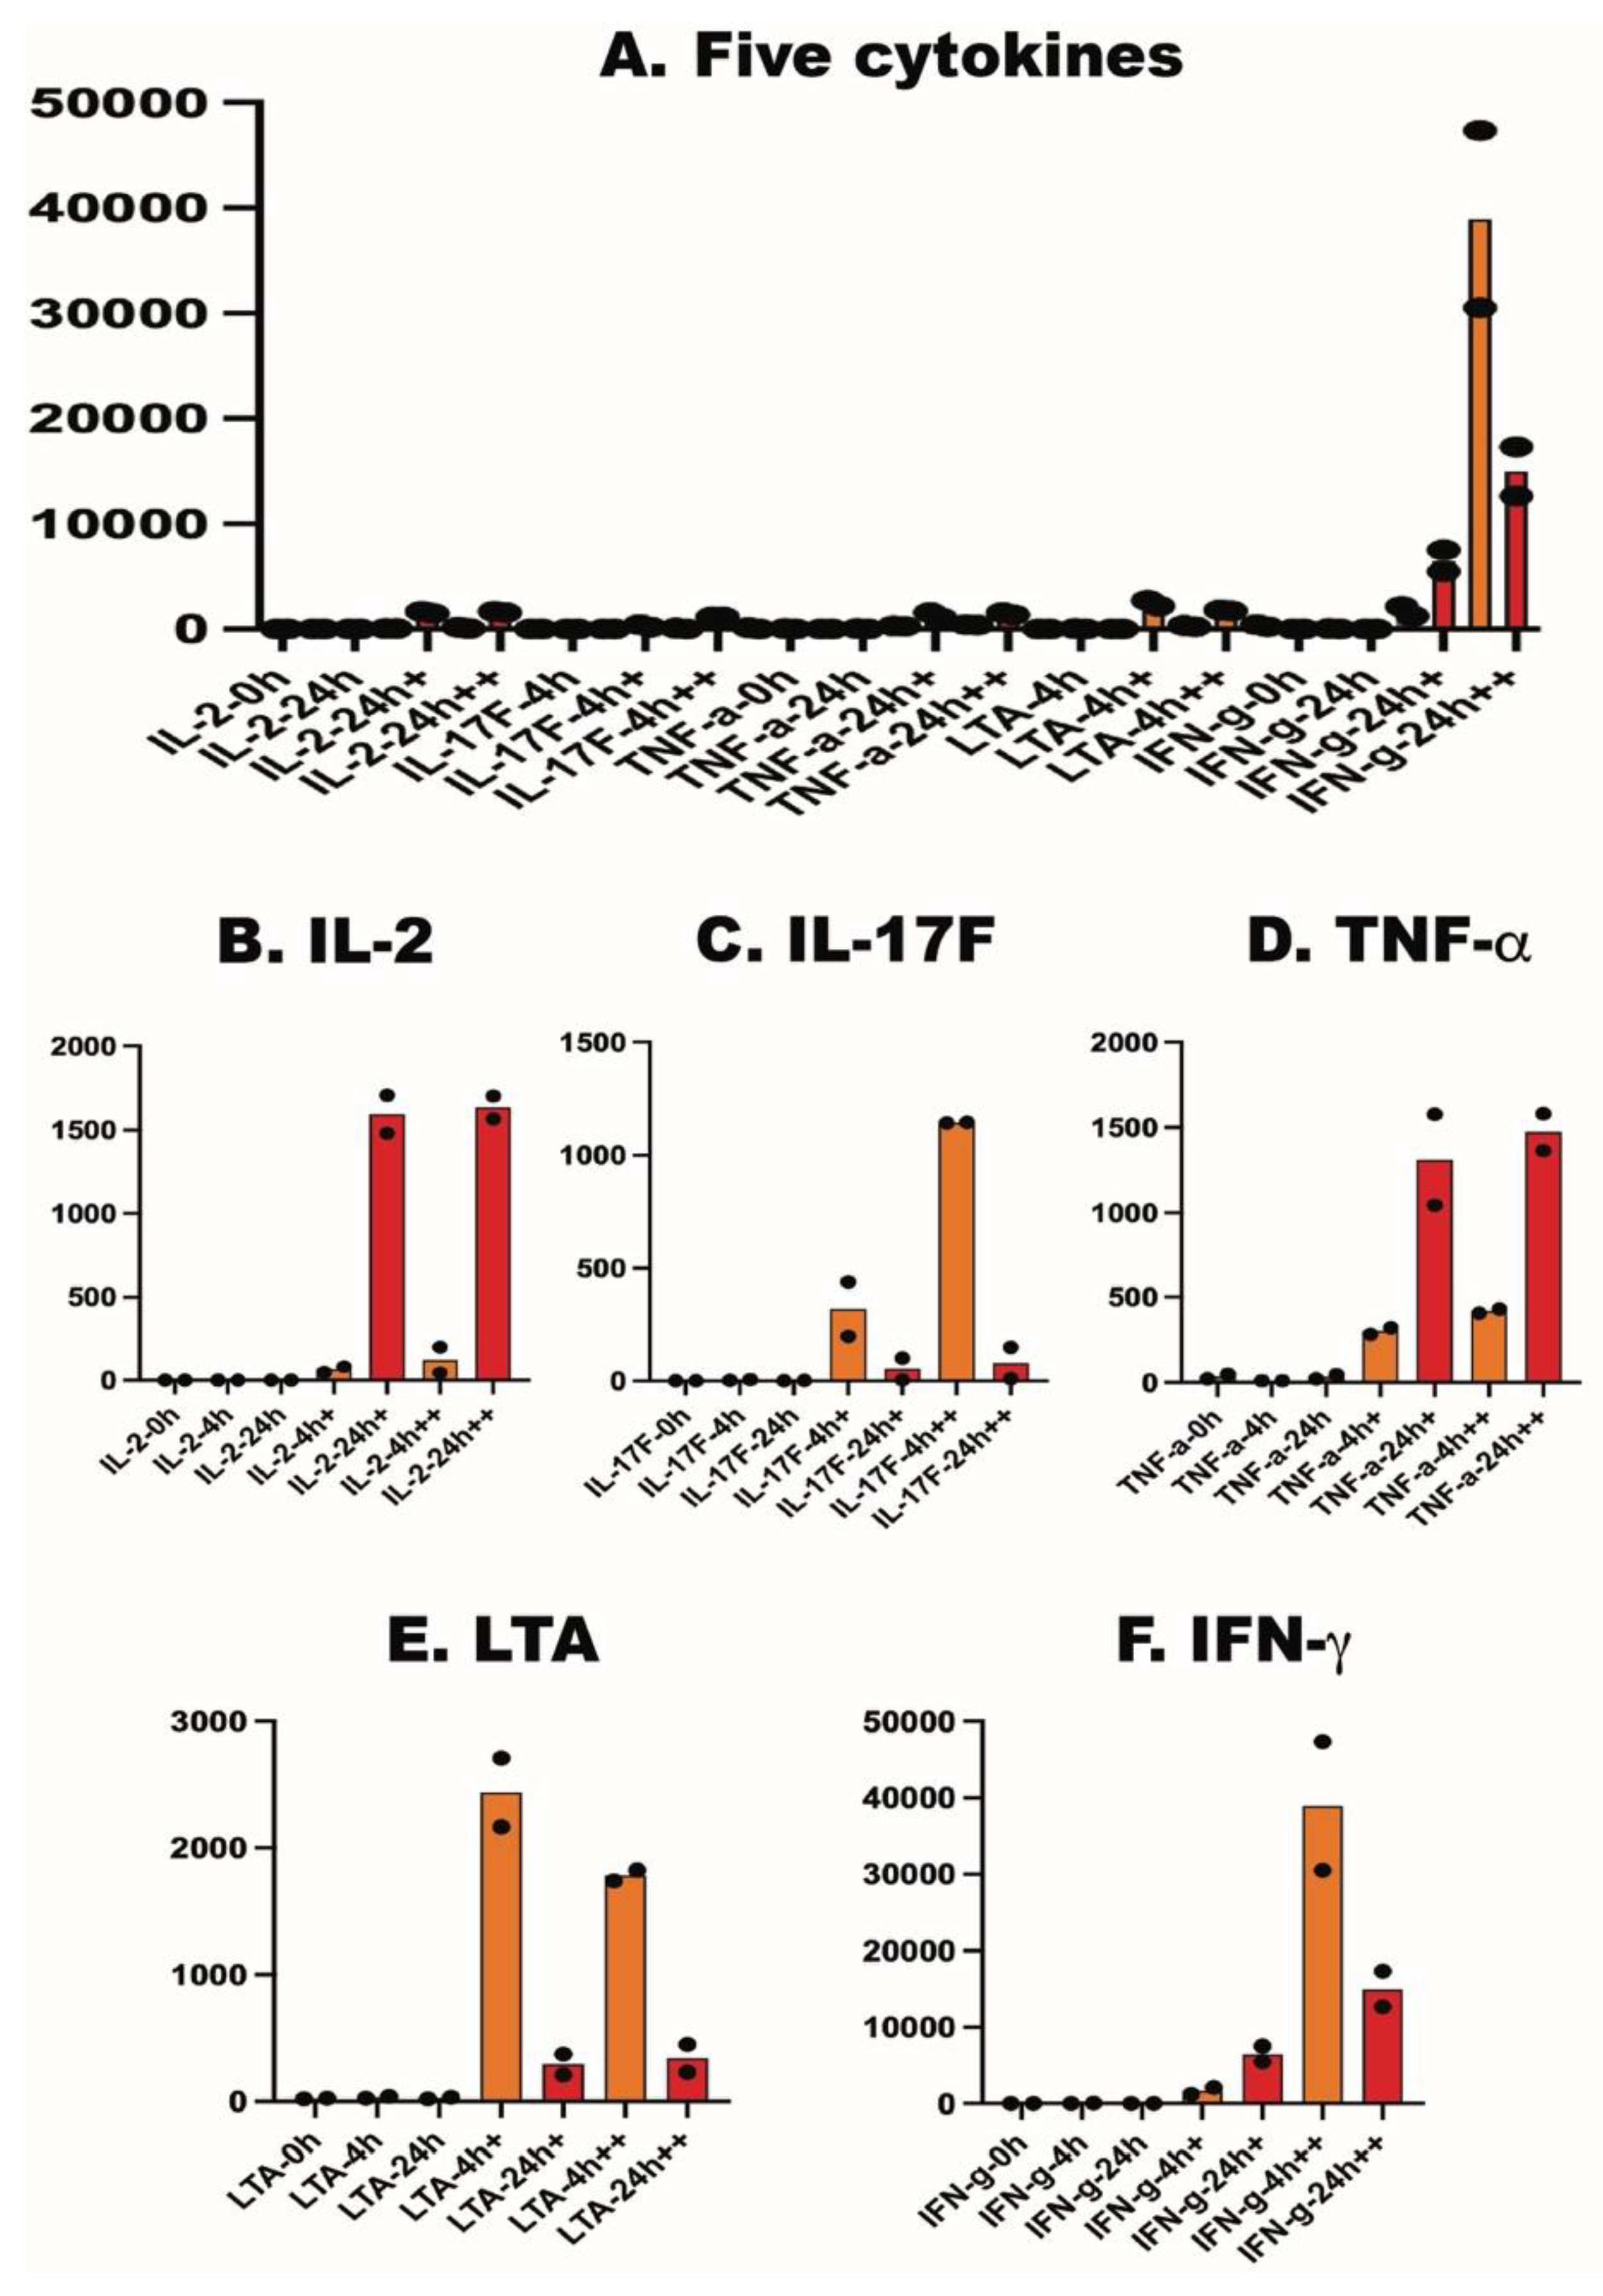
An interesting finding was the very potent induction of several cytokines and chemokines by the activation of human CD8+ T cells (Table 2 and Figure 5). The major cytokine produced by these cells was IFN-γ, which after stimulation by CD2, CD3, CD28 and the cytokines IL-12 and IL-18 became the most dominant transcript reaching 268 % of the top transcript of resting cells, which was beta-2-microglobulin with 17666 reads (Table 2 and Table 5). The response by the IFN-γ gene was quick as the expression reached a maximum at the 4-hour time point and then decreased by approximately 50% by 24 hours (Table 2 and Figure 4). Two other cytokines, IL-2 and TNF-α, both showed the opposite pattern with a slow response to activation, reaching their peak expressions at the 24-hour time point (Table 2 and Figure 4). The peak expression level for IFN-γ was 20-30 times higher than for both IL-2 and TNF-α, with 47 367 reads at maximum for IFN-γ, and 1566 and 1364 reads for IL-2 and TNF-α, respectively (Table 2). The very high level of IFN-γ expression suggests that CD8+ T cells can be a major local inducer of potent activation of macrophages, monocytes and other inflammatory cells. The relatively high gene expression of IL-2 also indicates that these cells could be self-sufficient in maintaining activation by having their own produced IL-2, potentially in addition to the IL-2 produced by CD4+ cells in the area of infection. Interestingly, we also observed a strong upregulation of the high affinity IL-2 receptor alpha subunit, the IL2RA, and a minor increase in the beta chain but no effect on the gamma chain (Table 2). These findings indicate that upon activation, the CD8+ T cells become more responsive to the self-produced IL-2, thereby maintaining their high level of activation and possibly also increasing their proliferative potential to enable a rapid increase in numbers of activated cytotoxic T cells in the area of infection.
A rapid transient expression of IL-17F was observed, with a 30-fold upregulation by 4 hours and an additional five-fold increase by IL-12 and IL-18, reaching levels of over 1100 reads (Table 2 and Figure 4). This response was then almost totally gone by 24 hours when the mRNA level for IL-17F was back to baseline (Table 2 and Figure 4). A strong upregulation was also seen for both LIF and LTA (Table 2 and Figure 4). These two cytokines showed a similar pattern as for IL-17F, with a rapid strong response at 4 hours followed by a decrease in expression by 24 hours (Table 2). In a recent study of the transcriptomes of five human immune cell populations we found that LIF was constitutively expressed, and at quite high levels, only by skin mast cell but not by B cells, monocytes and CD4+ and CD8+ T cells [2]. An interesting question is what role this cytokine plays in peripheral tissues such as normal skin and in infected tissues upon activation of cytotoxic T cells, especially considering its primary role in maintaining stem cell-ness in the bone marrow [38]. We also observed a major increase in several additional cytokines including IL-3, IL-4, IL-5, IL-10 and IL-13 but from very low initial levels and with final concentrations relatively low compared to IFN-γ, IL-2, TNF-α, LTA and LIF, with the exception of IL-3 that in one sample reached 334 reads (Table 2).
Major findings from the analysis of cytokine expression in activated CD8+ T cells included the extremely high levels of IFN-γ and of several additional cytokines and also the very rapid response. We have recently shown that monocytes are extremely potent producers of a limited set of inflammatory cytokines and chemokines upon activation by LPS [39]. This finding together with the present data on CD8+ T cells suggest a potent regulatory role for several major immune cell populations, not only for CD4+ T helper cell populations [39]. In the monocytes, upregulation was almost exclusively seen for the genes of the classical inflammatory cytokines, IL-1α, IL-1β, IL-6 and TNF-α, and for a few chemokines including IL-8 [39]. The most extreme response was seen for IL-6 and IL-8, with 75 000 times upregulation of IL-6 by 4-hours incubation in the presence of LPS, and with IL-8 being the dominant transcript with a level of 150% compared to lysozyme, the most highly expressed transcript in non-activated monocytes [39]. NK cells have previously also been shown to be very potent producers of IFN-γ [40]. It is therefore apparent that several of the major immune cell populations can become extremely potent cytokine and chemokine producers upon activation, which in certain situations can lead to very dangerous cytokine storms as was observed during severe covid infections and other viral infections [41].
Figure 4.
Expression levels of five strongly upregulated cytokines. As can be seen from panel A the most dramatic upregulation was observed for IFN-γ. However, we also observed a strong upregulation of both IL-2 and TNF-α and then primarily at the 24-hour time point. The upregulation of LTA and IL-17F showed the opposite pattern with strong upregulation at the 4-hour time point and then back to almost pre-activation levels at 24-hours. A strong effect of the addition of the cytokines IL-12 and IL-18 was primarily seen for IFN- γ and IL-17F.
A potent upregulation of five different CCL chemokines was also observed, namely CCL3, CCL3L1, CCL4, CCL4L1 and CCL20 (Table 2 and Figure 5). They reached expression levels of almost 2000 reads for some of them and over 12000 reads for others. This finding suggests that activated cytotoxic T cells are potent players in the recruitment of other inflammatory cells, including lymphocytes, monocytes, macrophages and granulocytes, to the area of infection/inflammation.
Figure 5.
Expression of five different chemokines upon activation of CD8+ T cells. The most pronounced upregulation in expression was seen at the 24-hour time point for four of these chemokines, CCL3L1, CCL-4, CCL4L1 and CCL20. It was only for CCL3 that we could detect higher expression levels at the 4-hour time point.
One of the micro RNAs increased quite dramatically by almost 100 -times, the MIR155HG (Table 4). The function of this micro-RNA does not seem to be fully known but it has been shown to be involved in the graft versus host response by T cells, which is why its potent upregulation during activation of CD8+ T cells could be of interest for future studies [22]. We also observed major increases in the transcription factors TBX21 and ZBED2, which both are of importance for the expression of IFN-γ. TBX21, more commonly known as T-bet, is a transcription factor essential for TH1 type of immune responses and thereby is a strong positive regulator of IFN-γ [23,24]. ZBED2 is a zinc finger protein and has been shown to have the opposite function as it limits interferon responses by binding interferon responsive factor-1 (IRF1) [25]. Hence, our findings indicate a response by at least two opposing transcription factors in the activation process of CD8+ T cells. This process most likely also involves several additional transcription factors for which we here did not see any marked upregulation.
An effect on the mRNA levels for several house-keeping genes was observed together with several solute carriers, which indicate that the cells upon activation also initiate metabolic changes possibly to initiate a proliferative response. However, this response was relatively minor compared to the dramatic upregulation of GZMB and IFN-γ, and to the somewhat less, but still strong upregulation of IL-2, IL-2 receptor alpha chain and TNF-α. This very strong response in GZMB and a few cytokines and chemokines indicate that the primary goal during the activation of CD8+ T cells is to activate the apoptosis machinery and to activate phagocytic inflammatory cells in the area of infection. Future analysis of additional immune cells and their changes in transcriptomic response upon activation will hopefully elucidate how highly efficient targeting of pathogens can be achieved by tailormade coordinated responses from several immune cell populations.
We will here make clear that the findings of this communication are based solely on mRNA levels and this is in most cases also reflecting the protein levels, but not always. Protein stability is a major factor that affect protein steady state levels, and translation is also strongly affected by micro RNAs. However, due to difficulties in obtaining accurate protein levels, mRNA levels are in general the best way to obtain an overall view of the entire production of proteins from a cell involving all approximately 21 000 genes.
4. Materials and Methods
4.1. Isolation of Human Peripheral Blood CD8+ T Cells
Peripheral blood samples in the form of buffy coats from healthy male and female donors were obtained from the blood bank at Uppsala University Hospital. Peripheral blood mononuclear cells (PBMCs) were isolated by density gradient centrifugation using Ficoll-Paque (Cytiva). CD8⁺ T cells were then positively selected from PBMCs using the CD8⁺ T Cell Isolation Kit (MACS, Miltenyi Biotec), following the manufacturer’s instructions. The purity of the isolated CD8⁺ T cell population was >96%, as confirmed by flow cytometry. The samples were analyzed in a Beckman Coulter CytoFLEX LX flow cytometer and the data was further processed in FlowJo. The following antibodies were used in the analysis; Anti-Human CD45 EF506 (ThermoFisher Scientific Catalog#: 69-0459-42), Anti-Human anti CD3 BV421 (ThermoFisher Scientific Catalog#: 404-0037-41), Anti-Human CD8a BV605 (ThermoFisher Scientific Catalog#: 406-0088-41), Anti-Human CD56 APC (ThermoFisher Scientific Catalog#: 17-0567-41). The samples were also analyzed for the absence of CD4+ and CD14+ cells. The staining procedure was performed as previously described [9]. Purified cells were immediately used for downstream culture and activation experiments.
4.2. Activation of the CD8+ T Cells
CD8⁺ T cells were cultured in TexMACS™ medium (Miltenyi Biotec) supplemented with 10% fetal bovine serum (FBS) and maintained at 37 °C in a humidified incubator with 5% CO₂. Cells were collected at 0 hours (baseline), 4 hours, and 24 hours for subsequent analyses. For activation, cells were stimulated using the T Cell Activation/Expansion Kit (Miltenyi Biotec), which includes anti-biotin MACSiBead™ Particles and biotinylated antibodies targeting human CD2, CD3, and CD28. Activation beads were prepared by incubating anti-biotin MACSiBead Particles (1 × 10⁸ particles) with biotinylated antibodies at a final concentration of 10 µg/mL. The bead-antibody complex was added to cultures at a ratio of 2.5 × 10⁶ beads per 5 × 10⁶ CD8⁺ T cells, and incubated for either 4 or 24 hours.
Two cultures of CD8+ T cells, one from a male donor and one from a female donor, were further activated by a combination of the above-described beads and two recombinant cytokines, IL-12 and IL-18. For the cytokine co-stimulation, recombinant human IL-12 and IL-18 (PeproTech) were added at a final concentration of 100 ng/mL each. Cytokine-stimulated cells were incubated as for the beads-only stimulated cells for 4 and 24 hours.
All handling of the cells and growth medium was done with plastic pipettes as we have observed that recirculating glass pipettes can contain large amounts of pyrogenic material from bacterial work which can induce a potent activation of inflammatory cytokines and chemokines by various immune cells (REF).
4.3. RNA-seq Analysis of the Total Transcriptome
At the designated time points, cells were harvested for RNA extraction using the RNeasy Mini Kit (Qiagen), according to the manufacturer’s protocol. Total RNA was quantified and submitted to SciLifeLab (Uppsala, Sweden) for bulk RNA sequencing. The transcriptome of the purified and activated human CD8+ T cells were analyzed for their total transcriptome by RNA-seq methodology at the SciLife lab in Uppsala, Sweden. The normalized sequence reads were transferred into a large Excel file for manual analysis.
Supplementary data
The following supporting information can be downloaded at the website of this paper posted on Preprints.org, The entire Excel-file containing all the information for the approximately 21 000 human genes from one female and one male anonymous blood donor. Column B Female cells 0 – Blank-without activation Column C. Female cells 4 hours – Blank-without activation Column D. Female cells 24 hours – Blank-without activation Column E. Female cells 4 hours – With anti-CD2, CD3 and CD28 activation Column F. Female cells 24 hours – With anti-CD2, CD3 and CD28 activation Column G. Female cells 4 hours – With anti-CD2, CD3, CD28, and by IL-12 and IL-18 activation Column H. Female cells 24 hours – With anti-CD2, CD3, CD28, and by L-12 and IL-18 activation Column I- Blank Column J Male cells 0 – Blank-without activation Column K. Male cells 4 hours – Blank-without activation Column L. Male cells 24 hours – Blank-without activation Column M. Male cells 4 hours – With anti-CD2, CD3 and CD28 activation Column N. Male cells 24 hours – With anti-CD2, CD3 and CD28 activation Column O. Male cells 4 hours – With anti-CD2, CD3, CD28, and by L-12 and IL-18 activation Column P. Male cells 24 hours – With anti-CD2, CD3, CD28, and by IL-12 and IL-18 activation
Abbreviations:
Granzyme, GZM; Interferon, IFN; Interleukin, IL.
References
- Akula S, Thorpe M, Boinapally V, Hellman L. Granule Associated Serine Proteases of Hematopoietic Cells - An Analysis of Their Appearance and Diversification during Vertebrate Evolution. PLoS One. 2015;10(11):e0143091.
- Akula S, Alvarado-Vazquez A, Haide Mendez Enriquez E, Bal G, Franke K, Wernersson S, et al. Characterization of Freshly Isolated Human Peripheral Blood B Cells, Monocytes, CD4+ and CD8+ T Cells, and Skin Mast Cells by Quantitative Transcriptomics. International journal of molecular sciences. 2024;25(23).
- Hellman L, Thorpe M. Granule proteases of hematopoietic cells, a family of versatile inflammatory mediators - an update on their cleavage specificity, in vivo substrates, and evolution. Biol Chem. 2014;395(1):15-49.
- Hunig T, Tiefenthaler G, Meyer zum Buschenfelde KH, Meuer SC. Alternative pathway activation of T cells by binding of CD2 to its cell-surface ligand. Nature. 1987;326(6110):298-301.
- Li Y, Kurlander RJ. Comparison of anti-CD3 and anti-CD28-coated beads with soluble anti-CD3 for expanding human T cells: differing impact on CD8 T cell phenotype and responsiveness to restimulation. J Transl Med. 2010;8:104.
- Lustig A, Manor T, Shi G, Li J, Wang YT, An Y, et al. Lipid Microbubble-Conjugated Anti-CD3 and Anti-CD28 Antibodies (Microbubble-Based Human T Cell Activator) Offer Superior Long-Term Expansion of Human Naive T Cells In Vitro. Immunohorizons. 2020;4(8):475-84.
- Henry CJ, Ornelles DA, Mitchell LM, Brzoza-Lewis KL, Hiltbold EM. IL-12 produced by dendritic cells augments CD8+ T cell activation through the production of the chemokines CCL1 and CCL17. J Immunol. 2008;181(12):8576-84.
- Landy E, Carol H, Ring A, Canna S. Biological and clinical roles of IL-18 in inflammatory diseases. Nat Rev Rheumatol. 2024;20(1):33-47.
- Alvarado-Vazquez PA, Mendez-Enriquez E, Salomonsson M, Waern I, Janson C, Wernersson S, et al. Circulating mast cell progenitors increase during natural birch pollen exposure in allergic asthma patients. Allergy. 2023;78(11):2959-68.
- Dotiwala F, Mulik S, Polidoro RB, Ansara JA, Burleigh BA, Walch M, et al. Killer lymphocytes use granulysin, perforin and granzymes to kill intracellular parasites. Nature medicine. 2016;22(2):210-6.
- Voskoboinik I, Dunstone MA, Baran K, Whisstock JC, Trapani JA. Perforin: structure, function, and role in human immunopathology. Immunol Rev. 2010;235(1):35-54.
- Ronnberg E, Pejler G. Serglycin: the master of the mast cell. Methods Mol Biol. 2012;836:201-17.
- Walch M, Dotiwala F, Mulik S, Thiery J, Kirchhausen T, Clayberger C, et al. Cytotoxic cells kill intracellular bacteria through granulysin-mediated delivery of granzymes. Cell. 2014;157(6):1309-23.
- Wolpe SD, Davatelis G, Sherry B, Beutler B, Hesse DG, Nguyen HT, et al. Macrophages secrete a novel heparin-binding protein with inflammatory and neutrophil chemokinetic properties. J Exp Med. 1988;167(2):570-81.
- Kouno J, Nagai H, Nagahata T, Onda M, Yamaguchi H, Adachi K, et al. Up-regulation of CC chemokine, CCL3L1, and receptors, CCR3, CCR5 in human glioblastoma that promotes cell growth. J Neurooncol. 2004;70(3):301-7.
- Menten P, Wuyts A, Van Damme J. Macrophage inflammatory protein-1. Cytokine & growth factor reviews. 2002;13(6):455-81.
- Guan E, Wang J, Norcross MA. Identification of human macrophage inflammatory proteins 1alpha and 1beta as a native secreted heterodimer. J Biol Chem. 2001;276(15):12404-9.
- Howard OM, Turpin JA, Goldman R, Modi WS. Functional redundancy of the human CCL4 and CCL4L1 chemokine genes. Biochem Biophys Res Commun. 2004;320(3):927-31.
- Hieshima K, Imai T, Opdenakker G, Van Damme J, Kusuda J, Tei H, et al. Molecular cloning of a novel human CC chemokine liver and activation-regulated chemokine (LARC) expressed in liver. Chemotactic activity for lymphocytes and gene localization on chromosome 2. J Biol Chem. 1997;272(9):5846-53.
- Croft M. Co-stimulatory members of the TNFR family: keys to effective T-cell immunity? Nat Rev Immunol. 2003;3(8):609-20.
- Dostert C, Grusdat M, Letellier E, Brenner D. The TNF Family of Ligands and Receptors: Communication Modules in the Immune System and Beyond. Physiol Rev. 2019;99(1):115-60.
- Neidemire-Colley L, Khanal S, Braunreiter KM, Gao Y, Kumar R, Snyder KJ, et al. CRISPR/Cas9 deletion of MIR155HG in human T cells reduces incidence and severity of acute GVHD in a xenogeneic model. Blood Adv. 2024;8(4):947-58.
- Peng SL. The T-box transcription factor T-bet in immunity and autoimmunity. Cell Mol Immunol. 2006;3(2):87-95.
- Oh S, Hwang ES. The role of protein modifications of T-bet in cytokine production and differentiation of T helper cells. J Immunol Res. 2014;2014:589672.
- Somerville TDD, Xu Y, Wu XS, Maia-Silva D, Hur SK, de Almeida LMN, et al. ZBED2 is an antagonist of interferon regulatory factor 1 and modifies cell identity in pancreatic cancer. Proc Natl Acad Sci U S A. 2020;117(21):11471-82.
- Hayward A, Ghazal A, Andersson G, Andersson L, Jern P. ZBED evolution: repeated utilization of DNA transposons as regulators of diverse host functions. PLoS One. 2013;8(3):e59940.
- Scalise M, Pochini L, Console L, Losso MA, Indiveri C. The Human SLC1A5 (ASCT2) Amino Acid Transporter: From Function to Structure and Role in Cell Biology. Front Cell Dev Biol. 2018;6:96.
- Halestrap AP. The SLC16 gene family - structure, role and regulation in health and disease. Mol Aspects Med. 2013;34(2-3):337-49.
- Clemencon B, Babot M, Trezeguet V. The mitochondrial ADP/ATP carrier (SLC25 family): pathological implications of its dysfunction. Mol Aspects Med. 2013;34(2-3):485-93.
- Lash LH. Mitochondrial glutathione transport: physiological, pathological and toxicological implications. Chem Biol Interact. 2006;163(1-2):54-67.
- Pastor-Anglada M, Mata-Ventosa A, Perez-Torras S. Inborn Errors of Nucleoside Transporter (NT)-Encoding Genes (SLC28 and SLC29). International journal of molecular sciences. 2022;23(15).
- Akula S, Fu Z, Wernersson S, Hellman L. The Evolutionary History of the Chymase Locus -a Locus Encoding Several of the Major Hematopoietic Serine Proteases. International journal of molecular sciences. 2021;22(20).
- Ryu J, Fu Z, Akula S, Olsson AK, Hellman L. Extended cleavage specificity of a Chinese alligator granzyme B homologue, a strict Glu-ase in contrast to the mammalian Asp-ases. Developmental and comparative immunology. 2021;128:104324.
- Thorpe M, Akula S, Hellman L. Channel catfish granzyme-like I is a highly specific serine protease with metase activity that is expressed by fish NK-like cells. Developmental and comparative immunology. 2016;63:84-95.
- Lieberman J. Granzyme A activates another way to die. Immunol Rev. 2010;235(1):93-104.
- Metkar SS, Menaa C, Pardo J, Wang B, Wallich R, Freudenberg M, et al. Human and mouse granzyme A induce a proinflammatory cytokine response. Immunity. 2008;29(5):720-33.
- Aybay E, Ryu J, Fu Z, Akula S, Enriquez EM, Hallgren J, et al. Extended cleavage specificities of human granzymes A and K, two closely related enzymes with conserved but still poorly defined functions in T and NK cell-mediated immunity. Frontiers in immunology. 2023;14:1211295.
- Nicola NA, Babon JJ. Leukemia inhibitory factor (LIF). Cytokine & growth factor reviews. 2015;26(5):533-44.
- Lara S, Akula S, Fu Z, Olsson AK, Kleinau S, Hellman L. The Human Monocyte-A Circulating Sensor of Infection and a Potent and Rapid Inducer of Inflammation. International journal of molecular sciences. 2022;23(7).
- Paolini R, Bernardini G, Molfetta R, Santoni A. NK cells and interferons. Cytokine & growth factor reviews. 2015;26(2):113-20.
- Morris G, Bortolasci CC, Puri BK, Marx W, O'Neil A, Athan E, et al. The cytokine storms of COVID-19, H1N1 influenza, CRS and MAS compared. Can one sized treatment fit all? Cytokine. 2021;144:155593.
Figure 1.
Overview of the experimental setup. Human peripheral blood cells originating from buffy coats were first separated on Ficoll gradients and then the CD8+ T cells were purified by magnetic cell sorting. One fraction of cells was then directly frozen for later RNA purification. The remaining cells were separated into six equal sized cell fractions and cultured for 4 or 24 hours according to the schedule shown in the figure. Following centrifugation to remove the culture medium, RNA was extracted from all seven cell fractions and sent for RNA-seq analysis. Two identical setups were performed one with cells from a female donor and one from a male donor.
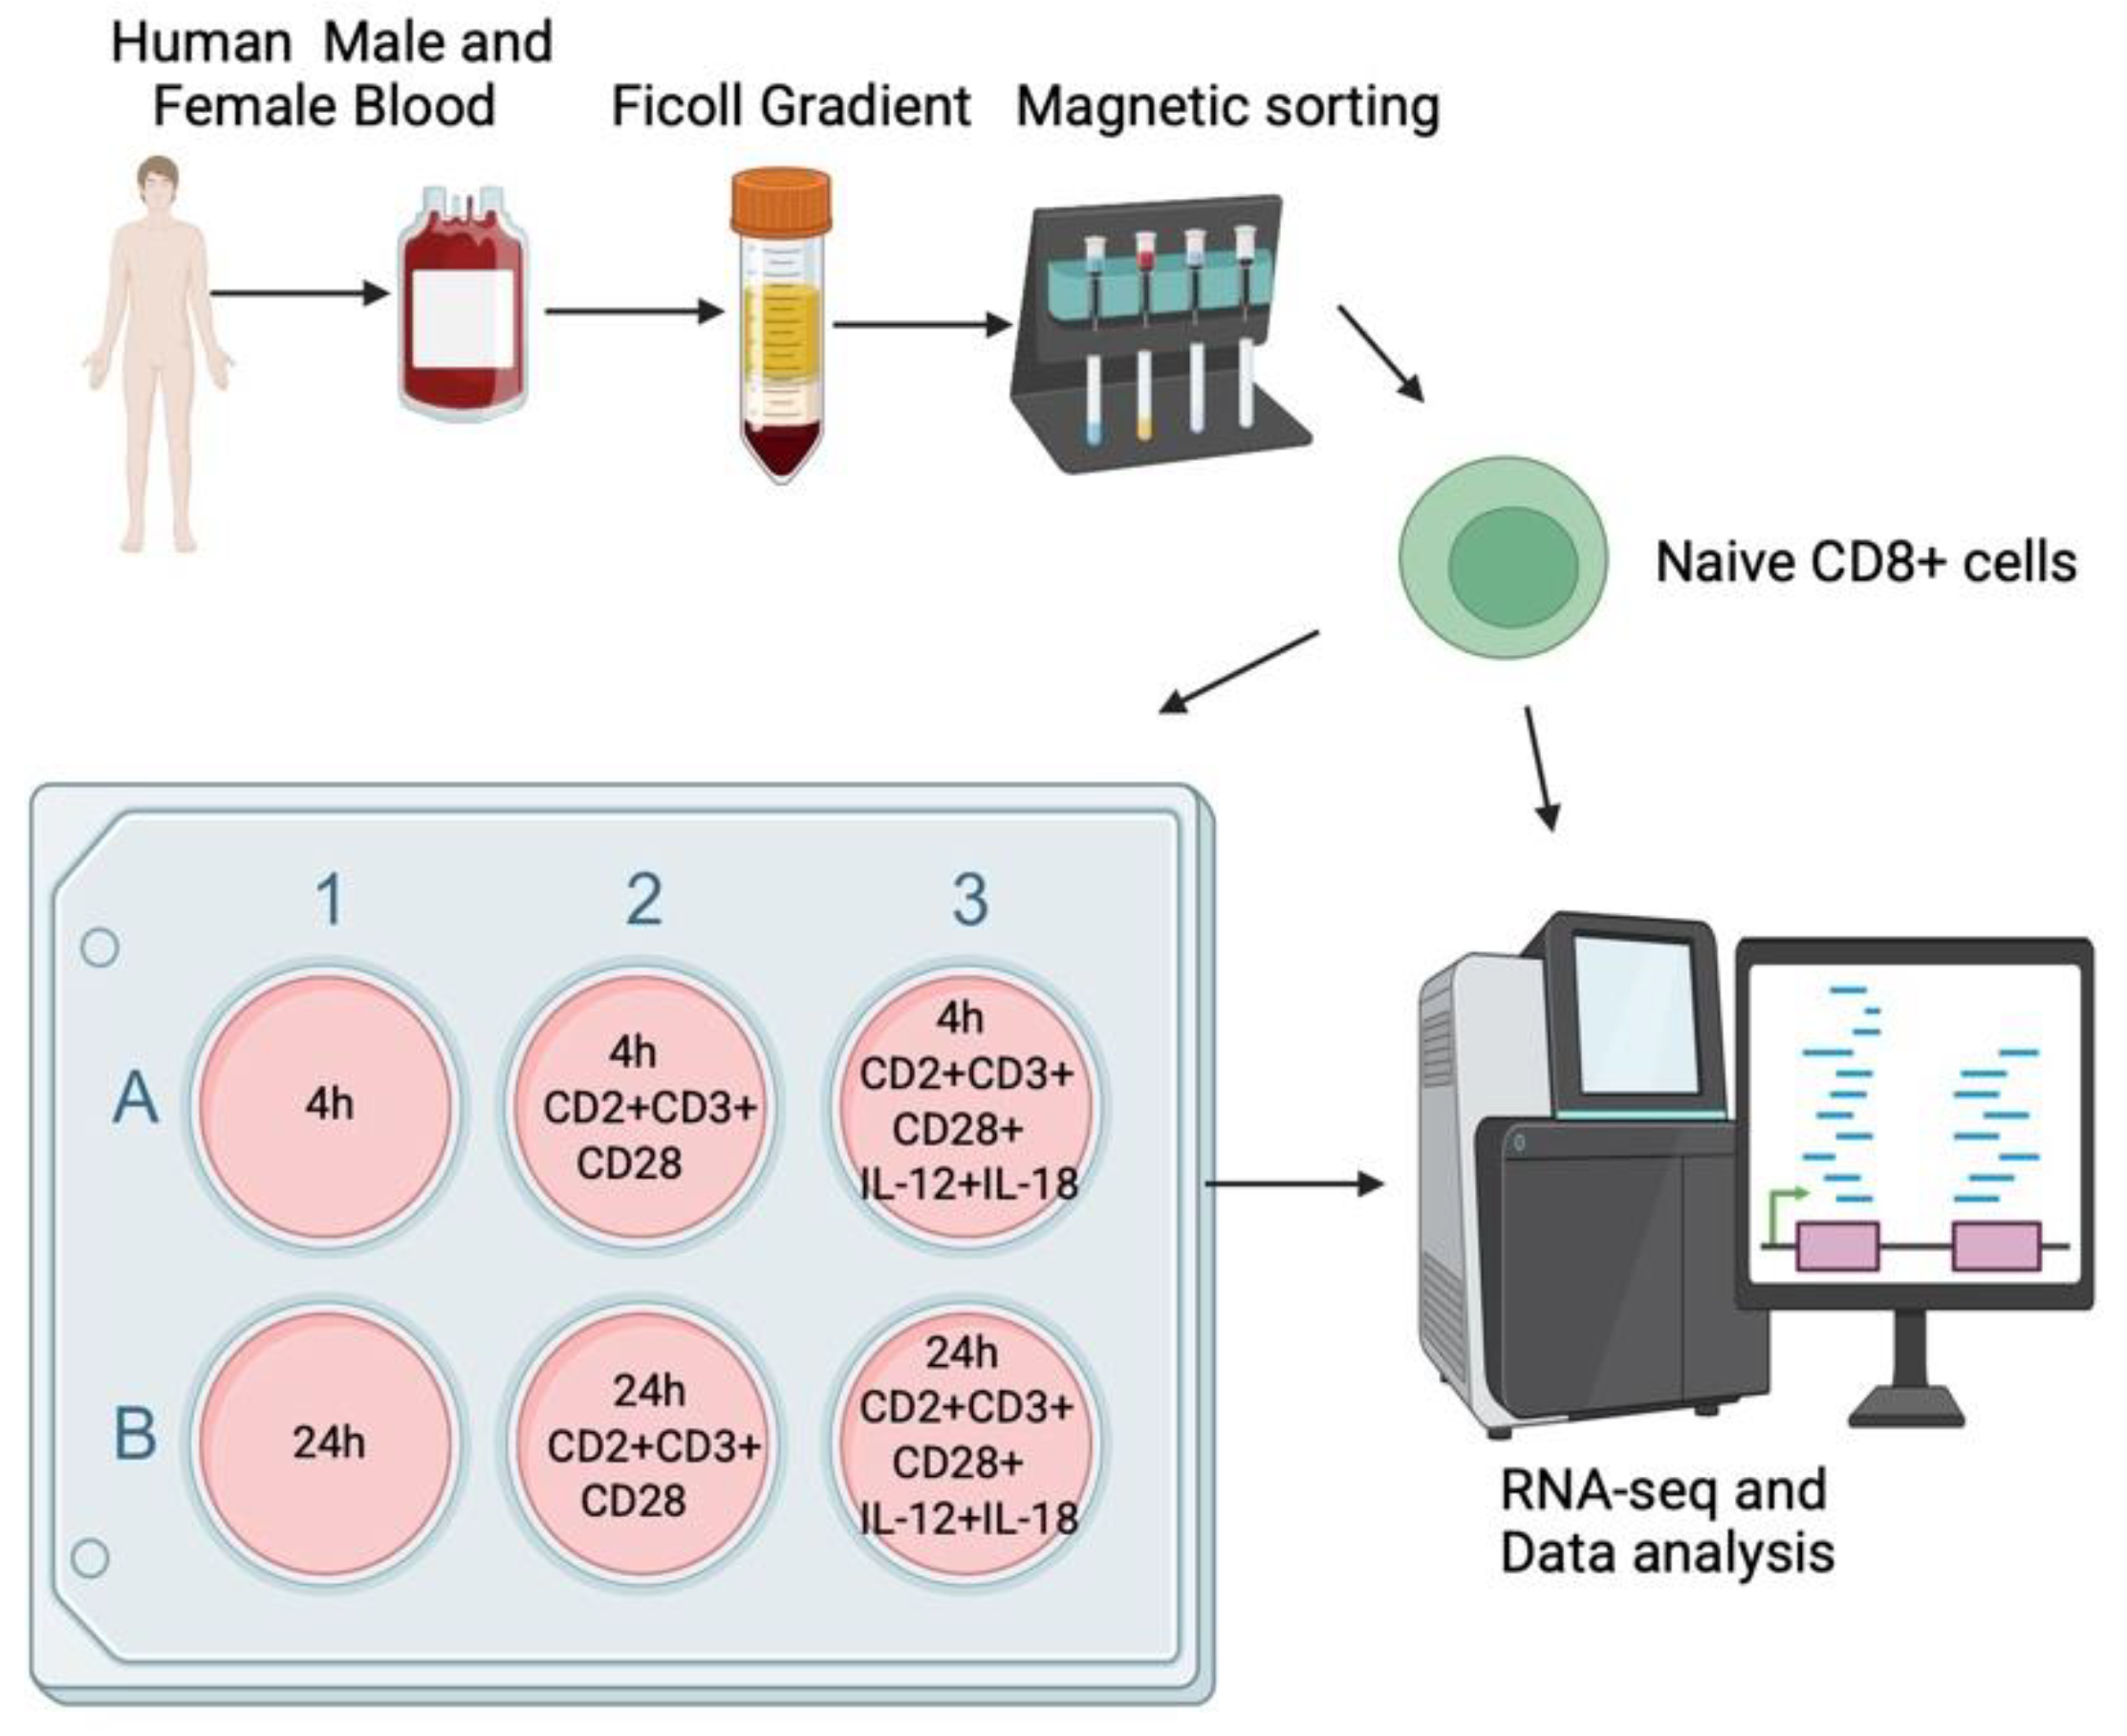
Figure 2.
Purification of human CD8+ T cells. The purity of the CD8+ cells before and after enrichment is shown as percentage of the total CD45+ cells. Sample 1 originate from a female blood donor and Sample 2 from a male blood donor.
Figure 2.
Purification of human CD8+ T cells. The purity of the CD8+ cells before and after enrichment is shown as percentage of the total CD45+ cells. Sample 1 originate from a female blood donor and Sample 2 from a male blood donor.
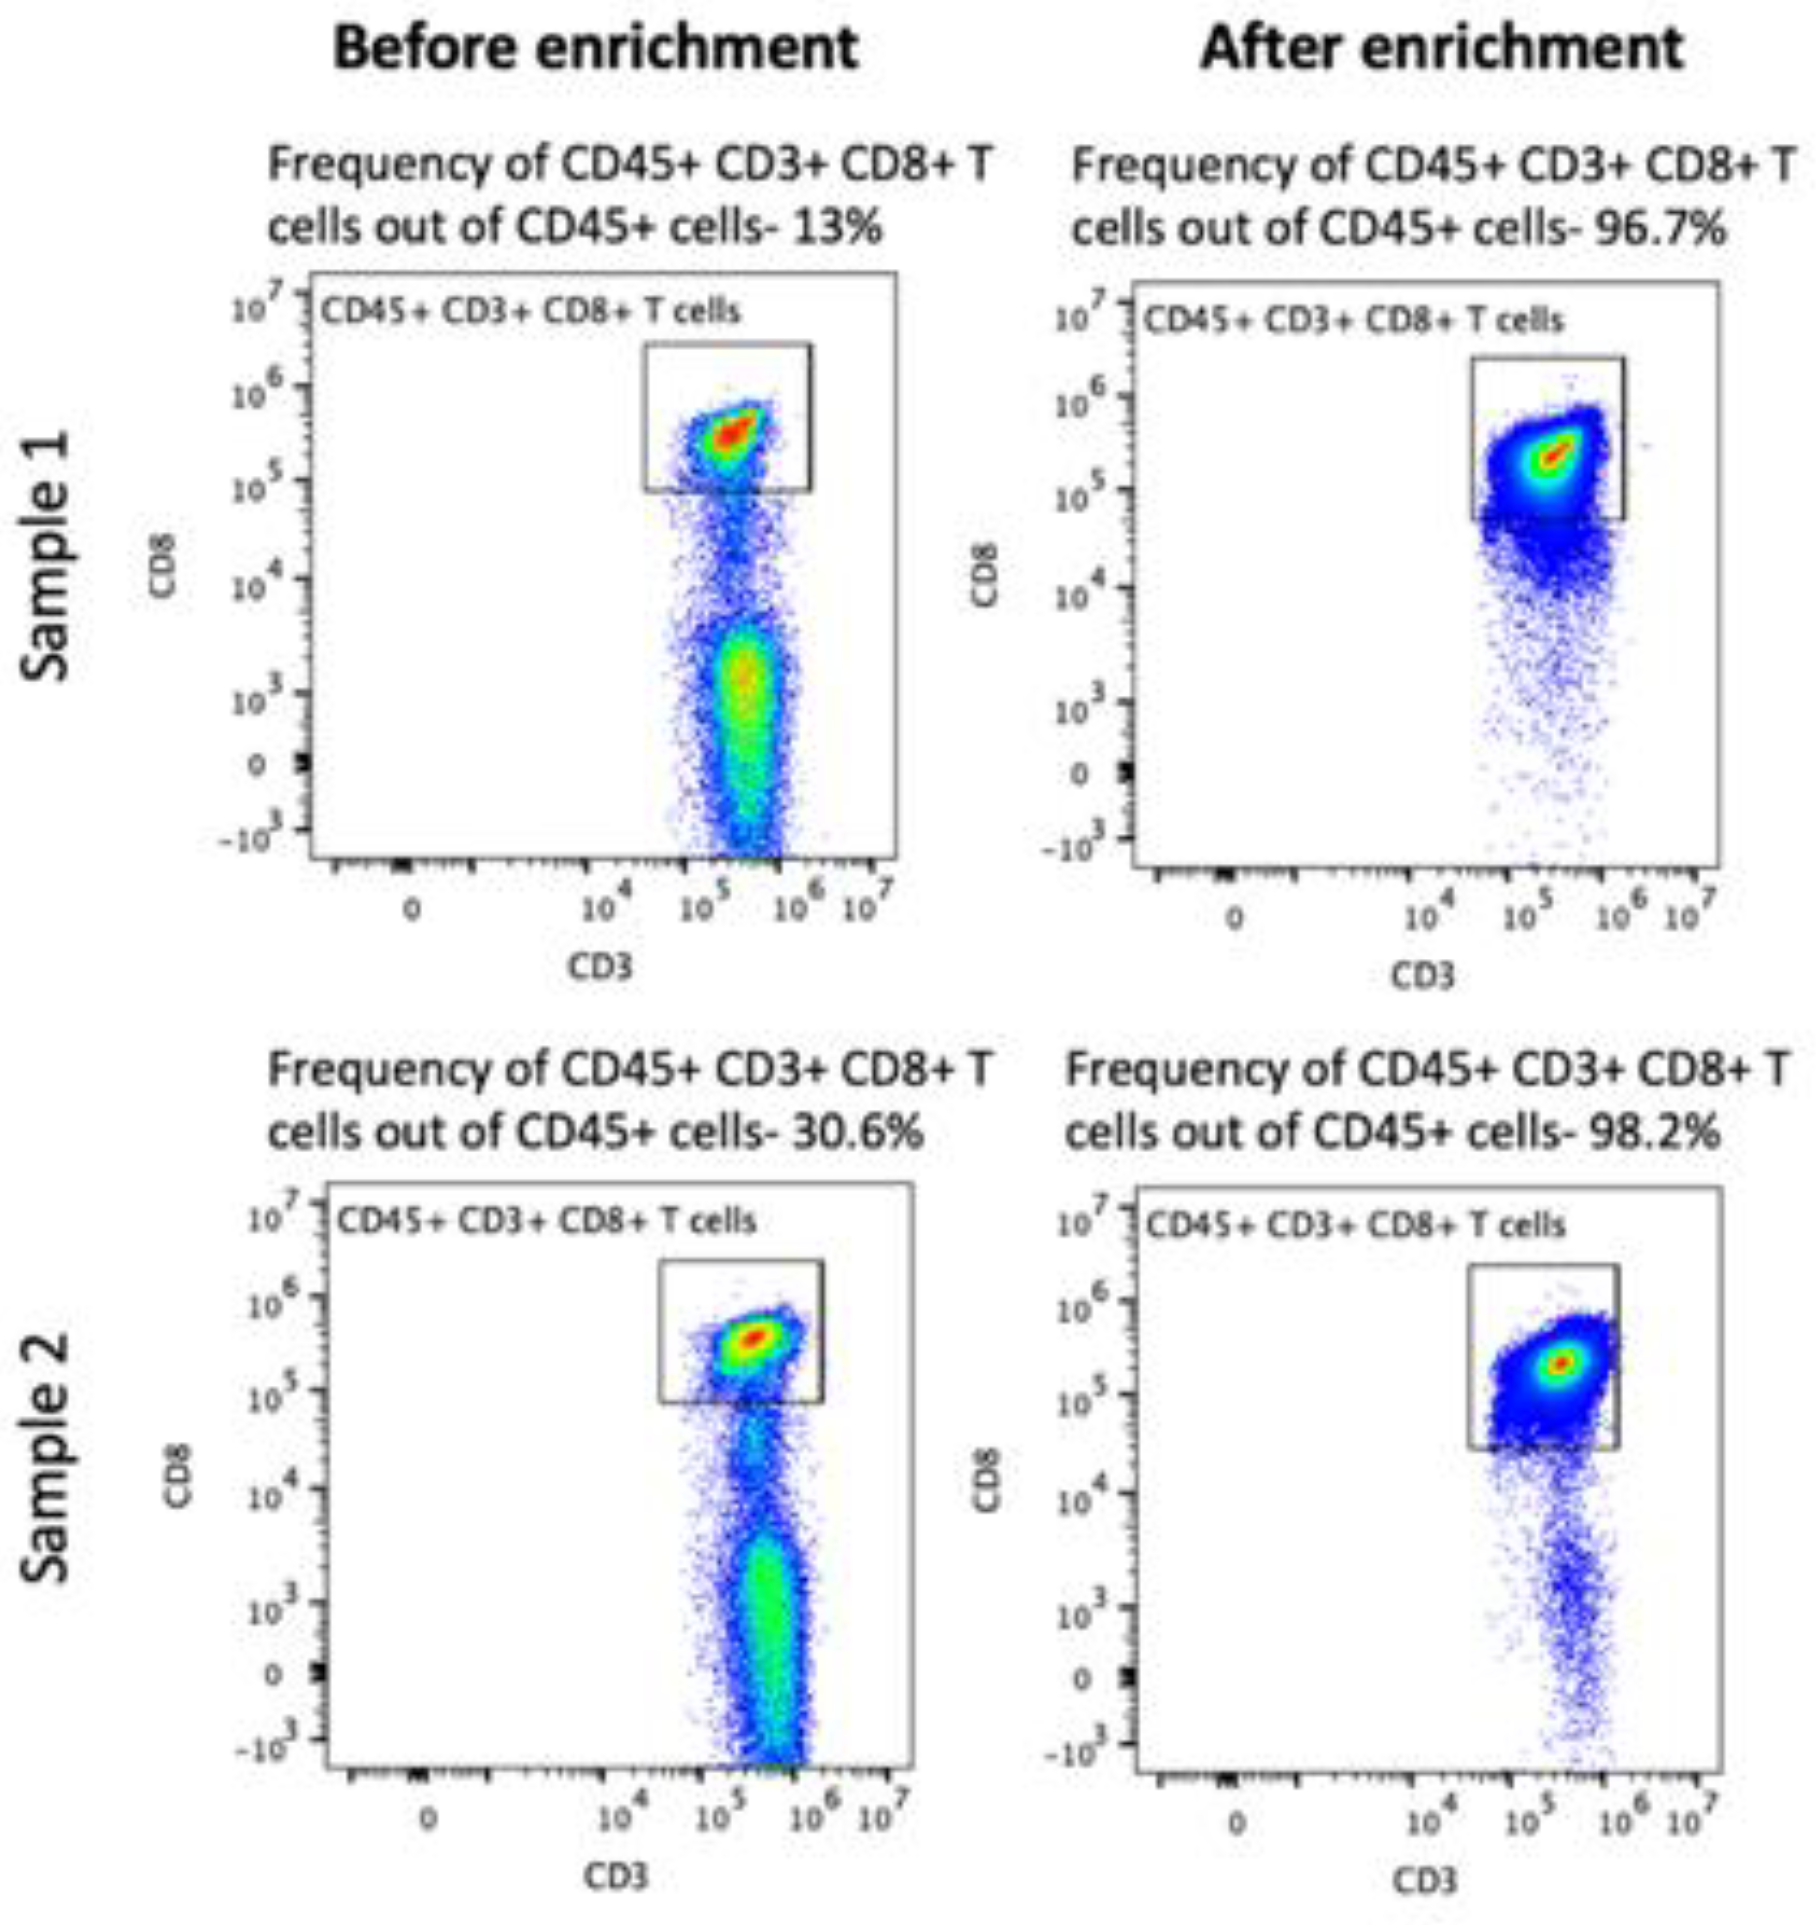
Figure 3.
Expression levels of the five human granzymes in CD8+ T cells upon activation. As can be seen from panel A only GZMB showed a major upregulation upon stimulation and the stimulation peaked at the 4-hour time point (in orange). In contrast, the granzymes A, K and M decreased in expression levels upon activation (Panels B, C and F). A minor increase in GZMH is seen at the 4-hour time point (Panel E). The Y-axis shows the number of reads in the RNA-seq analysis.
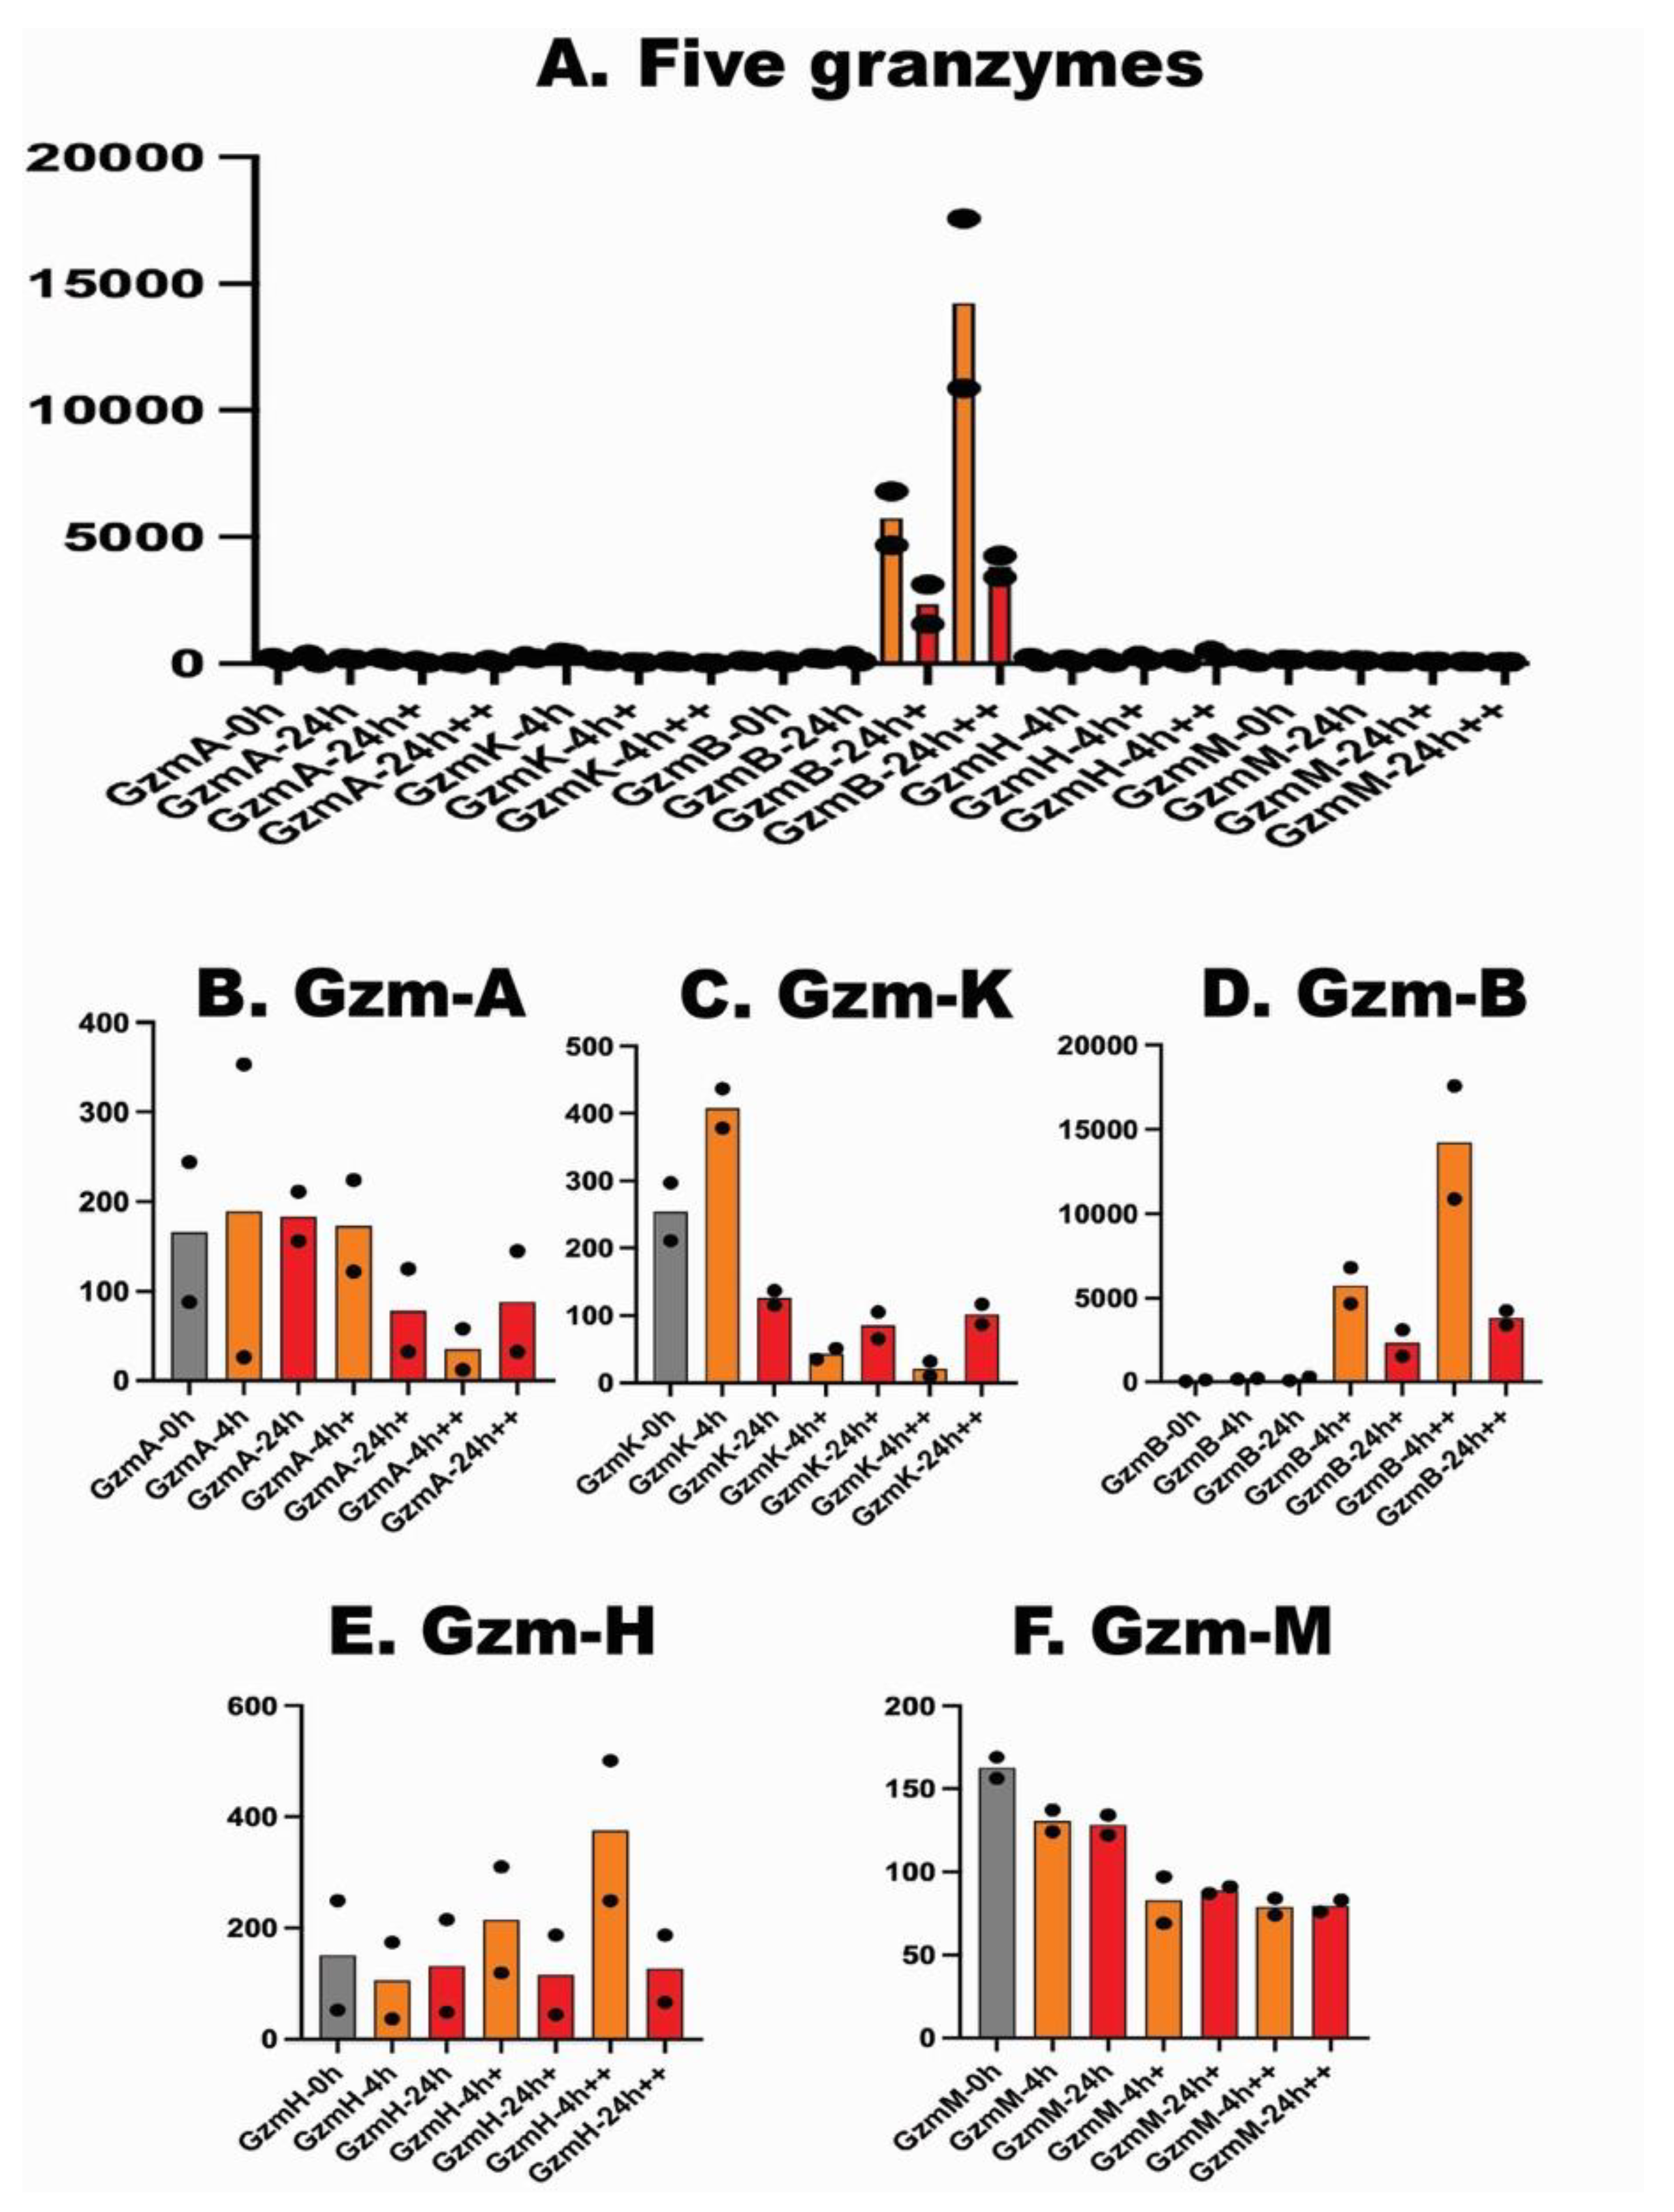

Table 1.
Granule-associated proteins. The 0, 4h and 24h lanes are from unstimulated cells at 0 minutes (before culturing), after 4 hours and after 24 hours in culture. The 4h+ and 24h+ lanes are from cultures activated with anti-CD2, CD3 and CD28 coupled beads. The 4h++ and 24h++ lanes are from cultures incubated with both the beads and the cytokines IL-12 and IL-18. The most highly upregulated samples are marked in red. The expression levels are shown as number of actual reads during the sequencing of the sample. A higher number of reads correspond to a higher expression level.
| Sample 1 (female donor) | Sample 2 (male donor) | |||||||||||||
| Genes | 0 | 4h | 24h | 4h+ | 24h+ | 4h++ | 24h++ | 0 | 4h | 24h | 4h+ | 24h+ | 4h++ | 24h++ |
| GZMA | 88 | 26 | 156 | 122 | 32 | 12 | 34 | 156 | 327 | 55 | 102 | 93 | 46 | 113 |
| GZMK | 211 | 378 | 115 | 35 | 65 | 10 | 87 | 297 | 437 | 137 | 51 | 105 | 32 | 117 |
| GZMB | 43 | 173 | 86 | 6816 | 1552 | 17579 | 3411 | 131 | 231 | 302 | 4671 | 3130 | 10881 | 4262 |
| GZMH | 52 | 36 | 48 | 119 | 44 | 249 | 66 | 249 | 174 | 215 | 310 | 187 | 501 | 187 |
| GZMM | 156 | 124 | 122 | 69 | 87 | 74 | 76 | 169 | 137 | 134 | 97 | 91 | 84 | 83 |
| Perforin | 166 | 334 | 222 | 201 | 413 | 204 | 462 | 143 | 389 | 363 | 315 | 685 | 316 | 729 |
| GNLY | 374 | 324 | 304 | 93 | 281 | 44 | 259 | 1111 | 1070 | 1114 | 373 | 1024 | 276 | 1019 |
| SRGN | 673 | 363 | 856 | 645 | 2020 | 592 | 1771 | 646 | 325 | 792 | 756 | 1771 | 671 | 1492 |
Table 2.
Cytokines, cytokine receptors and chemokines.
| Sample 1 (female donor) | Sample 2 (male donor) | |||||||||||||
| Genes | 0 | 4h | 24h | 4h+ | 24h+ | 4h++ | 24h++ | 0 | 4h | 24h | 4h+ | 24h+ | 4h++ | 24h++ |
| IL-2 | 0.3 | 0 | 1 | 82 | 1480 | 201 | 1566 | 0.5 | 0.3 | 0.2 | 49 | 1707 | 46 | 1702 |
| IL2RA | 1 | 3 | 9 | 1042 | 454 | 1149 | 608 | 0.3 | 3 | 5 | 972 | 309 | 1117 | 382 |
| IL2RB | 165 | 154 | 432 | 388 | 547 | 330 | 610 | 168 | 195 | 466 | 365 | 509 | 370 | 542 |
| IL2RG | 362 | 1268 | 1484 | 793 | 1769 | 686 | 1623 | 335 | 951 | 1261 | 946 | 1486 | 894 | 1436 |
| IL-3 | 0 | 0 | 0.3 | 33 | 79 | 21 | 66 | 0 | 0 | 0 | 70 | 334 | 47 | 256 |
| IL-4 | 0 | 0 | 0 | 2 | 15 | 1 | 14 | 0.1 | 0.2 | 0 | 6 | 23 | 3 | 23 |
| IL-5 | 0 | 0 | 0 | 6 | 5 | 4 | 4 | 0 | 0 | 0 | 11 | 11 | 11 | 8 |
| IL-10 | 0.5 | 2 | 2 | 10 | 13 | 10 | 13 | 0.2 | 1 | 1 | 8 | 23 | 10 | 17 |
| IL-13 | 0.9 | 0 | 0.1 | 20 | 42 | 7 | 38 | 0.6 | 0.1 | 0.3 | 37 | 52 | 12 | 55 |
| IL-17F | 0.1 | 6 | 0 | 199 | 4 | 1145 | 11 | 0.2 | 2 | 2 | 439 | 103 | 1143 | 151 |
| TNF-a | 49 | 10 | 46 | 282 | 1044 | 406 | 1364 | 22 | 10 | 22 | 320 | 1578 | 430 | 1581 |
| LTA | 25 | 42 | 33 | 2709 | 374 | 1827 | 452 | 20 | 26 | 22 | 2167 | 212 | 1741 | 232 |
| TNFSF14 | 3 | 28 | 24 | 116 | 553 | 79 | 494 | 2 | 26 | 20 | 139 | 334 | 85 | 277 |
| IFN-g | 6 | 44 | 6 | 2139 | 5477 | 47367 | 17308 | 12 | 12 | 2 | 1209 | 7516 | 30517 | 12639 |
| LIF | 0 | 0.2 | 0.1 | 143 | 26 | 455 | 29 | 0 | 0 | 0.1 | 79 | 17 | 230 | 18 |
| IL-1a | 0 | 10 | 62 | 1 | 58 | 0.5 | 45 | 0 | 5 | 34 | 0.6 | 7 | 0.3 | 5 |
| IL-1b | 3 | 331 | 749 | 7 | 746 | 8 | 609 | 0.3 | 159 | 379 | 1 | 87 | 0.8 | 74 |
| IL-6 | 0.3 | 23 | 152 | 3 | 148 | 10 | 115 | 0.1 | 9 | 82 | 2 | 17 | 9 | 16 |
| IL-8 | 3 | 355 | 670 | 10 | 714 | 9 | 575 | 0.3 | 182 | 290 | 2 | 82 | 2 | 65 |
| CCL3 | 4 | 124 | 516 | 1736 | 1809 | 2935 | 2561 | 4 | 72 | 271 | 2895 | 2202 | 4283 | 2504 |
| CCL3L1 | 3 | 49 | 207 | 525 | 1145 | 724 | 1840 | 3 | 32 | 118 | 774 | 1300 | 1087 | 1726 |
| CCL4 | 19 | 100 | 620 | 3220 | 8314 | 3646 | 9560 | 43 | 119 | 373 | 5487 | 12002 | 5984 | 10922 |
| CCL4L1 | 0.3 | 12 | 184 | 692 | 2779 | 701 | 3188 | 2 | 21 | 162 | 1684 | 6786 | 1746 | 6209 |
| CCL20 | 2 | 18 | 120 | 143 | 2163 | 158 | 3031 | 0.4 | 9 | 48 | 83 | 960 | 82 | 1105 |
Table 3.
TNF-receptor family members.
| Sample 1 (female donor) | Sample 2 (male donor) | |||||||||||||
| Genes | 0 | 4h | 24h | 4h+ | 24h+ | 4h++ | 24h++ | 0 | 4h | 24h | 4h+ | 24h+ | 4h++ | 24h++ |
|
TNFRSF4 OX40 |
2 | 2 | 5 | 150 | 63 | 109 | 72 | 1 | 0.7 | 6 | 171 | 52 | 100 | 58 |
|
TNFRSF18 GITR |
4 | 9 | 15 | 127 | 95 | 115 | 131 | 1 | 3 | 10 | 123 | 42 | 88 | 59 |
Table 4.
Micro-RNA and transcription factors.
| Sample 1 (female donor) | Sample 2 (male donor) | |||||||||||||
| Genes | 0 | 4h | 24h | 4h+ | 24h+ | 4h++ | 24h++ | 0 | 4h | 24h | 4h+ | 24h+ | 4h++ | 24h++ |
| MIR155HG | 2 | 7 | 24 | 625 | 833 | 597 | 880 | 1 | 6 | 13 | 649 | 771 | 796 | 759 |
| TBX21 | 54 | 25 | 23 | 155 | 240 | 206 | 231 | 79 | 51 | 44 | 135 | 121 | 215 | 116 |
| ZBED2 | 0 | 0.3 | 0.8 | 382 | 77 | 335 | 63 | 0 | 0.2 | 0.8 | 399 | 90 | 352 | 72 |
Table 5.
House-keeping genes and the most highly expressed gene in unstimulated cells, the beta-2-microglobulin.
Table 5.
House-keeping genes and the most highly expressed gene in unstimulated cells, the beta-2-microglobulin.
| Sample 1 (female donor) | Sample 2 (male donor) | |||||||||||||
| Genes | 0 | 4h | 24h | 4h+ | 24h+ | 4h++ | 24h++ | 0 | 4h | 24h | 4h+ | 24h+ | 4h++ | 24h++ |
| ACTB | 2401 | 3356 | 1950 | 9080 | 3493 | 7386 | 3557 | 2437 | 3577 | 2066 | 9855 | 3268 | 8597 | 3553 |
| GAPDH | 776 | 726 | 849 | 6806 | 1793 | 6284 | 1520 | 997 | 1355 | 1141 | 6214 | 1674 | 6341 | 1455 |
| RPL10 | 1823 | 1224 | 1499 | 850 | 1141 | 808 | 1164 | 2310 | 1592 | 1793 | 1025 | 1349 | 1003 | 1437 |
| RPL15 | 1314 | 971 | 1008 | 1024 | 877 | 927 | 899 | 1495 | 1156 | 1071 | 1058 | 937 | 1026 | 947 |
| B2M | 17666 | 23446 | 16733 | 16757 | 20824 | 15869 | 19112 | 17382 | 25027 | 15980 | 18800 | 18743 | 17546 | 17220 |
Table 6.
Solute carriers.
| Sample 1 (female donor) | Sample 2 (male donor) | |||||||||||||
| Genes | 0 | 4h | 24h | 4h+ | 24h+ | 4h++ | 24h++ | 0 | 4h | 24h | 4h+ | 24h+ | 4h++ | 24h++ |
| SLC1A5 | 6 | 20 | 22 | 409 | 323 | 422 | 316 | 6 | 18 | 15 | 464 | 246 | 430 | 227 |
| SLC16A1 | 11 | 14 | 18 | 65 | 103 | 68 | 98 | 11 | 12 | 13 | 56 | 68 | 55 | 58 |
| SLC25A5 | 202 | 141 | 172 | 675 | 299 | 640 | 274 | 224 | 162 | 164 | 613 | 265 | 553 | 227 |
| SLC25A10 | 3 | 6 | 3 | 50 | 4 | 41 | 4 | 3 | 5 | 3 | 43 | 3 | 33 | 4 |
| SLC29A1 | 1 | 6 | 2 | 143 | 69 | 135 | 65 | 0.6 | 7 | 1 | 118 | 39 | 106 | 33 |
Disclaimer/Publisher’s Note: The statements, opinions and data contained in all publications are solely those of the individual author(s) and contributor(s) and not of MDPI and/or the editor(s). MDPI and/or the editor(s) disclaim responsibility for any injury to people or property resulting from any ideas, methods, instructions or products referred to in the content. |
© 2025 by the authors. Licensee MDPI, Basel, Switzerland. This article is an open access article distributed under the terms and conditions of the Creative Commons Attribution (CC BY) license (http://creativecommons.org/licenses/by/4.0/).
Copyright: This open access article is published under a Creative Commons CC BY 4.0 license, which permit the free download, distribution, and reuse, provided that the author and preprint are cited in any reuse.


