Preprint
Article

This version is not peer-reviewed.

Deep Learning–Derived Quantitative HRCT Parameters at Initial Examination Predict Adverse Outcomes and Reinfection in COVID-19 Pneumonia

A peer-reviewed article of this preprint also exists.

Submitted:

23 October 2025

Posted:

23 October 2025

You are already at the latest version

Abstract

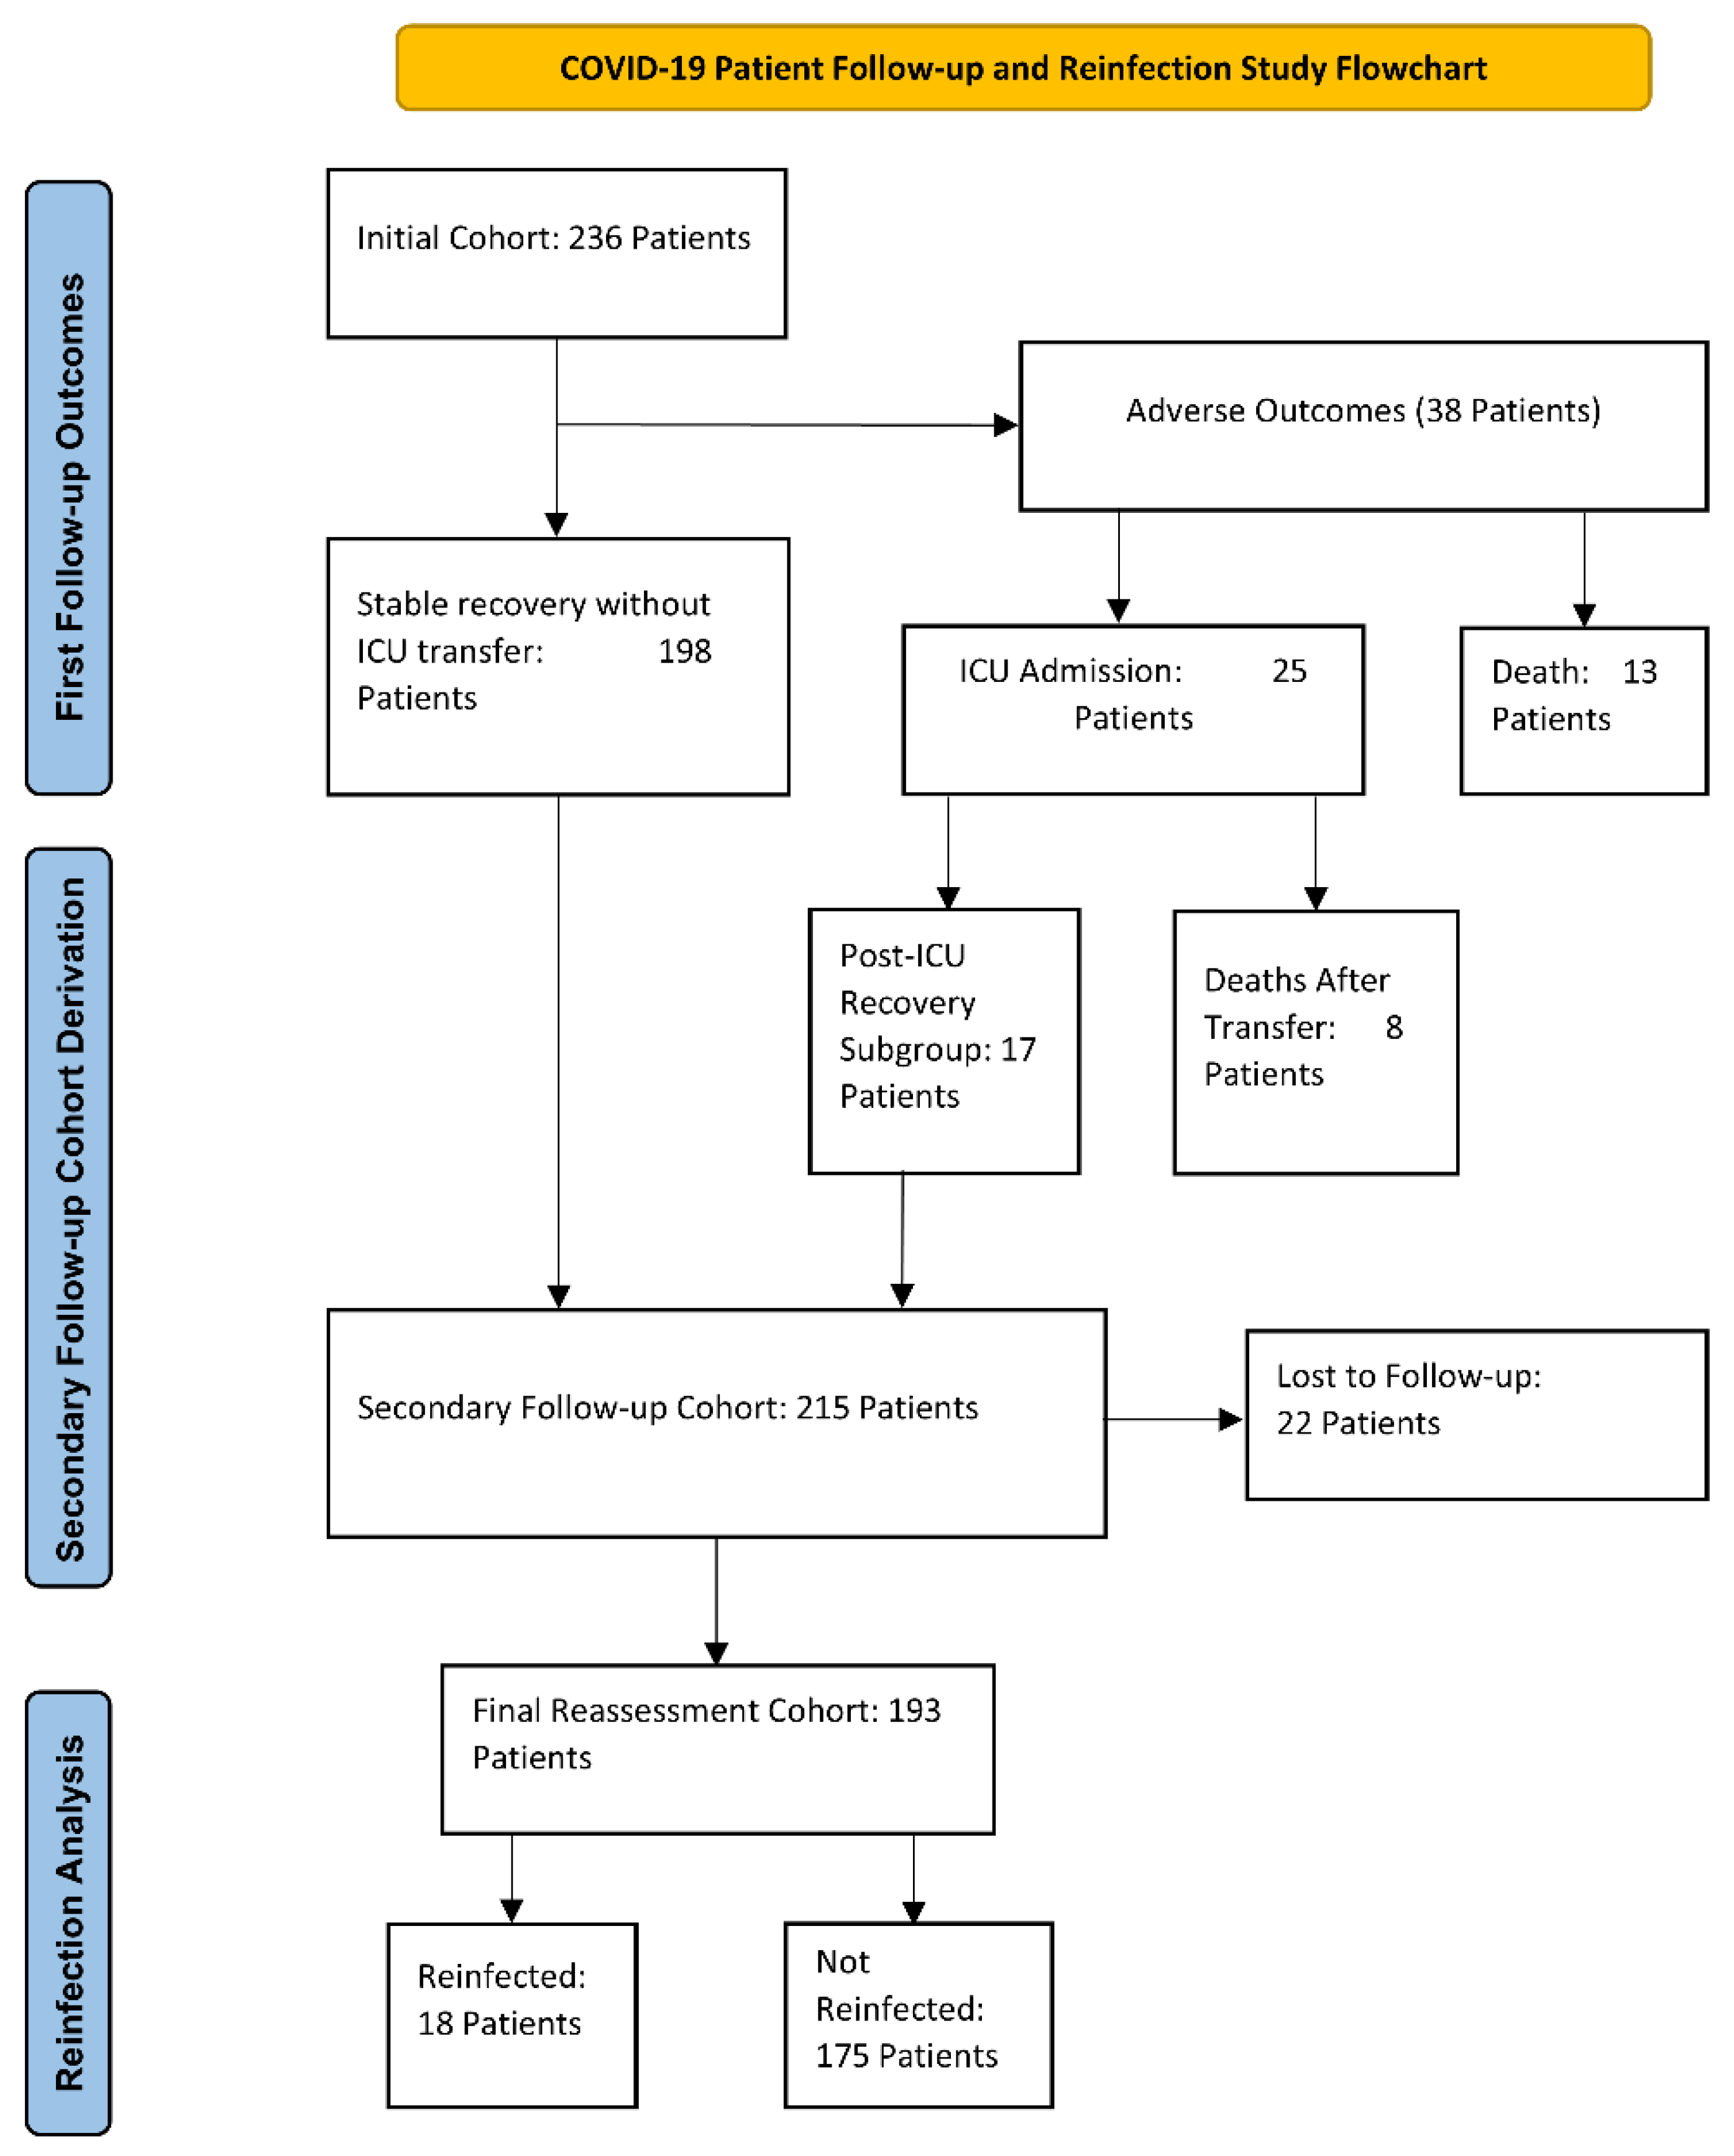
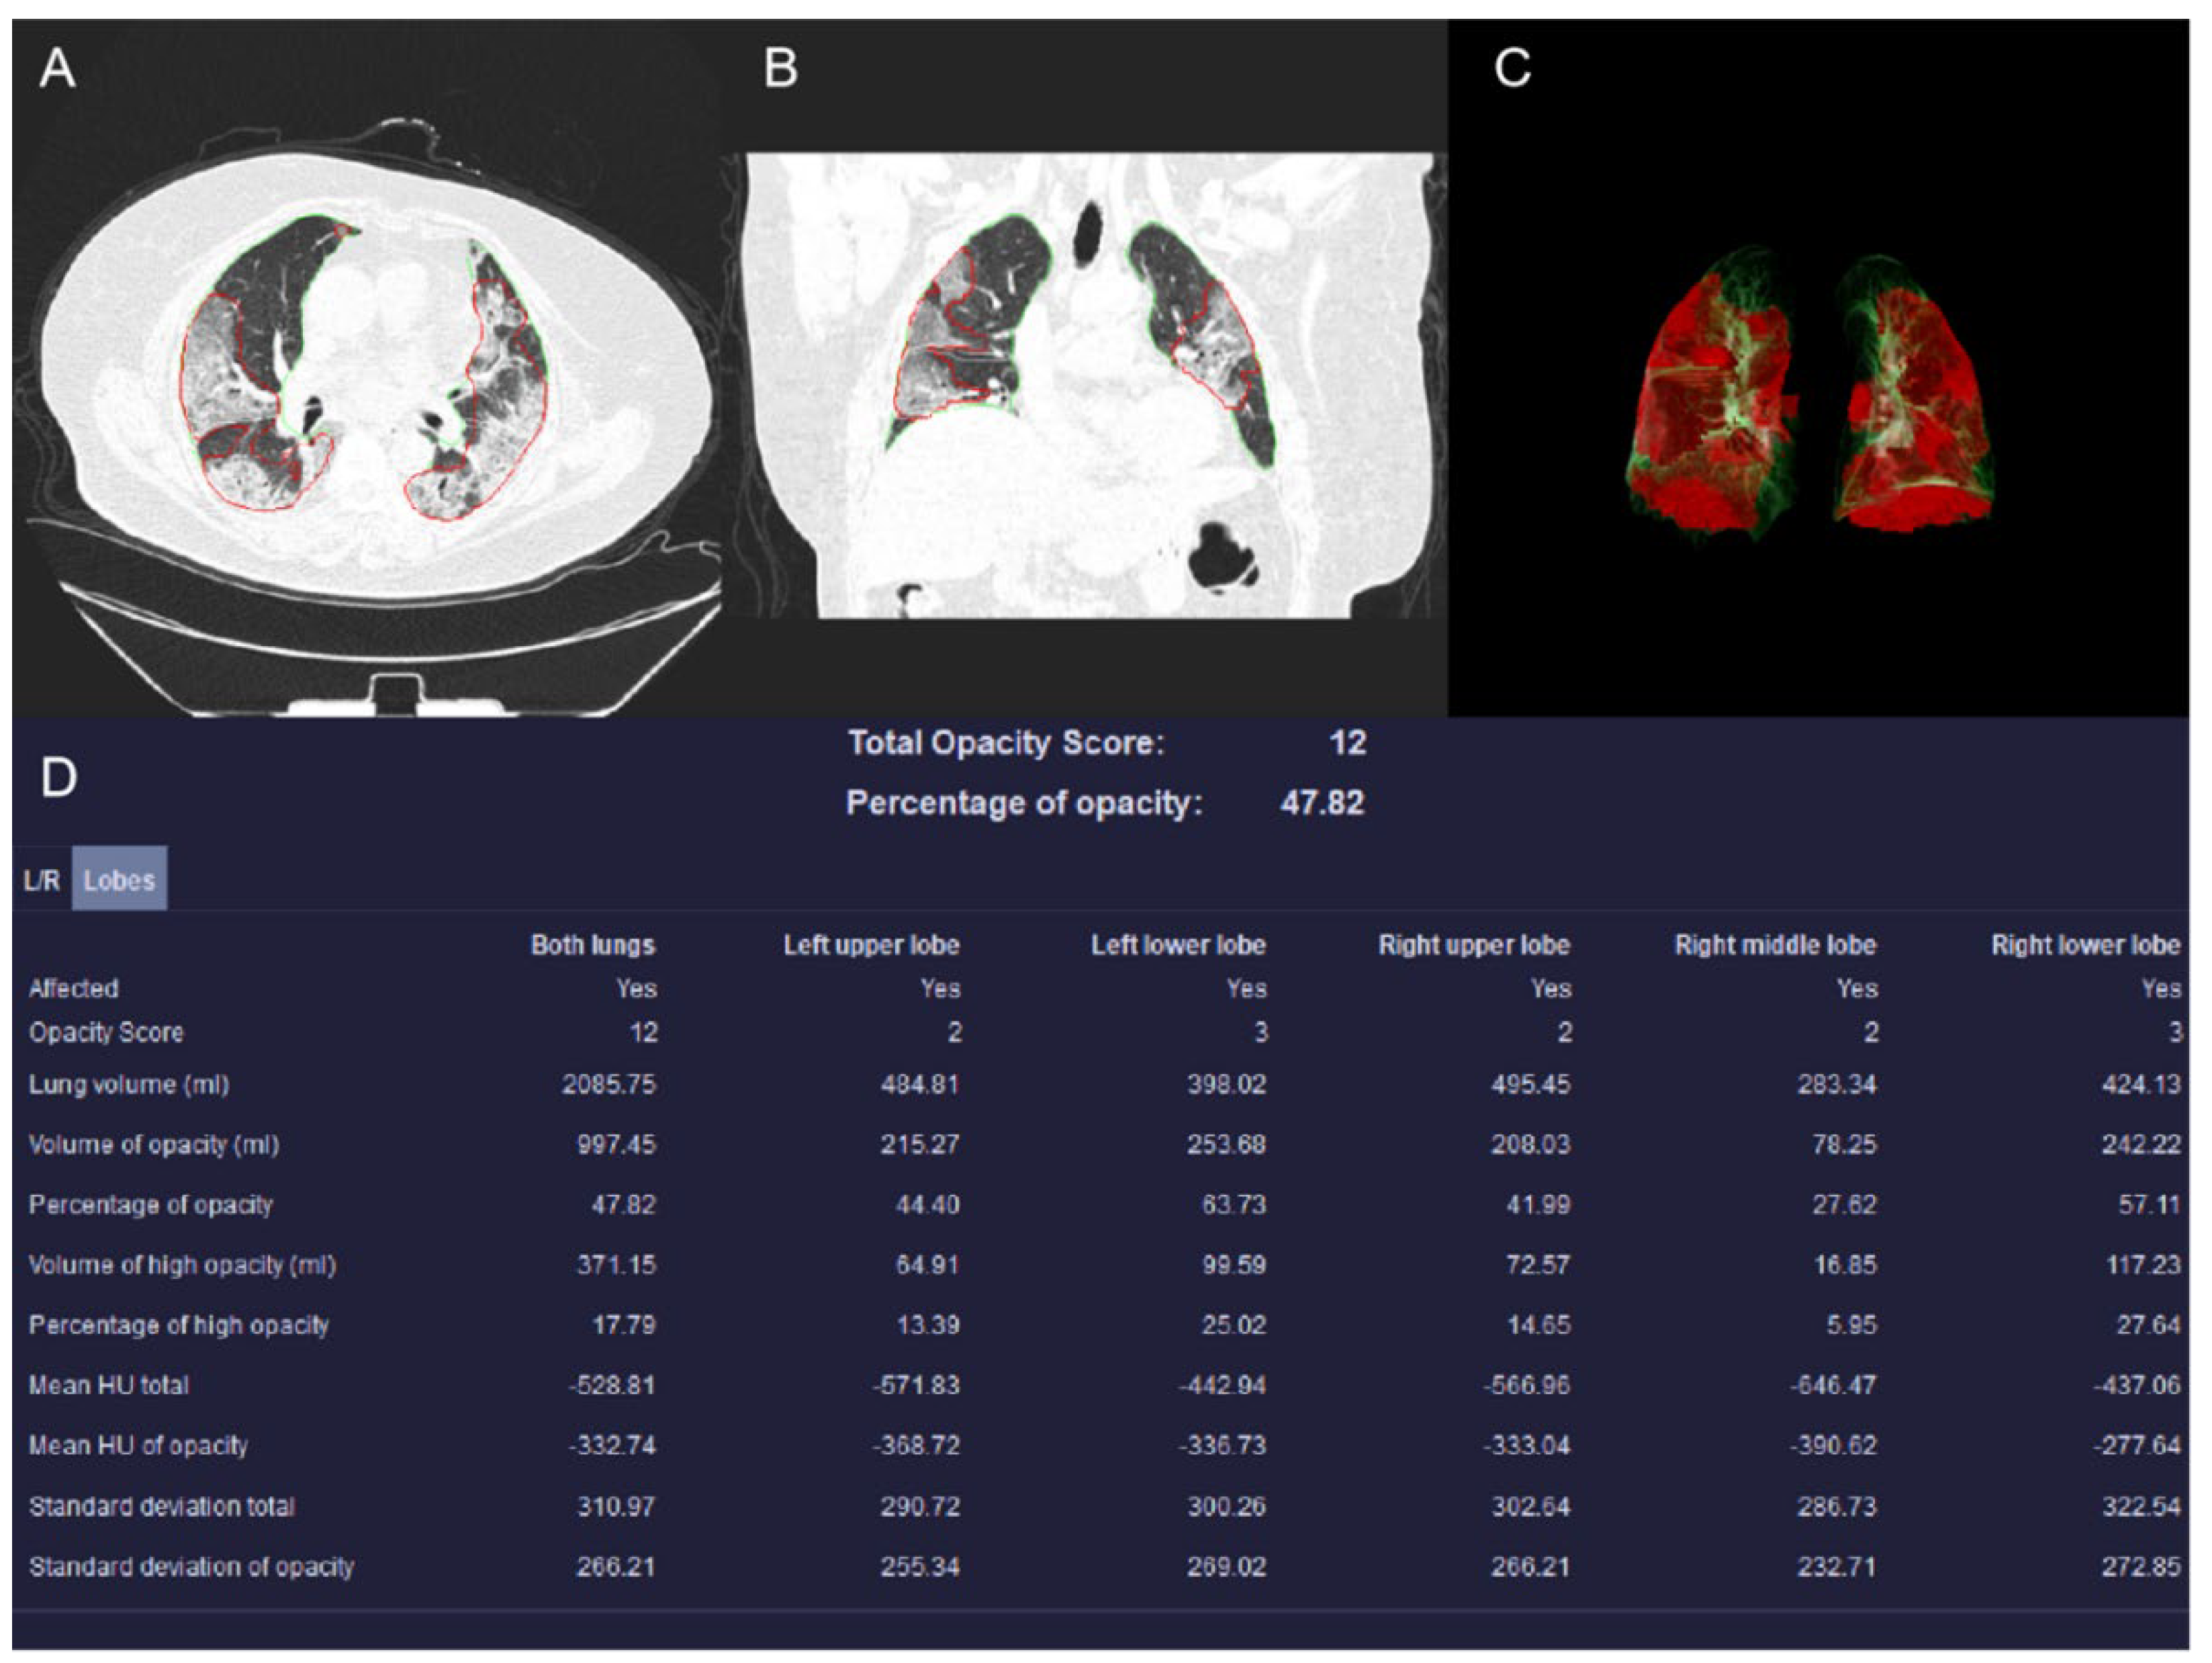
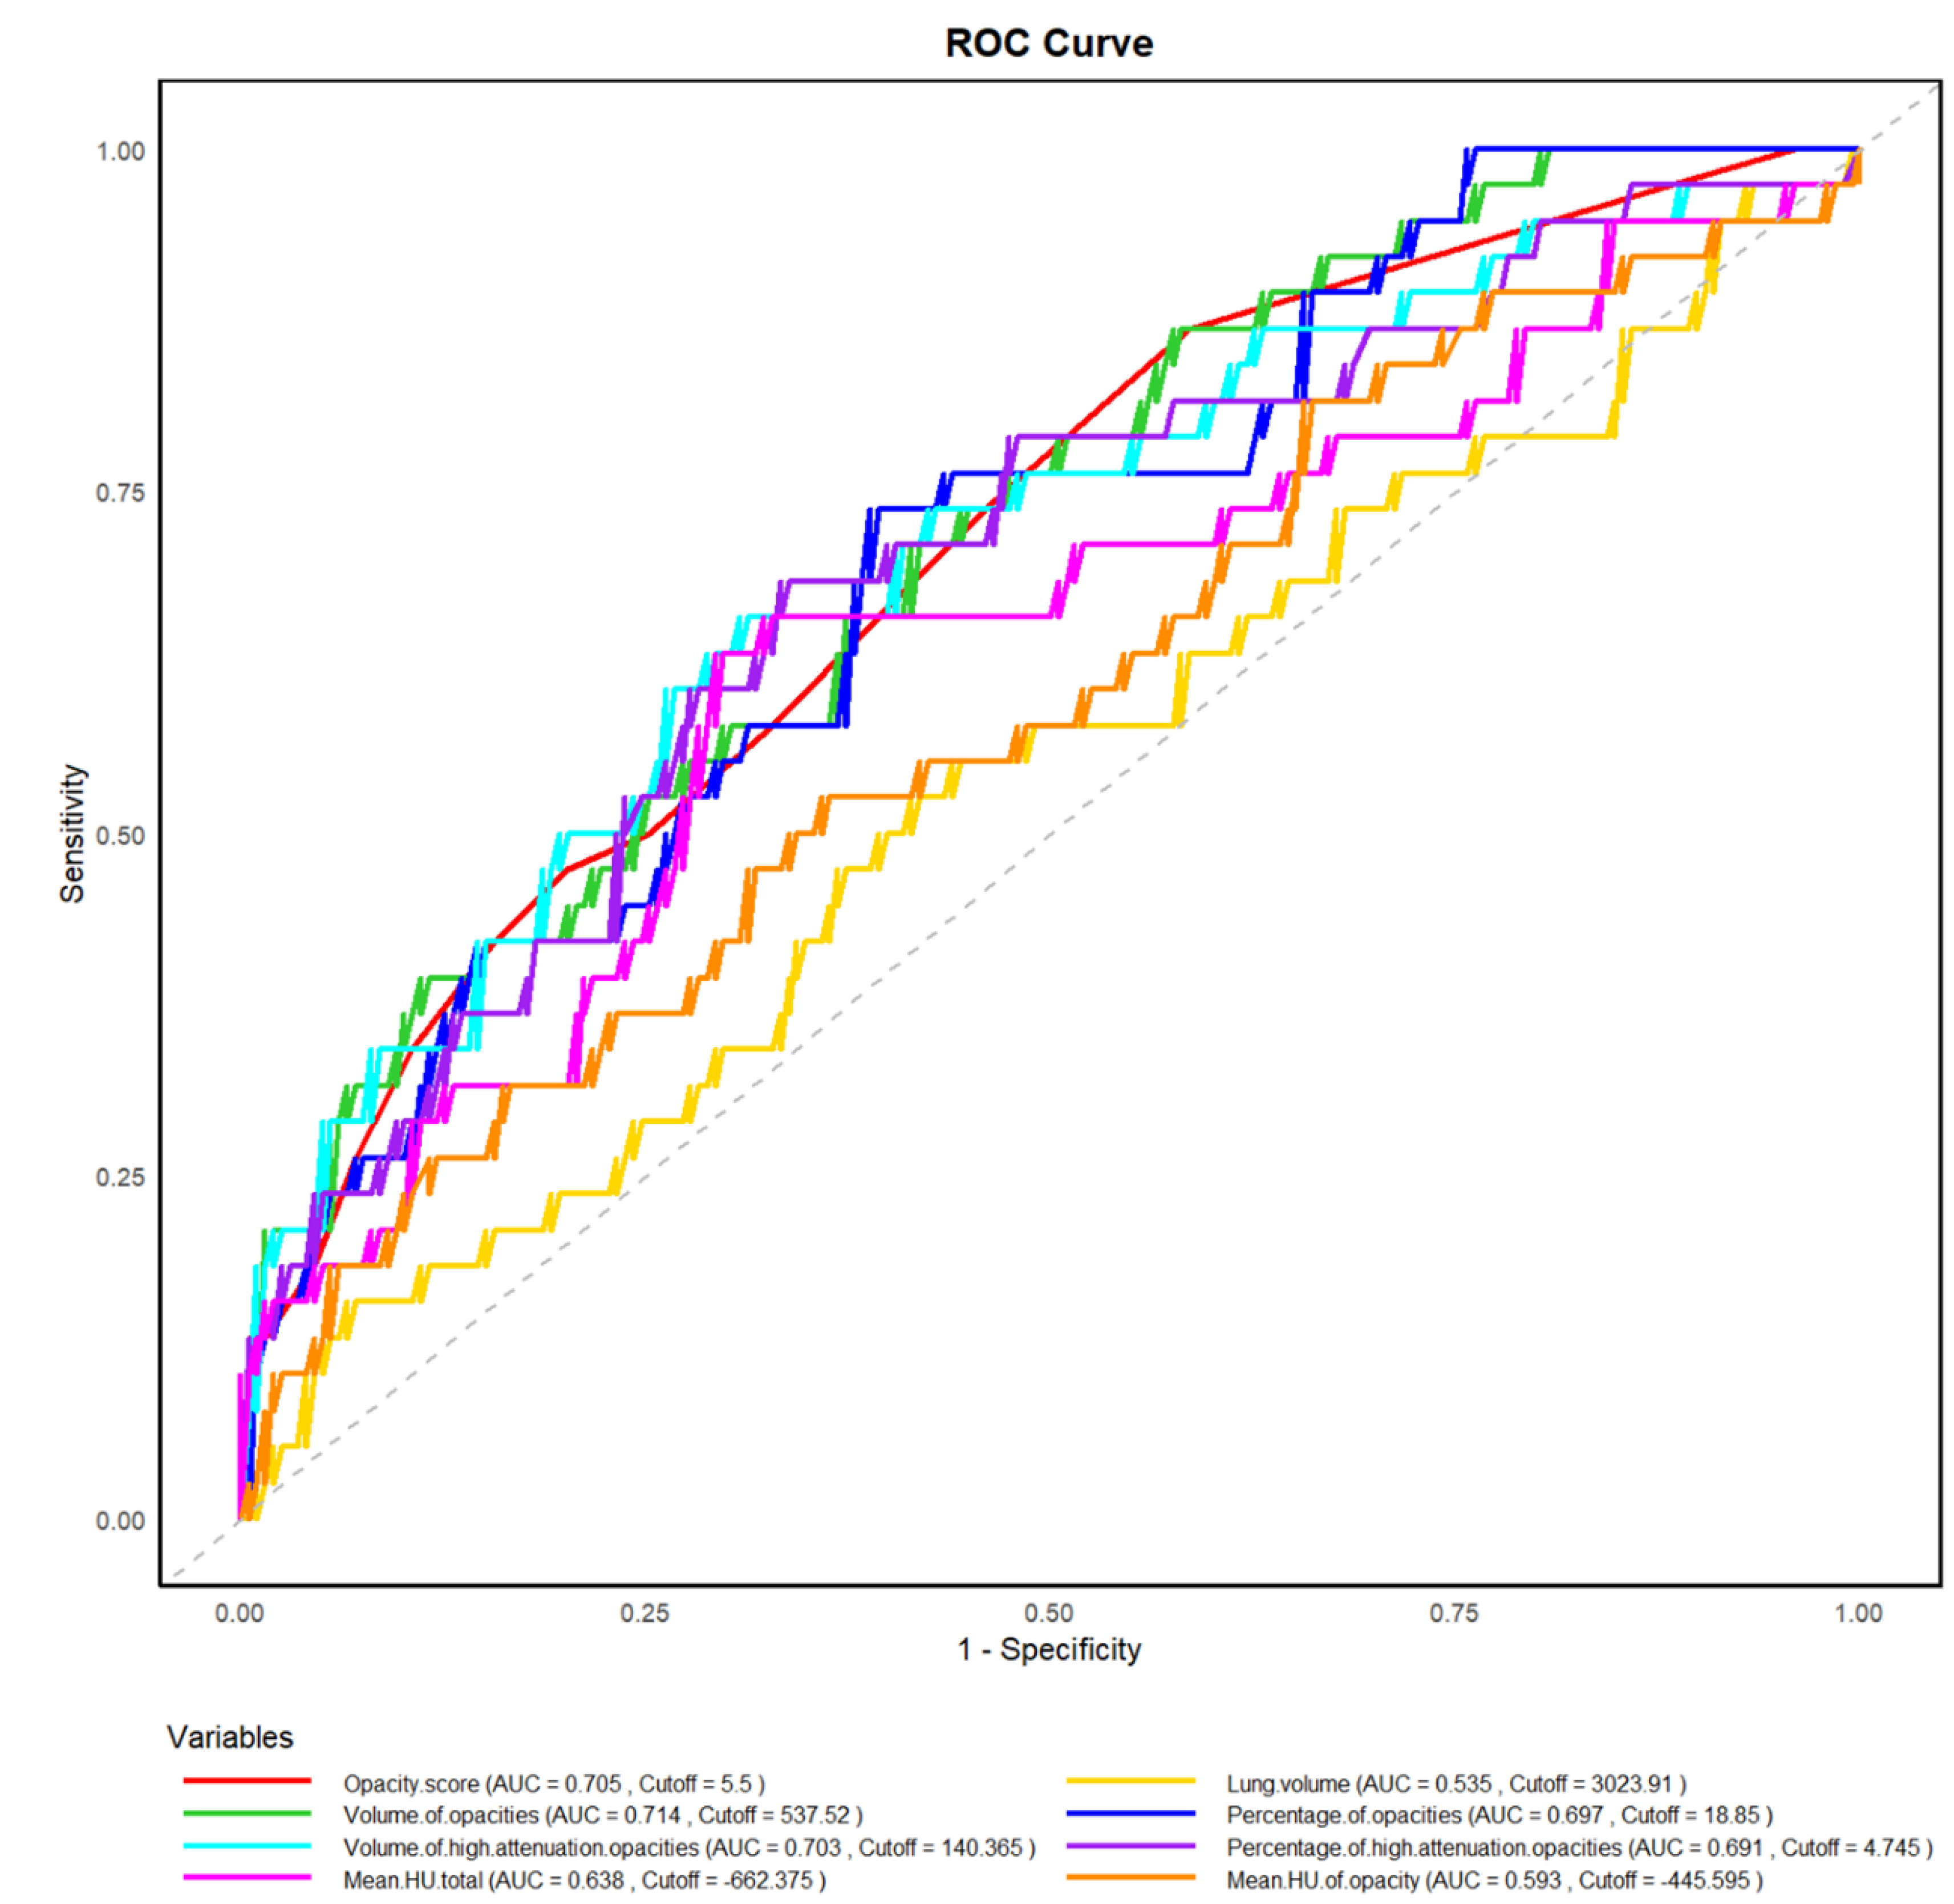
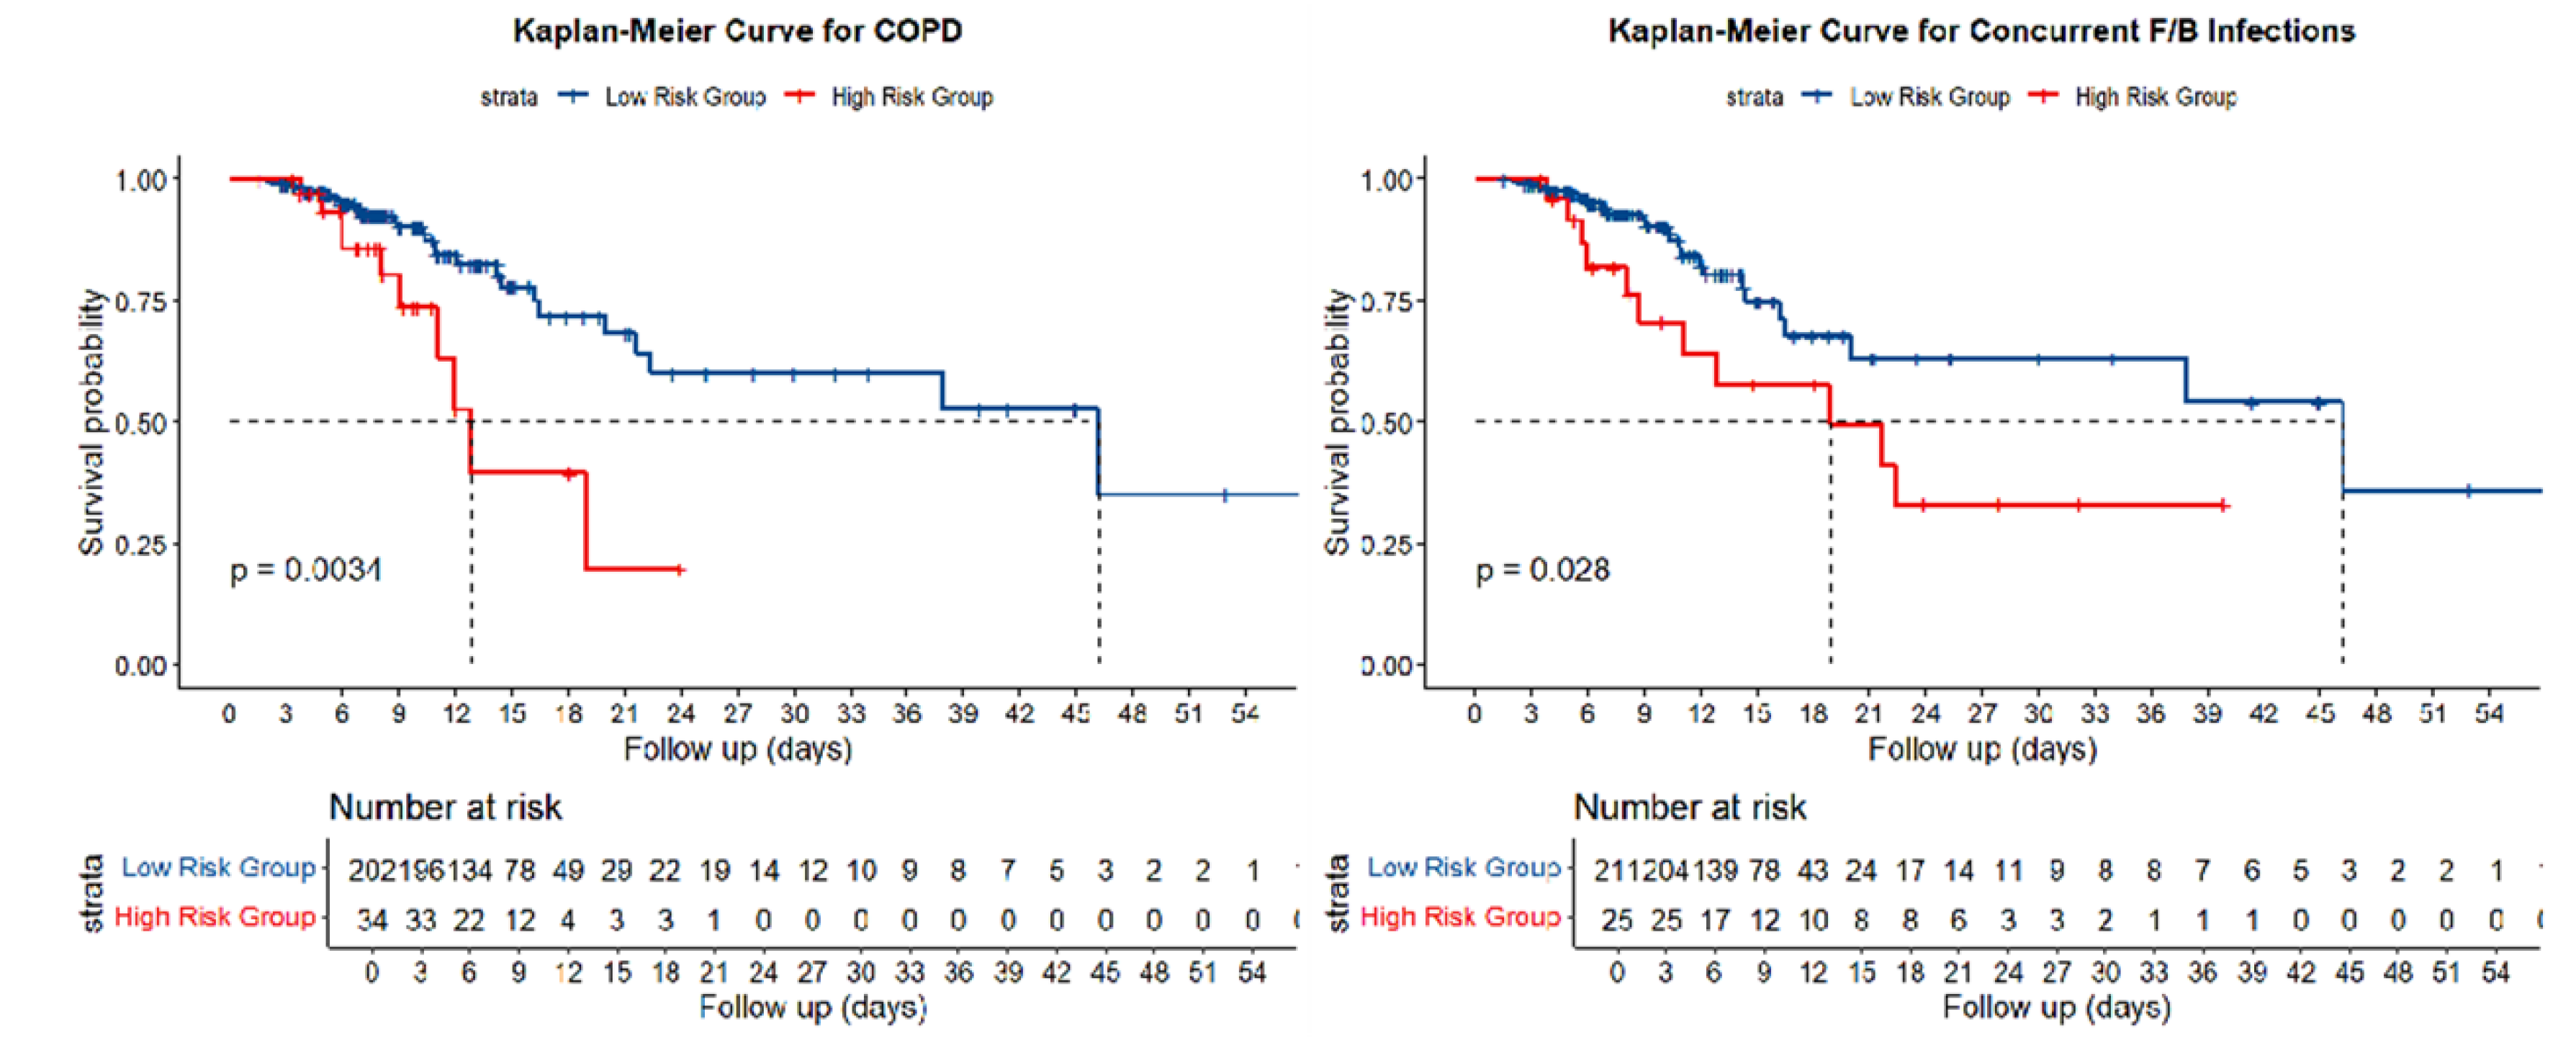
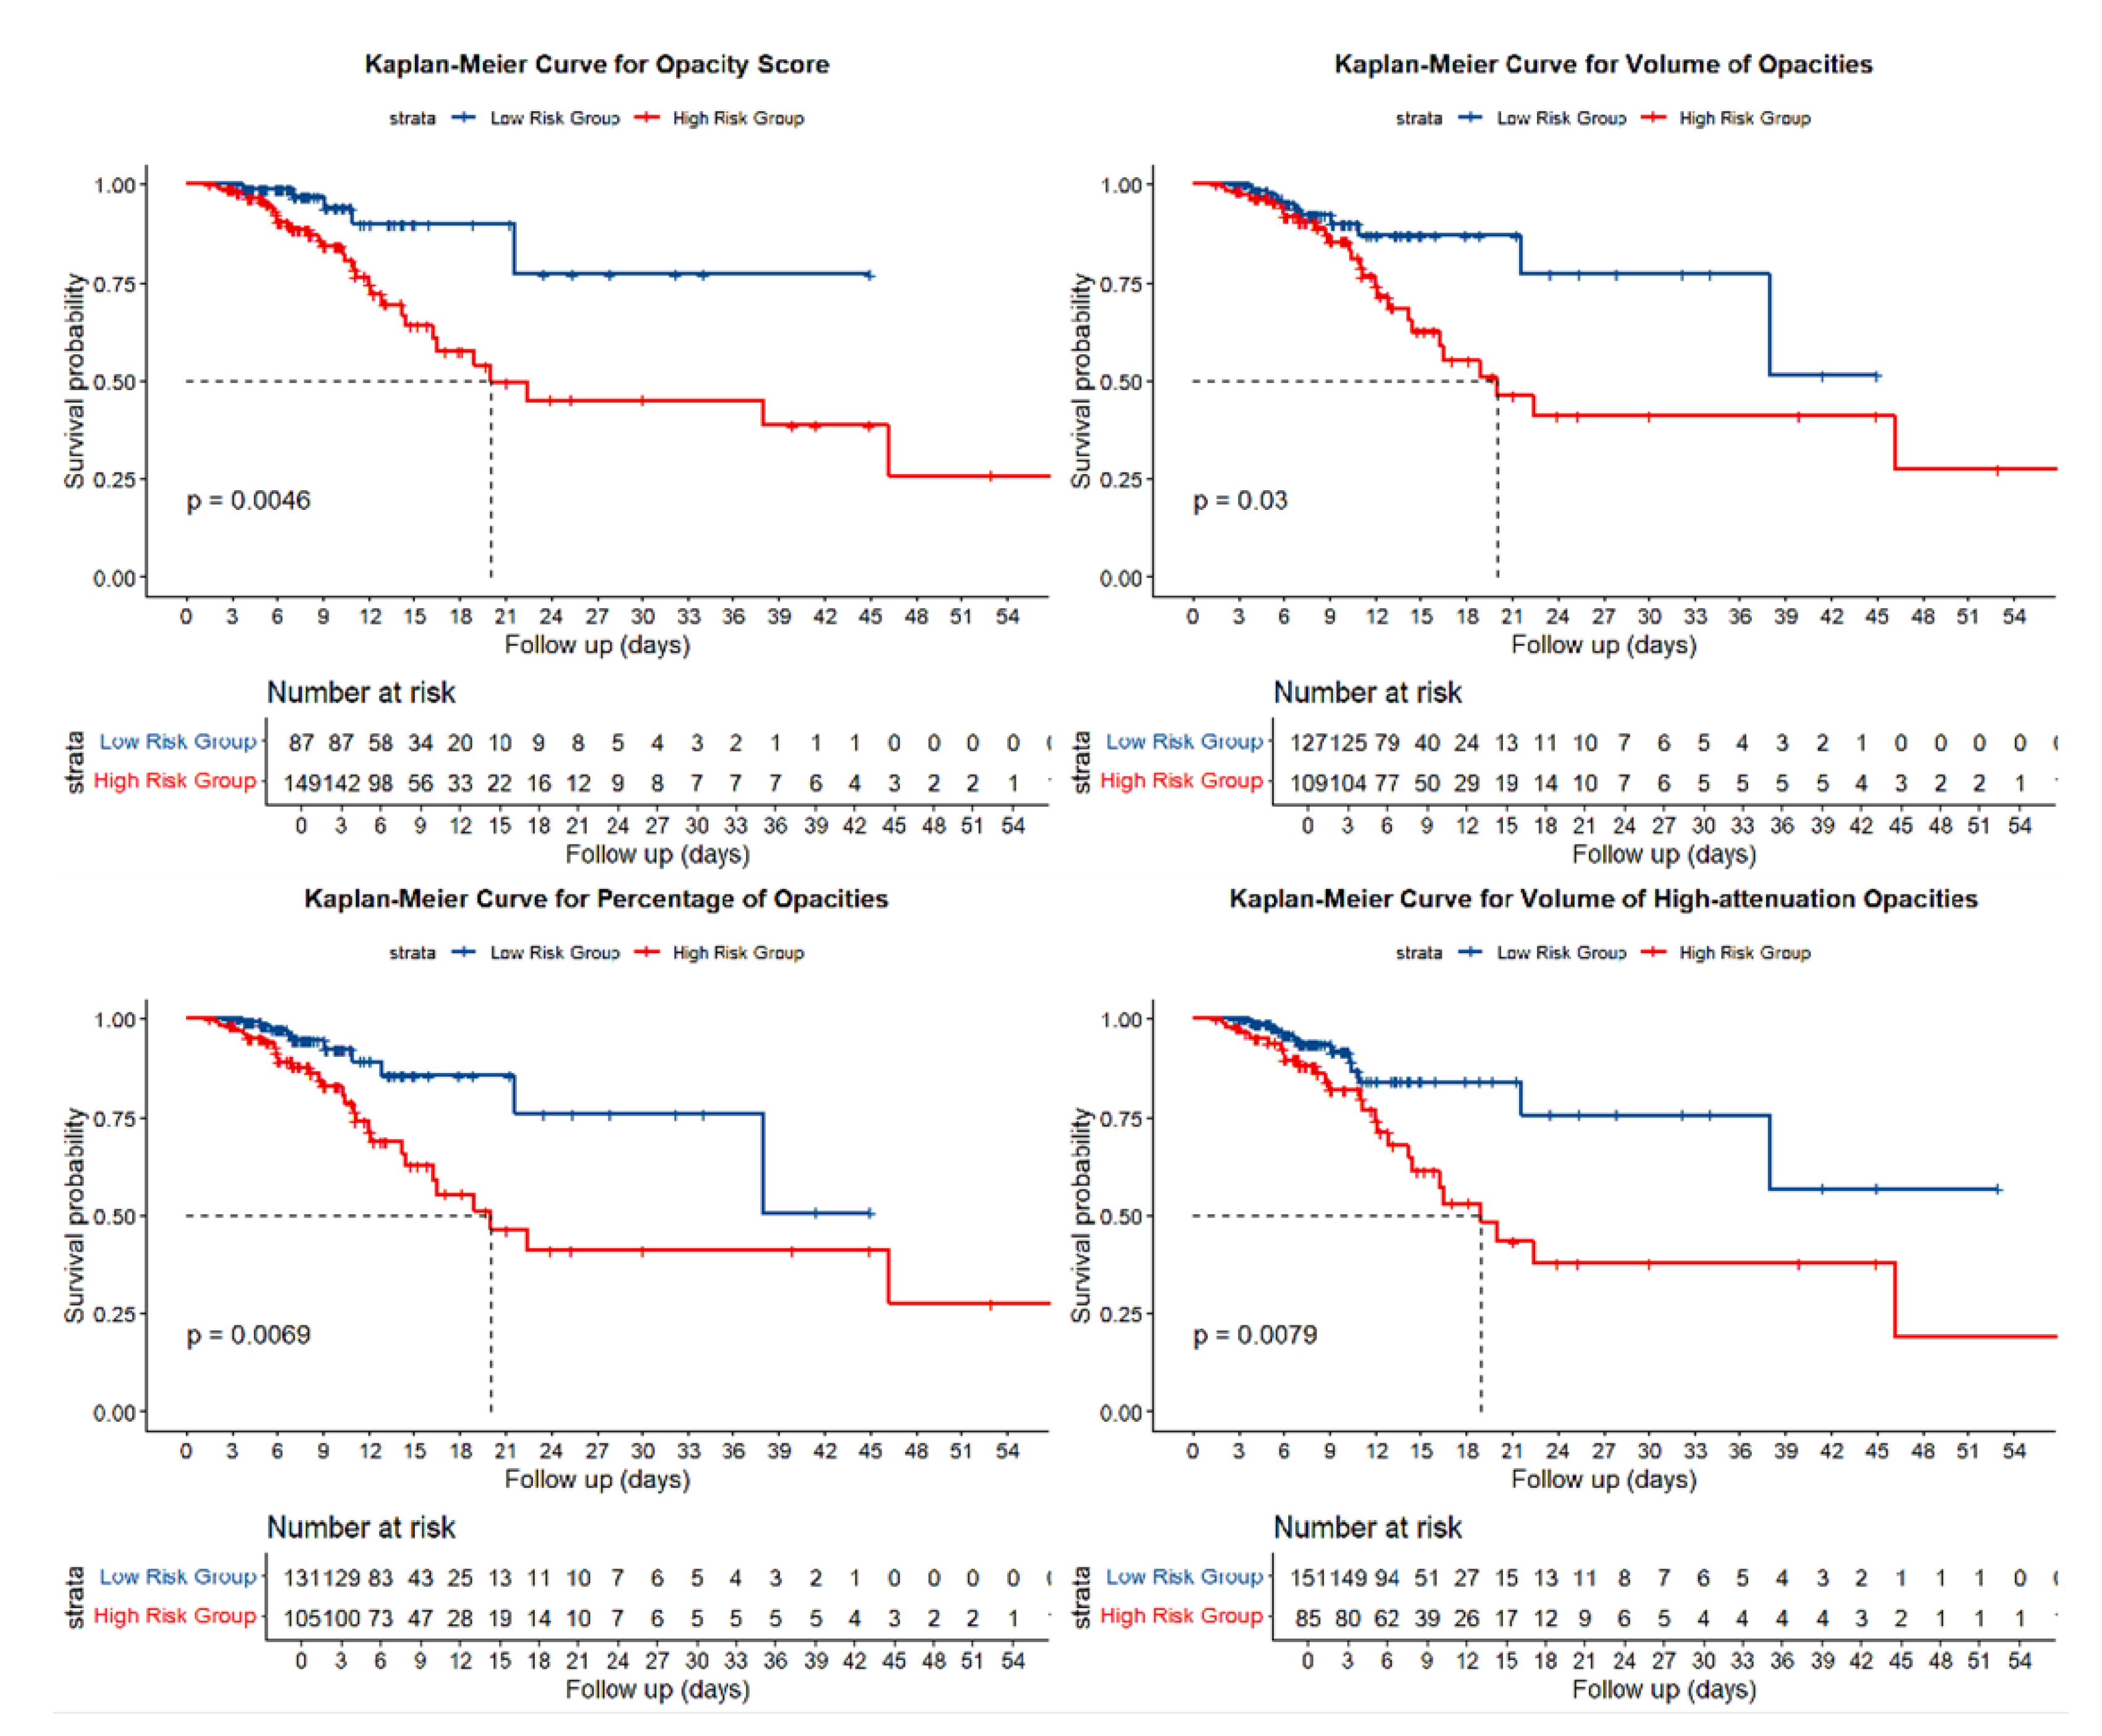
Objective: To determine whether deep-learning–derived quantitative HRCT parameters, combined with clinical characteristics, can predict in-hospital adverse outcomes and long-term reinfection in patients with COVID-19 pneumonia. Methods: We retrospectively analyzed 236 RT-PCR–confirmed patients who underwent HRCT between November 2022 and January 2023 at the Affiliated Hospital of North Sichuan Medical College. Pulmonary inflammatory regions were automatically segmented, and quantitative metrics—including opacity score, lesion volume and percentage, high-attenuation lesion volume and percentage, and mean total-lung attenuation—were extracted using an artificial-intelligence pneumonia analysis prototype (Siemens Healthineers, Erlangen, Germany). Optimal thresholds derived from receiver-operating-characteristic curves for the composite endpoint of intensive-care-unit admission or all-cause death were applied to stratify patients. Cox proportional-hazards models were used to identify independent predictors of adverse outcomes and subsequent SARS-CoV-2 reinfection. Results: Adverse outcomes occurred in 16.1% of patients. Higher opacity scores, larger lesion burdens, greater proportions of high-attenuation opacities, and higher mean lung attenuation were all associated with poorer outcomes (all P < 0.05). After adjusting for age and chronic obstructive pulmonary disease, an opacity score ≥ 5.5 (HR = 3.02), lesion percentage ≥ 18.85% (HR = 2.33), and mean attenuation ≥ −662.4 HU (HR = 2.20) remained independent predictors. During a median follow-up of 603 days, opacity score ≥ 5.5 (HR = 5.32), high-attenuation volume ≥ 140.37 ml (HR = 3.81), and high-attenuation percentage ≥ 4.94% (HR = 3.39) independently predicted reinfection (all P ≤ 0.027). Conclusions: Deep-learning–based quantitative HRCT metrics provide incremental prognostic information for risk stratification of both acute adverse outcomes and long-term reinfection among COVID-19 patient.

Keywords: 
;  ;  ;  ;  ;  

1. Introduction

Coronavirus disease 2019 (COVID-19), caused by Severe Acute Respiratory Syndrome Coronavirus 2 (SARS-CoV-2), remains a major global health concern despite advances in vaccination and antiviral therapy. As of February 2025, more than 777 million cases and 7 million deaths have been reported worldwide [1]. The virus’s high mutation rate has led to continuous emergence of variants with distinct transmissibility and pathogenicity. In particular, the evolution from the Delta (B.1.617.2) to Omicron (B.1.1.529) variant and its sublineages (e.g., XBB, BA.2.86, JN.1) has produced strains with enhanced immune evasion, reduced vaccine protection, and increased reinfection risk [2,3,4]. Consequently, accurately identifying patients who are likely to experience severe outcomes or reinfection remains a pressing clinical challenge.
Reverse-transcription polymerase chain reaction (RT-PCR) is the diagnostic gold standard for SARS-CoV-2 infection, but its accuracy depends heavily on specimen quality and assay performance. During the early pandemic, the RT-PCR positivity rate for throat swabs was approximately 58%, whereas high-resolution computed tomography (HRCT) demonstrated an 88% detection rate and could reveal radiologic improvement even before RT-PCR conversion to negative [5]. These findings underscore HRCT’s critical role in early detection and disease monitoring.
Beyond diagnosis, HRCT provides insight into the extent and severity of pulmonary involvement and may serve as a surrogate of inflammatory burden. Traditional semiquantitative scoring, however, depends on radiologist experience, is time-consuming, and lacks reproducibility during large-scale outbreaks. Deep learning (DL)–based CT analysis has revolutionized this process by enabling automated lesion segmentation and quantification with high efficiency and consistency. For instance, Li et al. reported an average processing time of only 4.5 s per case [6]. Quantitative CT metrics derived from DL algorithms—such as opacity score, lesion volume, and high-attenuation burden—can objectively stratify disease severity, predict short-term outcomes, and facilitate longitudinal assessment of lesion dynamics [7,8].
Meanwhile, as the virus continues to circulate, reinfection has become increasingly prevalent. Although prior infection provides partial immunity [9,10], novel variants with immune escape and intermittent viral shedding contribute to recurrent infections [11]. Reinfection may present with different clinical courses and, particularly among patients with comorbidities or immune dysfunction, can lead to aggravated pulmonary injury, worse outcomes, and long-term sequelae [12,13]. However, the radiologic predictors of reinfection and their relationship with initial disease severity remain poorly understood.
Given these gaps, this study aimed to evaluate deep-learning–derived quantitative HRCT parameters and clinical characteristics in hospitalized patients with COVID-19 pneumonia, to identify independent predictors of adverse in-hospital outcomes, and to explore their potential value in forecasting long-term reinfection risk.

2. Materials and Methods

2.1. Patient Characteristics

This retrospective study was approved by the institutional ethics committee of the Affiliated Hospital of North Sichuan Medical College (approval No. 2020ER007-1), and the requirement for written informed consent was waived owing to its retrospective design. Consecutive patients with reverse-transcription polymerase chain reaction (RT-PCR)–confirmed SARS-CoV-2 infection who underwent high-resolution computed tomography (HRCT) between November 1, 2022, and January 31, 2023, were retrospectively screened. After applying the inclusion and exclusion criteria, 236 patients were enrolled. Inclusion criteria comprised were: (1) age ≥ 18 years; (2) SARS-CoV-2 infection confirmed by RT-PCR using pharyngeal swab samples; and (3) availability of diagnostic-quality HRCT imaging. The Exclusion criteria were: (1) history of significant underlying lung diseases that could confound CT findings (e.g., lung cancer, tuberculosis, and pneumoconiosis); (2) history of extrapulmonary malignancies or systemic wasting conditions (e.g., cachexia or end-stage disease); (3) poor image quality; (4) contrast-enhanced chest CT, as the prototype, trained for non-contrast CT evaluation, was not recommended for post-contrast CT; and (5) absence of CT findings of pneumonia.

2.2. Follow-Up

For each patient, HRCT imaging and clinical data were collected, together with documentation of any concomitant fungal or bacterial pulmonary infection during hospitalization. Peak laboratory values at admission, including white blood cell count (WBC), lymphocyte percentage (LYM%), interleukin-6 (IL-6), D-dimer, C-reactive protein (CRP), and erythrocyte sedimentation rate (ESR), were also recorded.
Adverse outcomes during hospitalization were defined as transfer to the intensive care unit (ICU) or all-cause mortality. In this study, SARS-CoV-2 reinfection was defined as a second laboratory-confirmed episode of COVID-19 occurring ≥90 days after the initial infection [14,15], accompanied by new or characteristic pulmonary findings on chest CT, such as ground-glass opacities (GGOs) or consolidations.
Follow-up data were obtained through a comprehensive review of serial electronic hospital records, including readmission logs and clinically indicated CT imaging reports. The observation period for adverse outcomes (ICU admission or all-cause mortality) began on the date of initial COVID-19 diagnosis and continued until the occurrence of an event or the last documented clinical encounter. For reinfection analysis, the follow-up period extended from hospital discharge (or, for non-hospitalized patients, the date of the last documented clinical or radiological assessment) until the earliest of the following: (1) laboratory-confirmed SARS-CoV-2 reinfection by RT-PCR; (2) new CT evidence of pneumonia with confirmed reinfection; or (3) study termination (September 17, 2024). The flow chart of the study population selection process is presented in Figure 1.

2.3. CT Examinations and Imaging Evaluation

All patients underwent chest HRCT on one of three scanners: Siemens SOMATOM Force, GE LightSpeed VCT, or Philips Brilliance. P Scans were performed with patients in the supine position during full inspiration, extending from the lung apices to the level of the adrenal glands. Raw data were reconstructed into thin-section images with a slice thickness and interval of 1.0–1.2 mm and transferred to a dedicated post-processing workstation for quantitative analysis.
Image processing was conducted using a deep learning-based pneumonia analysis prototype (Siemens Healthineers, Erlangen, Germany). To ensure accuracy, the initial segmentation results were manually reviewed and corrected by two radiologists with 13 and 4 years of CT diagnostic experience, respectively. The model is an offline, standalone software that, although not yet clinically approved by the U.S. Food and Drug Administration (FDA), has been validated in multiple clinical studies and has shown superior performance in identifying high-risk patients compared with subjective assessments [16,17]. The software first applies multi-scale deep reinforcement learning to identify anatomical landmarks, such as the carina and sternal tip, and then performs lung segmentation. Technically, the segmented lung regions are resampled into 2-mm isotropic volumes and processed using a deep image-to-image network (DI2IN) to generate refined lung segmentation. Subsequently, a DenseUNet model is applied for COVID-19-related abnormality segmentation, which filters the lung segmentation results to produce three-dimensional outputs, identifies lesion areas, and extracts quantitative imaging features. The quantitative features extracted by the model include: (1) opacity score for the entire lung, based on the percentage of affected lesions (0 = 0%, 1 = 1–25%, 2 = 26–50%, 3 = 51–75%, 4 > 75%); (2) lung volume (in milliliters) for the entire lung; (3) volume and percentage of opacities; (4) volume and percentage of high-attenuation opacities (attenuation ≥ -200 Hounsfield units (HU)); and (5) mean HU value of the total lung and opacity. Representative segmentation and feature maps are illustrated in Figure 2.

2.4. Statistical Analysis

All statistical analyses were performed using IBM SPSS Statistics (version 27.0; Armonk, NY, USA) and RStudio (Posit, version 2024.12.1 + 563; Boston, MA, USA). Continuous variables were tested for normality using the Shapiro–Wilk test and for homogeneity of variance using Levene’s test. Variables with a normal distribution were expressed as mean ± standard deviation (SD), whereas non-normally distributed variables were summarized as median (interquartile range [IQR], P25–P75).
Between-group comparisons were performed using the independent-samples t test or the Mann–Whitney U test for continuous variables, as appropriate. Categorical variables were reported as counts (percentages) and compared using the chi-square (χ²) or Fisher’s exact test, depending on expected cell frequencies.
The predictive performance of clinical and imaging parameters for adverse outcomes was evaluated using receiver-operating-characteristic (ROC) curve analysis. Optimal cutoff values were derived from the Youden index and applied for risk stratification. Cumulative incidence of adverse outcomes was estimated using Kaplan–Meier survival analysis, with between-group differences assessed by the log-rank test.
Univariate and multivariate Cox proportional-hazards regression models were used to identify independent risk factors for adverse outcomes. Variables with P < 0. 05 in univariate analysis or with established clinical relevance were entered into the multivariate model. Model performance was quantified by the concordance index (C-index) and all statistical tests were two-sided, and a P value < 0.05 was considered statistically significant.

3. Results

3.1. Patients Characteristics

A total of 236 patients with COVID-19 pneumonia were included, including 148 men (62.7%); the overall mean age was 70.42 years (range, 28–97). During the initial hospitalization follow-up, the median observation period was 7.65 days (IQR: 5.23–11.36 days), and 38 patients (16.1%) experienced adverse outcomes, defined as ICU admission or all-cause mortality. For the long-term follow-up, excluding 22 patients lost to follow-up and 21 who died during the index hospitalization, with a median observation duration of 611.00 days (IQR: 602.50–615.00 days). Among these patients, 18 (9.3%) experienced laboratory and HRCT-confirmed SARS-CoV-2 reinfection.
Compared with the non–adverse-outcome group, patients with adverse outcomes were significantly older and had higher levels of WBC, IL-6, D-dimer, CRP, and procalcitonin (PCT), along with lower lymphocyte percentage (LYM%) (all P < 0.05). Regarding quantitative imaging parameters, the adverse outcomes group demonstrated higher opacity score, volume of opacities, percentage of opacities, volume of high-attenuation opacities, percentage of high-attenuation opacities, and mean HU of the total lung. Furthermore, the adverse outcomes group had a significantly higher prevalence of comorbidities, including cardiac insufficiency, coronary heart disease (CHD), COPD, and concurrent fungal or bacterial infections (p<0.05; illustrated in Table 1). Compared with the non-reinfection group, patients with reinfection showed no significant differences in age, sex distribution, smoking history, or major comorbidities such as hypertension, diabetes, coronary heart disease, or chronic obstructive pulmonary disease (all P > 0.05). Laboratory parameters—including WBC, lymphocyte percentage, IL-6, D-dimer, CRP, ESR, and PCT—were also comparable between the two groups (all P > 0.05), although a trend toward elevated PCT levels was observed in reinfected individuals (P = 0.02). In contrast, quantitative HRCT parameters demonstrated notable differences. Reinfection cases exhibited significantly higher lung opacity scores (median = 10.50 vs. 6.00, P = 0.00), greater lesion volumes and percentages (median opacity volume = 829.10 mL vs. 365.03 mL, P = 0.01; percentage of opacities = 30.38% vs. 13.00%, P = 0.01), and a larger burden of high-attenuation opacities (volume = 204.79 mL vs. 55.46 mL, P = 0.00; percentage = 6.31% vs. 1.91%, P = 0.01). Baseline characteristics comparing patients with and without reinfection are presented in Table 2.

3.2. Association Between HRCT Parameters and Adverse Outcomes

The predictive performance of imaging parameters was assessed using ROC curve analysis, with corresponding AUCs, optimal cutoff values, and ROC curves presented in Figure 3. Kaplan-Meier survival curves were generated to evaluate the cumulative incidence of adverse outcomes during the follow-up period. Patients with higher opacity scores, greater volumes and percentages of pulmonary opacities, and larger volumes of high-attenuation opacities, as well as those with COPD or concurrent fungal/bacterial infections, exhibited significantly higher cumulative incidence rates of adverse outcomes and poorer prognoses (log-rank test, p<0.05; see Figure 4 and Figure 5).
Univariate Cox regression analysis indicated that age, COPD, concurrent bacterial or fungal infections, IL-6, D-dimer, CRP, and high-value groups for opacity score, volume of opacities, percentage of opacities, volume of high-attenuation opacities and mean HU of the total lung were significantly associated with adverse outcomes (p<0.05). Multivariable Cox regression analysis demonstrated that opacity score ≥5.50 (adjusted HR = 3.02, 95% CI: 1.17-7.81, p=0.02), percentage of opacities ≥18.85 (adjusted HR = 2.33, 95% CI: 1.12-4.84, p=0.02), and mean HU of the total lung ≥-662.38 (adjusted HR = 2.20, 95% CI: 1.12-4.30, p=0.02) were independent predictors of adverse outcomes after adjusting for age and COPD. Because multivariate analysis of clinical factors had identified age and COPD as independent predictors, subsequent multivariable Cox models for imaging parameters were specifically adjusted for these two covariates (see Table 3). The C-index for age was 0.59 (95% CI: 0.46-0.71), for COPD was 0.57 (95% CI: 0.49-0.65), for opacity score was 0.62 (95% CI: 0.55-0.69), for percentage of opacities was 0.63 (95% CI: 0.54-0.72), and for mean HU of the total lung was 0.626 (95% CI: 0.53-0.72). The combined model achieved a C-index of 0.68 (95% CI: 0.57-0.80), which, although indicative of modest predictive accuracy, represents an improvement over individual predictors. These findings suggest that integrating quantitative HRCT metrics with clinical factors enhances risk stratification for COVID-19 patients, although further external validation is warranted to confirm the robustness of model performance.

3.3. Association Between HRCT Parameters and SARS-CoV-2 Reinfection

During the long-term follow-up for reinfection assessment, univariate Cox regression analysis identified procalcitonin (PCT) and high-value groups for opacity score, volume of high-attenuation opacities, and percentage of high-attenuation opacities as significant predictors of SARS-CoV-2 reinfection (all p < 0.05). After adjustment for PCT, multivariable analysis demonstrated that opacity score ≥5.50 (adjusted HR = 5.32, 95% CI: 1.21-23.46, p=0.03), volume of high-attenuation opacities ≥140.37 ml (adjusted HR = 3.81, 95% CI: 1.46-9.97, p=0.01), and percentage of high-attenuation opacities ≥4.935 (adjusted HR =3.39, 95% CI: 1.29-8.90, p=0.01) remained independently associated with reinfection risk (Table 3). In individual analyses, the discriminatory ability of single predictors was modest, with C-indices as follows: PCT (0.62, 95% CI: 0.47-0.78), opacity score (0.66, 95% CI: 0.58-0.74), volume of high-attenuation opacities (0.66, 95% CI: 0.54-0.77), and percentage of high-attenuation opacities (0.64, 95% CI: 0.53-0.76). In contrast, the combined model achieved a C-index of 0.73 (95% CI: 0.64-0.83), indicating moderate predictive accuracy. Integration of these imaging metrics with clinical variables such as PCT may enhance long-term risk stratification beyond the capacity of single predictors.

4. Discussion

This study examined clinical and radiologic determinants of adverse outcomes and reinfection among patients with COVID-19 in northeastern Sichuan. Adverse outcomes were independently associated with age, COPD, and several quantitative HRCT parameters, whereas reinfection risk correlated with pneumonia-related metrics reflecting the density and extent of pulmonary involvement. Together, these findings underscore the complementary value of clinical and imaging data for prognostic assessment in COVID-19.
Age emerged as a robust and well-established predictor of adverse outcomes. This association aligns with previous multicenter evidence indicating that older individuals exhibit heightened endothelial activation and pro-thrombotic responses, predisposing them to multi-organ injury and mortality [18]. Accordingly, our findings reinforce the need for intensified monitoring and optimized management strategies in elderly patients.
Similarly, COPD was identified as a strong determinant of poor prognosis, consistent with prior studies showing reduced pulmonary reserve and overexpression of ACE2 receptors facilitating viral entry [19]. These convergent data lend robust support to the notion that chronic respiratory impairment exacerbates vulnerability to COVID-19–related deterioration.
Secondary infections appear to play a pivotal role in adverse outcomes, although causal direction cannot be established in this retrospective design. Immunosuppressive agents such as glucocorticoids and tocilizumab mitigate hyperinflammation and may reduce organ injury and mortality [20]. yet they can also dampen host defenses. Invasive procedures (e.g., intubation, catheterization) increase the likelihood of fungal and bacterial superinfection. In our cohort, 29% of patients with adverse outcomes had concurrent fungal/bacterial infections versus 7% among those without events (P < 0.05). High rates of drug-resistant organisms have been reported in similar contexts [21], and certain immunosuppressive therapies may blunt inflammatory markers, delaying recognition and treatment[21,22]. These observations support judicious antimicrobial use, early microbiologic workup, immune optimization, and prompt treatment of co-infections to improve outcomes.
PCT functioned as a clinically meaningful biomarker in our analyses and aligns with prior literature. During bacterial infection, endotoxins and proinflammatory cytokines (IL-1β, IL-6, TNF-α) upregulate CALC-I gene expression in non-thyroidal tissues, causing marked rises in serum PCT [23]. Elevated PCT was reported as a strong predictor of in-hospital mortality in COVID-19 [24]. and in our cohort, higher PCT was associated with reinfection risk after adjustment. In viral infections, IFN-γ–activated macrophages inhibit IL-1β-driven PCT secretion, producing smaller rises than in bacterial disease [25]. Consequently, PCT serves as a valuable biomarker for distinguishing bacterial from viral infections, supporting more targeted antibiotic use and helping to mitigate the risk of antibiotic resistance. Accordingly, PCT helps distinguish bacterial from viral processes, enabling targeted antibiotics and antimicrobial stewardship. A meta-analysis of 26 trials (n = 6,708) showed that PCT-guided strategies improved clinical outcomes in acute respiratory infections and reduced antibiotic exposure[26]. These convergent data support the considered use of PCT to guide therapy in COVID-19.
The prognostic value of HRCT in COVID-19 is well supported, and our quantitative results extend this evidence by leveraging AI-enhanced metrics. Pulmonary CT findings evolve dynamically over the disease course [27,28,29]. Early disease often presents with ground-glass opacities (GGOs), reflecting the exudative phase of diffuse alveolar damage (DAD), characterized by alveolar wall edema, inflammatory exudation, and hyaline membranes. Wider GGO distribution correlates with worse outcomes [30]. As disease progresses, consolidations and the “crazy-paving pattern” emerge—radiologically defined by GGOs with thickened inter- and intralobular septa—and correspond histopathologically to mixed-phase DAD with intra-alveolar fibrin and early fibrosis (fibroblast proliferation, collagen deposition, septal thickening) [31,32]. Late-stage features include linear/reticular opacities, fibrous stripes, subpleural lines, and fibrotic changes; GGOs may persist or extend but often decrease in density with re-expansion. Subsegmental atelectasis can distort bronchovascular bundles [33]. Fibrosis-like changes (e.g., bronchiectasis, reticulation) are more frequent at discharge in severe cases and may imply lasting functional impairment [34]. HRCT thus aids early case identification—particularly when RT-PCR is negative—enables severity grading, and supports longitudinal management [35].
Beyond qualitative reading, quantitative CT provides measurable surrogates of parenchymal burden and has shown promise for predicting outcomes. Prior studies related well-aerated lung volume in ARDS to clinical course [36]. and semi-quantitative assessments of affected lung volume predicted oxygen requirements and intubation with good accuracy [37]. In our study, a deep learning prototype extracted opacity score and high-attenuation metrics from HRCT. ROC-derived thresholds facilitated clinically interpretable stratification (high vs. low groups). Opacity-derived indices were strongly associated with adverse outcomes and, notably, with reinfection risk. Prior work with the same prototype reported that combining total opacity volume with high-attenuation percentage outperformed subjective severity scores for outcome prediction [17]. Taken together, these data support the clinical utility of AI-derived quantitative CT to complement human interpretation.
Higher mean total-lung attenuation at admission was significantly associated with worse clinical outcomes in our cohort, plausibly reflecting a shift from GGOs toward consolidation. Consolidated regions are linked to alveolar collapse and microcirculatory impairment, promoting ventilation–perfusion mismatch and worsening respiratory failure [38]. While this mechanistic link is consistent with pathophysiology, prospective validation of attenuation-based thresholds would further strengthen clinical translation.
We minimized inter-subject bias by normalizing opacity volume to total lung volume, deriving opacity percentage and an opacity score that both demonstrated strong prognostic performance. These findings are consistent with reports of higher opacity burden in severe COVID-19 [7,39,40]. Although our quantitative approach enhances objectivity and reproducibility, external validation and harmonization across scanners and protocols will be important to confirm generalizability.
The observed relationship between high-attenuation lesions and subsequent reinfection should be interpreted cautiously but is biologically plausible. High-attenuation opacities typically indicate dense consolidation and severe alveolar injury. Diffuse alveolar damage and dysregulated repair may reduce functional reserve and alter local immune microenvironments. [41]. Inflammatory exudates physically impair mucociliary clearance and carry mediators and cellular debris that perpetuate inflammation [42,43]. increased mucus viscosity—driven by mucin hypersecretion and extracellular DNA/actin—further hinders clearance [42,44]. These processes may create regions of impaired surveillance and barrier function, predisposing to reinfection. While our adjusted models show significant associations, the limited number of reinfection events warrants viewing this finding as hypothesis-generating and in need of mechanistic and prospective confirmation.
This study has limitations. Some biomarkers (e.g., IL-6) exhibit diurnal variation, and standardized cutoffs or sampling windows are lacking. The single-center design and modest sample size limit external validity. Future work should include multicenter cohorts with protocol harmonization, predefined sampling strategies, and external validation of quantitative thresholds. Despite these constraints, rapid advances in machine learning suggest that quantitative imaging pipelines can evolve into accurate, personalized decision-support tools in future pandemics.

Author Contributions

Feng XY was responsible for writing the original draft and preparing the manuscript. Wang FY was responsible for the methodological design. Jiang SY and Wang LH were involved in data management and curation. Chen XY provided the software and technical guidance for its application. Tang SB was responsible for the investigation and data collection. Yang F performed the formal analysis. Li R supervised the entire research project, including conceptualization, methodology, and reviewing and editing of the manuscript. All authors have read and approved the final version of the manuscript.

Funding

This study was supported by the Health Commission of the Sichuan Province Medical Science and Technology Program (No. 24WXXT10), the Sichuan Province Science and Technology Support Program (No. 2021YJ0242).

Conflicts of Interest

The authors declare no conflict of interest.

References

  1. World Health Organization. WHO Coronavirus (COVID-19) Dashboard [EB/OL]. https://covid19.who.int/.
  2. World Health Organization. COVID-19 epidemiological update – [EB/OL]. https://www.who.int/publications/m/item/covid-19-epidemiological-update-edition-177. 12 March.
  3. Fontanet A, Autran B, Lina B, et al. SARS-CoV-2 variants and ending the COVID-19 pandemic. Lancet, 2021, 397(10278): 952-4.
  4. Lundberg A L, Soetikno A G, Wu S A, et al. Updated Surveillance Metrics and History of the COVID-19 Pandemic (2020-2023) in East Asia and the Pacific Region: Longitudinal Trend Analysis. JMIR Public Health Surveill, 2025, 11: e53214.
  5. Ai T, Yang Z, Hou H, et al. Correlation of Chest CT and RT-PCR Testing for Coronavirus Disease 2019 (COVID-19) in China: A Report of 1014 Cases. Radiology, 2020, 296(2): E32-e40.
  6. Li L, Qin L, Xu Z, et al. Using Artificial Intelligence to Detect COVID-19 and Community-acquired Pneumonia Based on Pulmonary CT: Evaluation of the Diagnostic Accuracy. Radiology, 2020, 296(2): E65-e71.
  7. Ardali Duzgun S, Durhan G, Basaran Demirkazik F, et al. AI-Based Quantitative CT Analysis of Temporal Changes According to Disease Severity in COVID-19 Pneumonia. J Comput Assist Tomogr, 2021, 45(6): 970-8.
  8. Wang S, Zha Y, Li W, et al. A fully automatic deep learning system for COVID-19 diagnostic and prognostic analysis. Eur Respir J, 2020, 56(2).
  9. Markmann A J, Giallourou N, Bhowmik D R, et al. Sex Disparities and Neutralizing-Antibody Durability to SARS-CoV-2 Infection in Convalescent Individuals. mSphere, 2021, 6(4): e0027521.
  10. Swartz M D, DeSantis S M, Yaseen A, et al. Antibody Duration After Infection From SARS-CoV-2 in the Texas Coronavirus Antibody Response Survey. J Infect Dis, 2023, 227(2): 193-201.
  11. Danzetta M L, Amato L, Cito F, et al. SARS-CoV-2 RNA Persistence in Naso-Pharyngeal Swabs. Microorganisms, 2020, 8(8).
  12. Kellam P, Barclay W. The dynamics of humoral immune responses following SARS-CoV-2 infection and the potential for reinfection. J Gen Virol, 2020, 101(8): 791-7.
  13. Sharma R, Sardar S, Mohammad Arshad A, et al. A Patient with Asymptomatic SARS-CoV-2 Infection Who Presented 86 Days Later with COVID-19 Pneumonia Possibly Due to Reinfection with SARS-CoV-2. Am J Case Rep, 2020, 21: e927154.
  14. Kim A Y, Gandhi R T. Reinfection With Severe Acute Respiratory Syndrome Coronavirus 2: What Goes Around May Come Back Around. Clin Infect Dis, 2021, 73(9): e3009-e12.
  15. Ugurel O M, Ata O, Turgut-Balik D. An updated analysis of variations in SARS-CoV-2 genome. Turk J Biol, 2020, 44(3): 157-67.
  16. Arru C, Ebrahimian S, Falaschi Z, et al. Comparison of deep learning, radiomics and subjective assessment of chest CT findings in SARS-CoV-2 pneumonia. Clin Imaging, 2021, 80: 58-66.
  17. Homayounieh F, Bezerra Cavalcanti Rockenbach M A, Ebrahimian S, et al. Multicenter Assessment of CT Pneumonia Analysis Prototype for Predicting Disease Severity and Patient Outcome. J Digit Imaging, 2021, 34(2): 320-9.
  18. Veiga V C, Cavalcanti A B. Age, host response, and mortality in COVID-19. Eur Respir J, 2023, 62(1).
  19. Wark P A B, Pathinayake P S, Eapen M S, et al. Asthma, COPD and SARS-CoV-2 infection (COVID-19): potential mechanistic insights. Eur Respir J, 2021, 58(2).
  20. McManus D, Davis M W, Ortiz A, et al. Immunomodulatory Agents for Coronavirus Disease-2019 Pneumonia. Clin Chest Med, 2023, 44(2): 299-319.
  21. Kurt A F, Mete B, Urkmez S, et al. Incidence, Risk Factors, and Prognosis of Bloodstream Infections in COVID-19 Patients in Intensive Care: A Single-Center Observational Study. J Intensive Care Med, 2022, 37(10): 1353-62.
  22. Schweiger A, Trevino S, Marschall J. Nosocomial infections in dialysis access. Contrib Nephrol, 2015, 184: 205-21.
  23. Xu H G, Tian M, Pan S Y. Clinical utility of procalcitonin and its association with pathogenic microorganisms. Crit Rev Clin Lab Sci, 2022, 59(2): 93-111.
  24. Aon M, Alsaeedi A, Alzafiri A, et al. The Association between Admission Procalcitonin Level and The Severity of COVID-19 Pneumonia: A Retrospective Cohort Study. Medicina (Kaunas), 2022, 58(10).
  25. Linscheid P, Seboek D, Nylen E S, et al. In vitro and in vivo calcitonin I gene expression in parenchymal cells: a novel product of human adipose tissue. Endocrinology, 2003, 144(12): 5578-84.
  26. Schuetz P, Wirz Y, Sager R, et al. Procalcitonin to initiate or discontinue antibiotics in acute respiratory tract infections. Cochrane Database Syst Rev, 2017, 10(10): Cd007498.
  27. Casartelli C, Perrone F, Balbi M, et al. Review on radiological evolution of COVID-19 pneumonia using computed tomography. World J Radiol, 2021, 13(9): 294-306.
  28. Liu Y, Zhou X, Liu X, et al. Systematic review and meta-analysis of the CT imaging characteristics of infectious pneumonia. Ann Palliat Med, 2021, 10(10): 10414-24.
  29. Zhou Y, Ren H, Wang S, et al. The evolution of chest CT findings from admission to follow-up in 30 moderate to severe adult patients with COVID-19 pneumonia. Chin J Acad Radiol, 2021, 4(1): 71-7.
  30. Balasubramaniam S, Raju B P, Perumpallipatty Kumarasamy S, et al. Lung Involvement Patterns in COVID-19: CT Scan Insights and Prognostic Implications From a Tertiary Care Center in Southern India. Cureus, 2024, 16(1): e53335.
  31. Savoia P, Valente Yamada Sawamura M, de Almeida Monteiro R A, et al. Postmortem chest computed tomography in COVID-19: A minimally invasive autopsy method. Eur J Radiol Open, 2024, 12: 100546.
  32. Ackermann M, Verleden S E, Kuehnel M, et al. Pulmonary Vascular Endothelialitis, Thrombosis, and Angiogenesis in Covid-19. N Engl J Med, 2020, 383(2): 120-8.
  33. Liu D, Zhang W, Pan F, et al. The pulmonary sequalae in discharged patients with COVID-19: a short-term observational study. Respir Res, 2020, 21(1): 125.
  34. Pan F, Yang L, Liang B, et al. Chest CT Patterns from Diagnosis to 1 Year of Follow-up in Patients with COVID-19. Radiology, 2022, 302(3): 709-19.
  35. Zhao W, Zhong Z, Xie X, et al. Relation Between Chest CT Findings and Clinical Conditions of Coronavirus Disease (COVID-19) Pneumonia: A Multicenter Study. AJR Am J Roentgenol, 2020, 214(5): 1072-7.
  36. Nishiyama A, Kawata N, Yokota H, et al. A predictive factor for patients with acute respiratory distress syndrome: CT lung volumetry of the well-aerated region as an automated method. Eur J Radiol, 2020, 122: 108748.
  37. Lanza E, Muglia R, Bolengo I, et al. Quantitative chest CT analysis in COVID-19 to predict the need for oxygenation support and intubation. Eur Radiol, 2020, 30(12): 6770-8.
  38. Shen C, Yu N, Cai S, et al. Quantitative computed tomography analysis for stratifying the severity of Coronavirus Disease 2019. J Pharm Anal, 2020, 10(2): 123-9.
  39. Wang Y C, Luo H, Liu S, et al. Dynamic evolution of COVID-19 on chest computed tomography: experience from Jiangsu Province of China. Eur Radiol, 2020, 30(11): 6194-203.
  40. Lyu P, Liu X, Zhang R, et al. The Performance of Chest CT in Evaluating the Clinical Severity of COVID-19 Pneumonia: Identifying Critical Cases Based on CT Characteristics. Invest Radiol, 2020, 55(7): 412-21.
  41. Li Y, Hu H, Liu J, et al. Crucial role played by CK8(+) cells in mediating alveolar injury remodeling for patients with COVID-19. Virol Sin, 2024, 39(3): 390-402.
  42. Meyerholz D K, Reznikov L R. Influence of SARS-CoV-2 on airway mucus production: A review and proposed model. Vet Pathol, 2022, 59(4): 578-85.
  43. Vijaykumar K, Leung H M, Barrios A, et al. COVID-19 Causes Ciliary Dysfunction as Demonstrated by Human Intranasal Micro-Optical Coherence Tomography Imaging. bioRxiv, 2022.
  44. Nalbandian A, Sehgal K, Gupta A, et al. Post-acute COVID-19 syndrome. Nat Med, 2021, 27(4): 601-15.
Figure 1. Flow chart showing the selection process for the study population. ICU, intensive care unit.
Preprints 182036 g001
Figure 2. From a COVID-19 pneumonia patient: A 68-year-old male with comorbidities including diabetes mellitus, CHD, and COPD. During hospitalization, the patient developed a co-infection with acinetobacter baumannii. HRCT scans of the chest (diagrams A-C) revealed bilateral subpleural GGO. Diagram D demonstrates quantitative analysis results of various indicators using the prototype. The patient succumbed to the illness 4 days after admission.
Preprints 182036 g002
Figure 3. ROC Curve Analysis of Imaging Parameters in Predicting Adverse Outcome.
Preprints 182036 g003
Figure 4. Kaplan-Meier Survival Curves by COPD and Concurrent Fungal/Bacterial Infection Status in COVID-19 Patients.
Preprints 182036 g004
Figure 5. Kaplan-Meier Survival Curves by Opacity Score, Volume of Opacities, Percentage of Opacities and Volume of High-attenuation Opacities Stratification in COVID-19 Patients.
Preprints 182036 g005
Table 1. Baseline Characteristics of Patients in the Adverse Outcomes Group and Non-Adverse Outcomes Group.
Parameter Non-Adverse Outcomes Group (n=198) Adverse Outcomes Group (n=38) z/χ2 p
Clinical characteristics
Age, year 73.00(59.00,81.00) 78.00(71.50,84.25) -2.66 0.01
Male 120(60.61) 28(73.68) 2.33 0.13
Smoke 35(17.68) 9(23.68) 0.76 0.38
Hypertension 96(48.49) 17(44.74) 0.18 0.67
Diabetes 94(47.48) 23(60.53) 2.17 0.14
Cardiac insufficiency 31(15.66) 14(36.84) 9.27 0.00
CHD 92(46.47) 25(65.79) 4.76 0.03
Cerebral infarction 31(15.66) 6(15.79) 0 0.98
Bronchiectasis 11(5.56) 1(2.63) 0.57 0.45
COPD 24(12.12) 10(26.32) 5.21 0.02
Emphysema 48(24.24) 13(34.21) 1.65 0.20
Asthma 2(1.01) 0(0.00) 0.39 0.53
Concurrent with F/B 14(7.07) 11(28.95) 16.11 0.00
Laboratory parameters
WBC, ×10^9/L 6.69(5.23,9.19) 9.63(5.34,13.57) -2.42 0.02
LYM% 14.30(9.25,20.60) 6.35(3.60,10.03) -4.83 0.00
IL-6, ng/L 27.38(8.13, 109.68) 109.68(49.56, 274.00) -5.37 0.00
D-dimer, mg/L 1.77(1.15,4.78) 5.07(2.18,15.54) -4.86 0.00
CRP, mg/L 63.78(15.68,81.33) 84.61(44.07, 154.70) -3.48 0.00
PCT, mg/mL 0.09(0.05,0.75) 0.78(0.17,1.46) -4.61 0.00
ESR, mm/h 58.92(48.00,60.50) 58.92(42.75,65.25) -0.18 0.86
CT-based lung parameters
Opacity score 6.00(5.00,10.00) 9.50(6.00,14.00) -4.04 0.00
Lung volume 2936.33(2523.18,3541.56) 3107.06(2555.71,3670.27) -0.69 0.49
Volume of opacities 426.30(164.62,906.45) 925.03(452.09,1571.74) -4.18 0.00
Percentage of opacities 13.33(5.03,34.33) 32.78(14.53,55.98) -3.85 0.00
Volume of high-attenuation opacities 63.48(22.50,214.23) 236.28(67.10,469.82) -3.97 0.00
Percentage of high-attenuation opacities 2.04(0.70,7.31) 7.67(2.53,14.84) -3.73 0.00
Mean HU total -714.53(-763.02, -639.27) -649.66(-742.91, -572.64) -2.70 0.01
Mean HU of opacity -471.04(-530.67, -421.24) -443.12(-502.80, -367.68) -1.81 0.07
Data are presented as interquartile range and n (%). Abbreviations: CHD, coronary heart disease; COPD, chronic obstructive pulmonary disease; TB, Tuberculosis; F/B, Fungal/Bacterial; WBC, white blood cell count; LYM%, lymphocyte percentage; IL-6, interleukin-6; CRP, C-reactive protein; PCT, procalcitonin; ESR, erythrocyte sedimentation rate.
Table 2. Baseline Characteristics of Patients in the Non-Reinfection Group and Reinfection Group.
Parameter Non-Reinfection Group (n=175) Reinfection Group (n=15) z/χ2 p
Clinical characteristics
Age, year 72.00(59.00, 81.00) 78.50(63.50, 84.00) -1.06 0.28
Male 105 (60.00) 12(66.67) 0.30 0.58
Smoke 31 (17.71) 5(27.78) 1.09 0.34
Hypertension 86(49.14) 6(33.33) 1.64 0.20
Diabetes 83(47.43) 7(38.89) 0.48 0.49
Cardiac insufficiency 28(16.00) 2(11.11) 0.30 0.74
CHD 80(45.71) 9(50.00) 0.12 0.73
Cerebral infarction 25(14.29) 4(22.22) 0.81 0.48
Bronchiectasis 7(4.00) 2(11.11) 1.86 0.20
COPD 22(12.57) 2(11.11) 0.03 1.00
Emphysema 41(23.429) 5(27.78) 0.17 0.77
Asthma 2(1.14) 0(0.00) 0.21 1.00
Concurrent with F/B 12(6.86) 2(11.11) 0.44 0.63
Laboratory parameters
WBC, ×10^9/L 6.69(5.30, 9.19) 7.01(4.66, 9.16) -0.27 0.79
LYM% 14.40 (9.40, 21.30) 13.10 (7.95, 18.40) -0.92 0.36
IL-6, ng/L 24.26 (7.33, 109.68) 58.23 (17.77, 109.68) -1.34 0.18
D-dimer, mg/L 1.75 (1.06, 5.01) 2.02 (1.36, 4.48) -0.80 0.43
CRP, mg/L 62.75 (13.91, 81.70) 71.43 (49.81, 81.14) -1.23 0.22
PCT, mg/mL 0.08 (0.05,0.59) 0.60 (0.05, 8.27) -1.94 0.05
ESR, mm/h 58.92 (48.00, 59.00) 58.92 (58.92, 74.00) -1.43 0.15
CT-based lung parameters
Opacity score 6.00 (5.00,9.00) 10.50(6.75, 12.25) -3.12 0.00
Lung volume 2943.86 (2513.01, 3552.76) 3024.37 (2716.19, 3825.59) -0.50 0.62
Volume of opacities 365.03(165.00,875.37) 829.10 (437.09, 1478.28) -2.57 0.01
Percentage of opacities 13.00 (4.71,32.34) 30.38 (11.97, 51.28) -2.47 0.01
Volume of high-attenuation opacities 55.46 (22.20,182.03) 204.79 (105.81, 371.80) -2.93 0.00
Percentage of high-attenuation opacities 1.91 (0.68, 6.39) 6.31 (3.01, 13.15) -2.63 0.01
Mean HU total -715.37 (-764.83, -640.42) -669.24 (-757.24, -560.53) -1.44 0.15
Mean HU of opacity -474.12 (-530.57, -423.33) -440.94 (-491.70, -371.55) -1.66 0.10
Table 3. Cox Regression Analysis for Adverse Outcomes and Reinfection.
Adverse Outcomes Reinfection
Univariate analysis Multivariate analysis Univariate analysis Multivariate analysis
Parameter HR 95% CI P HR 95% CI P HR 95% CI P HR 95% CI P
Opacity score 3.59 1.40-9.22 0.01 3.02 1.17-7.81 0.02 6.06 1.39-26.36 0.02 5.32 1.21-23.46 0.03
Lung volume 0.83 0.44-1.58 0.57 1.21 0.48-3.04 0.69
Volume of opacities 2.15 1.06-4.36 0.03 2.18 0.85-5.62 0.11
Percentage of opacities 2.63 1.27-5.45 0.01 2.33 1.12-4.84 0.02 1.92 0.76-4.86 0.17
Volume of high-attenuation opacities 2.43 1.24-4.77 0.01 3.68 1.43-9.49 0.01 3.81 1.46-9.97 0.01
Percentage of high-attenuation opacities 1.84 0.94-3.59 0.08 3.24 1.26-8.37 0.02 3.39 1.29-8.90 0.01
Mean HU total 2.48 1.28-4.82 0.01 2.20 1.12-4.30 0.02 2.41 0.96-6.07 0.06
Mean HU of opacity 1.58 0.83-2.99 0.16 2.25 0.89-5.69 0.09
Multivariate analysis for adverse outcomes was adjusted for age and COPD, while the analysis for reinfection was adjusted for PCT.
Disclaimer/Publisher’s Note: The statements, opinions and data contained in all publications are solely those of the individual author(s) and contributor(s) and not of MDPI and/or the editor(s). MDPI and/or the editor(s) disclaim responsibility for any injury to people or property resulting from any ideas, methods, instructions or products referred to in the content.
Copyright: This open access article is published under a Creative Commons CC BY 4.0 license, which permit the free download, distribution, and reuse, provided that the author and preprint are cited in any reuse.
Prerpints.org logo

Preprints.org is a free preprint server supported by MDPI in Basel, Switzerland.

Subscribe

Disclaimer

Terms of Use

Privacy Policy

Privacy Settings

© 2026 MDPI (Basel, Switzerland) unless otherwise stated