
Submitted:
21 March 2025
Posted:
21 March 2025
You are already at the latest version
Preprints on COVID-19 and SARS-CoV-2
Abstract
Background/Objectives: In order to prevent the transmission rate of COVID-19, early diagnosis with high accuracy is essential. The aim of this study is to identify the disease using convolutional neural network (CNN) architectures that allow accurate and rapid diagnosis of COVID-19 pneumonia on computed tomography (CT) images and to evaluate the classification success of the architectures by comparing their classification success with various performance metrics. Methods: In the study dataset, a total of 15584 lung CT slices were obtained, 8395 slices from 361 positive cases and 7189 slices from 134 negative cases, selected in accordance with the study criteria, with RT-PCR test results and CT scans. The dataset were analysed using fine-tuned DenseNet169, MobileNetV2, ResNet50, InceptionResNetV2, InceptionV3, VGG16, VGG19, Xception, DenseNet121, DenseNet201 and ResNet101. Accuracy, sensitivity, specificity, precision, F1 score, ROC curve and AUC were used for performance evaluation. Results: In the SARS-CoV-2 CT scan dataset and the study dataset, the highest performance metrics were obtained from the fine-tuned DenseNet201 with accuracy of 99.19%, sensitivity of 98.65%, specificity of 99.64%, precision of 99.55%, F1 score of 99.10%, AUC of 99.14%, and accuracy of 99.13%, sensitivity of 99.86%, specificity of 98.52%, precision of 98.28%, F1 score of 99.07%, AUC of 99.19%, respectively. The other highest accuracies for the study dataset were 97.47% with fine-tuned DenseNet169 and 97.85% with fine-tuned DenseNet121. Conclusions: As a result, the fine-tuned DenseNet201 proposed in this study shows a promising performance on lung CT images and two different datasets.
Keywords:
COVID-19
; deep learning
; convolutional neural networks
; image classification
; computed tomography
1. Introduction
The COVID-19 pandemic, which is known to have emerged in Wuhan, China in December 2019, has affected the lives of millions of people, caused difficulties in their daily lives and caused serious damage to the economies of many countries around the world. At the same time, it has caused millions of deaths and imposed a great burden and hardship on health centres, health services and health personnel. Therefore, timely and cost-effective screening of affected patients is crucial to struggle this disease. Due to the rapid spread of this highly infectious disease worldwide, it has become necessary to make early diagnosis with high accuracy in order to prevent the transmission rate. SARS-CoV-2, which causes COVID-19, is a highly contagious virus that affects the respiratory system. The most common symptoms with COVID-19 are fever, cough, fatigue and shortness of breath. The disease can progress to involve the lower respiratory system, causing severe inflammation in the lungs and leading to pneumonia [1,2]. The standard diagnostic method used is real-time polymerase chain reaction (RT-PCR) in the form of a throat swab [3]. RT-PCR has a sensitivity ranging from 42% to 71% and can give false negative results. Studies have shown that X-ray and computed tomography (CT) findings of COVID-19 include bilateral pulmonary parenchymal ground glass and consolidative pulmonary opacities with peripheral lung distribution. In contrast to RT-PCR, lung CT scans have shown a sensitivity of approximately 56%-98% in diagnosing COVID-19 [4].
According to the results of some studies on the available RT-PCR test, it was noted that there were patients with negative RT-PCR test results who were found to be positive by X-ray and computed tomography (CT) scan results. X-ray and CT reports revealed pulmonary irregularities inconsistent with COVID-19 patients with negative RT-PCR test results. Therefore, since RT-PCR testing is a time-consuming procedure and lacks sensitivity and consistency, X-ray and CT scanning can be considered as complementary methods to detect infection by the deadly virus [5]. As it is known, the ground-glass appearance and tissue changes seen in the lung are seen in almost all COVID-19 patients and can be easily recognised by X-ray and CT imaging. These features are also observed in patients with negative RT-PCR results but clinical symptoms. X-ray and CT imaging modalities are powerful tools in modern medical imaging that can help doctors diagnose a variety of conditions. These medical imaging tools help expert radiologists diagnose lung disorders without cutting into the body. CT and X-ray imaging methods are considered among the most effective techniques especially for the diagnosis of COVID-19. Thorax CT scanning is preferred over X-ray due to its versatility and three-dimensional pulmonary view [6,7,8,9]. In this context, it is very important and necessary to use deep learning-based rapid diagnosis systems over CT images. With the studies carried out, early diagnosis and rapid treatment solutions of COVID-19 disease have been further developed, providing clinicians with a more objective interpretation [10].
In this study, it is aimed to determine the disease by using pre-trained convolutional neural networks (CNN) architectures, which are among the deep learning methods widely used in the field of health, which achieve successful results in large-scale image recognition-medical image processing with their multi-layered structure, reaching high accuracy values by enabling accurate diagnosis of COVID-19 pneumonia, and to evaluate the architectures by comparing their classification success with various performance metrics
1.1. Related Work
To enable rapid and efficient clinical diagnosis of COVID-19, medical image analysis based on deep learning has become a hot topic. In recent years, various deep learning methods have been explored to screen COVID-19 from X-ray and computed tomography (CT) images [11]. Deep learning-based CNNs have achieved good performance in medical image classification tasks from lung CT images. CNN diagnostics have become more important with the spread of COVID-19 worldwide [12]. In the literature, there are various studies on the use of CNNs in diagnosing COVID-19 through medical images.
Ardakani et al. [13] examined AlexNet, VGG16, VGG19, SqueezeNet, GoogleNet, MobileNetV2, ResNet18, ResNet50, ResNet101 and Xception architectures for COVID-19 diagnosis from CT images. The dataset consists of a total of 1020 CT samples as COVID-19 and non-COVID-19. They achieved over accuracy of 90% with MobileNetV2, ResNet50, ResNet18, ResNet101 and Xception. ResNet101 architecture showed the best performance with accuracy of 99.63%. Apostolopoulos and Mpesiana [14] evaluated pre-trained VGG19, MobileNetV2, Inception, Xception and InceptionResNetV2 architectures on two datasets for automatic diagnosis of COVID-19 cases. They achieved the highest performance with accuracy of 96.78% for the second dataset using MobileNetV2. Horry et al. [15] worked with X-ray images and used VGG19, Inception, Xception and ResNet architectures. The dataset consists of 100 COVID-19 cases, 100 pneumonia cases and 200 healthy cases. They considered precision, recall and F1 score as performance metrics. As a result, in their study for three-class data, they obtained the highest performance with accuracy of 83% from the VGG19 architecture. Punn and Agarwal [16] developed an automated COVID-19 diagnosis system with X-ray images using ResNet, InceptionV2, InceptionResNetV2, DenseNet169 and NASNetLarge architectures. They analysed 6 scenarios in terms of fine-tuning transfer learning. They considered a total of 1076 X-ray images for the experiments. As a result of their work, the best performance metrics they achieved with InceptionResNetV2 and DenseNet169 were accuracy of 95%. The NasNetLarge architecture showed the best performance for the whole study with an accuracy of 98%. Narin et al. [17] used a total of 100 X-ray images, 50 from COVID-19 patients and 50 from healthy people, to detect patients infected with COVID-19. They performed the analyses with ResNet50, ResNet101, ResNet152, InceptionV3 and InceptionResNetV2 architectures. With InceptionV3, ResNet50 and InceptionResNetV2 architectures, they achieved an average accuracy of 95.4%, 96.1% and 94.2%, respectively. Asif et al. [18] used a combined dataset containing a total of 2541 X-ray images from two different sources. They performed performance evaluation using InceptionV3, Xception, MobileNetV2, NasNet and DenseNet201 architectures for COVID-19 diagnosis. Each of the architectures they used performed over 90%. MobileNetV2 with accuracy of 99.37% and DenseNet201 with accuracy of 99.21% showed the highest performances. Keerthana et al. [19] aimed to develop an inductive parameter transfer learning-based approach for COVID-19 and normal diagnoses from CT images. In their proposed approach, they performed feature extraction by taking DenseNet201, InceptionV3, Xception, VGG19 and ResNet50 as basic architectures and then fine-tuned them by adding special layers. They used two different optimizers for parameter tuning (Adam, RMSprop) and evaluated the results using two different datasets. They classified COVID-19 with precision of 92%, recall of 86%, F1 score of 89% for Xception architecture and precision of 95%, recall of 94%, F1 score of 94% for DenseNet201 architecture on Kaggle dataset using Adam optimizer. DenseNet201 architecture showed the highest performance with accuracy of 99.24% in binary classification with fine-tuned architectures. Huang and Liao [20] used InceptionV3, ResNet50V2, Xception, DenseNet121, MobileNetV2, EfficientNet-B0, EfficientNetV2 architectures with and without fine-tuning on both X-ray and CT images in the diagnosis of COVID-19 and reported the results. On CT images, they obtained accuracy of 93.46 ± 0.80%, precision of 94.09 ± 0.82%, recall of 94.06 ± 0.90%, F1 score of 93.89 ± 0.77% with the Xception architecture, and accuracy of 96.78 ± 1.19%, precision of 96.43 ± 1.15%, recall of 96.52 ± 1.28%, F1 score of 96.48 ± 1.35% with the fine-tuned Xception architecture. They obtained accuracy of 93.12 ± 2.21%, precision of 93.11 ± 2.25%, recall of 93.07 ± 2.23%, F1 score of 93.06 ± 2.31% with DenseNet121 architecture and accuracy of 96.58 ± 1.07%, precision of 96.59 ± 1.02%, recall of 96.53 ± 1.09%, F1 score of 96.48 ± 1.18% with fine-tuned DenseNet121 architecture. Kaur and Kaur [21] proposed a new fine-tuned pre-trained MobileNetV2 architecture for automatic diagnosis of COVID-19 from lung CT images and used Xception, NasNetLarge, NasNetMobile, DenseNet201, DenseNet121, DenseNet169, InceptionV3, InceptionResNetV2 architectures for comparisons. As a result of their analyses, they obtained accuracy values as 89.65% for Xception, 89.16% for NasNetLarge, 85.71% for NasNetMobile, 82.75% for DenseNet201, 79.80% for DenseNet121, 86.66% for DenseNet169, 82.26% for InceptionV3 and 81.28% for InceptionResNetV2. Malik et al. [22] aimed to classify nine different lung disorders, proposed four new CNN models and compared their models with VGG19, ResNet101, ResNet50, DenseNet121, EfficientNetB0, DenseNet201 and InceptionV3 architectures. They evaluated the models on a dataset consisting of X-ray, CT and cough sound. In the study, they achieved accuracy of 92.07±2.84% with VGG19, accuracy of 93.17±2.42% with ResNet101, accuracy of 92.97±2.03% with ResNet50, accuracy of 93.39±2.01% with DenseNet121, accuracy of 93.01±2.21% with EfficientNetB0, accuracy of 92.93±1.98% with DenseNet201 and accuracy of 91.97±2.51% with InceptionV3. Kathamuthu et al. [23] used VGG16, VGG19, DenseNet121, InceptionV3, Xception and ResNet50 architectures for COVID-19 diagnosis from lung CT images. While VGG16 showed the highest performance with accuracy of 98%, the accuracy values for other architectures were obtained as follows: accuracy of 97.38% with DenseNet121, accuracy of 93.36% with InceptionV3, accuracy of 81.29% with ResNet50, accuracy of 94.16% with Xception and accuracy of 96.38% with VGG19. Hossain et al. [24] used recursive feature elimination, principal component analysis and linear discriminant analysis methods for feature optimization in the diagnosis of COVID-19 using CT images by creating a feature vector through feature fusion based on VGG19 and ResNet50 architectures, and performed classification with maximum voting ensemble classification. They obtained accuracy of 94.35%, specificity of 91.46%, sensitivity of 97.23%, precision of 92.01% using VGG19 as feature extractor and accuracy of 95.56%, specificity of 92.19%, sensitivity of 99.56%, precision of 91.5% using ResNet50 as feature extractor. Zolya vd. [25], using SARS-CoV-2 CT-scan dataset, examined lung CT images in two scenarios, one binary (COVID-19 and non-COVID-19) and the other three-class classification with viral pneumonia added as the third class, and evaluated their scenarios with MobileNetV1, ResNet50, DenseNet201, VGG16 and VGG19 architectures using transfer learning method. In an in-depth analysis using the CAM technique, they achieved accuracy of 97.44% for three-class classification by differentiating the MobileNetV1 architecture. They obtained an accuracy of 94.67% with the DenseNet201 architecture. With other architectures, they achieved accuracies above 90%. Joshi et al. [26] used transfer learning method for COVID-19 diagnosis by combining SARS-CoV-2 CT-scan dataset and UCSD-AI4H COVID CT scan datasets. In the study, they created a new model based on the VGG16 architecture and achieved accuracy of 95%. Yousefpanah et al. [27] first designed a network called CT6-CNN and developed two ensemble deep transfer learning models based on Xception, ResNet101, DenseNet169 and CT6-CNN for COVID-19 diagnosis from CT images. They evaluated the models on the SARS-CoV-2 CT dataset. In the study, they achieved accuracy of 94.40% with Xception, accuracy of 92.23% with ResNet101 and accuracy of 95.73% with DenseNet169.
2. Materials and Methods
2.1. Proposed Approach
Google Colaboratory was used to perform data analyses with the Python programming language. The Python programming language was used together with TensorFlow and Keras libraries. The architectures were run with Graphics Processing Unit (GPU) support. The dataset was split 80%-20% as train-test. The ImageDataGenerator class of the TensorFlow and Keras library in Python was used to use data augmentation for training the images. Different data preprocessing and data augmentation methods were applied to the dataset and adjusted as follows: Rescale = 1/255.0; Horizontal flip and Vertical flip = True; Zoom range, Width shift range and Height shift range = 0.2; Rotation range = 20 – 360. The hyperparameter settings used in the analyses were as follows: Batch size=32, Epoch=100, Minimum learning rate = 0.0001-0.000001, Dropout=(0.5). Adam and Adamax methods were used for optimization. ReduceLROnPlateau, ModelCheckpoint and EarlyStopping functions were used as callbacks during the training process. Learning curves for each architecture were used to examine the behaviour of the CNN architectures used with respect to overfitting. In the learning curves, the first graphs show the changes of the train-test accuracies during the training process and the second graphs show the changes of the train-test losses during the training process. The methodology used in this study is presented in the flowchart in Figure 1.
In the use of deep learning models, the process starts with the reading of the data. After this, algorithm studies are not started immediately. Firstly, the data must be made suitable for the algorithms, and for this, the data pre-processing step must be performed [28]. This step aims to improve the quality of the features present in the image dataset [29]. The impact of pre-processing techniques on CNN frames is of great importance [30].
Medical imaging data is often small in size as data collection and labeling of medical images is a difficult and costly process. The small number of training process images hinders the feature extraction of CNN models, resulting in poor performance. Data augmentation is an effective way to overcome this problem [31]. In this study, various data augmentation approaches were used to augment the data. Data augmentation by adding transformed samples to training data sets can improve the performance and results of CNN algorithms. If the dataset used to train the model is sufficiently large and balanced, more effective and precise results are obtained. The accuracy of the results is increased by the use of image enhancement methods. In addition, data augmentation methods are an effective method for diversifying datasets [32].
2.2. Datasets
2.2.1. SARS-COV-2 Ct-Scan Dataset
A prestudy was performed using the open source SARS-COV-2 Ct-Scan dataset accessed via Kaggle. The dataset contains 2482 CT images of 120 patients, including 1252 CT slices of 60 patients diagnosed with COVID-19 pneumonia and 1230 CT slices of 60 patients non-COVID-19. The data were collected from real patients in hospitals in Sao Paulo, Brazil [33].
2.2.2. Study Dataset
In the study dataset, patients who applied to Ondokuz Mayıs University Faculty of Medicine Health Practice and Research Hospital with suspicion of COVID-19 between 01.01.2020 - 31.12.2021, who were 18 years of age/ over 18 years of age, who had RT-PCR test, and who had at least one CT scan in the Radiology Department were included. The confirmation of whether the applicants were COVID-19 patients or not was done by RT-PCR test result. CT images with artefacts, inconclusive diagnosis and poor quality were excluded from the study. In the dataset, lung CT images of 495 patients who were selected in accordance with the study criteria, had RT-PCR test results and had CT scans were accessed. The Declaration of Helsinki was followed and ethical approval was obtained for the study. In total, 361 of these patients were COVID-19 patients and 134 were non-COVID-19 patients. A total of 15584 lung CT slices were obtained, 8395 slices from 361 COVID-19 cases and 7189 slices from 134 non-COVID-19 cases. While the images were originally in DICOM format, they were converted to png format. All CT examinations were performed on an 80-slice CT scanner (Aquilion PRIME, Canon Medical Systems, Otawara, Japan). Unenhanced lung CT scans were obtained with a low dose technique (mA; Automated exposure control, kV: 100, slice thickness: 1 mm) in the CT unit, which was specifically located in an isolated area of the emergency department. After all images were obtained, it was decided which slices to include or exclude in the presence of an expert radiologist (10 years of experience). Examples of lung CT of COVID-19 and non-COVID-19 patients in the dataset are given in Figure 2.
2.3. Convolutional Neural Networks
CNNs are deep learning methods that create feature maps that can extract local features such as edges, sharp corners, shapes, gradients for classification problems by applying convolution between input data and learnable filters (kernels) [34]. CNN is frequently used, especially for image data. Artificial intelligence systems based on multilayer neural networks that can recognise, identify and classify objects, as well as detect and segment objects in images. This network is specifically designed to deal with a range of two-dimensional (2D) shapes and is frequently used in many other applications such as visual identification, medical image analysis, image segmentation, natural language processing. It is more effective than a normal artificial neural network as it can automatically identify key elements from the input without the need for a human [35].
A CNN architecture is a multi-layered structure that provides multi-level hierarchical feature learning. In the early layers of the CNN, simple features such as texture and shape can be extracted, while in the deeper layers, more complex features can be extracted, which are combined to accurately locate key elements [36]. A CNN architecture consists of a succession of several basic building blocks: Convolution layer, pooling layer, fully connected layer and activation layer.
The convolution and pooling layers perform feature extraction, while the fully connected layer passes the extracted features to the final output for classification. The convolution layer plays an important role in CNN, which consists of a series of mathematical and specialised linear operations (convolution operation, etc.). The pooling layer is added after the convolution layer to reduce the size of the feature maps and parameters [37]. In digital images, pixel values are stored in an array of numbers, while the kernel, a small grid of parameters and an optimisable feature extractor, is applied to each image position. This process, which makes CNNs highly efficient in image processing, can create a feature from anywhere in the image. As the output of one layer feeds the next layer, the extracted features can become hierarchically and progressively more complex [38]. CNN layers and general operation are given in Figure 3.
The process of transforming input data into output through layers is called forward propagation, and the process of optimizing parameters such as kernel etc. is called training. Through back-propagation and gradient descent optimization algorithms, the difference between the outputs and the actual labels is minimised. The performance of an architecture under specified kernels and weights is calculated with a loss function using the forward propagation algorithm on the training dataset. The kernels and weights are updated according to the loss by back propagation with the gradient descent optimization algorithm [39]. A general CNN architecture and the training process with forward propagation-back propagation algorithms are given in Figure 4.
2.4. Transfer Learning
Transfer learning is an approach in which a pre-trained model is fine-tuned for a new task or domain by utilising the knowledge acquired during initial training. This technique is particularly useful in medical imaging where labelled datasets are often of limited size [40]. Transfer learning can help overcome this limitation by transferring the learned parameters (i.e. weights) of CNN architectures trained on a large dataset (e.g. ImageNet) for medical image analysis [41].
The main advantages of transfer learning are that it shortens the training time, provides better performance for neural networks and can be used with a small number of data. Transfer learning allows researchers in the field of medical imaging to achieve better performance on small data sets. Transfer learning is divided into two types: cross-domain and cross-modal transfer learning, depending on whether new data and existing data belong to the same domain. Cross-domain transfer learning is a popular method for performing tasks in medical image analyses [42].
For the definition of transfer learning, two basic concepts must first be defined. Given a domain D, where X is the feature space and is the marginal distribution, the domain can be represented as in Equation 1:
With the domain definition, a task is defined as in Equation 2:
Here represents the label space and the function can also be written as an function, predicting the corresponding label based on the feature space. Thus, a task description as in Equation 3 is obtained:
For transfer learning, let be a source domain with matching task and be a destination domain with matching task . If or , transfer learning is a process that aims to learn the target probability distribution estimation function at using the information learnt from and [43].
3. Results
In order to decide on the architecture and performance measures to be used for the study dataset, analysis was performed with the SARS-COV-2 Ct-Scan dataset. In the analysis, the classification of the disease was performed with fine-tuned Xception, DenseNet201, DenseNet121, DenseNet169, ResNet50, ResNet101, VGG16, VGG19, InceptionV3, InceptionResNetV2, MobileNetV2, NasNetLarge and NasNetMobile architectures. The performance of the architectures was evaluated using accuracy, sensitivity, specificity, precision, F1 score and AUC. Learning curves, confusion matrices and ROC curves were obtained.
As a result of the study with SARS-COV-2 Ct-Scan dataset, the architecture with the highest performance was determined as fine-tuned DenseNet201 with accuracy of 99.19%, sensitivity of 98.65%, specificity of 99.64%, precision of 99.55%, F1 score of 99.10% and AUC of 99.14%. Among the architectures, fine-tuned ResNet101 showed the lowest performance with accuracy of 42.25%, sensitivity of 44.84%, specificity of 40.15%, precision of 37.88%, F1 score of 41.07% and AUC of 42.49%. The classification results for all fine-tuned architectures in the study are given in Table 1.
In the study dataset used, the images were divided into two classes as COVID-19 and non-COVID-19. Fine-tuned Xception, DenseNet201, DenseNet121, DenseNet169, ResNet101, ResNet50, VGG16, VGG19, InceptionV3, InceptionResNetV2, MobileNetV2 architectures were used in the classification. The architectures (fine-tuned ResNet101, NasNetLarge, NasNetMobile) that did not work well with the SARS-COV-2 Ct-Scan dataset were newly fine-tuned, but NasNetLarge and NasNetMobile, which still did not perform well, were not included in the study. The performance of the architectures was evaluated using accuracy, sensitivity, specificity, precision, F1 score and AUC. Learning curves, confusion matrices and ROC curves were obtained.
The architecture with the highest performance was fine-tuned DenseNet201 with accuracy of 99.13%, sensitivity of 99.86%, specificity of 98.52%, precision of 98.28%, F1 score of 99.07% and AUC of 99.19%, while the architecture with the lowest performance was fine-tuned VGG19 with accuracy of 92.47%, sensitivity of 99.79%, specificity of 86.25%, precision of 86.03%, F1 score of 92.40% and AUC of 93.02%. The performance measures obtained by different fine-tuned CNN architectures for the study dataset are given in Table 2.
The model graph of the fine-tuned DenseNet201 architecture is given in Figure 5.
The structure of the learning curves can be used to examine the behaviour of the architecture and to suggest adjustments that can be made to improve training performance. The learning curves for the training process of the fine-tuned DenseNet201 architecture for the SARS-COV-2 Ct-Scan dataset are given in Figure 6.
The learning curves of the fine-tuned DenseNet201 architecture for the study dataset are given in Figure 7.
The confusion matrices of the fine-tuned DenseNet201 architecture for the SARS-COV-2 Ct-Scan dataset and the study dataset are given in Figure 8.
The ROC curves of the fine-tuned DenseNet201 architecture for the SARS-COV-2 Ct-Scan dataset and the study dataset are given in Figure 9.
4. Discussion
In this study, we present automatic methods that can be used for accurate and fast classification of patients with COVID-19 pneumonia and non-COVID-19 from lung CT images using fine-tuned CNN architectures.
In the study with the SARS-CoV-2 CT-scan dataset, good results were obtained with performance metrics above 90% with all but three architectures that did not work well. When the results obtained for the study dataset were evaluated, it was determined that all architectures operated with performance metrics above 90%.
Comparing this study with the studies in the literature, it was observed that the results for the DenseNet201 architecture were mostly higher or very close to the results in the literature with the fine-tuning we performed on both the SARS-CoV-2 CT-scan dataset and the study dataset. The reasons for this difference were interpreted as the use of different datasets, different fine-tuning, hyperparameter adjustments, the balance of labelled data in the dataset and the effects of dataset sizes on performance. All architectures used in the study are very successful in image classification due to their deep layered structures and are frequently used in the literature. It can be said that the results obtained may vary as a result of the hyperparameters determined and adjusted according to the dataset, the nature of the problem, algorithm differences, random and independent separation of the train-test dataset for each study. Although there are different results, it has beenproven in many studies that CNN architectures, due to their deep structure, perform well in image classification tasks with performance metrics above 90% and even reaching 100% with appropriate fine-tuning.
For future studies, it is planned to work with datasets with more diversity, i.e. more labels, to split the train-test dataset in different ratios, to use different regularization methods, to make different hyperparameter adjustments, to use different architectures and to fine-tuning them accordingly. In addition, working with different medical data is among our future goals.
5. Conclusions
The results of the study showed that the CNN architectures used, the preprocessing methods applied to the image, the fine-tuning and the selected classifiers significantly affected the performance of the architectures. Deep learning provides accurate image classification without manual feature extraction. In addition, the most important feature that affects the success of deep CNN architectures is working with large datasets. Having more labelled training data and balanced dataset are the most important regulations affecting the success of deep learning methods. However, high performance as a result of the training process can be an indicator of overfitting and can be easily seen with learning curves. In order to reduce overfitting, the hyperparameters used when fine-tuning the CNN architecture must be carefully chosen and appropriate regularization methods are preferred. The most commonly used regularization method for this problem is to add a dropout layer between layers. Batch normalization and data augmentation methods are also frequently used to prevent overfitting. In addition, overfitting can be prevented with EarlyStopping, ReduceLROnPlateau, ModelCheckpoint functions to be used in the analysis. While multilayer architectures perform well on larger and more complex datasets, the risk of overfitting increases on smaller datasets. In this study, in order to avoid overfitting, each method mentioned above was used and the study dataset was kept large and balanced, and good results were obtained. When the results are analysed, taking into account the structure of the learning curves, the training process with each architecture went well and good results were obtained on the test dataset. As a result, it was determined that the architectures used in this study have good generalization capabilities and can respond to clinical problems in classifications made on image data. In addition, it was interpreted that the dataset used is generalizable in terms of COVID-19 and can be easily used in applications. In this study, it was revealed that the CNN method is an automatic decision mechanism that will help decision makers in the diagnosis of COVID-19 pneumonia using CT images, and thus, the disease can be diagnosed as soon as possible, treatment effectiveness can be increased, and the negativities caused by the disease can be prevented. With the studies to be carried out on the use of CNN in medical image analyses, the early diagnosis of COVID-19 pneumonia and other pneumonias will be further developed, and the use of CNNs as primary systems to assist clinicians will become widespread. For the diagnosis of COVID-19 pneumonia with radiological images, the use and development of CNN architectures will enable faster image classification, even as soon as the image is taken.
Author Contributions
Conceptualization, I.U. and L.T.; methodology, I.U.; software, I.U.; validation, I.U. and L.T.; formal analysis, I.U.; investigation, I.U.; resources, I.U.; data curation, I.U. and A.T.S.; writing—original draft preparation, I.U.; writing—review and editing, I.U., L.T. and A.T.S.; visualization, I.U.; supervision, L.T.; project administration, I.U. and L.T.; funding acquisition, I.U. and L.T. All authors have read and agreed to the published version of the manuscript.
Funding
This research was funded by Ondokuz Mayıs University Scientific Research Projects Unit, grant number PYO.TIP.1904.22.018.
Institutional Review Board Statement
The study was conducted in accordance with the Declaration of Helsinki, and approved by the Ethical Committee for Clinical Research of Ondokuz Mayis University (protocol code 2022/345 and 06.07.2022).
Informed Consent Statement
The requirement for informed consent was waived by the EthicalCommittee, with subjects having the opportunity to opt out.
Data Availability Statement
The study dataset associated with this article can be found, in the online version, at http://dx.doi.org/10.17632/mbnczn5rw3.1.
Conflicts of Interest
The authors declare no conflicts of interest.
Abbreviations
The following abbreviations are used in this manuscript:
| RT-PCR | Reverse transcription-polymerase chain reaction |
| CT | Conputed tomography |
| CNN | Convolutional neural network |
| 2D | Two dimensional |
References
- Chetoui, M.; Akhloufi, M. A. Explainable vision transformers and radiomics for covid-19 detection in chest x-rays. Journal of Clinical Medicine 2022, 11(11), 3013. [CrossRef]
- Meem, A. T.; Khan, M. M.; Masud, M.; Aljahdali, S. Prediction of Covid-19 Based on Chest X-Ray Images Using Deep Learning with CNN. Computer Systems Science and Engineering 2022, 1223-1240.
- Lee, M. H.; Shomanov, A.; Kudaibergenova, M.; Viderman, D. (2023). Deep learning methods for interpretation of pulmonary CT and X-ray images in patients with COVID-19-related lung involvement: a systematic review. Journal of Clinical Medicine 2023, 12(10), 3446. [CrossRef]
- Qian, X.; Wang, X.; et al. M3Lung-Sys: A deep learning system for multi-class lung pneumonia screening from CT imaging. IEEE Journal of Biomedical and Health Informatics 2020, 24(12), 3539-3550. [CrossRef]
- Saurabh, N.; Shetty, J. A review of intelligent medical imaging diagnosis for the COVID-19 infection. Intelligent Decision Technologies 2022, 16(1), 127-144.
- Jalehi, M. K.; Albaker, B. M. Highly accurate multiclass classification of respiratory system diseases from chest radiography images using deep transfer learning technique. Biomedical Signal Processing and Control 2023, 84, 104745. [CrossRef]
- Ai, T.; Yang, Z.; Hou, H.; Zhan, C.; Chen, C.; Lv, W. et al. Correlation of chest CT and RT-PCR testing for coronavirus disease 2019 (COVID-19) in China: a report of 1014 cases. Radiology 2020, 296(2), E32-E40. [CrossRef]
- Dong, D.; Tang, Z.; Wang, S.; Hui, H.; Gong, L.; Lu, Y. et al. The role of imaging in the detection and management of COVID-19: a review. IEEE reviews in biomedical engineering 2020, 14, 16-29. [CrossRef]
- Islam, M. M.; Karray, F.; Alhajj, R.; Zeng, J. A review on deep learning techniques for the diagnosis of novel coronavirus (COVID-19). Ieee Access 2021, 9, 30551-30572. [CrossRef]
- Clark, S.; Kamalinejad, E.; Magpantay, C.; Sahota, S.; Zhong, J.; Hu, Y. A Review of CNN on Medical Imaging to Diagnose COVID-19 Infections. In Proceedings of ISCA 34th International Conference on (Vol. 79, pp. 91-98) (November, 2021).
- Liu, S.; Cai, T.; Tang, X.; Wang, C. MRL-Net: Multi-Scale Representation Learning Network for COVID-19 Lung CT Image Segmentation. IEEE Journal of Biomedical and Health Informatics 2023, 27(9), 4317-4328. [CrossRef]
- Fallahpoor, M.; Chakraborty, S.; Heshejin, M. T.; Chegeni, H.; Horry, M. J.; Pradhan, B. Generalizability assessment of COVID-19 3D CT data for deep learning-based disease detection. Computers in Biology and Medicine 2022, 145, 105464. [CrossRef]
- Ardakani, A. A.; Kanafi, A. R.; Acharya, U. R.; Khadem, N.; Mohammadi, A. Application of deep learning technique to manage COVID-19 in routine clinical practice using CT images: Results of 10 convolutional neural networks. Computers in biology and medicine 2020, 121, 103795. [CrossRef]
- Apostolopoulos, I. D.; Mpesiana, T. A. Covid-19: automatic detection from x-ray images utilizing transfer learning with convolutional neural networks. Physical and engineering sciences in medicine 2020, 43(2), 635-640. [CrossRef]
- Horry, M. J.; Chakraborty, S.; Paul, M.; Ulhaq, A.; Pradhan, B.; Saha, M.; Shukla, N. X-ray image based COVID-19 detection using pre-trained deep learning models, 2020, https://doi.org/10.31224/osf.io/wx89s.
- Punn, N. S.; Agarwal, S. Automated diagnosis of COVID-19 with limited posteroanterior chest X-ray images using fine-tuned deep neural networks. Applied Intelligence 2021, 51(5), 2689-2702. [CrossRef]
- Narin, A.; Kaya, C.; Pamuk, Z. Automatic detection of coronavirus disease (COVID-19) using X-ray images and deep convolutional neural networks. Pattern Anal Applic 2021, 24, 1207–1220. [CrossRef]
- Asif, S.; Zhao, M.; Tang, F. et al. A deep learning-based framework for detecting COVID-19 patients using chest X-rays. Multimedia Systems 2022, 28, 1495–1513. [CrossRef]
- Keerthana, R.; Gladston, A.; Nehemiah, H. K. Transfer learning-based CNN diagnostic framework for diagnosis of COVID-19 from lung CT images. The Imaging Science Journal 2022, 70(7), 413-438. [CrossRef]
- Huang, M. L.; Liao, Y. C. A lightweight CNN-based network on COVID-19 detection using X-ray and CT images. Computers in Biology and Medicine 2022, 146, 105604. [CrossRef]
- Kaur, J.; Kaur, P. A CNN Transfer Learning-Based Automated Diagnosis of COVID-19 From Lung Computerized Tomography Scan Slices. New Generation Computing 2023, 1-44. [CrossRef]
- Malik, H.; Anees, T.; Al-Shamaylehs, A. S.; Alharthi, S. Z.; Khalil, W.; Akhunzada, A. Deep Learning-Based Classification of Chest Diseases Using X-rays, CT Scans, and Cough Sound Images. Diagnostics 2023, 13(17), 2772. [CrossRef]
- Kathamuthu, N. D.; Subramaniam, S.; Le, Q. H.; Muthusamy, S.; Panchal, H.; Sundararajan, S. C. M. et al. A deep transfer learning-based convolution neural network model for COVID-19 detection using computed tomography scan images for medical applications. Advances in Engineering Software 2023, 175, 103317. [CrossRef]
- Hossain, M. M.; Walid, M. A. A.; Galib, S. S.; Azad, M. M.; Rahman, W.; Shafi, A. S. M.; Rahman, M. M. Covid-19 detection from chest ct images using optimized deep features and ensemble classification. Systems and Soft Computing 2024, 6, 200077. [CrossRef]
- Zolya, M. A.; Baltag, C.; Bratu, D. V.; Coman, S.; Moraru, S. A. COVID-19 Detection and Diagnosis Model on CT Scans Based on AI Techniques. Bioengineering 2024, 11(1), 79. [CrossRef]
- Joshi, K. K.; Gupta, K.; Agrawal, J. An efficient transfer learning approach for prediction and classification of SARS–COVID-19. Multimedia Tools and Applications 2024, 83(13), 39435-39457. [CrossRef]
- Yousefpanah, K.; Ebadi, M. J.; Sabzekar, S.; Zakaria, N. H.; Osman, N. A.; Ahmadian, A. An Emerging Network for COVID-19 CT-Scan Classification using an ensemble deep transfer learning model. Acta Tropica 2024, 107277. [CrossRef]
- Özkan, Y. Uygulamalı Derin Öğrenme. Papatya Yayıncılık Eğitim 2021, İstanbul.
- Koresh, H. J. Implementation and Efficient Analysis of Preprocessing Techniques in Deep Learning for Image Classification. Current Medical Imaging 2023, 20, e290823220482.
- Murcia-Gomez, D.; Rojas-Valenzuela, I.; Valenzuela, O. Impact of image preprocessing methods and deep learning models for classifying histopathological breast cancer images. Applied Sciences 2022, 12(22), 11375. [CrossRef]
- Joshi, A. M.; Nayak, D. R. MFL-Net: An Efficient Lightweight Multi-Scale Feature Learning CNN for COVID-19 Diagnosis From CT Images. IEEE Journal of Biomedical and Health Informatics 2022, 26(11), 5355-5363. [CrossRef]
- Shamrat, F. J. M.; Azam, S.; Karim, A.; Ahmed, K.; Bui, F. M.; De Boer, F. High-precision multiclass classification of lung disease through customized MobileNetV2 from chest X-ray images. Computers in Biology and Medicine 2023, 155, 06646. [CrossRef]
- Soares, E.; Angelov, P.; Biaso, S.; Froes, M. H.; Abe, D. K. SARS-CoV-2 CT-scan dataset: A large dataset of real patients CT scans for SARS-CoV-2 identification. MedRxiv 2020, 2020-04. [CrossRef]
- Sharma, A.; Singh, K.; Koundal, D. A novel fusion-based convolutional neural network approach for classification of COVID-19 from chest X-ray images. Biomedical Signal Processing and Control 2022, 77, 103778, 2022. [CrossRef]
- Taye, M. M. Theoretical understanding of convolutional neural network: concepts, architectures, applications, future directions. Computation 2023, 11(3), 52. [CrossRef]
- Kugunavar, S.; Prabhakar, C. J. Convolutional neural networks for the diagnosis and prognosis of the coronavirus disease pandemic. Visual computing for industry, biomedicine, and art 2021, 4(1), 12. [CrossRef]
- Khanday, N. Y.; Sofi, S. A. Deep insight: Convolutional neural network and its applications for COVID-19 prognosis. Biomedical Signal Processing and Control 2021, 69, 102814, 2021. [CrossRef]
- Ergin, T. Convolutional Neural Network (ConvNet yada CNN) nedir, nasıl çalışır. Medium 2018. Available online: https://medium. com/@ tuncerergin/convolutional-neural-network-convnetyada-cnn-nedir-nasil-calisir-97a0f5d34cad (accessed on 17 October 2024).
- Yamashita, R.; Nishio, M.; Do, R. K. G.; Togashi, K. Convolutional neural networks: an overview and application in radiology. Insights into imaging 2018, 9, 611-629. [CrossRef]
- Zhang, H.; Qie, Y. Applying Deep Learning to Medical Imaging: A Review. Applied Sciences 2023, 13(18), 10521. [CrossRef]
- Morid, M. A.; Borjali, A.; Del Fiol, G. A scoping review of transfer learning research on medical image analysis using ImageNet. Computers in Biology and Medicine 2021, 128, 104115. [CrossRef]
- Ayana, G.; Dese, K.; Choe, S. W. Transfer learning in breast cancer diagnoses via ultrasound imaging. Cancers 2021, 13(4), 738. [CrossRef]
- Wang, J.; Zhu, H.; Wang, S. H.; Zhang, Y. D. A review of deep learning on medical image analysis. Mobile Networks and Applications 2021, 26, 351-380. [CrossRef]
Figure 1.
General representation of the study for diagnosing COVID-19.
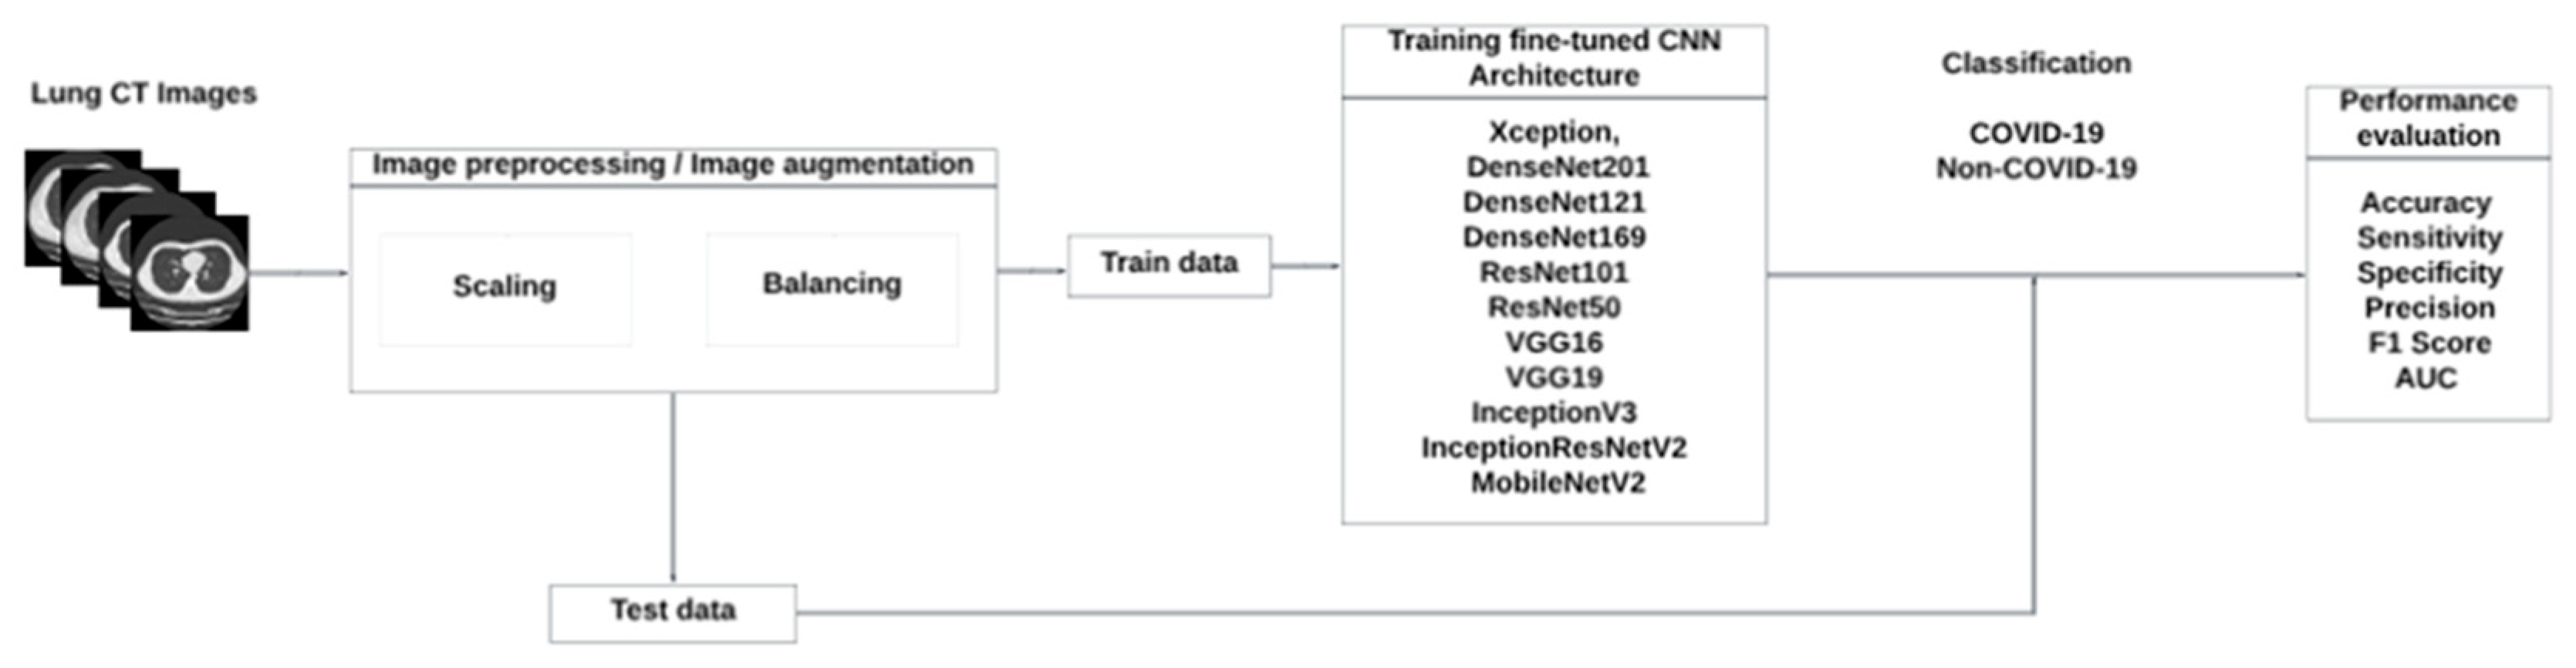
Figure 2.
Sample images of two classes in the dataset, (a) COVID-19 cases, (b) non-COVID-19 cases.
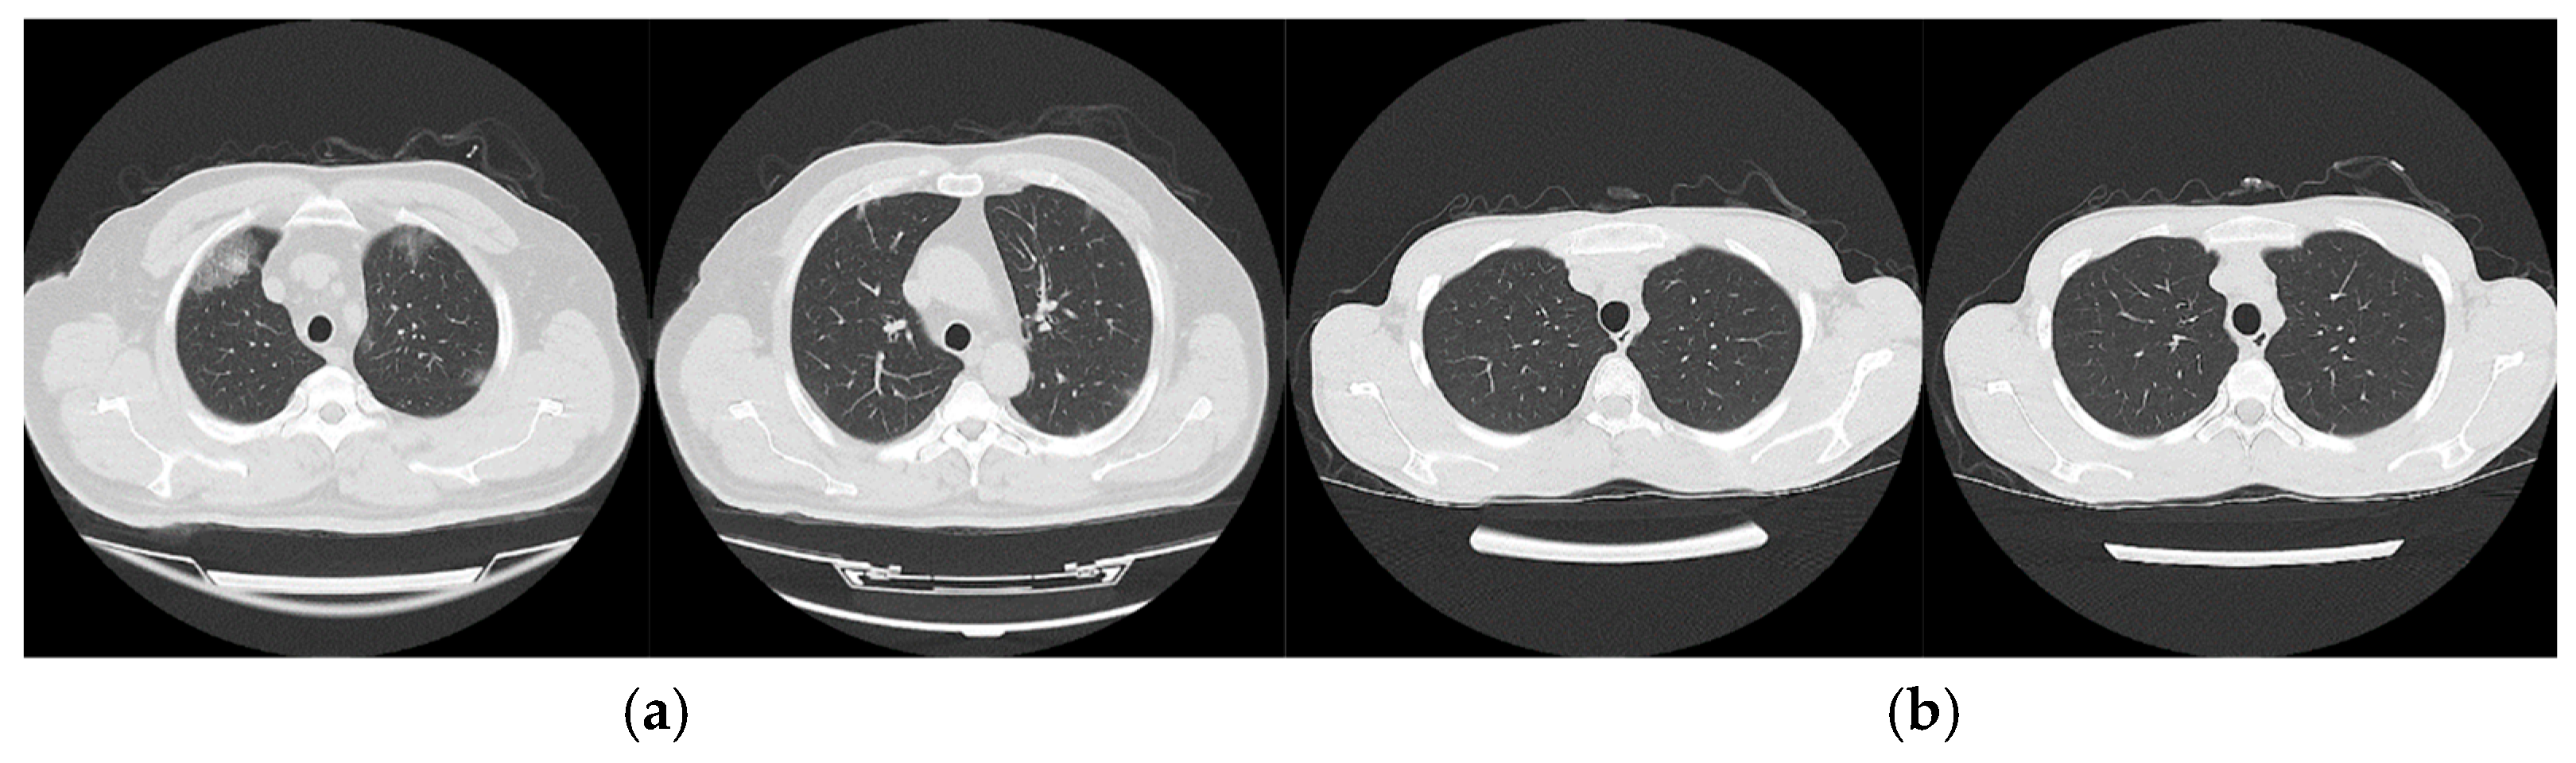
Figure 3.
CNN layers and general operation.
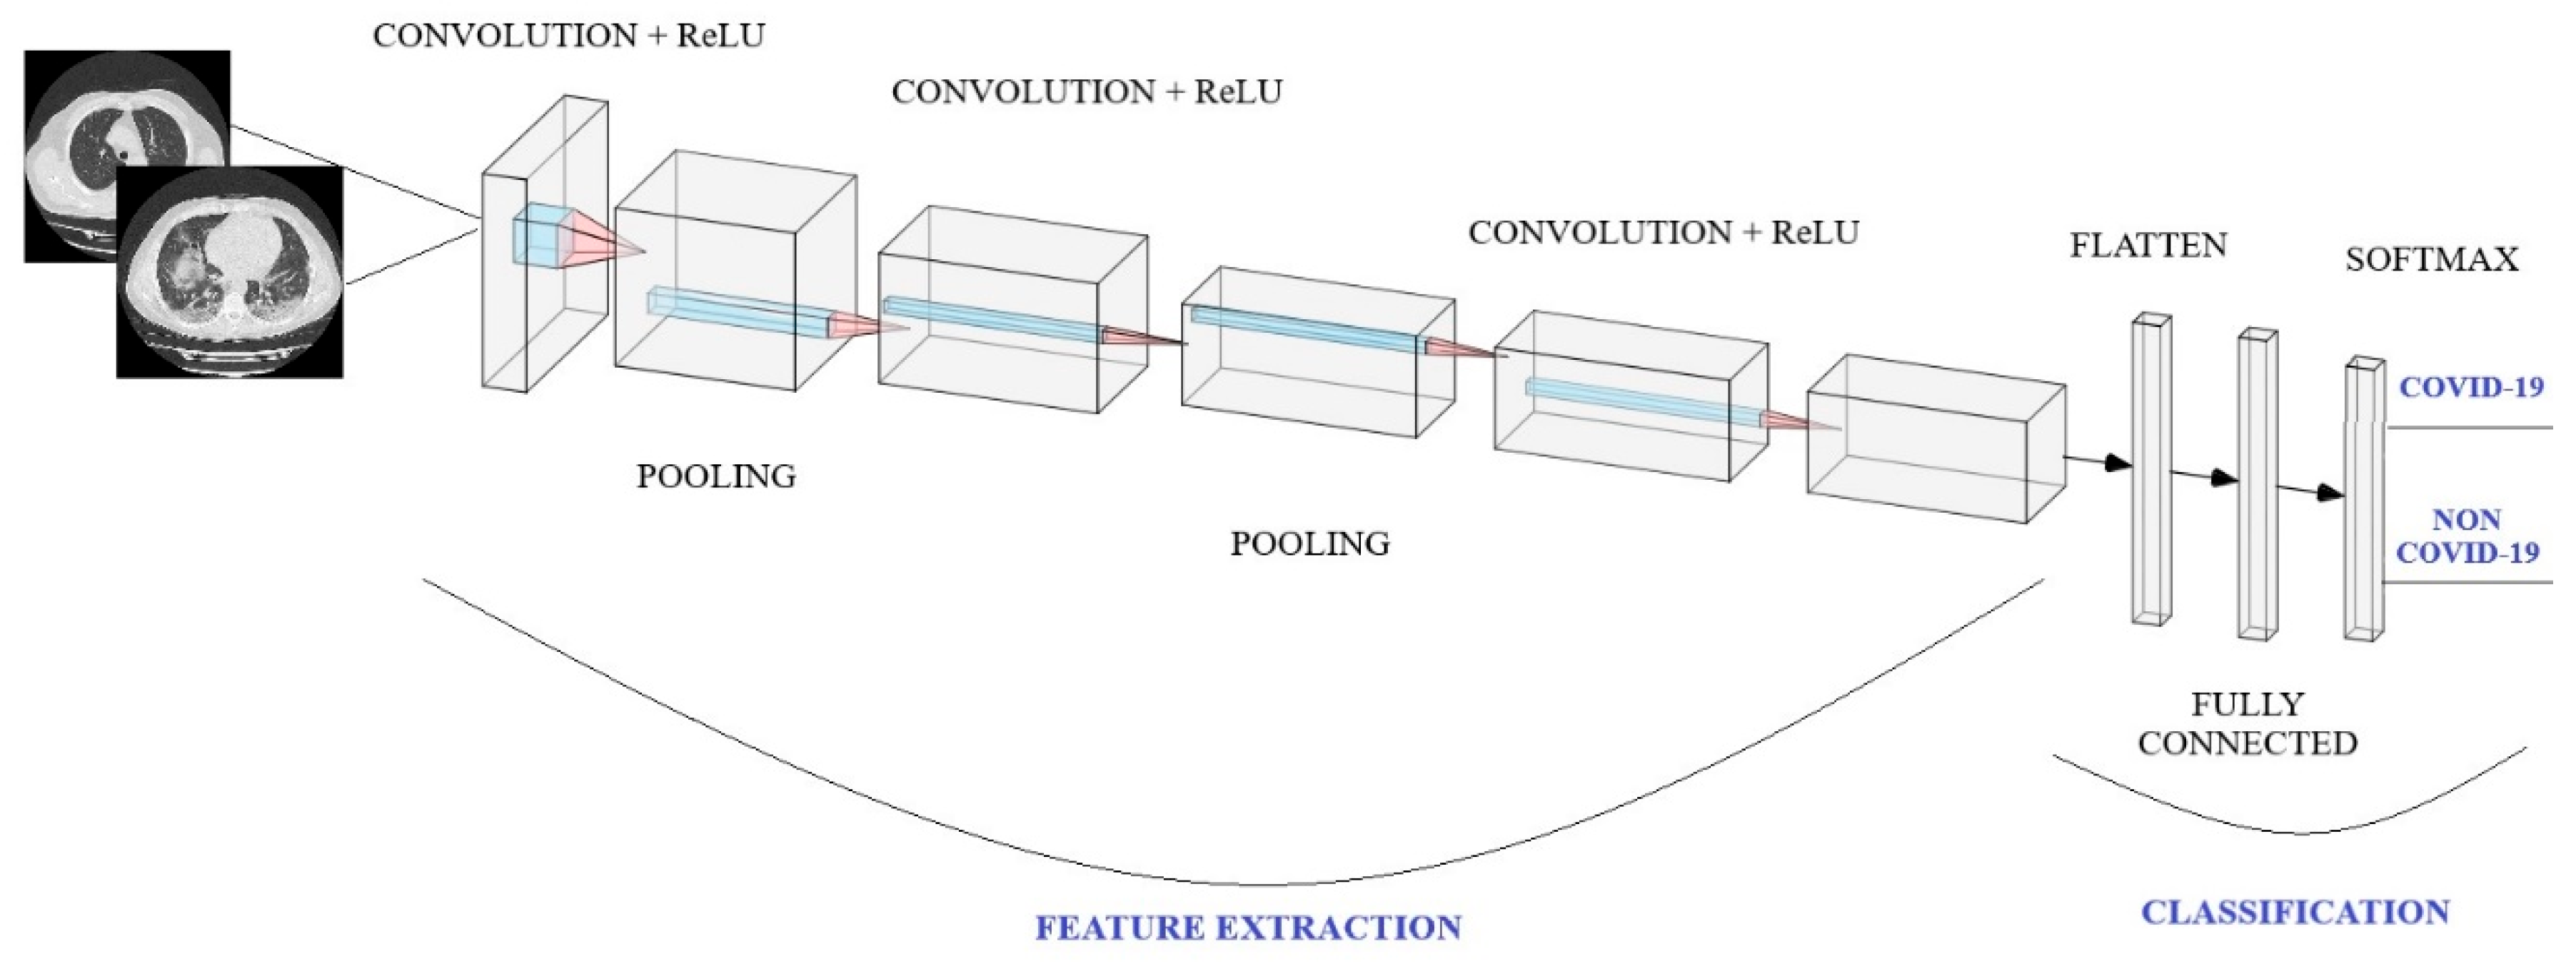
Figure 4.
CNN architecture and training process.
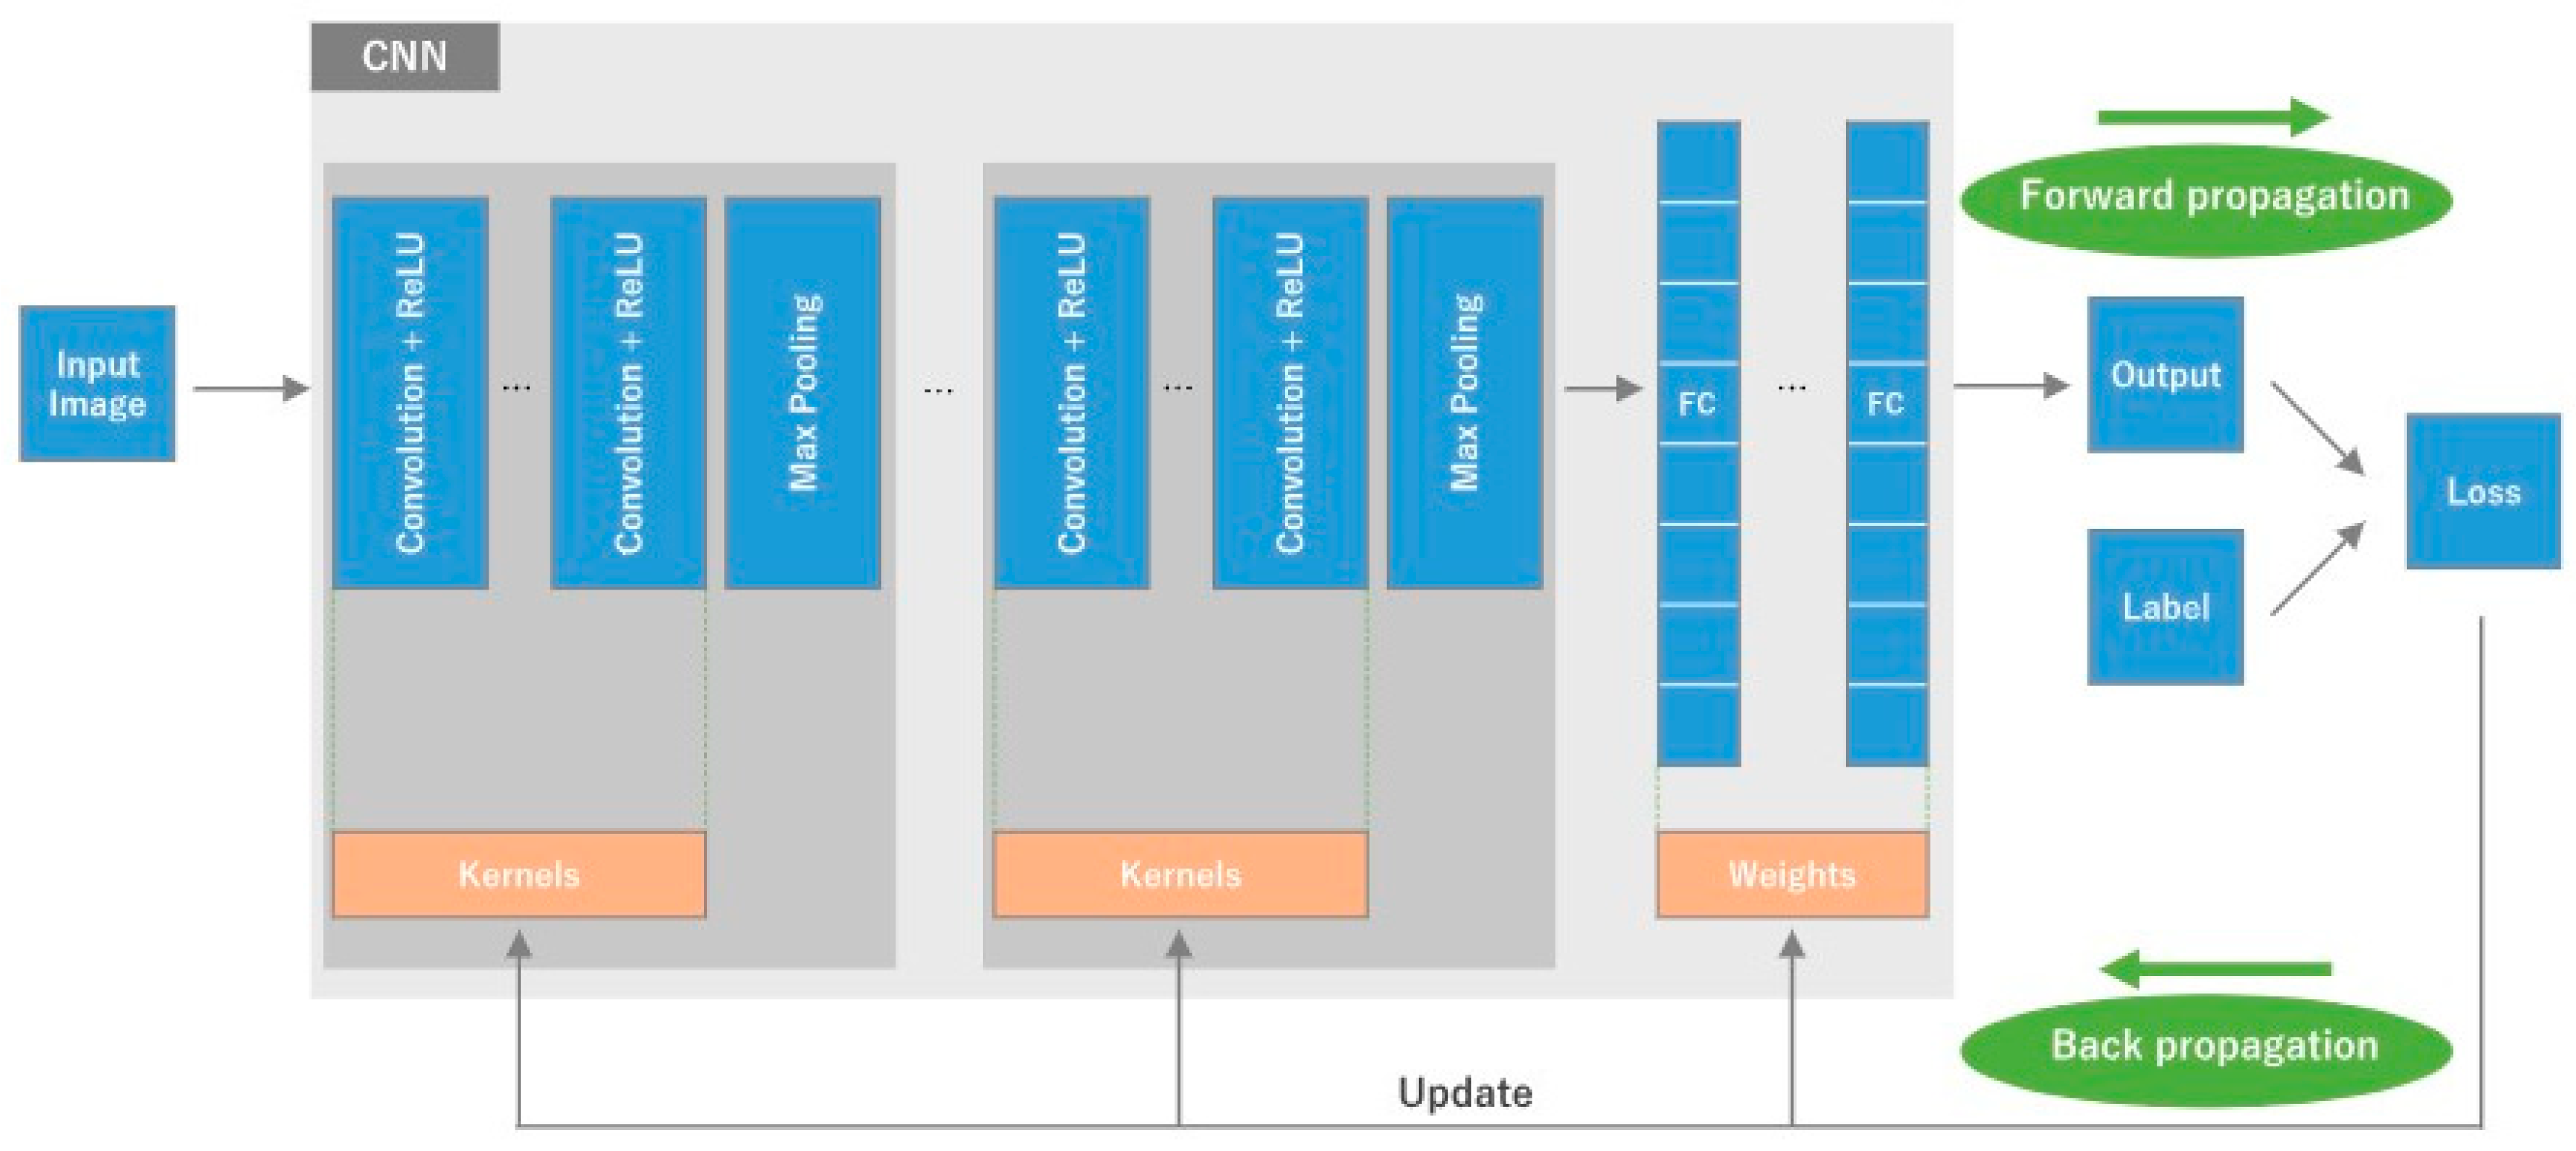
Figure 5.
Fine-tuned DenseNet201 architecture model graph.
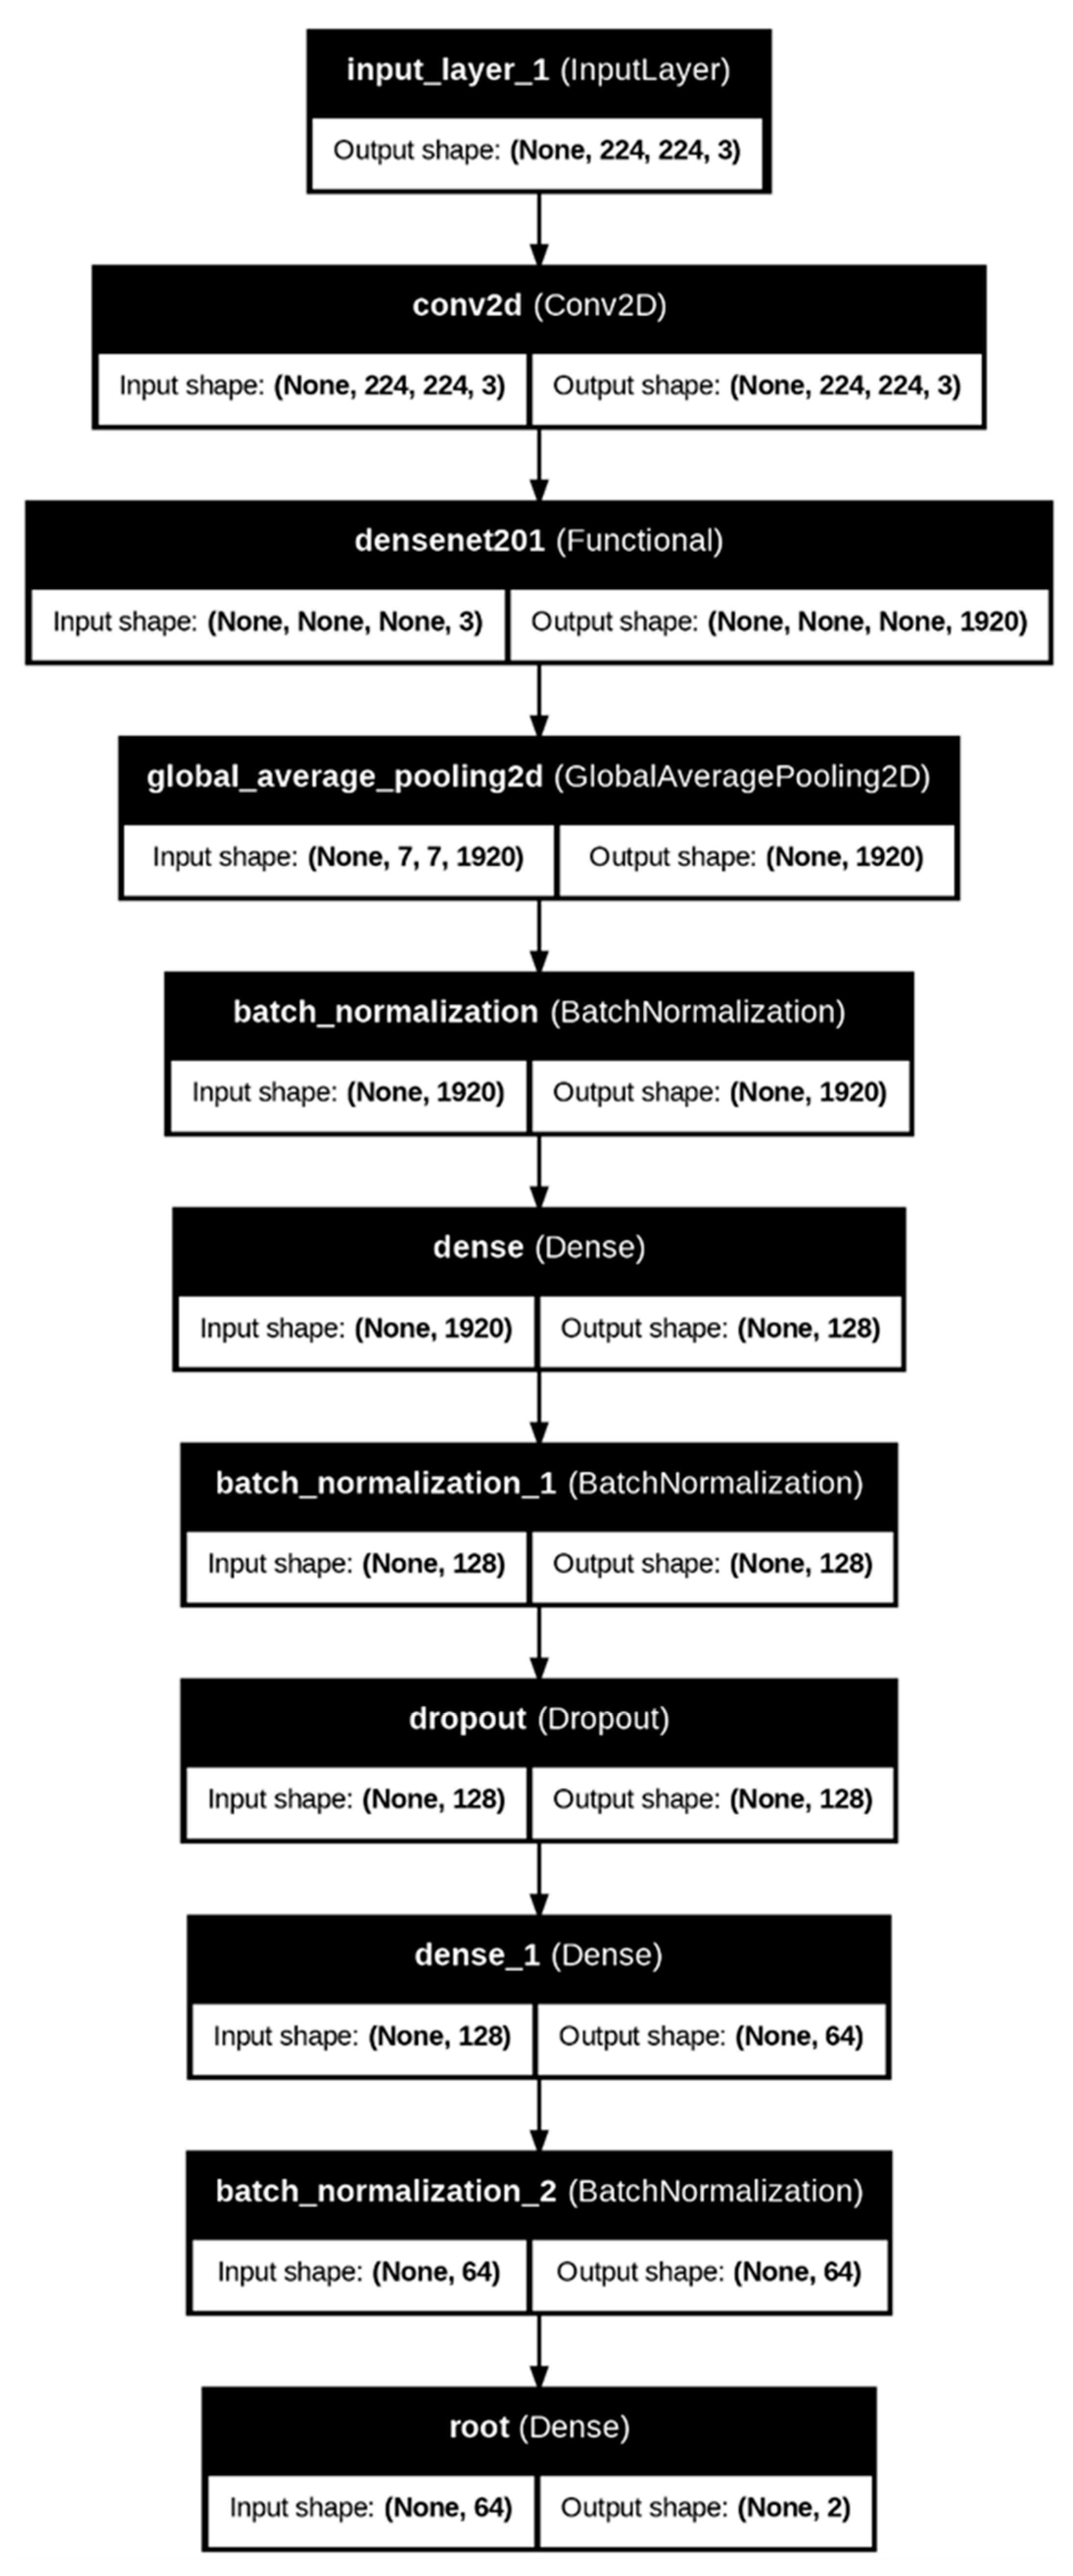
Figure 6.
Learning curves of DenseNet201 architecture for SARS-COV-2 Ct-Scan dataset.
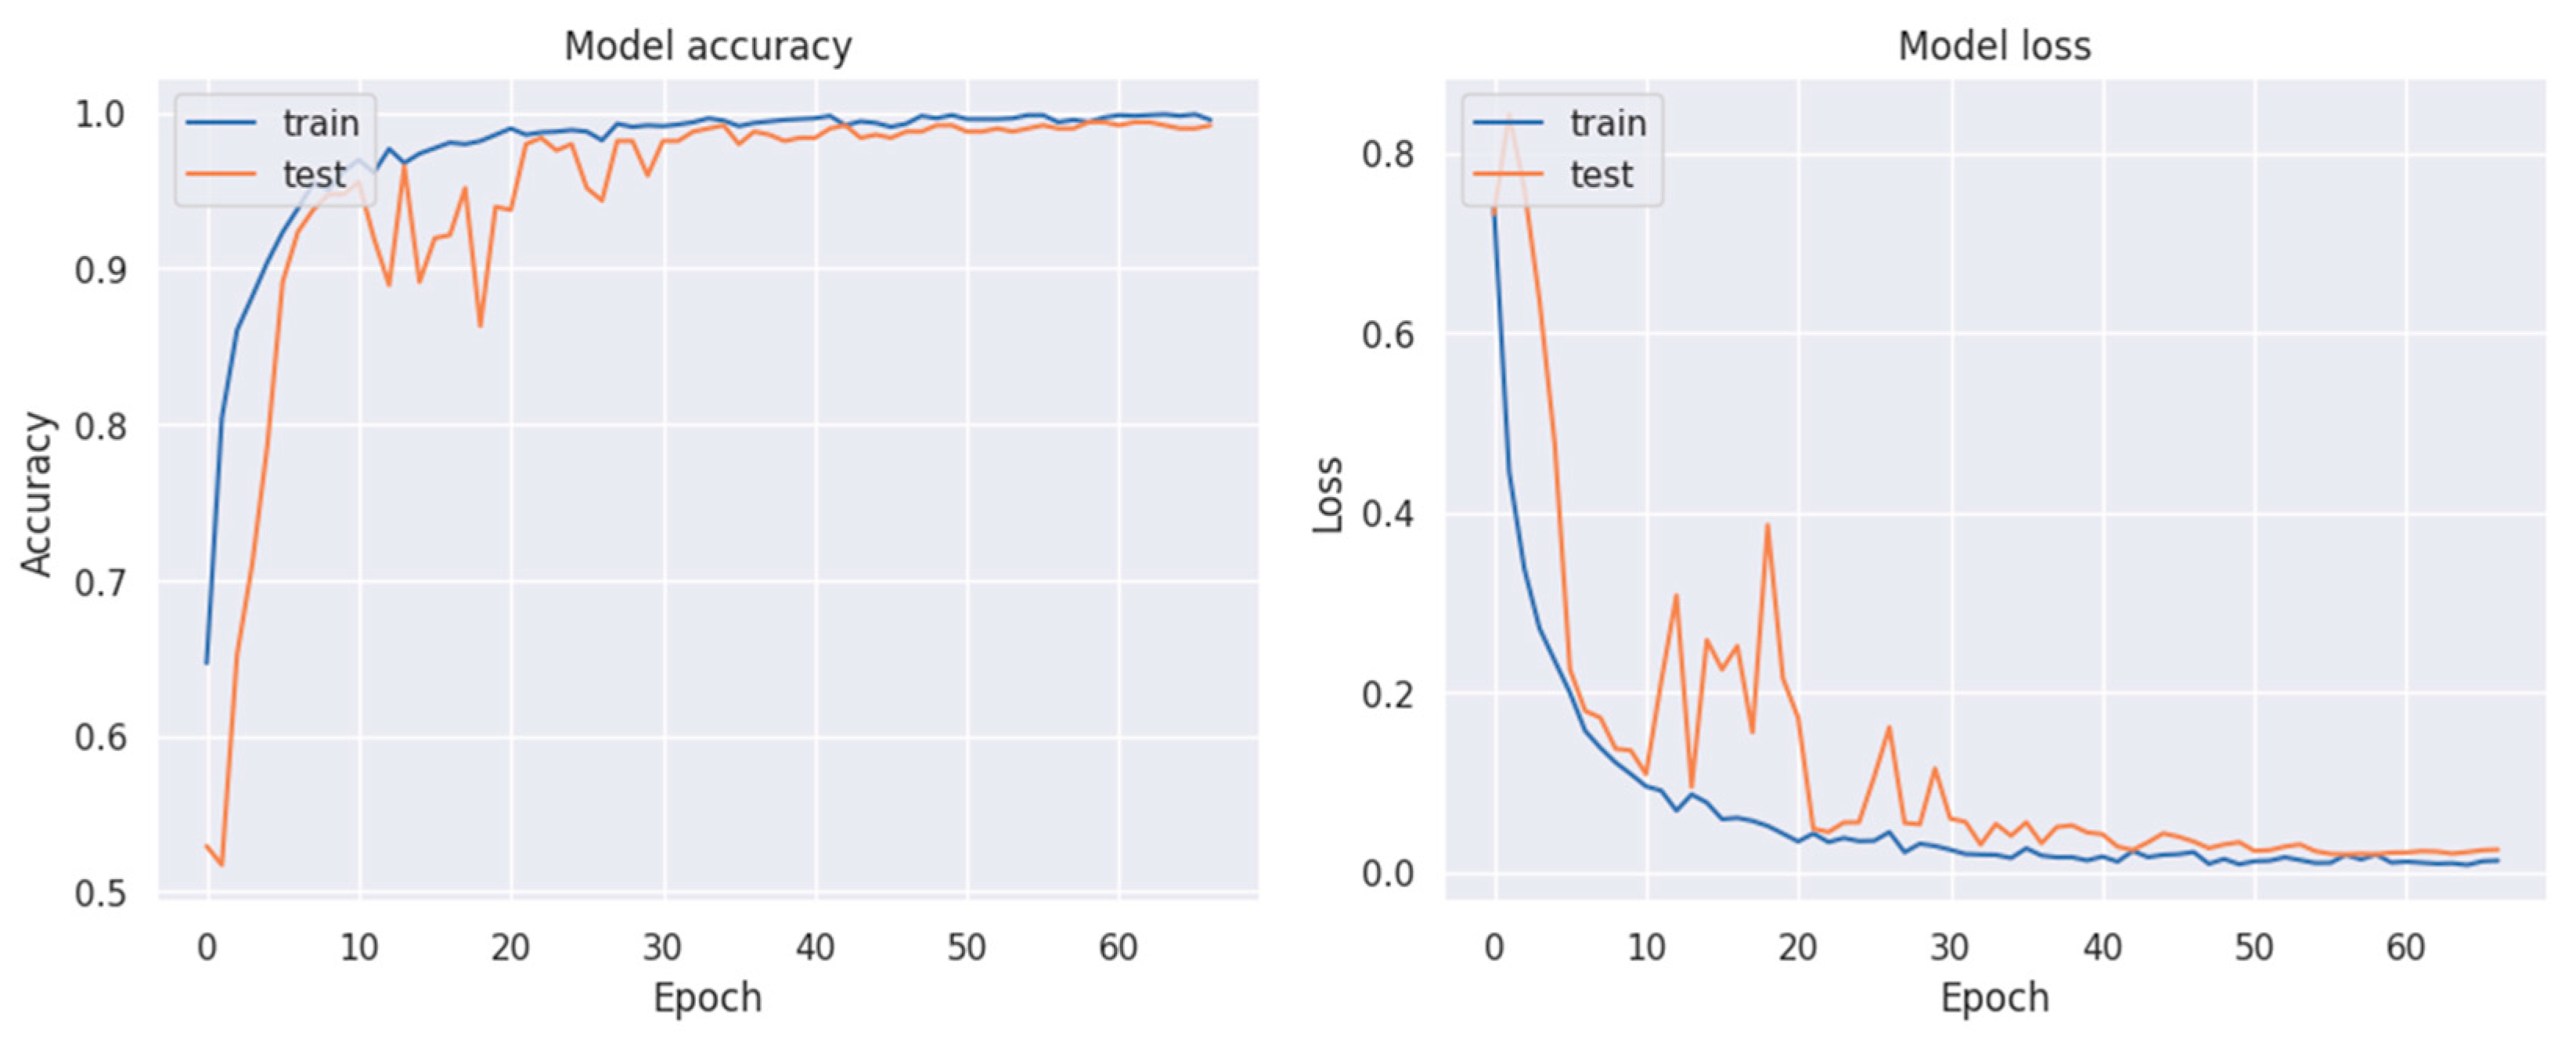
Figure 7.
Learning curves of the fine-tuned DenseNet201 architecture for the study dataset.
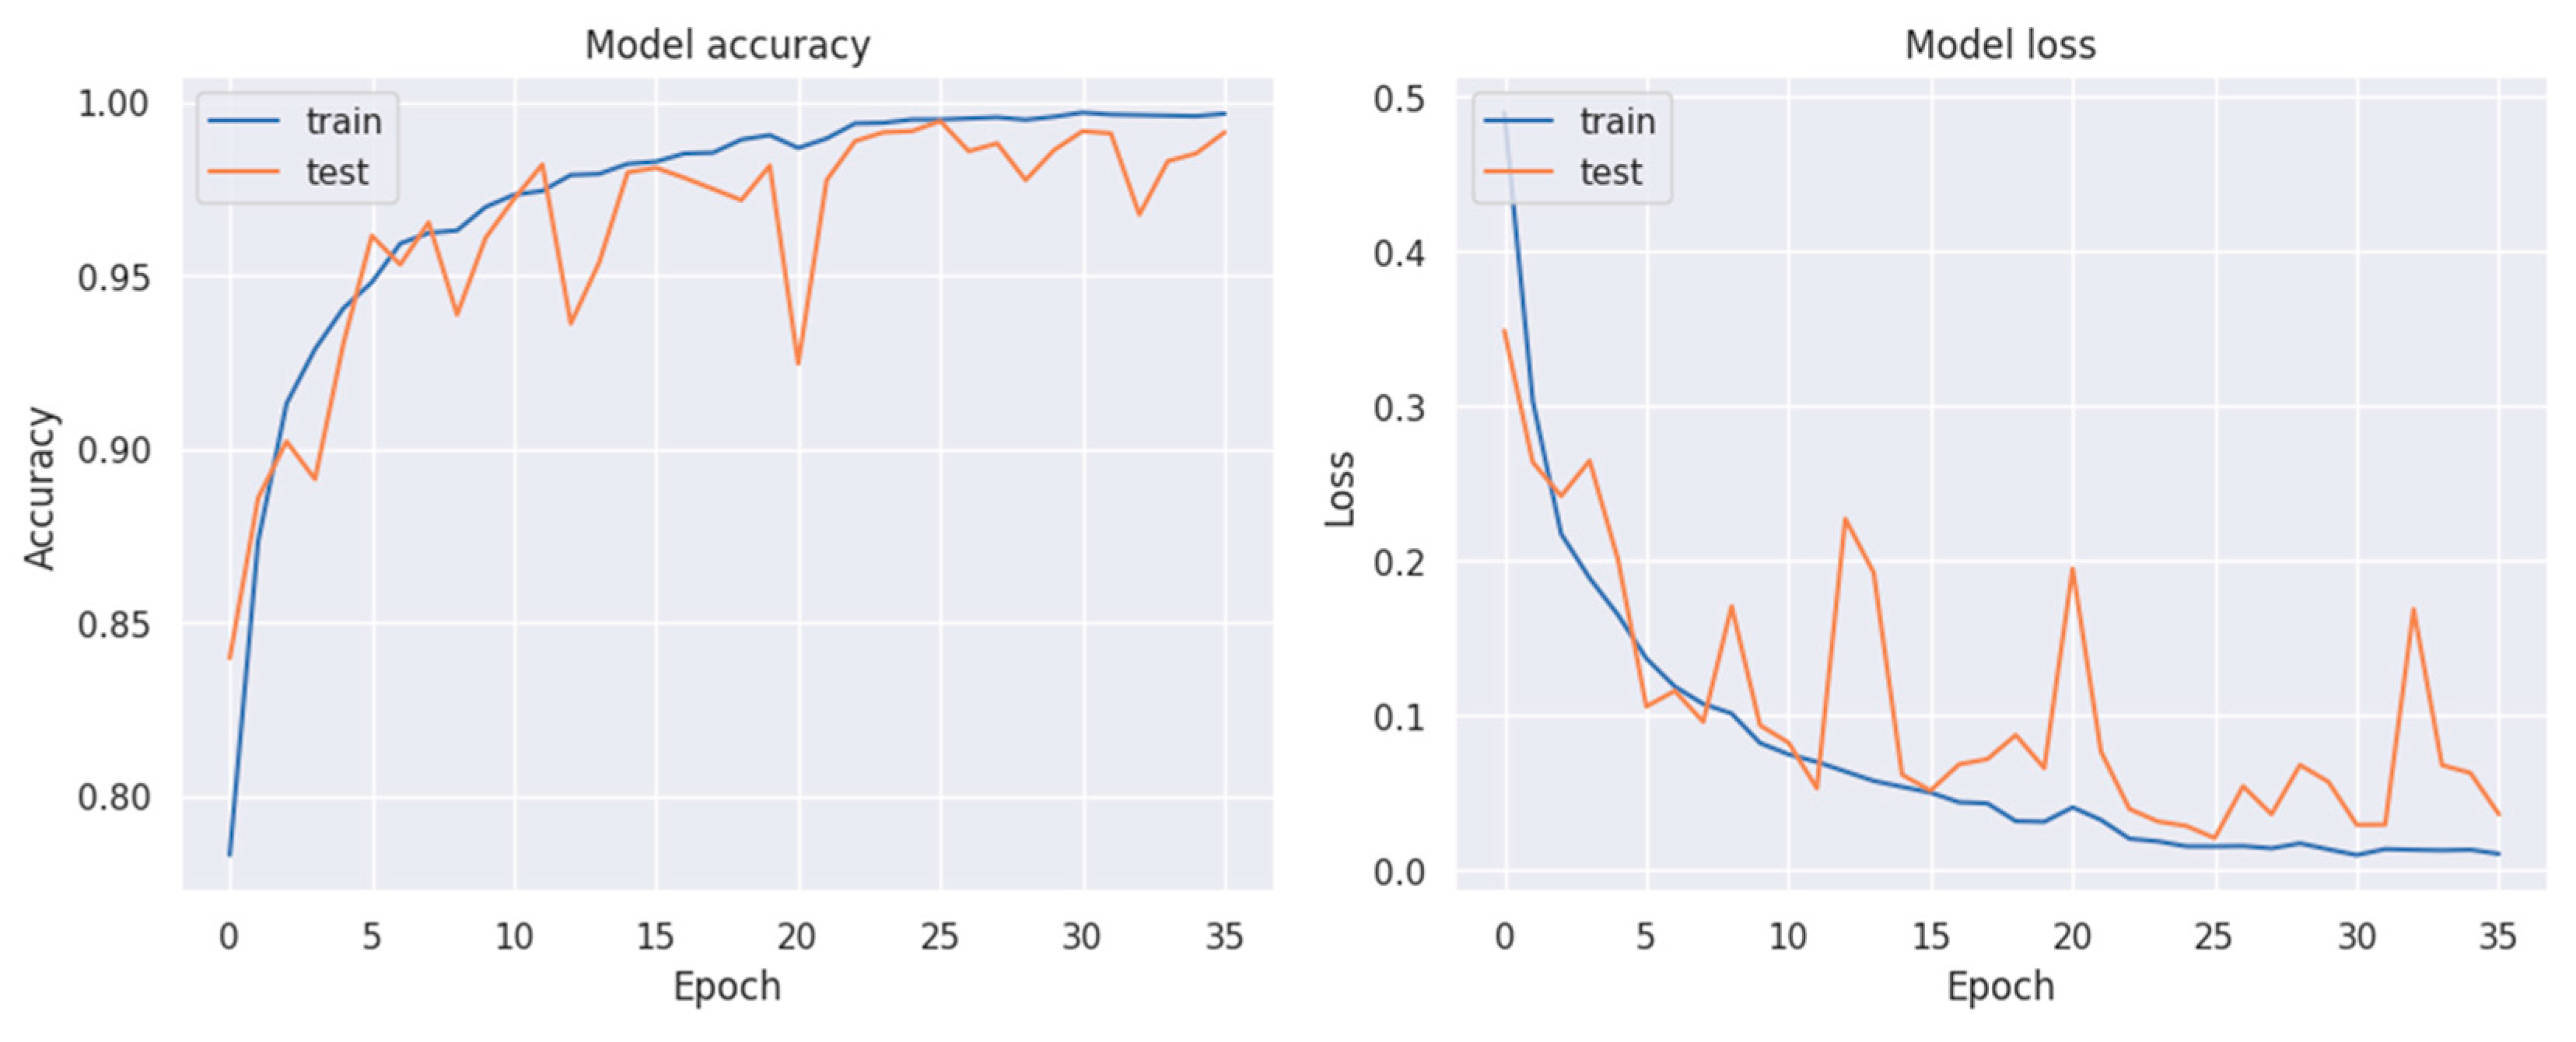
Figure 8.
(a) Confusion matrix of fine-tuned DenseNet201 architecture for SARS-COV-2 Ct-Scan dataset, (b) Confusion matrix of fine-tuned DenseNet201 architecture for the study dataset.
Figure 8.
(a) Confusion matrix of fine-tuned DenseNet201 architecture for SARS-COV-2 Ct-Scan dataset, (b) Confusion matrix of fine-tuned DenseNet201 architecture for the study dataset.
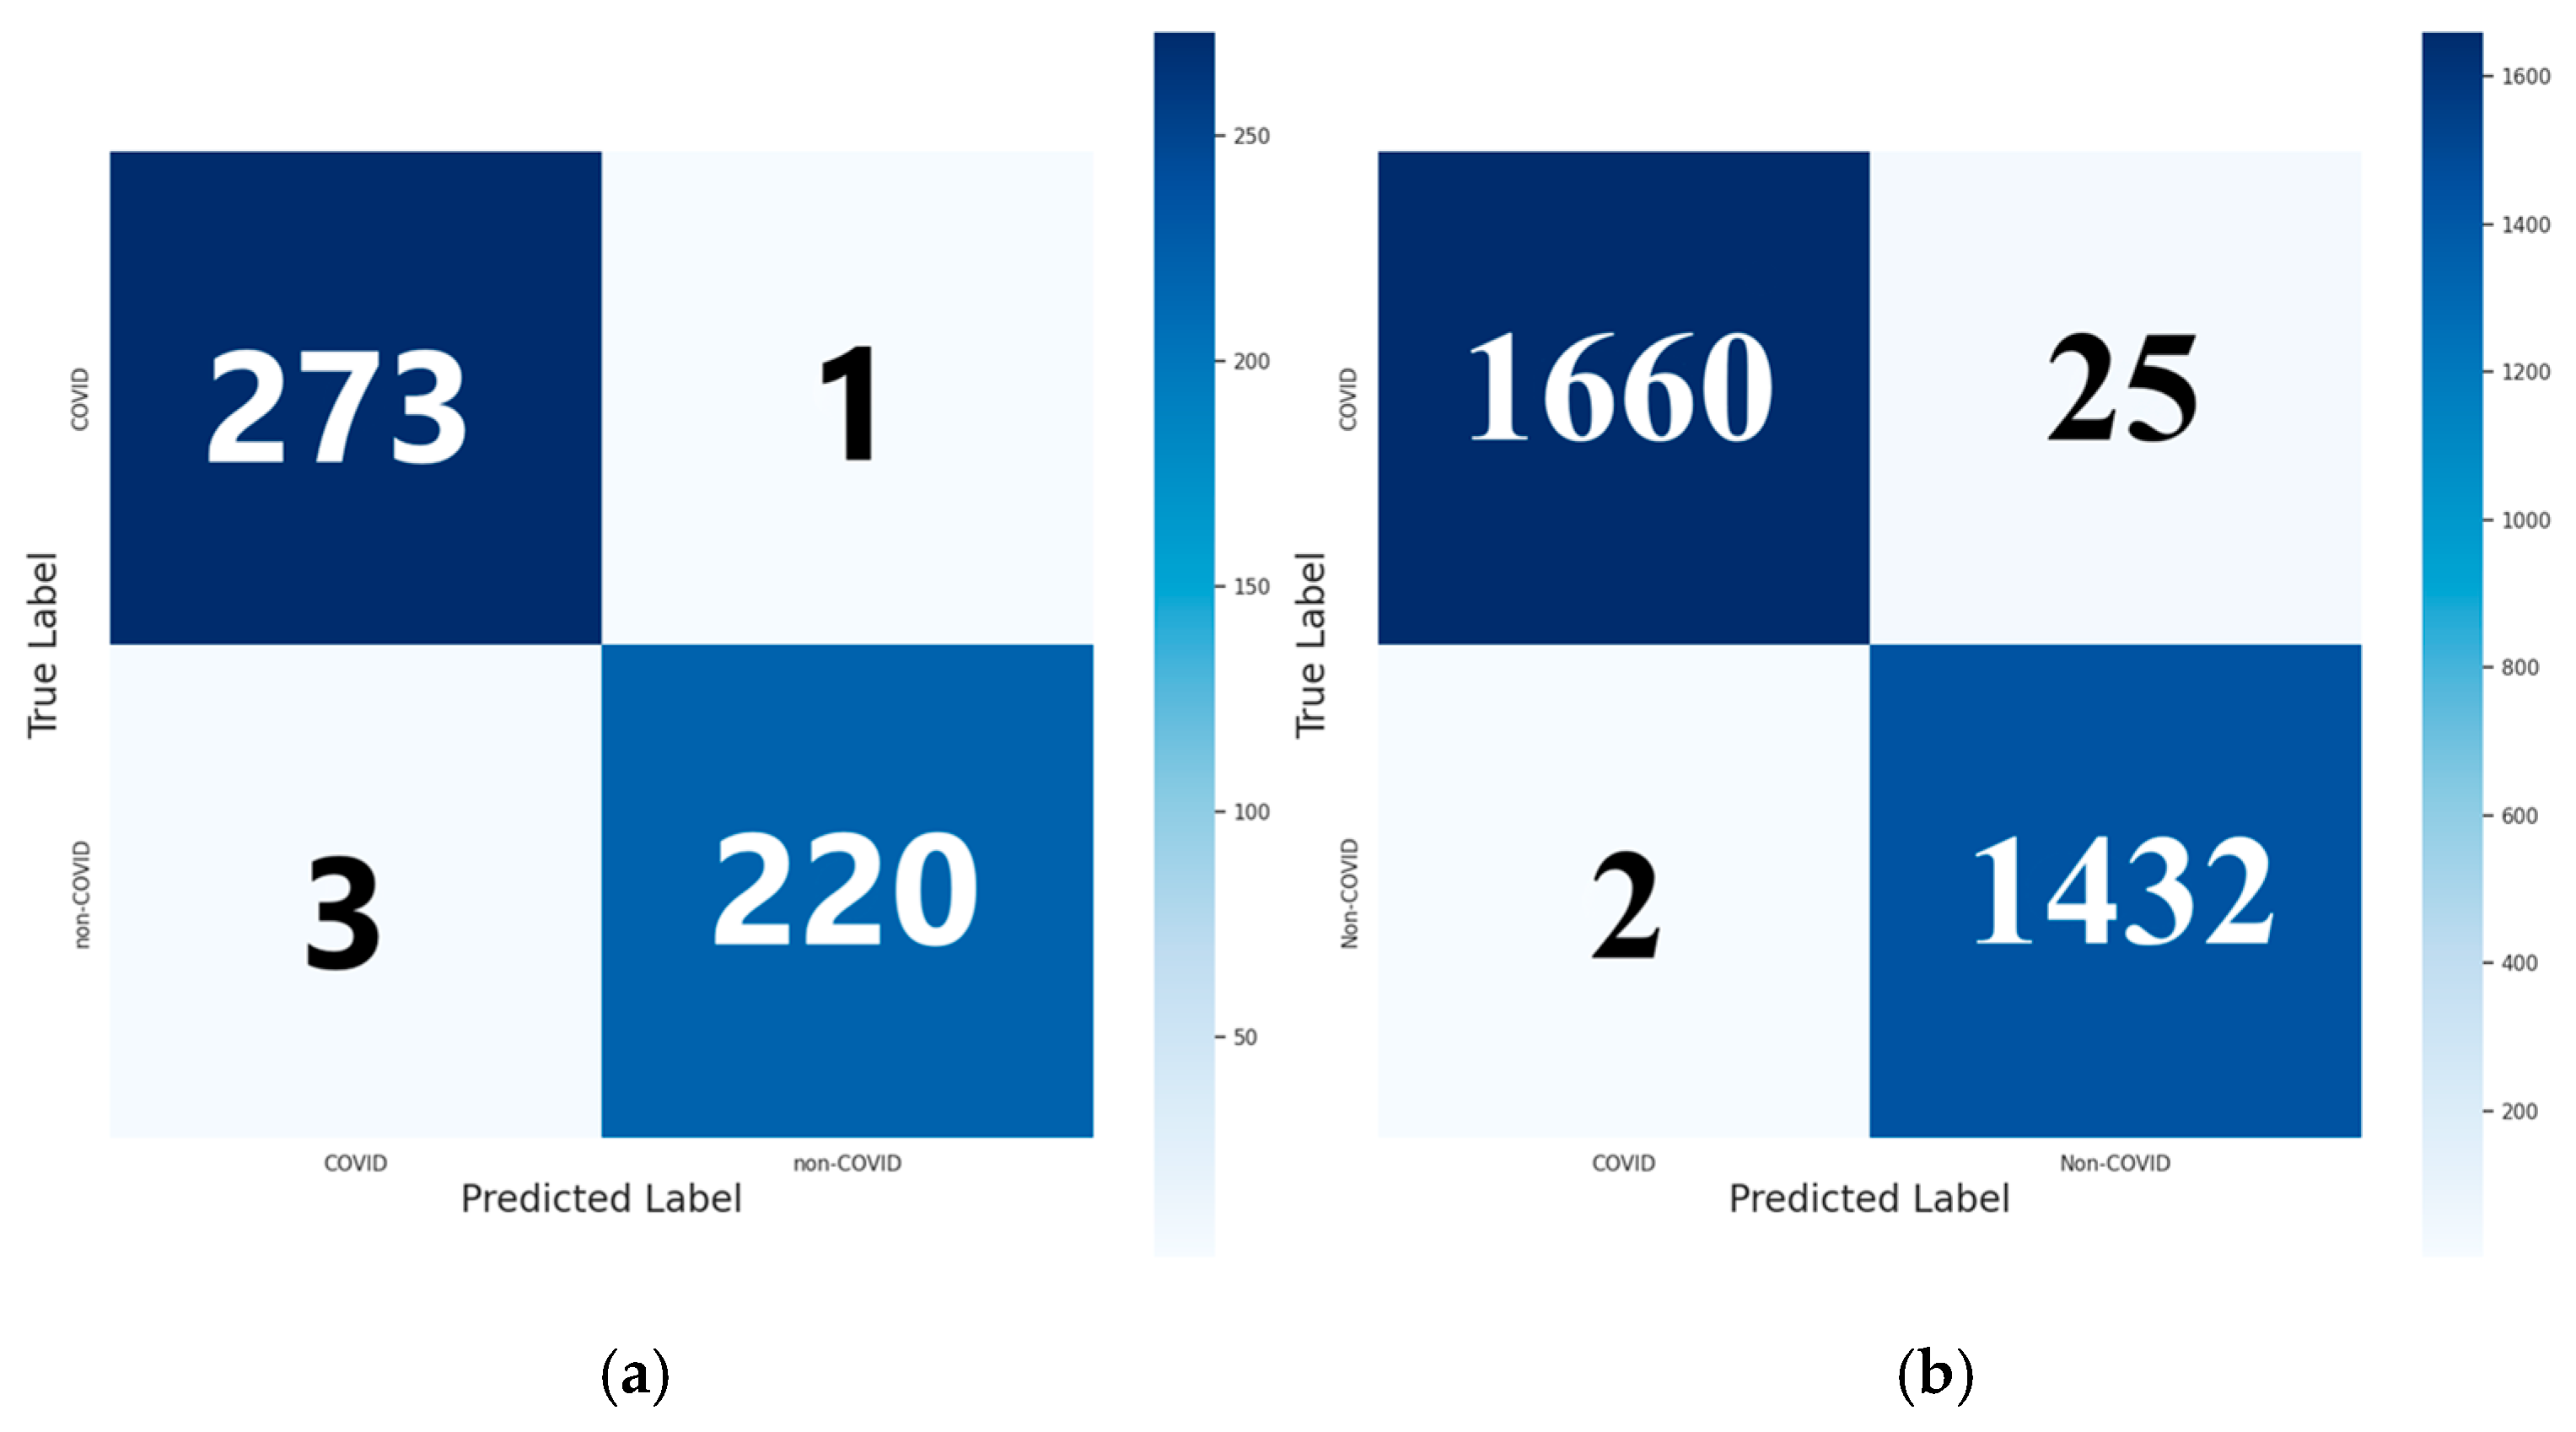
Figure 9.
(a) ROC curve of fine-tuned DenseNet201 architecture for SARS-COV-2 Ct-Scan dataset, (b) ROC curve of the fine-tuned DenseNet201 architecture for the study dataset.
Figure 9.
(a) ROC curve of fine-tuned DenseNet201 architecture for SARS-COV-2 Ct-Scan dataset, (b) ROC curve of the fine-tuned DenseNet201 architecture for the study dataset.
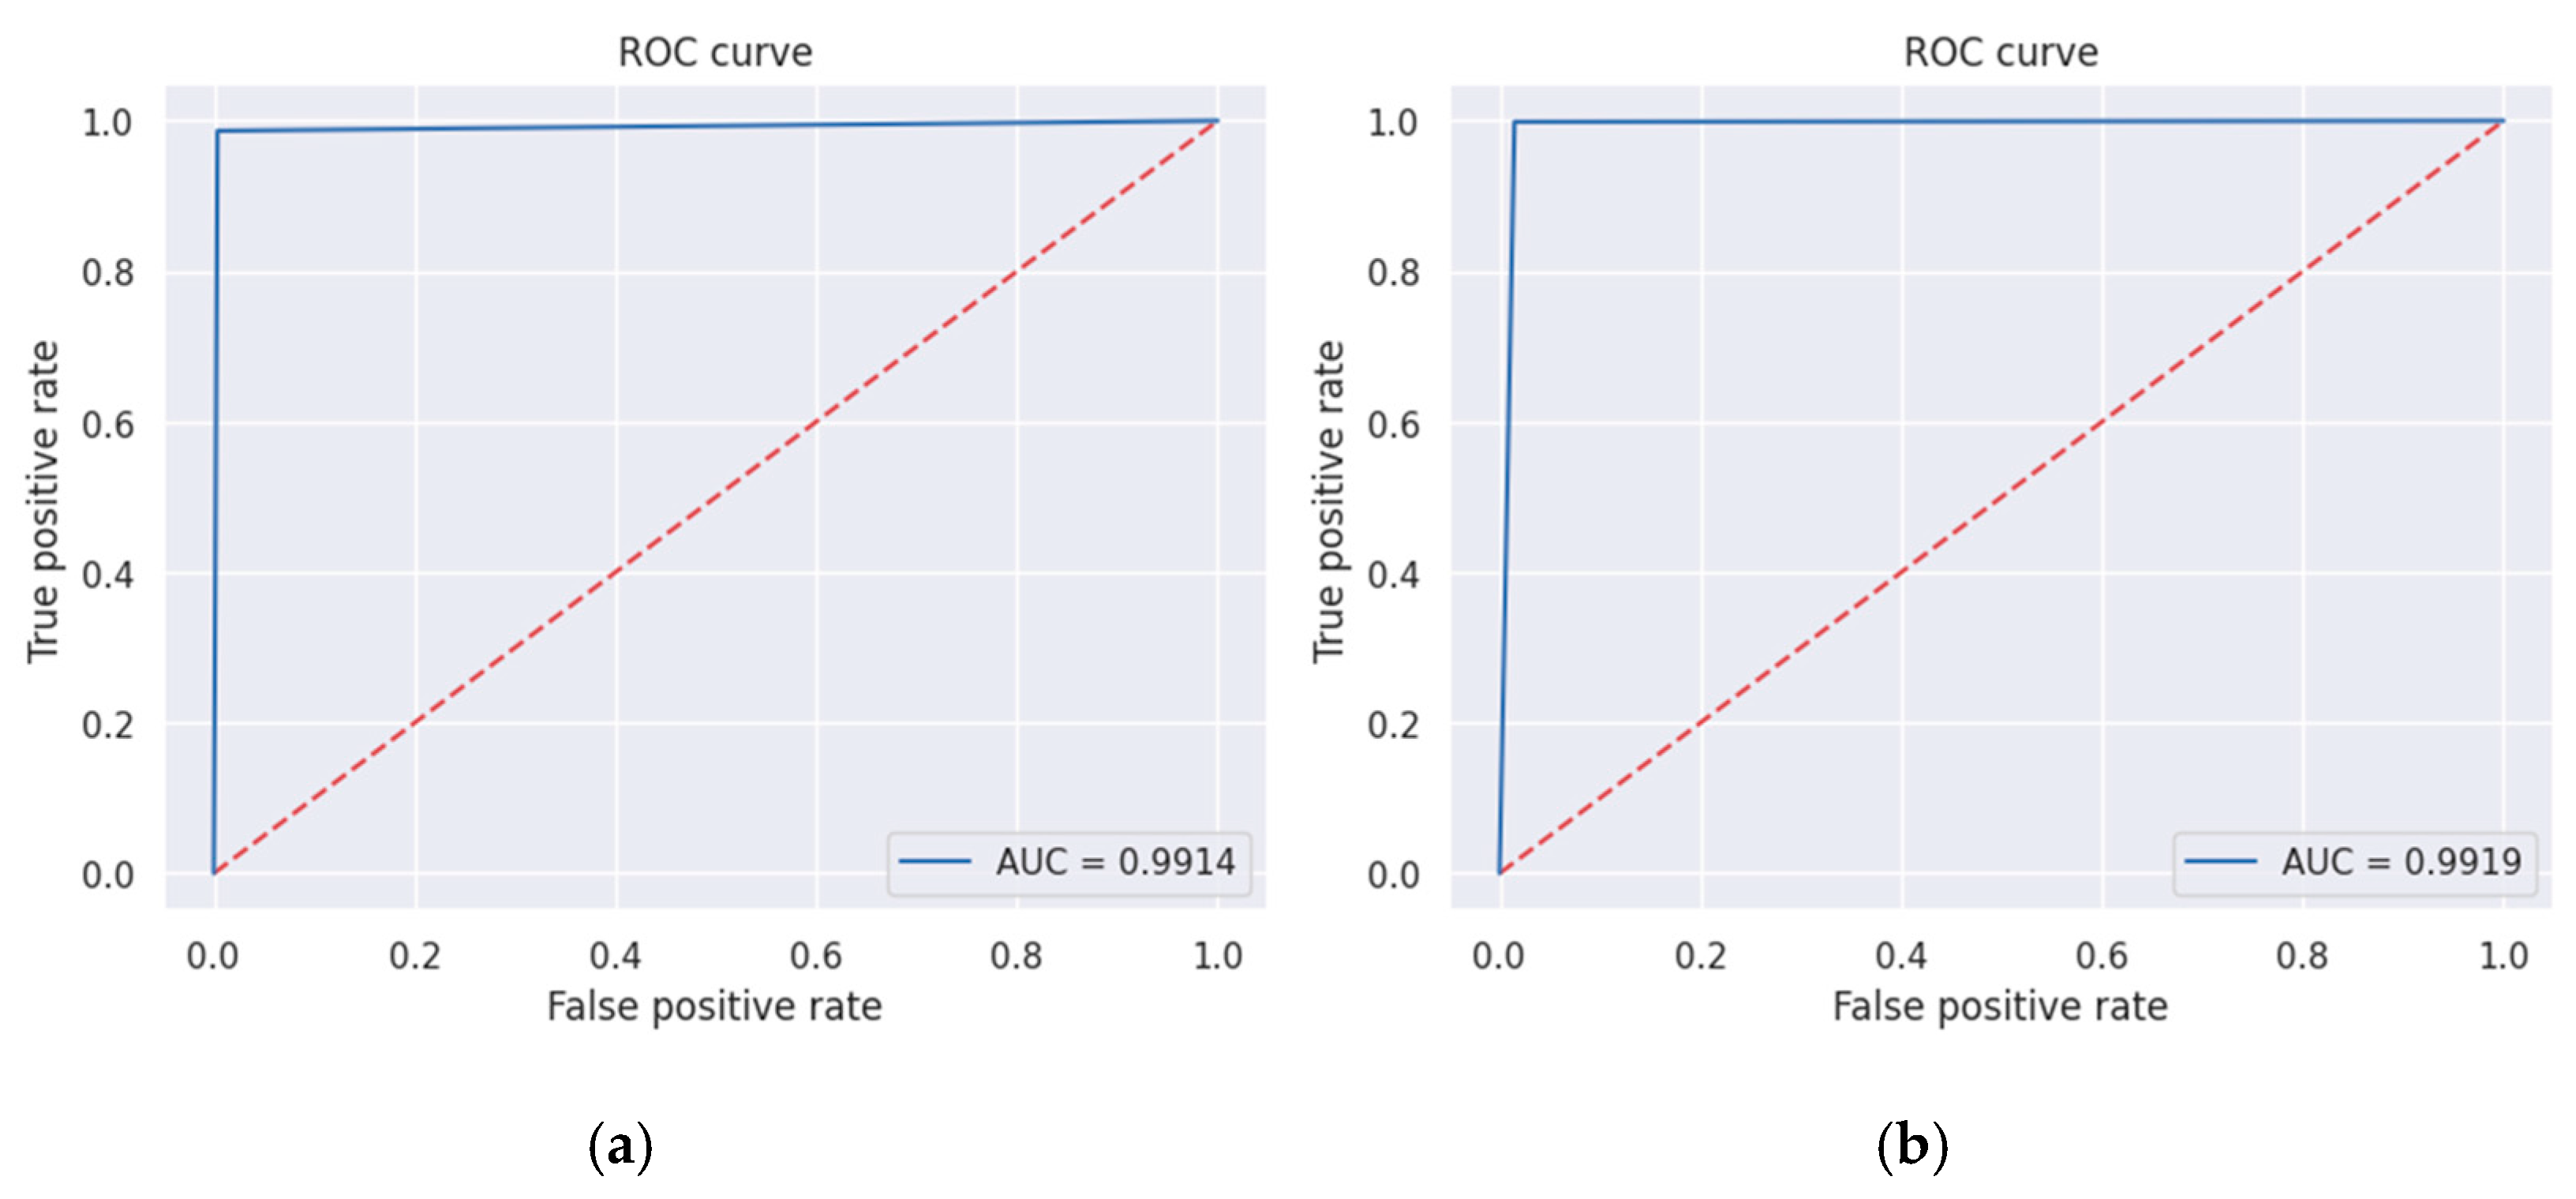

Table 1.
Classification results of CNN architectures for the SARS-COV-2 Ct-Scan dataset.
| Accuracy (%) | Sensitivity (%) | Specificity (%) | Precision (%) | F1 Score (%) | AUC (%) |
|
|---|---|---|---|---|---|---|
| Xception | 96.78 | 97.76 | 95.99 | 95.20 | 96.46 | 96.87 |
| DenseNet201 | 99.19 | 98.65 | 99.64 | 99.55 | 99.10 | 99.14 |
| DenseNet121 | 96.58 | 99.10 | 94.53 | 93.64 | 96.30 | 96.81 |
| DenseNet169 | 97.59 | 95.96 | 98.91 | 98.62 | 97.27 | 97.43 |
| ResNet101 | 42.25 | 44.84 | 40.15 | 37.88 | 41.07 | 42.49 |
| ResNet50 | 96.98 | 95.96 | 97.81 | 97.27 | 96.61 | 96.89 |
| VGG16 | 96.78 | 95.52 | 97.81 | 97.26 | 96.38 | 96.66 |
| VGG19 | 96.18 | 96.86 | 95.62 | 94.74 | 95.79 | 96.24 |
| InceptionV3 | 96.98 | 97.31 | 96.72 | 96.02 | 96.66 | 97.01 |
| InceptionResNetV2 | 94.57 | 96.41 | 93.07 | 91.88 | 94.09 | 94.74 |
| MobileNetV2 | 98.19 | 98.21 | 98.18 | 97.77 | 97.99 | 98.19 |
| NasNetLarge | 45.47 | 100.00 | 1.09 | 45.14 | 62.20 | 50.55 |
| NasNetMobile | 59.76 | 99.55 | 27.37 | 52.73 | 68.94 | 63.46 |
Table 2.
Classification results of CNN architectures for the study dataset.
| Accuracy (%) | Sensitivity (%) | Specificity (%) | Precision (%) | F1 Score (%) | AUC (%) |
|
|---|---|---|---|---|---|---|
| Xception | 96.31 | 98.95 | 94.07 | 93.41 | 96.10 | 96.51 |
| DenseNet201 | 99.13 | 99.86 | 98.52 | 98.28 | 99.07 | 99.19 |
| DenseNet121 | 97.85 | 98.60 | 97.21 | 96.78 | 97.68 | 97.91 |
| DenseNet169 | 97.47 | 98.88 | 96.27 | 95.74 | 97.29 | 97.57 |
| ResNet101 | 94.58 | 98.60 | 91.17 | 90.45 | 94.35 | 94.89 |
| ResNet50 | 95.38 | 93.72 | 96.80 | 96.13 | 94.91 | 95.26 |
| VGG16 | 97.27 | 95.39 | 98.87 | 98.63 | 96.98 | 97.13 |
| VGG19 | 92.47 | 99.79 | 86.25 | 86.03 | 92.40 | 93.02 |
| InceptionV3 | 96.09 | 96.75 | 95.49 | 95.08 | 95.91 | 96.12 |
| InceptionResNetV2 | 96.86 | 94.62 | 98.76 | 98.47 | 96.51 | 96.69 |
| MobileNetV2 | 96.38 | 98.11 | 94.90 | 94.23 | 96.13 | 96.51 |
Disclaimer/Publisher’s Note: The statements, opinions and data contained in all publications are solely those of the individual author(s) and contributor(s) and not of MDPI and/or the editor(s). MDPI and/or the editor(s) disclaim responsibility for any injury to people or property resulting from any ideas, methods, instructions or products referred to in the content. |
© 2025 by the authors. Licensee MDPI, Basel, Switzerland. This article is an open access article distributed under the terms and conditions of the Creative Commons Attribution (CC BY) license (http://creativecommons.org/licenses/by/4.0/).
Copyright: This open access article is published under a Creative Commons CC BY 4.0 license, which permit the free download, distribution, and reuse, provided that the author and preprint are cited in any reuse.


