Submitted:
22 October 2025
Posted:
23 October 2025
You are already at the latest version
Abstract
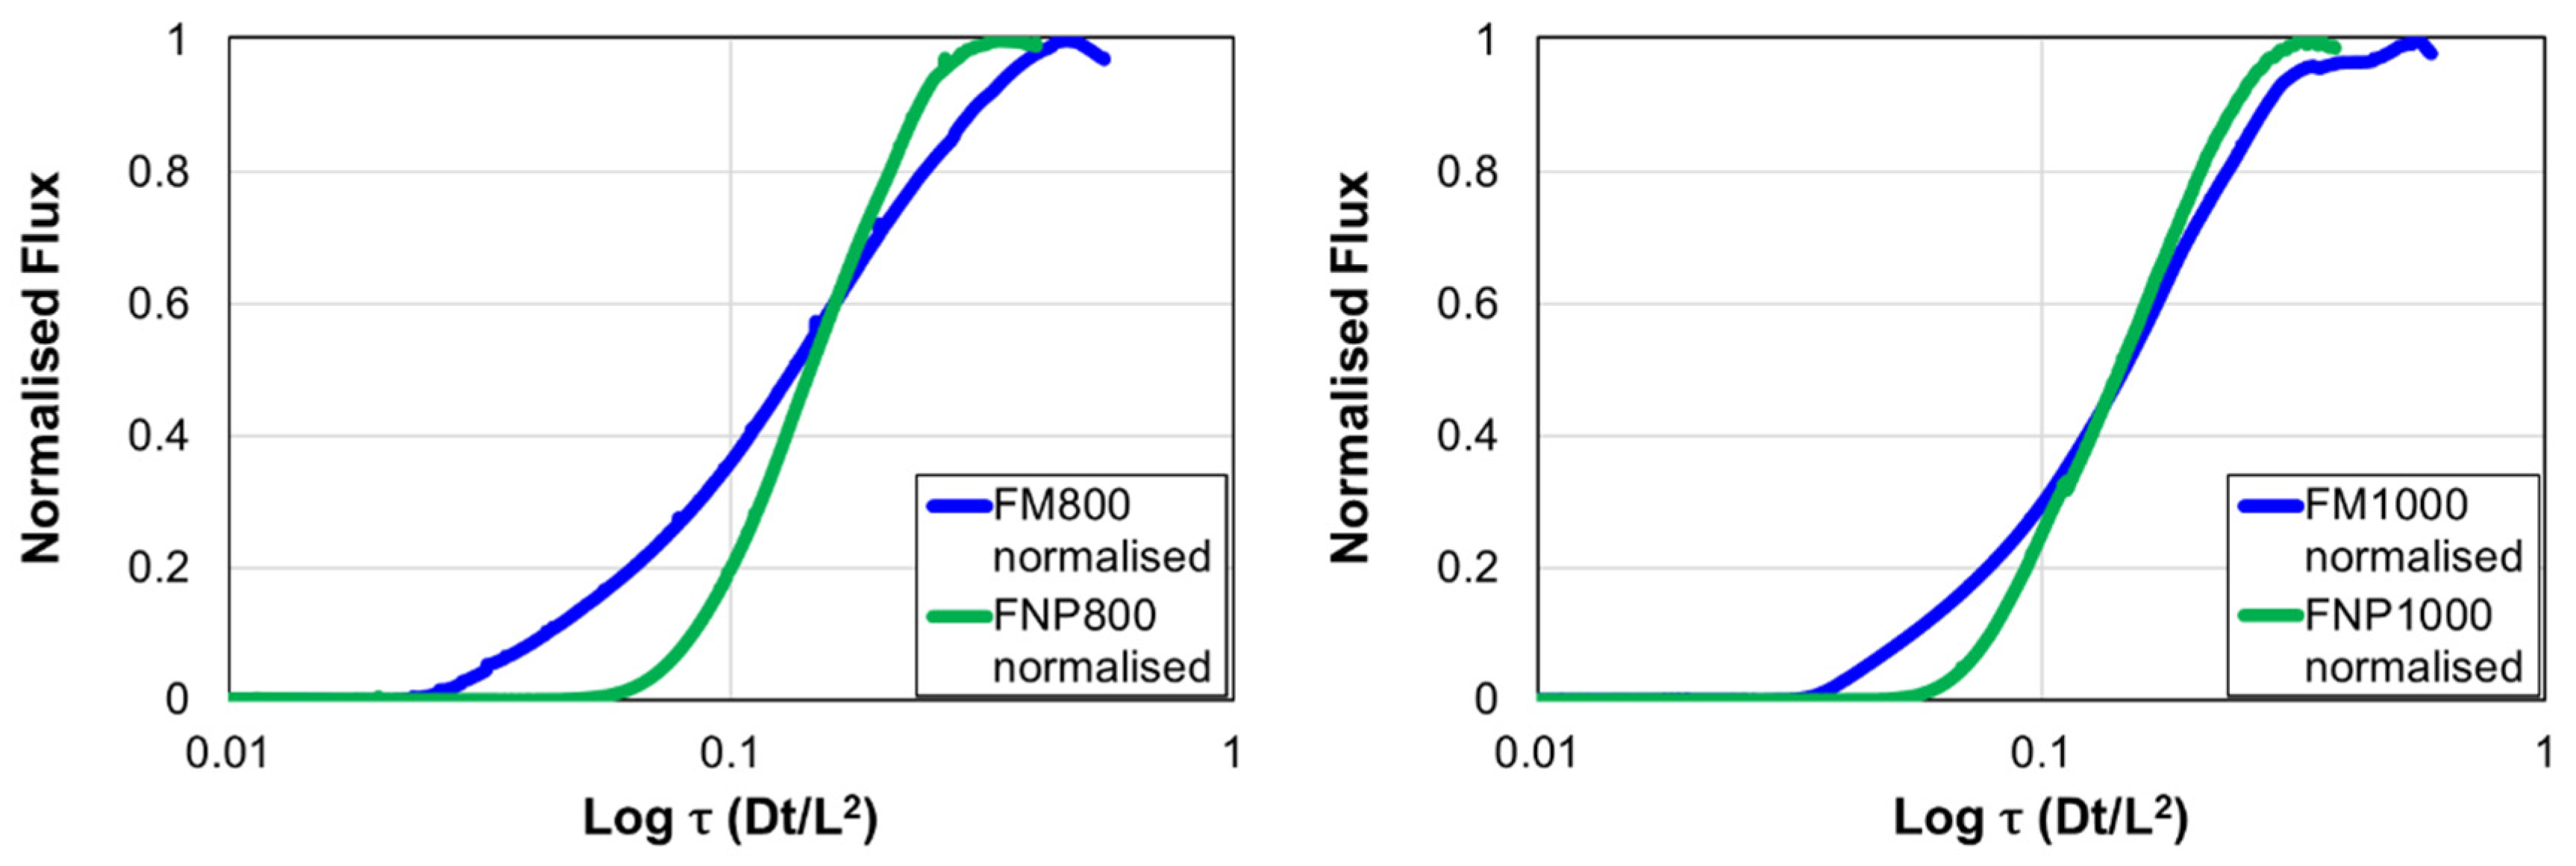
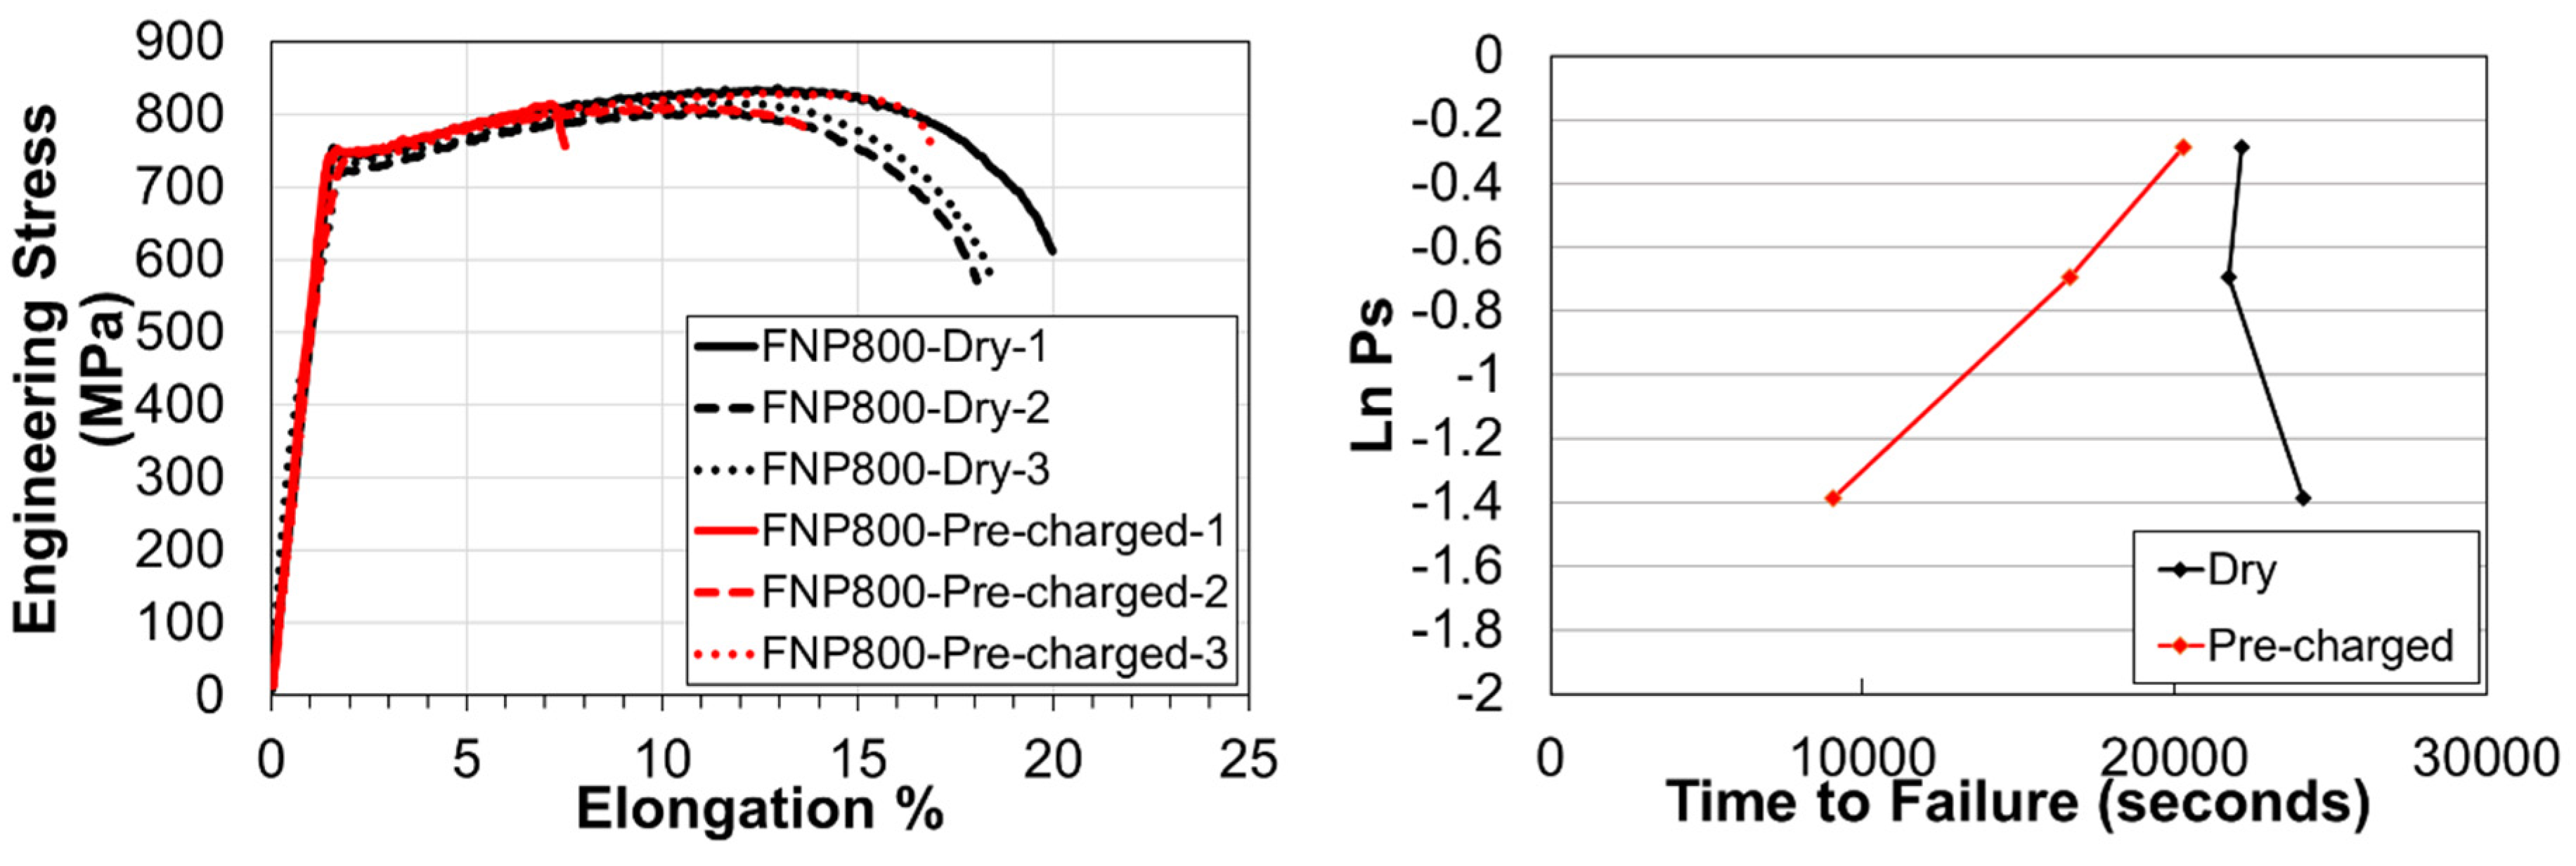
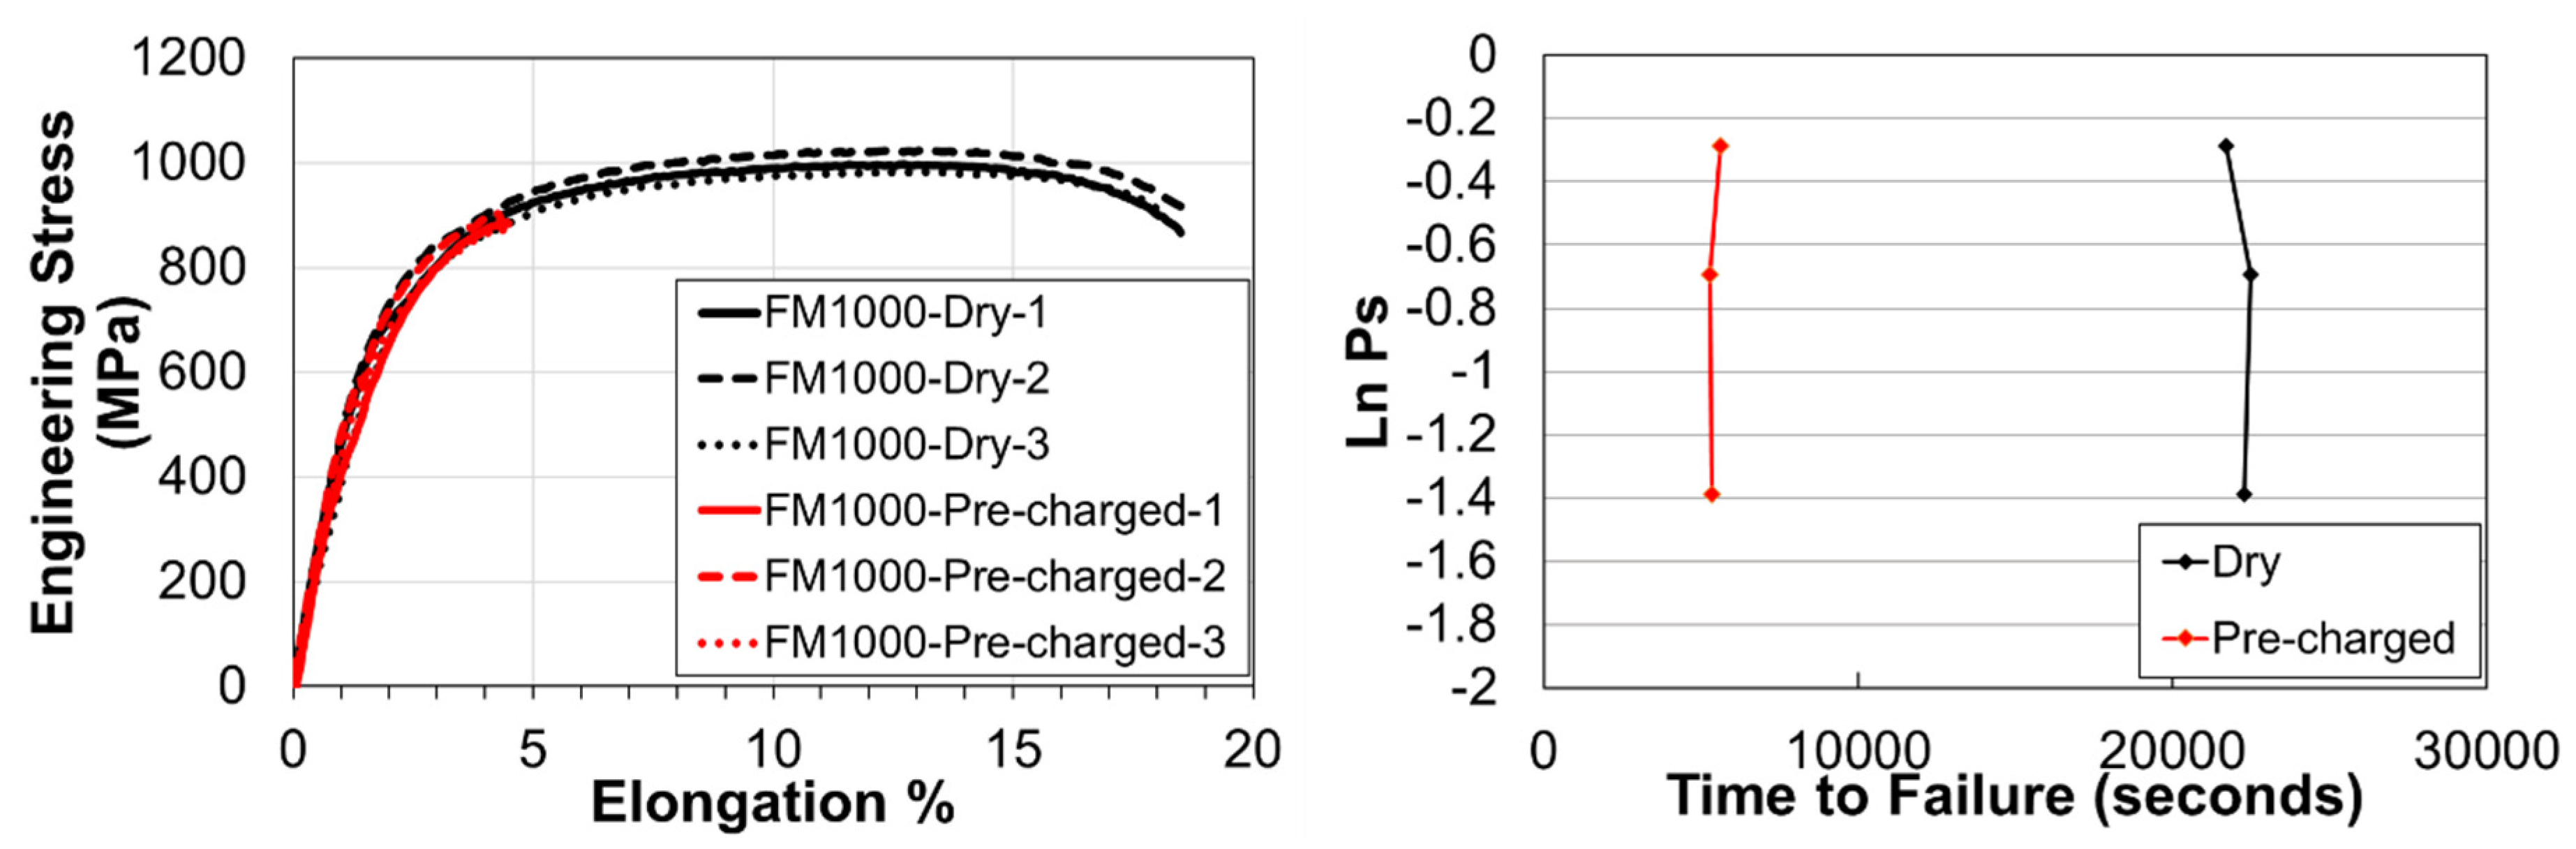
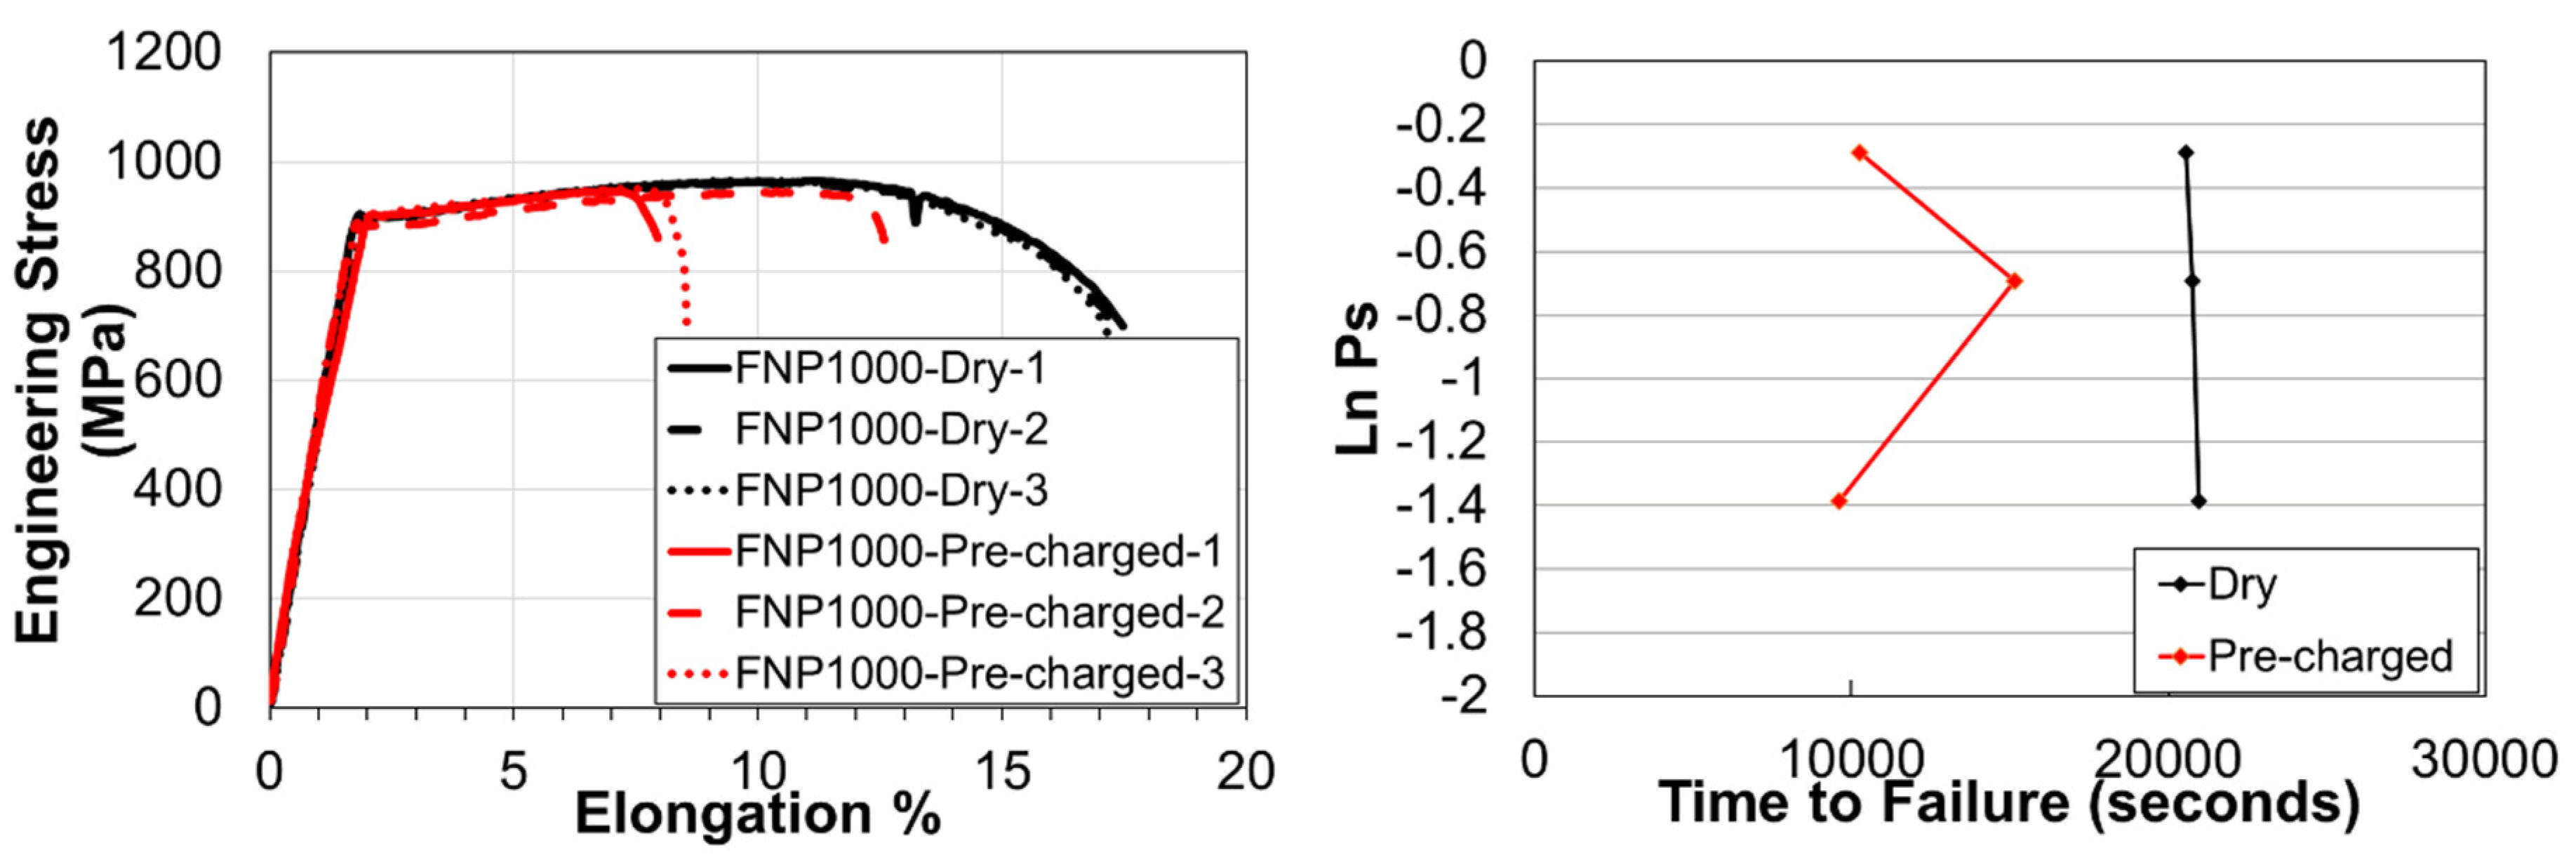
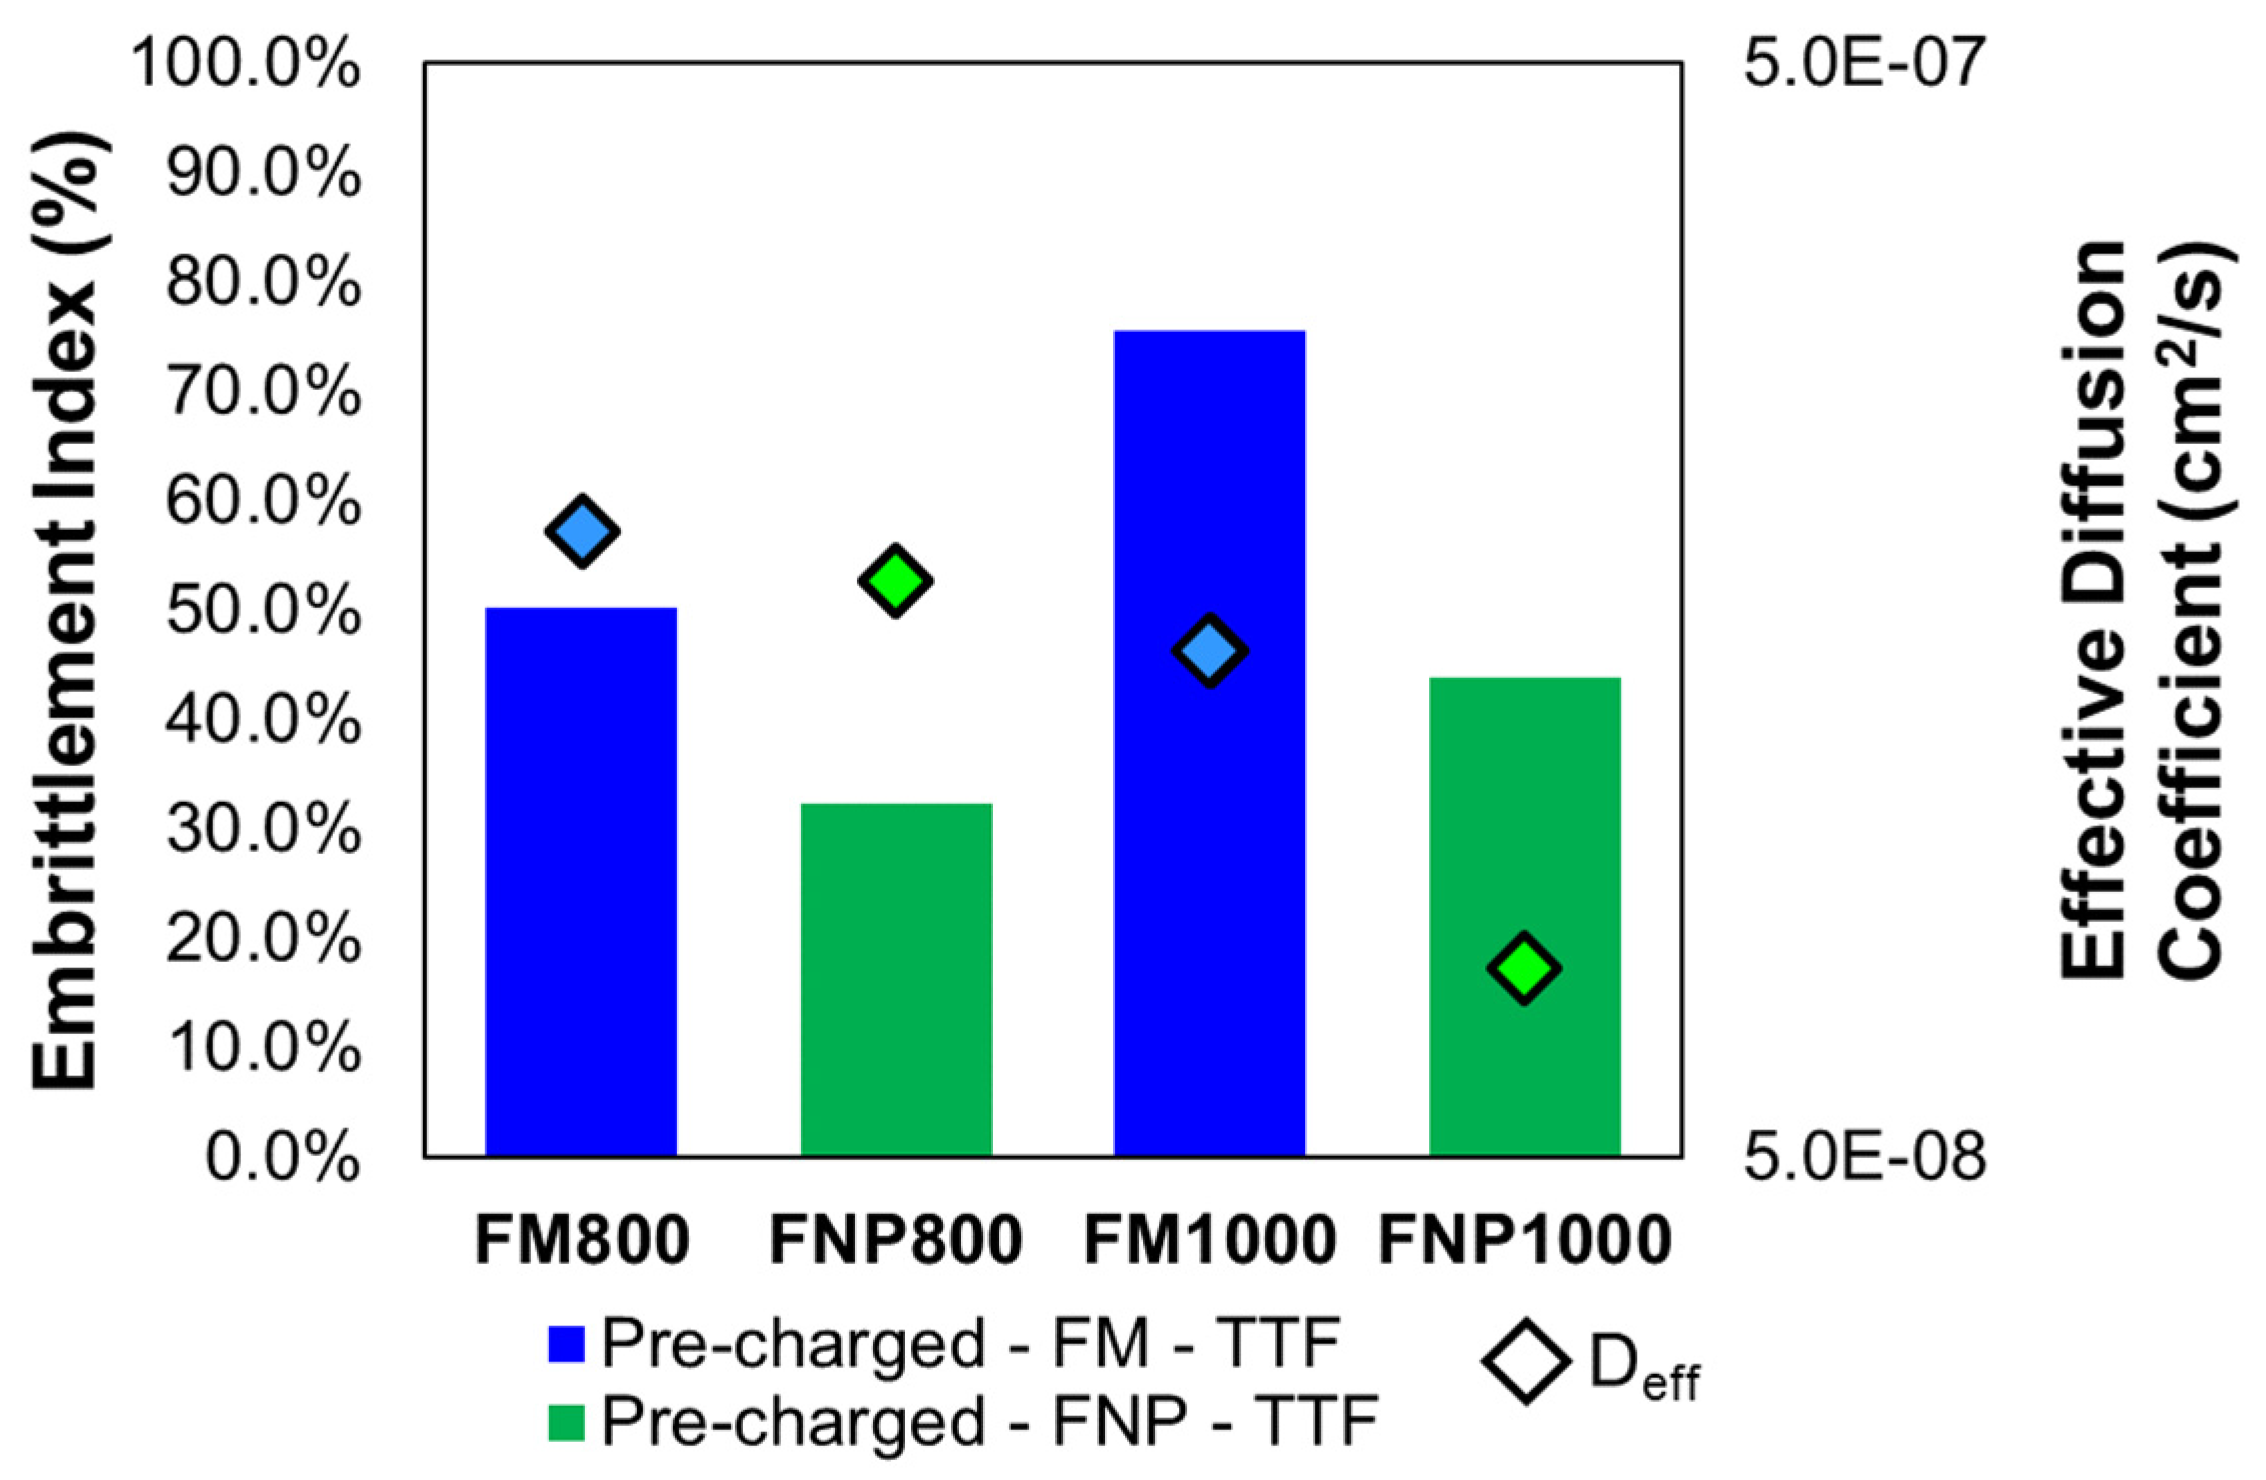
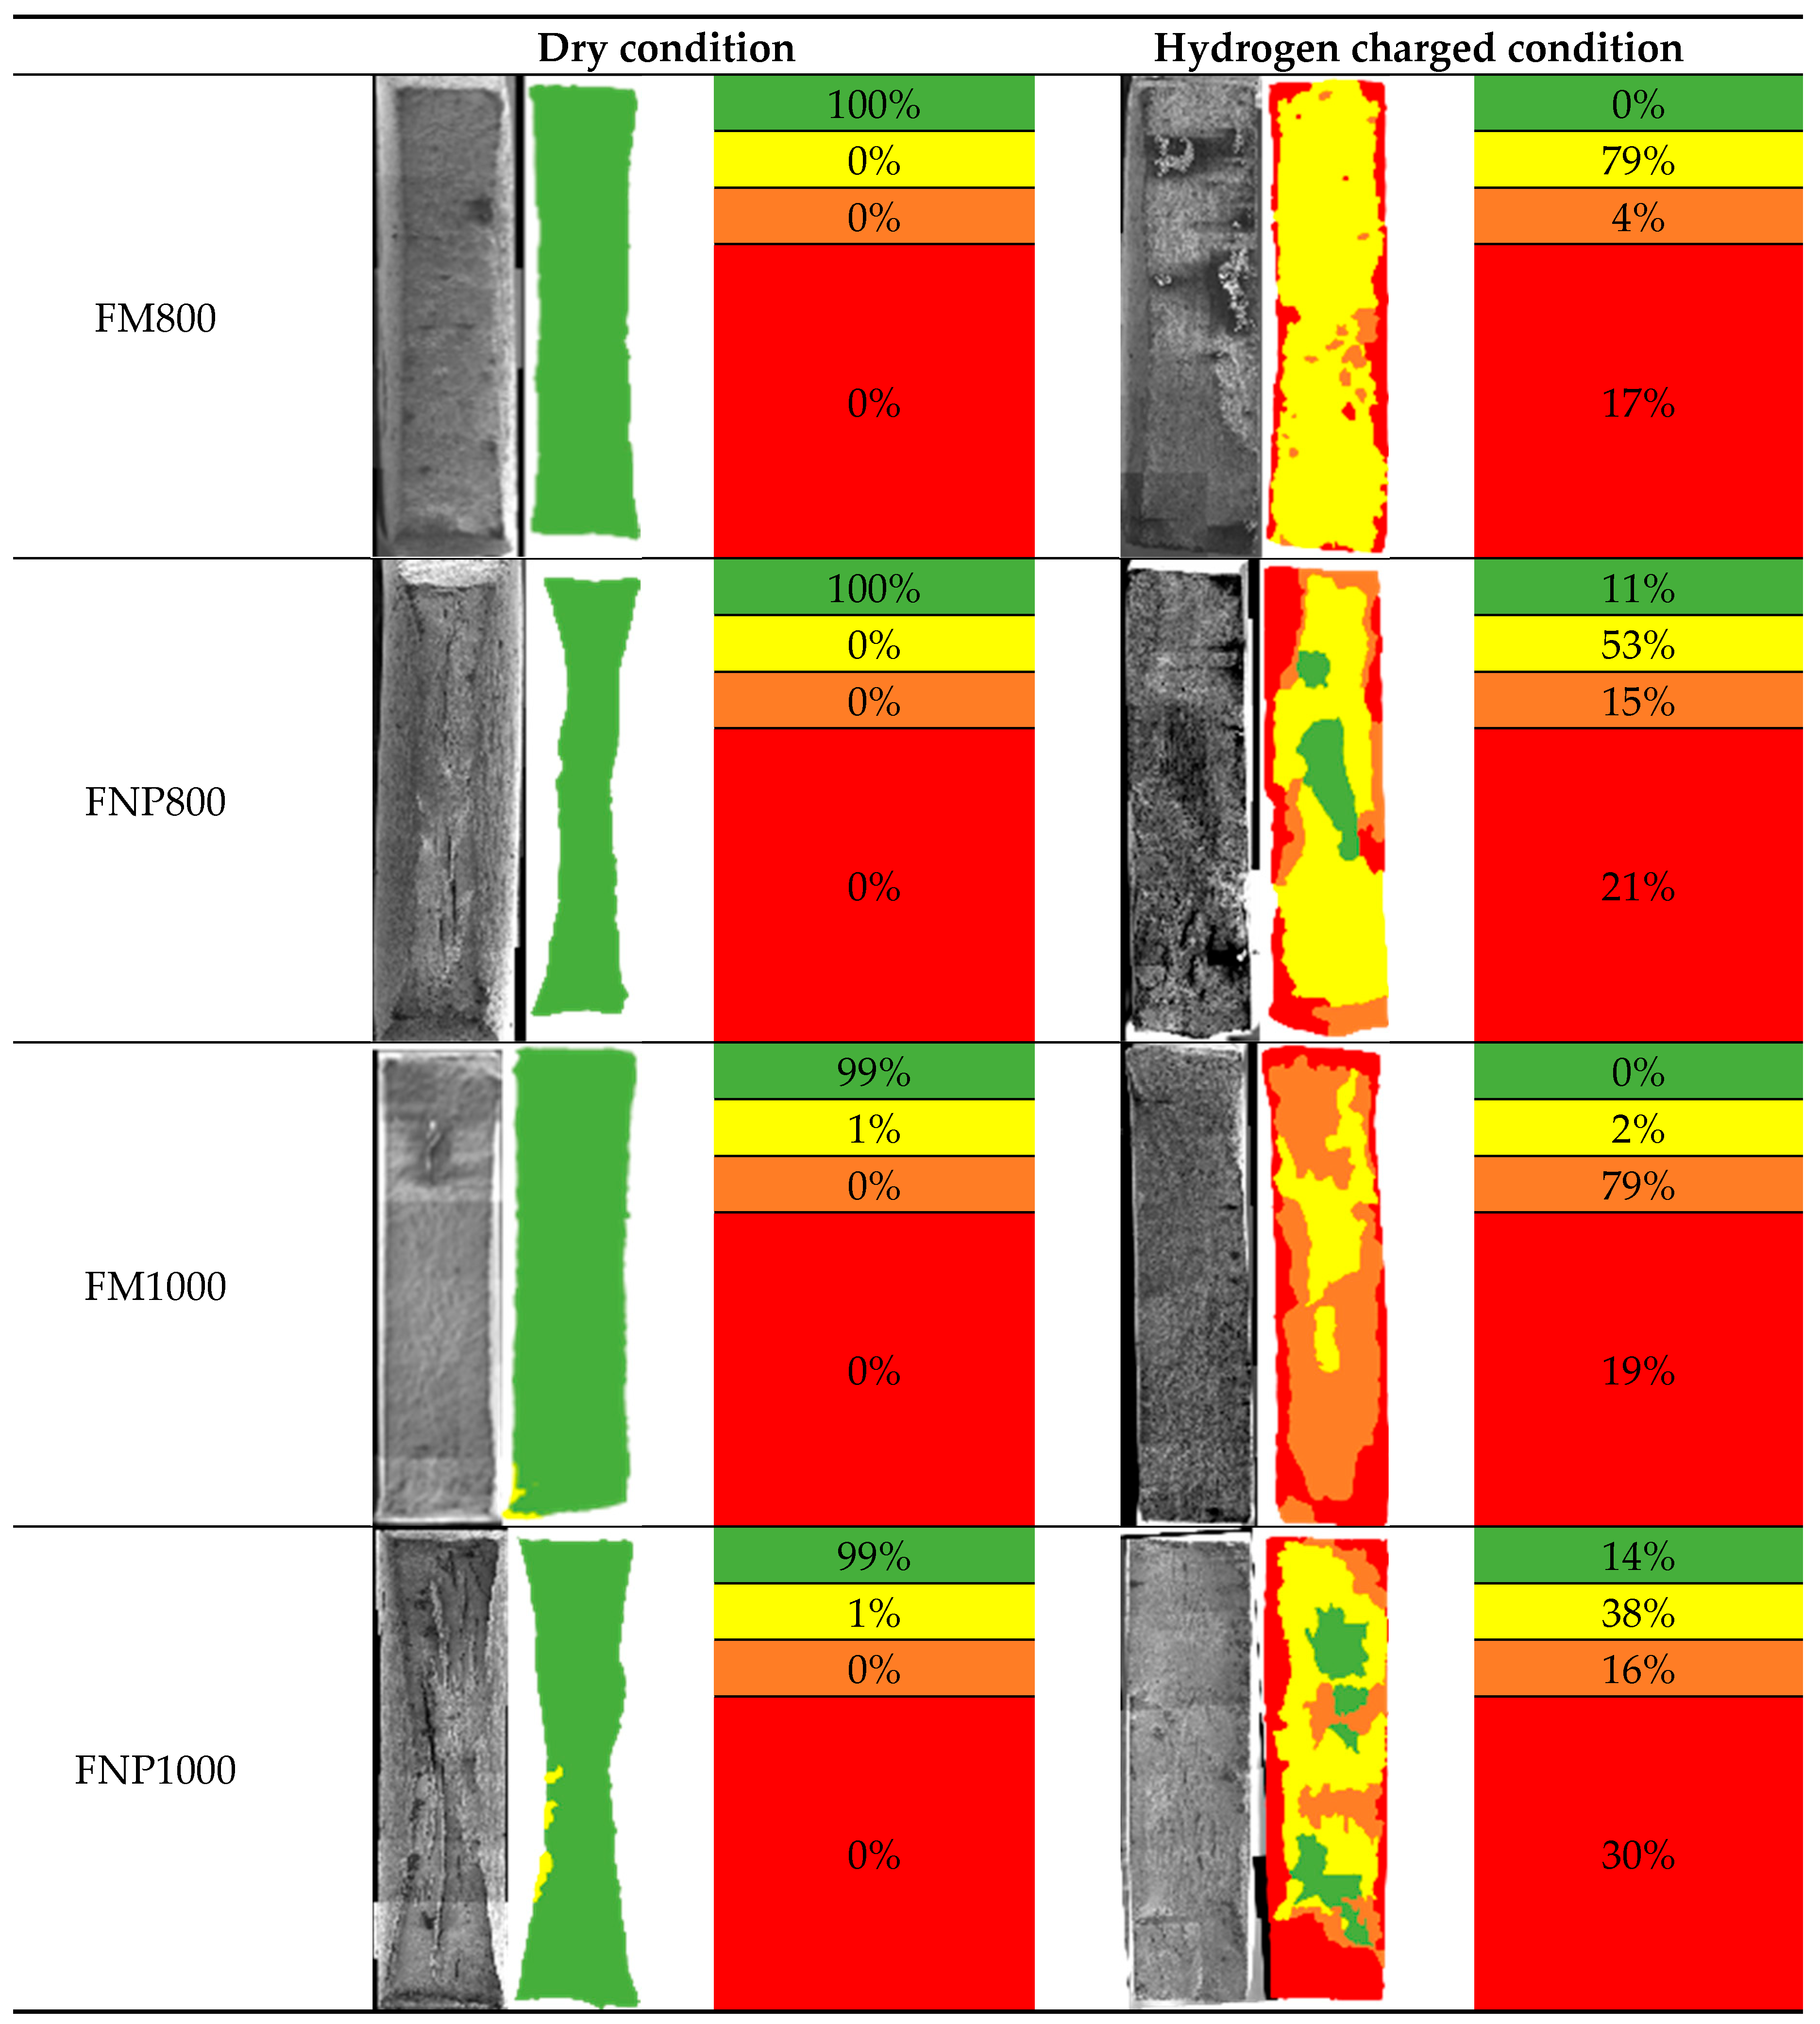
The adoption of advanced high-strength steels (AHSS) in the automotive industry have significantly increased in recent years driven by weight reduction and enhanced crashworthiness. Hot dip galvanised sacrificial coatings are regularly applied to these steels for corrosion protection. In this investigation, the scanning vibrating electrode technique (SVET) demonstrated that hydrogen evolution on the steel substrate is taking place when these sacrificial coatings are damaged during service, increasing the risk of hydrogen embrittlement. The hydrogen embrittlement susceptibility of a new generation of nano-precipitate ferritic, FNP, AHSS have been studied and compared against conventional dual phase ferritic-martensitic, FM, AHSS at equivalent strength levels. Hydrogen permeation tests have shown that FNP AHSS have lower effective diffusion coefficients, Deff, than FM AHSS at equivalent strength levels. At 800 MPa strength level Deff were 1.68×10⁻⁷ cm2/s and 1.87×10⁻⁷ cm2/s for FNP800 and FM800 respectively. At higher strength levels, 1000 MPa, Deff were 7.45×10⁻⁸ cm2/s and 1.45×10⁻⁷ cm2/s for the FNP1000 and FM1000, respectively. Slow strain rate tests (SSRT) showed that FNP AHSS displayed over 35% higher resistance to hydrogen embrittlement than conventional FM AHSS. Quantitative fractographic analyses confirmed that the new ferritic nano-precipitate microstructure retains much more ductile behaviour than conventional martensitic-ferritic even under the most severe hydrogen charging conditions tested.
Keywords:
1. Introduction
2. Materials and Methods
2.1. Materials
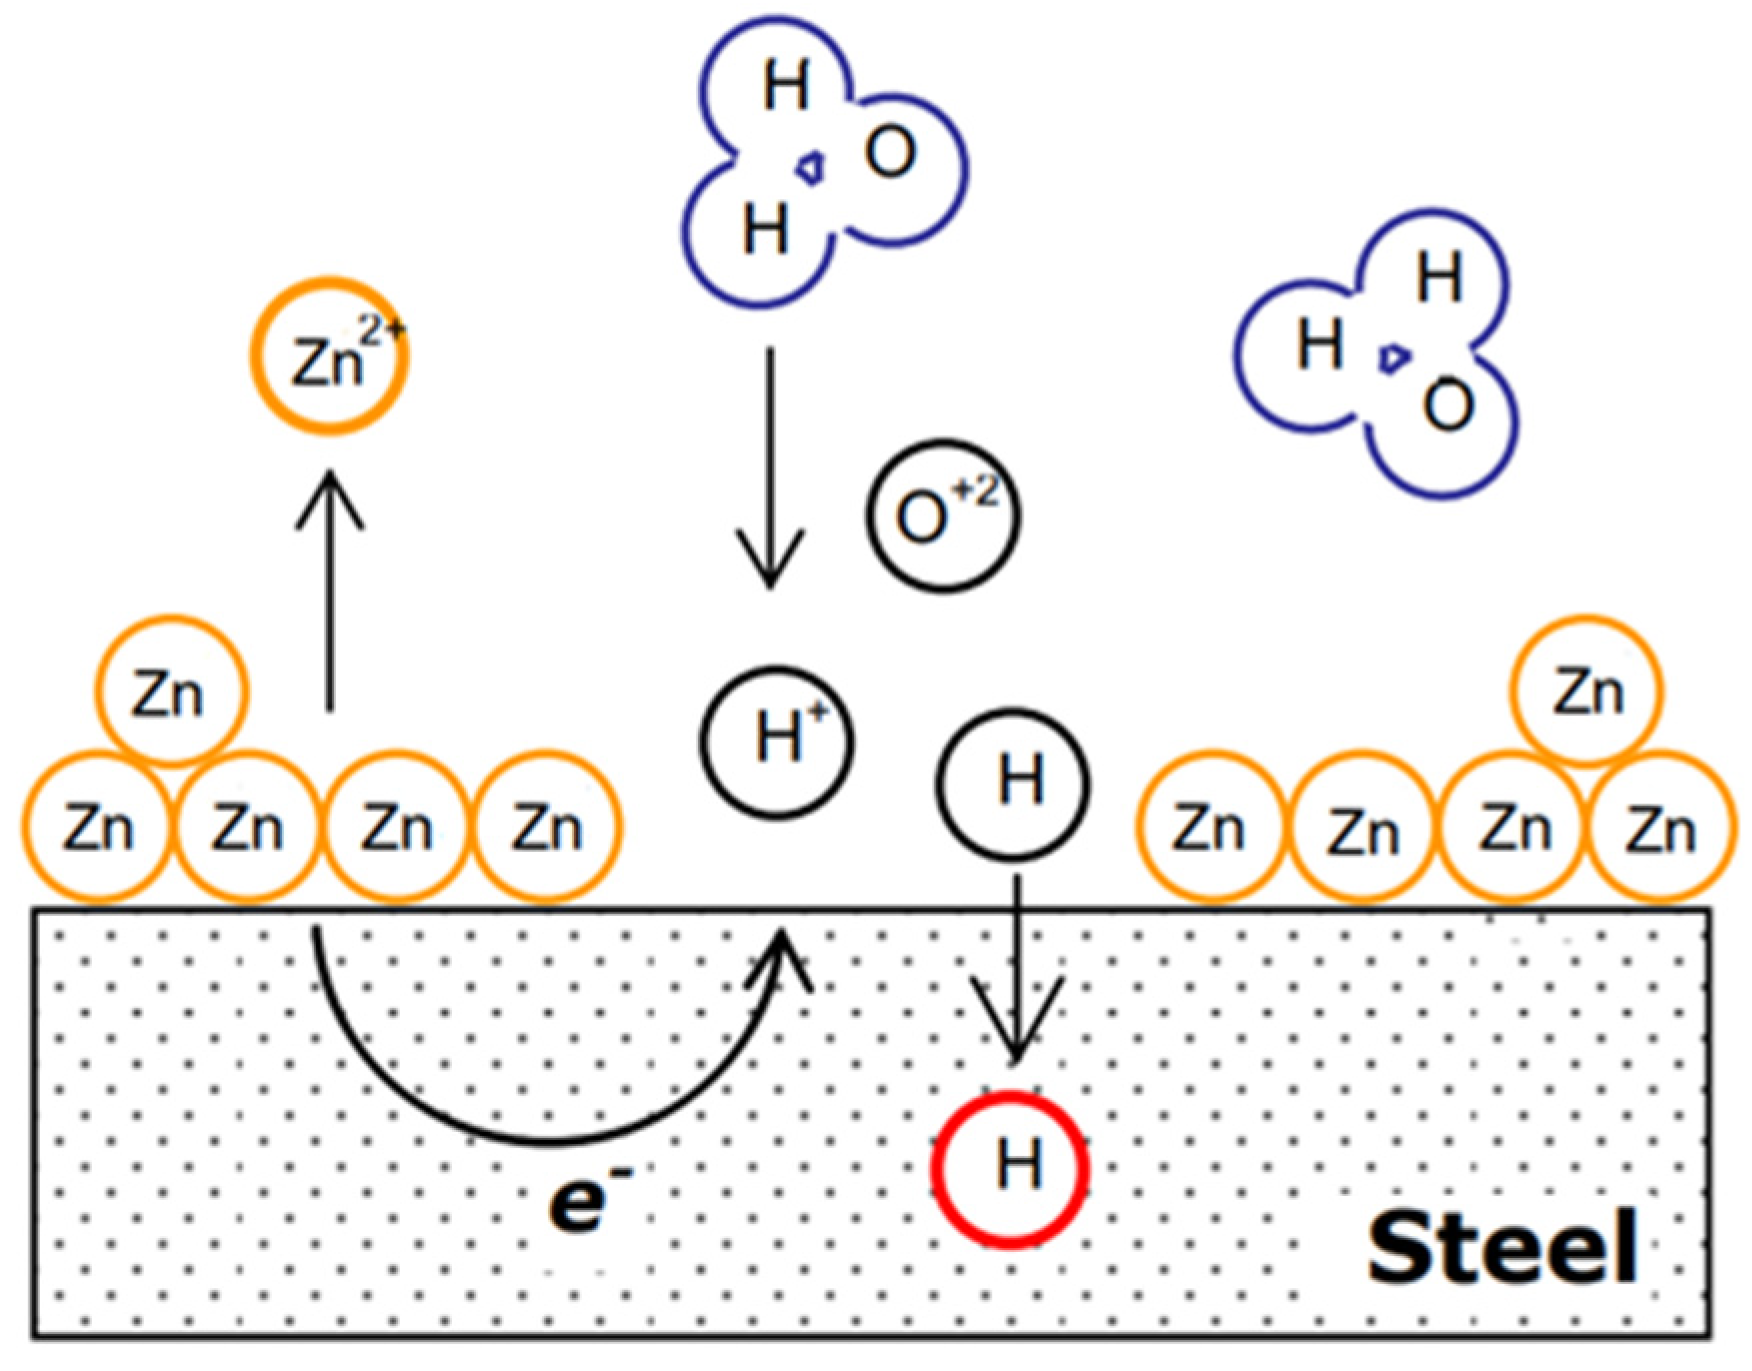
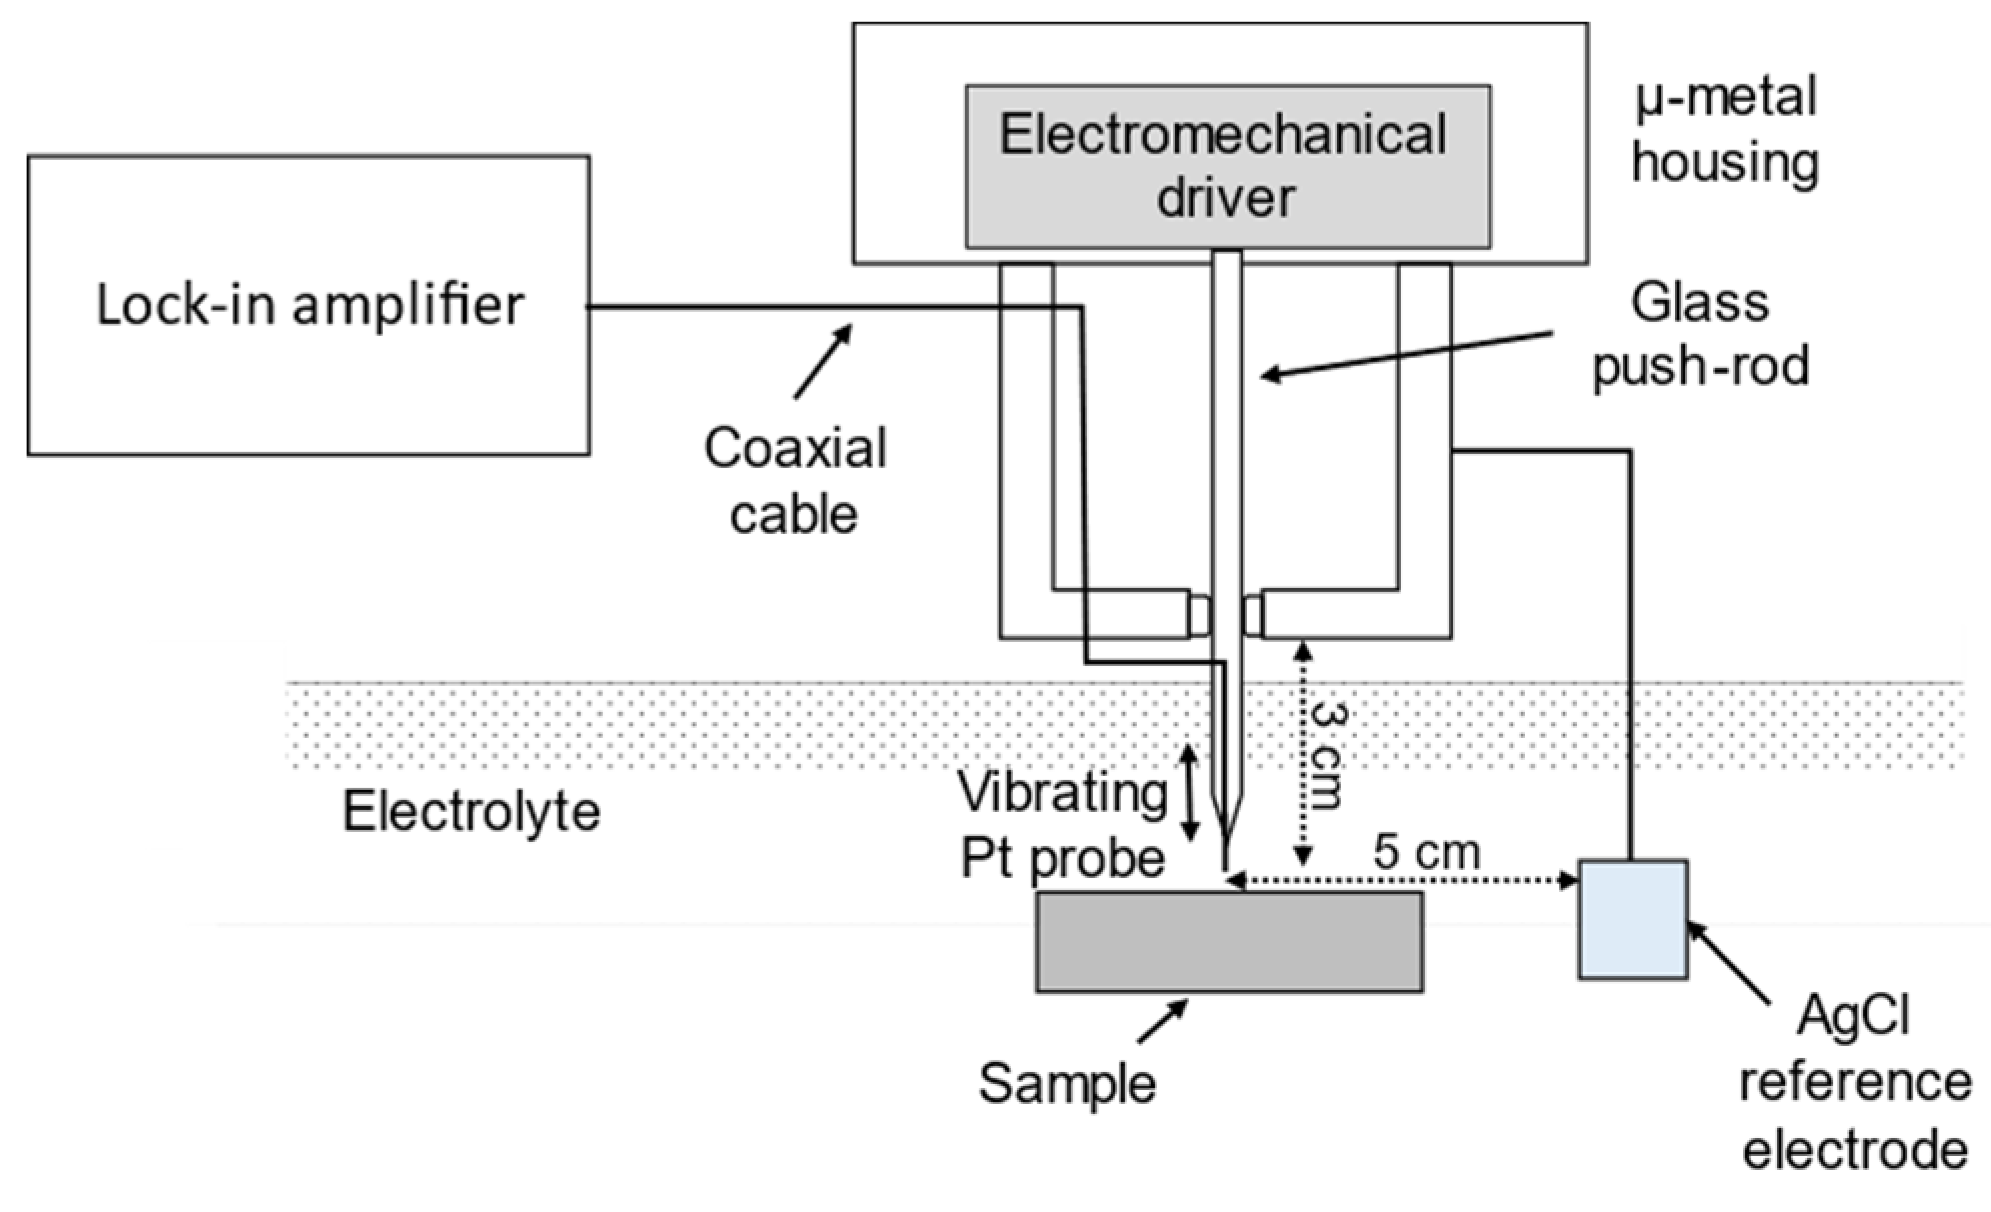
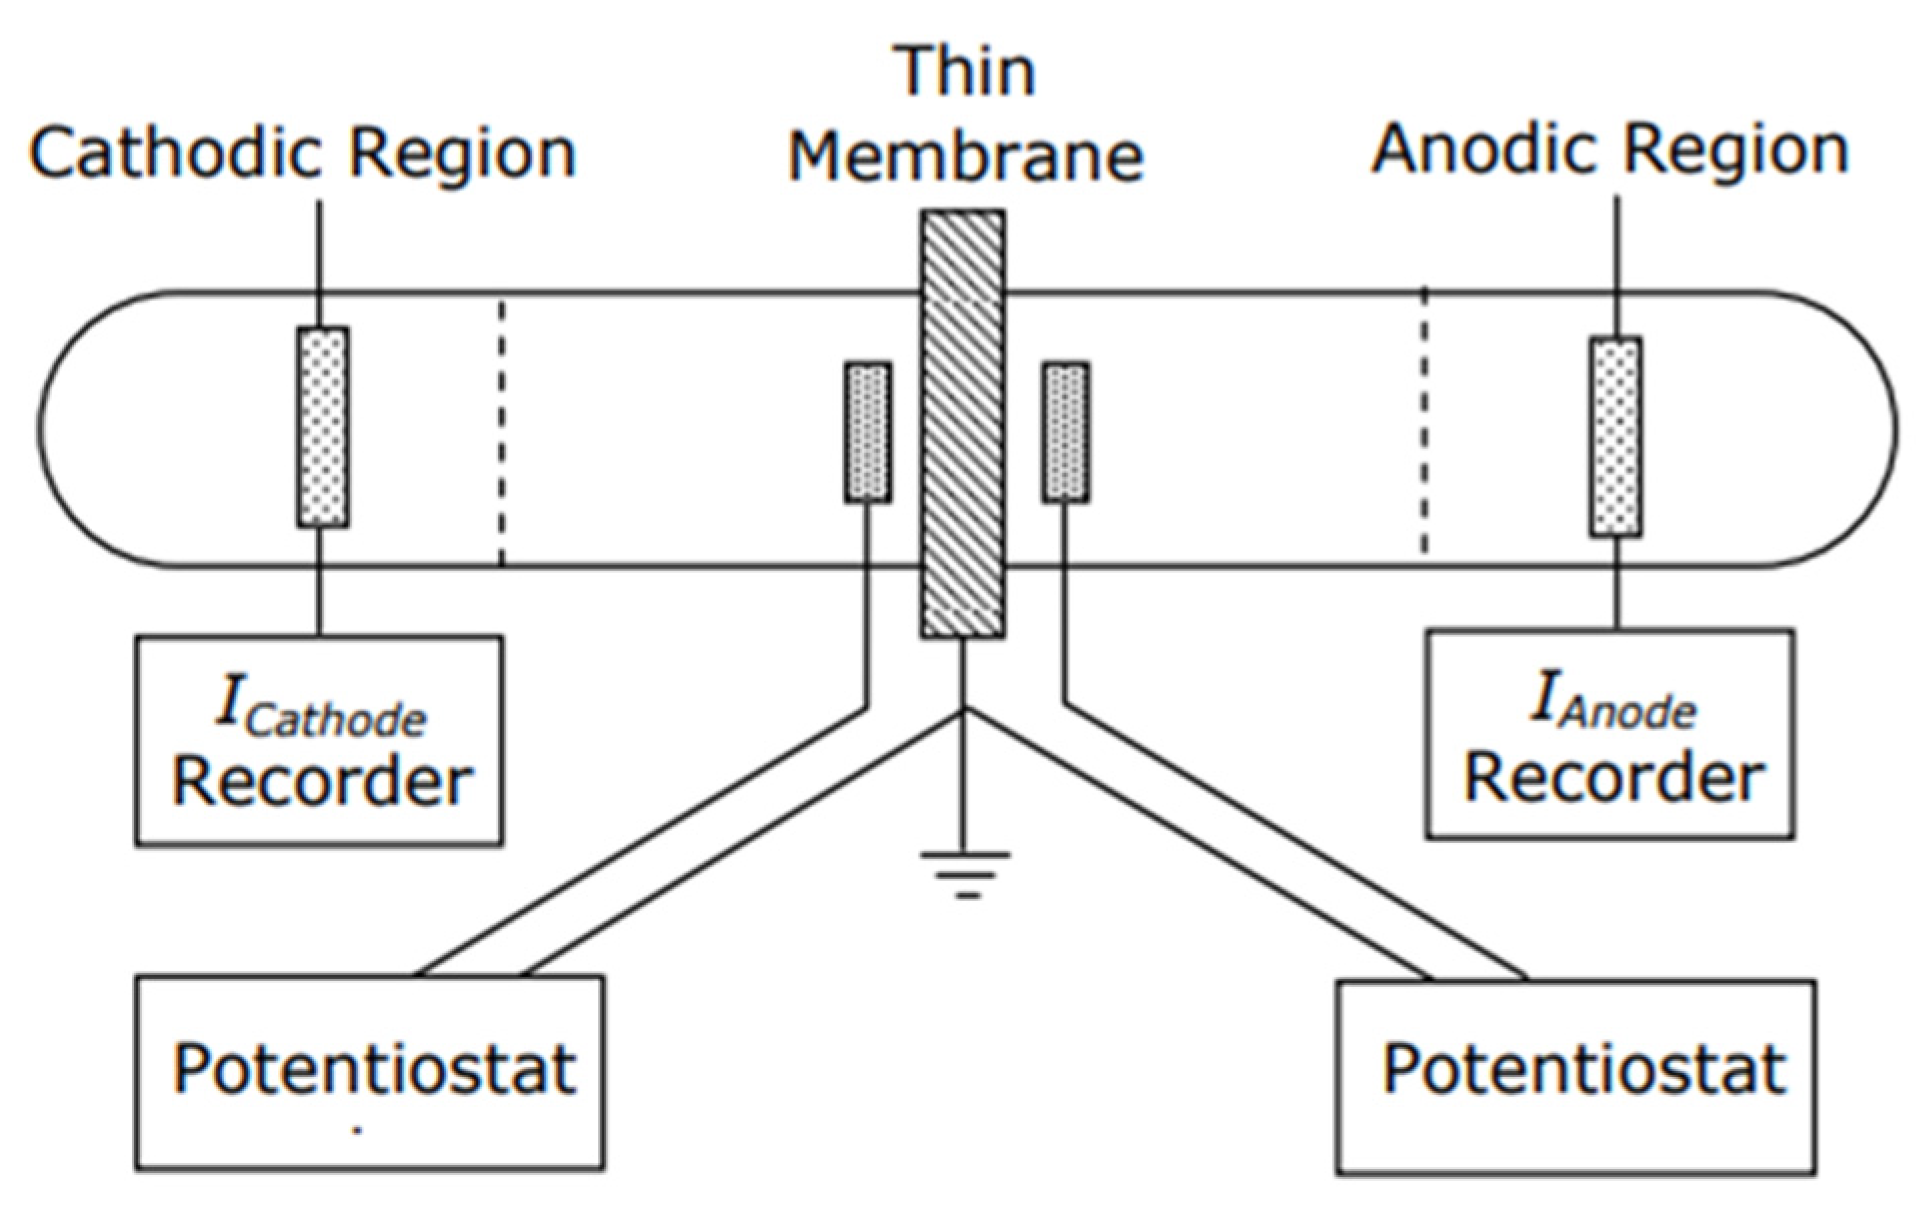
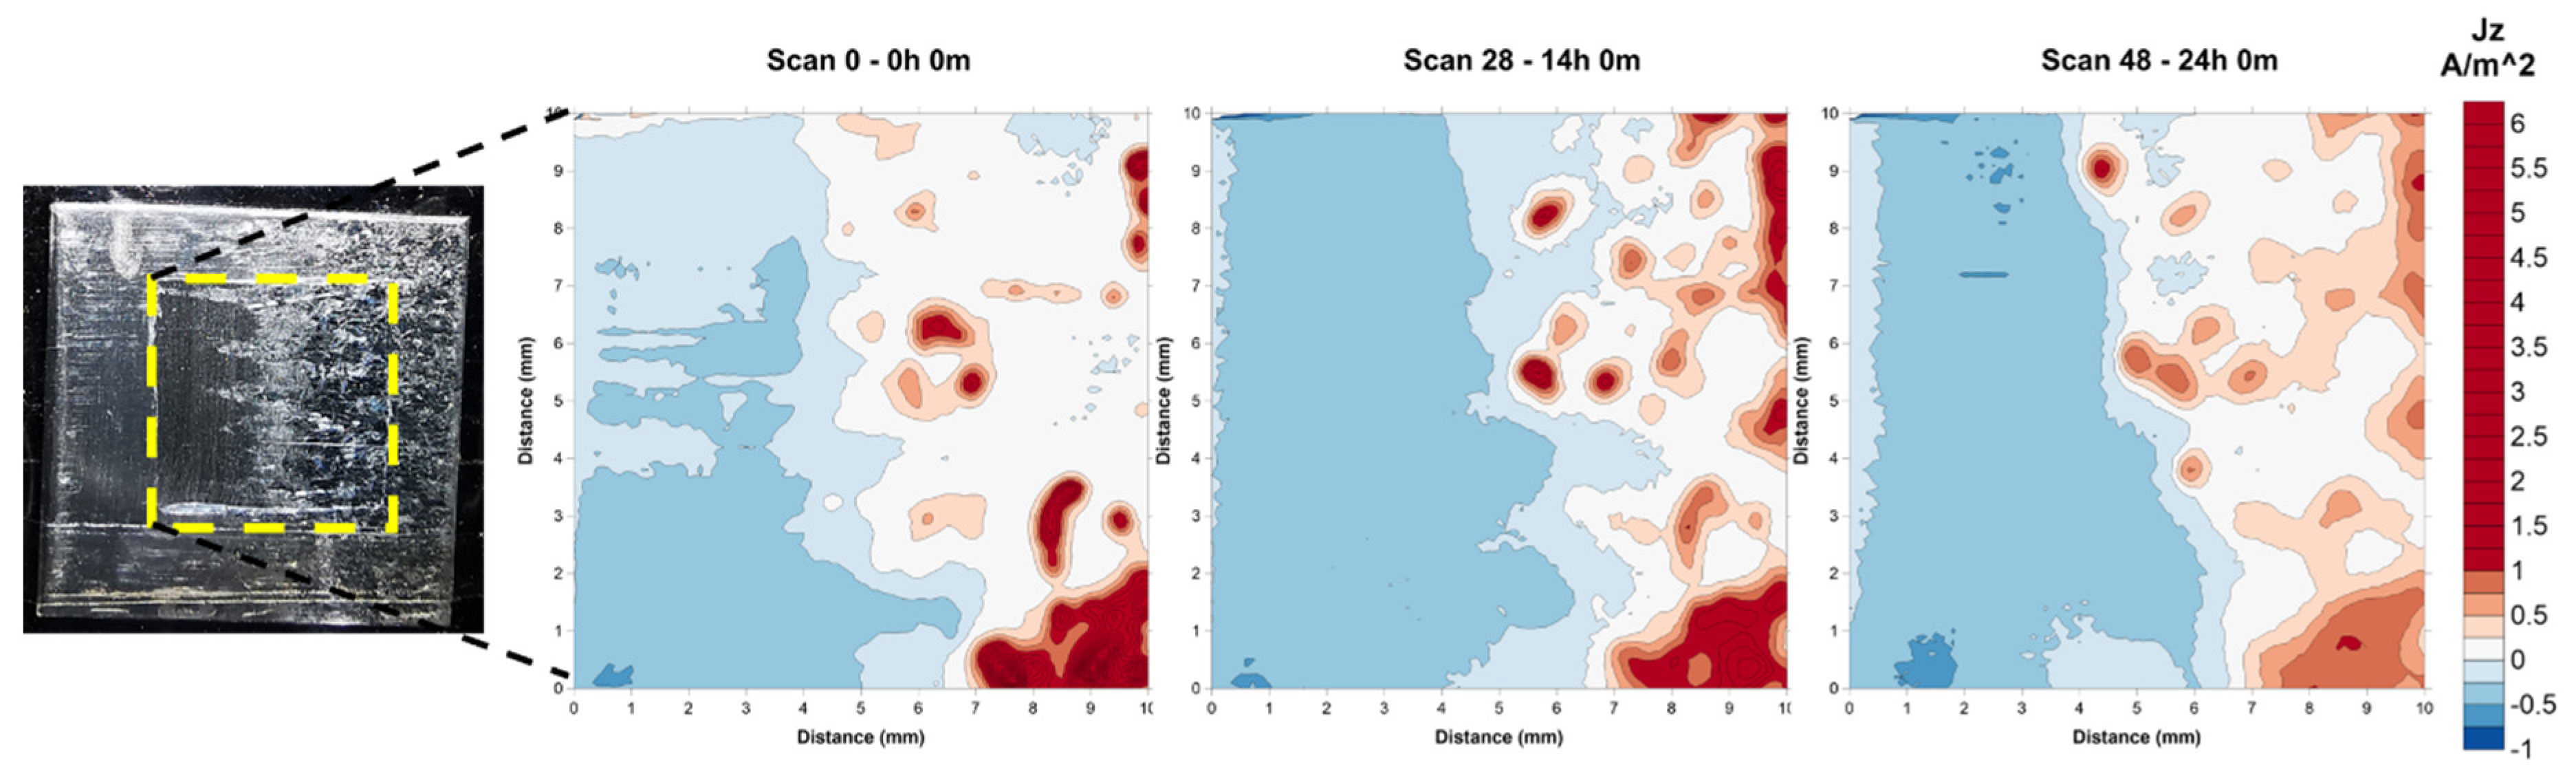
2.2. Effect of Galvanic Corrosion Upon Hydrogen Evolution
2.3. Hydrogen Diffusion
2.4. Embrittlement Indices, EI, and Slow Strain Rate Test, SSRT
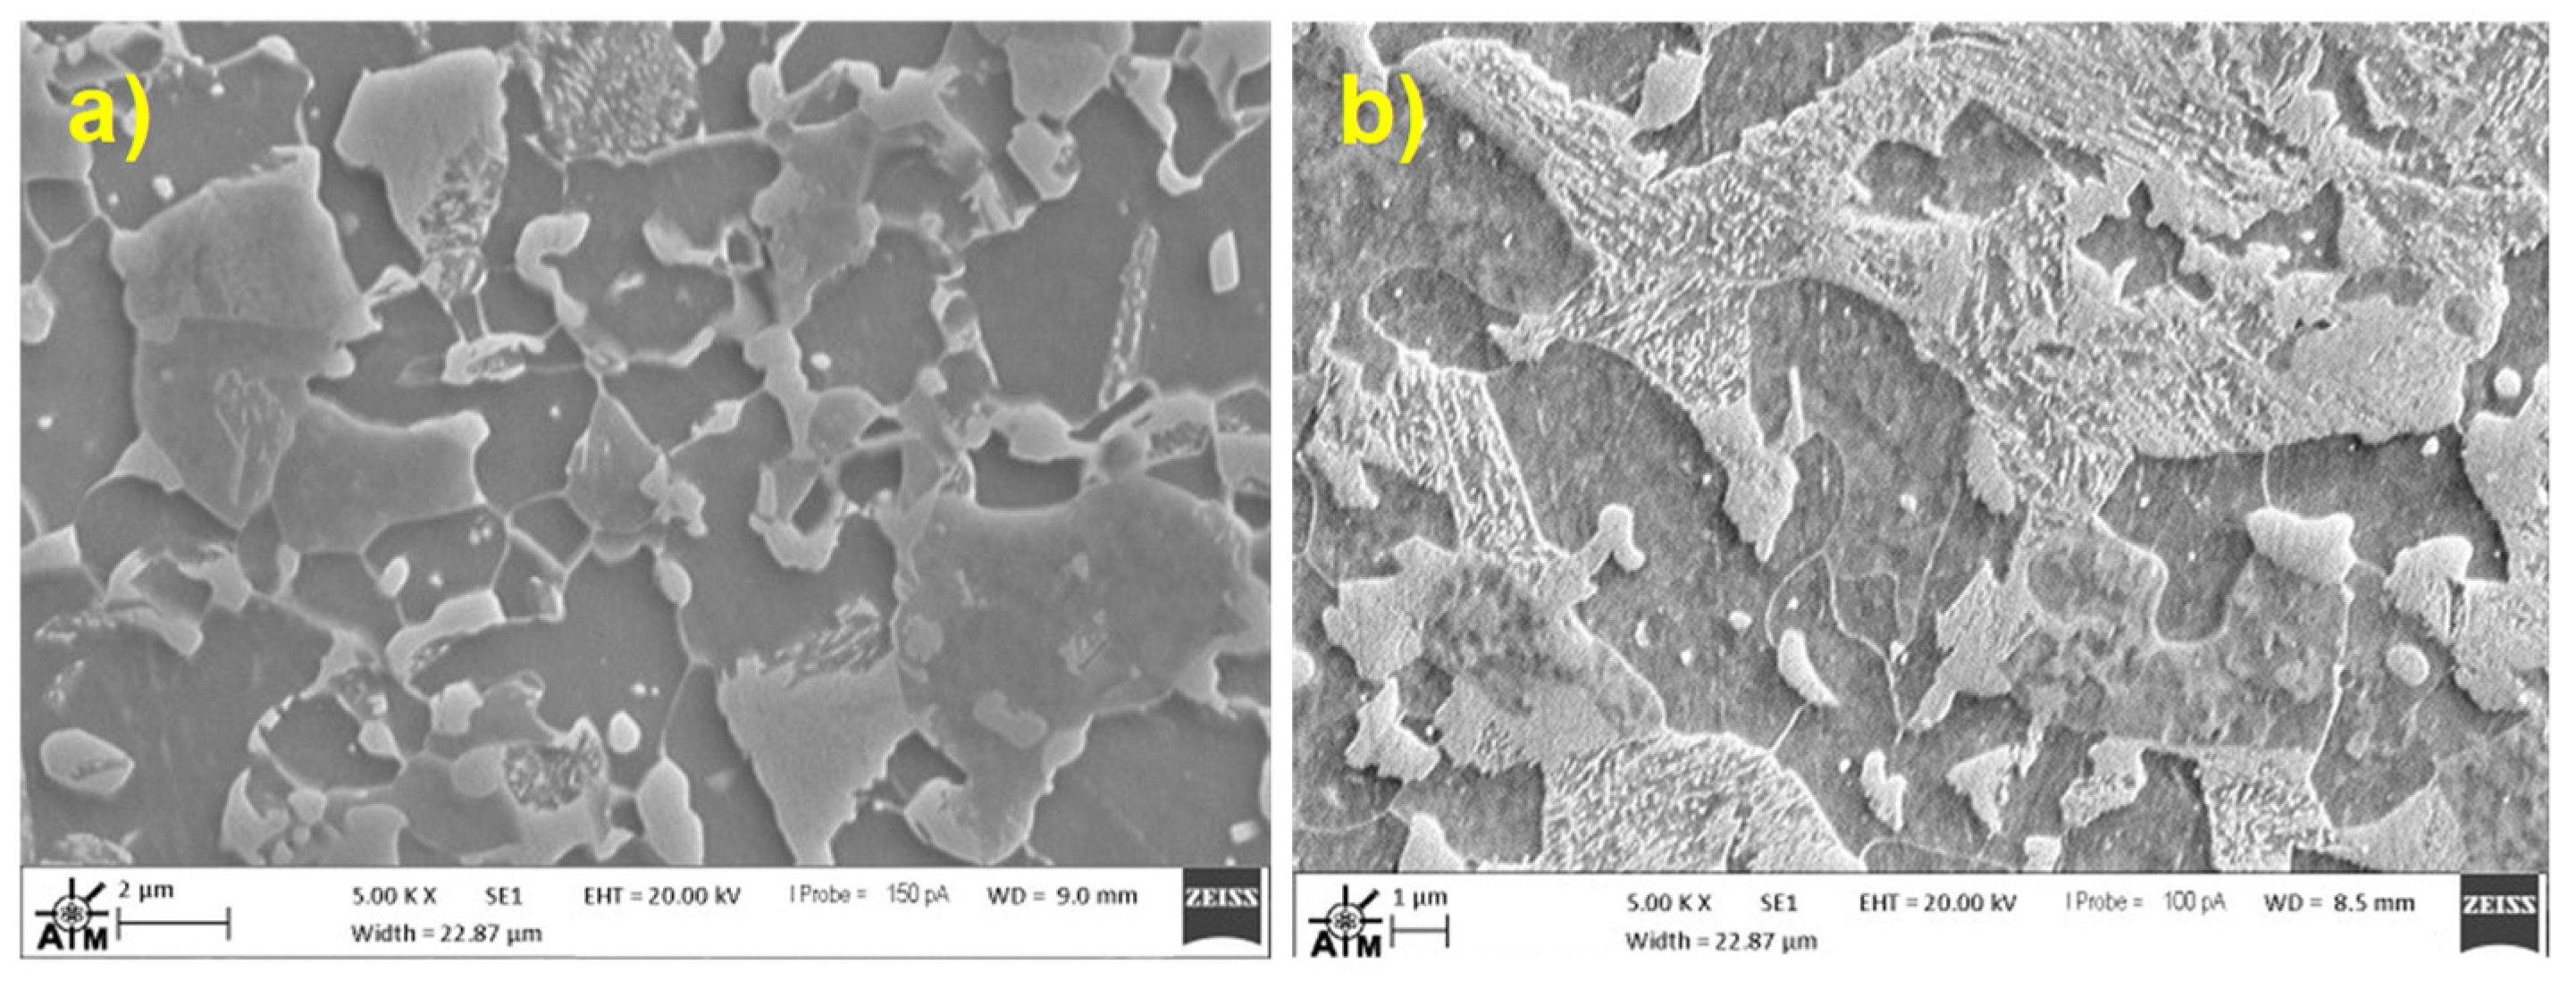
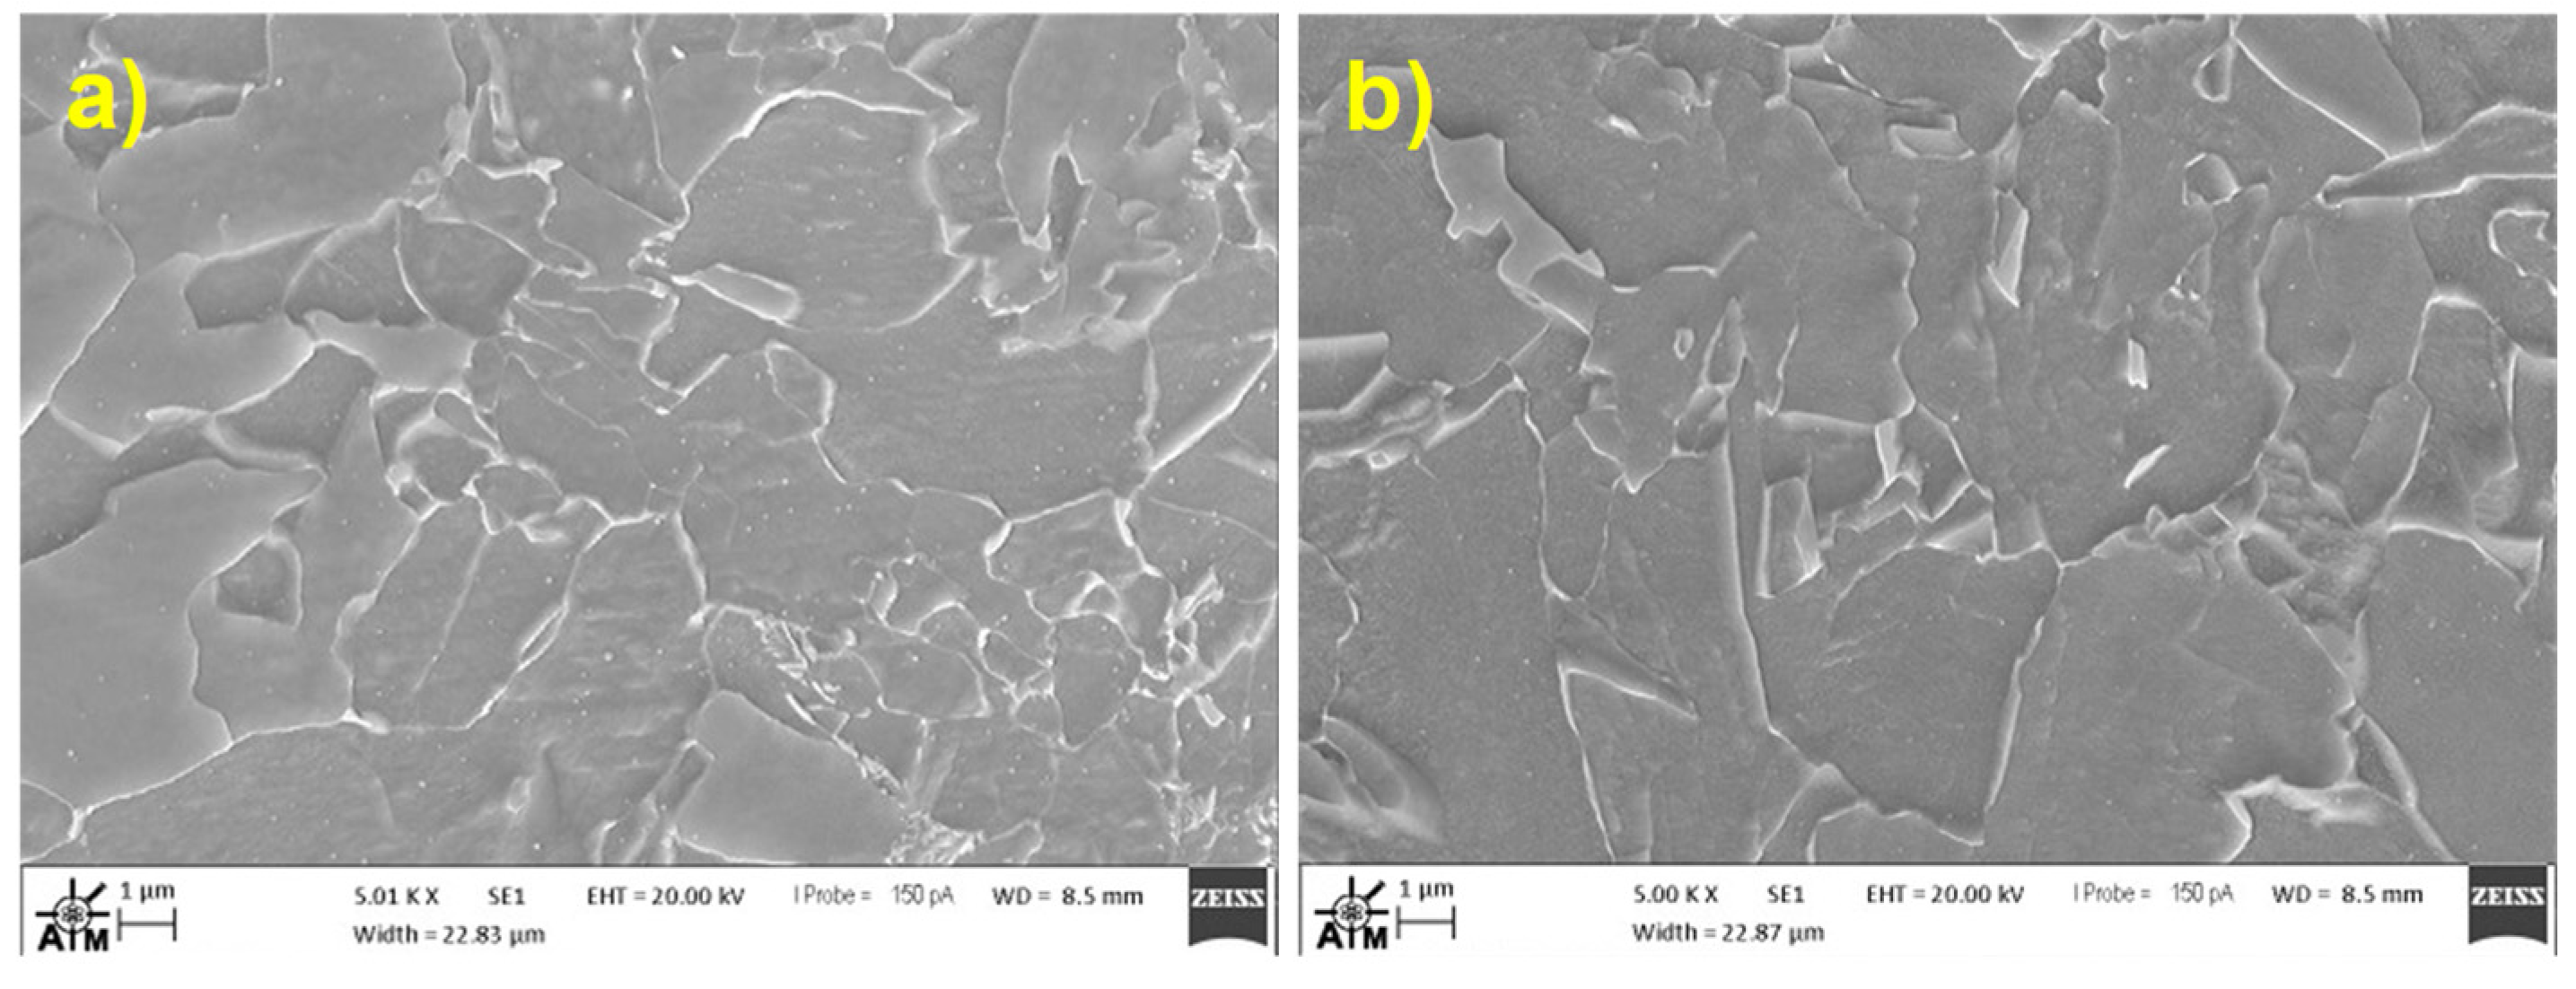
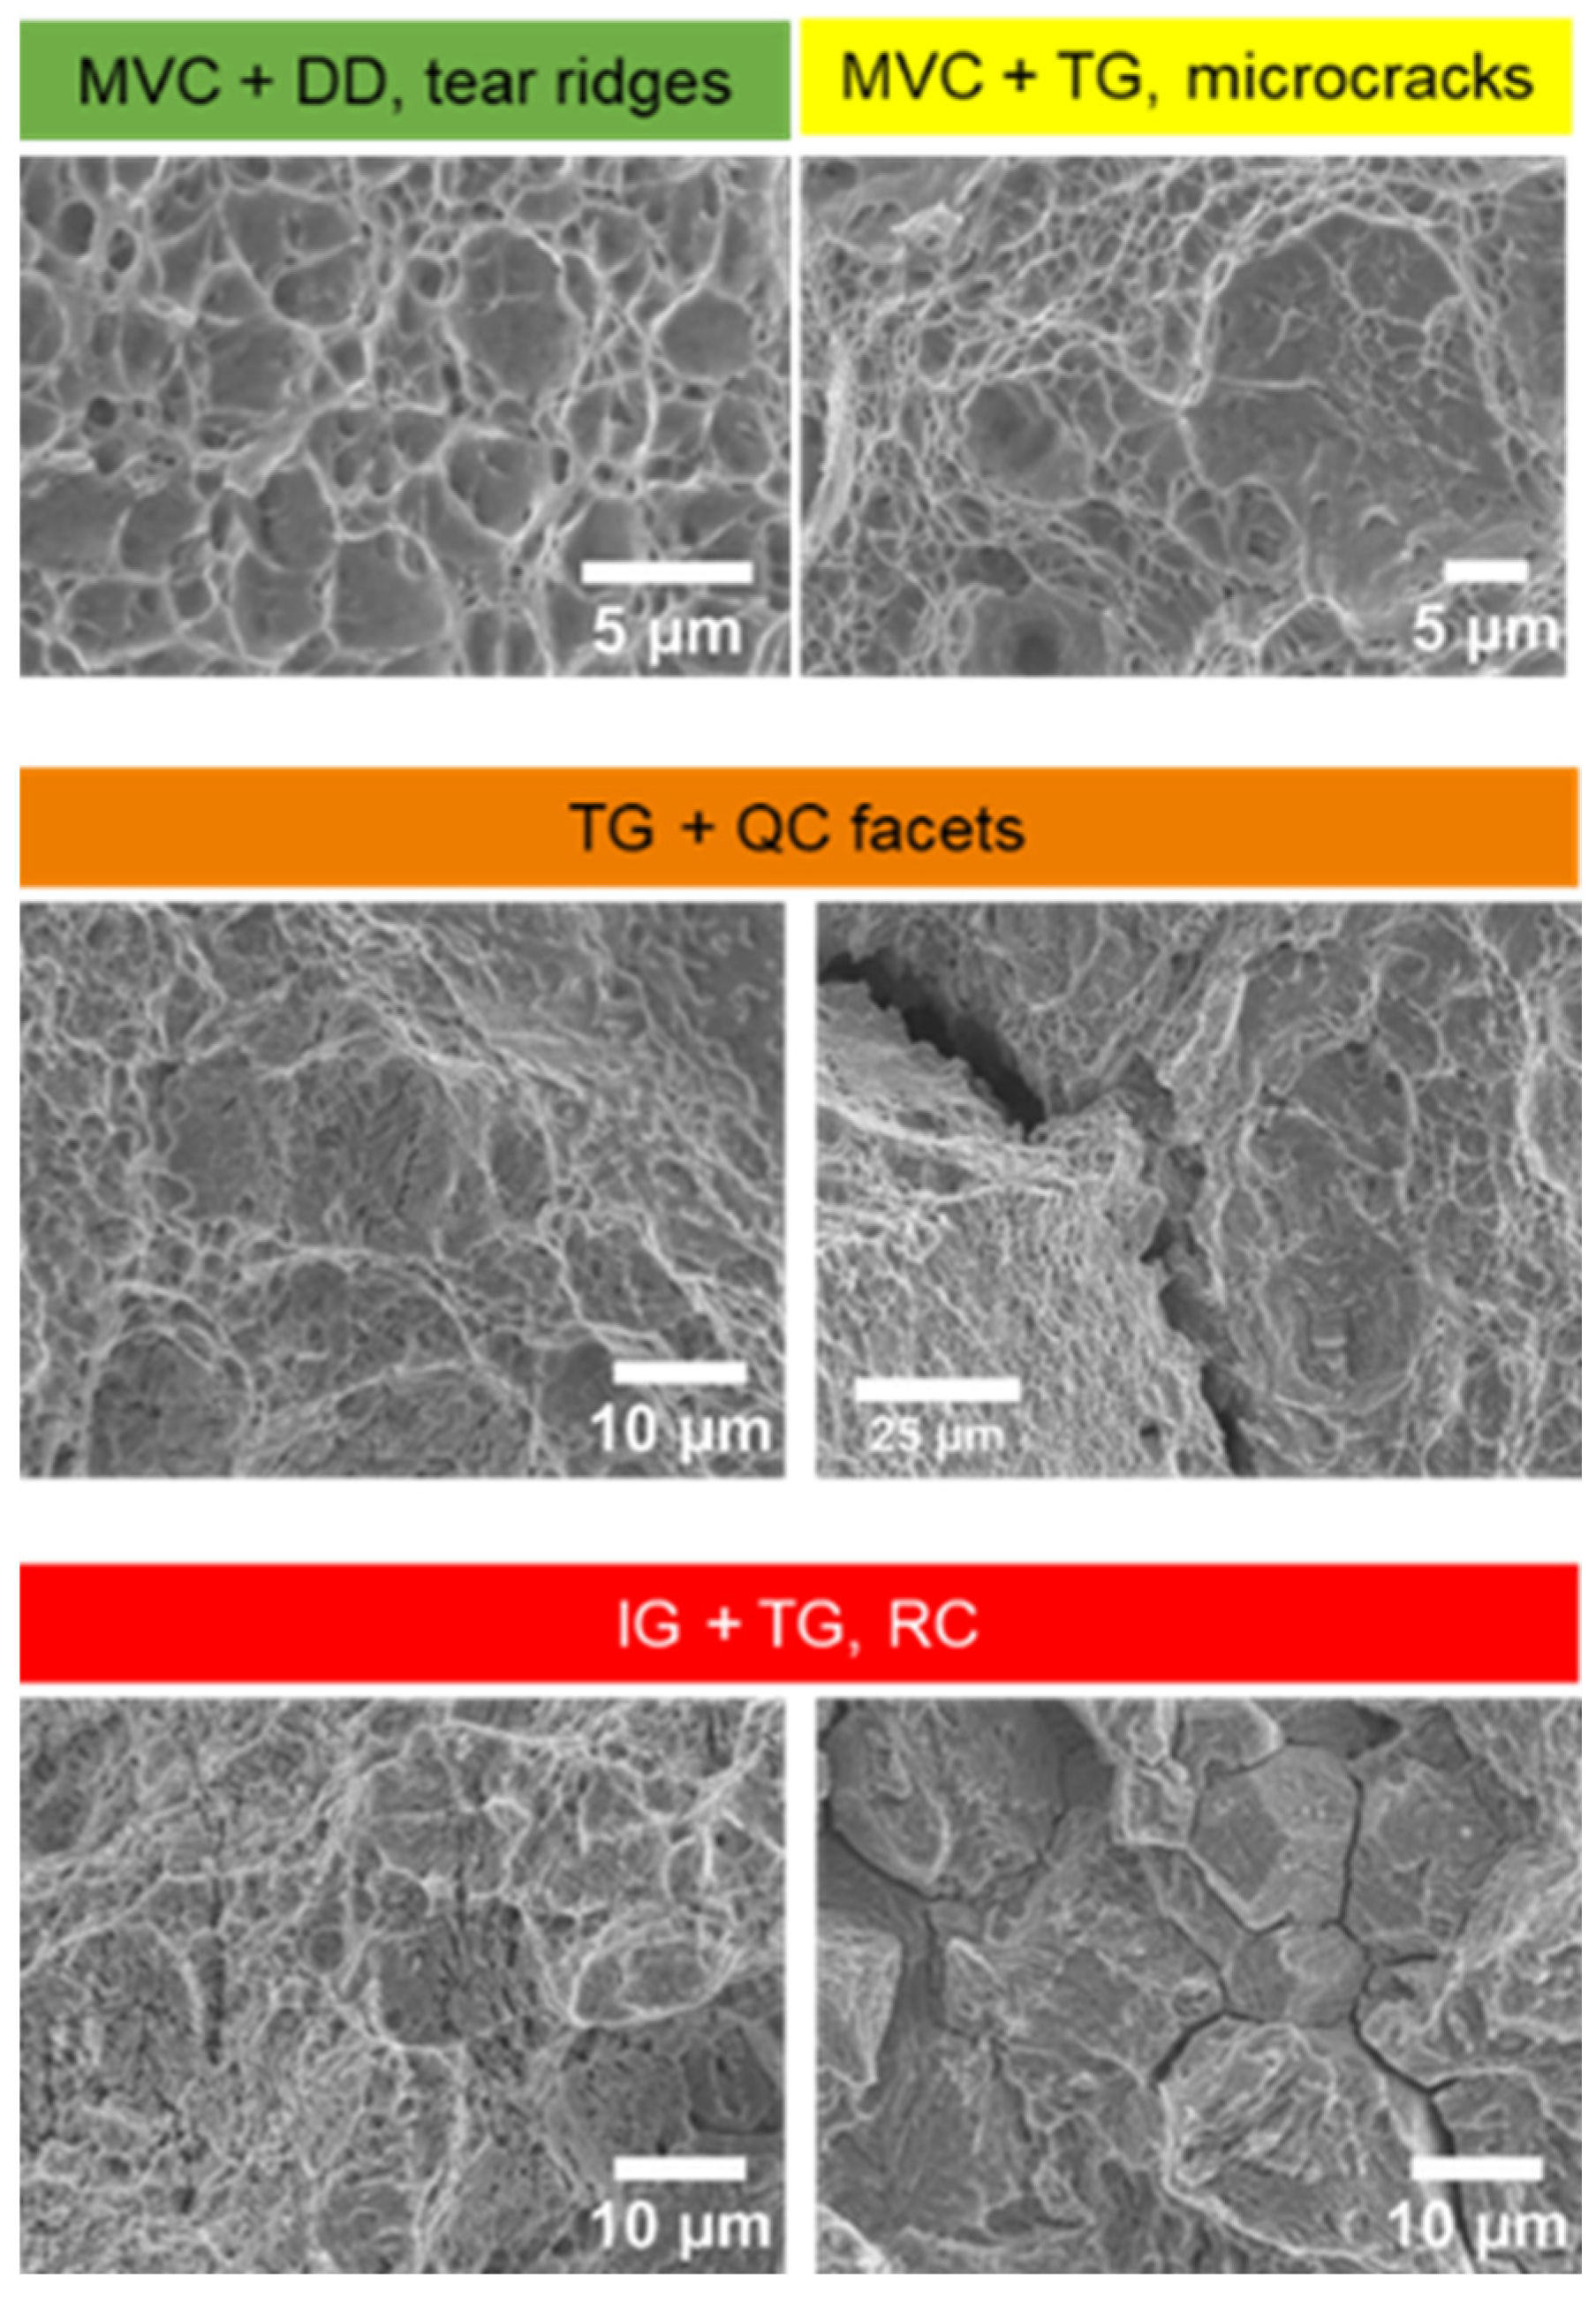
2.5. Fractography
3. Results and Discussion
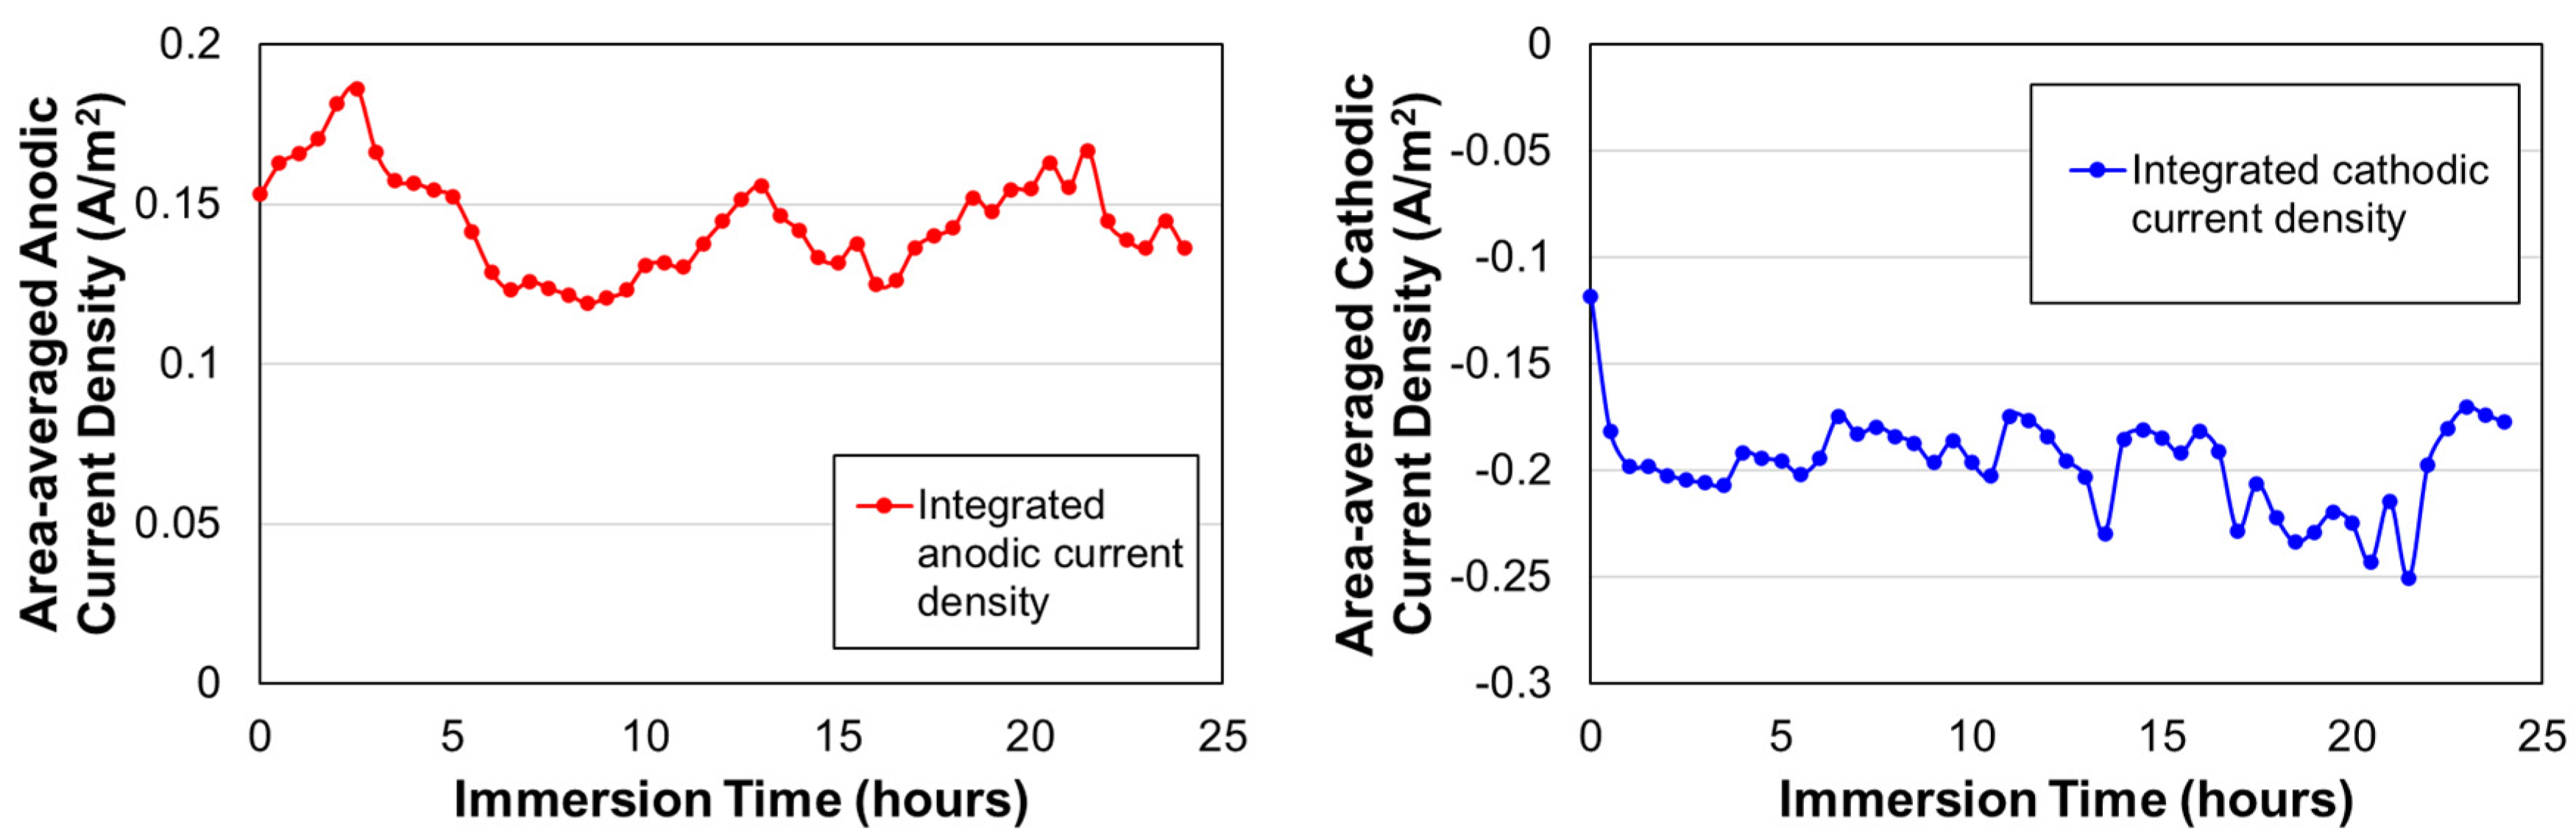
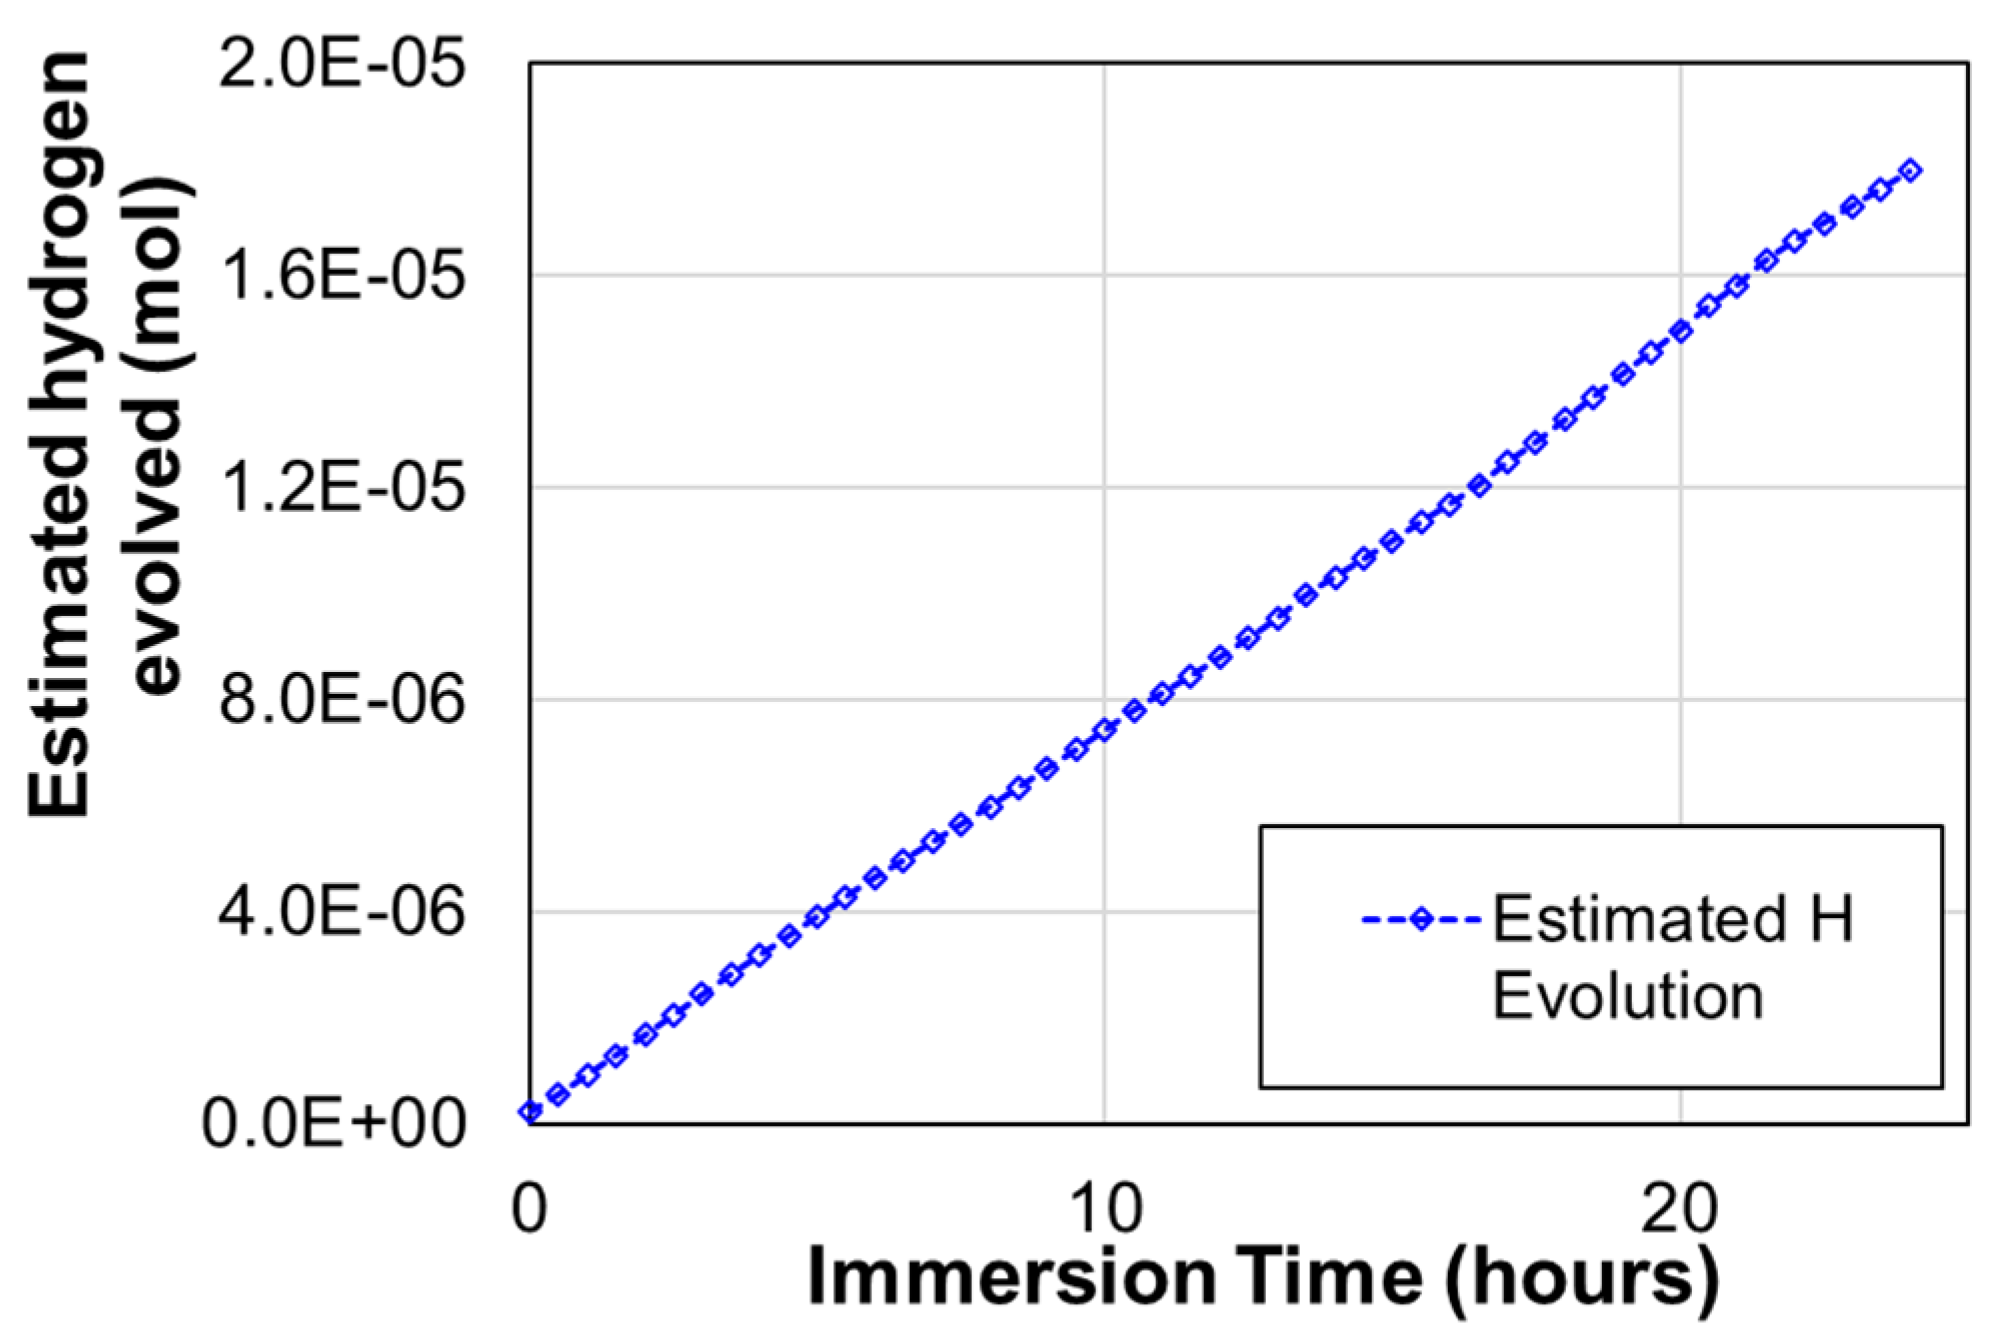
3.1. Effect of Galvanic Corrosion Upon Hydrogen Evolution
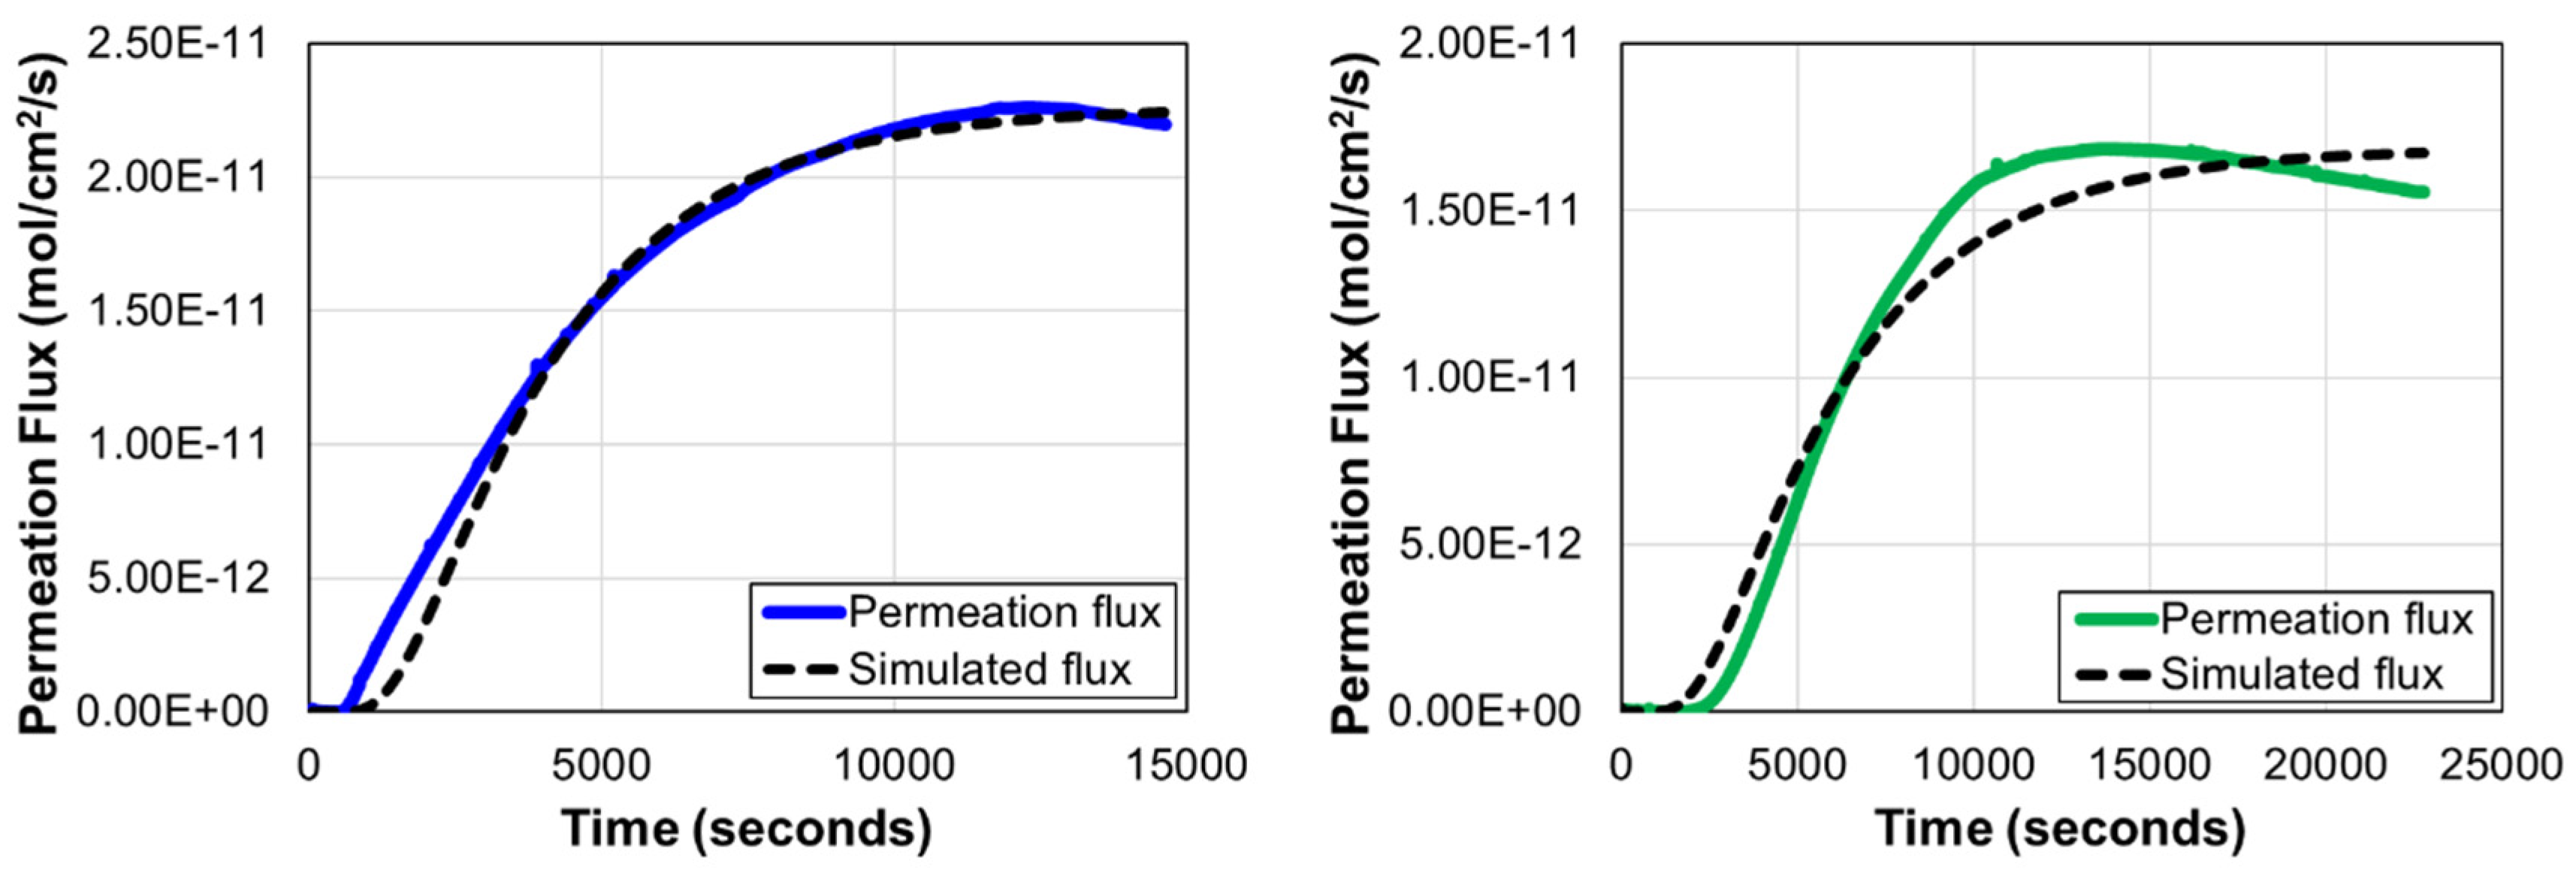
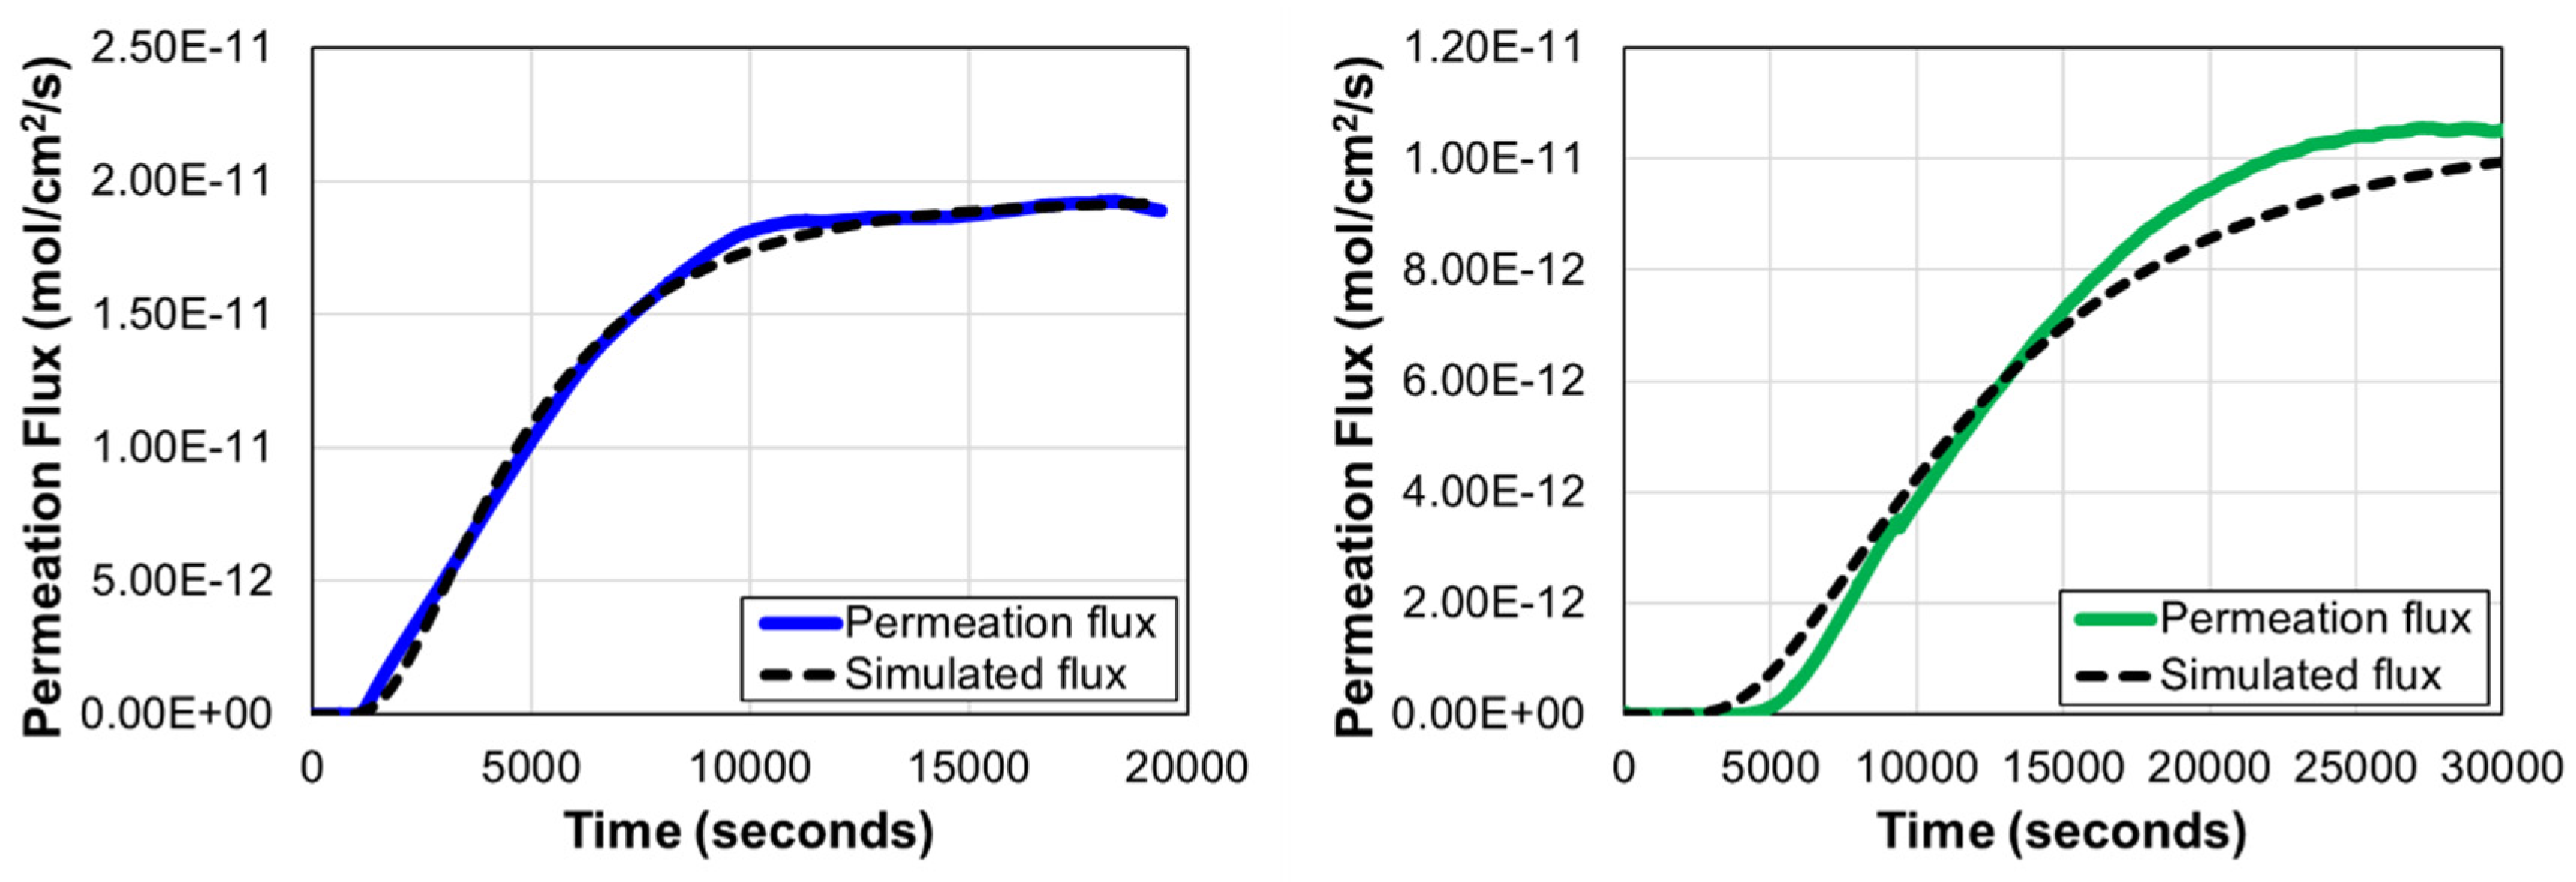
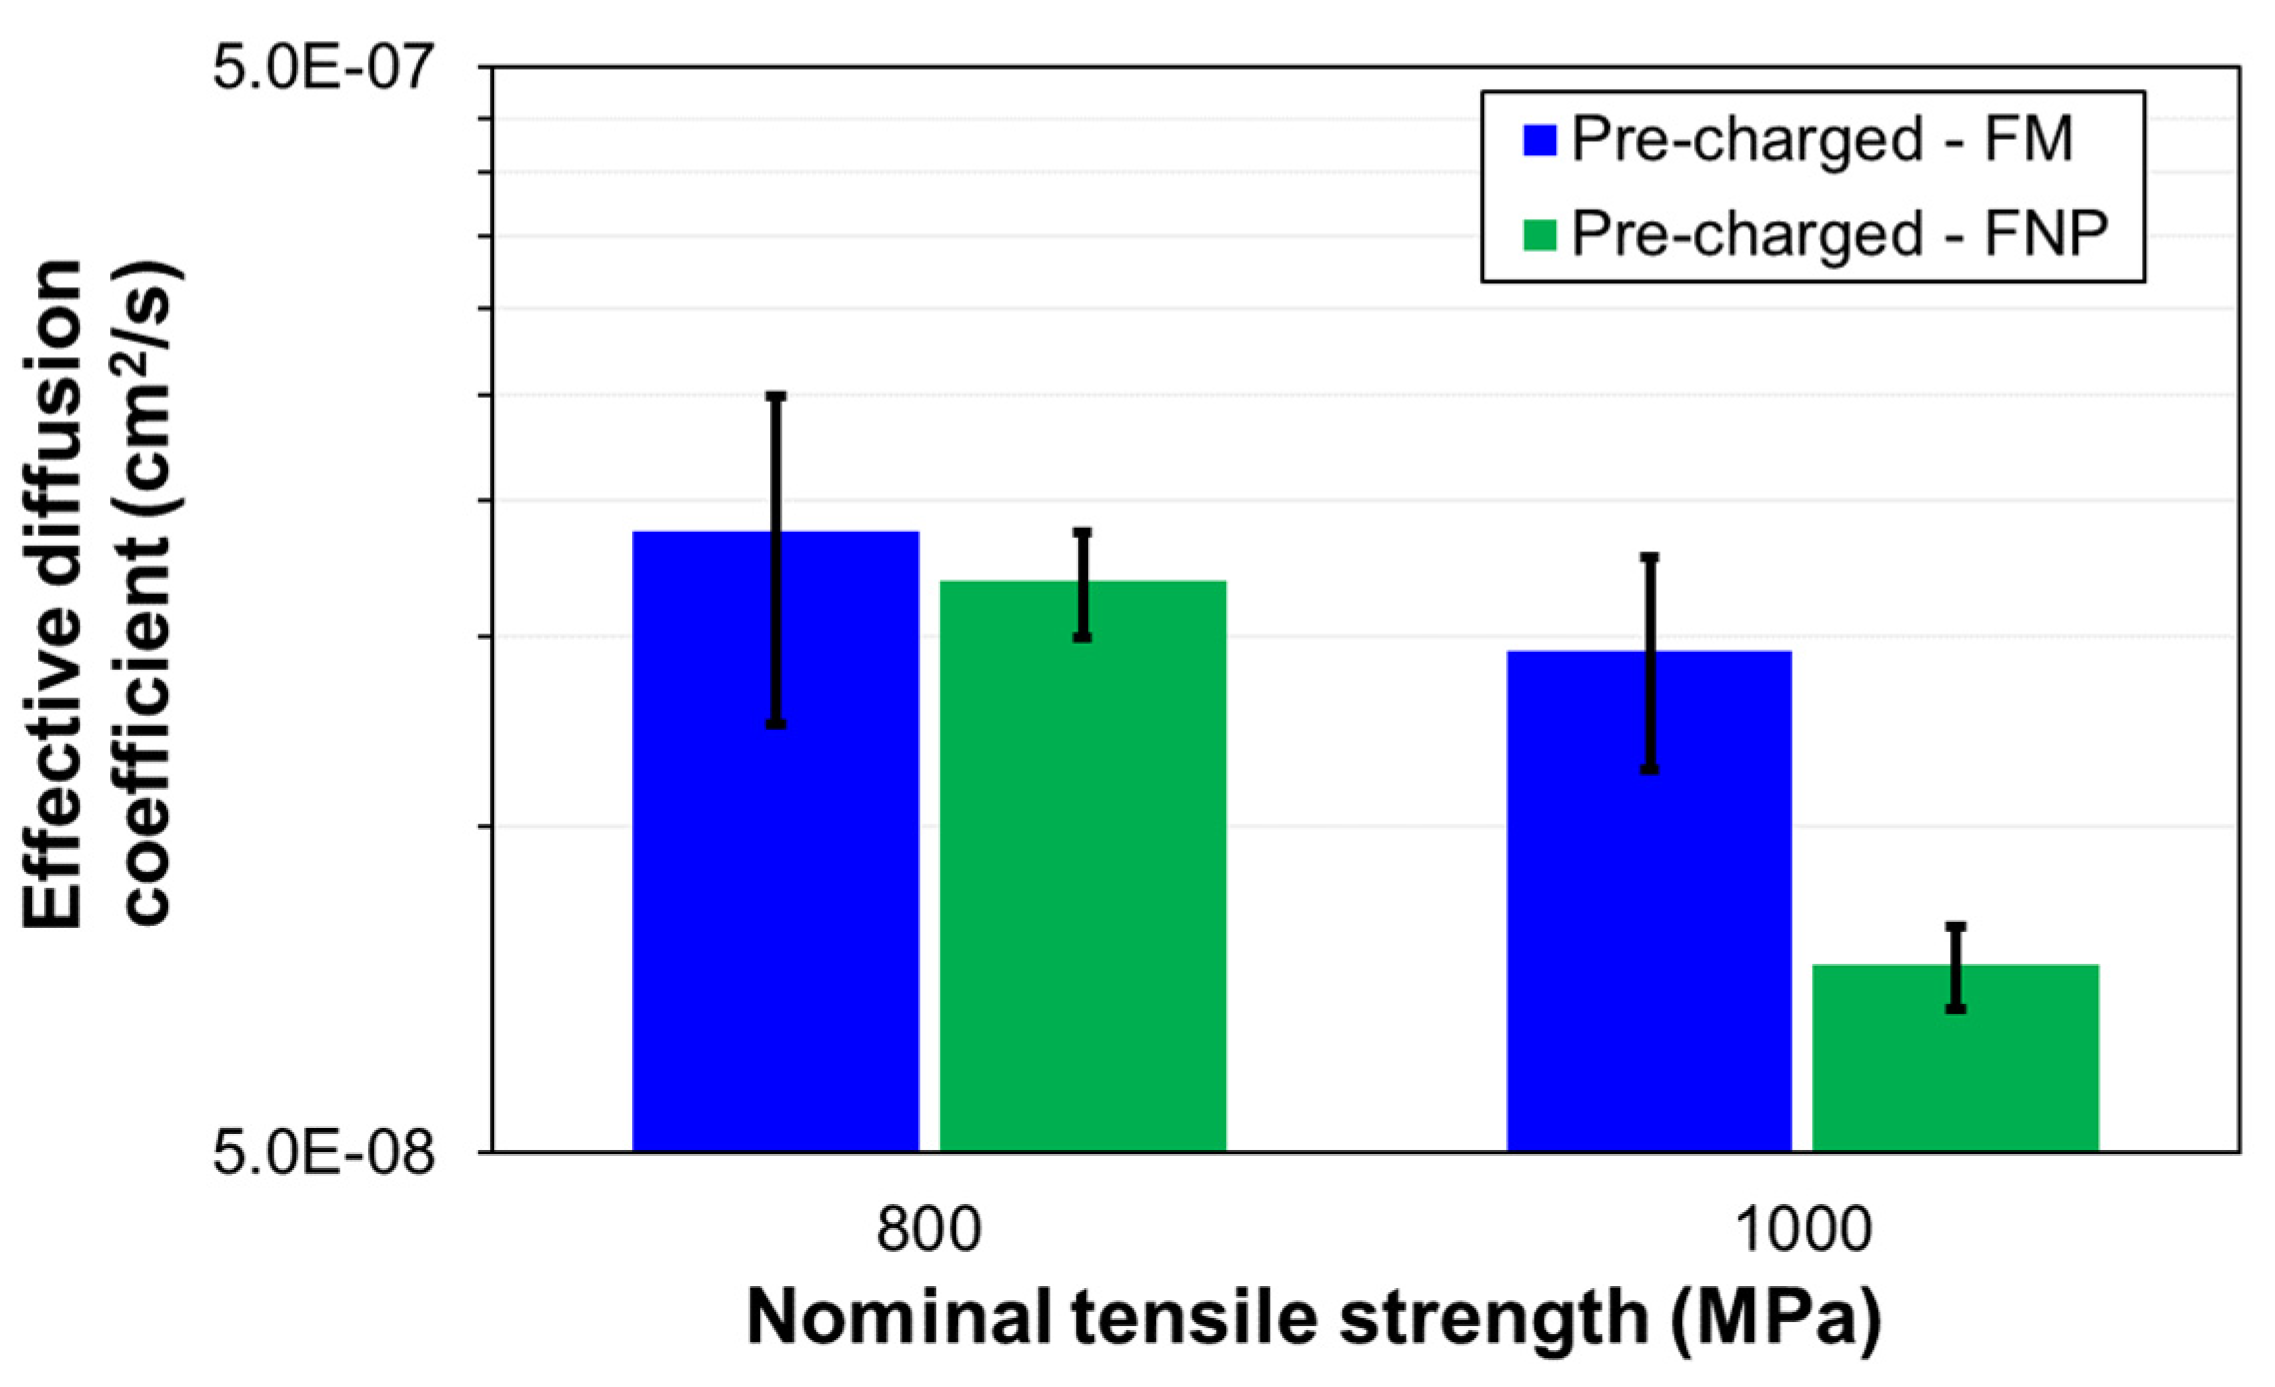
3.2. Hydrogen Diffusion
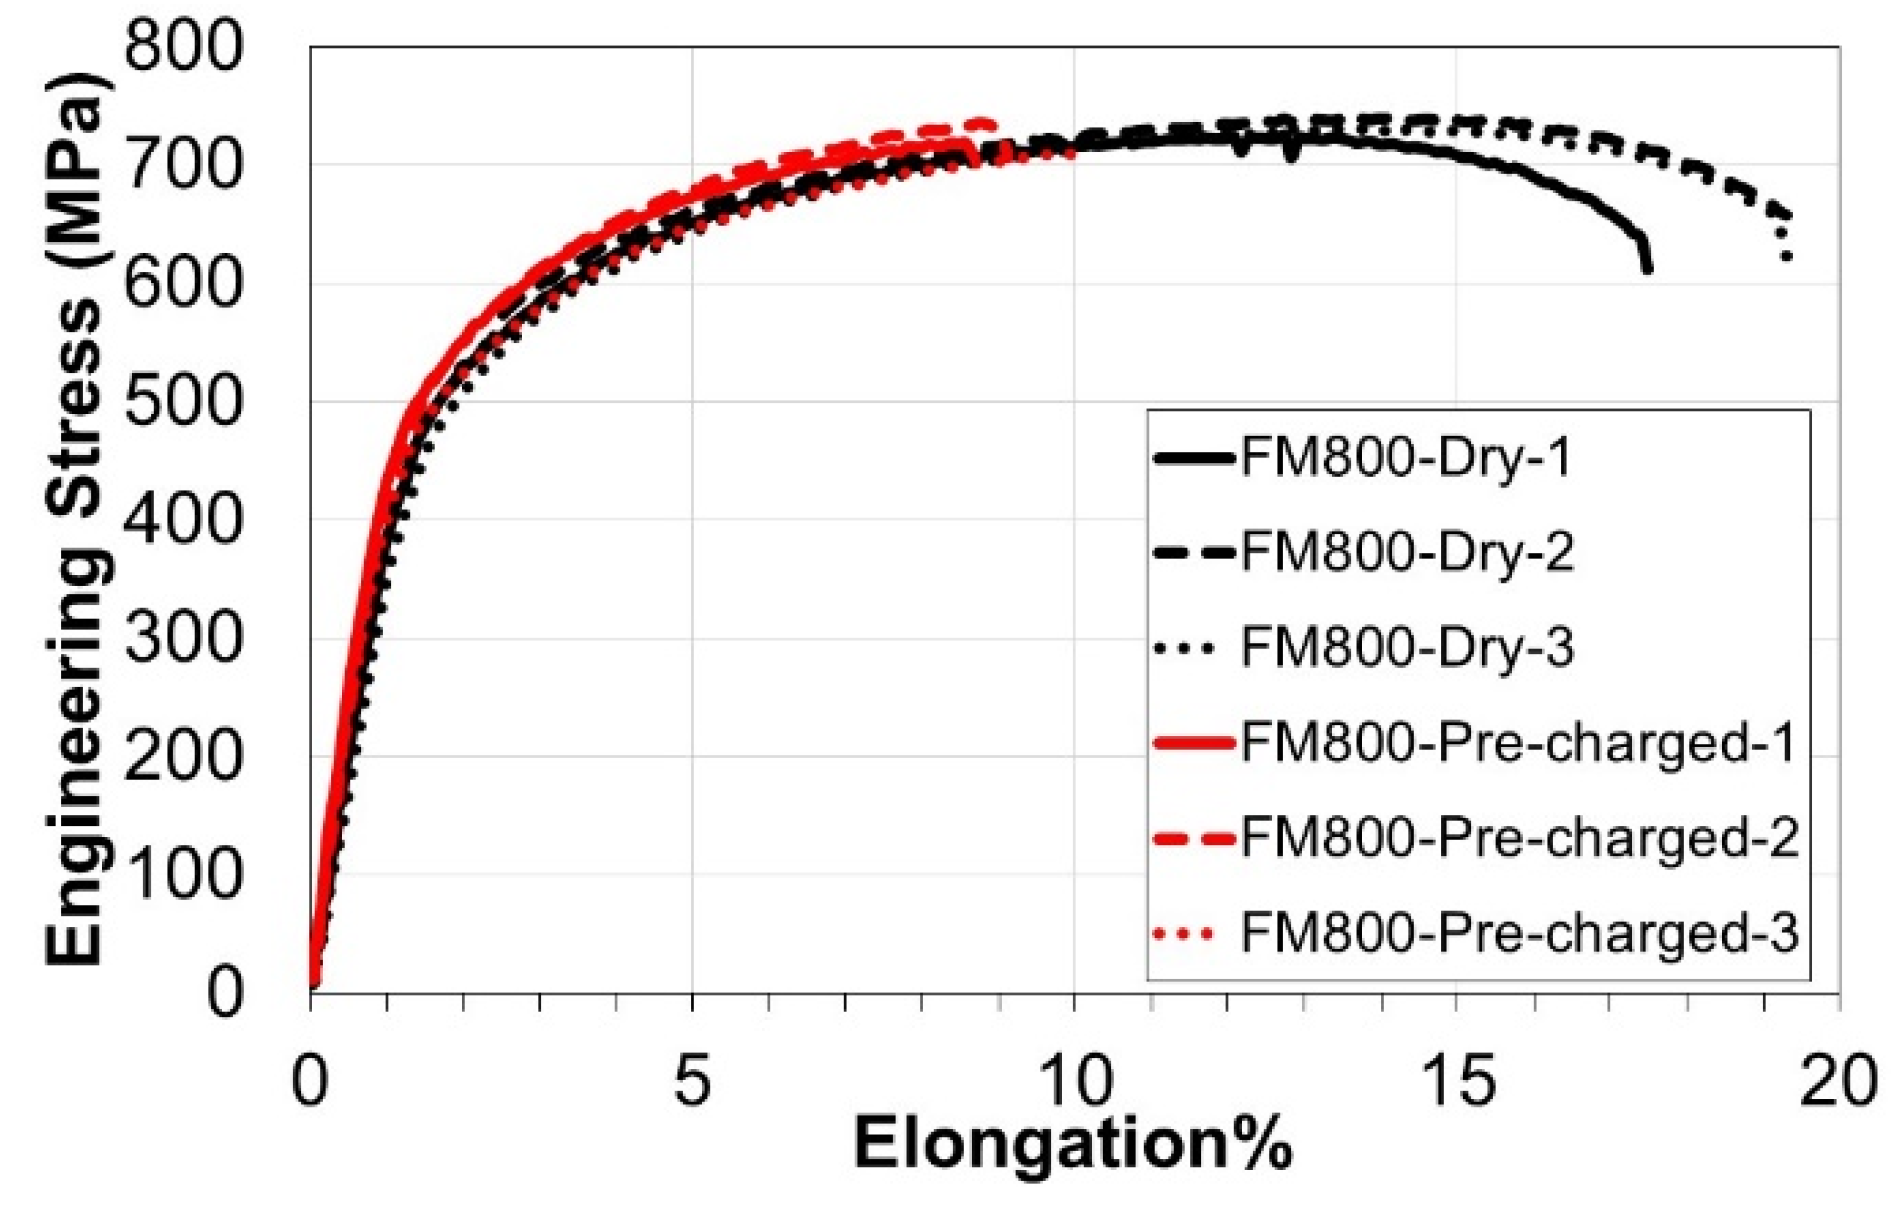
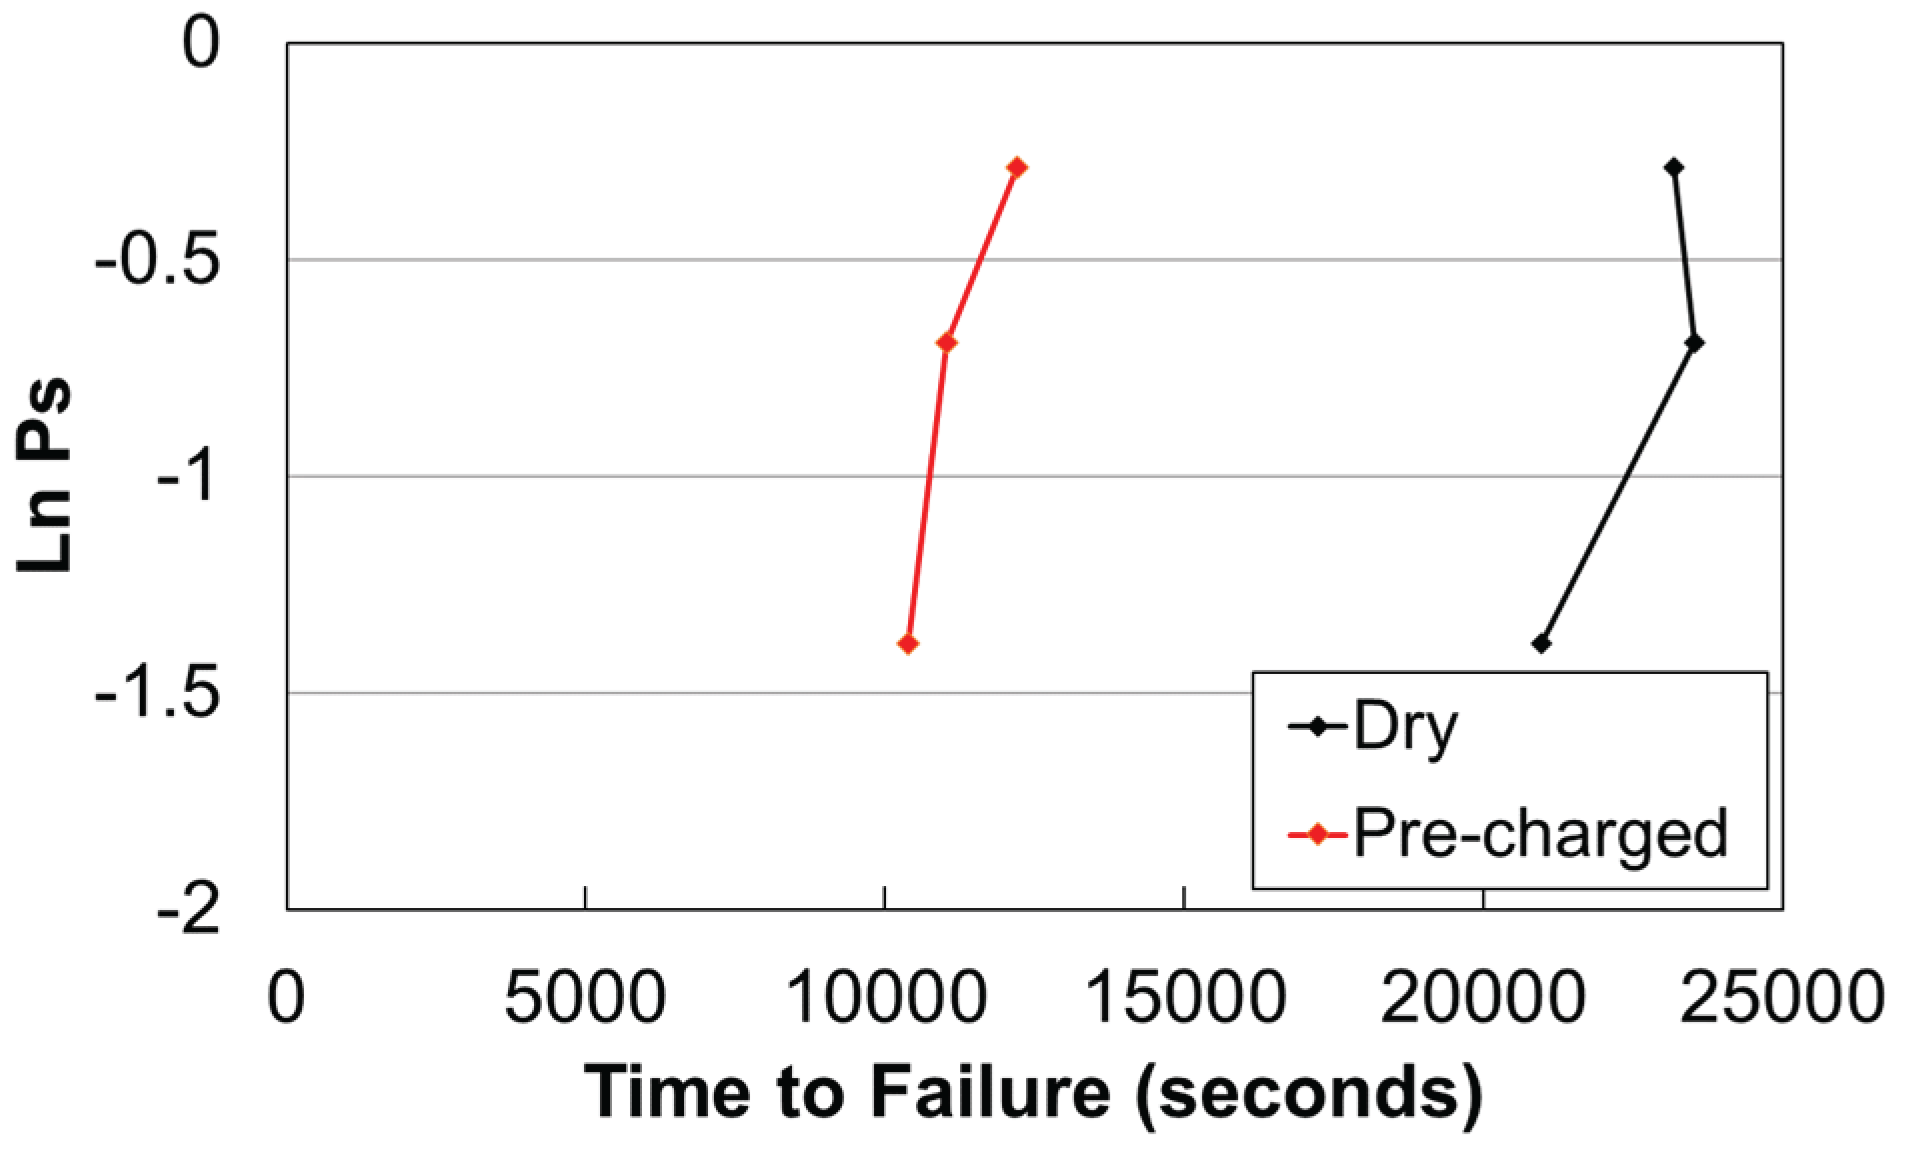
3.3. Slow Strain Rate Tests & Fractography
4. Conclusions
Author Contributions
Funding
Data Availability Statement
Acknowledgments
Conflicts of Interest
Abbreviations
References
- J.A. Lelliott, Hydrogen Embrittlement of Automotive Ultra-High-Strength Steels: Mechanism and Minimisation, Doctor of Engineering, Swansea University, Swansea, 2021. [CrossRef]
- R. Kuziak, R. Kawalla, S. Waengler, Advanced high strength steels for automotive industry, Archives of Civil and Mechanical Engineering. 2008, 8, 103–117. [CrossRef]
- C.T. Broek, FutureSteelVehicle: leading edge innovation for steel body structures, Ironmaking & Steelmaking. 2013, 39, 477–492. [CrossRef]
- Regulation (EU) No 333/2014 of the European Parliament and of the Council of 11 March 2014 Amending Regulation (EC) No 443/2009 to Define the Modalities for Reaching the 2020 Target to Reduce CO2 Emissions from New Passenger Cars, Official Journal of the European Union 2014.
- C.M. Tamarelli, AHSS 101: the evolving use of advanced high strength steels for automotive applications, 2011, Autosteel, 2011.
- R.L. Higginson, C.M. R.L. Higginson, C.M. Sellars, Worked examples in quantitative metallography, Maney Pub, 2003.
- A. Kumar, S.B. Singh, K.K. Ray, Influence of bainite/martensite-content on the tensile properties of low carbon dual-phase steels, Materials Science and Engineering: A. 2008, 474, 270–282. [CrossRef]
- D. Katundi, A. Tosun-Bayraktar, E. Bayraktar, D. Toueix, Corrosion behaviour of the welded steel sheets used in automotive industry, Journal of Achievements in Materials and Manufacturing Engineering. 2010, 38, www.journalamme.org.
- G. Chalaftris, M.J. Robinson, Hydrogen re-embrittlement of high strength steel by corrosion of cadmium and aluminium based sacrificial coatings, Corrosion Engineering Science and Technology. 2005, 40, 28–32. [CrossRef]
- J. Bockris, J. McBreen, L. Nanis, The Hydrogen Evolution Kinetics and Hydrogen Entry into α-Iron, J Electrochem Soc. 1965, 112, 1025–1031.
- G. Williams, H.N. McMurray, Localized corrosion of magnesium in chloride-containing electrolyte studied by a scanning vibrating electrode technique, J Electrochem Soc. 2008, 155, C340–C349.
- H.N. Mcmurray, D. Williams, D.A. Worsley, Artifacts Induced by Large-Amplitude Probe Vibrations in Localized Corrosion Measured by SVET, J Electrochem Soc. 2003, 150, 12–567. [CrossRef]
- H.K.D.H. Bhadeshia, Prevention of Hydrogen Embrittlement in Steels, ISIJ International. 2016, 56, 24–36. [CrossRef]
- C.D. Beachem, A new model for hydrogen-assisted cracking (hydrogen “embrittlement”), Metallurgical Transactions. 1972, 3, 441–455.
- I.M. Robertson, P. Sofronis, A. Nagao, M.L. Martin, S. Wang, D.W. Gross, K.E. Nygren, Hydrogen Embrittlement Understood, Metallurgical and Materials Transactions B. 2015, 46, 1085–1103. [CrossRef]
- W.H. Johnson, On some remarkable changes produced in iron and steel by the action of hydrogen and acids, Nature. 1875, 11, 393. [CrossRef]
- M.A. V Devanathan, Z. Stachurski, The adsorption and diffusion of electrolytic hydrogen in palladium, Proc. R. Soc. Lond. A. 1962, 270, 90–102.
- S. Meister, Grain and particle analysis with line intersection method, Software, 2012, https://uk.mathworks.com/matlabcentral/fileexchange/35203-grain-and-particle-analysis-with-line-intersection-method.
- E. Frank, M.A. Hall, I.H. Witten, The WEKA Workbench, Online Appendix for “Data Mining: Practical Machine Learning Tools and Techniques”, 4th Edn. Morgan Kaufman, Burlington 2009.
- A. Saai, O.S. Hopperstad, Y. Granbom, O.G. Lademo, Influence of Volume Fraction and Distribution of Martensite Phase on the Strain Localization in Dual Phase Steels, Procedia Materials Science. 2014, 3, 900–905. [CrossRef]
- Y. Bergström, Y. Granbom, D. Sterkenburg, A Dislocation-Based Theory for the Deformation Hardening Behavior of DP Steels: Impact of Martensite Content and Ferrite Grain Size, Journal of Metallurgy 2010, 1–16. [CrossRef]
- J. Sullivan, N. Cooze, C. Gallagher, T. Lewis, T. Prosek, D. Thierry, In-situ monitoring of corrosion mechanisms and phosphate inhibitor surface deposition during corrosion of Zinc Magnesium Aluminium (ZMA) alloys using novel time-lapse microscopy, Faraday Discuss 180 2015, 361–379. http://rsc.li/fd-upcoming-meetings (accessed July 14, 2020).
- B.S. Institute, BS EN ISO 17081:2014. Method of measurement of hydrogen permeation and determination of hydrogen uptake and transport in metals by an electrochemical technique, 2014.
- D. Figueroa, M.J. Robinson, Hydrogen transport and embrittlement in 300 M and AerMet100 ultra high strength steels, Corros Sci. 2010, 52, 1593–1602. [CrossRef]
- M.J. Robinson, R.M. Sharp, The Effect of Post-Exposure Heat Treatment on the Hydrogen Embrittlement of High Carbon Steel, Corrosion. 1985, 41, 582–586. [CrossRef]
- E. Akiyama, S. Li, Electrochemical hydrogen permeation tests under galvanostatic hydrogen charging conditions conventionally used for hydrogen embrittlement study, Corrosion Reviews. 2016, 34, 103–112.
- L. Lan, X. Kong, Z. Hu, C. Qiu, D. Zhao, L. Du, Hydrogen permeation behavior in relation to microstructural evolution of low carbon bainitic steel weldments, Corros Sci. 2016, 112, 180–193. [CrossRef]
- E. Van den Eeckhout, T. Depover, K. Verbeken, The Effect of Microstructural Characteristics on the Hydrogen Permeation Transient in Quenched and Tempered Martensitic Alloys, Metals (Basel). 2018, 8. [CrossRef]
- M. Dadfarnia, P. Sofronis, T. Neeraj, Hydrogen interaction with multiple traps: Can it be used to mitigate embrittlement?, Int J Hydrogen Energy. 2011, 36, 10141–10148. [CrossRef]
- [M. Iino, Trapping of hydrogen by sulfur-associated defects in steel, Metallurgical Transactions A. 1985, 16, 401–409.
- A. Rijkenberg, A. Blowey, P. Bellina, C. Wooffindin, Advanced High Stretch-Flange Formability Steels for Chassis & Suspension Applications, in: Conf. on Steels in Cars and Trucks, 2014: pp. 426–433.
- T. Depover, K. Verbeken, The effect of TiC on the hydrogen induced ductility loss and trapping behavior of Fe-C-Ti alloys, Corros Sci. 2016, 112, 308–326. [CrossRef]
- T. Depover, O. Monbaliu, E. Wallaert, K. Verbeken, Effect of Ti, Mo and Cr based precipitates on the hydrogen trapping and embrittlement of Fe–C–X Q&T alloys, Int J Hydrogen Energy. 2015, 40, 16977–16984. [CrossRef]
- T. Depover, A. Laureys, D. Perez Escobar, E. Van den Eeckhout, E. Wallaert, K. Verbeken, Understanding the Interaction between a Steel Microstructure and Hydrogen, Materials (Basel). 2018, 11. [CrossRef]
- J. Lee, T. Lee, Y.J. Kwon, D.-J. Mun, J.-Y. Yoo, C.S. Lee, Effects of vanadium carbides on hydrogen embrittlement of tempered martensitic steel, Metals and Materials International. 2016, 22, 364–372. [CrossRef]
- T. Maki, 2 - Morphology and substructure of martensite in steels, in: E. Pereloma, D. V Edmonds (Eds.), Phase Transformations in Steels, Woodhead Publishing, 2012: pp. 34–58. [CrossRef]
- K. Takai, J. Seki, Y. Homma, Observation of Trapping Sites of Hydrogen and Deuterium in High-Strength Steels by Using Secondary Ion Mass Spectrometry, Materials Transactions, JIM. 1995, 36, 1134–1139. [CrossRef]
- H. Hagi, Diffusion Coefficient of Hydrogen in Iron without Trapping by Dislocations and Impurities, Materials Transactions, JIM. 1994, 35, 112–117. [CrossRef]
- H. Hagi, Y. Hayashi, Effect of Dislocation Trapping on Hydrogen and Deuterium Diffusion in Iron., Transactions of the Japan Institute of Metals. 1987, 28, 368–374. [CrossRef]
- M. Koyama, C.C. Tasan, E. Akiyama, K. Tsuzaki, D. Raabe, Hydrogen-assisted decohesion and localized plasticity in dual-phase steel, Acta Mater. 2014, 70, 174–187. [CrossRef]
- K. Takashima, T. Nishimura, K. Yokoyama, Y. Funakawa, Role of Interface between Ferrite and Martensite in Hydrogen Embrittlement Behavior of Ultra-high Strength Dual-phase Steel Sheets, ISIJ International. 2019, 59, 1676–1682. [CrossRef]

| Steel | C | Si | Mn | Cr | Mo | Nb | Ti | V | B |
| FM800 | 0.136 | 0.236 | 1.692 | 0.553 | 0.003 | 0.024 | 0.021 | 0.003 | 0.0002 |
| FNP800 | 0.0611 | 0.189 | 1.373 | 0.016 | 0.141 | 0.061 | 0.002 | 0.212 | 0.0002 |
| FM1000 | 0.149 | 0.041 | 2.222 | 0.548 | 0.005 | 0.014 | 0.026 | 0.006 | 0.0001 |
| FNP1000 | 0.1037 | 0.201 | 1.396 | 0.023 | 0.292 | 0.05 | 0.003 | 0.286 | 0.0002 |
| Product | Rp0.2 [MPa] |
Rm [MPa] |
Ag [%] |
A50 [%] |
| FM800 | 488 (± 2) | 782 (± 4) | 12.5 (± 0.1) | 19.7 (± 0.3) |
| FNP800 | 747 (±12) | 826 (± 5) | 9.3 (± 0.3) | 17.2 (± 1.5) |
| FM1000 | 700 (± 5) | 1027 (± 9) | 7.8 (± 0.3) | 13.5 (± 0.4) |
| FNP1000 | 862 (± 8) | 982 (± 3) | 8.2 (± 0.1) | 16.7 (± 0.3) |
| Product | Mean Embrittlement Index % | t-statistic | p-value | Power | |
| FM800 | 50.30% (± 3.5%) | 11.773 | 2.98×10⁻⁴ | 1 | |
| FNP800 | 32.40% ( ±16.7%) | 2.168 | 0.096 | 0.38 | |
| FM1000 | 75.60% (± 0.6%) | 66.706 | 3.03×10⁻⁷ | 1 | |
| FNP1000 | 43.80% (± 11.5%) | 5.186 | 6.58×10⁻³ | 0.97 |
 |
Disclaimer/Publisher’s Note: The statements, opinions and data contained in all publications are solely those of the individual author(s) and contributor(s) and not of MDPI and/or the editor(s). MDPI and/or the editor(s) disclaim responsibility for any injury to people or property resulting from any ideas, methods, instructions or products referred to in the content. |
© 2025 by the authors. Licensee MDPI, Basel, Switzerland. This article is an open access article distributed under the terms and conditions of the Creative Commons Attribution (CC BY) license (http://creativecommons.org/licenses/by/4.0/).


