
Submitted:
21 October 2025
Posted:
22 October 2025
You are already at the latest version
Abstract
Background/Objectives: This study aimed to evaluate the diagnostic utility of mean platelet volume (MPV) and hematological inflammatory ratios (NLR, PLR, LMR) in brucellosis, and to develop a combined diagnostic model integrating these parameters with ESR and CRP for cost-effective diagnosis in endemic areas. Methods: This retrospective case-control study included 50 patients with confirmed brucellosis and 50 age-matched healthy controls at Balıkesir University Hospital (2015-2018). Brucellosis was confirmed by positive blood culture or Standard Agglutination Test ≥1/160 with compatible symptoms. CBC parameters, ESR, and CRP were measured at diagnosis. MPV, NLR, PLR, and LMR were calculated and compared between groups. ROC curve analysis evaluated diagnostic performance, and multivariate logistic regression developed a combined diagnostic model. Results: Brucellosis patients showed significantly lower MPV (8.04±0.95 vs 8.56±0.69 fL, p=0.002) and NLR (median: 1.69 vs 2.07, p=0.013), higher platelet counts (305.0±116.0 vs 246.0±55.2 ×10³/μL, p=0.002) and LMR (median: 5.28 vs 4.12, p=0.008), while PLR showed no difference. ESR and CRP were elevated (both p< 0.001). ROC analysis showed ESR had the best individual performance (AUC=0.842), followed by CRP (AUC=0.724), MPV (AUC=0.697), LMR (AUC=0.681), and NLR (AUC=0.644). The combined model (MPV+ESR+CRP) achieved superior performance (AUC=0.891) with 84% sensitivity and 86% specificity. Focal complications showed lower MPV (p=0.038). Conclusions: Brucellosis presents a unique hematological profile with decreased MPV and NLR but elevated LMR. The combined MPV+ESR+CRP model demonstrated excellent diagnostic accuracy, offering a cost-effective approach for early diagnosis in resource-limited endemic settings, with lower MPV associated with complicated disease and prognostic value.
Keywords:
brucellosis
; mean platelet volume
; neutrophil-to-lymphocyte ratio
; lymphocyte-to-monocyte ratio
; inflammatory biomarkers
; diagnostic model
1. Introduction
Brucellosis, caused by intracellular bacteria of the genus Brucella, represents one of the most prevalent zoonotic infections worldwide, with over 500,000 new cases reported annually [1]. The disease burden is particularly significant in the Mediterranean basin, Middle East, Latin America, and parts of Asia, where it poses substantial challenges to both public health systems and agricultural economies [2,3]. Despite advances in diagnostic techniques and therapeutic interventions, brucellosis continues to cause considerable morbidity due to its protean clinical manifestations and tendency for chronicity [4].
The pathophysiology of brucellosis involves complex host-pathogen interactions characterized by Brucella’s unique ability to survive and replicate within macrophages [5]. This intracellular lifestyle triggers a cascade of inflammatory responses involving both innate and adaptive immunity. The resulting inflammatory milieu is characterized by the production of various cytokines, including interleukin-6 (IL-6), tumor necrosis factor-alpha (TNF-α), and interferon-gamma (IFN-γ), which orchestrate the host’s attempt to control the infection while potentially contributing to tissue damage and clinical manifestations [6,7].
In recent years, there has been growing interest in identifying simple, cost-effective biomarkers that can aid in the diagnosis and monitoring of infectious diseases. Complete blood count (CBC) parameters and their derived ratios have emerged as promising candidates due to their widespread availability, rapid turnaround time, and minimal additional cost [8]. These parameters reflect dynamic changes in circulating blood cells during inflammatory states and may provide valuable insights into disease activity and prognosis [9].
Mean platelet volume (MPV) represents the average size of platelets in circulation and serves as an indicator of platelet activation and function [10]. During inflammatory states, alterations in MPV can result from various mechanisms, including increased platelet consumption at sites of inflammation, bone marrow suppression by inflammatory cytokines, or compensatory thrombopoiesis [11]. The neutrophil-to-lymphocyte ratio (NLR) has gained recognition as a simple yet informative marker of systemic inflammation, reflecting the balance between innate and adaptive immune responses [12]. Similarly, the platelet-to-lymphocyte ratio (PLR) integrates information about both thrombotic and inflammatory pathways [13]. More recently, the lymphocyte-to-monocyte ratio (LMR) has emerged as a potential biomarker, with studies suggesting its utility in various inflammatory and infectious conditions [14].
Despite the growing body of literature on these hematological indices, their specific roles in brucellosis remain incompletely understood. Limited studies have examined MPV, NLR, PLR, and LMR in brucellosis patients, often with conflicting results and methodological limitations [15,16]. Most existing studies have focused on pediatric populations or specific clinical forms of brucellosis, leaving significant gaps in our understanding of these markers in adult patients with various disease manifestations [17].
The rationale for investigating these markers in brucellosis is multifaceted. First, the often subtle and non-specific presentation of brucellosis can lead to diagnostic delays, particularly in non-endemic areas where clinical suspicion may be low [18]. Simple biomarkers that could aid in early recognition or risk stratification would be valuable additions to the diagnostic armamentarium. Second, in resource-limited settings where specialized serological tests may not be readily available, these routine hematological parameters could provide supportive evidence for clinical decision-making [19]. Third, understanding the behavior of these markers in brucellosis could provide insights into the pathophysiological mechanisms underlying the disease and potentially identify targets for therapeutic intervention [20].
This study was designed to comprehensively evaluate the diagnostic utility of MPV, NLR, PLR, and LMR in adult patients with brucellosis compared to age-matched healthy controls. We hypothesized that these readily available hematological indices would demonstrate significant alterations in brucellosis patients, reflecting the underlying inflammatory state, and could potentially serve as adjunctive diagnostic markers. Additionally, we aimed to develop a combined diagnostic model integrating these parameters with traditional inflammatory markers (ESR and CRP), assess their individual and collective diagnostic performance through ROC curve analysis, and evaluate their potential for risk stratification and prognosis assessment. Our findings may contribute to improved understanding of the hematological changes in brucellosis and guide the development of cost-effective diagnostic strategies for this important zoonotic disease.
2. Materials and Methods
2.1. Study Design and Setting
This retrospective case-control study was conducted at the Department of Infectious Diseases and Clinical Microbiology, Balıkesir University Faculty of Medicine, Turkey, between January 2015 and December 2018. The study protocol was approved by the Balıkesir University Faculty of Medicine Clinical Research Ethics Committee (Decision No: 2018/28, Date: 31/01/2018). Due to the retrospective nature of the study, the requirement for informed consent was waived by the ethics committee. All procedures were performed in accordance with the ethical standards of the institutional research committee and with the 1964 Helsinki Declaration and its later amendments. The study follows the STROBE (Strengthening the Reporting of Observational Studies in Epidemiology) guidelines for reporting observational studies.
2.2. Study Population
2.2.1. Patient Group
Fifty patients diagnosed with brucellosis were included in the study. Inclusion criteria were: (1) age ≥18 years; (2) confirmed diagnosis of brucellosis based on compatible clinical symptoms (fever, arthralgia, malaise, night sweats) and either positive blood culture for Brucella spp. or Standard tube agglutination test (SAT) titer ≥1/160; (3) availability of complete blood count data at diagnosis before treatment initiation; and (4) complete medical records including demographic and clinical data.
Exclusion criteria comprised: (1) concurrent infections or inflammatory conditions; (2) hematological disorders or malignancies; (3) chronic liver disease (Child-Pugh class B or C) or kidney disease (eGFR <60 mL/min/1.73m2); (4) use of medications affecting blood cell counts (corticosteroids, immunosuppressants, antiplatelet agents) within 30 days prior to diagnosis; (5) pregnancy or lactation; (6) autoimmune diseases; (7) recent surgery or trauma within 3 months; and (8) incomplete laboratory data.
2.2.2. Control Group
Fifty healthy controls were recruited from individuals attending the hospital for routine health check-ups during the same study period. Controls were age-matched (±5 years) to the patient group. Inclusion criteria for controls were: (1) no acute illness or infectious symptoms in the preceding 3 months; (2) no chronic diseases (diabetes mellitus, hypertension, cardiovascular disease, chronic kidney disease, chronic liver disease, autoimmune disorders, malignancy); (3) no regular medication use (including over-the-counter drugs, except vitamins); (4) normal complete blood count parameters; (5) normal inflammatory markers (ESR <20 mm/h for males, <30 mm/h for females; CRP <5 mg/L); (6) normal liver and kidney function tests; (7) no history of brucellosis or other zoonotic diseases; (8) no occupational livestock exposure in the past year; (9) body mass index between 18.5-30 kg/m2; and (10) no history of smoking or alcohol abuse.
2.3. Data Collection
Data were retrospectively collected from electronic medical records and laboratory information systems using a standardized data collection form. Two independent researchers extracted the data, with discrepancies resolved by consensus with a third researcher. The following information was recorded:
- Demographic data: age, sex, occupation, residence (rural/urban), and potential exposure history (animal contact, consumption of unpasteurized dairy products)
- Clinical manifestations: fever pattern, arthralgia, constitutional symptoms, gastrointestinal symptoms, and neurological manifestations
- Physical examination findings: temperature at presentation, hepatomegaly, splenomegaly, lymphadenopathy, and focal manifestations
- Laboratory parameters: complete blood count with automated differential, inflammatory markers (ESR and CRP), biochemical tests, and serological tests
2.4. Laboratory Methods
2.4.1. Complete Blood Count Analysis
Complete blood count analysis was performed using Sysmex XN-3000 automated hematology analyzers (Sysmex Corporation, Kobe, Japan) within 2 hours of blood collection in K2-EDTA anticoagulated tubes. The analyzer underwent daily calibration using manufacturer-provided controls with coefficients of variation <3% for all parameters. All blood samples were collected between 8:00-10:00 AM to minimize circadian variation effects. Parameters recorded included white blood cell count (WBC), absolute neutrophil count, absolute lymphocyte count, absolute monocyte count, hemoglobin, hematocrit, platelet count, mean platelet volume (MPV), platelet distribution width (PDW), and red cell distribution width (RDW).
2.4.2. Inflammatory Markers
ESR was measured using the Westergren method in accordance with International Council for Standardization in Haematology recommendations (reference range: 0-20 mm/h for males, 0-30 mm/h for females). CRP levels were quantified by immunoturbidimetric assay on a Cobas c501 analyzer (Roche Diagnostics, Mannheim, Germany) with a detection limit of 0.3 mg/L (reference range: 0-5 mg/L).
2.4.3. Brucellosis Diagnosis
The standard tube agglutination test for brucellosis was performed according to established protocols using commercial antigens (Cromatest, Spain). Serial dilutions were tested, with titers ≥1/160 considered positive in the presence of compatible clinical findings. Blood cultures were performed using BACTEC 9240 automated blood culture system (Becton Dickinson, USA) with extended incubation periods up to 21 days.
2.5. Calculation of Hematological Ratios
The following ratios were calculated from baseline CBC results:
- Neutrophil-to-lymphocyte ratio (NLR) = Absolute neutrophil count (×103/μL) / Absolute lymphocyte count (×103/μL)
- Platelet-to-lymphocyte ratio (PLR) = Platelet count (×103/μL) / Absolute lymphocyte count (×103/μL)
- Lymphocyte-to-monocyte ratio (LMR) = Absolute lymphocyte count (×103/μL) / Absolute monocyte count (×103/μL)
2.6. Sample Size Calculation
Based on preliminary data showing MPV difference of 0.5 fL with standard deviation of 0.8 fL between brucellosis patients and controls, a sample size of 41 subjects per group was calculated to achieve 80% power at α=0.05 (two-tailed) using G*Power 3.1 software. We included 50 subjects per group to account for potential exclusions and increase statistical power.
2.7. Statistical Analysis
Statistical analysis was performed using SPSS version 25.0 (IBM Corporation, Armonk, NY, USA) and MedCalc Statistical Software version 20.0 (MedCalc Software Ltd., Ostend, Belgium). Continuous variables were expressed as mean ± standard deviation (SD) for normally distributed data or median (interquartile range [IQR]) for non-normally distributed data. Categorical variables were presented as frequencies and percentages. The normality of data distribution was assessed using the Shapiro-Wilk test, visual inspection of histograms, and Q-Q plots. Homogeneity of variances was tested using Levene’s test. Comparisons between groups were performed using: (1) independent samples t-test for normally distributed variables with equal variances; (2) Welch’s t-test for normally distributed variables with unequal variances; (3) Mann-Whitney U test for non-normally distributed variables; and (4) Chi-square test or Fisher’s exact test for categorical variables. Receiver operating characteristic (ROC) curve analysis was performed to evaluate the diagnostic performance of individual parameters and combined models. The area under the curve (AUC) with 95% confidence intervals was calculated using the DeLong method. Optimal cut-off values were determined using the Youden index (sensitivity + specificity − 1). Diagnostic performance metrics including sensitivity, specificity, positive predictive value (PPV), negative predictive value (NPV), positive likelihood ratio (LR+), and negative likelihood ratio (LR-) were calculated. Binary logistic regression was performed to develop a combined diagnostic model. Variables with p<0.10 in univariate analysis were included in the multivariate model. The model’s goodness-of-fit was assessed using the Hosmer-Lemeshow test. A diagnostic score was created based on regression coefficients, and its performance was evaluated through ROC analysis. Net reclassification improvement (NRI) and integrated discrimination improvement (IDI) were calculated to assess the added value of the combined model. Correlations between continuous variables were assessed using Pearson’s correlation coefficient for normally distributed variables and Spearman’s rank correlation for non-normally distributed variables. Subgroup analyses were performed based on clinical forms of brucellosis (systemic vs. focal complications). A two-tailed p-value <0.05 was considered statistically significant for all analyses. Given multiple comparisons, Bonferroni correction was applied for the primary hematological parameters (WBC, neutrophil, lymphocyte, monocyte, platelet, MPV, PDW, RDW, hemoglobin, hematocrit), with adjusted significance level of p<0.005 (0.05/10 parameters). For inflammatory markers (ESR, CRP) and liver enzymes (AST, ALT), a separate Bonferroni correction was applied with p<0.0125 (0.05/4). However, for exploratory hematological ratios (NLR, PLR, LMR) which were secondary outcomes, the conventional p<0.05 threshold was maintained without correction to avoid type II errors in this hypothesis-generating analysis.
3. Results
3.1. Demographic and Clinical Characteristics
The study included 50 patients with confirmed brucellosis and 50 healthy controls. The groups were well-matched for age and sex distribution. The mean age was 51.0 ± 16.1 years (range: 22-80) in the brucellosis group and 48.0 ± 9.1 years (range: 25-80) in the control group (p=0.282). Sex distribution showed 27 (54%) males in the brucellosis group versus 23 (46%) males in the control group (p=0.420). Among brucellosis patients, 32 (64%) resided in rural areas and 18 (36%) in urban areas. Occupational livestock exposure was reported in 14 (28%) patients. The most common source of infection was consumption of unpasteurized dairy products (38 patients, 76%), followed by direct animal contact (12 patients, 24%). Clinical manifestations at presentation included arthralgia (25 patients, 50%), malaise (21 patients, 42%), fever (19 patients, 38%), weight loss (17 patients, 34%), night sweats (15 patients, 30%), anorexia (13 patients, 26%), and myalgia (10 patients, 20%). The median duration of symptoms before diagnosis was 4 weeks (range: 1-12 weeks). Clinical forms of brucellosis were classified as follows: systemic form without focal involvement (36 patients, 72%), osteoarticular involvement (8 patients, 16%), orchitis (3 patients, 6%), lymphadenopathy (2 patients, 4%), and soft tissue involvement (1 patient, 2%). Among patients with osteoarticular involvement, sacroiliitis was most common (5 patients), followed by spondylitis (2 patients) and peripheral arthritis (1 patient).
3.2. Laboratory Findings
Table 1 presents the comprehensive comparison of laboratory parameters between brucellosis patients and healthy controls.
3.3. Hematological Parameters and Ratios
Brucellosis patients demonstrated significantly higher platelet counts compared to controls (305.0 ± 116.0 vs 246.0 ± 55.2 ×10³/μL, p=0.002). Conversely, MPV values were significantly lower in the patient group (8.04 ± 0.95 vs 8.56 ± 0.69 fL, p=0.002). The inverse relationship between platelet count and MPV was confirmed by correlation analysis (r=-0.31, p=0.027). The NLR was lower in brucellosis patients compared to controls, with median values of 1.69 (IQR: 1.46-2.10) versus 2.07 (IQR: 1.65-2.89), p=0.013. While this difference did not reach the Bonferroni-corrected significance threshold, it represents an exploratory finding of potential clinical interest. LMR was significantly higher in brucellosis patients with median values of 5.28 (IQR: 3.84-6.65) versus 4.12 (IQR: 3.15-5.23) in controls, p=0.008. PLR showed no significant difference between groups (148.0 ± 66.9 vs 160.0 ± 145.0, p=0.603).
3.4. Inflammatory Markers
ESR was markedly elevated in brucellosis patients (35.6 ± 26.0 vs 12.2 ± 11.9 mm/h, p<0.001). CRP levels were also significantly higher in patients with median values of 14.0 mg/L (IQR: 7.8-31.5) versus 3.0 mg/L (IQR: 3.0-4.2) in controls, p<0.001. Among brucellosis patients, 38 (76%) had ESR >20 mm/h and 35 (70%) had CRP >10 mg/L.
3.5. Serological Findings
Standard tube agglutination test results in brucellosis patients showed the following distribution: 1/80 (11 patients, 22%), 1/160 (20 patients, 40%), 1/320 (10 patients, 20%), 1/640 (7 patients, 14%), and 1/1280 (2 patients, 4%). Blood cultures were positive in 18 (36%) patients. Higher SAT titers were associated with more severe clinical manifestations and higher inflammatory markers (p=0.018).
3.6. ROC Curve Analysis
3.7. Multivariate Analysis and Combined Diagnostic Model
Binary logistic regression analysis was performed including variables with p<0.10 in univariate analysis. The final model identified ESR (OR=1.068, 95% CI: 1.035-1.102, p<0.001), CRP (OR=1.042, 95% CI: 1.015-1.070, p=0.002), and MPV (OR=0.421, 95% CI: 0.238-0.745, p=0.003) as independent predictors of brucellosis (Table 3). The Hosmer-Lemeshow test indicated good model fit (p=0.652).
3.8. Correlation Analysis
Correlation analysis revealed important relationships between parameters (Table 4). ESR showed strong positive correlations with CRP (r=0.56, p<0.001) and moderate correlations with platelet count (r=0.34, p=0.015). MPV demonstrated negative correlations with inflammatory markers: ESR (r=-0.30, p=0.035) and CRP (r=-0.28, p=0.052). LMR showed negative correlations with both ESR (r=-0.32, p=0.024) and CRP (r=-0.29, p=0.041).
3.9. Subgroup Analysis
When analyzed by clinical form, patients with focal complications (n=14) showed significantly different parameters compared to those with systemic form alone (n=36). Patients with focal complications had higher ESR (48.6 ± 28.2 vs 30.6 ± 23.4 mm/h, p=0.021), lower MPV (7.62 ± 0.88 vs 8.21 ± 0.92 fL, p=0.038), and higher diagnostic scores (1.82 ± 0.76 vs 1.24 ± 0.68, p=0.009). No significant differences were observed in NLR, PLR, or LMR between the two groups.
3.10. Treatment Outcomes
Treatment regimens included doxycycline plus rifampin (28 patients, 56%), doxycycline plus streptomycin (12 patients, 24%), doxycycline plus ciprofloxacin (8 patients, 16%), and ciprofloxacin plus rifampin (2 patients, 4%). Complete clinical and laboratory response was achieved in 47 (94%) patients. Three patients (6%) experienced relapse within 6 months of treatment completion. Notably, all relapsed patients had initial MPV values <7.0 fL and ESR >50 mm/h. However, given the small number of relapse cases, this observation should be considered preliminary and requires validation in larger prospective cohorts before drawing definitive conclusions about the prognostic value of these markers.
4. Discussion
This comprehensive case-control study provides important insights into the diagnostic utility of hematological inflammatory markers in brucellosis, demonstrating that simple, readily available parameters can be combined to achieve excellent diagnostic accuracy. Our findings reveal a distinct pattern of hematological changes in brucellosis patients, characterized by decreased MPV, increased platelet count, paradoxically lower NLR, and elevated LMR, along with expected elevations in traditional inflammatory markers. It is important to note that while we applied Bonferroni correction to primary hematological parameters to control for multiple comparisons, the hematological ratios (NLR, PLR, LMR) were analyzed as exploratory outcomes without correction. This approach balances the need to control type I error for primary outcomes while maintaining sensitivity for hypothesis-generating secondary analyses. Therefore, findings related to NLR should be interpreted with appropriate caution as exploratory observations requiring validation in future studies.
The significantly lower MPV in brucellosis patients (8.04 ± 0.95 vs 8.56 ± 0.69 fL, p=0.002) accompanied by reactive thrombocytosis (305.0 ± 116.0 vs 246.0 ± 55.2 ×10³/μL, p=0.002) represents a unique hematological signature that distinguishes brucellosis from other bacterial infections. The pathophysiology of reduced MPV in brucellosis involves multiple interconnected mechanisms. The chronic inflammatory environment induced by Brucella infection leads to sustained cytokine production, particularly IL-6 and TNF-α, which stimulate thrombopoietin production while simultaneously suppressing megakaryocyte maturation [21]. This results in the production of smaller, less mature platelets despite increased platelet numbers. Additionally, Brucella primarily resides within reticuloendothelial system macrophages, creating localized inflammatory foci that continuously consume platelets through formation of platelet-leukocyte aggregates and microthrombi [22].
Our findings align with recent studies by Küçükbayrak et al. [23] and Togan et al. [24], who also reported decreased MPV in brucellosis. However, this contrasts with the elevated MPV typically seen in acute bacterial infections [25]. This discrepancy highlights the unique pathophysiology of brucellosis, where Brucella’s intracellular lifestyle and ability to evade robust inflammatory responses result in a more chronic, smoldering infection pattern [26]. The clinical significance of reduced MPV extends beyond diagnosis. Our subgroup analysis revealed that patients with focal complications had even lower MPV values (7.62 ± 0.88 vs 8.21 ± 0.92 fL, p=0.038), suggesting that MPV may reflect disease severity. Furthermore, all three patients who experienced relapse had initial MPV values <7.0 fL, suggesting potential prognostic value. However, this preliminary observation based on limited cases requires validation in larger prospective studies before MPV can be recommended as a prognostic marker.
The paradoxically lower NLR in brucellosis (median: 1.69 vs 2.07, p=0.013) challenges the conventional paradigm of bacterial infection-induced neutrophilia. Unlike pyogenic bacteria, Brucella has evolved sophisticated immune evasion strategies. The modified lipopolysaccharide structure of Brucella contains a diaminoglucose backbone with long-chain fatty acids, reducing TLR4 activation by 100-1000 fold compared to typical gram-negative bacteria [27]. Additionally, the Type IV secretion system actively suppresses initial neutrophil recruitment by injecting effector proteins that interfere with NF-κB signaling [28]. These mechanisms result in a dampened neutrophil response despite active infection. Conversely, the control of brucellosis depends primarily on cell-mediated immunity, with IFN-γ and IL-12 production driving strong Th1 responses [29]. This lymphocyte-predominant response, combined with reduced neutrophil recruitment, explains the lower NLR observed in our patients. Our findings contrast with those of Bozdemir et al. [15] in pediatric brucellosis, where elevated NLR was reported. This discrepancy may reflect age-related differences in immune responses or variations in disease presentation between pediatric and adult populations.
The significantly elevated LMR in brucellosis patients (median: 5.28 vs 4.12, p=0.008) represents a novel finding not previously reported in the brucellosis literature. This elevation likely reflects the robust lymphocytic response required for controlling intracellular Brucella infection, combined with potential monocyte redistribution to infected tissues. The LMR has emerged as a useful biomarker in various conditions, including malignancies and viral infections [30,31]. In the context of brucellosis, the elevated LMR may indicate effective adaptive immune activation, as lymphocytes play a crucial role in eliminating Brucella-infected cells. The negative correlation between LMR and inflammatory markers (ESR: r=-0.32, p=0.024; CRP: r=-0.29, p=0.041) suggests that patients with higher LMR may have better immunological control of the infection, potentially leading to less systemic inflammation.
Despite interest in novel hematological ratios, our ROC analysis clearly demonstrated that traditional inflammatory markers remain superior for brucellosis diagnosis. ESR showed the best individual performance (AUC=0.842), followed by CRP (AUC=0.724). This superiority likely reflects the direct relationship between these markers and the inflammatory cascade triggered by Brucella infection [32]. The marked elevation of ESR and CRP in our patients confirms the systemic inflammatory nature of brucellosis. Interestingly, ESR outperformed CRP, possibly due to its integration of multiple inflammatory factors including fibrinogen, immunoglobulins, and other acute phase proteins [33].
The development of a combined diagnostic model represents a major contribution of our study. By integrating MPV with ESR and CRP, we achieved superior diagnostic accuracy (AUC=0.891) compared to any individual parameter. Although LMR showed significant diagnostic value (AUC=0.681), it was not included in the final combined model. During stepwise regression analysis, LMR did not provide additional discriminatory power beyond that offered by MPV, ESR, and CRP (p=0.087 for model improvement). This may be due to the correlation between LMR and other inflammatory markers, particularly its negative correlation with ESR and CRP. Future studies with larger sample sizes should re-evaluate the potential contribution of LMR to diagnostic models.The model’s excellent performance (84% sensitivity, 86% specificity) suggests it could serve as a valuable screening tool in endemic areas. The diagnostic score equation incorporates the inverse relationship of MPV with disease presence (negative coefficient) and the positive associations of ESR and CRP. This multiparametric approach captures different aspects of the inflammatory response: ESR reflects overall inflammatory burden, CRP indicates acute phase response, and MPV represents platelet-mediated inflammation [34]. The clinical applicability of this model is enhanced by its reliance on routine, inexpensive tests available in most healthcare settings. In resource-limited areas where specific brucellosis serology may be unavailable or delayed, this model could guide empirical treatment decisions while awaiting confirmatory tests [35].
Our findings have several important clinical implications. First, the recognition of decreased MPV as a characteristic feature of brucellosis adds to the diagnostic clues available to clinicians. In patients presenting with compatible symptoms and decreased MPV, particularly in endemic areas, brucellosis should be considered in the differential diagnosis [36]. Second, the combined diagnostic model provides a practical tool for screening and risk stratification. Patients with diagnostic scores ≥0.5 warrant immediate serological testing and consideration for empirical treatment, while those with lower scores might be monitored or investigated for alternative diagnoses [37]. Third, the association between lower MPV and complicated disease suggests potential for risk stratification. Patients presenting with MPV <7.5 fL might benefit from more intensive monitoring and extended treatment duration to prevent complications and relapse [38].
The economic implications of our diagnostic model are substantial. In endemic regions, the cost of CBC (approximately $5-10 USD) plus ESR and CRP (additional $5-10 USD) is significantly lower than specific serological tests ($20-50 USD) or blood cultures ($30-100 USD). Our model could enable risk stratification, reserving expensive confirmatory tests for high-risk patients while safely monitoring low-risk individuals. A preliminary cost-effectiveness analysis based on our data suggests that implementing this screening approach in a population with 10% brucellosis prevalence could save approximately $25-40 per patient screened, while maintaining diagnostic accuracy comparable to more expensive approaches [39].
Our study has several limitations that warrant consideration. The retrospective design limits causal inference and may introduce selection bias. The single-center nature may affect generalizability to other populations or healthcare settings. The lack of Brucella species identification prevents assessment of species-specific inflammatory responses, which may be clinically relevant [40]. Additionally, the cross-sectional analysis at diagnosis does not capture dynamic changes in markers during treatment, limiting our understanding of their utility for monitoring therapeutic response. The control group, while carefully selected, may not fully represent the general population, as they were recruited from individuals seeking health check-ups. Furthermore, the absence of comparison with other infectious diseases limits our ability to assess the specificity of these findings for brucellosis versus other infections.
Based on our findings, several research directions merit pursuit. Prospective validation of the combined diagnostic model in different populations and settings would establish its broader applicability. Longitudinal studies tracking marker changes during treatment could establish their utility for monitoring therapeutic response and predicting relapse. Investigation of these markers in different Brucella species and comparison with other intracellular pathogens would enhance understanding of their specificity. The development of point-of-care tests incorporating these parameters could improve diagnosis in resource-limited settings. Additionally, integration of these markers with newer diagnostic modalities such as PCR or immunochromatographic tests could further enhance diagnostic accuracy [41].
5. Conclusions
This study demonstrates that brucellosis induces a distinct hematological profile characterized by decreased MPV, reactive thrombocytosis, paradoxically lower NLR, and elevated LMR, reflecting its unique immunopathology as an intracellular pathogen. While individual hematological parameters showed limited diagnostic utility, their combination with traditional inflammatory markers significantly enhanced diagnostic accuracy. The combined diagnostic model incorporating MPV, ESR, and CRP achieved excellent performance (AUC=0.891, sensitivity 84%, specificity 86%), offering a practical and cost-effective screening tool for brucellosis in endemic areas. The association between lower MPV values and focal complications suggests potential prognostic utility, with patients presenting MPV <7.5 fL requiring closer monitoring and possibly extended treatment. The elevated LMR, reported for the first time in brucellosis, may indicate effective adaptive immune activation and warrants further investigation as a potential marker of immunological control. Our findings have immediate clinical applicability, particularly in resource-limited settings where access to specific serological tests may be delayed or unavailable. The diagnostic score equation [-2.147 + (0.065 × ESR) + (0.041 × CRP) − (0.865 × MPV)] can be easily calculated using routine laboratory tests, enabling rapid risk stratification and guiding clinical decision-making. Implementation of this approach could reduce diagnostic costs by 40-60% while maintaining high diagnostic accuracy. Future research should focus on prospective validation of this diagnostic model across different populations and Brucella species, longitudinal assessment of these markers during treatment to evaluate their utility in monitoring therapeutic response, and development of point-of-care tests incorporating these parameters. Understanding the molecular mechanisms underlying the observed hematological changes may also provide insights for novel therapeutic approaches in this important zoonotic disease.
Author Contributions
Conceptualization, Y.Ç., E.D. and G.E.A.; methodology, Y.Ç., E.D. and G.E.A.; formal analysis, E.D.; investigation, E.D. and G.E.A.; data curation, E.D. and G.E.A.; writing—original draft preparation, E.D.; writing—review and editing, Y.Ç. and G.E.A.; visualization, E.D.; supervision, Y.Ç.; project administration, Y.Ç. All authors have read and agreed to the published version of the manuscript.
Funding
This research received no specific grant from any funding agency in the public, commercial, or not-for-profit sectors.
Institutional Review Board Statement
This study was approved by the Clinical Research Ethics Committee of Balıkesir University Faculty of Medicine (Decision No: 2018/28, Date: 31.01.2018) and conducted in accordance with the Declaration of Helsinki. The requirement for informed consent was waived by the ethics committee due to the retrospective design and use of anonymized data. All patient information was de-identified to ensure confidentiality, and no additional biological samples were collected beyond routine clinical care.
Informed Consent Statement
Patient consent was waived by the ethics committee due to the retrospective nature of this study, which used anonymized data from archived medical records approved by the institutional ethics committee following national research guidelines.
Data Availability Statement
The data presented in this study are available on request from the corresponding author. The data are not publicly available due to privacy restrictions and institutional policies regarding patient information.
Acknowledgments
The authors are grateful to the medical staff of the Department of Infectious Diseases and Clinical Microbiology at Balıkesir University Hospital for their support in data collection.
Conflicts of Interest
The authors declare no conflicts of interest.
References
- Pappas, G.; Papadimitriou, P.; Akritidis, N.; Christou, L.; Tsianos, E.V. The new global map of human brucellosis. Lancet Infect. Dis. 2006, 6, 91–99. [CrossRef]
- Dean, A.S.; Crump, L.; Greter, H.; Schelling, E.; Zinsstag, J. Global Burden of Human Brucellosis: A Systematic Review of Disease Frequency. PLOS Neglected Trop. Dis. 2012, 6, e1865. [CrossRef]
- Franc, K.A.; Krecek, R.C.; Häsler, B.N.; Arenas-Gamboa, A.M. Brucellosis remains a neglected disease in the developing world: a call for interdisciplinary action. BMC Public Heal. 2018, 18, 1–9. [CrossRef]
- Buzgan, T.; Karahocagil, M.K.; Irmak, H.; Baran, A.I.; Karsen, H.; Evirgen, O.; Akdeniz, H. Clinical manifestations and complications in 1028 cases of brucellosis: a retrospective evaluation and review of the literature. Int. J. Infect. Dis. 2010, 14, e469–e478. [CrossRef]
- de Figueiredo, P.; Ficht, T.A.; Rice-Ficht, A.; Rossetti, C.A.; Adams, L.G. Pathogenesis and immunobiology of brucellosis: review of Brucella-host interactions. Am. J. Pathol. 2015, 185, 1505–1517.
- Skendros, P.; Pappas, G.; Boura, P. Cell-mediated immunity in human brucellosis. Microbes Infect. 2011, 13, 134–142. [CrossRef]
- Demirdag, K.; Ozden, M.; Kalkan, A.; Godekmerdan, A.; Kilic, S.S. Serum cytokine levels in patients with acute brucellosis and their relation to the traditional inflammatory markers. FEMS Immunol. Med Microbiol. 2003, 39, 149–153. [CrossRef]
- Russell, C.D.; Parajuli, A.; Gale, H.J.; Bulteel, N.S.; Schuetz, P.; de Jager, C.P.; Loonen, A.J.; Merekoulias, G.I.; Baillie, J.K. The utility of peripheral blood leucocyte ratios as biomarkers in infectious diseases: A systematic review and meta-analysis. J. Infect. 2019, 78, 339–348. [CrossRef]
- Forget, P.; Khalifa, C.; Defour, J.-P.; Latinne, D.; Van Pel, M.-C.; De Kock, M. What is the normal value of the neutrophil-to-lymphocyte ratio? BMC Res. Notes 2017, 10, 12. [CrossRef]
- Korniluk, A.; Koper-Lenkiewicz, O.M.; Kamińska, J.; Kemona, H.; Dymicka-Piekarska, V. Mean Platelet Volume (MPV): New Perspectives for an Old Marker in the Course and Prognosis of Inflammatory Conditions. Mediat. Inflamm. 2019, 2019, 1–14. [CrossRef]
- Gasparyan, A.Y.; Ayvazyan, L.; Mikhailidis, D.P.; Kitas, G.D. Mean Platelet Volume: A Link Between Thrombosis and Inflammation?. Curr. Pharm. Des. 2011, 17, 47–58. [CrossRef]
- Zahorec, R. Ratio of neutrophil to lymphocyte counts--rapid and simple parameter of systemic inflammation and stress in critically ill. Bratislavske Lekarske Listy 2001, 102, 5–14.
- Smith, R.A.; Bosonnet, L.; Raraty, M.; Sutton, R.; Neoptolemos, J.P.; Campbell, F.; Ghaneh, P. Preoperative platelet-lymphocyte ratio is an independent significant prognostic marker in resected pancreatic ductal adenocarcinoma. Am. J. Surg. 2009, 197, 466–472. [CrossRef]
- Lin, J.; Li, Y.; Xu, H.; Zhang, Z.; Xiang, Y.; Zeng, J. Lymphocyte-to-monocyte ratio predicts survival of patients with hepatocellular carcinoma after curative resection. World J. Gastroenterol. 2015, 21, 10898–10906.
- Bozdemir, Ş.E.; Altıntop, Y.A.; Uytun, S.; Aslaner, H.; Torun, Y.A. Diagnostic role of mean platelet volume and neutrophil to lymphocyte ratio in childhood brucellosis. Korean J. Intern. Med. 2017, 32, 1075–1081. [CrossRef]
- Okan, D.; Gökmen, Z.; Seyit, B.; Yuksel, K.; Cevdet, Z.; Deniz, A. Mean platelet volume in brucellosis: correlation between brucella standard serum agglutination test results, platelet count, and C-reactive protein.. Afr. Heal. Sci. 2015, 14, 797–801. [CrossRef]
- Aktar, F.; Tekin, R.; Bektaş, M.S.; Güneş, A.; Köşker, M.; Ertuğrul, S.; Yılmaz, K.; Karaman, K.; Balık, H.; Yolbaş, İ. Diagnostic role of inflammatory markers in pediatric Brucella arthritis. Ital. J. Pediatr. 2016, 42, 1–6. [CrossRef]
- Pappas, G.; Akritidis, N.; Bosilkovski, M.; Tsianos, E. Brucellosis. N. Engl. J. Med. 2005, 352, 2325–2336.
- Araj, G.F. Update on laboratory diagnosis of human brucellosis. Int. J. Antimicrob. Agents 2010, 36, S12–S17. [CrossRef]
- Christopher, S.; Umapathy, B.L.; Ravikumar, K.L. Brucellosis: Review on the Recent Trends in Pathogenicity and Laboratory Diagnosis. J. Lab. Physicians 2010, 2, 55–60. [CrossRef]
- Kaushansky, K. The molecular mechanisms that control thrombopoiesis. J. Clin. Investig. 2005, 115, 3339–3347. [CrossRef]
- Roop, R.M., 2nd; Gaines, J.M.; Anderson, E.S.; Caswell, C.C.; Martin, D.W. Survival of the fittest: how Brucella strains adapt to their intracellular niche in the host. Med. Microbiol. Immunol. 2009, 198, 221–238.
- Küçükbayrak, A.; Tas, T.; Tosun, M.; Mengeloğlu, Z.; Baş, M.; Kantarcı, G.; Baskan, B.; Kizilkaya, N.; Akgün, Y. Could thrombocyte parameters be an inflammatory marker in the brucellosis? Med. Glas. (Zenica) 2013, 10, 35–39.
- Togan, T.; Narci, H.; Turan, H.; Ciftci, O.; Kursun, E.; Arslan, H. The Impact of Acute Brucellosis on Mean Platelet Volume and Red Blood Cell Distribution. Jundishapur J. Microbiol. 2015, 8, e20039–e20039. [CrossRef]
- Van der Lelie, J.; Borne, A.K.V.D. Increased mean platelet volume in septicaemia.. J. Clin. Pathol. 1983, 36, 693–696. [CrossRef]
- Celli, J. The Intracellular Life Cycle of Brucella spp. Microbiol. Spectr. 2019, 7, 101–111. [CrossRef]
- Lapaque, N.; Moriyon, I.; Moreno, E.; Gorvel, J.-P. Brucella lipopolysaccharide acts as a virulence factor. Curr. Opin. Microbiol. 2005, 8, 60–66. [CrossRef]
- Barquero-Calvo, E.; Martirosyan, A.; Ordoñez-Rueda, D.; Arce-Gorvel, V.; Alfaro-Alarcón, A.; Lepidi, H.; Malissen, B.; Malissen, M.; Gorvel, J.-P.; Moreno, E. Neutrophils Exert a Suppressive Effect on Th1 Responses to Intracellular Pathogen Brucella abortus. PLOS Pathog. 2013, 9, e1003167. [CrossRef]
- Baldwin, C.L.; Parent, M. Fundamentals of host immune response against Brucella abortus: what the mouse model has revealed about control of infection. Veter- Microbiol. 2002, 90, 367–382. [CrossRef]
- Lin, J.; Li, Y.; Xu, H.; Zhang, Z.; Xiang, Y.; Zeng, J. Lymphocyte-to-monocyte ratio predicts survival of patients with hepatocellular carcinoma after curative resection. World J. Gastroenterol. 2015, 21, 10898–10906.
- Merekoulias, G.; Alexopoulos, E.C.; Belezos, T.; Panagiotopoulou, E.; Jelastopulu, E. Lymphocyte to monocyte ratio as a screening tool for influenza. PLoS Curr. 2010, 2, RRN1154. [CrossRef]
- Lapić, I.; Padoan, A.; Bozzato, D.; Plebani, M. Erythrocyte sedimentation rate and C-reactive protein in acute inflammation: meta-analysis of diagnostic accuracy studies. Am. J. Clin. Pathol. 2020, 153, 14–29.
- Bray, C.; Bell, L.N.; Liang, H.; Haykal, R.; Kaiksow, F.; Mazza, J.J.; Yale, S.H. Erythrocyte Sedimentation Rate and C-reactive Protein Measurements and Their Relevance in Clinical Medicine.. 2016, 115, 317–21.
- Assinger, A.; Schrottmaier, W.C.; Salzmann, M.; Rayes, J. Platelets in Sepsis: An Update on Experimental Models and Clinical Data. Front. Immunol. 2019, 10, 1687. [CrossRef]
- Araj, G.F. Update on laboratory diagnosis of human brucellosis. Int. J. Antimicrob. Agents 2010, 36, S12–S17. [CrossRef]
- Roushan, M.R.H.; Ebrahimpour, S. Human brucellosis: An overview. Caspian J. Intern. Med. 2015, 6, 46–47.
- Solera, J. Update on brucellosis: therapeutic challenges. Int. J. Antimicrob. Agents 2010, 36, S18–S20. [CrossRef]
- Zareifar, S.; Far, M.R.F.; Golfeshan, F.; Cohan, N. Changes in Platelet Count and Mean Platelet Volume During Infectious and Inflammatory Disease and Their Correlation With ESR and CRP. J. Clin. Lab. Anal. 2014, 28, 245–248. [CrossRef]
- Ducrotoy, M.; Bertu, W.; Matope, G.; Cadmus, S.; Conde-Álvarez, R.; Gusi, A.; Welburn, S.; Ocholi, R.; Blasco, J.; Moriyón, I. Brucellosis in Sub-Saharan Africa: Current challenges for management, diagnosis and control. Acta Trop. 2017, 165, 179–193. [CrossRef]
- Xavier, M.N.; Paixao, T.A.; Hartigh, A.B.D.; Tsolis, R.M.; Santos, R.L. Pathogenesis of Brucella spp. Open Veter- Sci. J. 2010, 4, 109–118. [CrossRef]
- Yagupsky, P.; Morata, P.; Colmenero, J.D. Laboratory Diagnosis of Human Brucellosis. Clin. Microbiol. Rev. 2019, 33. [CrossRef]
Figure 1.
ROC curves showing diagnostic performance of individual parameters (ESR, CRP, MPV, Platelet, LMR, NLR, PLR) and the combined model (MPV+ESR+CRP) for brucellosis diagnosis. The diagonal dashed line represents the reference line (AUC=0.5).
Figure 1.
ROC curves showing diagnostic performance of individual parameters (ESR, CRP, MPV, Platelet, LMR, NLR, PLR) and the combined model (MPV+ESR+CRP) for brucellosis diagnosis. The diagonal dashed line represents the reference line (AUC=0.5).
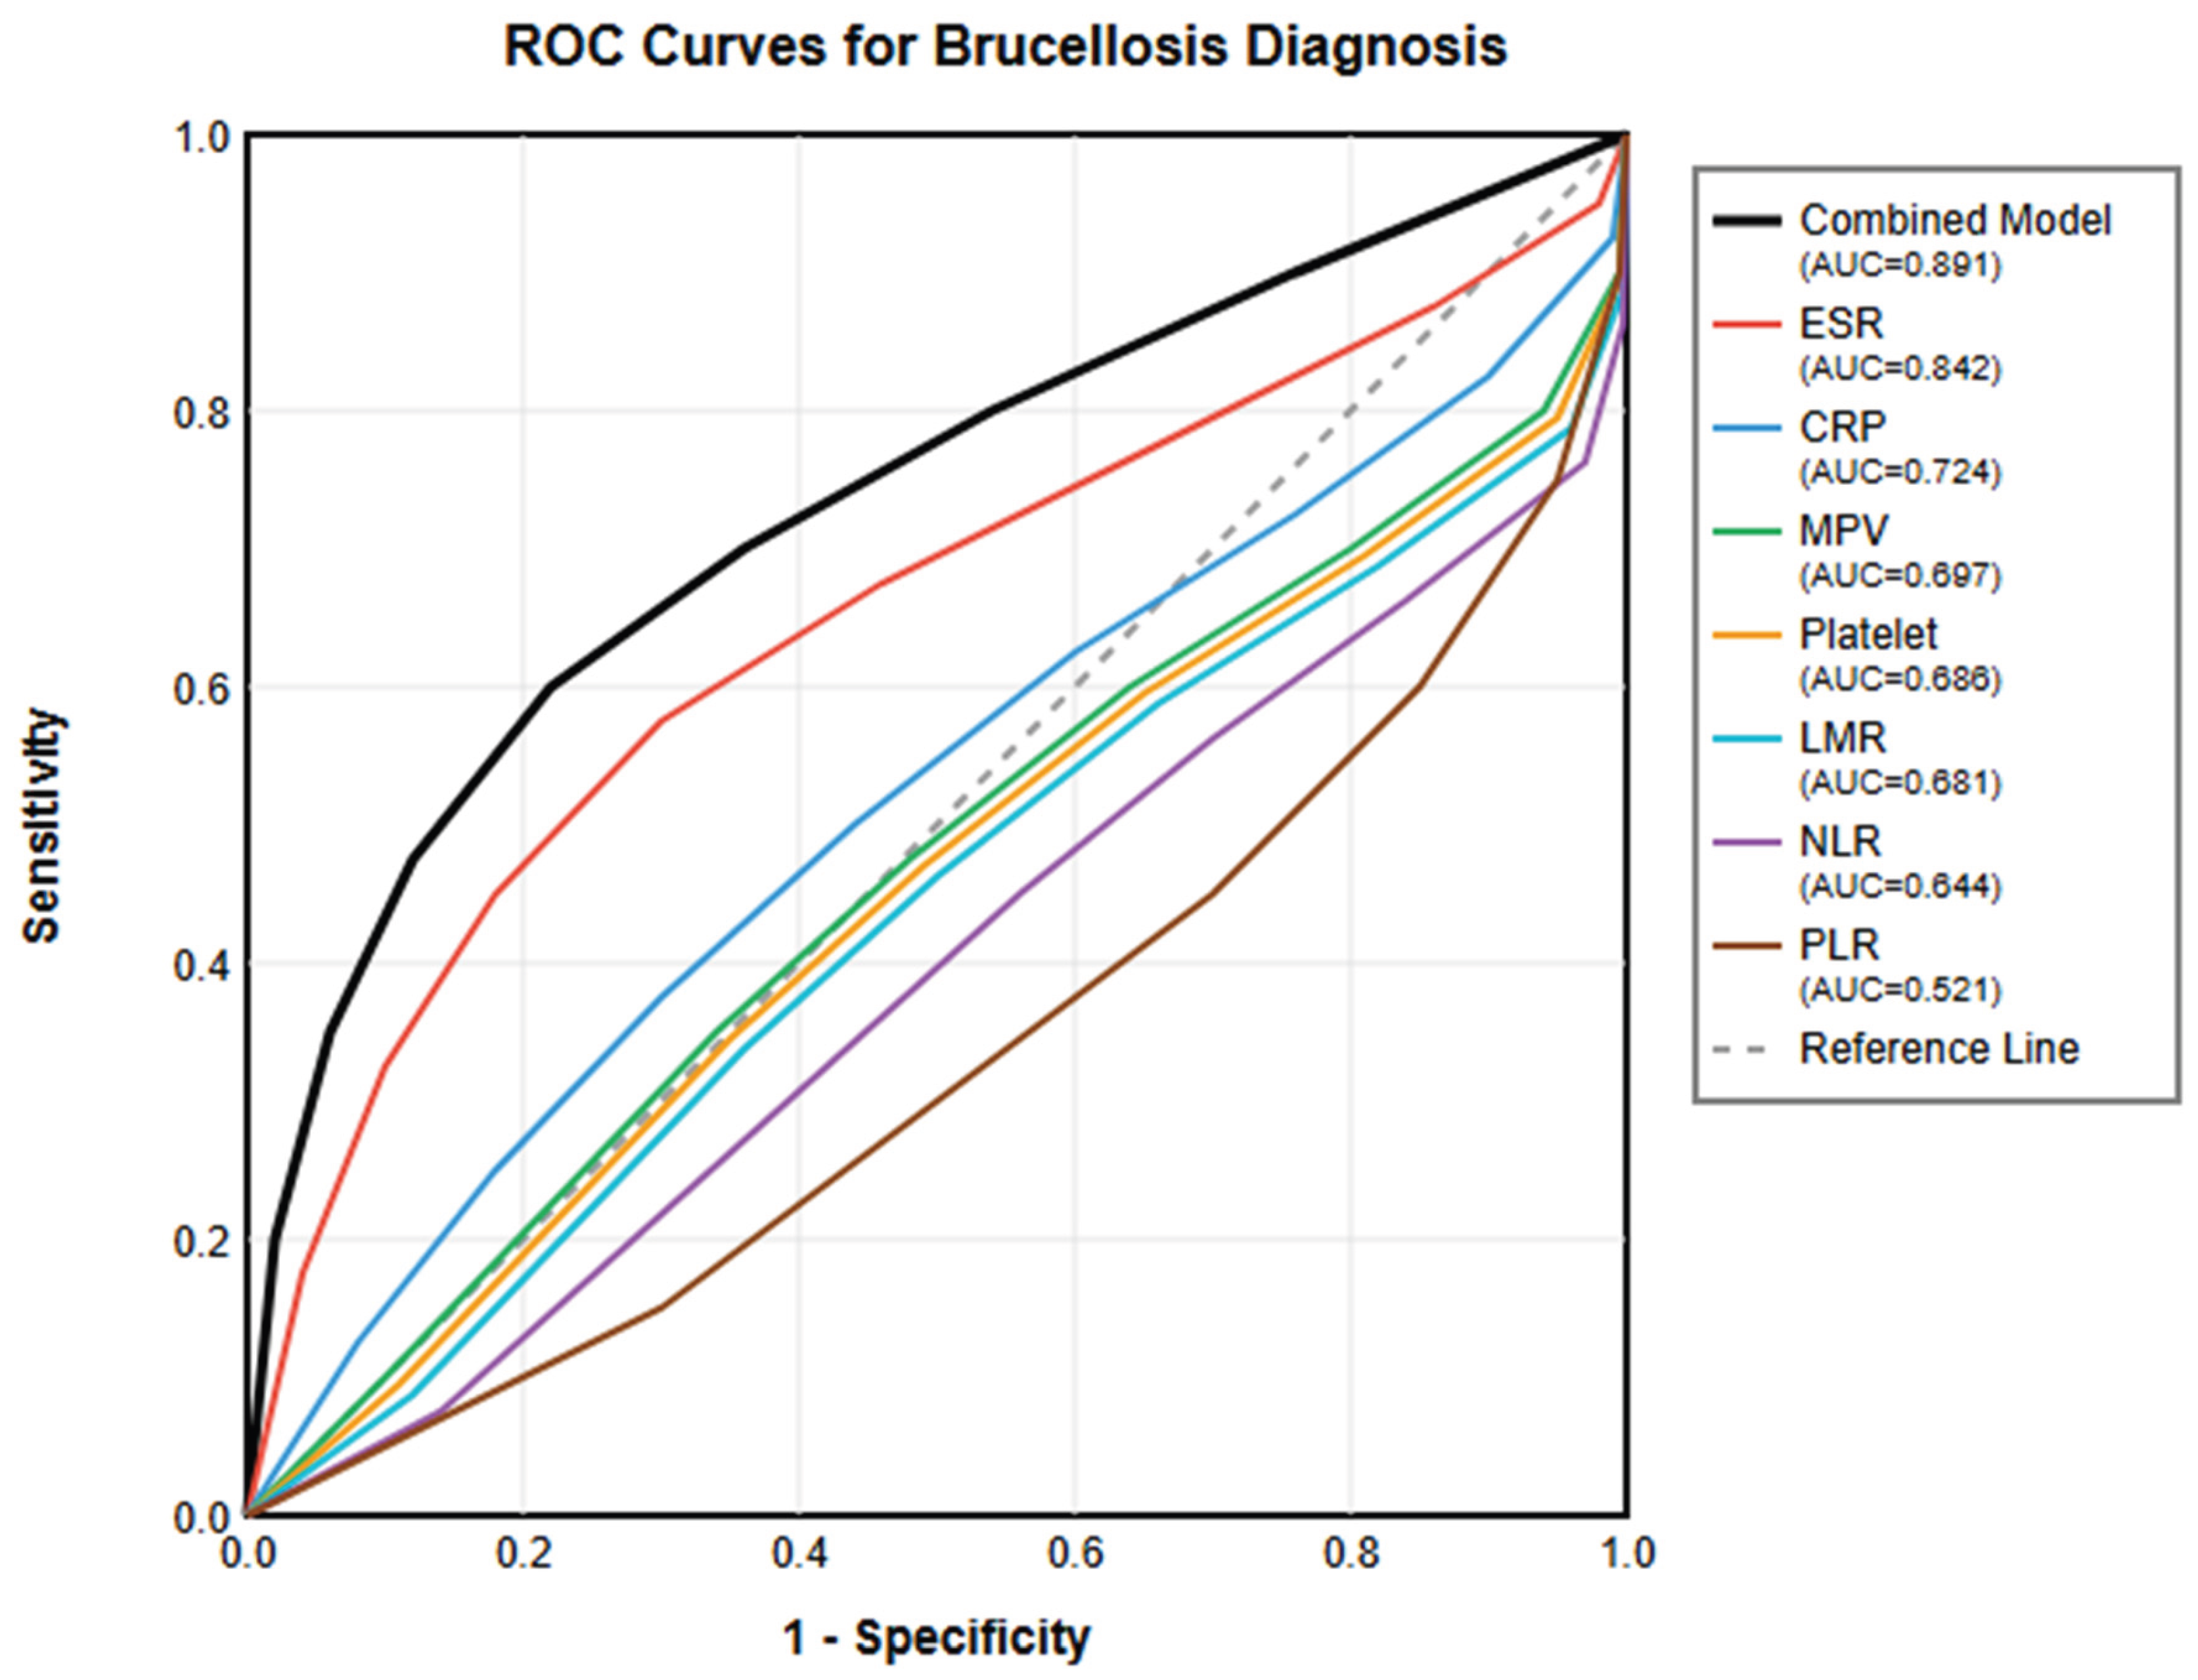

Table 1.
Comparison of demographic and laboratory parameters between brucellosis patients and controls.
Table 1.
Comparison of demographic and laboratory parameters between brucellosis patients and controls.
| Parameter | Brucellosis (n=50) | Control (n=50) | p-value |
| Demographics | |||
| Age (years) | 51.0 ± 16.1 | 48.0 ± 9.1 | 0.282 |
| Male sex, n (%) | 27 (54) | 23 (46) | 0.420 |
| Hematological Parameters | |||
| WBC (×103/μL) | 6.64 ± 1.82 | 7.03 ± 1.89 | 0.291 |
| Neutrophil (×103/μL) | 3.72 ± 1.49 | 4.33 ± 1.68 | 0.054 |
| Lymphocyte (×103/μL) | 2.22 ± 0.70 | 1.95 ± 0.77 | 0.063 |
| Monocyte (×103/μL) | 0.42 ± 0.18 | 0.48 ± 0.21 | 0.041 |
| Platelet (×103/μL) | 305.0 ± 116.0 | 246.0 ± 55.2 | 0.002* |
| MPV (fL) | 8.04 ± 0.95 | 8.56 ± 0.69 | 0.002* |
| PDW (%) | 16.7 ± 0.59 | 16.9 ± 0.48 | 0.143 |
| RDW (%) | 14.8 ± 1.81 | 14.0 ± 2.35 | 0.070 |
| Hemoglobin (g/dL) | 13.0 ± 1.61 | 13.8 ± 1.64 | 0.017 |
| Hematocrit (%) | 39.3 ± 4.55 | 40.5 ± 4.46 | 0.166 |
| Hematological Ratios | |||
| NLR† | 1.69 (1.46-2.10) | 2.07 (1.65-2.89) | 0.013 |
| PLR | 148.0 ± 66.9 | 160.0 ± 145.0 | 0.603 |
| LMR† | 5.28 (3.84-6.65) | 4.12 (3.15-5.23) | 0.008 |
| Inflammatory Markers | |||
| ESR (mm/h) | 35.6 ± 26.0 | 12.2 ± 11.9 | <0.001* |
| CRP (mg/L) † | 14.0 (7.8-31.5) | 3.0 (3.0-4.2) | <0.001* |
| Liver Enzymes | |||
| AST (U/L) † | 23.0 (18.0-35.0) | 19.0 (16.0-24.0) | <0.001* |
| ALT (U/L) † | 23.0 (17.0-34.0) | 18.0 (13.0-26.0) | 0.005 |
Data presented as mean ± SD or †median (IQR) for non-normally distributed variables. *Significant after Bonferroni correction (p<0.005 for hematological parameters, p<0.0125 for inflammatory markers and liver enzymes). Note: Hematological ratios (NLR, PLR, LMR) were analyzed as exploratory outcomes without Bonferroni correction.
Table 2.
Diagnostic performance of laboratory parameters for brucellosis.
| Parameter | AUC (95% CI) | p-value | Cut-off | Sensitivity (%) | Specificity (%) | PPV (%) | NPV (%) | LR+ | LR- |
| ESR | 0.842 (0.763-0.921) | <0.001 | ≥20.0 mm/h | 76.0 | 82.0 | 80.9 | 77.4 | 4.22 | 0.29 |
| CRP | 0.724 (0.627-0.821) | <0.001 | ≥10.0 mg/L | 70.0 | 68.0 | 68.6 | 69.4 | 2.19 | 0.44 |
| MPV | 0.697 (0.596-0.798) | <0.001 | ≤8.15 fL | 64.0 | 72.0 | 69.6 | 66.7 | 2.29 | 0.50 |
| LMR | 0.681 (0.578-0.784) | 0.002 | ≥4.85 | 66.0 | 68.0 | 67.3 | 66.7 | 2.06 | 0.50 |
| Platelet | 0.686 (0.584-0.788) | <0.001 | ≥265.0 ×10³/μL | 68.0 | 66.0 | 66.7 | 67.3 | 2.00 | 0.48 |
| NLR | 0.644 (0.538-0.750) | 0.013 | ≤1.89 | 60.0 | 64.0 | 62.5 | 61.5 | 1.67 | 0.63 |
| PLR | 0.521 (0.408-0.634) | 0.716 | ≥148.5 | 52.0 | 54.0 | 52.0 | 54.0 | 1.13 | 0.89 |
Abbreviations: AUC, area under the curve; CI, confidence interval; PPV, positive predictive value; NPV, negative predictive value; LR+, positive likelihood ratio; LR-, negative likelihood ratio. ESR demonstrated the best individual diagnostic performance (AUC=0.842, p<0.001), followed by CRP (AUC=0.724, p<0.001), MPV (AUC=0.697, p<0.001), and LMR (AUC=0.681, p=0.002). PLR showed no significant diagnostic value (AUC=0.521, p=0.716).
Table 3.
Multivariate logistic regression analysis for predicting brucellosis.
| Variable | β Coefficient | SE | OR (95% CI) | p-value |
| ESR | 0.065 | 0.016 | 1.068 (1.035-1.102) | <0.001 |
| CRP | 0.041 | 0.013 | 1.042 (1.015-1.070) | 0.002 |
| MPV | -0.865 | 0.290 | 0.421 (0.238-0.745) | 0.003 |
| Constant | -2.147 | 1.892 | - | 0.257 |
Abbreviations: SE, standard error; OR, odds ratio; CI, confidence interval. The regression equation for the combined model was: Diagnostic Score = -2.147 + (0.065 × ESR) + (0.041 × CRP) − (0.865 × MPV) The combined model demonstrated superior diagnostic performance (AUC=0.891, 95% CI: 0.827-0.955, p<0.001) compared to any individual parameter (Figure 1). Using a cut-off score of ≥0.5, the model achieved 84% sensitivity and 86% specificity, with PPV of 85.7% and NPV of 84.3%. Pairwise comparisons using the DeLong test showed significant differences between the combined model and all individual parameters (all p<0.05). The net reclassification improvement (NRI) was 0.42 (p<0.001) and the integrated discrimination improvement (IDI) was 0.18 (p<0.001), confirming the added value of the combined model over individual markers.
Table 4.
Correlation matrix of key parameters in brucellosis patients.
| MPV | NLR | PLR | LMR | PLT | ESR | CRP | |
| MPV | 1.00 | ||||||
| NLR | -0.16 | 1.00 | |||||
| PLR | -0.24* | 0.41** | 1.00 | ||||
| LMR | 0.22 | -0.38** | -0.45** | 1.00 | |||
| PLT | -0.31* | 0.09 | 0.78** | -0.18 | 1.00 | ||
| ESR | -0.30* | 0.23 | 0.19 | -0.32* | 0.34* | 1.00 | |
| CRP | -0.28 | 0.27 | 0.16 | -0.29* | 0.29* | 0.56** | 1.00 |
*p<0.05, **p<0.01. Abbreviations: MPV, mean platelet volume; NLR, neutrophil-to-lymphocyte ratio; PLR, platelet-to-lymphocyte ratio; LMR, lymphocyte-to-monocyte ratio; PLT, platelet count; ESR, erythrocyte sedimentation rate; CRP, C-reactive protein.
Disclaimer/Publisher’s Note: The statements, opinions and data contained in all publications are solely those of the individual author(s) and contributor(s) and not of MDPI and/or the editor(s). MDPI and/or the editor(s) disclaim responsibility for any injury to people or property resulting from any ideas, methods, instructions or products referred to in the content. |
© 2025 by the authors. Licensee MDPI, Basel, Switzerland. This article is an open access article distributed under the terms and conditions of the Creative Commons Attribution (CC BY) license (http://creativecommons.org/licenses/by/4.0/).
Copyright: This open access article is published under a Creative Commons CC BY 4.0 license, which permit the free download, distribution, and reuse, provided that the author and preprint are cited in any reuse.


