Submitted:
22 October 2025
Posted:
22 October 2025
You are already at the latest version
Abstract
Drought remains a phenomenal disaster of critical concerns in West Africa, particularly in the Niger river Basin, due to its insidious and multifaceted nature. Its continuous devastating impacts on communities, coupled with the limitations of existing univariate index-based monitoring approaches contributes to the problem. The paper aims to introduce and evaluate a Hybrid Drought Resilience Empirical Model (DREM) that integrates meteorological, agricultural, and hydrological drought indicators to enhance their concurrent monitoring and early warning in the region for effective decision-making. The datasets used include reanalysis hydrometeorological records from 1980 - 2016, and community-level vulnerability data. Results show that DREM-based composite index detects drought earlier than SPI-based indices, with higher agreement to soil moisture and streamflow. The model detects drought initiation when the drought thresholds are of the range -0.26 to -1.19 over a period of three consecutive months depending on the location. The end of droughts occurs when thresholds are higher and of the range of -0.08 to -0.82 depending on the location. Thus, based on the findings of this study, the DREM-based composite index has indeed proven to be a suitable drought monitor for the Niger Basin and early warning tool decision-makers and stakeholders can trust with high confident.
Keywords:
climate variability
; single variable drought index
; composite drought index
; drought empirical model
; monitoring
; early warning
; Niger basin
; percentile rank
; multivariate indicators
1. Introduction
Drought is a significant threat to both humans and ecological systems across the continent of Africa; particularly the West African region. Drought is a type of extreme climatic variability [1]; which has been hypothesized to be deeply rooted in West Africa [2,3]. Both the onset and end of drought are difficult to determine, because, drought is normally a creeping phenomenon [4]. Usually, it starts slowly and gradually becomes noticeable only when its effect starts to wreak havoc on a region [4,5]. In the Niger Basin of West Africa, drought remains the most complex and least-understood of all-natural hazards causing more deaths, conflicts, and displacement of more people; than other natural disasters [2,4,6]. This is because, there is a connection between the region’s climatic variability and economic impact of drought [2,7,8]. As a result, aside the back-to-back drought events of 1970s and 1980s ensuing in famine and humongous economic losses [2], between 2010 and 2013 the region again experienced a resurgence of drought events, which led to nearly 18.7 million people (though situation may have been aggravated by insecurity in some parts) in 2012 facing starvation [4,9,10]. The high number and spatial extent of the affected people shown in Figure 1 are clear evidence of the failure of existing approaches to drought monitoring and early warning systems in the Niger Basin; which are driven majorly by univariate-drought indicators. According to [11] the 2010 drought in the Sahel severely affected northern Nigeria, Niger, and Mali, displacing communities and reducing agricultural output by more than 40%.
The Niger River Basin is known to be a vital hydrological and socio-economic corridor in West Africa; however, this is being undermined by the region’s projected drier conditions [6]. Thus, the lingering drying conditions of the region, continued to remain a nightmare, and worsening the situation is the recent projected increase in climatic variability under climate change [1]. Worsening the vulnerability of West African region to climate change is its high reliance on rain-fed agriculture.
Climate change is expected to amplify drought conditions through temporal shifts or changes in rainfall patterns (i.e., shorter, delayed rainy season and more dry spells), evaporation rates, and water cycles [12]. Usually, these shifts pose significant challenges for agriculture, water management, health, and adaptation planning. Based on recent studies, as temperatures rise, soil and water bodies lose moisture thereby, making the environment drier [13,14]. Furthermore, the World Meteorological Organization (WMO) 2021 State of Climate Services Report stated that the number of occurrence and duration of droughts have increased by 29% over the past two decades, especially since 2000. It further reported that majority of the fatalities occurred in Africa, ensuing in looming water crisis (https://public.wmo.int/en/media/press-release/wake-looming-water-crisis-report-warns-accessed -2-12-2021. Also, in the most recent World Meteorological Organization (WMO) 2024 State of Climate Services Report [15] released, dry conditions in what was usually the wet season in late 2023 and early 2024 resulted in significant drought in north-western Africa; and the severe drought led to significant impacts on agriculture and hydroelectric production. As a result, [16] in their study posited and recommended that significant efforts be devoted in a timely manner to minimizing the vulnerability of droughts to climate change. This is because, the authors further concluded, changes in drought intensity and frequency have a greater detrimental effect on hydrological ecosystem services. These unwarranted challenges have been made worst by lack of universal definition of drought because drought definition is usually impact and location specifics [4,17].
Furthermore, droughts are multifaceted in nature and usually, categorized into four types, namely, meteorological, agricultural, hydrological, and socio-economic [18]; thus, making its management complex and challenging. [4] argued that if you cannot define drought, you cannot detect and measure it, and if you cannot measure it, you cannot effectively manage it. Traditionally, the ways to measure drought has been by comparing observed precipitation with what’s known to be normal, which refers to climatologic drought, or by comparing soil moisture and crop conditions with what’s normal, referring to agricultural drought, or by looking at how much water is contained in snow, the level or flow rate of moving water, water in reservoirs, or groundwater levels, which is referred to hydrological drought (https://droughtmonitor.unl.edu /data/docs/USDM_brochure.pdf). For example, meteorological droughts, which is marked by insufficient precipitation, can rapidly evolve and serve as precursors to other subsequent drought categories, leading to deficits in soil moisture and decreased streamflow, which in turn trigger water supply shortages [18,19,20]. Soil moisture is an essential element of the environment. It modulates crop production, hydrological cycle and meteorology of a place. Usually, it indicates the dryness of the ground surface [21]. Drought has become one of the most severe climatic events that need to be mitigated to reduce its negative impacts on a region [22,23].
Over the past 5 decades or more drought disaster challenges have been addressed by drought managers typically by relying on the use of variety of drought indices for monitoring and early warning of impending drought. Index-based drought monitoring, and assessment approaches are now widely employed operationally, because of their capabilities in simplifying complex inter-relationships between many climates and climate-related parameters [24].
Generally, drought indices have proved to be indispensable tools for detection, measuring, monitoring and evaluation of the characteristics of drought events. Among the commonly used drought indices are the Palmer Drought Severity Index [25], the Standardized Precipitation Index (SPI) [26], and the Standardized Precipitation Evapotranspiration Index (SPEI) [27], using indicators like precipitation, temperature, soil moisture, streamflow, etc. [28]. Both SPI and SPEI primarily rely on meteorological data, thereby, neglecting other essential components of the hydrological cycle relevant for a thorough assessment of drought conditions, such as soil moisture, groundwater levels, and the potential impacts on runoff and water availability [29].
Notably, each drought index was developed to address specific needs; however, the plurality of these indices often leaves the end-users and decision-makers confused [30]. For example, a study by [31] over the upper Niger sub-catchment area observed varying and conflicting information on the drought severity and number of drought occurrences calculated by three different indices, namely, Standardized Anomaly Index (SAI), Bhalme and Mooley Drought Index [32] and Standardized Precipitation Index (SPI) (all meteorological drought indices). The authors posited that this could be misleading and even cause confusion in terms of decision-making in response to the drought problems.
Oftentimes, while placing the current conditions in historical perspective, these drought indices are utilized in characterizing drought and its statistical properties; because they can provide both spatial and temporal representations of historical drought. As a result, many indices were created during the 20th century to measure drought severity by looking at precipitation, soil moisture, stream flow, vegetation health, and other variables [33]. Such that there are over 150 known drought indices in existence today [34], which have been reviewed and compared in a number of studies e.g., [35,36,37].
Recent study by [4] using of SPI model revealed that West Africa like other regions of the world, can also benefit from the utilizing objective drought thresholds or triggers that are both impact and location specific for identifying or defining and tracking the onset of moderate, severe, extreme, and exceptional drought events ahead of time. However, the authors concluded that the problem with the SPI-based objective thresholds, is that it’s driven solely by univariate indicator, that is, precipitation. By implication, the model neglects the importance of evaporative demand of the regional atmosphere due to air temperature. According to [38], there is need for appropriate technique in this region for determining drought occurrence to reduce its impact on the society.
Furthermore, there has been heightened interest recently, for a regional dimension to the management of the recurrent Sahelian droughts in the Niger basin. This is because current univariate-based drought indicators techniques employed in the management of the drought disasters have not yielded the desired solution, nor have they been effective in addressing the problem [4]. The failure stems from the fact that first, droughts affect the entire hydrologic system, and wide variety of disciplines and socio-economic sectors. Second, is the many timescales drought is known to be operating on and diverse geographical and temporal distribution of the phenomenon, which make it difficult to establish both a universal definition of drought and an index to measure it. Thus, defining drought is difficult because there is need to consider and incorporate the various components of the hydrologic cycle affected by the water deficit and the time associated with water deficits (https://geochange.er.usgs.gov./sw/ changes/ natural/drought-accessed-1-12-2022). Therefore, continuous and simultaneous monitoring of suite of indicators are required to concurrently track the different aspects of drought in a holistic manner [39]. This is necessary to facilitate the understanding of the complex nature of drought in the area, as well as improve its mitigation, which can be better achieved using a composite drought index (CDI).
Since 2002, there has been a paradigm shift towards a multivariate drought analysis using composite drought indices (CDI) technology. The US drought monitor (USDM) [40] has become, at least in the United States of America, the standard in multivariate drought analysis. It is a hybrid composite drought index (CDI) that combines two or more drought indicators or indices into a single index. Such indicators often reflect the different components of the hydrological cycle [41]. For example, the USDM method integrates Palmer Drought Severity Index (PDSI), Standardized Precipitation Index (SPI), Percent of Normal Precipitation (PNP), Climate Prediction Center soil moisture (CPC-SM) and Streamflow Indices. The USDM uses these indices to produce one statistic that summarizes the drought status, magnitude, and severity across several variables.
Alongside the USDM is the North America Drought Monitor (NADM) regional state-of-the art drought monitoring tools developed through expert integration of diverse set of quantitative drought indicators along with local impacts reports from observers in the field [40]. Usually, the two indices (USDM and NADM) use percentile rank approach to establish thresholds for drought severity categories, which is roughly aligned with possible return periods for droughts [40]. Generally, the combining indicators are weighted based on how well they performed in detecting and characterizing drought events in various parts of the country [40].
Operationally, the USDM and NADM define drought initiation of moderate severity with 20th percentile threshold. By implication, 20 percent of the time the precipitation deficits exceed the threshold. Other examples of existing composite drought indices besides the USDM and NADM are the China Meteorological Composite Drought Index [42], the Combined Drought Indicator of the Communities of European Union Drought Observatory (EDO) [43], and Kenyan Combined Drought Index [44]. Most recently, [45] developed a composite drought index dataset for Niger using a weighing technique combining entropy and Euclidian distance.
Among the strengths of the CDIs is harmonizing and streamlining drought management decision-making process, because of their ability to concurrently track all aspects of drought and provide information to diverse audience [40]. However, they may generally mask many of the complex interactions leading to drought going on at different temporal and spatial time [40]. While meeting the data requirements of USDM remains a constraint in implementing it outside United States, the USDM as a model for drought early warning systems can, however, be adapted for use in other regions while considering the unique characteristics of the region and indicators for the hydrological cycle available [46]. For example, it has been adapted in Morocco, Spain, South Korea, and some other parts of the world [47,48].
To effectively, management drought hazard, therefore, its composite nature needs to be recognized and treated as such in a comprehensive and integrated manner. Effective drought monitoring system should integrate all the relevant components of the hydrologic cycle (i.e., precipitation, soil moisture and streamflow) into a comprehensive assessment of current and future drought conditions [40].
West Africa is one of the major parts of the world facing recurring severe droughts, and still do not have comprehensive, integrated information and early warning systems in place [49]; thereby making generalization and discussion on the whole basin, as a unit difficult [50]. Despite the significance of drought hazard, the West African region does not have an effective institutional capacity not only to respond and to adapt to climatic variability and [51,52], but to also conveniently deal with the ensuing extreme events like droughts.
Similar to other parts of the world, worthwhile efforts have been made to tackle drought hazard in West Africa. Nevertheless, more works are still needed to improve the integration of different types of droughts and access to accurate and timely monitoring and predictive tools to assist both the government and non-governmental decision-makers in the Niger basin of West Africa to become more effective in preparing and responding to droughts and food security [53,54,55]. This is necessary because drought had remained a major disaster, causing huge damages to humanity, the environment, and the economy of this region [56].
It is against this backdrop, decision-makers and stakeholders often ask such questions as how can we have an all-purpose or all-in-one drought threshold for prompt detection and early warning of impending outbreak of either meteorological, agricultural or hydrological type of drought in the region? or How can farmers, water resources managers, planners and meteorologists, be aided operationally, to concurrently, identify a looming meteorological, agricultural and hydrological drought hazards before being affected? How reliable are the information from a hybrid system support tool used in making such drought management decisions that can profit diverse audience? Hence, the need to address these concerns, as they remain major gaps in the drought literature of West Africa. Therefore, this study develops a multivariate, objective drought index (DREM) for the Niger Basin, capable of detecting meteorological, agricultural, and hydrological droughts concurrently. We then compare its performance to standard indices like SPI.
2. Materials and Methods
2.1. Study Area
The study focuses on the Niger River Basin (NRB) of West Africa located roughly between longitudes 12oW and 15oE, and latitude 4o and 17oN, and covering approximately 7.5% of the continent of Africa. With the headwaters located at the fringes of the Guinean moist forests, the Niger River traverses almost all the possible ecosystem zones in West Africa, especially along its course. It is a trans-boundary river basin shared by nine riparian countries (Figure 2), geographically spanning over Guinea, Mali, Niger, Nigeria, Benin, Burkina Faso, Cameroon, Chad, and Côte d’Ivoire. It has a total population of over 100 million people depending on the river for their livelihoods, such as agricultural production and food security, transportation, trade, hydropower, and recreation [57]. In terms of drainage area including the flow regime, the Niger River is the third longest river in Africa, after Nile and Congo; with its 4,200km length and drains through hydrologically active catchment area of 1.5 million km2. Figure 2 provides succinct description of major vegetation belts and drainage networks of the Niger Basin.
Furthermore, the tropical climate of Niger Basin witnesses 7 months of cropping season (i.e., April to October) every year, during which more than 95% of the total annual rainfall is experienced [59]. Usually, annual rainfall ranges from about 100 millimeters (4 inches) in the Sahel zone to more than 1,200 millimeters (48 inches) along the pure tropical areas in the Guinea zone. The basin regularly, experiences alternating wet and dry seasons that characterizes the climate of the region, and comprises of two sub-areas, the semi-arid Sahelian region (12oN- 20oN) and humid Guinean coast (south of 10oN). The Sahel region represents an ecotone or transition between the Saharan desert and the wet climate of Guinea coast.
Additionally, as a result of its heterogeneous nature and large size, as well as its topographical and hydrological characteristics, the basin is often divided into four sub-basins namely, the upper Niger, inner delta, middle Niger, and lower Niger [60]. Figure 3 is a schematic map of the four (4) Niger River sub-basins. These sub-basins provide a better understanding of the biophysical, hydrological, and socio-economic processes affecting the basin’s water resources [61].
2.2. The Reanalysis Data
The data required and analyzed in this study comprise principally long-term monthly hydro-meteorological reanalysis datasets from the African Drought and Flood Monitor (ADFM) database covering the period 1980–2016 as shown in Table 1.
The ADFM was developed by [63], and is updated daily and provides multiple hydrologic variables at both continental and basin scales. The suite of univariate drought indicators from the ADFM were produced using Variable Infiltration Capacity (VIC) model. The VIC model is a large-scale, semi-distributed land surface hydrologic model [64]. These suite of indicators include precipitation, temperature, soil moisture and streamflow datasets. Normally, to display and view the data of a desired variable, the location, or a point for which the data is to be extracted was first selected [65]. Typically, the data extraction is done graphically by clicking on the map or by entering the location coordinates (i.e., latitude and longitude). Accordingly, by selecting point data section on the system, the time interval, and clicking on data download and answering ’yes’ on creating a corresponding data file question, and manually entering the coordinates (i.e., the latitudes and longitudes) of each of the selected locations respectively, the datasets were obtained at point scale.
Following the aforementioned procedure, the datasets were extracted for 60 stations scattered across the nine countries of the Niger river Basin shown in Figure 4. With regards to the study period, it has been selected to bring major drought episodes that occurred after the 1970s and the recovery years from the 1990s into historical context; as well as to ensure that the minimum of 30 years of continuous records required for the computation of robust drought indices is conformed with [66].
Historically, drought assessment usually relies on limited ground-based meteorological precipitation and temperature measurements. However, it is well-known these have never captured the full complexity of drought impacts on vegetation, soil moisture, agriculture, and water resources [67]. In this study, therefore, the reanalysis dataset has been preferred because of the (a) paucity of the observational dataset has been a major problem to drought depiction in the region [4,68,69]. For example, according to [4] the percentage of data gaps found from a preliminary analysis carried out ranges from 13.2%–50.5% depending on the location, (b) the database provides hydro-meteorological series of high resolution and quality. Usually, the reanalysis datasets are made available to the public through a web-based interactive interface, which is based on Google maps. Such setting allows a user to interact with the system, zoom in to a specific location, display maps and time series, as well as download the data. The link to the dataset is http://stream.princeton.edu/AWCM/WEBPAGE/interface.php.
2.3. In-situ Observational Station and Ancillary Data
The in-situ observational records used in this study for bias-correction of the AFDM datasets were extracted from the database of the Global Historical Climatology Networks (GHCN-NOAA, www.ncdc.noaa.gov/ghcnnm/v2.php) available for the period 1950–2001. The choice of the database hinged on its well-known high-quality data. Another source of observed station data considered to cover the study period was air temperature and rainfall data (1980-2020) from Nigerian Meteorological Agency (NiMet). Also, used is the community-based drought related vulnerability data such as losses in agricultural yields, losses in hydropower production, income, migration of affected population etc. collected through research questionnaire instrument.
The ancillary data used in this study include the Digital Elevation Model (DEM) and Normalized Difference Vegetation Index (NDVI). The DEM was sourced from HYDRO1k, a geographic database developed by the U.S. Geological Survey’s EROS Data Center (http://www.creaf.uab.es /miramon/mmr/examples/miombo/docs/database). It was used for delineating and describing the study area using Spatial Analyst Tool in ArcMap Geographic Information System (GIS). The NDVI dataset was extracted from the ADFM database and used for the performance evaluation of the CDI. The performance evaluations were based on exploratory data analysis and use of some statistical tools, which include Mean Absolute Error (MAE), Coefficient of Determination (R2), Nash Sutcliff Efficiency (NSE), and Bias Percent (PBias) and Index of Agreement (d).
2.4. Methodology
2.4.1. Data Quality Control: Bias Correction of Reanalysis Dataset
The AFDM reanalysis datasets namely, precipitation, air temperature, soil moisture and streamflow were subjected to quality control to correct the biases and improve on the quality of the datasets using the linear scaling method [70]. This method was preferred to delta and quantile mapping methods of bias correction, because of its simplicity and straightforward application in dealing with observed and predicted probability distribution functions (PDFs)/CDFs. Moreover, it is well suited for handling both bounded variables such as precipitation and unbounded variable like temperatures [71]. Usually, precipitation is corrected with a multiplier (x) and temperature with an additive term [72,73]. Subsequently, the obtained BCF was used to correct the reanalysis dataset for the 2002–2016 periods. The mathematical expression of the linear scaling method is as stated below.
, t =1,2,……………,35J (1)
(2)
where , and are corrected monthly precipitation and temperature, while and are uncorrected monthly precipitation and temperature. and are the mean values of monthly observed and climate model reanalysis data for the calibration period(t), and J is the number of years.
2.4.2. Understanding the Climatology of Niger River Basin Based on Station Data
The knowledge of the climatology of a place is critical in establishing an objective operational threshold for defining and distinguishing dry spells from actual drought conditions; thus, needs to be analytically, elucidated. Additionally, being able to recognize an emerging drought, or knowing whether drought is over, entails understanding what is normal for a given season or location, and considering longer time frames. For instance, if an area has been in drought for a while it naturally takes more than one or two rains of significant values to end it, although one rain may be all that is needed to awaken inactive vegetation or spur growth of crop (https://droughtmonitor.unl.edu/ data/docs/USDM_brochure.pdf). To this effect, analyses of the spatial characteristics of rainfall of the region from 1980 to 2016 has been carried out.
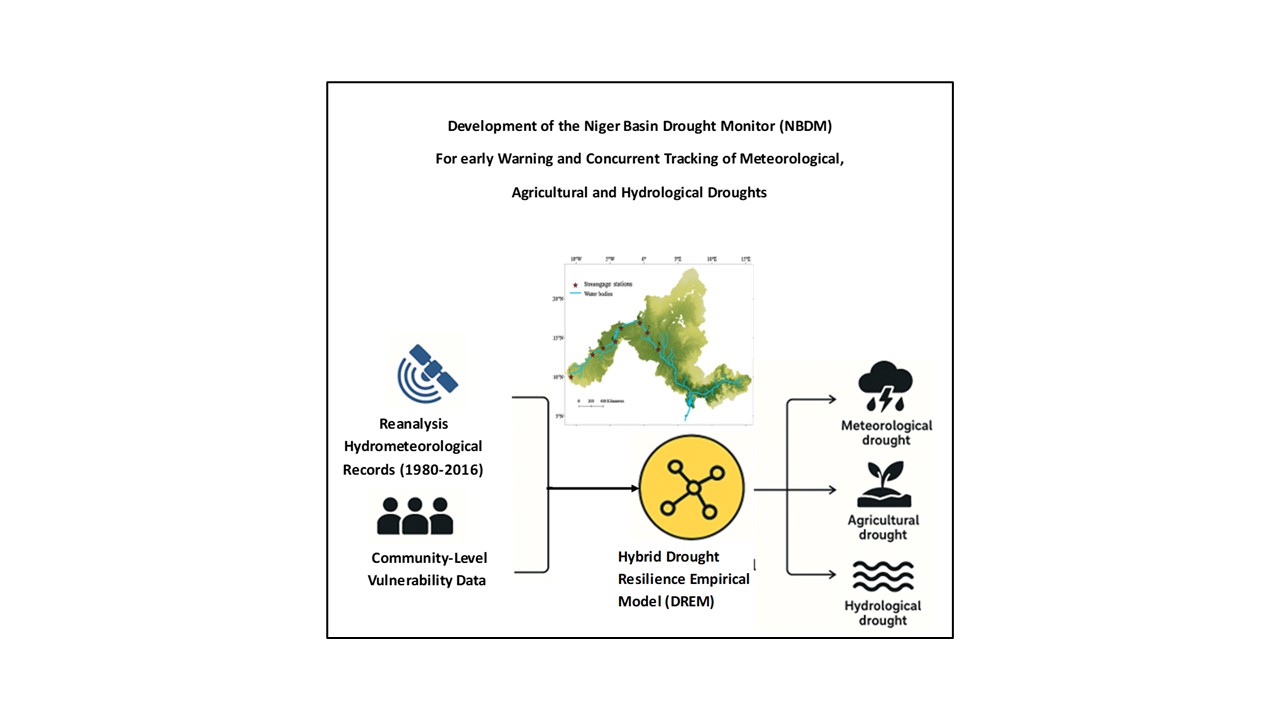
2.4.3. Conceptual Framework of Design of Niger Basin Drought Monitor (NBDM)
The Niger Basin Drought Monitor (NBDM) functions as a Drought Resilience Empirical Model (DREM), represented in Figure 5. It connects the main drought types—meteorological, agricultural, hydrological, and socio-economic—showing how precipitation acts as the carrier of drought signals [74] through the hydrological cycle. Reduced rainfall leads to soil moisture deficits, plant stress, groundwater decline, and streamflow reduction, resulting in agricultural and hydrological droughts [18,75,76]. For example, [77] found a substantial seasonal correlation between meteorological and agricultural droughts in spring, summer, and autumn, as evidenced by cross-wavelet coherence analysis.
Meteorological drought arises from prolonged precipitation shortages. These shortages, worsened by rising temperature or evapotranspiration, trigger agricultural drought when soil moisture falls below levels needed for crop growth, leading to reduced yields. Hydrological drought occurs when surface and subsurface water resources, runoff, and groundwater recharge fall below normal. Socio-economic drought emerges when these water deficits disrupt human activities. Two concepts namely, timescale and inertia underpin drought behavior and monitoring [35]. Inertia reflects delays in system responses to drought signals, while timescale refers to the lag between water shortages and their impacts [77,78]. For instance, soil moisture reacts quickly to rainfall deficits, while groundwater responds slowly. Monitoring requires capturing these lags to provide early warning and action [79]. To integrate predictors, multiple regression models generate a weighted linear combination, (www.unt.edu/rss/class/mike/ 5710/Multiple%20Regression) illustrated in Figure 6.
The mathematical formulation for the empirical derivation of the DREM or NBDM model based on the objective blend of drought indicators (OBDI) is as expressed below
(3)
where, represents the selected input drought indices and /or indicator, is the weight for each index, N is the number of input drought indices
(4)
where β1, β2 and β3 represent the weightings (Wj) of the meteorological drought index (Met. DI), agricultural drought index (Agric. DI) and hydrological drought index (Hydro. DI) respectively. The weight β1, β2 and β3 as shown in equation 4 is constraint to 1, to minimize error, hence, β1+ β2 + β3 = 1.
2.4.4. The Development Process of the Niger Basin Drought Monitor (NBDM)
The Niger Basin Drought Monitor (NBDM) was developed in the form of Objective Blend of Burden of Drought Disaster Indicator (OBBDDI) similar to USDM Objective Blend Drought Indicators (OBDI). The OBBDDI is a drought resilience empirical model (DREM) established from a linear combination equation. The OBBDDI was created by integrating three input indices namely, the Standardized Effective Precipitation Index (SEPI), Soil Moisture Index (SMI) and the Streamflow Index (SFI) representing indices for the three biophysical forms of drought i.e., meteorological, agricultural, and hydrological drought to establish an “All-in-One drought Model” for concurrent tracking of anomalies of three components of the hydrological cycle (i.e., precipitation, soil moisture and streamflow) with the view to monitor drought evolution in the basin holistically.
With regards to the commonly used meteorological drought indicator, the SPI, the lack of consideration for the effect of temperature on drought constitutes one the limitations of SPI model. Hence, instead of using SPI as input indicator, the Standardized Effective Precipitation Index (SEPI) was introduced as indicator of meteorological drought. Therefore, to account for the effect of temperature or potential evapotranspiration, effective precipitation was considered and transformed into Standardized Effective Precipitation Index (SEPI) following the SPI approach by replacing precipitation with effective precipitation as input data. The other input indicators into the CDI were soil moisture (SM) and streamflow (SF) which were transformed into Soil Moisture Index (SMI) and Streamflow Index (SFI) using the Normal Curve Equivalent (NCE) method, because the units of measurement of the indicators were in percentiles. The computation of the potential evapotranspiration and effective precipitation parameters and of the standardization process are detailed below under general methodological framework.
Following the standardization of the input indicators, the independent variables coefficients or weightings i.e., (Wi) = W1, W2 and W3 were determined for the Niger River Basin on the average were W1 = 0.278, W2 = 0.322, W3 = 0.400 representing weight for the meteorological, agricultural, and hydrological drought indices respectively. Thereafter, drought category thresholds and weights for each individual index was assigned. Hence, the NBDM is a worksheet model, and mathematically expressed as
(5)
The weight coefficients of each of the three input indicators or variables (SEPI, SMI, and SFI) in the Objective Blend of Burden of Drought Disaster Index (OBBDDI) was established using the concept of drought disaster burden (DDB) resulting from exposure of the society to different biophysical forms of drought events. The burden of drought disaster (BDD) or drought disaster burden (DDB) measures the weight of the impacts of the different types of droughts on the society based on drought disaster damage indicators or simply disaster damage indicators (DDI). The concept of BDD was adapted from the World Health Organization (WHO) concept of Disability-Adjusted Life Years (DALYs) Measure of the Direct Impact of Natural Disasters. Thus, the weight of each input indicator components was empirically determined. This was achieved using the obtained community level drought vulnerability data. This was done with the view to establish the relative importance of each of the input drought indicators into the empirical model.
2.4.5. Description of the General Methodological Framework of NBDM Development
The general methodological framework for the development of the NBDM is described in Figure 7. There are six (6) different modules, namely the (i) input data / Database Management module, (ii) the potential evapotranspiration (PET) computation module, (iii) the indicators standardization module, (iv) Dry Spell / Drought Triggers Module, and (v) Objective Blend of Burden of Drought Indices (OBBDI) Module and (vi) Integrated dry spell and Drought Detection Module. Provided below is a brief description of each module.
- i.
- The input data module: It comprises all the hydrometeorological monthly data used in the analysis, which includes precipitation, temperature soil moisture and streamflow. Hence, the database contains 60 stations with 4 different parameters as highlighted above.
- i.
- ii. The potential evapotranspiration (PET) computation module: It consists of two different approaches for computing the PET for the purpose of comparison of results. They are the Thornthwaite Method and Hargreaves and Samani method using Mean surface air temperature, maximum and minimum temperatures.
Usually, the Thornthwaite Method uses air temperature as an index of the energy available for evapotranspiration, with the assumption that air temperature has a correlation with the integrated effects of net radiation and other controls of evapotranspiration, and the available energy being shared in fixed proportions between heating the atmosphere and evapotranspiration. The empirical equation relating the evapotranspiration to the air temperature is expressed below [80].
(6)
(7)
(8)
where PET is the monthly potential evapotranspiration, T is the monthly mean air temperature (°C), I is a heat index for the station imposed by the local normal climatic temperature regime and the exponent a is a function of I; µ is the number of days in the month under consideration, and N is the mean number of daylight hours in a particular month. The Thornthwaite method was selected in this study because it provides the best results on the regional level [81,82] and fewer data required. The major drawback of this method is that the computation of PET ceases as soon as temperature gets to below zero. This condition is not visible for a tropical hot type of climate in West Africa.
With regards to the [83] equation, it is an empirical radiation-based method that is extensively used in the conditions of limited weather data, such as the study region. It has been found to also give better results relative to other methods [82]. It requires only maximum and minimum air temperatures and extra-terrestrial radiation (Ra) It is mathematically expressed as:
(9)
(10)
(11)
where, PET is the potential evapotranspiration(mm/month); is extraterrestrial radiation (mm/month) and the values of gotten from table depending on the latitude position of each station or location; is the monthly mean air temperature(◦C); is the monthly maximum air temperature (◦C); is the monthly minimum air temperature (◦C); is the empirical radiation adjustment coefficient. With the computation of PET, all the precipitation data were converted to an “effective precipitation”. The Effective Precipitation (Ep) was computed using the combination of precipitation and PET. For comparison of results two approaches were considered in this study and built into the DREM, namely, the (i) Multivariable Regression Model method or (ii) the United States Department of Agriculture, Soil Conservation Service [84] method, which is applicable under irrigation condition or assumption.
- i.
- The drought indicators standardization module: It uses percentile method to transform all input data into a standardized scale. To achieve this, two options were considered, the Standardized Precipitation Index (SPI) model approach [4], if the indicator measurement was in international system unit (i.e., S.I unit), or the Normal Curve Equivalent (NCE) method, if the unit of measurement of the indicator was in percentile. The SPI model was selected because of its widespread acceptance and recognition as the standard index for the monitoring of drought events [85].
The mathematical expression for the SPI model used in this study is as stated below.
(12)
(13)
where
(14)
(15)
C0 = 2.515517, C1 = 0.802853, C2 =0.010328, d1 = 1.432788, d2 = 0.189269, and d3 = 0.001308.
The mathematical expression of the NCE method used in this study is as shown below.
(16)
where z is z-score, NCE is the normal curve equivalent value in percentile.
- ii.
- The dry spell and Drought conditions triggers module: It comprises the various drought definition or drought initiation (onset) thresholds for each of the respective indices considered in this study, namely, SPI, SEPI, SMI, SFI and CDI. It also consists of the threshold(s) for the phase change or transition from dry spell to actual drought phase.
- ii.
- iii. Objective Blend of Burden of Drought Indices (OBBDI) Module: It determines first the relative weight of the impacts of each type of droughts (i.e., meteorological, agricultural and hydrological droughts) on the society based on available drought disaster damage indicators, then, thereafter, established the OBBDDI hinged on the concept of drought disaster burden (DDB) resulting from exposure of the society to different biophysical forms of drought events.
- ii.
- iv. The last module is the integrated dry spell and drought detection module: It identifies and categorizes the severity of the detected drought events using the established thresholds.
2.4.6. Determination of Percentile-based Drought Threshold
To determine operational objective drought thresholds for defining and measuring drought episodes in the Niger Basin, a baseline assessment analysis (BAA)” of the region’s precipitation behavior when known historical drought-induced famine with serious impact on the society occurred was carried out by determining the percentiles of the precipitation anomalies. To achieve this, the precipitation behavior during the well-known 1980s drought induced-famine was examined. All the precipitation records were first rendered as percentiles with respect to the selected study period 1980–2016 using the “Percentile Rank (PR)” method. Normally, the PR method returns the rank of a value in a data set as a percentage of the data set. Thus, within a dataset, this function can be used to evaluate the relative standing of a value in a time series 7. https://support.microsoft.com/en-us/office/percentrank-function-f1b5836c-9619-4847-9fc9-080ec9024442-accessed-8-12-2022). The analyses were carried out using Excel for Microsoft 365.
Based on the annual averages, the precipitation deficits percentile for each year was determined to identify the drought months and years and their percentile values. This is with the view to ascertain the relative standing of the 1980s rainfall values at different locations recorded in the drought chronology of the region that caused famine during the period. The Microsoft Excel PR method adopted in this study is defined as the number of values in the dataset (y) smaller than x divided by the sum of the number of values in a dataset (y) smaller than x and the number of values in a dataset (z) larger than x. The PR approach is mathematically expressed as below.
(17)
where x is the value for which you want to know the rank, Y is the number of values in the variable dataset smaller than x, and Z is the number of values in the variable dataset larger than x.
The PR approach has been preferred in this study because of its simplicity, and it has been successfully applied in US Drought Monitor (USDM), which is the first composite drought index that is widely known to have successful application and has become, at least in North American continent the golden standard in multivariate drought analysis. Also, the 1980s period were chosen to bring the major drought-induced famine events after the 1970s drought and the recovery years from 1990s into historic context. Moreover, the drought events of 1980s eclipsed that of 1970s as the worst drought ever recorded in history of the region, resulting in the region witnessing the worst rainfall deficit since instrumental records began [86]. Therefore, in this study, “an objective threshold(s) for defining the onset of a moderate drought is being established as the corresponding index values of the CDI associated with the established precipitation deficits percentiles during the 1980s when drought induced famine occurred in the region for each of the month and for the annual average”. The CDI-based threshold for defining drought has been computed by determining the CDI values corresponding to the already established percentiles for drought occurrence in the study region and its various severity categories accordingly. The thresholds were established for both monthly and annual average timescales. Subsequently, based on runs theory concept, the CDI values less than the computed index thresholds were identified as drought and their severity categorized accordingly.
2.4.7. Operational Application of the Established Drought Definition Thresholds
To apply the obtained CDI thresholds to define or detect and characterize drought conditions the principle of runs theory proposed by [87] and recommended by [88] was followed using the threshold method of drought definition. Figure 8 is an illustration of the application of runs theory. According to [87], a run is defined as a sequence of consecutive values of a variable below a given or define thresholds that are preceded and followed by at least one value of the variable. Below is the procedure to charactrize drought events using threshold approach.
Precipitation Deficit(dt) which could also be expressed in normalized form was obtained as a difference of precipitation record (Pt) from the expected threshold (Te). The logic and rationale behind the application of Runs theory in drought detection is mathematically expressed below.
(18)
In this study, we argued that agricultural and water resources activities within a region are usually adapted to a norm that can be approximated by long-term averages of precipitation. As a result, defining Xo as the mean or median of the time series (X) from Figure 8, usually results in about 50% of the time periods being “droughts”. By implication, one is analyzing dryness or dry periods rather than drought. But all dryness is not drought, some could be dry spells. In this study, therefore, the term “drought” is restricted to the more extended and severe dry periods [89]. Thus, underscoring why long-term averages cannot be suitable truncation level for drought definition. In this study, therefore,
Expected threshold (Te) = Long-term Average (19)
For the impact of the dt to be felt in a region, the precipitation deficit must have cumulative effect, which can be estimated using mathematical expression below.
(20)
Drought initiation occurs when the cumulative deficit is less than the critical Threshold (Tc), i.e., the objective drought thresholds being determined in this study. Thus, the Tc becomes the ideal truncation level (threshold) for defining drought occurrence.
(21)
Thus, once is determined, each period for which X < constitutes a “drought” and each “drought” is characterized by
(a) Duration (D) is defined as length of period for which X <
(b) Severity (S) is defined as cumulative deviation from and
(c) Intensity (or magnitude) (I) is defined as S / D.
2.4.8. NBDM As Visual Basic Application-Driven Drought Early Warning System (DEWS)
To seamlessly operate NBDM represented as DREM, a hybrid drought monitoring and earning system tool, Microsoft Excel Visual Basic Application (VBA) program was used to execute and connect all the various modules that are in involved in the computational tasks. The VBA programming language was selected because in the DREM application for the computation the CDI, it required several macros writing to handle different aspect of the application tasks [90]. Usually, the rule is when developing an excel based application that will span several worksheets, it is advisable to use macro to handle several procedures rather than writing formulars in the excel cells. Normally, when a new value is entered into a worksheet cell, Excel will recalculate all the cells that refer to it. If the macro is writing values into the worksheet, VBA will need to wait until the worksheet is done with recalculating each entry before it can resume. Hence, it is advisable using VBA when one needs to accomplish tedious tasks such as involved in this study [91]. With VBA therefore, even if the CDI database grows bigger and heavier it will still run fast since there are no excel formulas written inside cells. Microsoft also adds in a lot of code at the background for VB projects to make them easier for any coder.
2.4.9. Evaluation of Performance of NBDM Outputs
The NBDM performance was evaluated against SEPI, SMI, SFI and Normalized Difference Vegetation Index (NDVI). The performance evaluations were based on exploratory data analysis and use of some statistical tools, which include Mean Absolute Error (MAE), Coefficient of Determination (R2), Nash Sutcliff Efficiency (NSE), and Bias Percent (PBias) and Index of Agreement (d).
3. Results and Discussion
3.1. Model Development Outputs
Niger Basin Drought Monitor represented as Drought Resilience Empirical Model (DREM) has been developed as a hybrid composite drought index (CDI) for defining and concurrent monitoring of the different aspects and biophysical forms of drought and the characterization of historical droughts. The DREM’s Login interface, Menu interface, output format and typical CDIs generated results using DREM are all displayed in Figure 9, Figure 10 and Figure 11 respectively. The Login user interface is for inputting the user’s ID to ensure that user’s information and work done is secure. The menu interface shows the various functionalities and computations that could done using DREM including the display of number of stations in the database and date a particular task was carried out. Hence, it is an interface where the user can select any task to be executed by DREM. The format of the CDI output from DREM is shown in Figure 11, and drought occurrence is detected on monthly basis and the category of the severity of drought identified shown using colored codes; whether it’s moderate (MOD DRGT), severe (SEV DRGT), extreme (EXTR DRGT), or exceptional (EXCPT DRGT) drought.
3.2. Thresholds and Detection of Drought Onset and Cessation
To identify the occurrence of drought events in the study region, CDI thresholds were computed using the DREM which were in the range -0.26 to -1.19, -0.42 to -1.60, -0.58 to -1.76 and -0.73 to -1.96. The index-based thresholds were computed corresponding to the established precipitation deficit percentiles defining drought occurrence at each location in the study region, that is, 20th, 10th, 5th, and 2nd percentiles representing Moderate(D1), Severe(D2), Extreme (D3) and Exceptional (D4) drought respectively; which are also distinguished by color codes. Thus, to concurrently monitor the different aspects of drought, namely, meteorological, agricultural, and hydrological drought in different socio-economic sectors of the Niger Basin, DREM defines and identifies the onset of drought of moderate intensity when the CDI values fall below the thresholds range of -0.26 to -1.19 over a period of three consecutive months depending on the location. However, when it comes to knowing drought cessation over an area, DREM computed CDI values were in the range of thresholds of -0.08 to -0.82 depending on the location corresponding to precipitation deficits of 30 percentile representing an abnormally dry condition(D0), that is, not yet drought. Normally, D0 is a “heads-up” stage, which is simply saying two things. First, it says “pay attention, because if it stays dry, the region or area could slide into a real drought represented as D1, D2, D3 or D4 depending on the severity. Second, it can also mean the area is just coming out of a drought but the soil and water supply haven’t fully recovered yet. Possible physical signs could be grass turning brown early, small streams low, early stress on crops, and need for more watering.
Furthermore, for easy identification of drought threshold at any location within the basin, for moderate drought severity level, the spatial distribution of the moderate drought level threshold (D1) was computed and is depicted in Figure 12. It defines the 20th, percentile precipitation deficits relative to the climatology of the basin. This is with view that being able to recognize emerging drought, or knowing whether drought is over, entails understanding what is normal for a given location or season (https://droughtmonitor.unl.edu/data/docs/USDM_brochure.pdf). The corresponding index-based thresholds for initiation or onset of drought of moderate severity in different locations of the Niger basin are for example Bamako (-0.71) Koulikoro (-0.90), Dire (-0.74), Gao (-0.90), Dori (-0.84), Ouagadougou (-0.96), Niamey (-0.98), Tahoua (-0.79), Malaville (-1.04), Kandi (-1.02), Abuja (-0.64), Makurdi (-0.69), Numan (-0.59) and Yola (-0.70). Thus, there is variations in the drought thresholds even within the same sub-basin and country; thereby, affirming the fact that drought definition thresholds are always location specific as asserted by [28]. Additionally, it is observed in the figure that even the same amount of rainfall does not translate to moderate, severe, extreme or exceptional drought events in different parts of the basin at the same time. This corroborates well with the equiprobability transformation of rainfall distribution in the basin. Further result revealed that relative to the climatology of the basin, areas with wetter climate, require lower drought index threshold values or higher precipitation deficits values to initiate onset of drought, while areas known for drier climate regime require higher drought index thresholds or lesser precipitation deficits values to define drought events in those regions.
3.3. Equiprobability Transformation Analysis for Drought Detection
The NBDM-CDI result was further substantiated through an SPI equiprobability transformation analysis of rainfall distribution in the Niger. As evidenced in the conceptual graph in Figure 13, the same amount of August monthly precipitation of 200mm for example, produced different index values and cumulative probabilities in different parts of the basin (i.e., Upper Niger, Inland Delta, Middle Niger, and Lower sub-basins).
These SPI values and the cumulative probabilities obtained for each of the sub-basins are -0.765, 2.37, 0.435, −0.421 and 0.224, 0.960, 0.670 0.315 respectively. By implication, drought episodes in different locations of the basin are comparable in space and time, which agrees very well with the findings over United States by [92]. It, therefore, demonstrates one of the strengths of application of SPI metrics in drought management analysis. The consequence of the result, is that farmers in different parts of the basin will experience differently the effects of the same amount of rainfall. Thus, the use of varying drought thresholds remains critical for objective drought identification and planning in the Niger River Basin.
3.4. Spatial Characteristics of the Major Droughts of 1980s in the Niger Basin
The result of the capability of NBDM to reproduce the occurrence of the well-known drought induced famine in the Niger Basin revealed through spatial analysis that during the 1980s period, a large portion of the Middle Niger and Inland Delta Sub-basins were under extreme to exceptional drought conditions, while most other parts of the Upper Niger and Lower Sub-basins within the rain forest climatic zones were under moderate drought conditions as shown in Figure 14. Additionally, relative to the univariate or single indicator subjective drought threshold proposed by [26] and the objective SPI-based thresholds established in this study, the NBDM-CDI based drought thresholds are higher values and would require lesser cumulative precipitation deficits to be attained as shown in Table 2. So, on the average, across the whole basin, the NBDM-CDI based thresholds are higher (requiring smaller precipitation deficits) than single variable SPI-based ones; because the NBDM-CDI are designed based on multi-indicator approach. It incorporates soil moisture and streamflow as inputs. As a result, CDI flags drought with less rainfall deficit than SPI alone. Additionally, the NBDM-CDI allows for a holistic view of drought conditions [93]. This makes it particularly useful for decision-making, as it captures not only meteorological deficits but also hydrological and agricultural impacts.
3.5. Effectiveness in Early Detection and Cessation of Drought
The CDI threshold values are the bolded figures highlighted in the Table 2. With CDI-based thresholds established in this study, research findings reveal that impending drought events or outbreak of drought would be detected earlier, faster and more accurately, than the SPI-based objective thresholds and also much earlier than the SPI-based subjective thresholds from the literature developed by [27] that will require more precipitation deficits. The same holds for the cessation of drought in the region. The study findings are in consonant with the results of [94] over India the CDI was found to provide a more accurate reflection of crop stress than SPI alone. According to the authors, the Indian Meteorological Department tested the CDI by integrating rainfall, soil moisture, and vegetation indices to improve monitoring of agricultural droughts in states such as Maharashtra. Similarly, over China [95] developed a CDI by integrating soil moisture and evapotranspiration data for northern China. The CDI captured agricultural drought impacts better than SPI, especially during high-temperature summers. In the Sahelian region of West Africa, SPI sometimes identifies drought even when irrigated agriculture maintains stable crop yields, highlighting its limitations [96]. Likewise, [28] in their study over Europe posited that SPI may indicate drought even when impacts are mitigated by irrigation or groundwater; something composite indices such as the USDM would account for
However, in the United States, scientific studies consistently show that SPI is more effective in detecting drought onset, especially short-term agricultural and meteorological droughts [97]. Its simplicity and sensitivity to rainfall deficits allow it to signal early warnings before broader impacts manifest. On the contrary, SPI struggles with drought cessation detection, as recovery in precipitation does not always align with soil moisture or hydrological recovery. Also, in 2017 for example, parts of the Northern Plains of United States experienced a flash drought. But SPI alone failed to detect the early onset, because rainfall deficits were minor, but USDM captured rapid soil moisture depletion, proving more effective for early warning [98]. Aside, the USDM, was also found to be more effective in monitoring drought persistence and cessation, as it integrates soil moisture, streamflow, and other factors that reflect recovery more accurately [40,98]. According to [99] USDM provides a more accurate picture of drought recovery, since it considers lagging indicators like groundwater and vegetation health; whereas SPI may signal recovery as soon as rainfall resumes, but this can be misleading if soil moisture or hydrology remain stressed. For example, in California’s 2012–2016 drought, SPI signaled recovery earlier than reality, while USDM correctly indicated ongoing hydrological stress [100]. Generally, SPI is more effective for rapid, rainfall-driven drought onset detection, especially in data-sparse regions such as West Africa; because it detects rainfall anomalies quickly, thereby, making it effective for meteorological drought onset [26]. However, CDI is more accurate for drought persistence and cessation monitoring, particularly in agricultural systems and regions where evapotranspiration plays a major role; such as West African region; because, it detects drought onset more reliably than SPI, when temperature and evapotranspiration drive soil moisture stress, even without rainfall deficits [9897].
3.6. NBDM-CDI Performance Evaluation
The NBDM CDI-based time series performance was evaluated on sub-basin-wise, based on the ability of the CDI to reproduce the meteorological, agricultural, and hydrological drought conditions represented by SEPI 6-month timescale, soil moisture index (SMI) and streamflow index (SFI) respectively. Result of the exploratory data analysis obtained based on the Coefficient of Determination(R2) for example showed that CDI can explain about 70%, 84% and 92% of variances in SEPI 6-month, SMI and SFI respectively over the Upper Niger Sub-basin as shown in Table 3.
Further results based on other statistical evaluation analysis showed strong agreement between DREM-CDI values and SEPI, SMI and SFI representing meteorological, agricultural, and hydrological drought indicators respectively. Especially, stronger agreement exists with soil moisture (SMI) and streamflow (SFI) over the Upper Niger, Middle Niger, and Lower Niger sub-basins, where the Nash Sutcliff Efficiency (NSE) values were 0.946 and 0.922, 0.889 and 0.935, 0.864 and 0.906 respectively; and Index of Agreement (d) values were 0.953 and 0.978, 0.914 and 0.932, 0.890 and 0.910 respectively. Thereby making DREM a suitable Niger Basin Drought Monitor an effective early warning tool decision-makers and stakeholders can trust and rely upon for effective management of drought in the basin. Other results of the statistical tools used, namely, Mean Absolute Error (MAE), and Bias Percent (PBias) are shown in Table 3.
The DREM CDI tool has therefore, proven to have the capability to simultaneously track meteorological drought (if measured using SEPI), agricultural drought (if measure using SMI) and hydrological drought (if measured using SFI) at a minimal error. Thus, it can serve as an All-purpose useful tool for concurrent monitoring and early warnings of impending different aspects of drought hazards in the Niger Basin.
3.7. Calibration / Validation of Performance of NBDM CDI
To ascertain the suitability of the NBDM represented as Drought Resilience Empirical Model (DREM) as a decision-support tool, the Composite Drought Index (CDI) was validated country-wise against historical drought records from the EM-DAT/UN-FAO chronology database and ENSO-related drought years from the International Research Institute (IRI) for the nine Niger Basin countries (1980–2016). Drought years were identified or defined when CDI values fell at or below established objective thresholds. Validation measured agreement between CDI-defined droughts and historical events, expressed as hit/success rates. Results displayed in Table 4 showed 67–100% success with historical drought events captured by NBDM CDI and 62–77% with ENSO-related droughts captured by NBDM CDI. The strong performance of NBDM CDI and its ability to further distinguish dry spells from genuine droughts suggest it is more practical and objective than indices using subjective thresholds to define drought events, making it highly suitable for drought alert triggers, decision-making, and early warning in the Niger Basin.
Further, the NBDM CDI time series was validated sub-basin-wise against the Standardized NDVI (SNDVI). Correlations ranged from –0.231 to 0.522, with negative values over Niamey, a semi-arid region influenced by microclimatic changes due to the Kandaji Dam. Since CDI is temperature-related and NDVI is sensitive to air temperature, especially during summer or warm months of the year (April–October), then, negative correlations are expected [101,102]. High temperatures increase evapotranspiration, reducing soil moisture and vegetation vigor, which in turn lowers NDVI [103,104]. This confirms the close relationship between soil moisture and vegetation health in arid and semi-arid areas [101].
In terms of potential limitations, the NBDM-CDI requires multiple reliable datasets, such as soil moisture and streamflow datasets that are often lacking in developing regions such as West Africa. In constructing the NBDM OBDDDI, I have to rely on reanalysis datasets. Also, it is region-specific, with weights assigned to the input components based on local conditions and data availability. So, the weighting of components can vary, leading to inconsistent results across studies; especially, if the region outside its region of development is more vulnerability to agricultural drought than hydrological drought. Additionally, in terms of calibration and validation, both historical drought event comparison and remote sensing validation approaches were used which may potentially have some limitations. For instance, the approaches are dependent on quality of historical drought records, which may be incomplete or subjective and the NDVI Satellite data, which may be influenced by non-drought factors (e.g., pests, land-use changes) respectively. Moreover, while composite indices can capture drought complexly, they can also mask individual drought signals unlike the single-variable-based indices.
3.7. Comparison Between USDM and NBDM
In comparison to the USDM OBDI, the NBDM OBDDBI is computed at a station-level scale (finite resolution) with minimal complexity and subjectivity. Its construction combines subjective community-level vulnerability datasets (e.g., income, migration, dependence on rainfed agriculture, yield losses) used mainly for weighting indicators, with a smaller set of objective hydrometeorological indicators such as precipitation, soil moisture, and streamflow. This makes it applicable in regions highly vulnerable to hydrological and agricultural drought. The NBDM OBDDBI is scalable and replicable just like SPI, as it can be applied at local or station, regional, or global scales with consistent methodology, though further verification is needed.
By contrast, the USDM is more flexible, in the sense that any number of inputs can be used, integrating 40–50 inputs that include objective hydrometeorological datasets and subjective sources such as expert judgment, farmer/community impact reports, citizen science observations, and local agency input. This wide input base, makes USDM highly robust and adaptable to diverse user needs but also more complex and subjective [105]. In terms of temporal scale, the USDM is issued weekly but can be adapted for monthly use. However, when fewer inputs are available, its robustness weakens, though it remains functional. Spatially, USDM OBDI values are computed at a climate-division level (coarser resolution), aimed at consistently assessing drought severity across multiple timescales [106].
Although data constraints in the study region are acknowledged, however, in terms of future research, there may be need to consider the following areas. These may include, for example, validating NBDM CDI with ground observations or extending the study period to more recent years) to strengthen the study outcome and conclusions. Another area for further research consideration is in verification and validation of the scalability of the NBDM OBDDBI.
4. Conclusions
In this study, the problem of confusions caused by the plurality of single variable drought indices and lack of effective institutional capacity, comprehensive, integrated information, and early warning systems to respond and adapt to extreme climatic variability like drought over the Niger River Basin, West Africa was addressed. The key findings, conclusions, and recommendations of this study are the following:
- i.
- The Niger Basin Drought Monitor (NBDM) has been developed to effectively integrates three hydrometeorological indicators, precipitation, soil moisture, and streamflow to provide a single ‘average’ drought designation at station level with the intent to have a composite drought index (CDI) that captures local drought conditions.
- ii.
- The percentile rank approach was used to transform first all input datasets into a standardized scale to which drought category thresholds and weights for each individual index was assigned. The CDI-based thresholds of range −0.26 to −1.19 for defining drought of moderate intensities were established and found to be consistently higher than the single variable SPI-based ones, implying earlier detection of any impending drought for a given rainfall deficit.
- iii.
- In terms of evaluation of the NBDM-CDI, high Nash Sutcliff Efficiency and index of agreement values show NBDM-CDI tracks soil moisture and streamflow drought well.
- iv.
- The model validation showed 67–100% success with historical drought events captured by NBDM-CDI and 62–77% with ENSO-related droughts captured by NBDM-CDI. Also, NBDM-CDI time series were further validated sub-basin-wise against the Standardized NDVI (SNDVI), the result further confirms the close relationship between soil moisture and vegetation health in arid and semi-arid areas.
- v.
- The NBDM offers a robust all-in-one drought early-warning tool for the basin region and therefore, being recommended for use as drought alert triggers in decision-making, and early warning in the Niger Basin.
Author Contributions
Research conceptualization, Okpara, J.N. and Ogunjobi, K.O.; Methodology, Okpara, J.N.; Software Okpara, J.N.; validation, Okpara, J.N., Ogunjobi, K.O. and Adefisan, A. A,;formal analysis, Okpara, J. N.; investigation, Okpara, J.N.; resources, Okpara, J.N.; data curation, Okpara, J.N.; writing, Okpara, J. N.; writing review and editing, Ogunjobi, K. O. and Adefisan, A. A.; visualization, Adefisan, A.A.; supervision, Ogunjobi, K. O. and Adefisan, A.A. ; project administration, Okpara, J.N.. All authors read and agreed to the published version of the manuscript
References
- IPCC. Summary for Policymakers. In: Climate Change 2023: Synthesis Report. Contribution of Working Groups I, II and III to the Sixth Assessment Report of the Intergovernmental Panel on Climate Change [Core Writing Team, H. Lee and J. Romero (eds.)]. IPCC, Geneva, Switzerland,2023 pp. 1-34. [CrossRef]
- Okpara J.N., Afiesimama E.A., Anuforom A.C., Owino A., Ogunjobi K.O. The applicability of standardized precipitation index: drought characterization for early warning system and weather index insurance in West Africa. Nat Hazard 2017, 89(2):555–583.
- Sarr B. Present and future climate change in the semi-arid region of West Africa: a crucial input for practical adaptation in agriculture. Atmos Sci Lett, 2012, 13:108–112. https:// doi. org/ 10. 1002/ asl. 368.
- Okpara, J. N., K. O. Ogunjobi and · E. A. Adefisan. Developing objective dry spell and drought triggers for drought monitoring in the Niger Basin of West Africa. Natural Hazards 2022. [CrossRef]
- Wilhite D. A. Drought monitoring, mitigation, and preparedness in the United States: an end-to-end approach, paper presented at the task force on socio-economic application of public weather services. WMO, Geneva, 2006.
- World Meteorological Organization. High level meeting on national drought policies. 2013. towards more drought resilient societies. Geneva, 11–15 March 2013 [online]. http://www.wmo.int/pages/prog/wcp/drought/hmndp/index.php (citation 20 Nov 2020).
- Benson, C. and Clay, E. The Impact of Drought on Sub-Saharan African Economies. World Bank Technical Paper No. 401, The World Bank, Washington DC, 1998, 80 p.
- Tarhule, A. Damaging Rainfall and Flooding: The Other Sahel Hazards 2005, Volume 72, pages 355–377.
- Boyd, E., Rosalind, J.C., Lamb, P.J., Tarhule, A., Lele M.I. & Brouder, A. Building resilience to face recurring environmental crisis in African Sahel. Nature, Climate Change, 2013, 3, 631–637.
- FAO. The Sahel crisis executive brief, 2012.
- UN-OCHA. Sahel Drought Crisis Humanitarian Update, 2011.
- Konapala, G., Mishra, A. K., Wada, Y. and Mann, M.E. Climate change will affect global water availability through compounding changes in seasonal precipitation and evaporation. Nature Communications 2020, 11(1) 3044 . [CrossRef]
- Condon, L.E., Atchley, A. L. and Reed M. Maxwell, R.M. Evapotranspiration depletes groundwater under warming over the contiguous United States. Nation Communications 2020, 11:873 . [CrossRef]
- Findell, K.L., Keys, P.W., Van Der Ent, R.J., Lintner, B. R., Berg, A. L., and Krasting, J. O. Rising Temperatures Increase Importance of Oceanic Evaporation as a Source for Continental Precipitation. Journal of Climate. Journal of climate 2019, vol 32. [CrossRef]
- World Meteorological Organization (WMO). State of Climate Services Report.2024.
- Tegegne, G., and Melesse, A.M. Quantifying Spatiotemporal Drought Dynamics Under Climate Change in the Abbay River Basin, Ethiopia. In: Melesse, A., Gessesse, B., Zewdie, W. (eds) Abbay River Basin. Springer Geography. Springer, Cham.2025 . [CrossRef]
- Wilhite D. A. Drought: a global assessment. Ed. Routledge, London, 2000.
- Li, H.; Yin, Y.; Zhou, J.; Li, F. Improved Agricultural Drought Monitoring with an Integrated Drought Condition Index in Xinjiang, China. Water 2024, 16, 325. [CrossRef]
- Fowé, T.; Yonaba, R.; Mounirou, L.A.; Ouédraogo, E.; Ibrahim, B.; Niang, D.; Karambiri, H.; Yacouba, H. From meteorological to hydrological drought: A case study using standardized indices in the Nakanbe River Basin, Burkina Faso. Nat. Hazards 2023, 119, 1941–1965.
- Le, H.M., et al., 2019. A Comparison of Spatial–Temporal Scale Between Multiscalar Drought Indices in the South-Central Region of Vietnam, Spatiotemporal Analysis of Extreme Hydrological Events. Elsevier 2019, pp. 143–169.
- Abubakar, Muhammad & Abdussalam, Auwal & Ahmed, Muhammad & Wada, Amina. (2024). Spatiotemporal variability of rainfall and drought characterization in Kaduna, Nigeria. Discover Environment 2024, 2. 72. 10.1007/s44274-024-00112-7.
- Dinsa, A.B., Wakjira, F.S., Demmiese, E. T., and Negash, T.T. Forecasting Seasonal Drought Using Spatio-SPI and Machine Learning Algorithm: The Case of Borana Plateau of Southern Oromia, Ethiop J Earth Sci Clim Change 2023, vol 14, issue 8.
- Agwata J. A review of some indices used for drought studies. Civil Environ Res 2014, 6: 14-21.
- Tsakiris, G., Pangalou, D. and Vangelis, H. Regional Drought Assessment Based on the Reconnaissance Drought Index (RDI). Water Resource Management 2007, 21:821–833.
- Palmer W. C. Meteorological drought. US Department of Commerce, Weather Bureau, Washington, DC, 1965, p 18.
- McKee T.B., Doesken NJ, Kleist J.The relationship of drought frequency and duration to time scales. In: Proceeding of the ninth conference on applied climatology. American meteorological society, Boston,1993, pp 179–184.
- Vicente-Serrano S.M., Begueria S, Lopaz-Moreno J. I. A multiscalar drought index sensitive to global warming: the standardized precipitation evapotranspiration index. J Clim 2010, 23:1696–1718.
- Wilhite, D. A., and Glantz, M. H. Understanding the drought phenomenon: the role of definitions. Water Int, 1985, 0:111–120.
- Keyantash, John. (2021). Indices for Meteorological and Hydrological Drought. Hydrological Aspects of Climate Change. 10.1007/978-981-16-0394-5_11.
- Sepulcre-Canto, G., Horion, S., Singleton, A., Carrao, H., and Vogt, J. Development of a Combined Drought Indicator to detect agricultural drought in Europe, Nat. Hazards Earth Syst. Sci.,2012, 12, 3519–3531. [CrossRef]
- Okpara J.N. and Tarhule A. Evaluation of drought indices in the Niger River Basin, West Africa. J Geogr Earth Sci 2015, 3(2):1–32.
- Bhalme HN, Mooley DA. Large scale droughts/floods and monsoon circulation. Monthly Weather Review 1980, 108(8): 1197–12.
- 2014; 33. Environmental Protection Agency (EPA) Climate Change Indicators in the United States, 2014.
- Zargar, A., R. Sadiq, B. Naser and F.I. Khan, A review of drought indices. Environmental Reviews 2011, 19:333–349.
- Heim Jr R.R. A Review of Twentieth Century Drought Indices Used in the United States. Bulletin of the American Meteorological Society, 2002, 83(8): 1149-1165.
- Keyantash J.A., and Dracup J.A. The Quantification of Drought: An Evaluation of Drought Indices. Bulletin of the American Meteorological Society 2002, 83: 1167-1180.
- Hayes, M., M. Svoboda, D. LeComte, K. Redmond, and P. Pasteris. Drought monitoring: new tools for the 21st century. In: Drought and Water Crises: Science, Technology, and Management Issues, Ed. D. Wilhite, Boca Raton, FL: CRC Press 2005, pp. 53–69.
- Abaje I.B., Ati O.F., Iguisi E.O., Jidauna G. G. Droughts in the Sudano Sahelian ecological zone of Nigeria: implications for agriculture and water resources development. Glob J Hum Soc Sci, 2013, 13(2):12–23.
- Anderson, M.C. Hain, C., Pimstein, A., Mecikalski, J. R., and Kustas, W. P. Evaluation of Drought Indices Based on Thermal Remote Sensing of Evapotranspiration over the Continental United States. J. Climate, 2011, 24, 2025-2044. [CrossRef]
- Svoboda M, LeComte D, Hayes M, Heim R, Gleason K, Angel J, Rippey B, Tinker R, Palecki M, Stooksbury D., Miskus D., Stephens S. The drought monitor. Bull Am Meteor Soc.2002 83:1181–1189.
- He, X., Estes, L., Konar, M., Tian, D., Anghileri, D., Baylis, K. Integrated approaches to understanding and reducing drought impact on food security across scales. Current Opinion in Environmental Sustainability, 2019, 40, 43–54. [CrossRef]
- Zhao, H. Y., G. Gao, P. Q. Zhang and Yan, X. The modification of meteorological drought composite index and its application in Southwest China. J. Appl. Meteor. Sci., 2011, 22, 698–705. (in Chinese).
- Sepulcre-Canto, G., Horion, S., Singleton, A., Carrão, H., Vogt, J., 2012 Development of a Combined Drought Indicator to detect agricultural drought in Europe. Natural Hazards and Earth System Sciences 2012,12, 3519-3531.
- Balint, Z., Mutua, F., Muchri, P., & Omuto, C. T. Monitoring drought with the combined drought index in Kenya. Development in earth surface Processes,2013, Vol. 16, 341-355.
- Garba, I.; Abdourahamane, Z.S.; Mirzabaev, A. A Drought Dataset Based on a Composite Index for the Sahelian Climate Zone of Niger. Data 2023, 8, 28. https:// doi.org/10.3390/data8020028.
- Hayes, M., The Newsletter of the National Drought Mitigation Center, 2014.
- Bijaber, N., Hadani, D. Saidi, M., Svoboda, M.D. Wardlow, B.D., Hain, C.R., Poulseen, C.C. Yessef, M., and Rochd, A. Developing a Remotely Sensed Drought Monitoring Indicator for Morocco. Geosciences, 2018, 8, 55; [CrossRef]
- Nam, W. H., Tadesse, T., Wardlow, B. D., Hayes, M. J., Svoboda, M. D., Hong, E. M., . Developing the vegetation drought response index for South Korea (VegDRI-SKorea) to assess the vegetation condition during drought events. International Journal of Remote Sensing, 2018, 39(5), 1548–1574.
- Pulwarty, R.S. and Sivakumar, M.V.K. Information systems in a changing climate: Early Warnings and drought risk management. Weather and Climate Extremes,2014, 3: 14-21.
- Oguntunde P. G., Abiodun B. J., Lischeid G., Abatan A. A. Droughts projection over the Niger and Volta River basins of West Africa at specific global warming levels. J Climatol 2020:1–12. https:// doi. org/ 10.1002/ joc. 6544.
- Quenum, G.M.L.D.,Klutse, N.A.,Alamuo, E.A., Lawin, E. A. Oguntunde, P.G. Precipitation variability in West Africa in the Context of Global Warming and Adaptation recommendations African Handbook of Climate Change Adaptation, pp 1533-1554, 2020. [CrossRef]
- Quenum, G.M.L.D., Klutse, N.A.B., Dieng, D., Laux, P., Arnault, J., Kodja, J.D., Oguntunde, P.G. Identification of potential drought areas in west Africa under climate change and variability. Earth Syst. Environ., 2019 3, 429–444.
- Karavitis, C. A. Decision support systems for drought management strategies in metropolitan Athens. Water International 1999a 24(1), 10–21.
- Tadesse, T., J.F. Brown, and M.J. Hayes. A new approach for predicting drought-related vegetation stress: Integrating satellite, climate, and biophysical data over the U.S. central plains. ISPRS Journal of Photogrammetry and Remote Sensing 2005, 59(4):244–253.
- Tadesse, T., Haile, M., Senay, G., Knutson, C., and Wardlow, B.D. Building integrated drought monitoring and food security systems in sub-Saharan Africa. Natural Resources Forum 2008, 32(4):245–279.
- Masih I., Maskey, S., Muss, F.E.F., Trambaue, P. (2014) A review of droughts on the African continent: a geospatial and long-term perspective. Hydrol Earth Syst Sci 2014, 18:3635–3649.
- World Bank. The Niger River Basin: A Vision for Sustainable Management. Edited by Katherin George Golitzen, 2005.
- Tarhule, A., Zume, J.T., Grijsen, J., Talbi-Jordan, A., Guero, A., Dessouassi, R.Y., Doffou, H., Kone, S., Coulibaly, B., Harshadeep, N. R. Exploring temporal hydroclimatic variability in the Niger Basin (1901–2006) using observed and gridded data. Int J Climatol 2014, 35:520–539.
- Oladipo, E. O. A Comparative Performance Analysis of Three Meteorological Drought Indices. Int. Journal Climatology, 1985, 5, pp 655-664.
- Tommaso Abrate , Pierre Hubert and Daniel Sighomnou A study on hydrological series of the Niger River, Hydrological Sciences Journal 2013, 58:2, 271-279. [CrossRef]
- Niger Basin Snapshot. Adaptation to Climate Change in the Upper and Middle Niger River Basin, 2010.
- Namara R.E., Barry B., Owusu E.S., and Ogilvie A. An overview of the development challenges and constraints of the Niger Basin and possible intervention strategies, Colombo, Sri Lanka international water management institute (IWMI Working Paper 144), 2011, p 34.
- Sheffield, J., Wood, E.J.F., Chaney, N., Guan, K., Sardi, S., Yuan, X., Olang, L., Amani, A., Ali, A., Demuth, S., Ogallo, L. A drought monitoring and forecasting system for sub-sahara African water resources and food security. Bull Am Met Soc 2014, 95(6):861–882.
- Liang, X., E. F. Wood, and D. P. Lettenmaier. Surface soil moisture parameterization of the VIC-2L evaluation and modification. Global Planet. Change,1996, 13, 195–206.
- 2013; 65. African Water Cycle Monitor Tutorial, 2013.
- Seiler R.A., Hayes M., Bressan L. Using the standardized precipitation index for flood risk monitoring. Int J Climatol 2002, 22:1365–1376. https:// doi. org/ 10. 1002/ joc. 799.
- Abah, E.O., Ayodele, A.P., Precious, E., Noguchi, R., Omale, P.A. Drought Assessment over Northern Africa Using Multi-source Satellite Product. In: Ahamed, T. (eds) Remote Sensing Application II. New Frontiers in Regional Science: Asian Perspectives 2024, vol 77. Springer, Singapore. [CrossRef]
- Quagraine, K. A., Nkrumah, F., Klein, C., Klutse, N. A.B., and Quagraine, K. T. West African Summer Monsoon Precipitation Variability as Represented by Reanalysis Datasets. MDPI Journal of Climate 2020, 8, 111; [CrossRef]
- Zhan W., Guan K., Sheffield J., Wood E. F. Depiction of drought over sub-Saharan Africa using reanalysis precipitation data sets. J Geophys Res Atmos, 2016,121:10555–10574. https:// doi. org/ 10. 1002/ 2016JD0248 58.
- N’Tcha M’Po Yèkambèssoun, Lawin Agnidé Emmanuel, Oyerinde Ganiyu Titilope, Yao Benjamin Kouassi, Afouda Abel Akambi. Comparison of Daily Precipitation Bias Correction Methods Based on Four Regional Climate Model Outputs in Ouémé Basin, Benin. Hydrology,2016, Vol. 4, No. 6, pp. 58-71. [CrossRef]
- Wetterhall F., Pappenberger F., He, Y., Freer J., Cloke H. Conditioning model output statistics of regional climate model precipitation on circulation patterns. Nonlinear Proc Geophys 2012, 19:623–633.
- Fang, G.H., Yang J., Chen Y.N., Zammit C. Comparing bias correction methods in downscaling meteorological variables for a hydrologic impact study in an arid area in China. Hydrol Earth Syst Sci 2015, 19:2547–2559.
- Shrestha, M., Acharya, S.C., Shrestha, P.K. Bias correction of climate models for hydrological modelling–are simple methods still useful? Meteorol Appl 2017, 24:531–539.
- Changnon, S. A. Detecting Drought Conditions in Illinois. Illinois State Water survey, Champaign, Circular, 1987, 169.
- Mishra, A. K., and V. P. Singh. A review of drought concepts, J. Hydrol., 2010, 391(1–2), 202–216. [CrossRef]
- Tallaksen, L.M. and Van Lanen, H.A.J. Hydrological Drought. Processes and Estimation Methods for Streamflow and Groundwater. Developments in Water Science, 2004, 48, Elsevier Science B.V., 579 pg.
- Zhang, Y.; Zhang, H.; Ye, Z.; Lyu, J.; Ma, H.; Zhang, X. Spatiotemporal Dynamics of Drought Propagation in the Loess Plateau: A Geomorphological Perspective. Water 2025, 17, 2447. [CrossRef]
- Vicente-Serrano, S. M., Célia Gouveia, C., Camarero, J.J., Begueríae ,S., Trigo, R., López-Moreno,J. I., Azorín-Molina, C., Pasho, E, Lorenzo-Lacruz, J., Revueltoa, J., Morán-Tejeda, E , and Sanchez-Lorenzo, A. Response of vegetation to drought time-scales across global land biomes PNAS, 2013, vol. 110, no. 1, 52-57.
- IPCC Climate Change: Synthesis Report. A Contribution of Working Groups I, II, and III to the Third Assessment Report of the Intergovernmental Panel on Climate Change [Watson, R.T. and the Core Writing Team (eds.)]. Cambridge University Press, Cambridge, United Kingdom, and New York, NY, USA,2001, 398 pp.
- Wilhite, D.A., Sivakumar, M.V.K, and Pulwarty, R. Managing drought risk in a changing climate: the role of national drought policy. Weather Clim Extremes, 2014, 3:4–13.
- Thornthwaite, C.W. and Mather, J.R. Instructions and tables for computing potential evapotranspiration and the water balance. Publ. Climatol.,1957, 10(3), 311pp.
- Vlahinić, M. (2004). Land reclamation and Agrohydrological Monograph of Popovo Polje. Department of Natural Sciences and Mathematics, 2004, Volume 6. Sarajevo. (In Bosnian).
- Čadro, S. Mirza Uzunović, M., Žurovec, J., and Žurovec, O. Validation and calibration of various reference evapotranspiration alternative methods under the climate conditions of Bosnia and Herzegovina. International Soil and Water Conservation Research, 2017, 5, 309–324.
- Hargreaves, G.H. and Samani, Z.A. (1985) Reference Crop Evapotranspiration from Temperature. Applied Engineering in Agriculture,1985, 1, 96-99. [CrossRef]
- United States Department of Agriculture, Soil Conservation Service. Irrigation water requirements. Tech. Rel. 1970 No. 21, (rev. 1970) 88 pp.
- World Meteorological Organization (WMO). Standardized Precipitation Index User Guide. WMO-No. 1090.,2012.
- Nicholson S.E. Sub-saharan rainfall 1981–1984. J Clim Appl Meteorol 1985, 24:1388–1391.
- Yevjevich V. An objective approach to definitions and investigations of continental hydrologic droughts, Hydrology papers no. 23, Fort Collins: Colorado State University Natural Hazards, 1967, 1, 3.
- World meteorological organization (WMO). Experts agree on a universal drought index to cope with climate risks. Press release No. 872, 2009.
- Dracup, J.A., K.S. Lee, and E.G. Paulson, Jr. On the definitions of droughts. Water Resources Research, 1980.
- Ruqoyyah, S., Murni, S., & Fasha, L. H. Microsoft Excel VBA on mathematical resilience of primary school teacher education students. Journal of Physics: Conference Series, 2020, 1657(1), 012010. [CrossRef]
- Kulworatit, C. & Tuntiwongwanich, S. The use of digital intelligence and association analysis with data mining methods to determine the factors affecting digital safety among Thai adolescents. International Journal of Innovation, Creativity and Change,2020, 14(2), 1120-1134.
- Guttman N. Accepting the standardized precipitation index: a calculation algorithm. J Am Water Resour As, 1999, 35(2):311–322.
- Wilhite, D. A., and Pulwarty, R. S. Drought and water crises: Integrating science, management, and policy (2nd ed.). CRC Press, 2017.
- Rao, G. S., Srinivas, V. V., & Subba Rao, M. Development of a composite drought index for agricultural impact assessment in India. Natural Hazards, 2013, 65(3), 1627–1647.
- Hao, Z., Zhang, J., & Yao, F. Integrated drought monitoring for agricultural drought in North China. Natural Hazards, 2014, 70(1), 799–815.
- Gebrehiwot, T., van der Veen, A., & Maathuis, B. Spatial and temporal assessment of drought in the Northern highlands of Ethiopia. International Journal of Applied Earth Observation, 2011.
- Hao, Z., and Singh, V. P. Drought characterization from a multivariate perspective: A review. Journal of Hydrology, 2015, 527, 668–678.
- Otkin, J. A., Anderson, M. C., Hain, C., & Svoboda, M. Examining the relationship between drought development and rapid changes in the Evaporative Stress Index. Journal of Hydrometeorology, 2018, 19(3), 787–802.
- Anderson, M. C., et al.. Monitoring rapid onset drought using thermal remote sensing and evapotranspiration data. Remote Sensing of Environment 2013, 138, 290–303.
- Diffenbaugh, N. S., Swain, D. L., & Touma, D. Anthropogenic warming has increased drought risk in California. PNAS,2015, 112(13), 3931–3936.
- Sun, D. and Kafatos, M. Note on the NDVI-LST Relationship and the Use of Temperature-Related Drought Indices over North America. Geophysical Research Letters 2007, 34, 1-4. [CrossRef]
- Pei, W., Fu, Q., Liu, D. and Li, T. A drought index for Rainfed agriculture: The Standardized Precipitation Crop Evapotranspiration Index (SPCEI). Hydrol. Processes 2019, 33(5): 803-815.
- Prihodko, L., and Goward, S. N. Estimation of air temperature from remotely sensed surface observations. Remote Sens. Environ. 1997, 60, 335–346.
- Boegh, E., Soegaard, H., Hanan, N., Kabat, P., & Lesch, L. A remote sensing study of the NDVI-Ts relationship and the transpiration from sparse vegetation in the Sahel based on high-resolution satellite data. Remote Sensing of Environment 1998, 69, 224–240.
- National Drought Mitigation Center (NDMC). (2020). U.S. Drought Monitor. Retrieved from https://droughtmonitor.unl.edu.
- National Drought Mitigation Center (NDMC). (2023). How the Drought Monitor is Made. https://droughtmonitor.unl.edu.
Figure 1.
Distribution of drought affected population between 2010 and 2012 in West Africa (Source: FAO, 2012).
Figure 1.
Distribution of drought affected population between 2010 and 2012 in West Africa (Source: FAO, 2012).
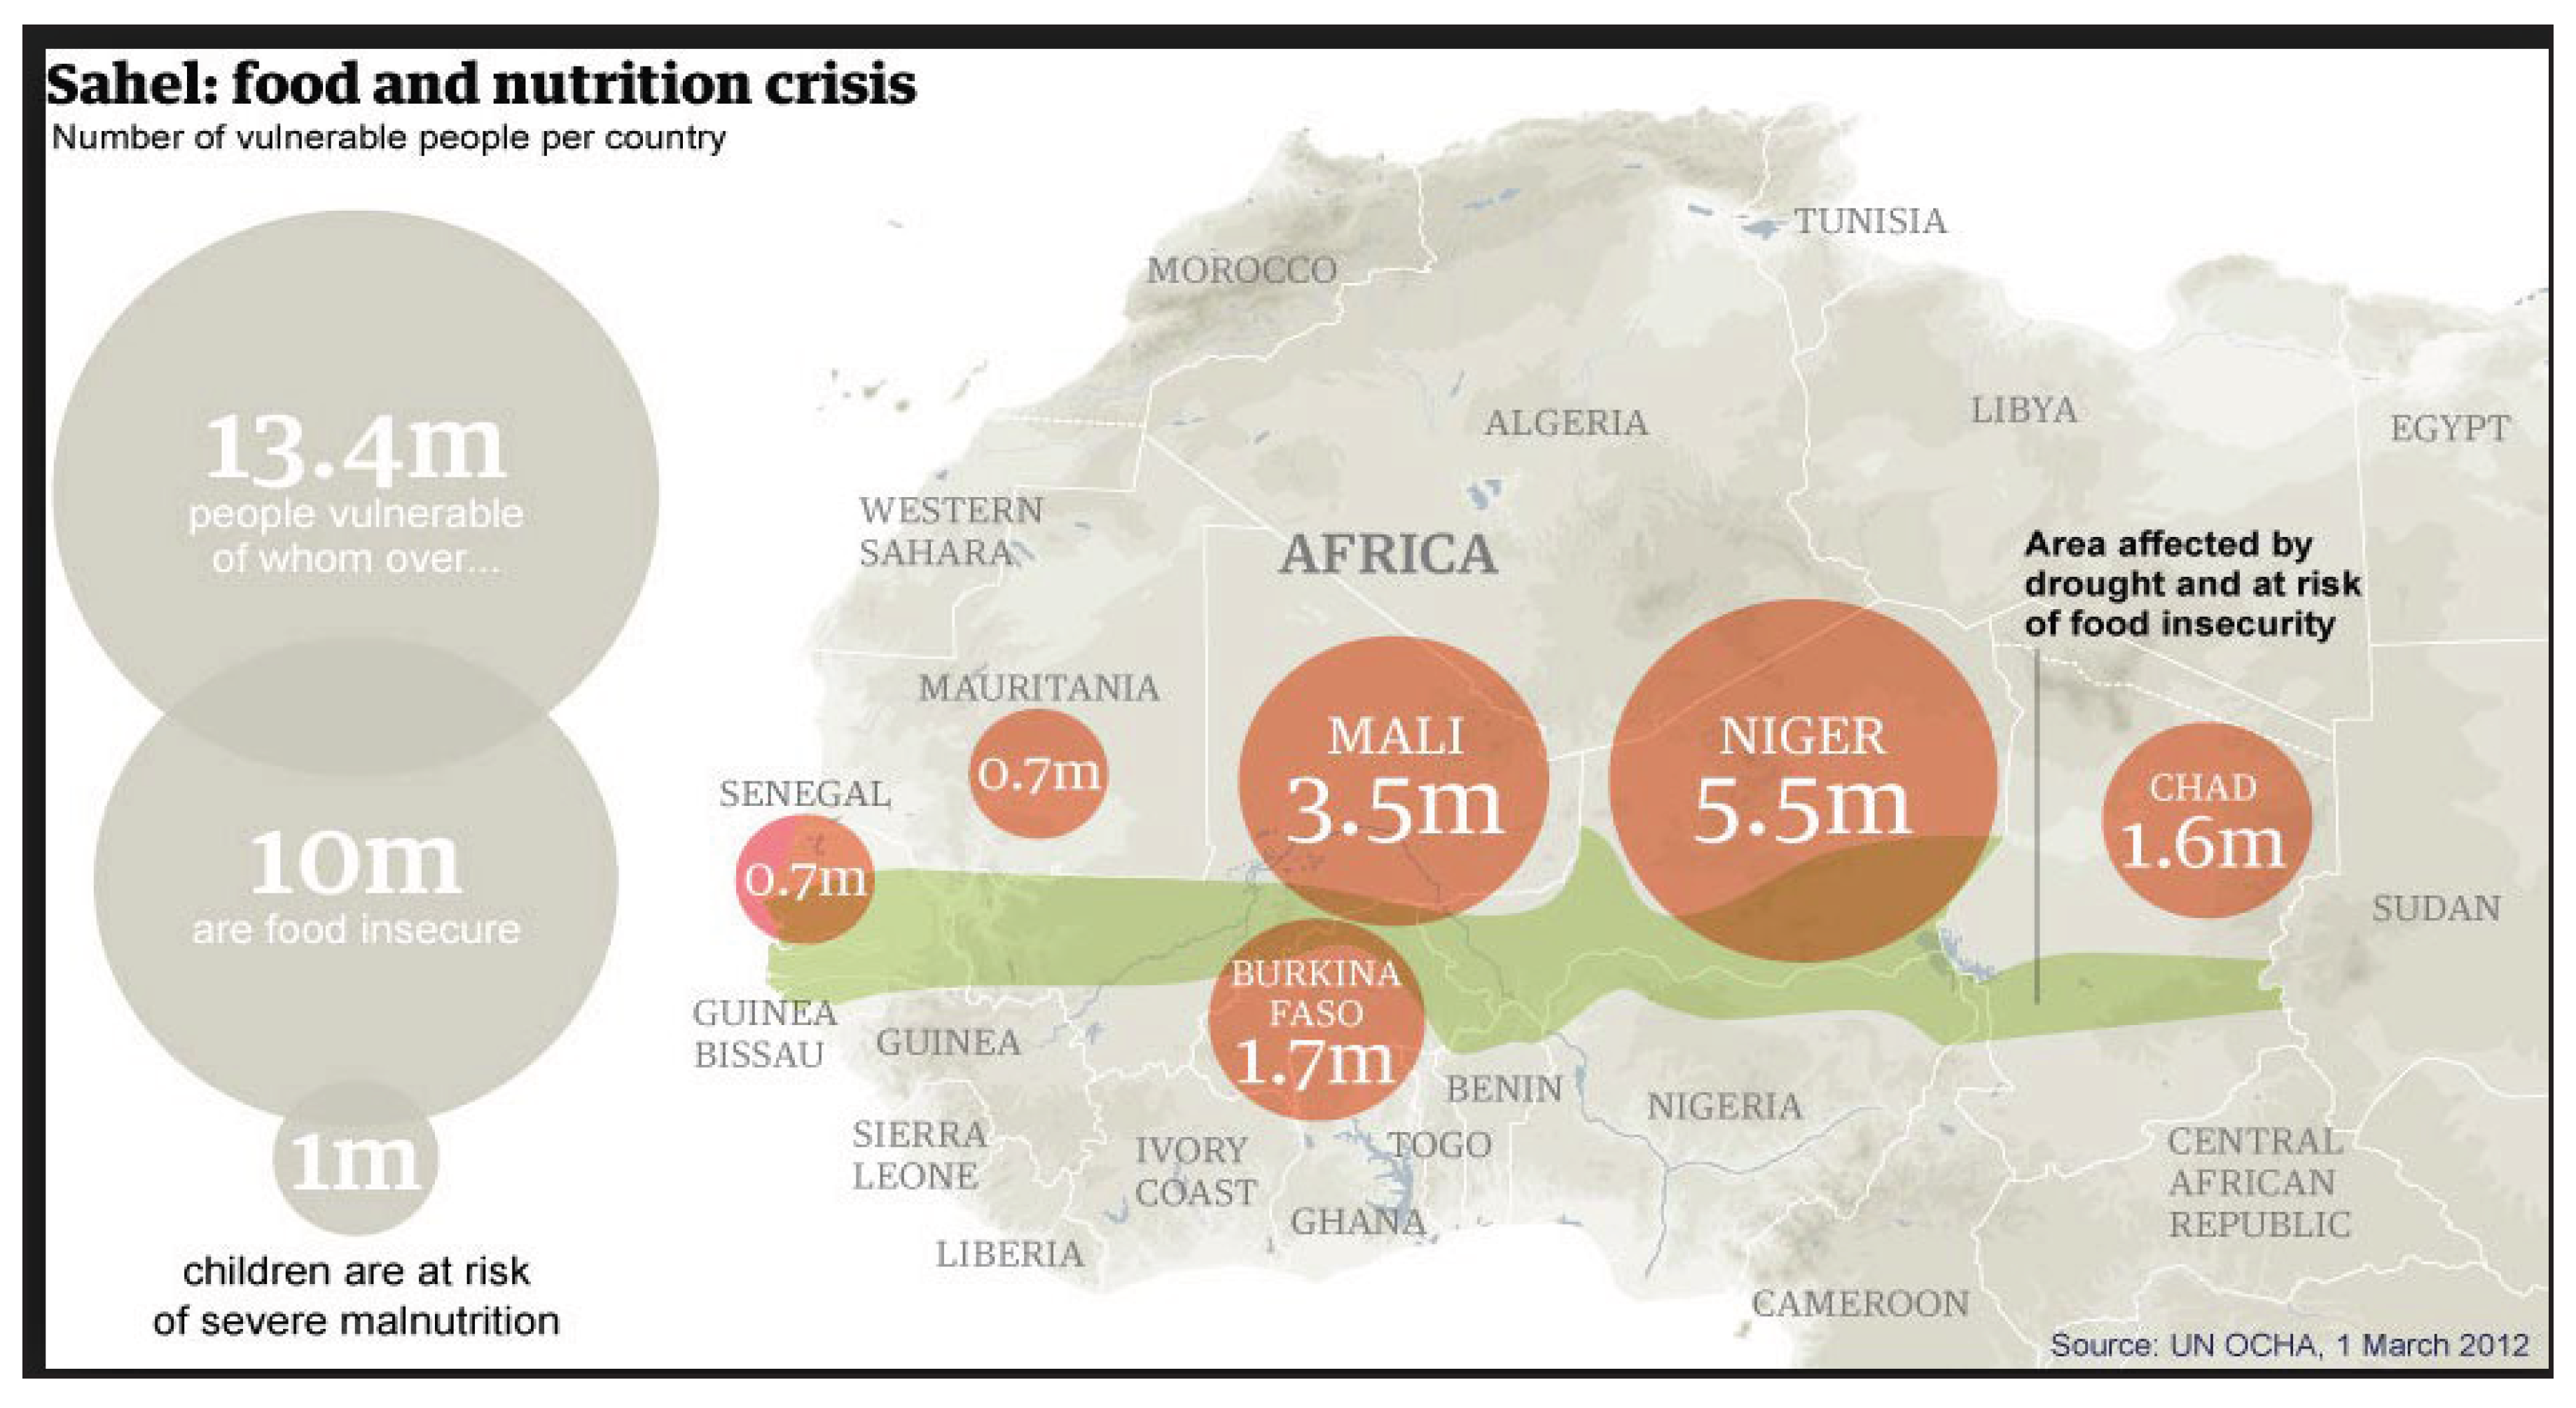
Figure 2.
The Niger River Basin of West Africa, showing the major vegetation belts, and the drainage network (Source: Tarhule et al., 2014) [58].
Figure 2.
The Niger River Basin of West Africa, showing the major vegetation belts, and the drainage network (Source: Tarhule et al., 2014) [58].
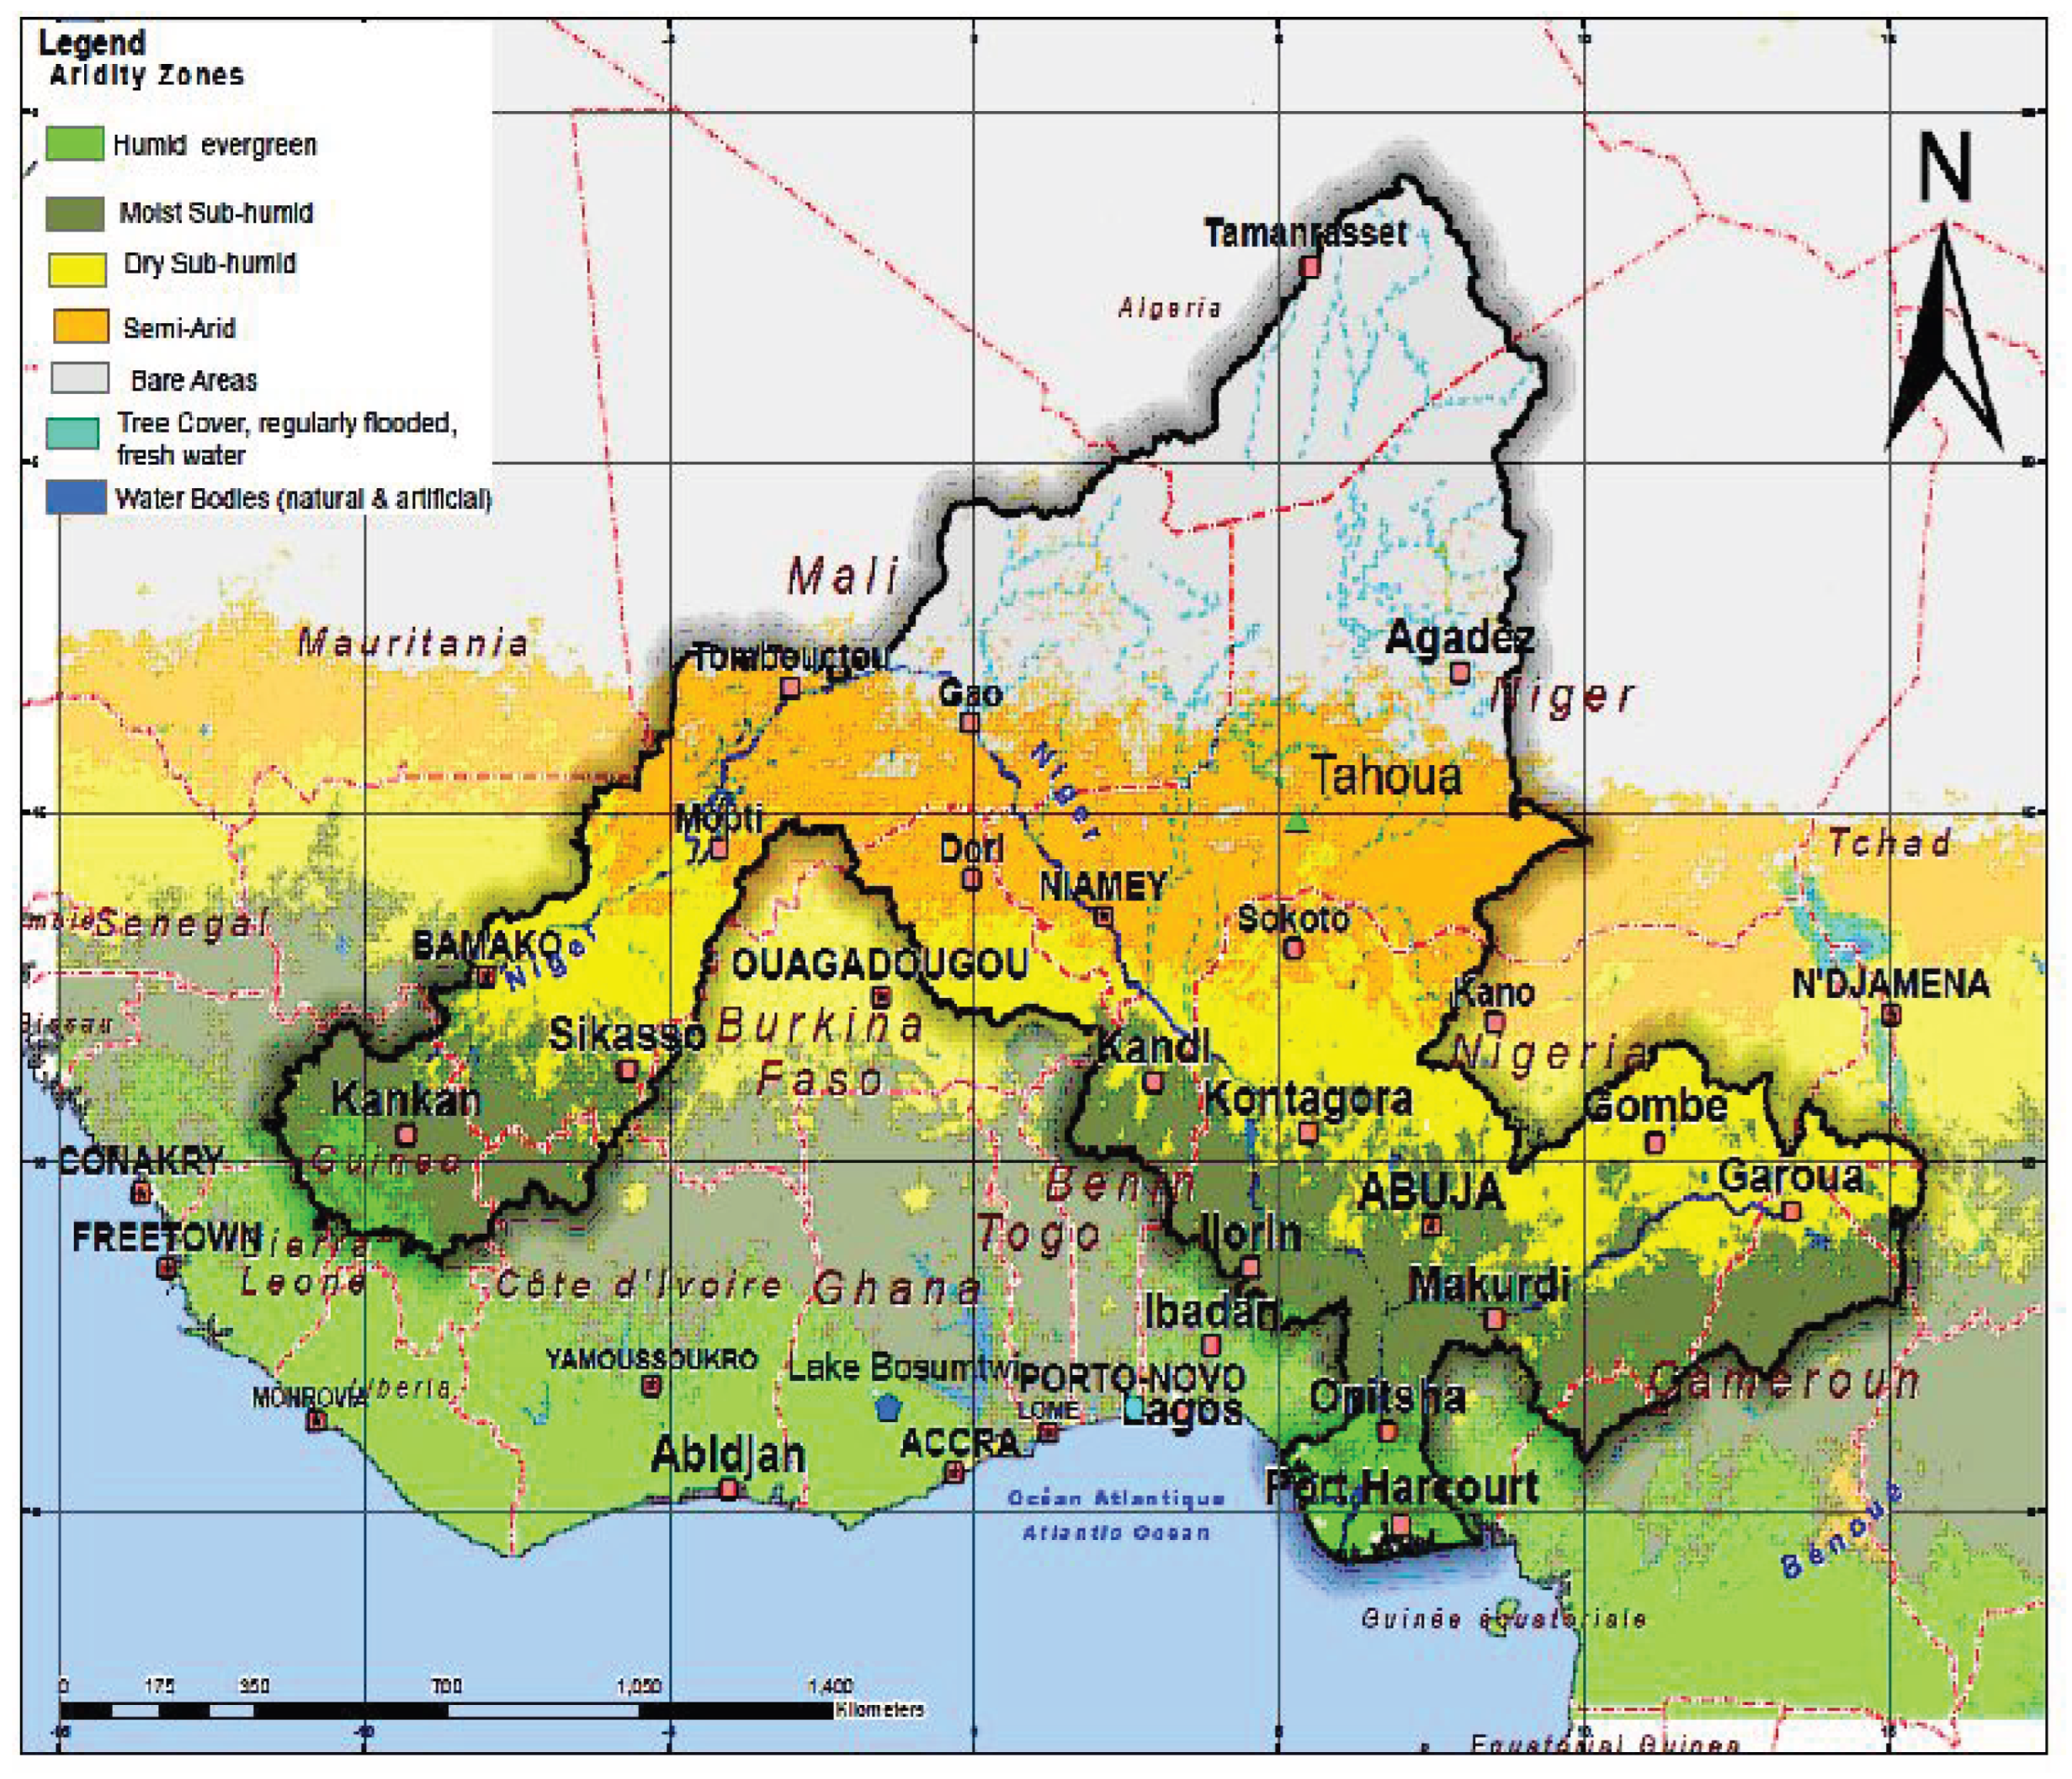
Figure 3.
The Four watersheds of the Niger River Basin West Africa (Source: Adapted from Abrate et al., 2010)[62].
Figure 3.
The Four watersheds of the Niger River Basin West Africa (Source: Adapted from Abrate et al., 2010)[62].
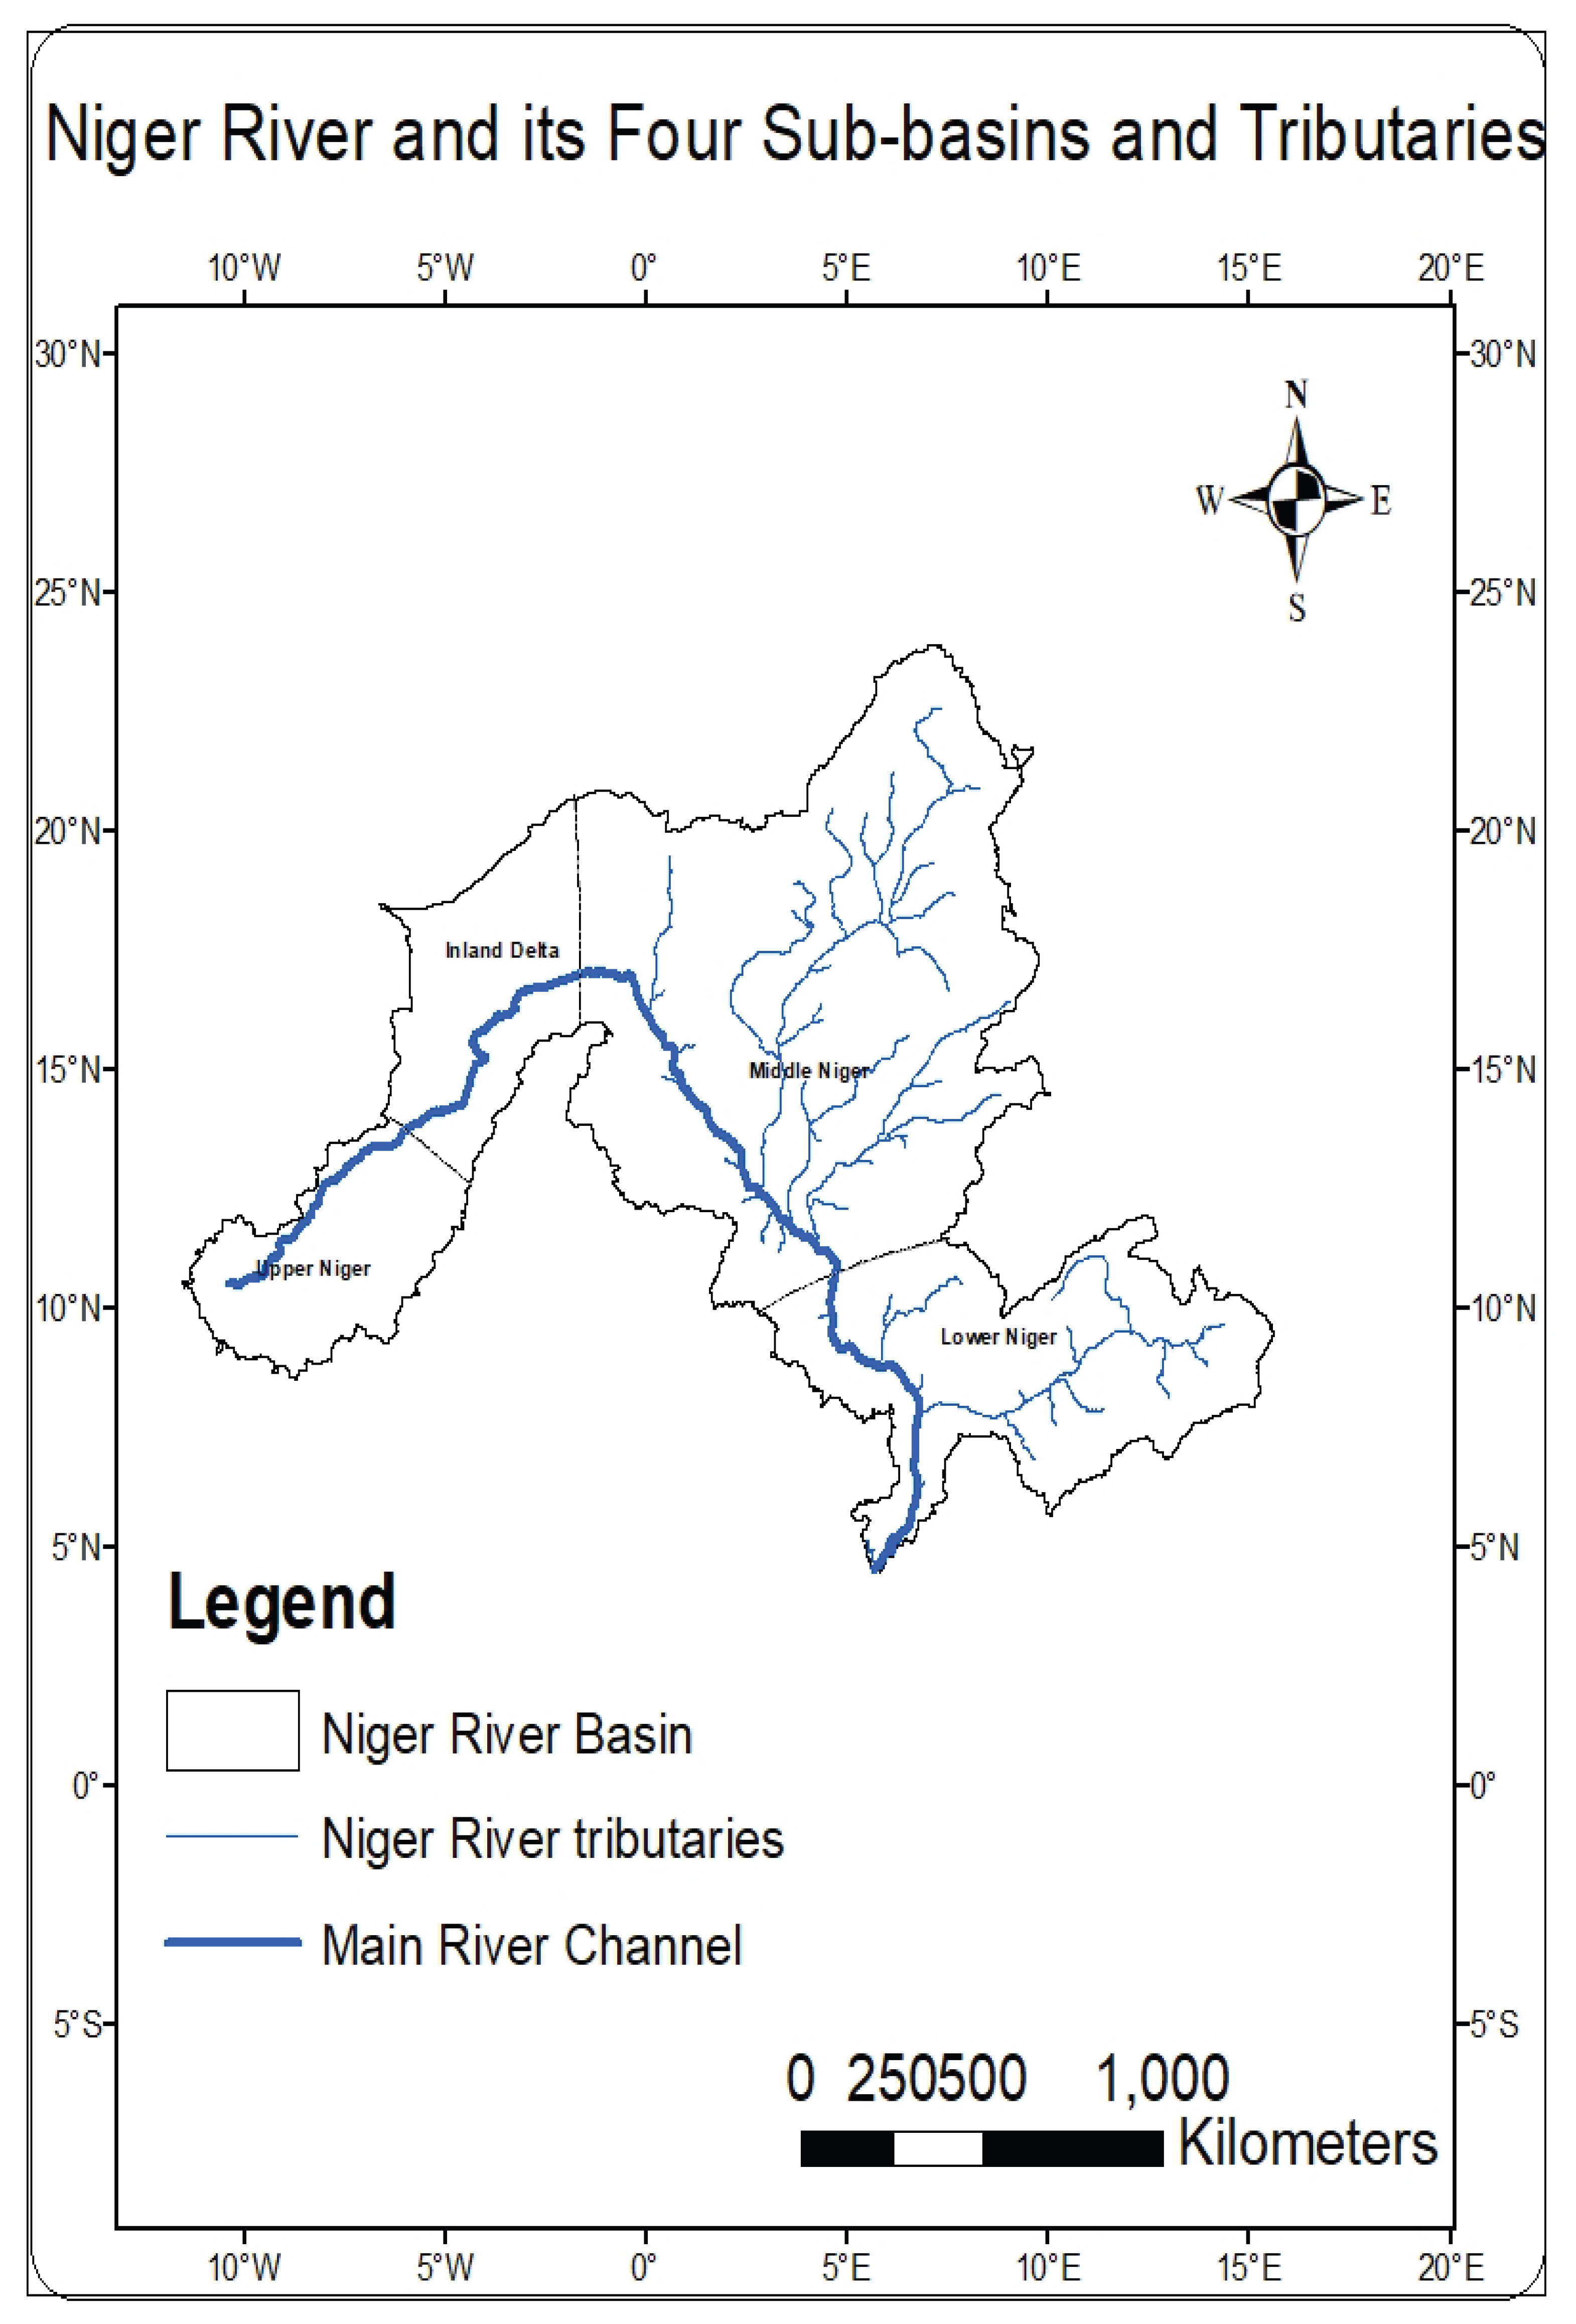
Figure 4.
Country-wise distribution of number of stations in the study area.
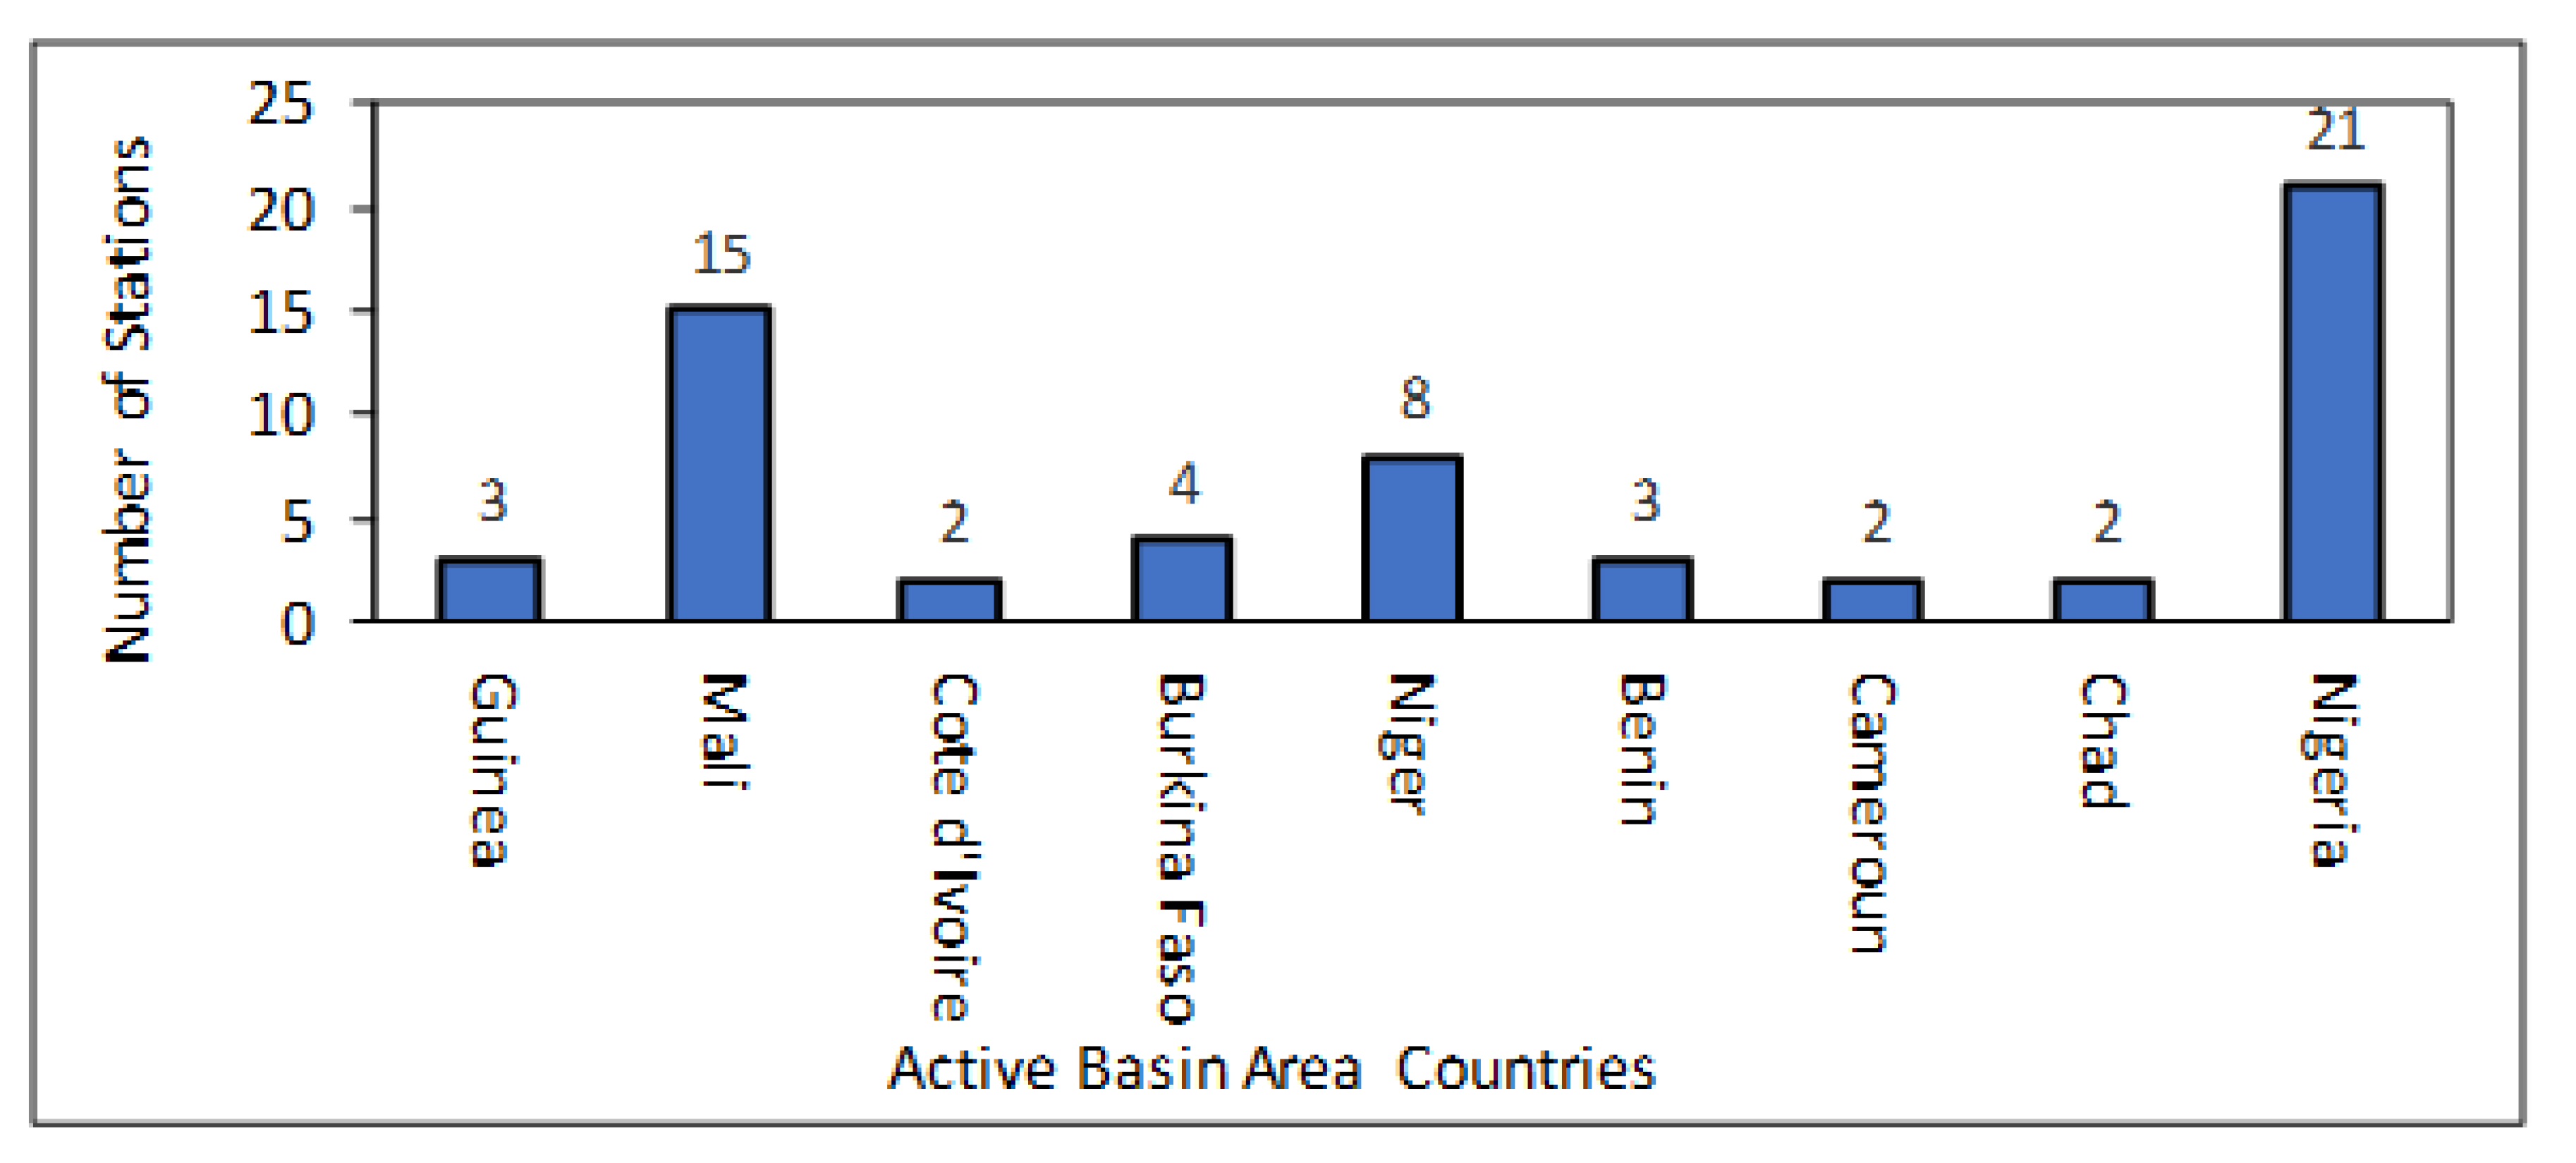
Figure 5.
The Conceptual Framework of Study.
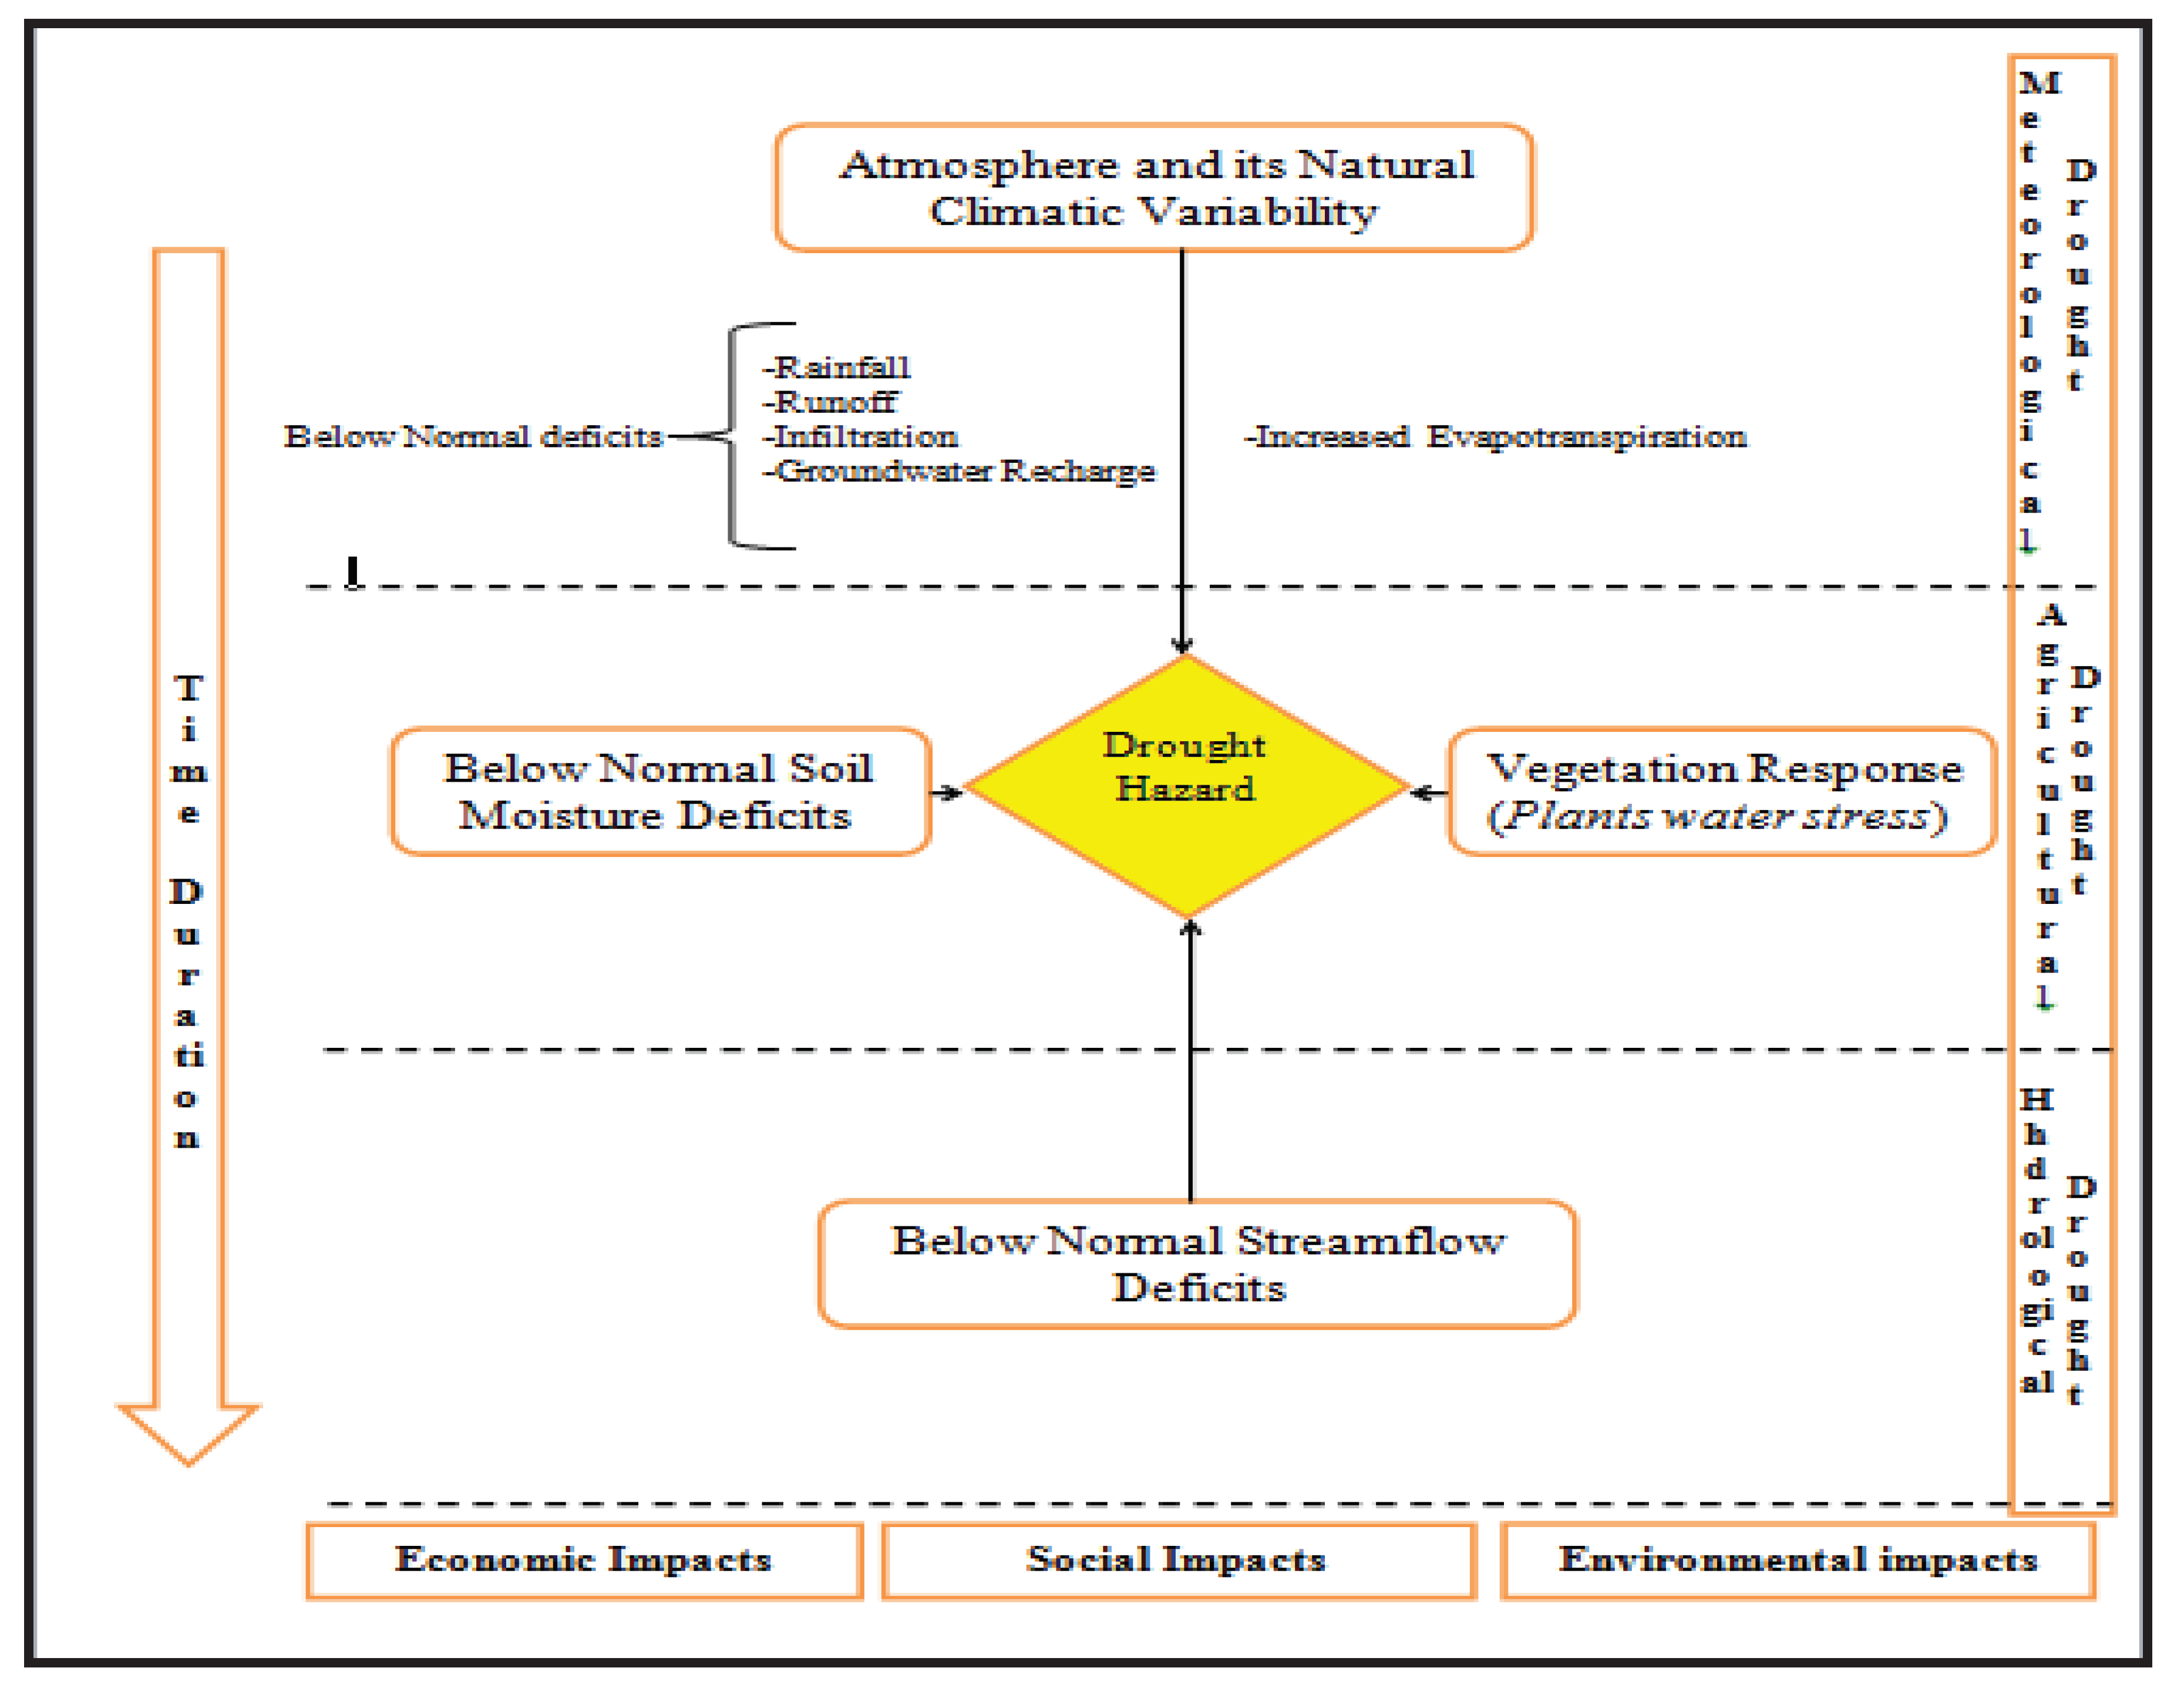
Figure 6.
Concept of the working of the Linear combination model.
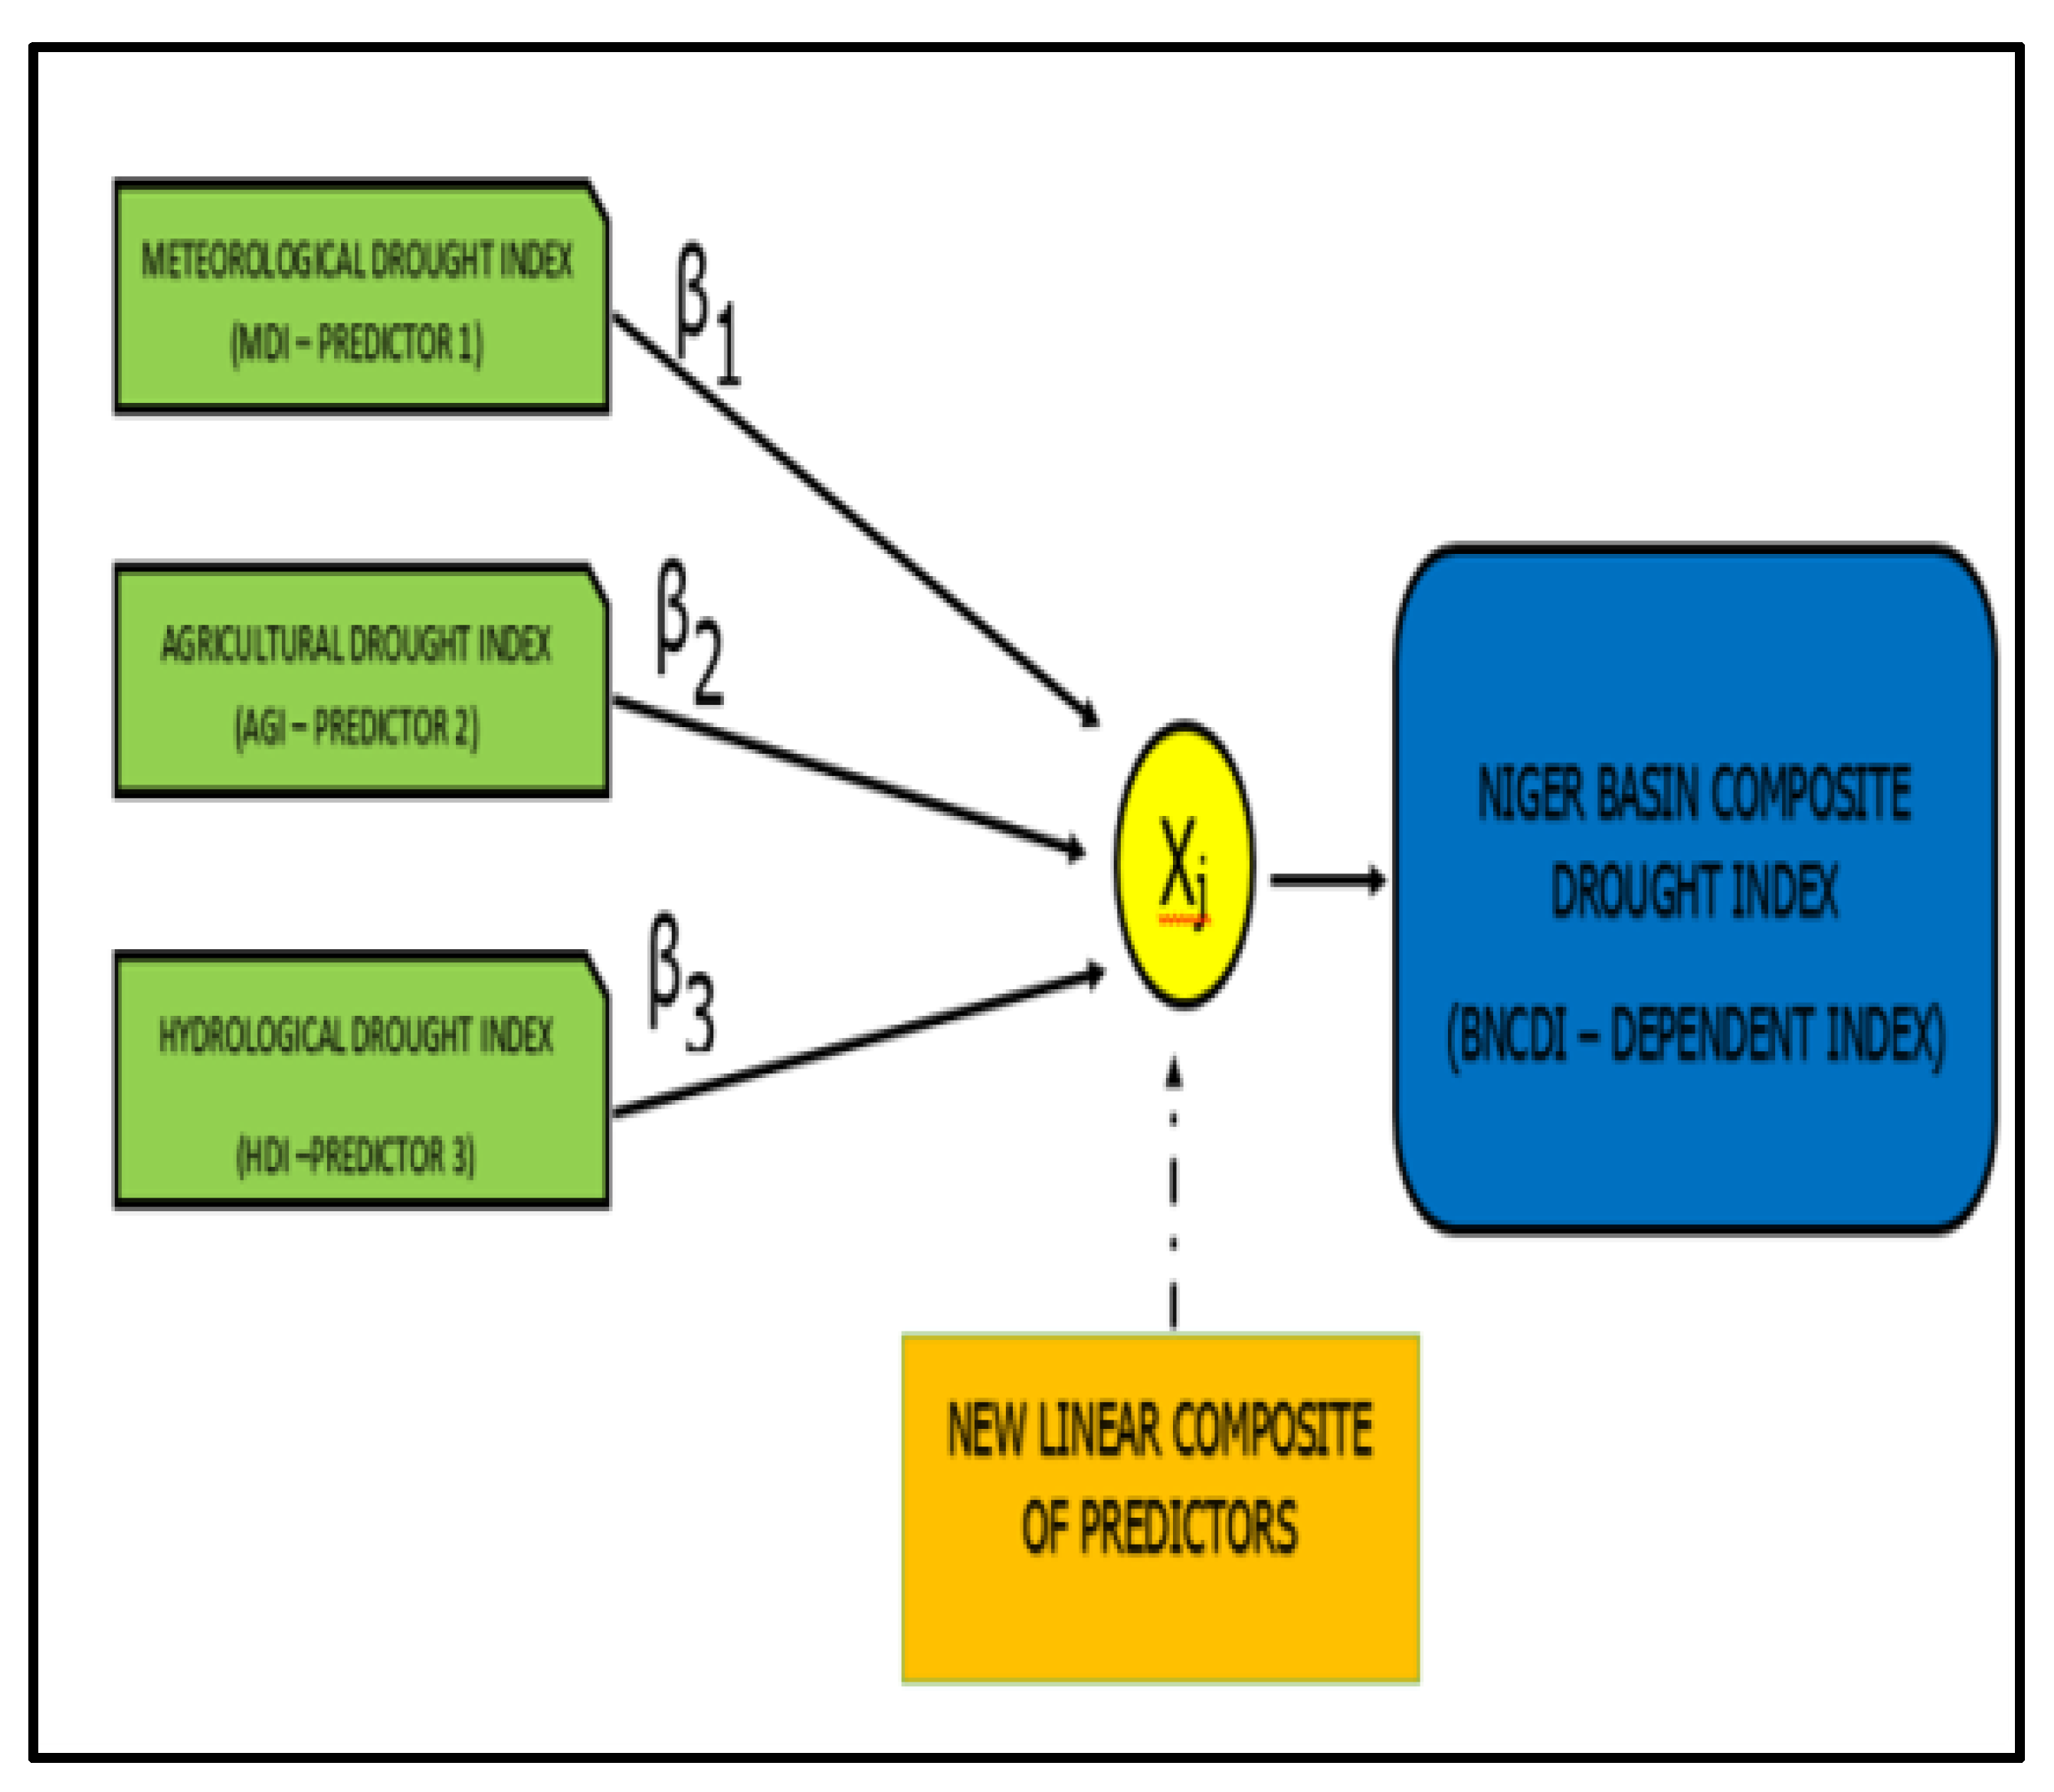
Figure 7.
Study General Methodological Framework.

Figure 8.
Illustration of the Application of Runs Theory (Adapted from Dracup and Paulson, 1980).
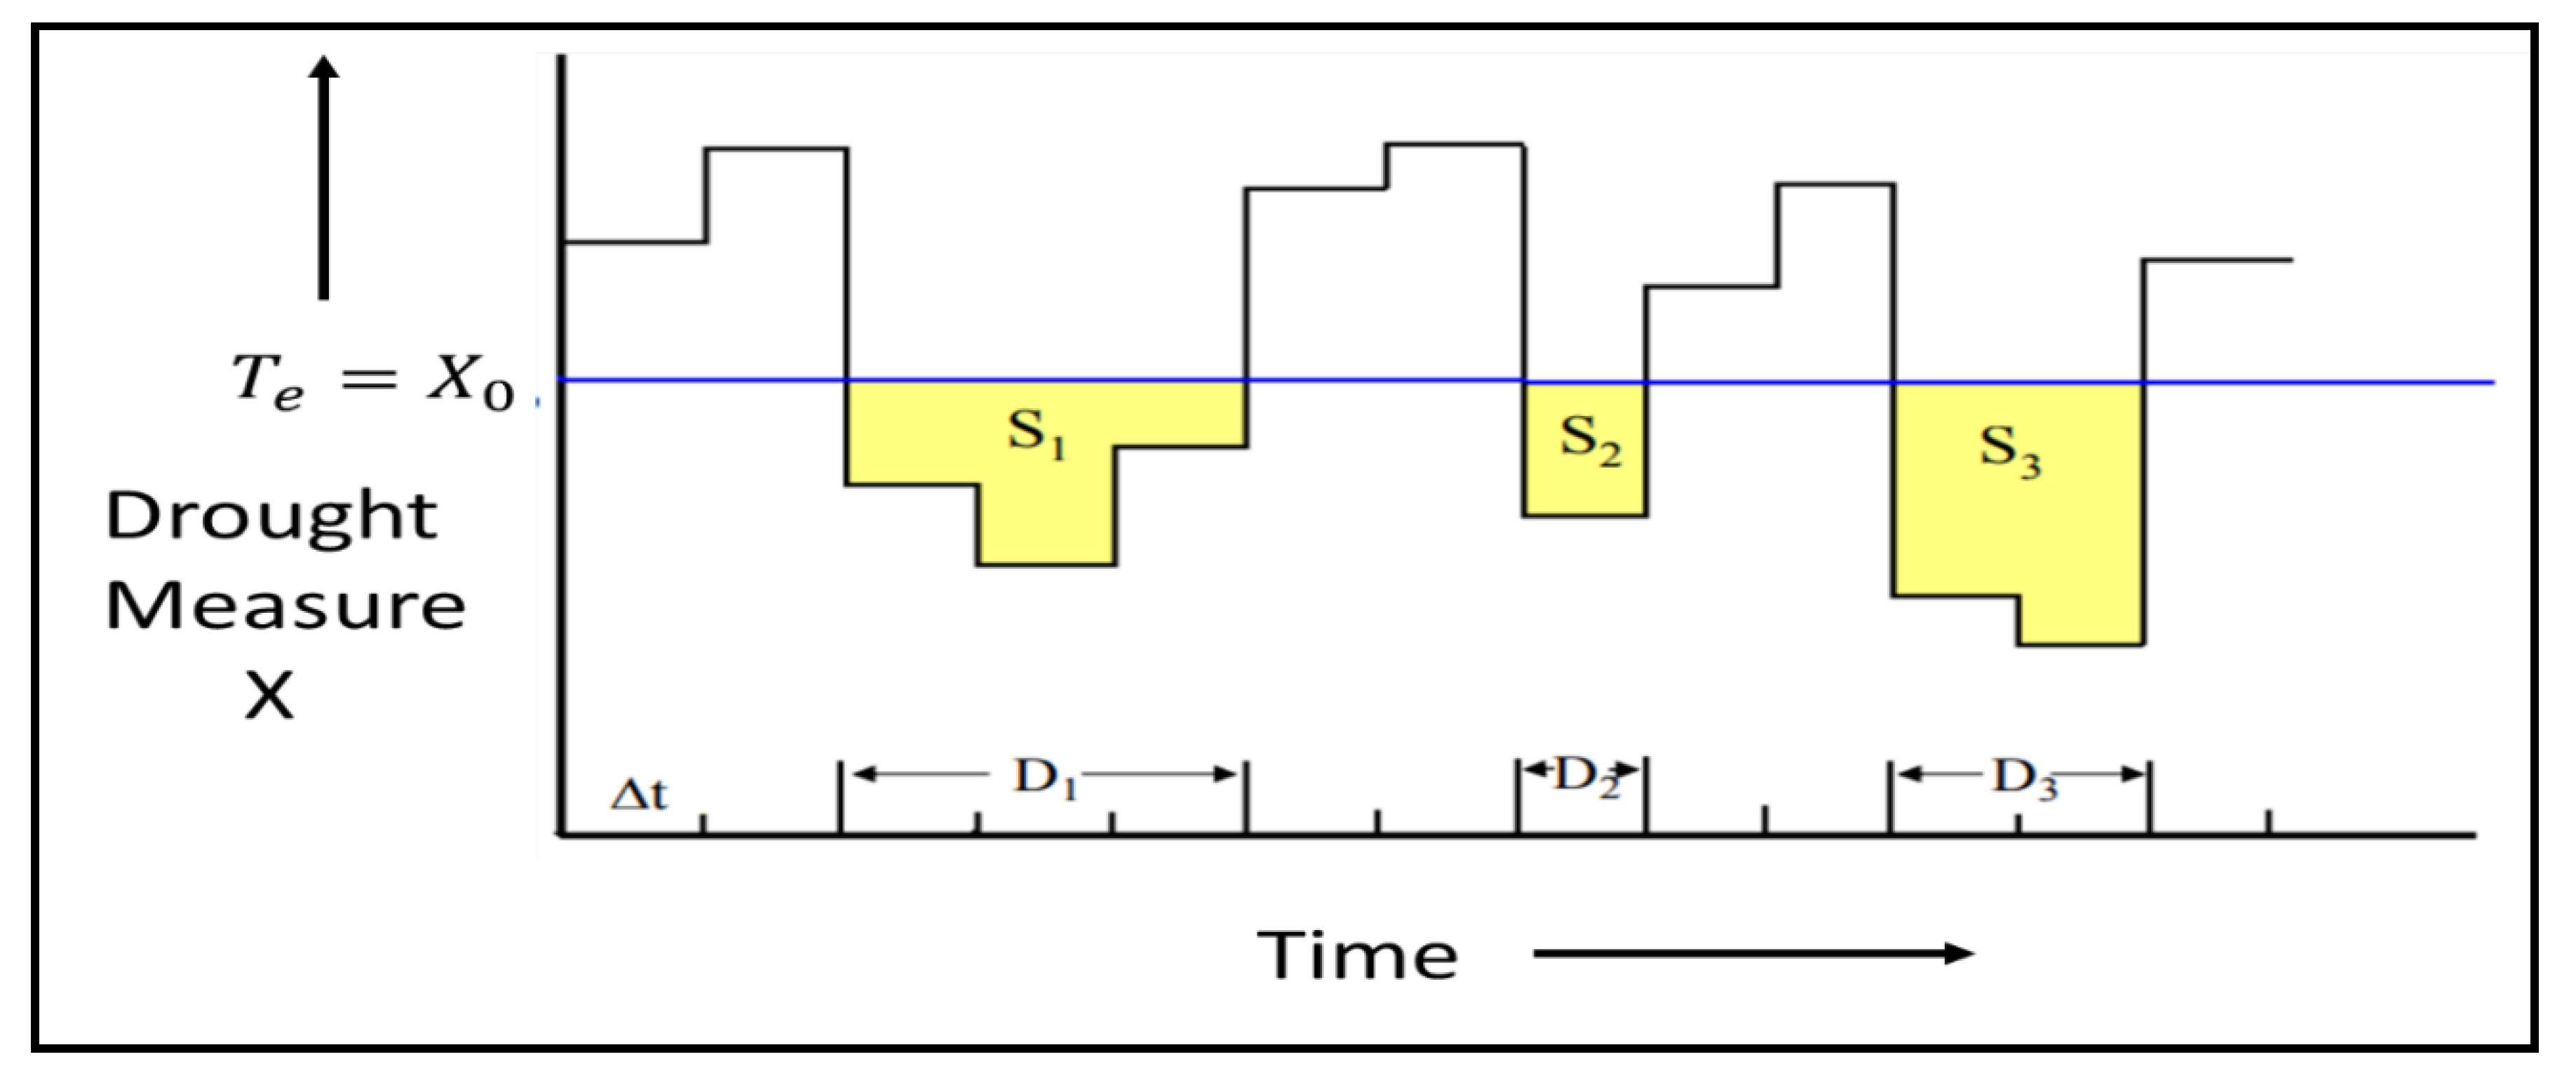
Figure 9.
The Login Interface of DREM.
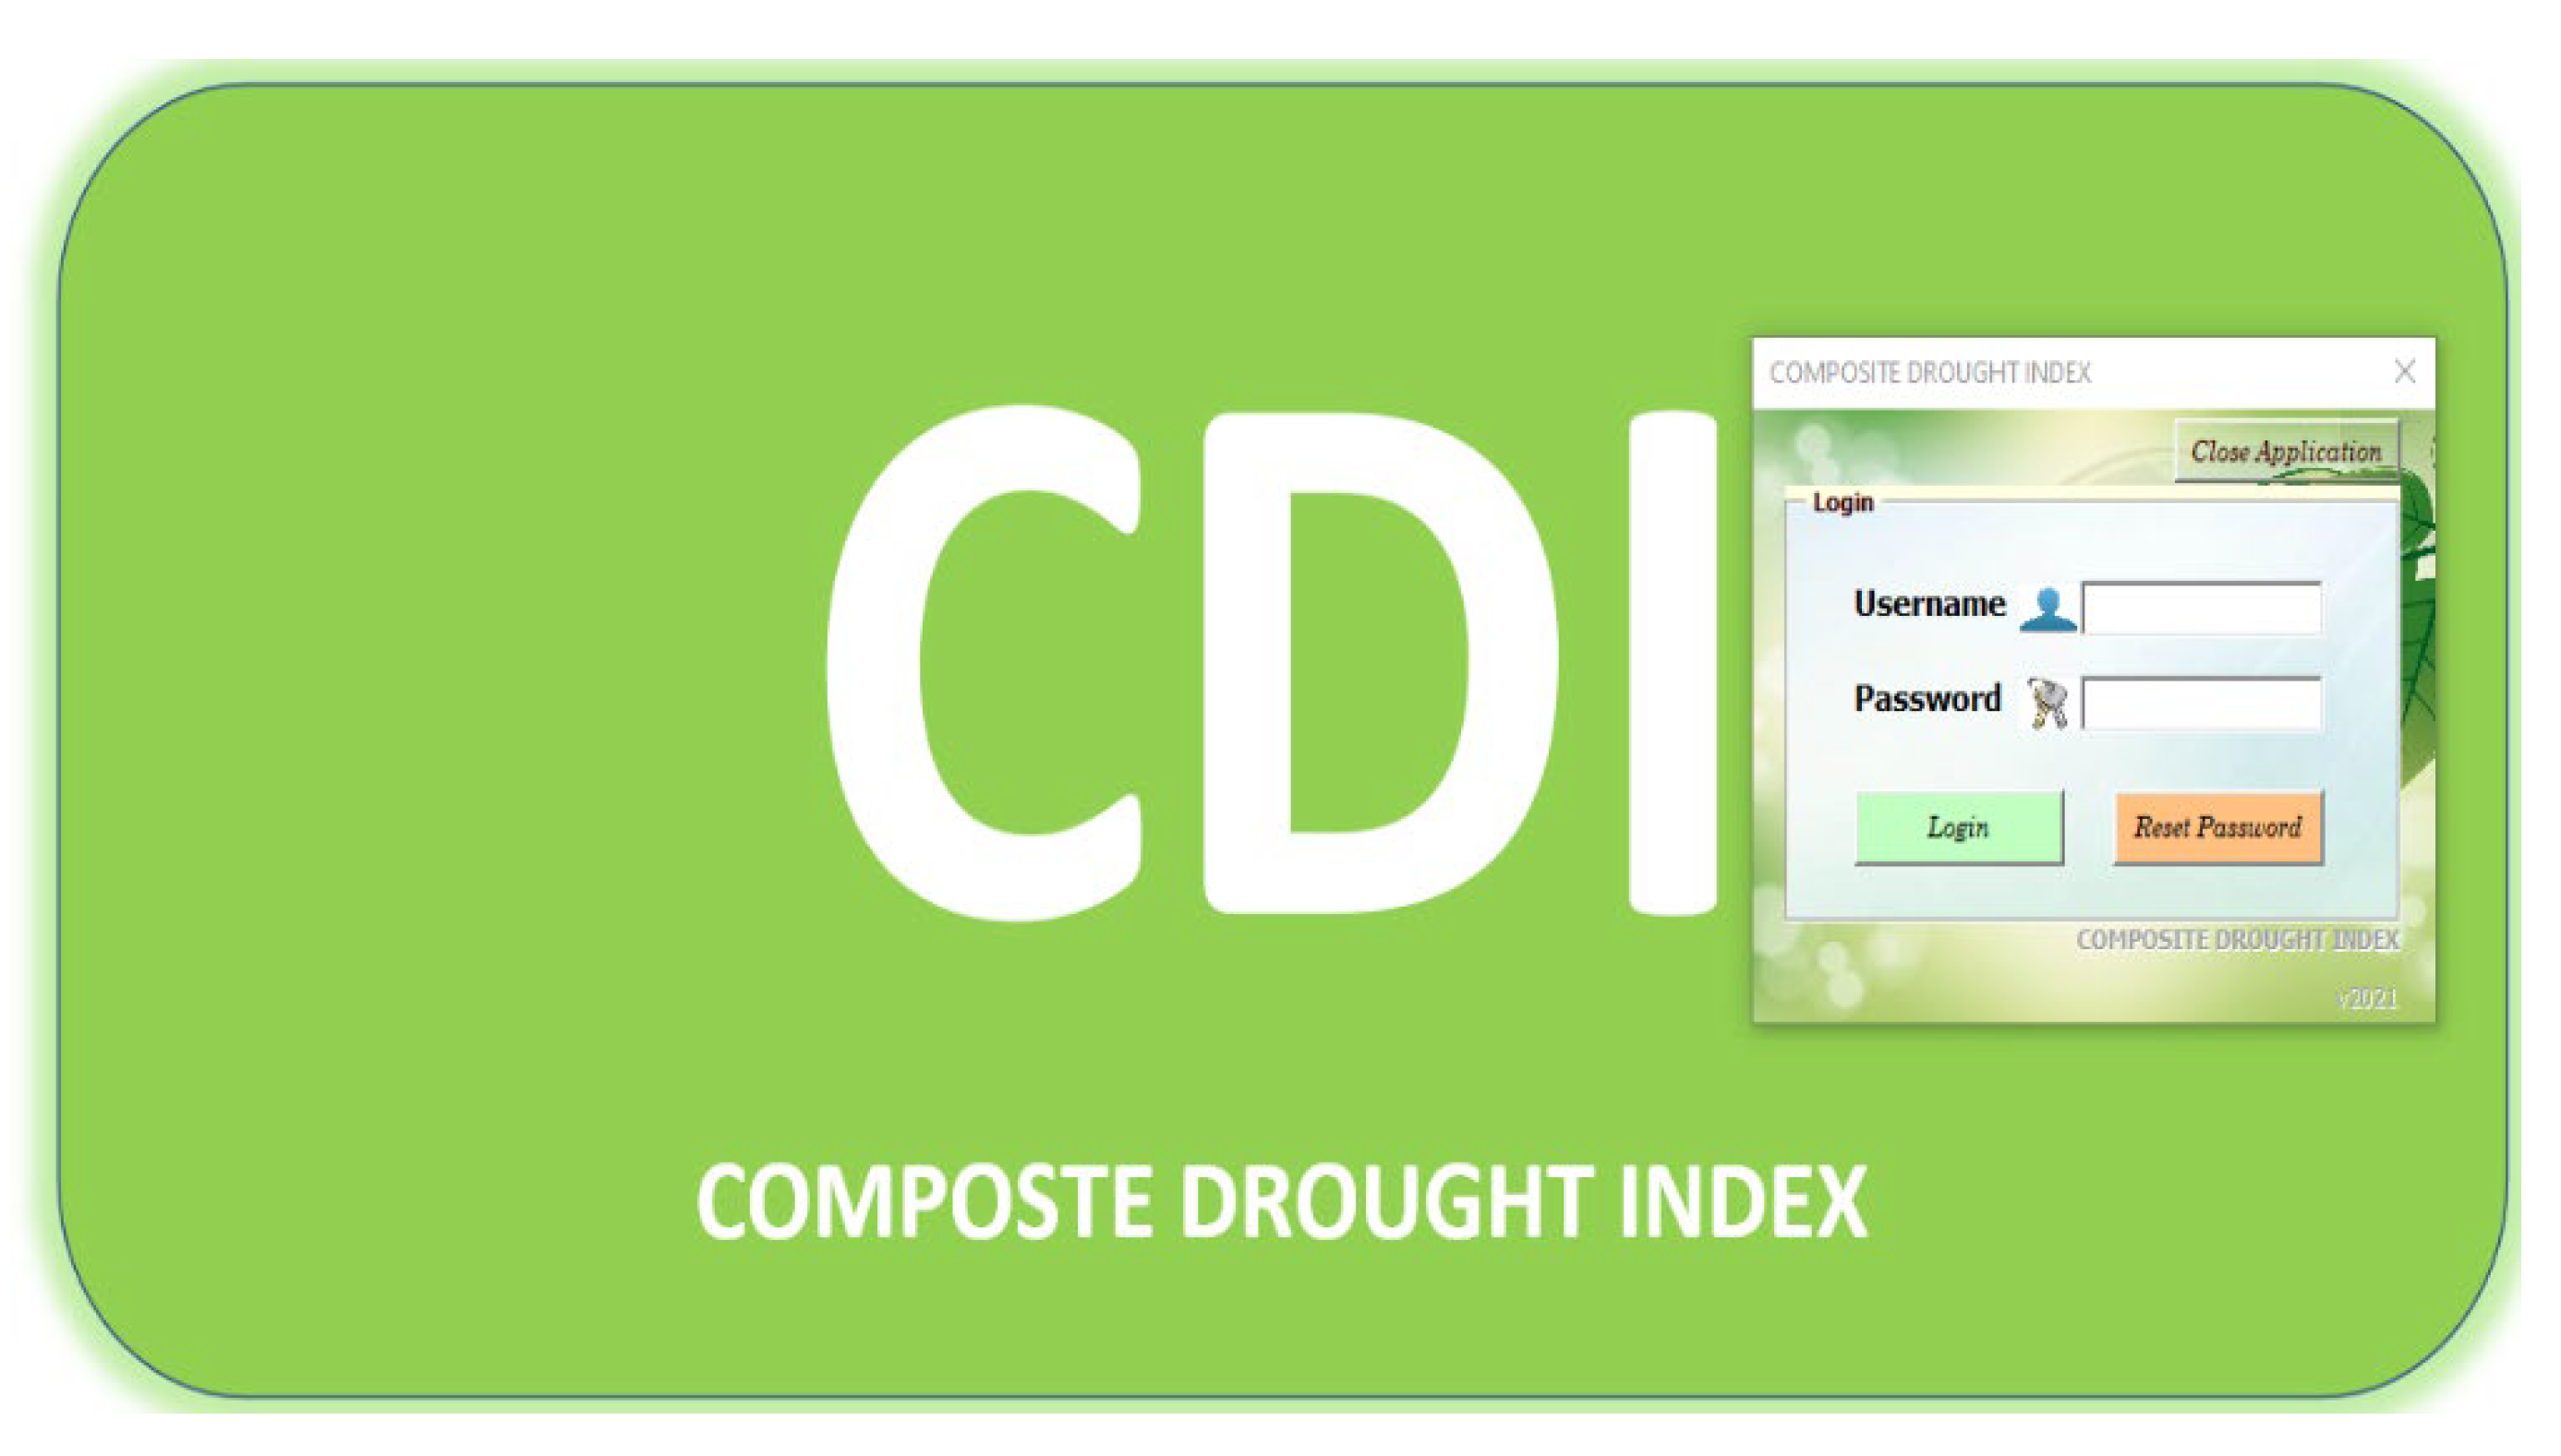
Figure 10.
The Menu Interface of DREM.
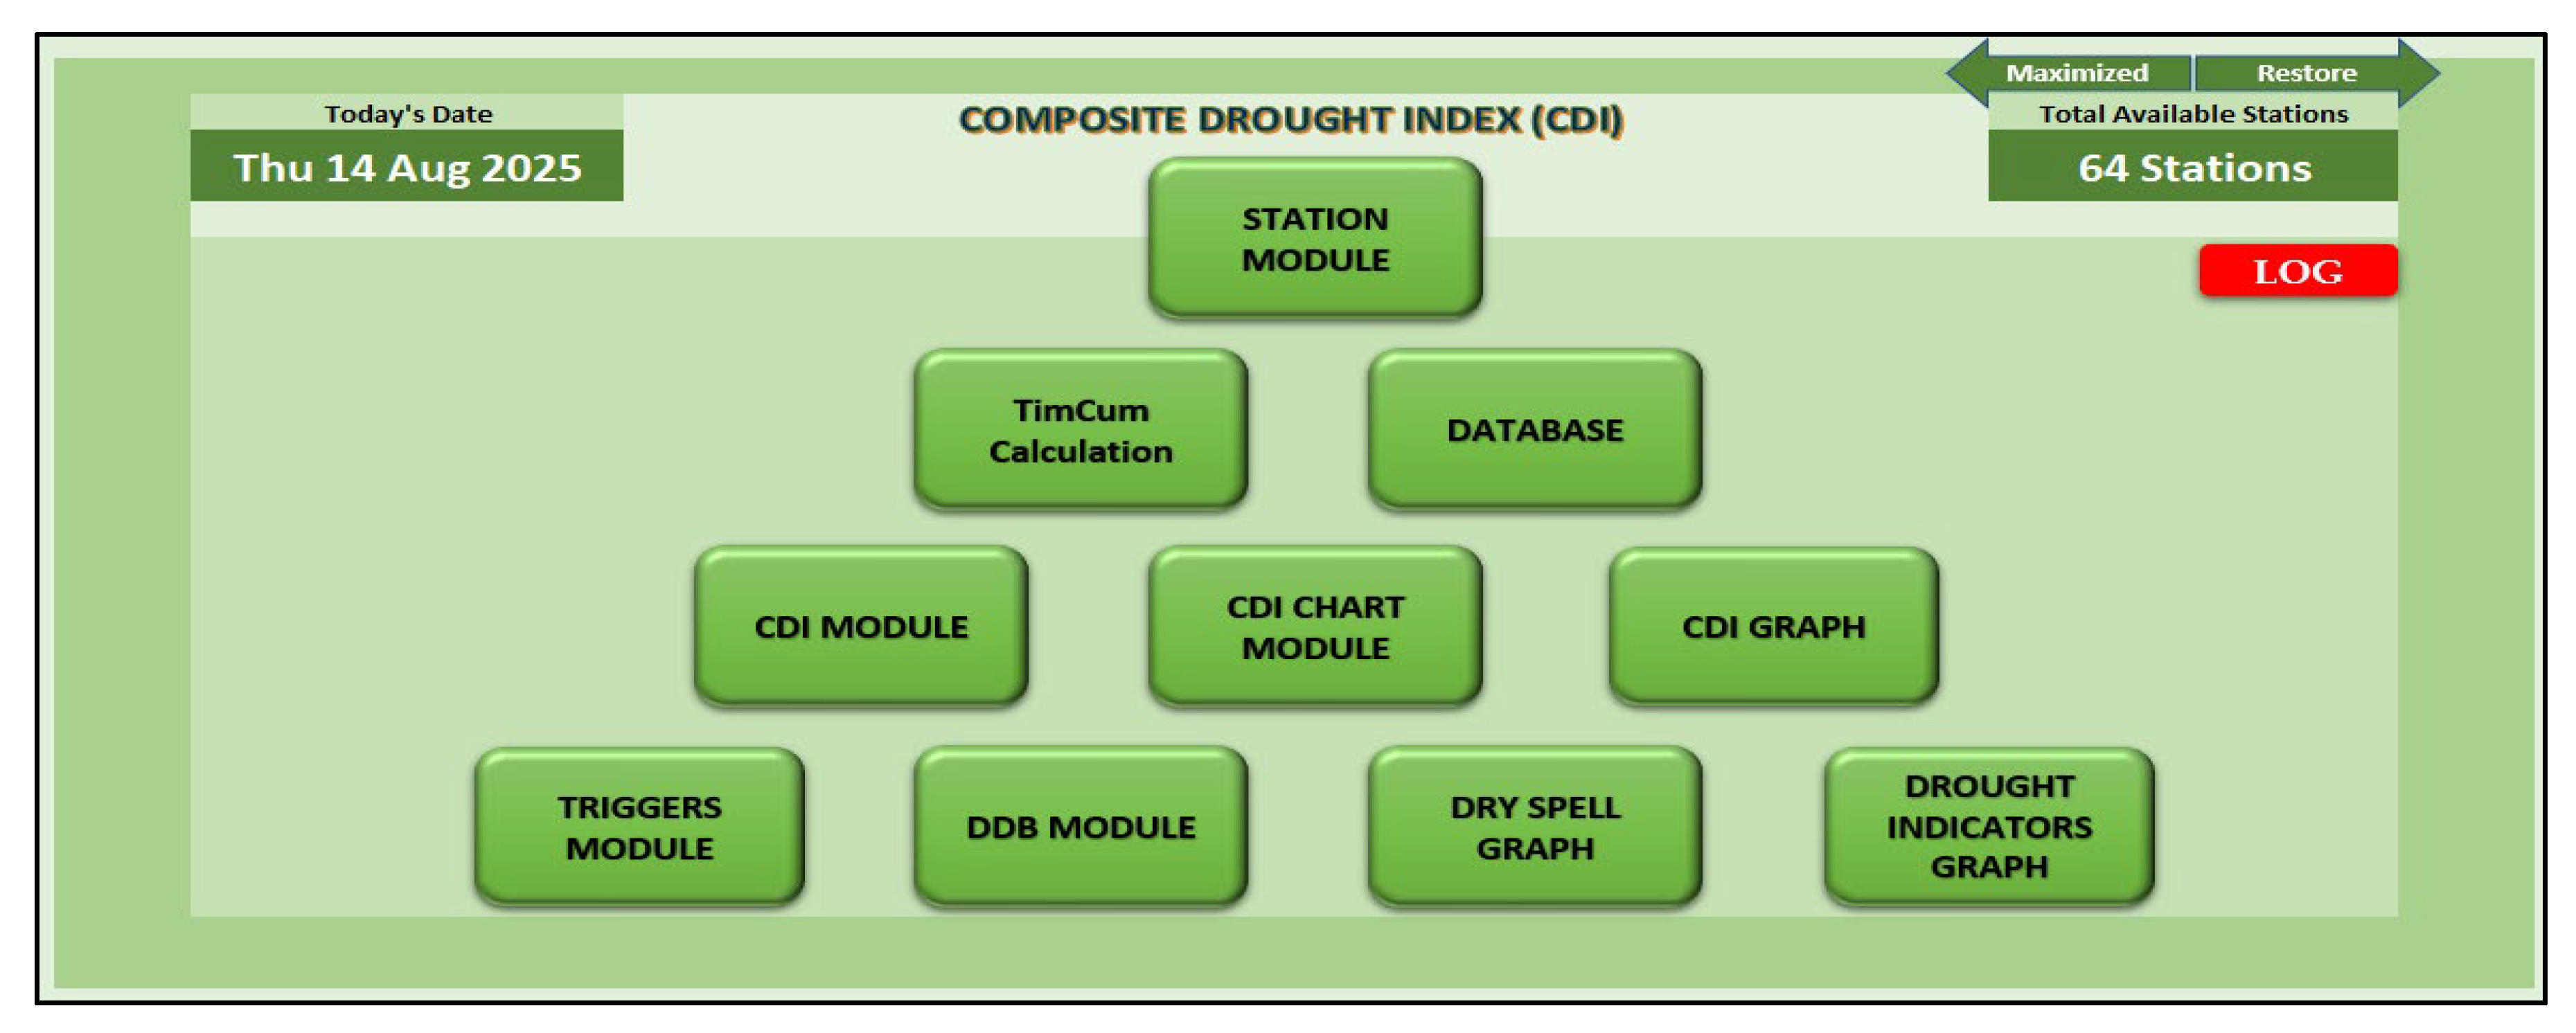
Figure 11.
Typical of Drought Detection and Severity Categorization by DREM for Abuja station.
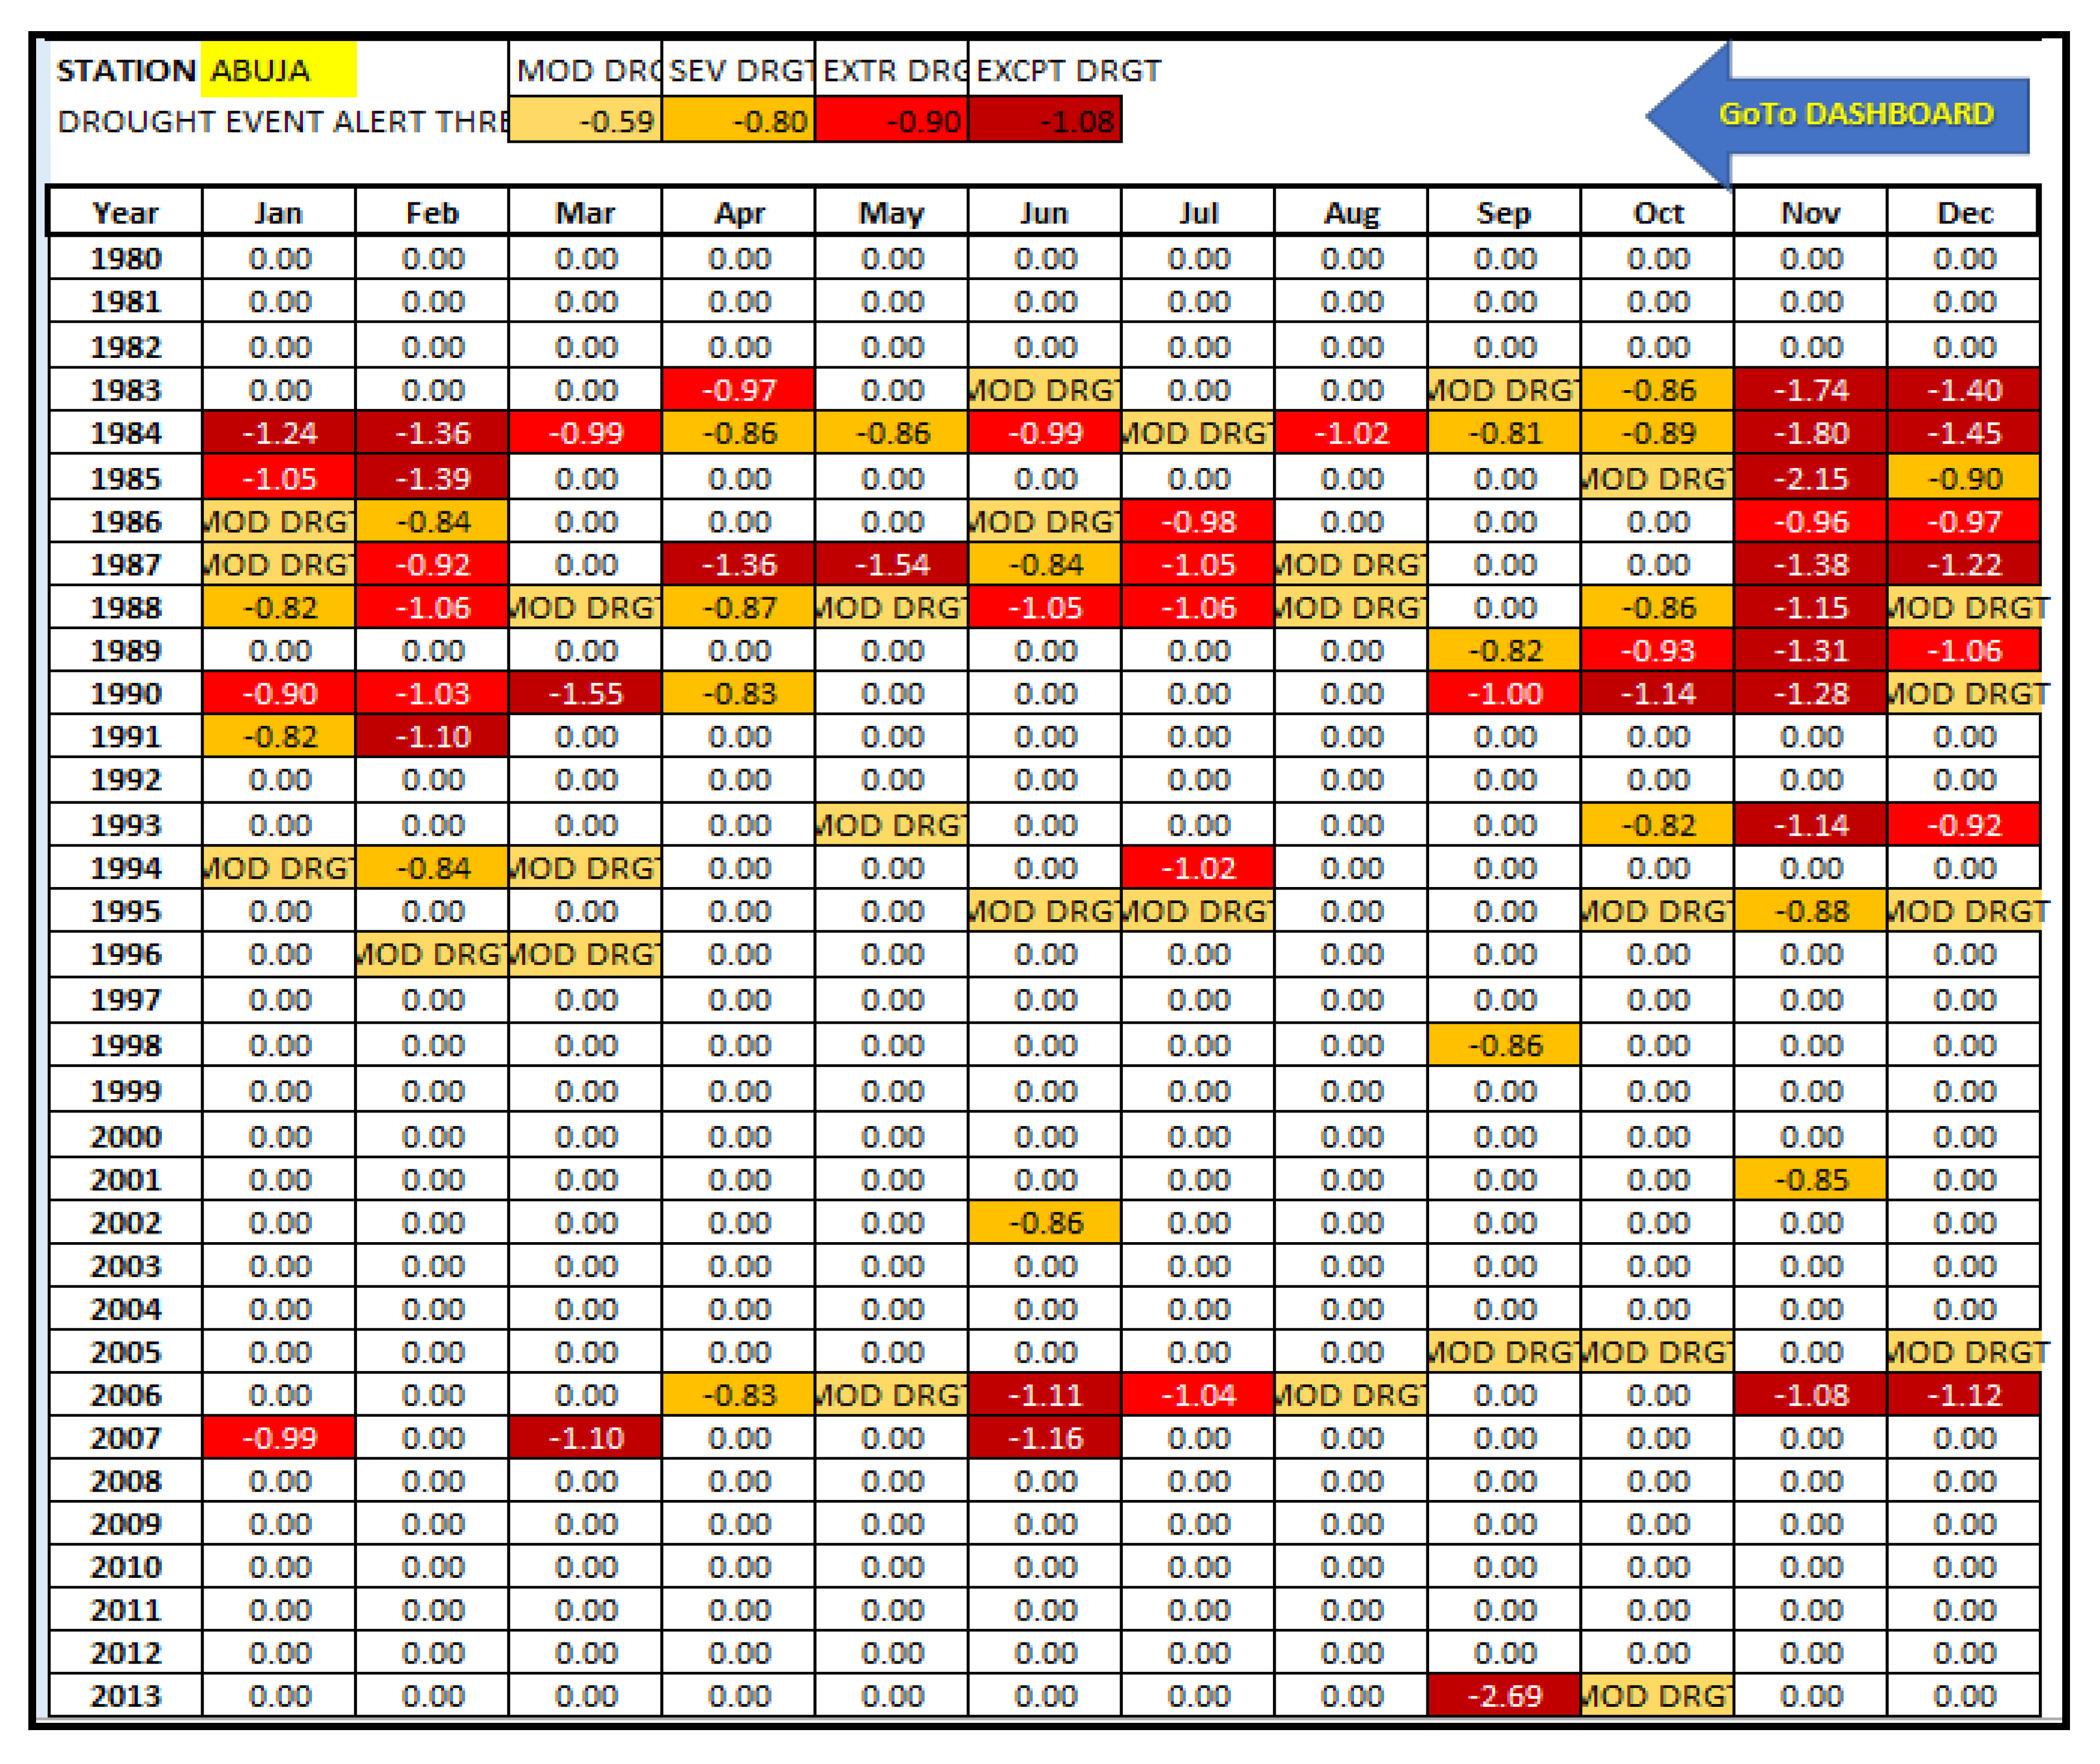
Figure 12.
Distribution of CDI based Threshold for the Detection of Moderate Drought relative to the basin’s climatology.
Figure 12.
Distribution of CDI based Threshold for the Detection of Moderate Drought relative to the basin’s climatology.
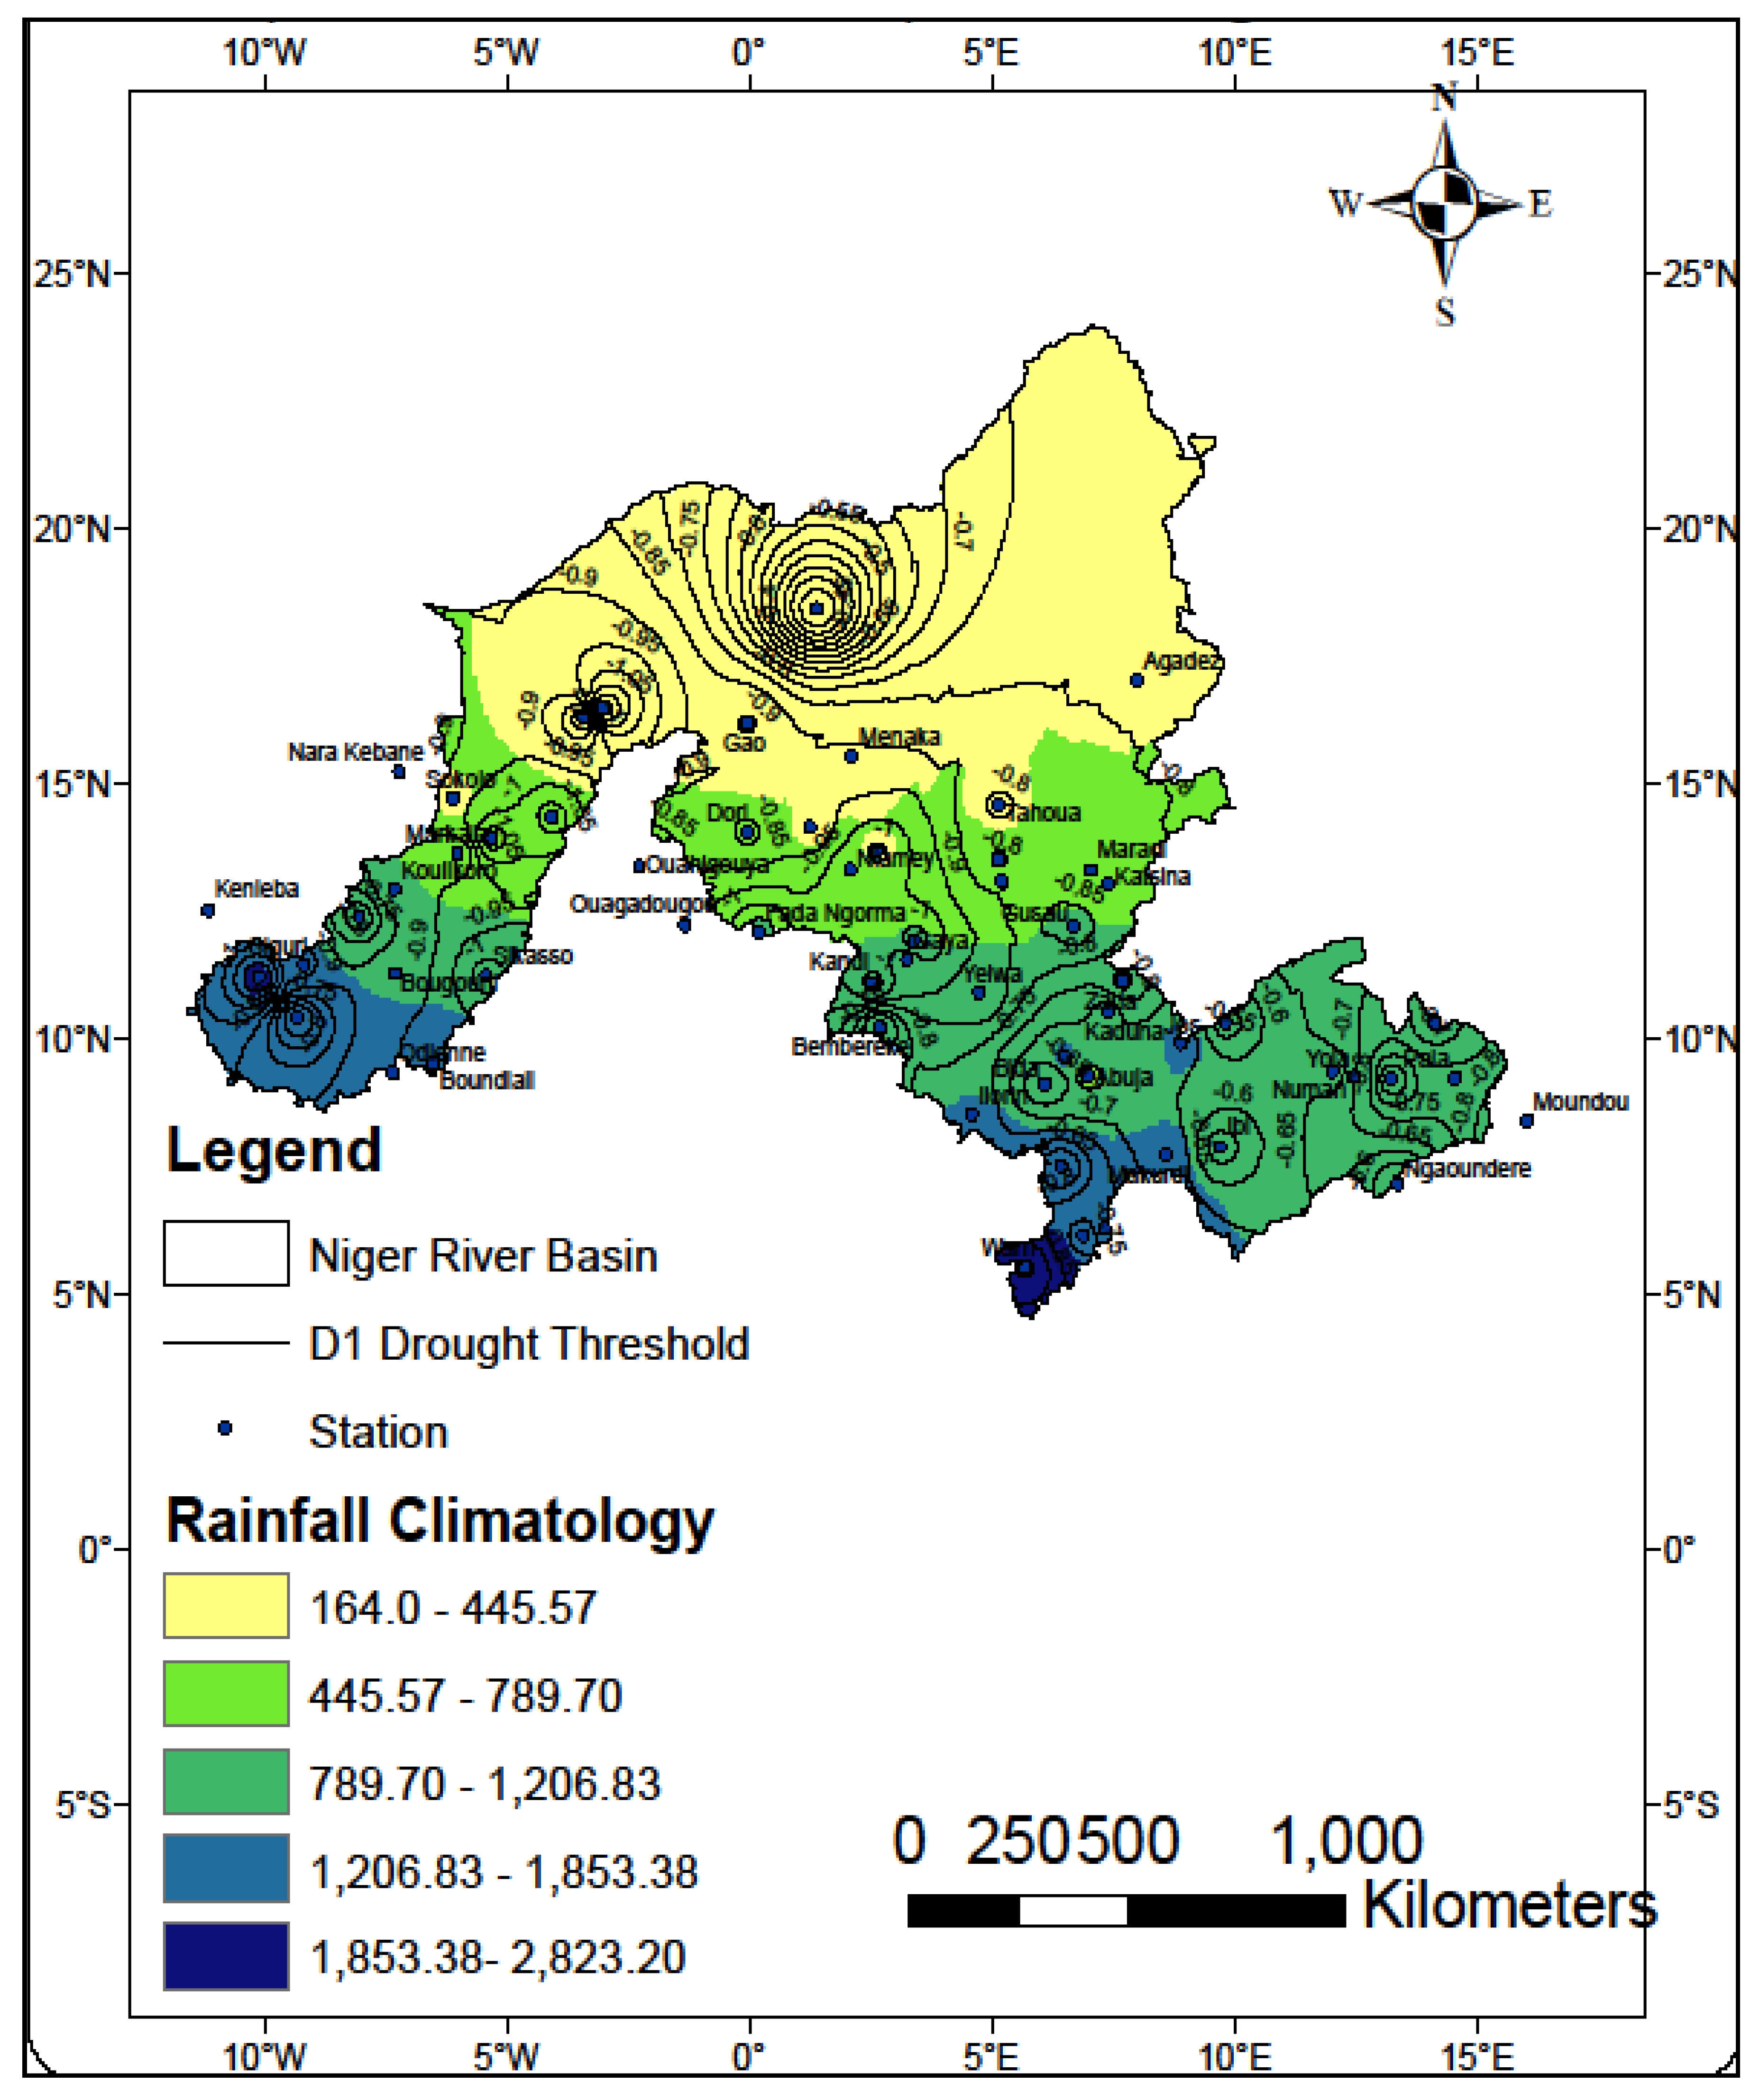
Figure 13.
Equiprobability transformation of reanalysis rainfall distribution in the Niger basin.
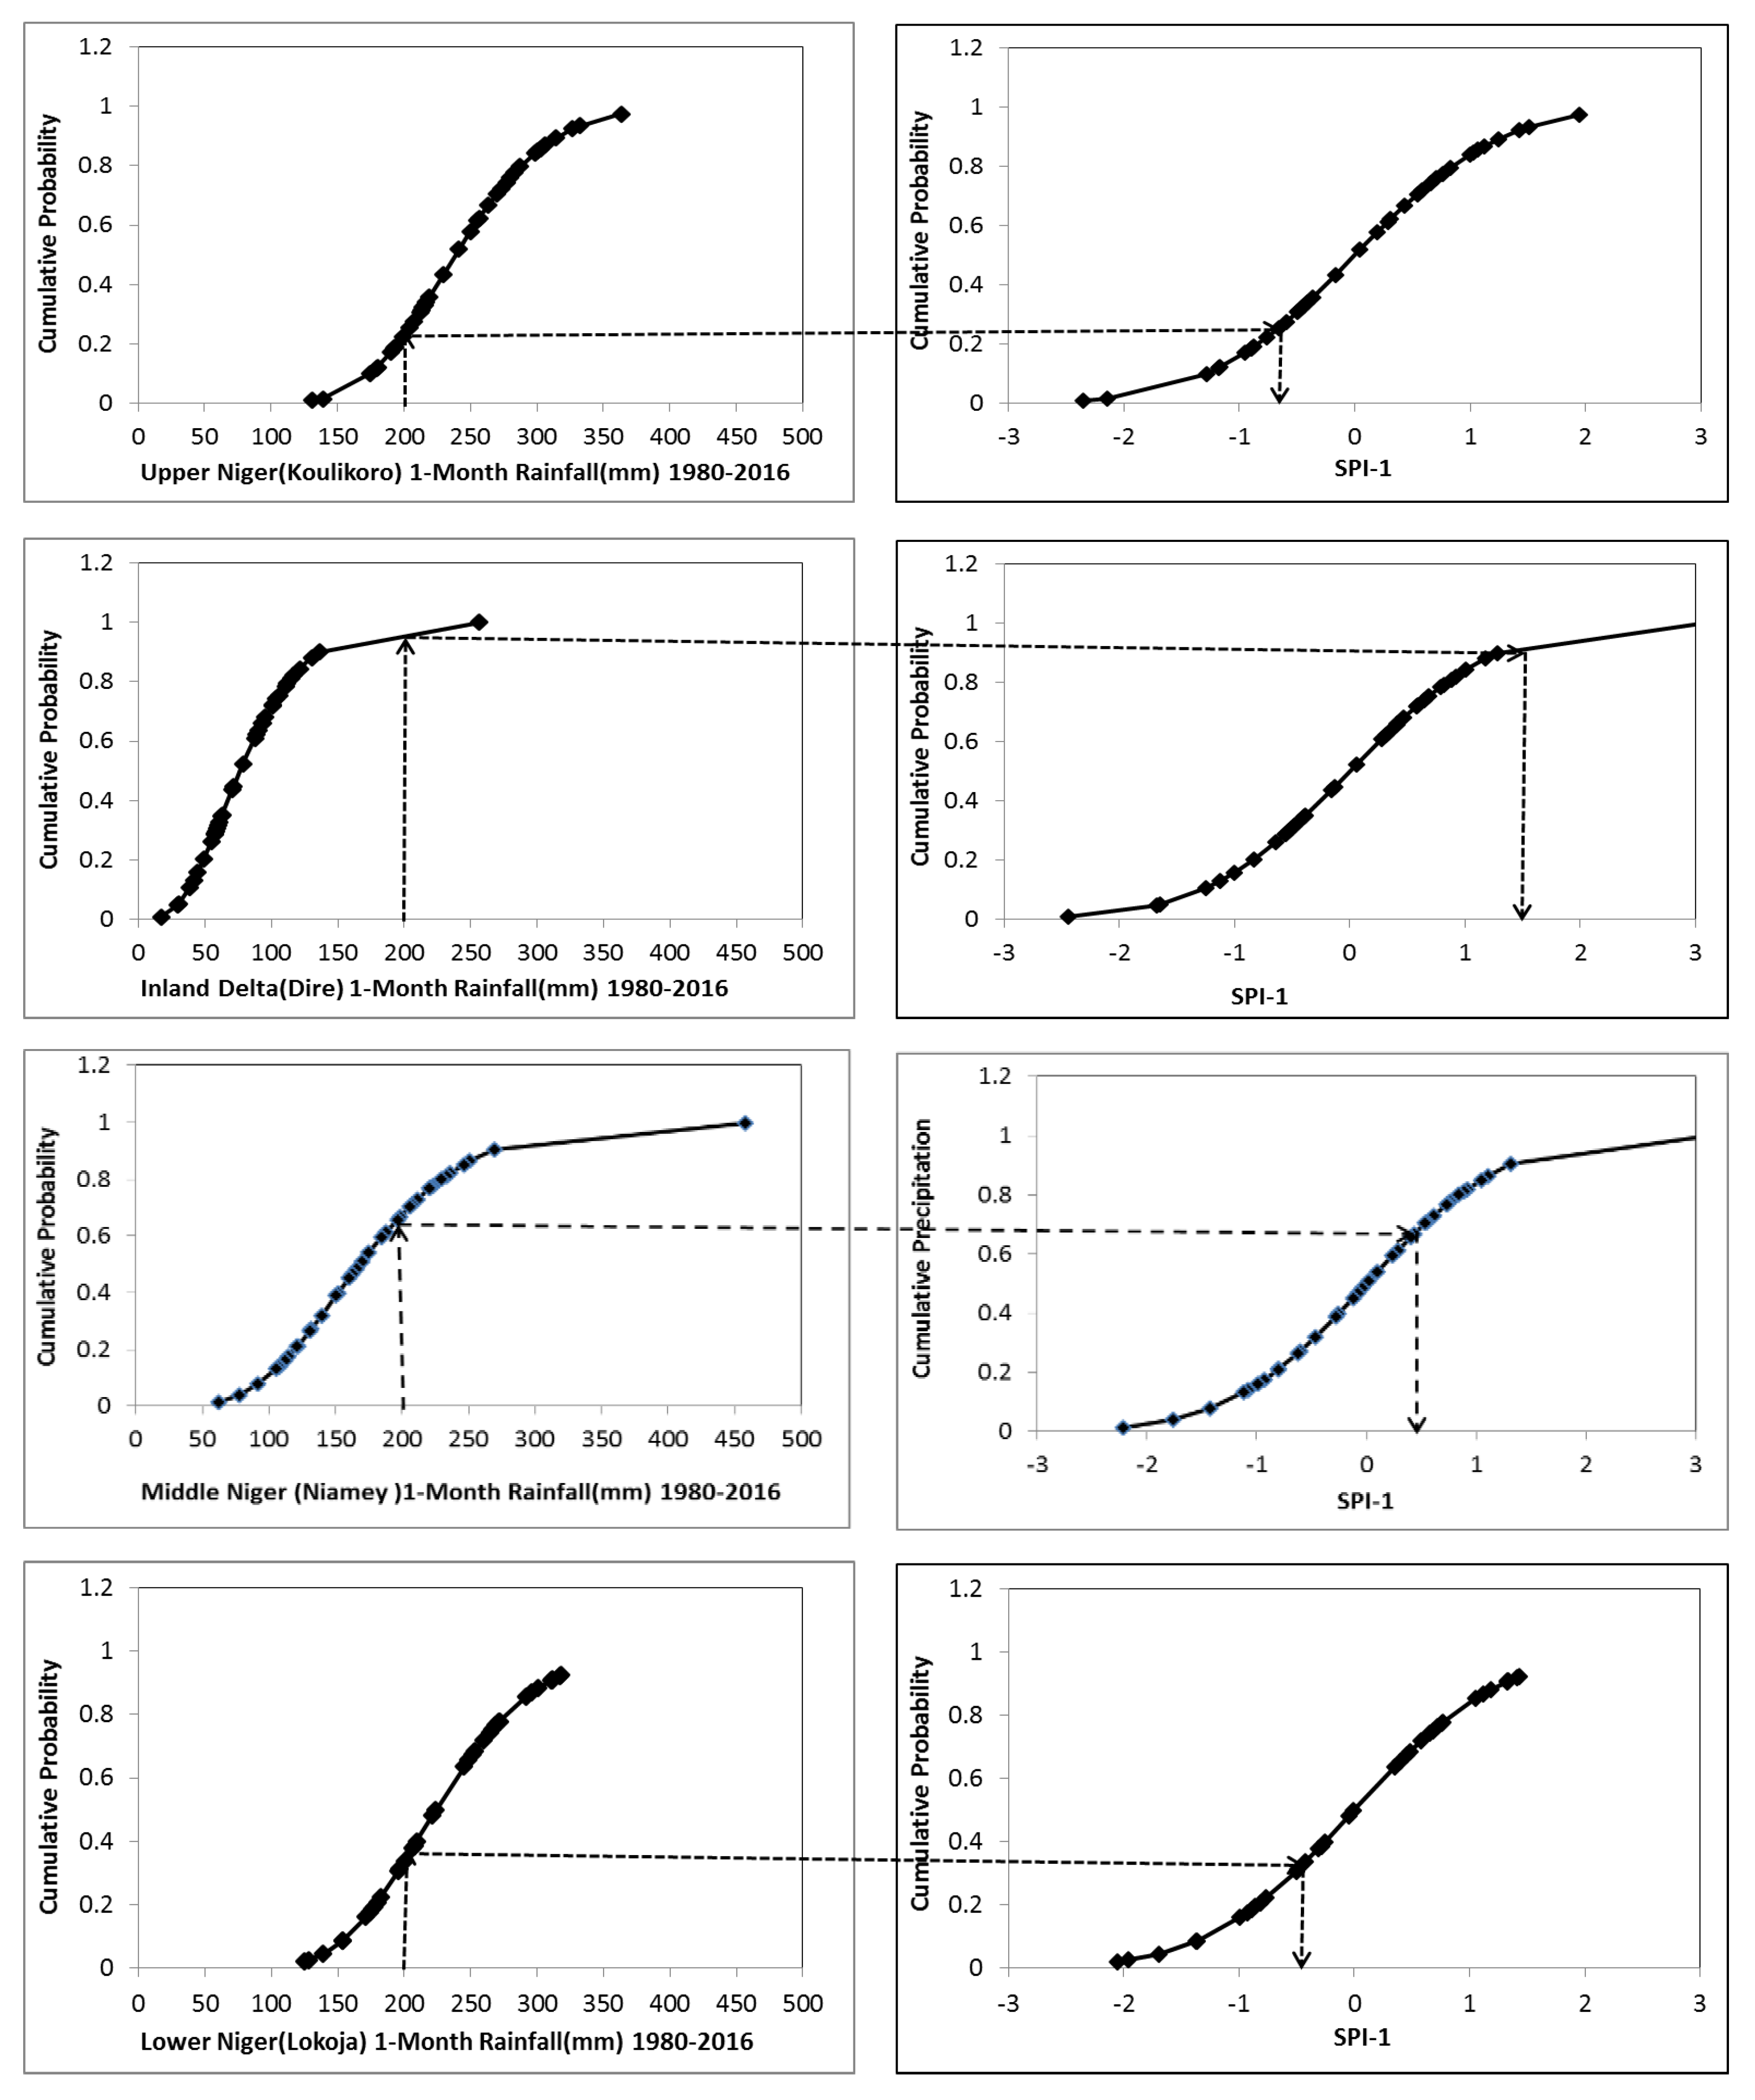
Figure 14.
CDI based Drought Severity Distribution over the Niger Basin (1980s).
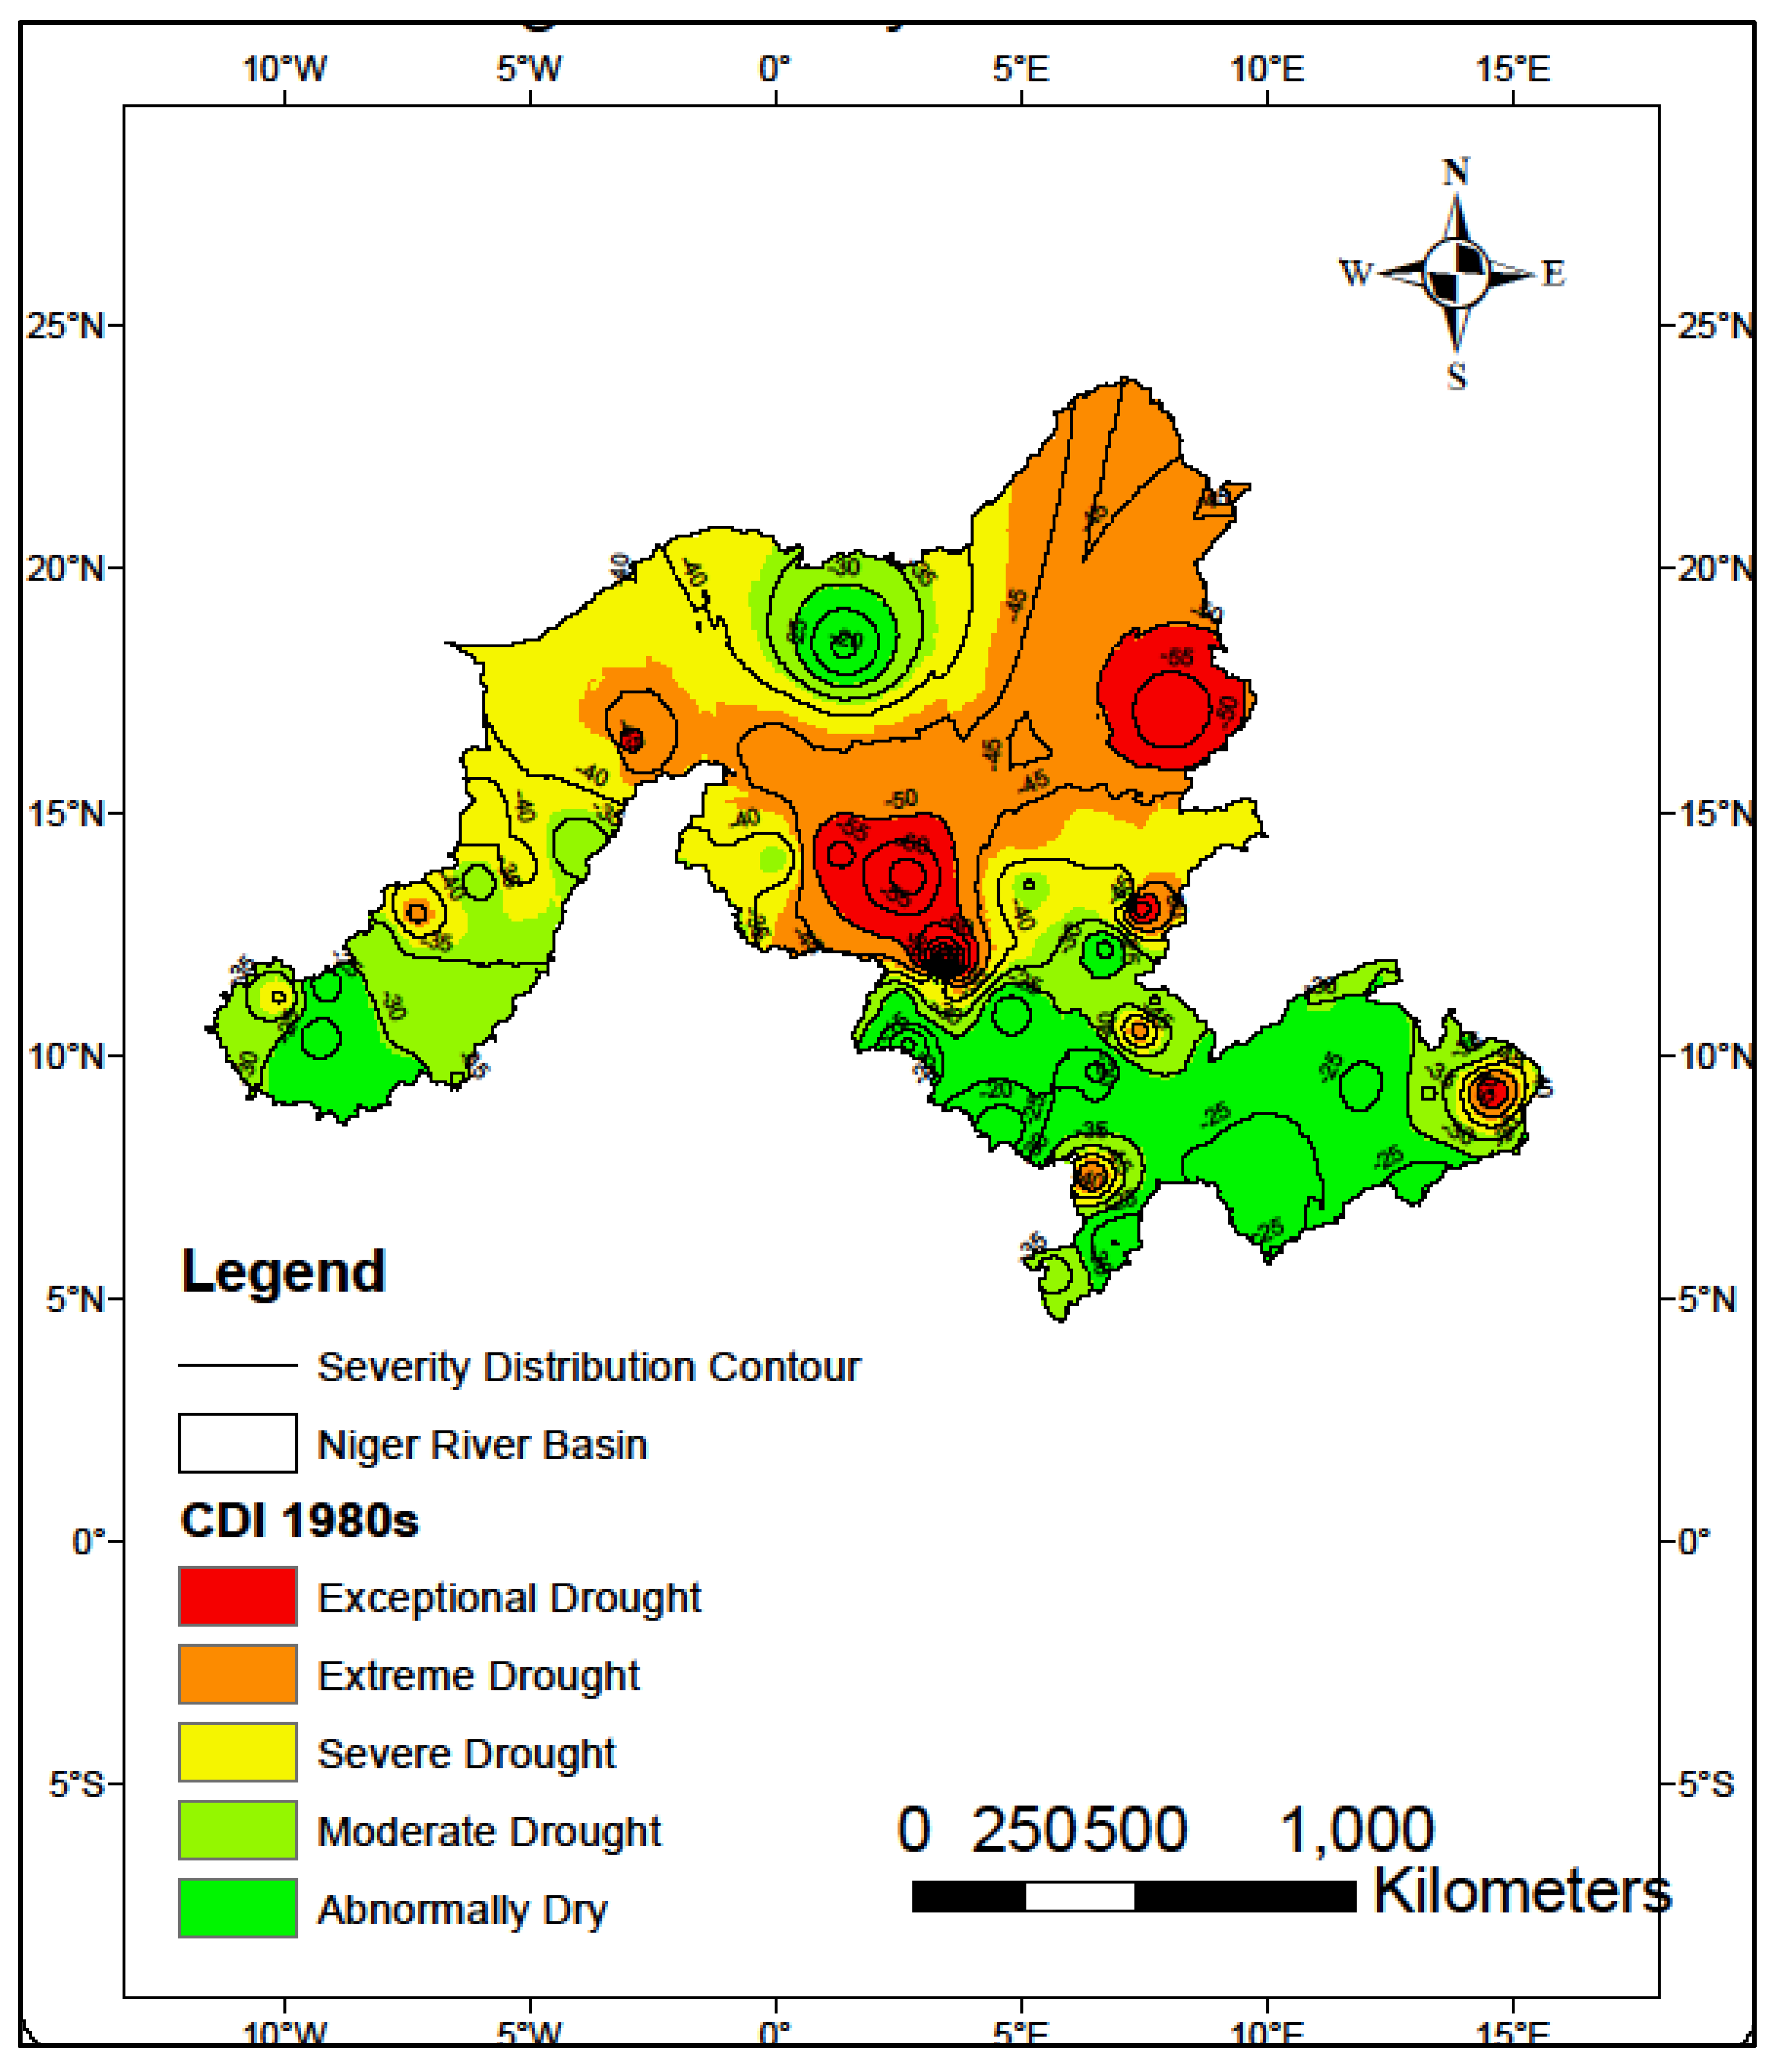

Table 1.
Summary of reanalysis hydro-meteorological data used.
| Parameters | Record Period | Time scale | Spatial scale | Source |
| Precipitation | 1980–2016 | Daily | 0.25 x 0.25 | AFDM website |
| Temperature | 1980–2016 | Daily | 0.25 x 0.25 | AFDM website |
| Soil moisture | 1980–2016 | Daily | 0.25 x 0.25 | AFDM website |
| Streamflow | 1980–2016 | Daily | 0.25 x 0.25 | AFDM website |
Table 2.
Comparison Between the Subjective and Objective Drought Definition Thresholds (SPI and CDI).
Table 2.
Comparison Between the Subjective and Objective Drought Definition Thresholds (SPI and CDI).
| Category | Subjective Threshold | Objective Indices | Upper Niger ( Koulikoro) | Inland Delta ( Dire) | Middle Niger (Niamey) | Lower Niger ( Lokoja) |
| Mild Drought/ Abn Dry | 0 to -0.99 | SPI | (-0.49 to -0.78) | (-0.39 to -0.83) | (-0.59 to -0.74) | (-0.45 to -0.84) |
| CDI | (-0.43 to -0.81) | (-0.48 to -0.81) | (-0.08 to -0.82) | (-0.32 to -0.69) | ||
| Moderate Drought | (-1.0 to -1.49) | SPI | (-0.79 to -1.32) | (-0.84 to -1.34) | (-0.75 to -1.34) | (-0.85 to −1.25) |
| CDI | (-0.64 to -1.11) | (-0.72 to -1.08) | (-0.26 to -1.19) | (-0.56 to −0.99) | ||
| Severe Drought | (-1.50 to-1.99) | SPI | (-1.33 to −1.76) | (-1.35 to -1.50 | (-1.35 to −1.71) | (-1.26 to -1.49) |
| CDI | (-0.91 to -1.39 | (-0.99 to -1.45) | (-0.42 to −1.60) | (-0.94 to -1.72) | ||
| Extreme Drought | < -2.0 | SPI | (-177 to −1.81) | (-1.51 to -1.63) | (-1.72 to −1.86) | (-1.50 to −1.77) |
| CDI | (-1.09 to -1.58) | (-1.14 to -1.69) | (-0.58 to −1.76) | (-1.52 to −1.67) | ||
| Exceptional Drought | SPI | |||||
| CDI | (- 1.32 to -1.79) | (-1.28 to -1.85) | (-0.73 to −1.87) | (-1.12 to -1.96) |
Table 3.
DREM CDI Model Performance Evaluation.
| Sub- Basin | Index Models | R2 | NSE | PBIAS | MAE | d |
| Upper Niger | SEPI | 0.701 | 0.776 | -0.374 | 0.322 | 0.906 |
| SMI | 0.842 | 0.946 | 0.169 | 0.239 | 0.953 | |
| SFI | 0.922 | 0.977 | 0.071 | 0.149 | 0.978 | |
| Inland Delta | SEPI | 0.477 | -0.146 | -2.200 | 0.546 | 0.800 |
| SMI | 0.655 | 0.721 | 0.516 | 0.846 | 0.844 | |
| SFI | 0.683 | 0.928 | -0.070 | 0.165 | 0.898 | |
| Middle Niger | SEPI | 0.501 | -0.377 | -1.601 | 0.681 | 0.816 |
| SMI | 0.744 | 0.889 | 0.278 | 0.418 | 0.914 | |
| SFI | 0.79 | 0.935 | 0.234 | 0.332 | 0.932 | |
| Lower Niger | SEPI | 0.501 | 0.864 | -0.305 | 0.235 | 0.839 |
| SMI | 0.698 | 0.906 | 0.286 | 0.380 | 0.890 | |
| SFI | 0.736 | 0.899 | 0.302 | 0.412 | 0.910 |
Table 4.
Country-wise NBDM CDI Performance Validation.
| Country Drought Chronology Success ENSO Success Rate (%) Rate (%) |
| Cameroun 100 69 Chad 89 62 Nigeria 85 69 Niger 75 62 Benin 100 62 Burkina Faso 100 62 Cote d’Ivoire 100 62 Guinea 67 77 Mali 100 62 |
Disclaimer/Publisher’s Note: The statements, opinions and data contained in all publications are solely those of the individual author(s) and contributor(s) and not of MDPI and/or the editor(s). MDPI and/or the editor(s) disclaim responsibility for any injury to people or property resulting from any ideas, methods, instructions or products referred to in the content. |
© 2025 by the authors. Licensee MDPI, Basel, Switzerland. This article is an open access article distributed under the terms and conditions of the Creative Commons Attribution (CC BY) license (http://creativecommons.org/licenses/by/4.0/).
Copyright: This open access article is published under a Creative Commons CC BY 4.0 license, which permit the free download, distribution, and reuse, provided that the author and preprint are cited in any reuse.


