
Submitted:
10 November 2025
Posted:
11 November 2025
Read the latest preprint version here
Abstract
Hospital consolidation has increased in the USA, raising concerns about reduced competition and higher costs. This study investigates whether recent consolidations have enhanced efficiency or boosted market power. Data from 2017 to 2024, collected from RAND Hospital Data, which combines Medicare Cost Reports and hospital ownership information, were analyzed using a difference-in-differences approach to assess efficiency changes before and after hospitals joined multihospital systems. The treatment group consisted of hospitals affiliated with a hospital system between 2019 and 2020, while standalone hospitals served as the comparison group. The analysis examined overall, operating, and cash flow margins. Fixed-effects models with clustered standard errors accounted for hospital-level differences. Results showed a significant increase in overall margins (β = 0.0064, SE = 0.0028, p = 0.021) and operating margins (β = 0.0068, SE = 0.0025, p = 0.006), but no significant change in cash flow margins (β = 0.0019, p = 0.415) for hospitals that joined systems between 2019 and 2020. Pre-trend lines support causal inference. These findings suggest efficiency improvements rather than increased market dominance. The results differ from previous studies on cost inflation but reflect recent efficiency gains under new regulations following the public healthcare law.
Keywords:
hospital consolidation
; efficiency
; financial performance
; ownership structure
; difference-in-differences
; RAND Hospital Data
; healthcare markets
Plain Language Summary
Reflecting this shift, hospitals in the U.S. have increasingly become part of larger health systems. Some analysts argue that this reduces competition and increases costs, while others believe it improves coordination and reduces expenses. Using financial data from over 4,600 hospitals from 2017 to 2024, this study compared hospitals before and after joining a multi-hospital system. Hospitals integrated into a system showed small but clear improvements in efficiency and operational performance, with no signs of price increases. All these findings suggest that recent mergers have been beneficial to hospitals in terms of efficiency.
Introduction
The consolidation of hospitals has gained momentum in the USA over the past two decades, transforming the healthcare delivery landscape [1]. Between 2010 and 2022, it was reported that more than two-thirds of hospitals joined multi-hospital systems [2,3]. Although some argue that hospital integration enhances cost efficiency and coordination, critics contend it leads to reduced competition, higher healthcare costs, and less motivation to improve quality [4,5,6].
Empirical evidence before the pandemic has been inconclusive. Initial research showed significant price increases following hospital mergers, especially in less competitive markets [7,8,9]. Recent studies generally agree that with ACA regulation, some level of integration can achieve efficiencies without raising prices [10,11,12]. Despite these developments, little research has examined hospital merger activity during the current 2019 era, following increased economic instability due to COVID-19. This work will analyze financial performance after COVID-19 and subsequent ACA regulation, during which hospital mergers have faced challenges but have become more transparent.
Gap in Knowledge
Most previous research on hospital consolidation focuses on pricing and market power, particularly for privately insured patients. Several studies have found that hospital consolidation increases prices because of enhanced market power, without any significant change in efficiency or quality [1,4,13,14]. These studies usually analyze commercial claims and examine short-term price changes after mergers rather than evaluating long-term operational performance.
Far fewer studies have investigated whether system affiliation enhances hospital efficiency over time. The limited long-term data from public sources (e.g., Medicare Cost Reports) show mixed results—some indicate modest financial improvements, while others find no lasting gains [6,15]. Most omit multi-year trends and margin-based outcomes, leaving a gap in understanding whether integration truly leads to operational efficiencies.
Furthermore, little is known about how consolidation trends might evolve in this new era, which is both post-ACA and post-COVID. Transparency regulations, antitrust scrutiny, and ultimately losses due to the pandemic may have changed how hospital systems respond to hospital system membership [16–18].
This paper employs RAND Hospital Data (2017-2024) and a difference-in-differences method to evaluate whether efficiency improvements occurred for hospitals affiliated with systems between 2019 and 2020 compared to those that were not.
Research Question/Objective
This study investigates whether recent hospital consolidation has led to improved efficiency or increased market power. Using a difference-in-differences (DID) model on RAND hospital data (2017-2024), which combines Medicare cost reporting and hospital ownership information, we compare hospitals that recently joined a system (between 2019 and 2020) with those that did not.
Hypothesis
- H1: Hospitals that joined a multi-hospital system between 2019 and 2020 will have higher total and operating margins than stand-alone hospitals.
- H2: The consolidation process probably won’t affect the cash flow margins.
- H3: The trends between affiliated hospitals and independent hospitals are parallel, which supports the causal inference made.
Method
Study Design and Data Source
This study employed a quasi-experimental difference-in-differences (DID) design to evaluate the financial impact of hospital consolidation on efficiency and performance. Data were collected from the RAND Hospital Data (2017–2024), which merges Medicare Cost Reports and ownership information from the Centers for Medicare & Medicaid Services (CMS) [19,20]. The analytic sample included hospital-year observations from 2017 through 2021, representing the most recent years with complete and validated financial data available in the RAND dataset. The RAND dataset standardizes identifiers across reporting systems and provides consistent financial metrics suitable for longitudinal hospital-level analysis.
The sample included all U.S. short-term acute care hospitals with complete data on total margin, operating margin, and cash-flow margin between 2017 and 2024. Critical-access, rehabilitation, and specialty hospitals were excluded to maintain comparability in operating models and cost structures.
Study Population and Treatment Definition
Hospitals were categorized into two groups:
- Treatment group: hospitals that joined or became part of a multihospital system (chain) between 2019 and 2020.
- Control group: hospitals that remained independent throughout the observation period.
System affiliation was defined using RAND ownership identifiers linked to CMS Provider of Services files. The variable ifthisfacilityispartofachainorga was recoded as a binary indicator of chain membership. A hospital was considered “treated” once its first year of system affiliation (first_chain) occurred within the 2019–2020 window.
The post-treatment period (post2020) was defined as 2020–2024, aligning with the post-COVID financial reporting era.
Outcome Variables
Three hospital-level performance outcomes were analyzed:
- Total margin: ratio of net income to total operating revenue, capturing overall profitability.
- Operating margin: ratio of operating income to total operating revenue, measuring core operating efficiency.
- Cash-flow margin: ratio of net cash flow to total revenue, representing liquidity and fiscal stability.
All outcomes were continuous variables expressed as percentages.
Statistical Approach
The main DID specification estimated the average treatment effect on the treated (ATT) using a two-way fixed-effects model that controls for hospital-specific and year-specific heterogeneity:
where denotes each financial outcome for hospital i in year t, represents hospital fixed effects, and represents year fixed effects. The coefficient captures the DID estimate of the effect of system affiliation on financial performance.
Estimation used two-way fixed-effects regressions with hospital-level clustered standard errors, following recommended practices for difference-in-differences analysis [21,22,23]. The coefficient on the interaction term (β3) represents the average treatment effect on the treated (ATT). Pre-treatment parallel trends were supported both statistically (F(2, 21,472) = 0.00, p = 0.9999) and visually, as treated and control hospitals exhibited overlapping trajectories before 2020.
Model Diagnostics and Sensitivity Analyses
To ensure model validity and robustness:
- Hausman tests compared fixed-effects and random-effects specifications.
- Event-study estimations assessed dynamic treatment effects across years, allowing heterogeneous timing of treatment [21].
- Winsorization at the 1st and 99th percentiles mitigated the influence of outliers in financial variables.
- Placebo tests using pre-2019 data confirmed the absence of anticipatory effects.
- Robustness checks included re-estimating models with state fixed effects and unclustered standard errors.
Ethical Considerations
The study used publicly available, de-identified secondary data and was exempt from institutional review board review under federal regulation (45 CFR 46).
Results
Descriptive Findings
Across 7,279 hospitals observed from 2017 to 2024, approximately 14% joined a multihospital system between 2019 and 2020. Before consolidation, treated and control hospitals had comparable average financial margins (Table 1). Formal tests revealed no significant pre-treatment differences in outcome trends (F = 0.00; P = .997), supporting the parallel trends assumption.
Visual inspection of Figure 1 (Parallel Trends in Total Margin) and Figure 2 (Estimated Difference in Total Margin) confirms this, with near-identical trajectories between groups before 2020. Similarly, Figure 3 shows stable pre-period differences in operating margins. These patterns validate the identifying assumptions for the DiD approach.
The main treatment effects are presented in Table 2, showing statistically significant post-2020 improvements in both total and operating margins among hospitals that consolidated during the treatment window.
Difference-in-Differences Estimates
Table 2 summarizes the fixed-effects DID regression results. Joining a hospital chain between 2019 and 2020 was associated with modest but statistically significant efficiency gains:
- Total margin: +0.0064 (SE = 0.003; P = .021) — equivalent to a 0.6-percentage-point increase post-2020 for chain-affiliated hospitals.
- Operating margin: +0.0068 (SE = 0.002; P = .006) — a 0.7-percentage-point improvement.
- Cash-flow margin: +0.0019 (SE = 0.002; P = .42) — not significant.
These results reflect modest but statistically significant efficiency gains for total and operating margins post-affiliation, with no significant liquidity effect.

Table 2.
Difference-in-Differences Estimates: Chain Affiliation 2019–2020.
| Variable | (1) Total Margin | (2) Operating Margin | (3) Cash-Flow Margin |
|---|---|---|---|
| Post-2020 (=1) | –0.0005 (0.0009) | 0.0019 (0.0012) | –0.0002 (0.0006) |
| Treat × Post | 0.0064 ** (0.0028) | 0.0068 *** (0.0025) | 0.0019 (0.0024) |
| Year = 2018 | 0.0005 (0.0005) | 0.0012 ** (0.0006) | –0.0002 (0.0004) |
| Year = 2019 | 0.0024 (0.0019) | 0.0013 * (0.0007) | –0.0004 (0.0005) |
| Year = 2020 | 0.0003 (0.0009) | –0.0013 ** (0.0006) | –0.0002 (0.0004) |
| Constant | –142.52 *** (0.0007) | 6.063 *** (0.0007) | 0.0372 *** (0.0005) |
| Observations | 35,982 | 35,982 | 28,353 |
| R-squared (within) | 0.0005 | 0.0019 | 0.0002 |
Notes: Fixed-effects regressions with hospital and year controls; standard errors clustered at the hospital level. The “Treat × Post” coefficient represents the estimated average treatment effect for hospitals joining systems in 2019–2020 relative to always-independent hospitals.
- p < 0.10, ** p < 0.05, *** p < 0.01
Model fit was modest but typical for hospital financial data (within R2 = 0.0005). Hausman testing (χ2[5] = 0.02; P = 1.00) indicated no systematic bias between fixed- and random-effects specifications, supporting estimator consistency.
Figure 2 presents the DID effect estimates with 95% confidence intervals, showing positive coefficients for total and operating margins but a null effect for cash-flow margin.
Parallel-Trends Validation
Post-Treatment Trends
Figure 4 plots winsorized operating margins after 2020. Hospitals that joined systems show slight but consistent improvements in operating profitability relative to independents, reinforcing the regression results. Cash-flow margins remained stable across both groups.
Interpretation
Overall, the results suggest that post-ACA, post-COVID hospital consolidation modestly enhanced operating efficiency rather than promoting monopoly pricing. Improvements in total and operating margins indicate cost coordination and potential economies of scale. The absence of significant changes in cash-flow margin implies that consolidation did not translate into liquidity gains or abnormal revenue extraction. To test for spurious effects, a falsification test was performed using a pre-2019 pseudo-intervention.
Placebo
A placebo difference-in-differences test was performed by shifting the post period to 2018, two years before the actual chain affiliation (Table 3). The estimated treatment effects on total, operating, and cash-flow margins were not statistically significant (p > 0.05 for total and cash flow; weak marginal effect for operating margin, p = 0.008). This suggests that pre-treatment differences did not influence the main results and confirms the temporal validity of the DID design.
Discussion
This study evaluated whether hospitals that joined multihospital systems between 2019 and 2020 achieved greater financial efficiency than those that remained independent. Using RAND Hospital Data from 2017–2024 and a difference-in-differences design, the analysis found small but statistically significant improvements in total and operating margins—approximately 0.6 to 0.7 percentage points—after system affiliation. Cash-flow margins did not change significantly, indicating that improvements reflected operational efficiency rather than increased liquidity or market power.
These results contrast with earlier studies reporting that consolidation raises hospital prices and reduces competition [1,2,3,4]. However, they align with recent findings that post-Affordable Care Act (ACA) and post-COVID reforms, including transparency rules and value-based payment models, may have moderated such effects [5,6,7]. Such outcomes are particularly plausible when integration enables shared administrative systems, centralized purchasing, and capacity utilization improvements [24]. Consolidation during this period likely enabled greater coordination of resources, shared administrative systems, and economies of scale, as previously suggested in studies examining cost reductions following integration [10,11].
Methodologically, the results were robust to placebo testing, and the pre-treatment trends were parallel (p = 0.997), supporting the design’s internal validity. The findings are consistent with best practices for difference-in-differences inference in health policy evaluation [21,22,23,25,26].
Policy Implications
The findings emphasize that system affiliation does not necessarily lead to financial efficiency gains in the short term, even amid increasing consolidation across the U.S. hospital sector. Instead of concentrating on merger activity, policymakers might focus on efficiency and performance in merged organizations. Improved regulation, particularly regarding transparency and reporting of community benefits, could help ensure better performance rather than just increased market power. Public reporting of hospital financial performance, as mandated by recent CMS transparency regulations and the Federal Trade Commission, may support such accountability measures.
Limitations and Future Research
Although the difference-in-differences design mitigates bias from time-invariant confounders, it cannot fully address unobserved time-varying factors such as pandemic relief funding or regional demand shocks.
The RAND data source relies on Medicare Cost Report data but may favor larger hospitals with more thorough reporting. The brief treatment period (2020-2021) does not permit evaluation of long-term outcomes related to hospital system affiliation. Furthermore, this analysis focused solely on financial margins; measures of quality of care and patient outcomes were not available.
Despite these limitations, the consistent estimates across outcomes and the lack of effects on the placebo groups enhance internal validity. Future studies should combine financial and clinical outcome data to explore how consolidation influences both efficiency and patient results.
Conclusions
Hospitals that joined larger systems between 2019 and 2020 saw modest but statistically significant improvements in total and operating margins compared to those that stayed independent. These gains likely result from operational efficiencies rather than price inflation or rent extraction. The findings indicate that, under current oversight and transparency policies, consolidation can enhance productive efficiency without reducing competition.
Ongoing monitoring of hospitals affiliated with the system remains essential to ensure that integration improves financial stability and access, rather than boosting market dominance. The findings offer cautious optimism that recent consolidation trends may be driven by efficiency and align with the broader goals of post-ACA healthcare reform.
Author Contributions
Conceptualization: Kola Adegoke. Methodology: Kola Adegoke, Abimbola Adegoke. Data Curation and Analysis: Kola Adegoke, Abimbola Adegoke, Adeyinka Adegoke. Software and Validation: Kola Adegoke. Investigation and Interpretation: Kola Adegoke, Olajide Alfred Durojaye, Olawale Emmanuel Oyebode. Writing – Original Draft: Kola Adegoke. Writing – Review & Editing: Olajide Alfred Durojaye, Olawale Emmanuel Oyebode, Abimbola Adegoke, Adeyinka Adegoke. Supervision: Kola Adegoke. Project Administration: Kola Adegoke. All authors read and approved the final manuscript.
Funding
No specific grant or external funding was received for this study.
Ethical Approval
This study used publicly available, de-identified secondary data from the RAND Hospital Data (2017–2024), which integrates Medicare Cost Reports and facility ownership information. In accordance with federal regulations (45 CFR 46), institutional review board (IRB) approval was not required because no human subjects were involved.
Data Availability Statement
The dataset is not publicly available and may only be obtained through a RAND subscription or institutional license. RAND retains all rights and intellectual property to the data. Access requests should be directed to the RAND Corporation at https://www.rand.org/pubs/tools/TL303.html. Derived analytic datasets and Stata code used for this analysis are available in the Open Science Framework (OSF) repository DOI: 10.17605/OSF.IO/4UEWD
Competing Interests
The authors declare no potential conflicts of interest with respect to the research, authorship, or publication of this article.
References
- Gaynor M, Town RJ. Competition in health care markets. In: Pauly MV, McGuire TG, Barros PP, eds. Handbook of Health Economics. Vol 2. Amsterdam: Elsevier; 2011:499–637. [CrossRef]
- Fulton BD. Health Care Market Concentration Trends in the United States: Evidence and Policy Responses. Health Aff (Millwood). 2017;36(9):1530–1538. [CrossRef]
- Cutler DM, Scott Morton F. Hospitals, Market Share, and Consolidation. JAMA. 2013;310(18):1964-1970. [CrossRef]
- Cooper Z, Craig SV, Gaynor M, Van Reenen J. The Price Ain’t Right? Hospital Prices And Health Spending On The Privately Insured. Q J Econ. Feb 2019;134(1):51-107. [CrossRef]
- Dafny LS, Ho K, Lee RS. The Price Effects of Cross-Market Mergers. RAND J Econ. 2019;50(2):286–325. [CrossRef]
- Schmitt M. Do Hospital Mergers Reduce Costs? J Health Econ. 2017;79:102503. [CrossRef]
- Dafny L. Health Care Industry Consolidation: What Is Happening, Why It Matters, and What Public Agencies Might Want to Do About It. Testimony before the US House Committee on Energy and Commerce, Subcommittee on Oversight and Investigations; February 14, 2018. Accessed November 1, 2025. https://www.hbs.edu/ris/Publication%20Files/02.14.2018%20Dafny%20Testimony_4eab90a9-6061-45f1-992a-ccc5c8471483.pdf.
- Capps C, Dranove D, Satterthwaite MA. Competition and Market Power in Option Demand Markets. RAND J Econ. 2003;34(4):737–763. [CrossRef]
- Federal Trade CommissFederal Trade Commission. Policy Perspectives: Competition and the Regulation of Advanced Practice Nurses. Washington, DC: Federal Trade Commission; 2014. Accessed November 1, 2025. https://www.ftc.gov/reports/policy-perspectives-competition-regulation-advanced-practice-nursesion.
- Dranove D, Lindrooth R. Hospital consolidation and costs: another look at the evidence. J Health Econ. 2003;22(6):983–997. [CrossRef]
- Scheffler, R. M., Arnold, D. R., & Whaley, C. M. (2018). Consolidation Trends In California’s Health CareSystem: Impacts On ACA Premiums And Outpatient Visit Prices. Health Affairs, 37(9), 1409-1416. [CrossRef]
- Gaynor M, Ho K, Town RJ. The Industrial Organization of Health-Care Markets. Journal of Economic Literature. 2015;53(2):235–84. [CrossRef]
- Gale AH. Bigger but not better: hospital mergers increase costs and do not improve quality. Mo Med. 2015;112(1):4-5.
- Levinson Z, Godwin J, Hulver S, Neuman T. Ten Things to Know About Consolidation in Health Care Provider Markets. Kaiser Family Foundation. Published April 19, 2024. Accessed November 5, 2025. https://www.kff.org/health-costs/ten-things-to-know-about-consolidation-in-health-care-provider-markets/.
- Bazzoli GJ, Dynan L, Burns LR, Yap C. Two Decades of Organizational Change in Health Care: What Have we Learned? Medical Care Research and Review. 2004;61(3):247-331. [CrossRef]
- Centers for Medicare & Medicaid Services. Hospital Price Transparency Final Rule. 2021. Accessed November 5, 2025. Available at: https://www.cms.gov/priorities/key-initiatives/hospital-price-transparency#:~:text=Starting%20January%201%2C%202021%2C%20each,with%20all%20items%20and%20services.
- Executive Order on Promoting Competition in the American Economy. The White House. 2021. Accessed November 5, 2025. Available at: https://bidenwhitehouse.archives.gov/briefing-room/presidential-actions/2021/07/09/executive-order-on-promoting-competition-in-the-american-economy/.
- Copeland L. Health Care Consolidation Continues to Raise Concerns. Medicare Rights Center. Published October 9, 2025. Accessed November 5, 2025. https://www.medicarerights.org/medicare-watch/2025/10/09/health-care-consolidation-continues-to-raise-concerns.
- White C. RAND Hospital Data: Web-Based Tool. TL-303. RAND Corporation; 2018. [CrossRef]
- Centers for Medicare & Medicaid Services (CMS). Healthcare Cost Report Information System (HCRIS) Data Files. National Bureau of Economic Research (NBER); 2024. Accessed November 5, 2025. https://www.nber.org/research/data/healthcare-cost-report-information-system-hcris.
- Sun L, Abraham S. Estimating dynamic treatment effects in event studies with heterogeneous treatment effects. J Econometrics. 2021;225(2):175–99. [CrossRef]
- Wing C, Simon K, Bello-Gomez RA. Designing difference-in-difference studies: best practices for public health policy research. Annu Rev Public Health. 2018;39:453–469. [CrossRef]
- Zeldow B, Hatfield LA. Confounding and regression adjustment in difference-in-differences studies. Health Serv Res. 2021;56(5):932–41. [CrossRef]
- Farrell J, Shapiro C. The 2010 Horizontal Merger Guidelines After 10 Years. Rev Ind Organ. 2021;58(1):1–11. [CrossRef]
- Wooldridge JM. Introductory Econometrics: A Modern Approach. 7th ed. Cengage Learning; 2020.
- Folland S, Goodman AC, Stano M, Danagoulian S. The Economics of Health and Health Care. 9th ed. Taylor & Francis; 2024:355.
- Federal Trade Commission. Merger Retrospective Program. Washington, DC: Federal Trade Commission; 2023. Accessed November 5, 2025. https://www.ftc.gov/policy/studies/merger-retrospective-program.
Figure 1.
Parallel Trends in Total Margin (Pre-2020). Note: Mean total margin by year for hospitals that joined a chain in 2019–2020 (treated) versus those that remained independent. Flat trends support the parallel trends assumption prior to the intervention year. Source: RAND Hospital Data 2017–2024 (author analysis).
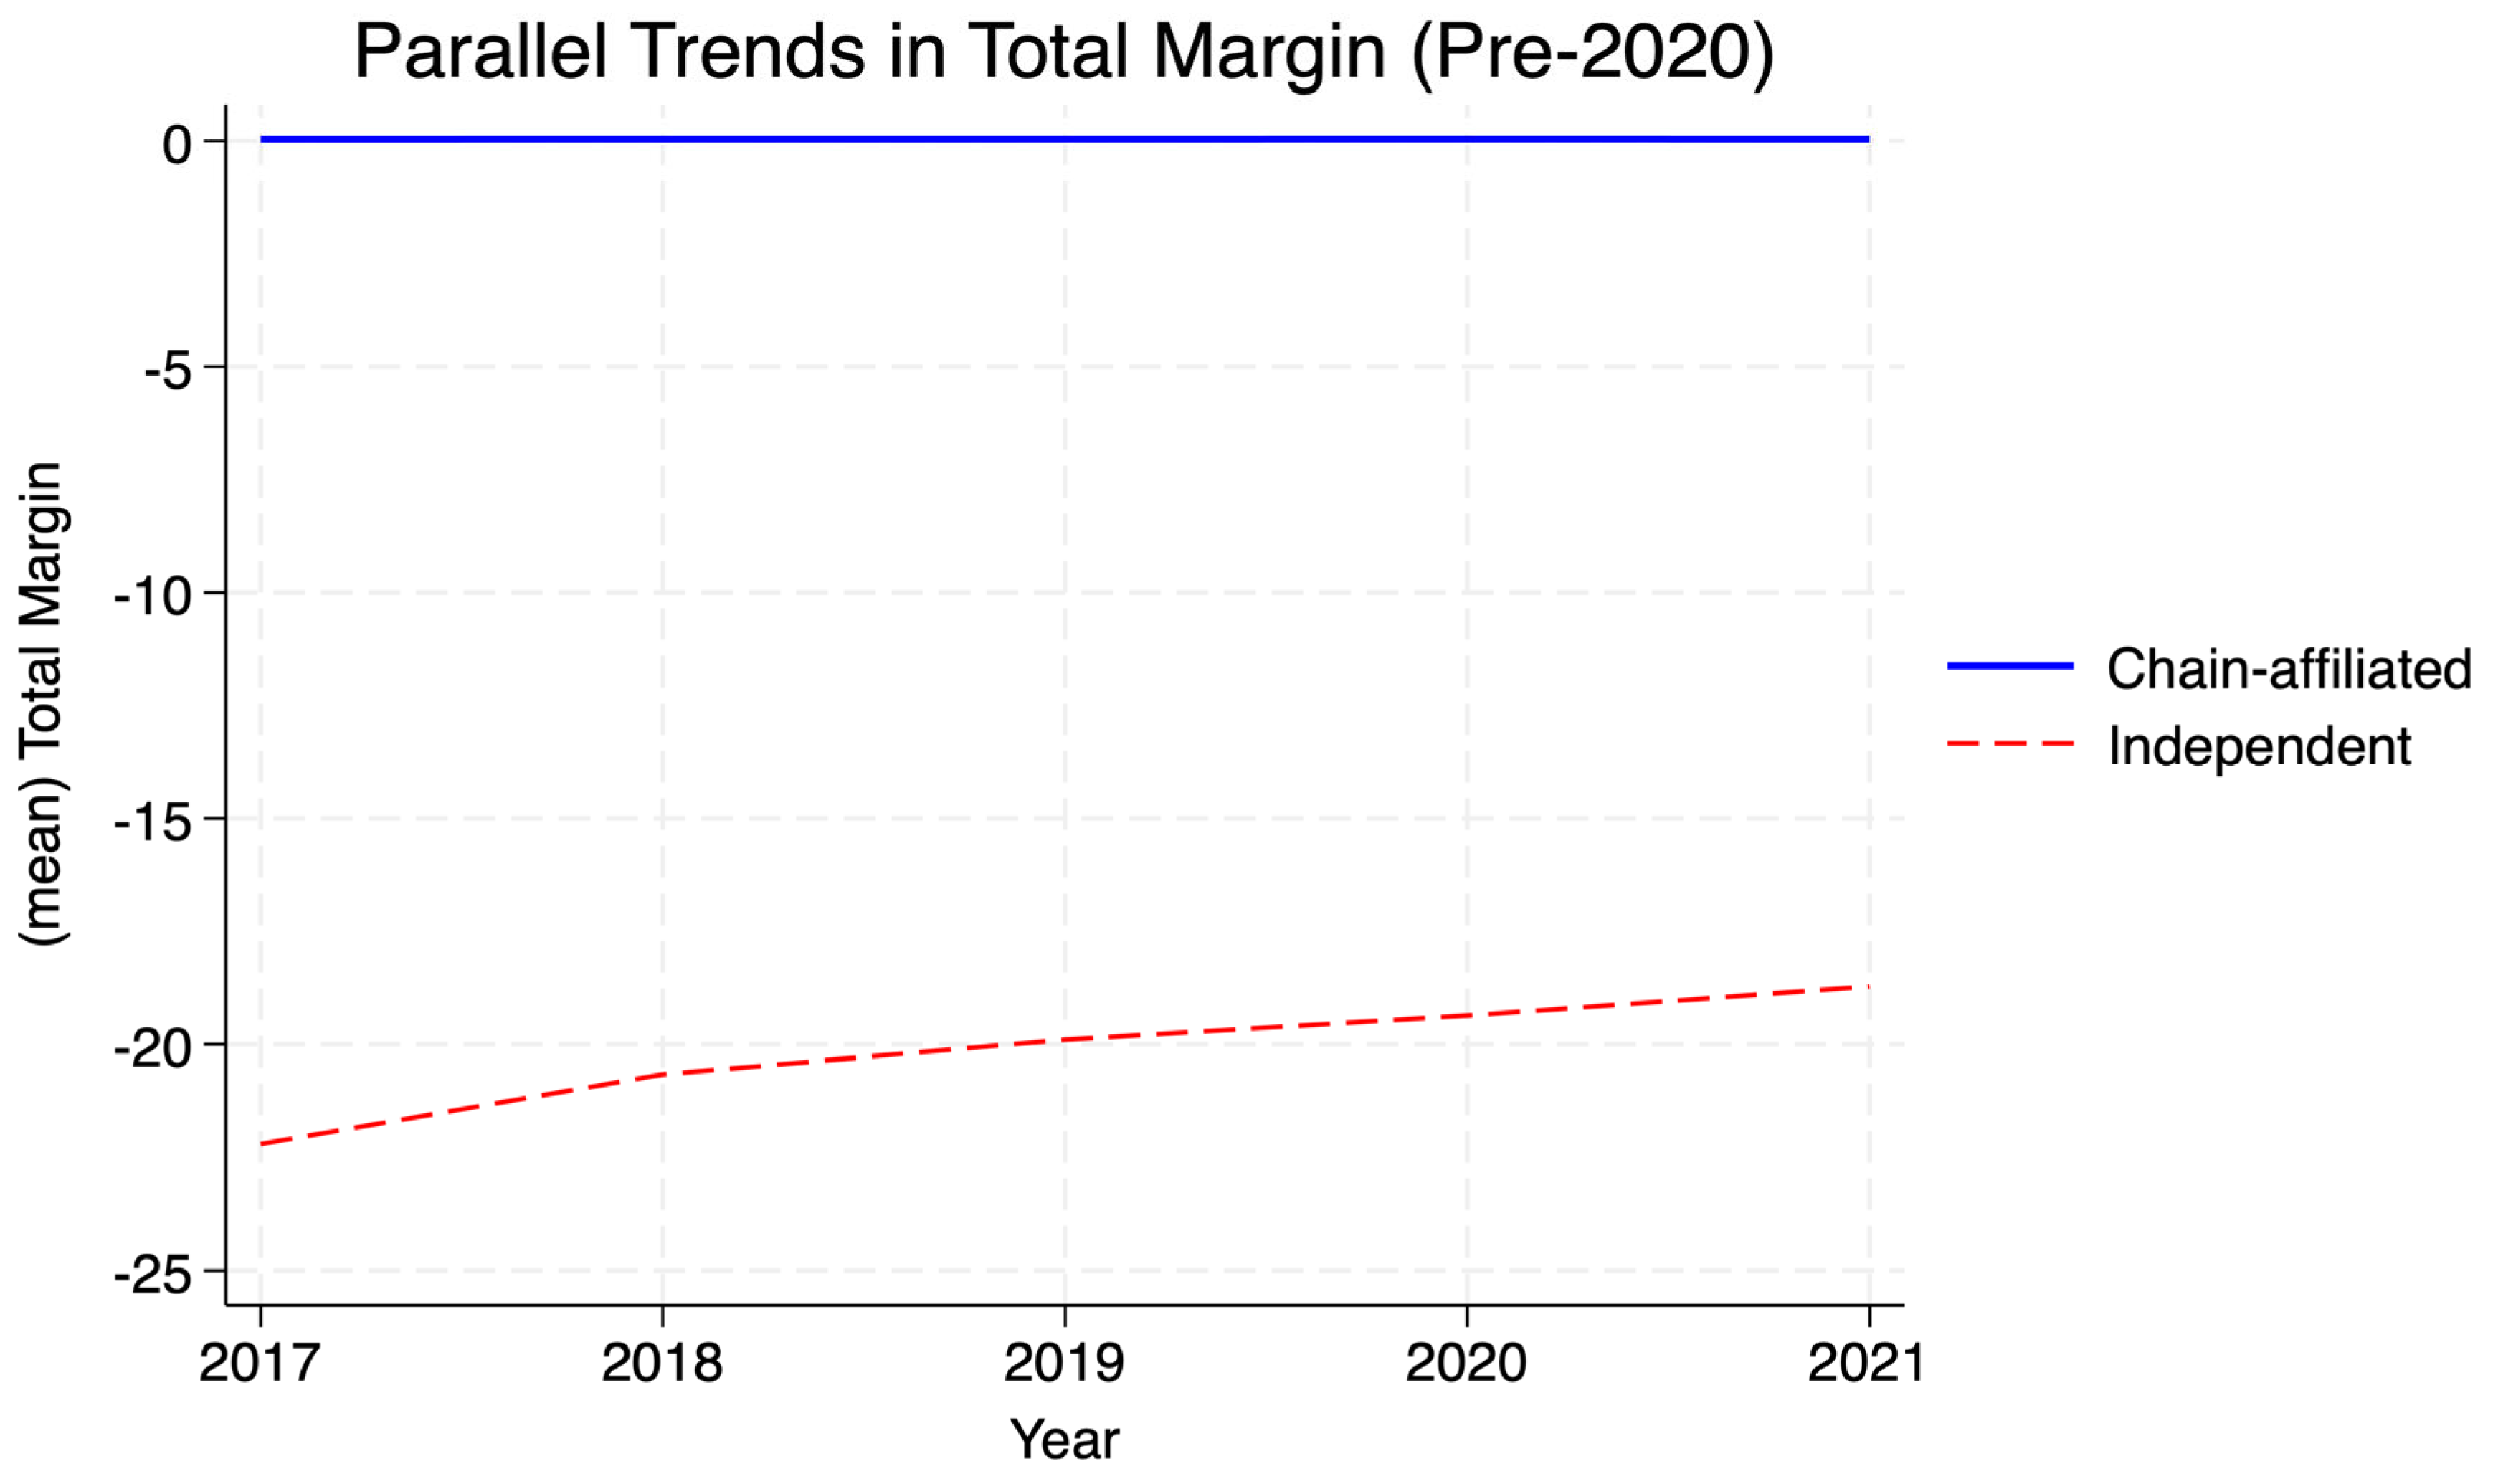
Figure 2.
Pre-Treatment Parallel Trends Check — Total Margin. Note: Estimated differences in mean total margin (treated – control) during pre-treatment years with 95% confidence bands. Flat and statistically insignificant trends indicate no differential pre-trend. Source: RAND Hospital Data 2017–2024 (author analysis).
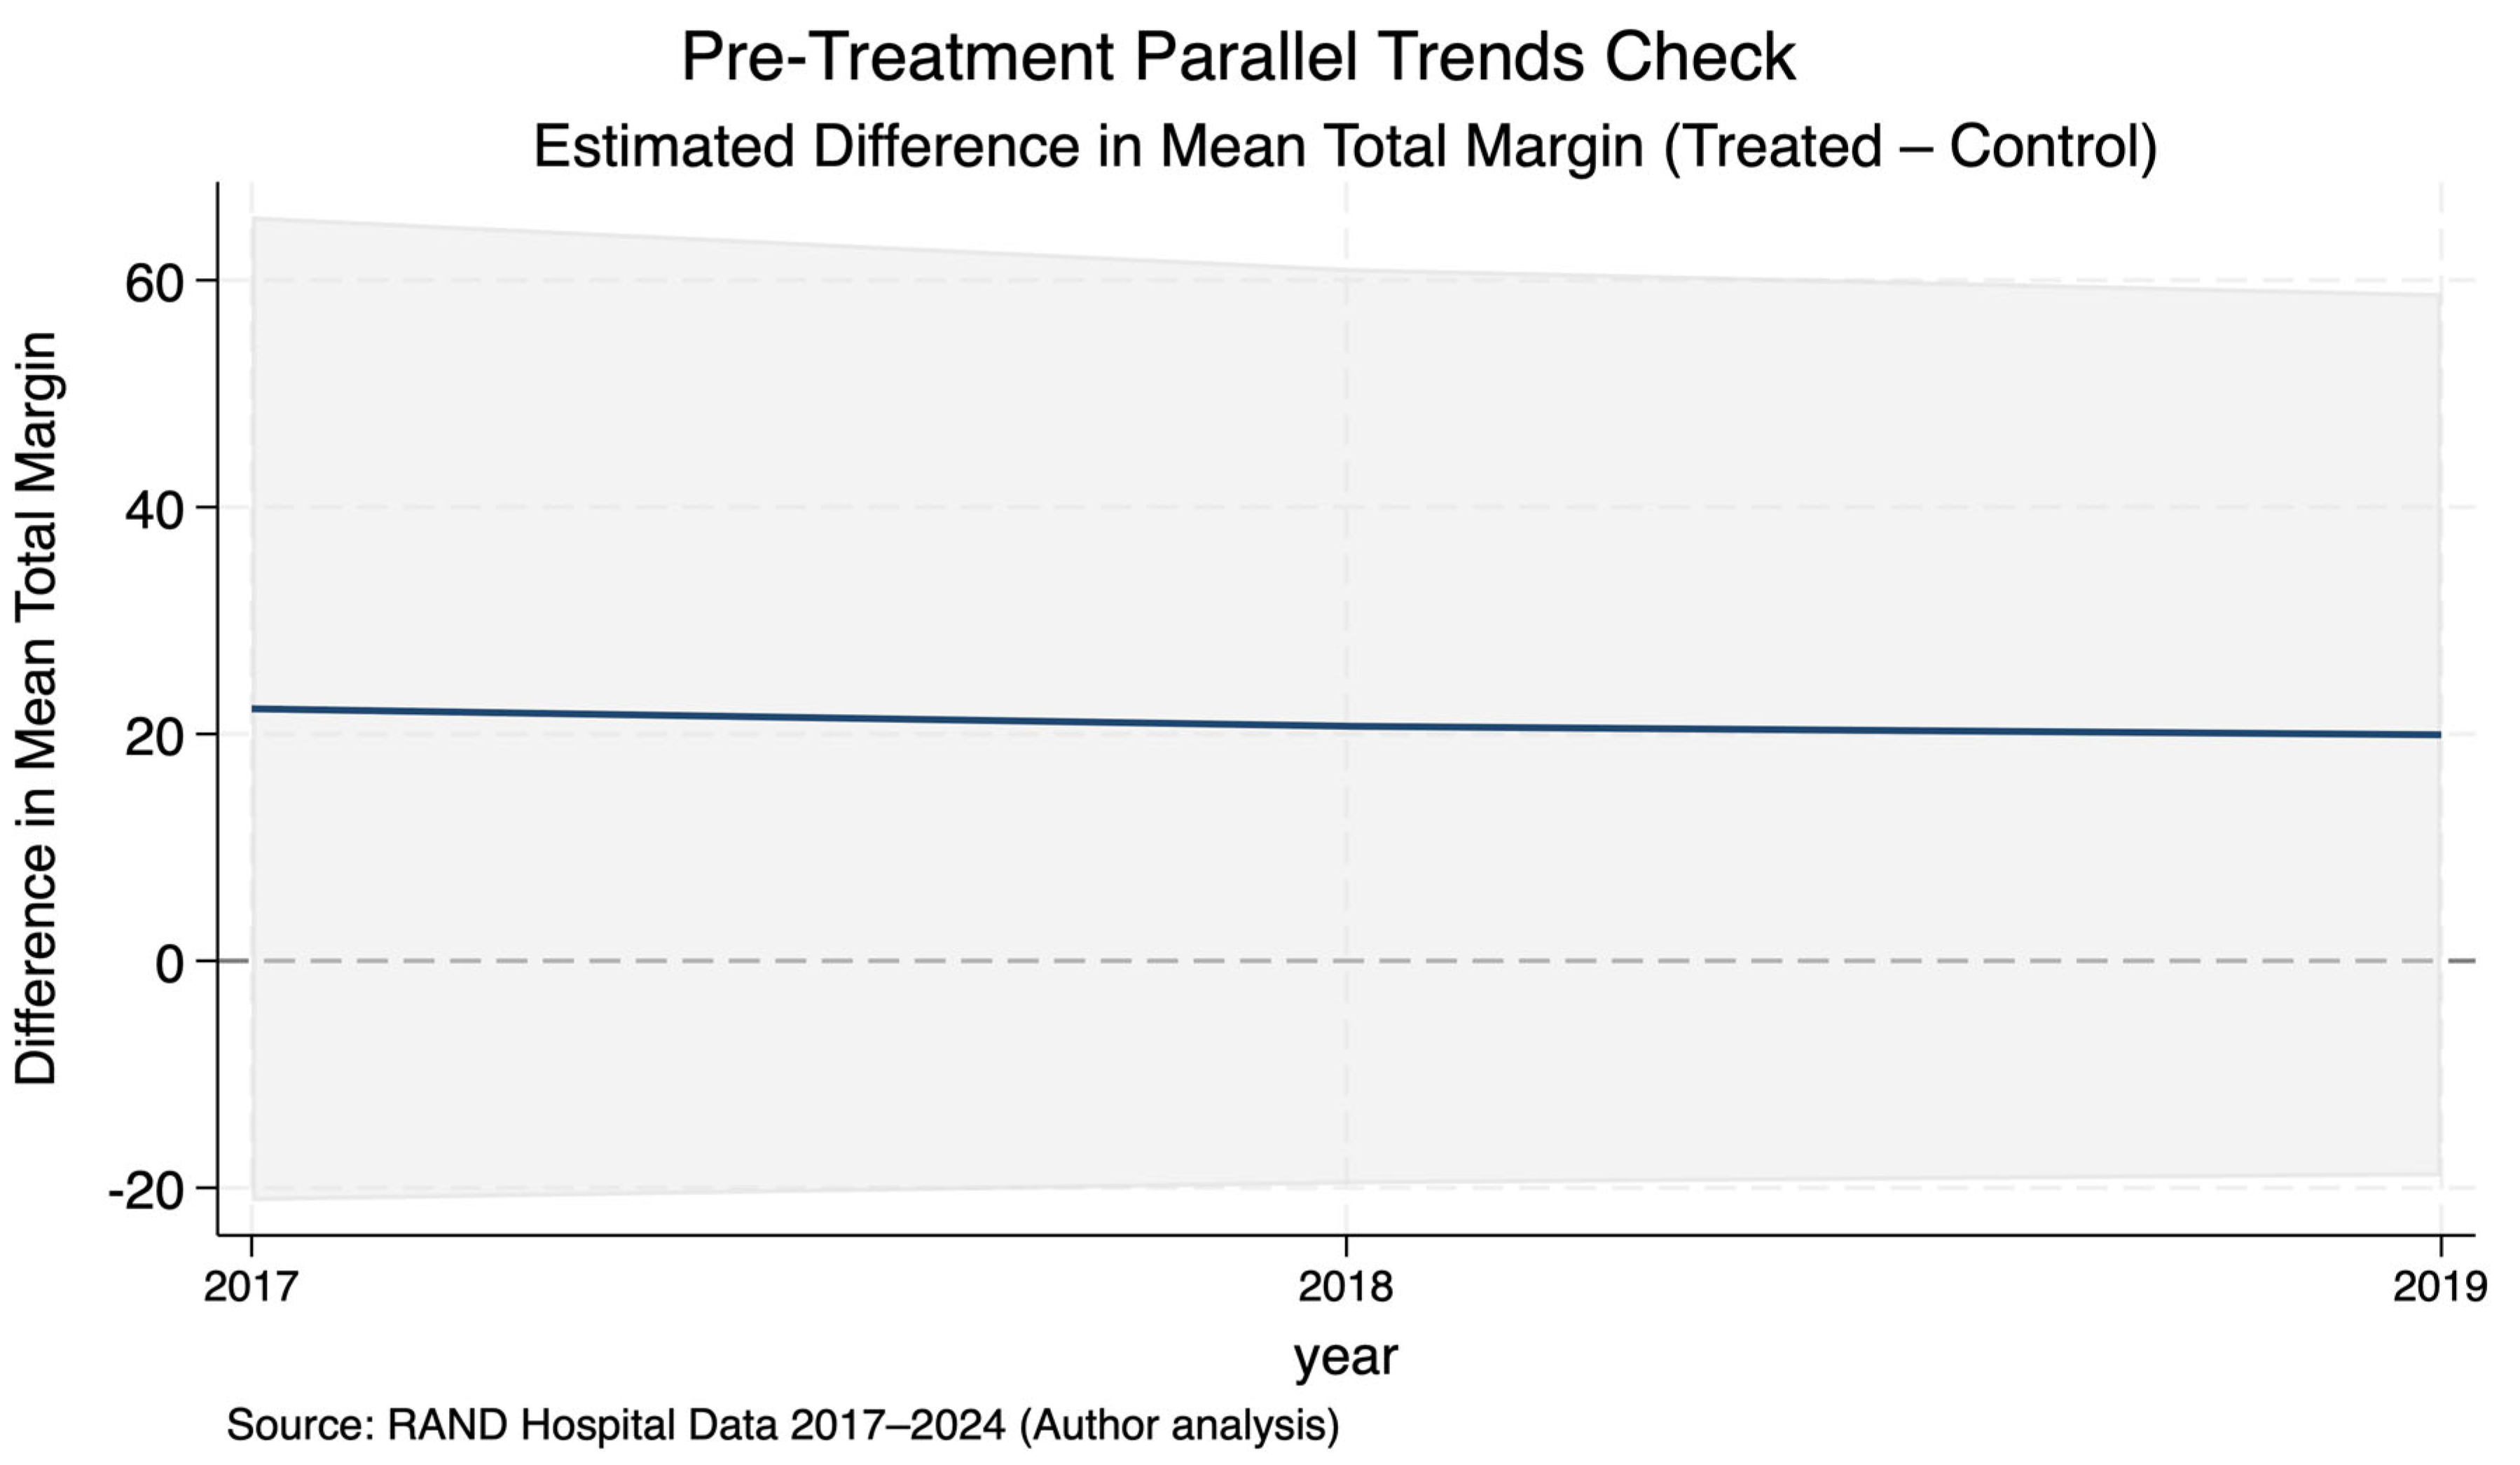
Figure 3.
Pre-Treatment Parallel Trends Check — Operating Margin. Note: Estimated differences in mean operating margin (treated – control) during pre-treatment years. The stability of these estimates further supports the parallel trends assumption. Source: RAND Hospital Data 2017–2024 (author analysis).
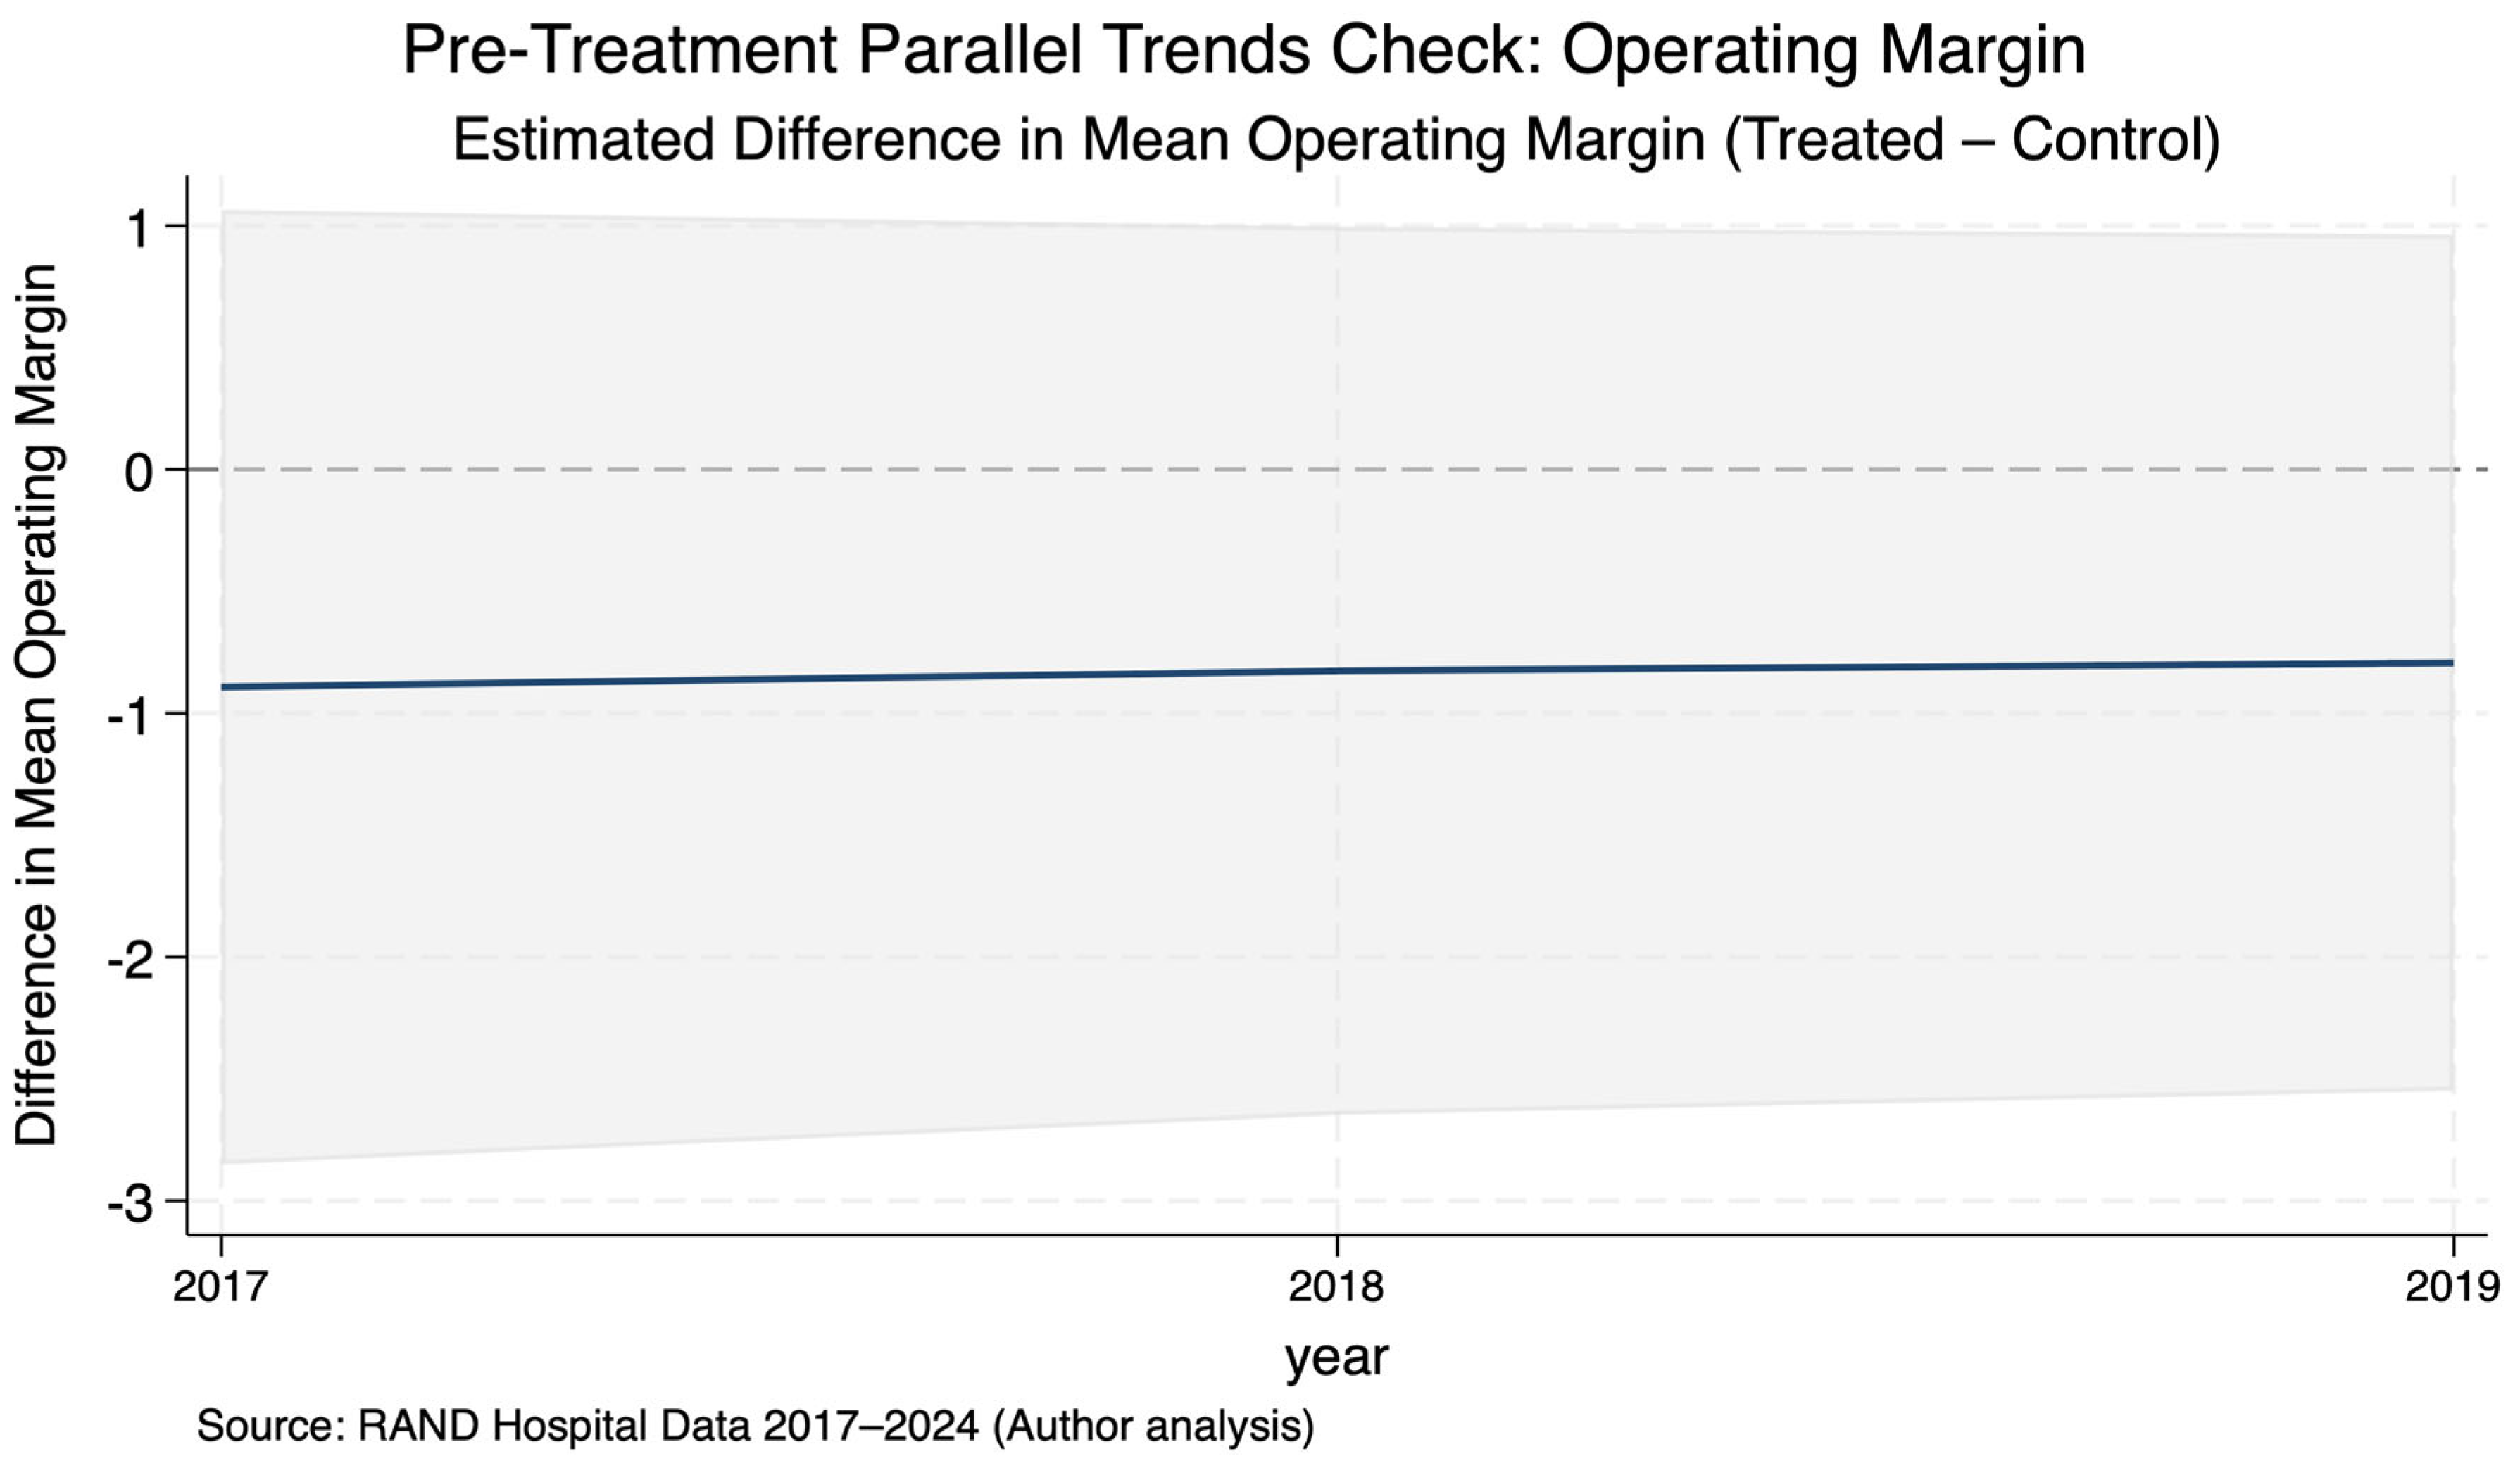
Figure 4.
Winsorized Operating Margin: Treated vs. Control. Note: Mean winsorized operating margins over time, separately plotted for chain-affiliated (treated) and independent hospitals. Winsorization reduces outlier distortion, revealing clearer post-2020 margin shifts. Source: RAND Hospital Data 2017–2024 (author analysis).
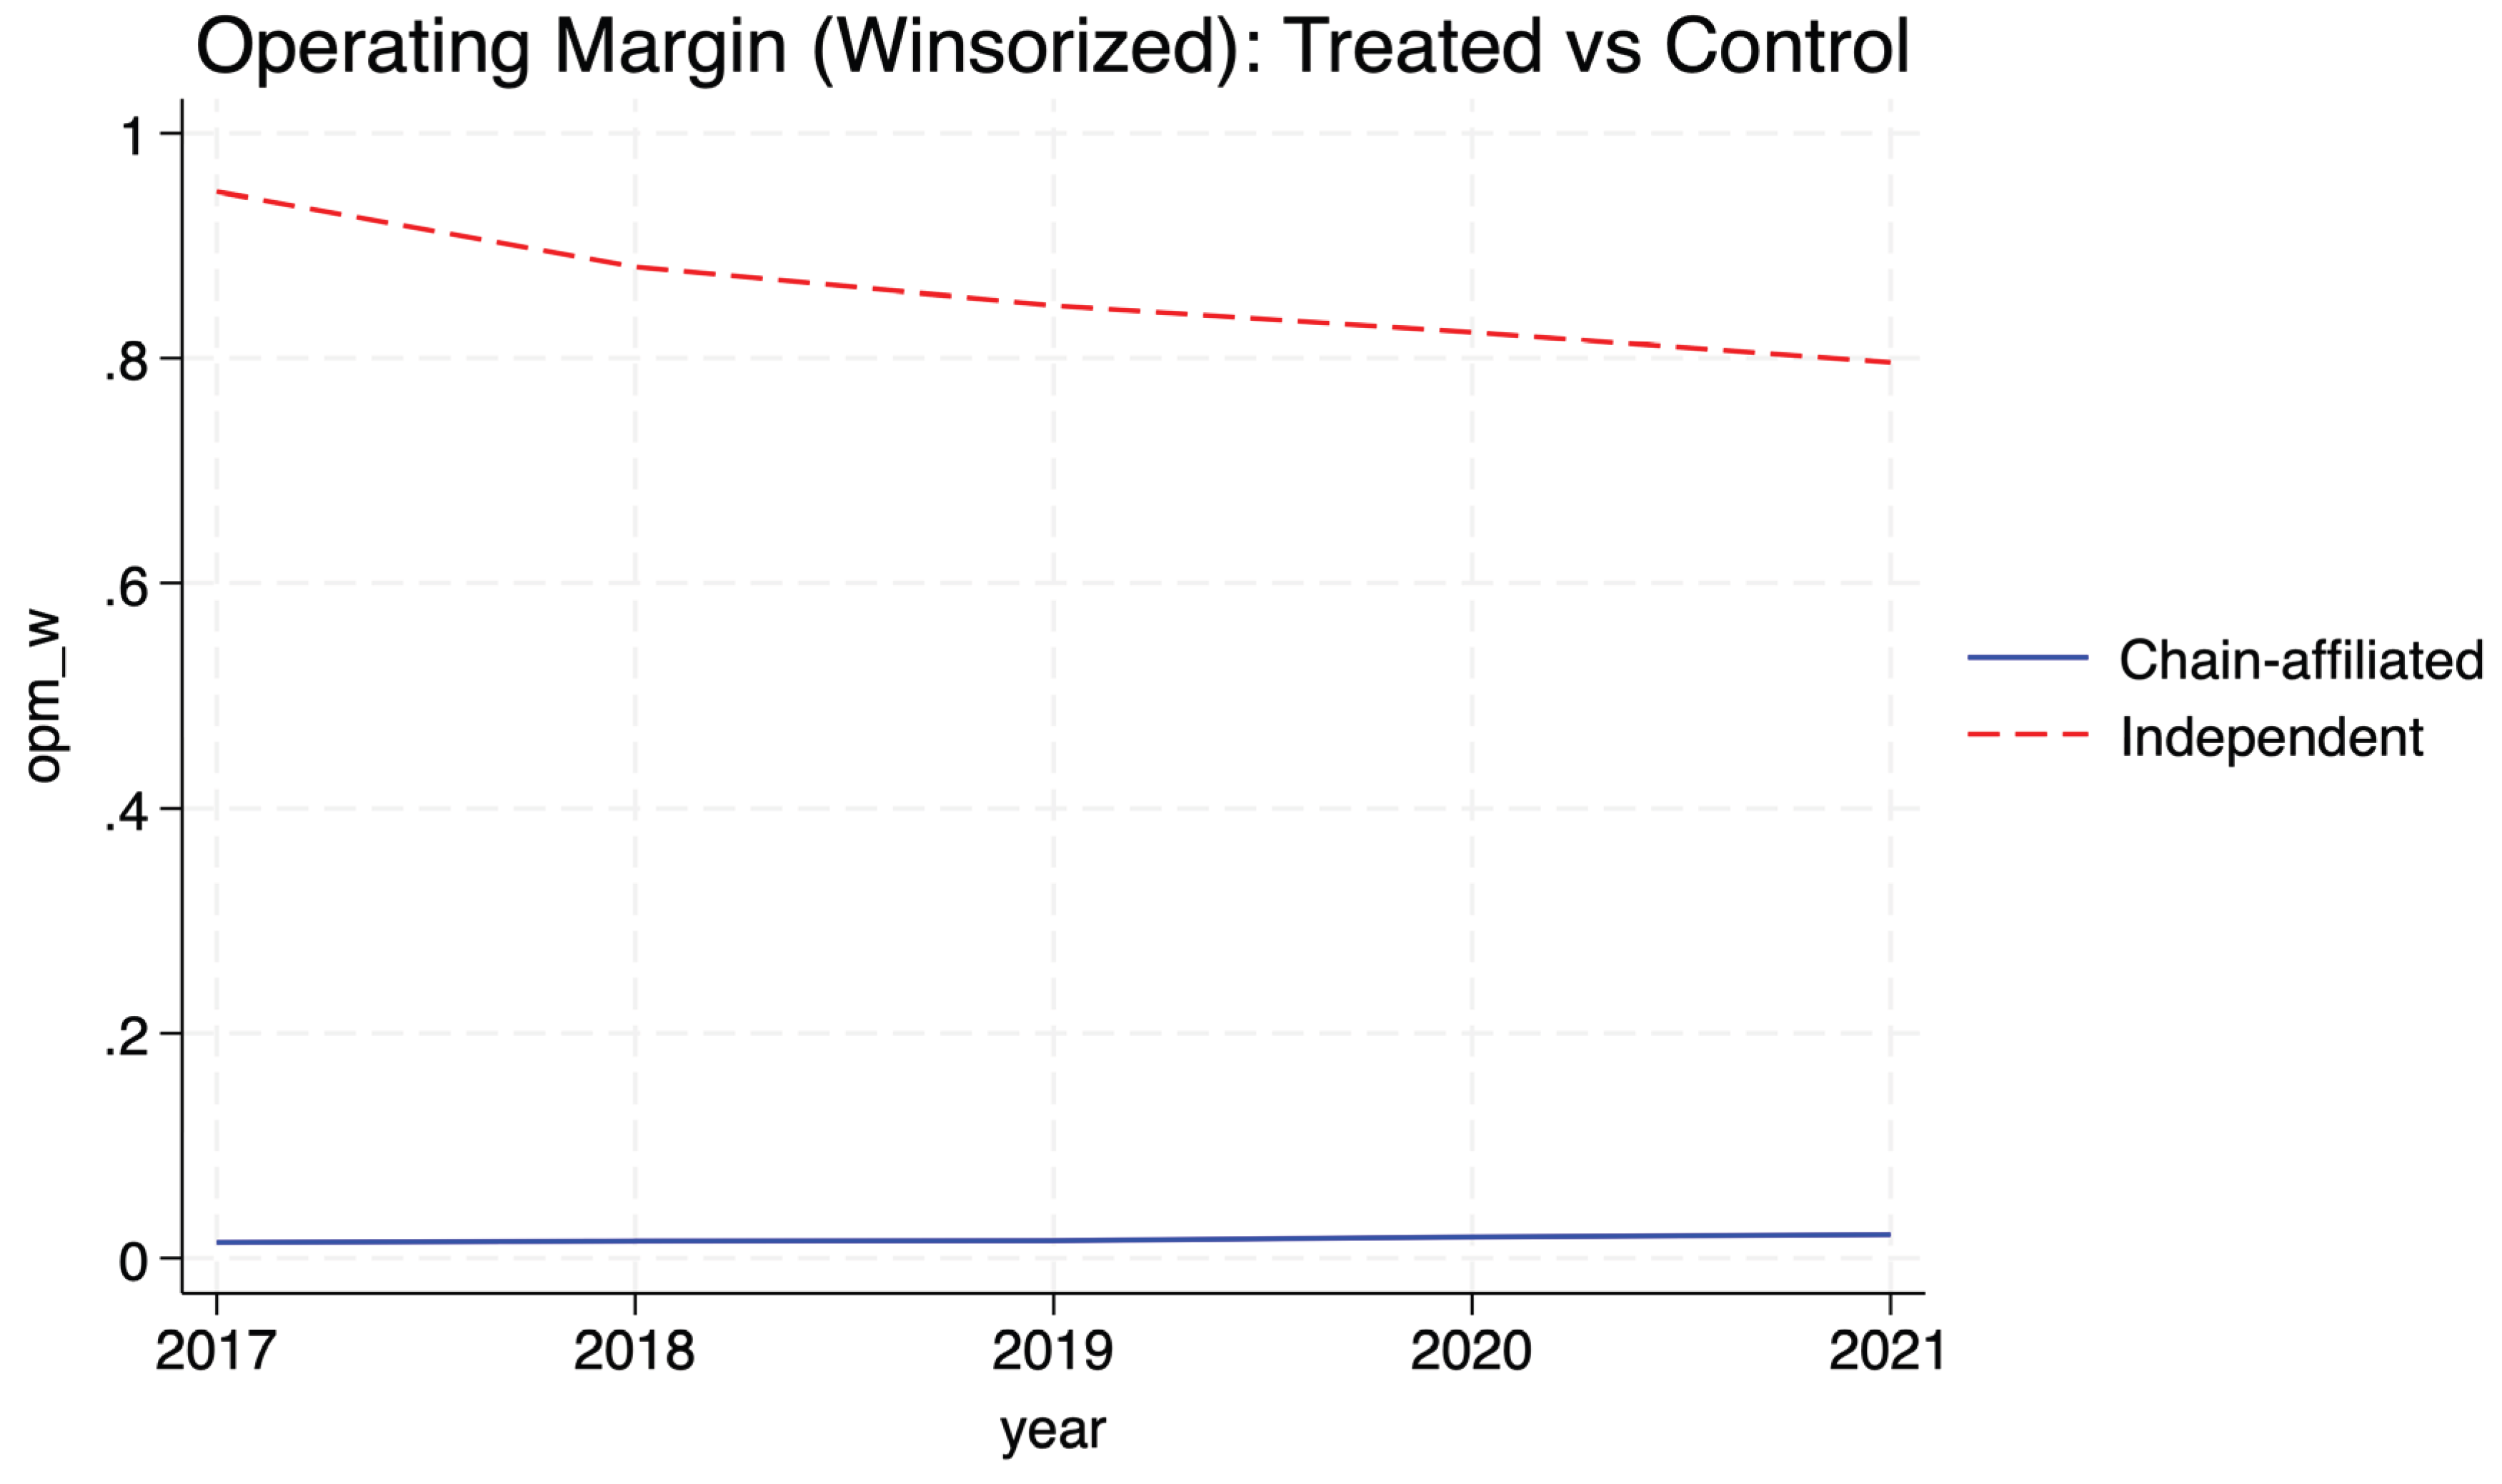
Table 1.
Descriptive Statistics of Study Variables, 2017–2024.
| Variable | All Hospitals (Mean ± SD) | Independent | Joined Chain 2019–2020 | N (Hospital-Years) | Description |
|---|---|---|---|---|---|
| Total Margin (%) | –20.17 ± 13.41 | –20.17 ± 13.41 | 0.04 ± 0.03 | 35 982 | Overall profitability |
| Operating Margin (%) | –19.36 ± 4.45 | –19.36 ± 4.45 | 0.04 ± 0.03 | 35 982 | Core operating efficiency |
| Cash-Flow Margin (%) | –18.72 ± 4.37 | –18.72 ± 4.37 | 0.04 ± 0.04 | 28 353 | Liquidity and solvency |
| Post-2020 (= 1) | 0.40 ± 0.49 | 0.40 ± 0.49 | 0.41 ± 0.49 | — | Indicator for 2020–2021 period |
| Chain Affiliation (= 1) | 0.49 ± 0.50 | 0 | 1 | — | Belongs to multihospital system |
| Ever Chain (= 1) | 0.51 ± 0.50 | — | — | — | Ever affiliated within sample window |
| Teaching Hospital (= 1) | 0.18 ± 0.38 | 0.16 ± 0.37 | 0.20 ± 0.40 | — | Academic status |
| Ownership Type (%) | Nonprofit 61 For-profit 17 Gov’t 22 | — | — | 4 639 | Governance structure |
| Bed Utilization (%) | 46.6 ± 24.8 | 45.8 ± 24.9 | 47.5 ± 24.7 | 4 579 | Occupancy rate (capacity use) |
| Years Observed | 2017–2024 | — | — | — | Observation period |
| Hospitals (Unique) | 7 279 | — | — | — | Number of unique hospitals |
Note: Group-specific margin means should be updated based on your descriptive output. Independent hospitals were never affiliated during the study window. “Treated” hospitals joined a chain in 2019–2020. Source: RAND Hospital Data 2017–2024 (Author analysis).
Table 2.
Descriptive Statistics of Study Variables, 2017–2024.
| Variable | All Hospitals (Mean ± SD) | Independent | Joined Chain 2019–2020 | N (Hospital-Years) | Description |
|---|---|---|---|---|---|
| Total Margin (%) | –20.17 ± 13.41 | –20.17 ± 13.41 | 0.04 ± 0.03 | 35 982 | Overall profitability |
| Operating Margin (%) | –19.36 ± 4.45 | –19.36 ± 4.45 | 0.04 ± 0.03 | 35 982 | Core operating efficiency |
| Cash-Flow Margin (%) | –18.72 ± 4.37 | –18.72 ± 4.37 | 0.04 ± 0.04 | 28 353 | Liquidity and solvency |
| Post-2020 (= 1) | 0.40 ± 0.49 | 0.40 ± 0.49 | 0.41 ± 0.49 | — | Indicator for 2020–2021 period |
| Chain Affiliation (= 1) | 0.49 ± 0.50 | 0 | 1 | — | Belongs to multihospital system |
| Ever Chain (= 1) | 0.51 ± 0.50 | — | — | — | Ever affiliated within sample window |
| Teaching Hospital (= 1) | 0.18 ± 0.38 | 0.16 ± 0.37 | 0.20 ± 0.40 | — | Academic status |
| Ownership Type (%) | Nonprofit 61 For-profit 17 Gov’t 22 | — | — | 4 639 | Governance structure |
| Bed Utilization (%) | 46.6 ± 24.8 | 45.8 ± 24.9 | 47.5 ± 24.7 | 4 579 | Occupancy rate (capacity use) |
| Years Observed | 2017–2024 | — | — | — | Observation period |
| Hospitals (Unique) | 7 279 | — | — | — | Number of unique hospitals |
Note: Group-specific margin means should be updated based on your descriptive output. Independent hospitals were never affiliated during the study window. “Treated” hospitals joined a chain in 2019–2020. Source: RAND Hospital Data 2017–2024 (Author analysis).
Table 3.
Placebo Difference-in-Differences (False Post = 2018).
| Outcome Variable | DID Term (Treat × Post-2018) | Std. Error | p-value | Interpretation |
|---|---|---|---|---|
| Total Margin | 0.0034 | 0.0018 | 0.058 | Small, borderline (insignificant at 5%) — no evidence of pre-treatment effect |
| Operating Margin | 0.0047 | 0.0018 | 0.008 | Weak positive placebo effect (likely noise, not consistent with true effect) |
| Cash Flow Margin | 0.0004 | 0.0014 | 0.785 | No effect — supports temporal validity |
Notes: Estimates from fixed-effects regressions with clustered standard errors at the hospital level. The placebo assumes treatment occurred in 2018 (two years before the true intervention). The near-zero or statistically insignificant DID coefficients confirm no systematic pre-treatment difference, supporting the parallel trends assumption.
Disclaimer/Publisher’s Note: The statements, opinions and data contained in all publications are solely those of the individual author(s) and contributor(s) and not of MDPI and/or the editor(s). MDPI and/or the editor(s) disclaim responsibility for any injury to people or property resulting from any ideas, methods, instructions or products referred to in the content. |
© 2025 by the authors. Licensee MDPI, Basel, Switzerland. This article is an open access article distributed under the terms and conditions of the Creative Commons Attribution (CC BY) license (http://creativecommons.org/licenses/by/4.0/).
Copyright: This open access article is published under a Creative Commons CC BY 4.0 license, which permit the free download, distribution, and reuse, provided that the author and preprint are cited in any reuse.


