Submitted:
16 October 2025
Posted:
22 October 2025
You are already at the latest version
Abstract
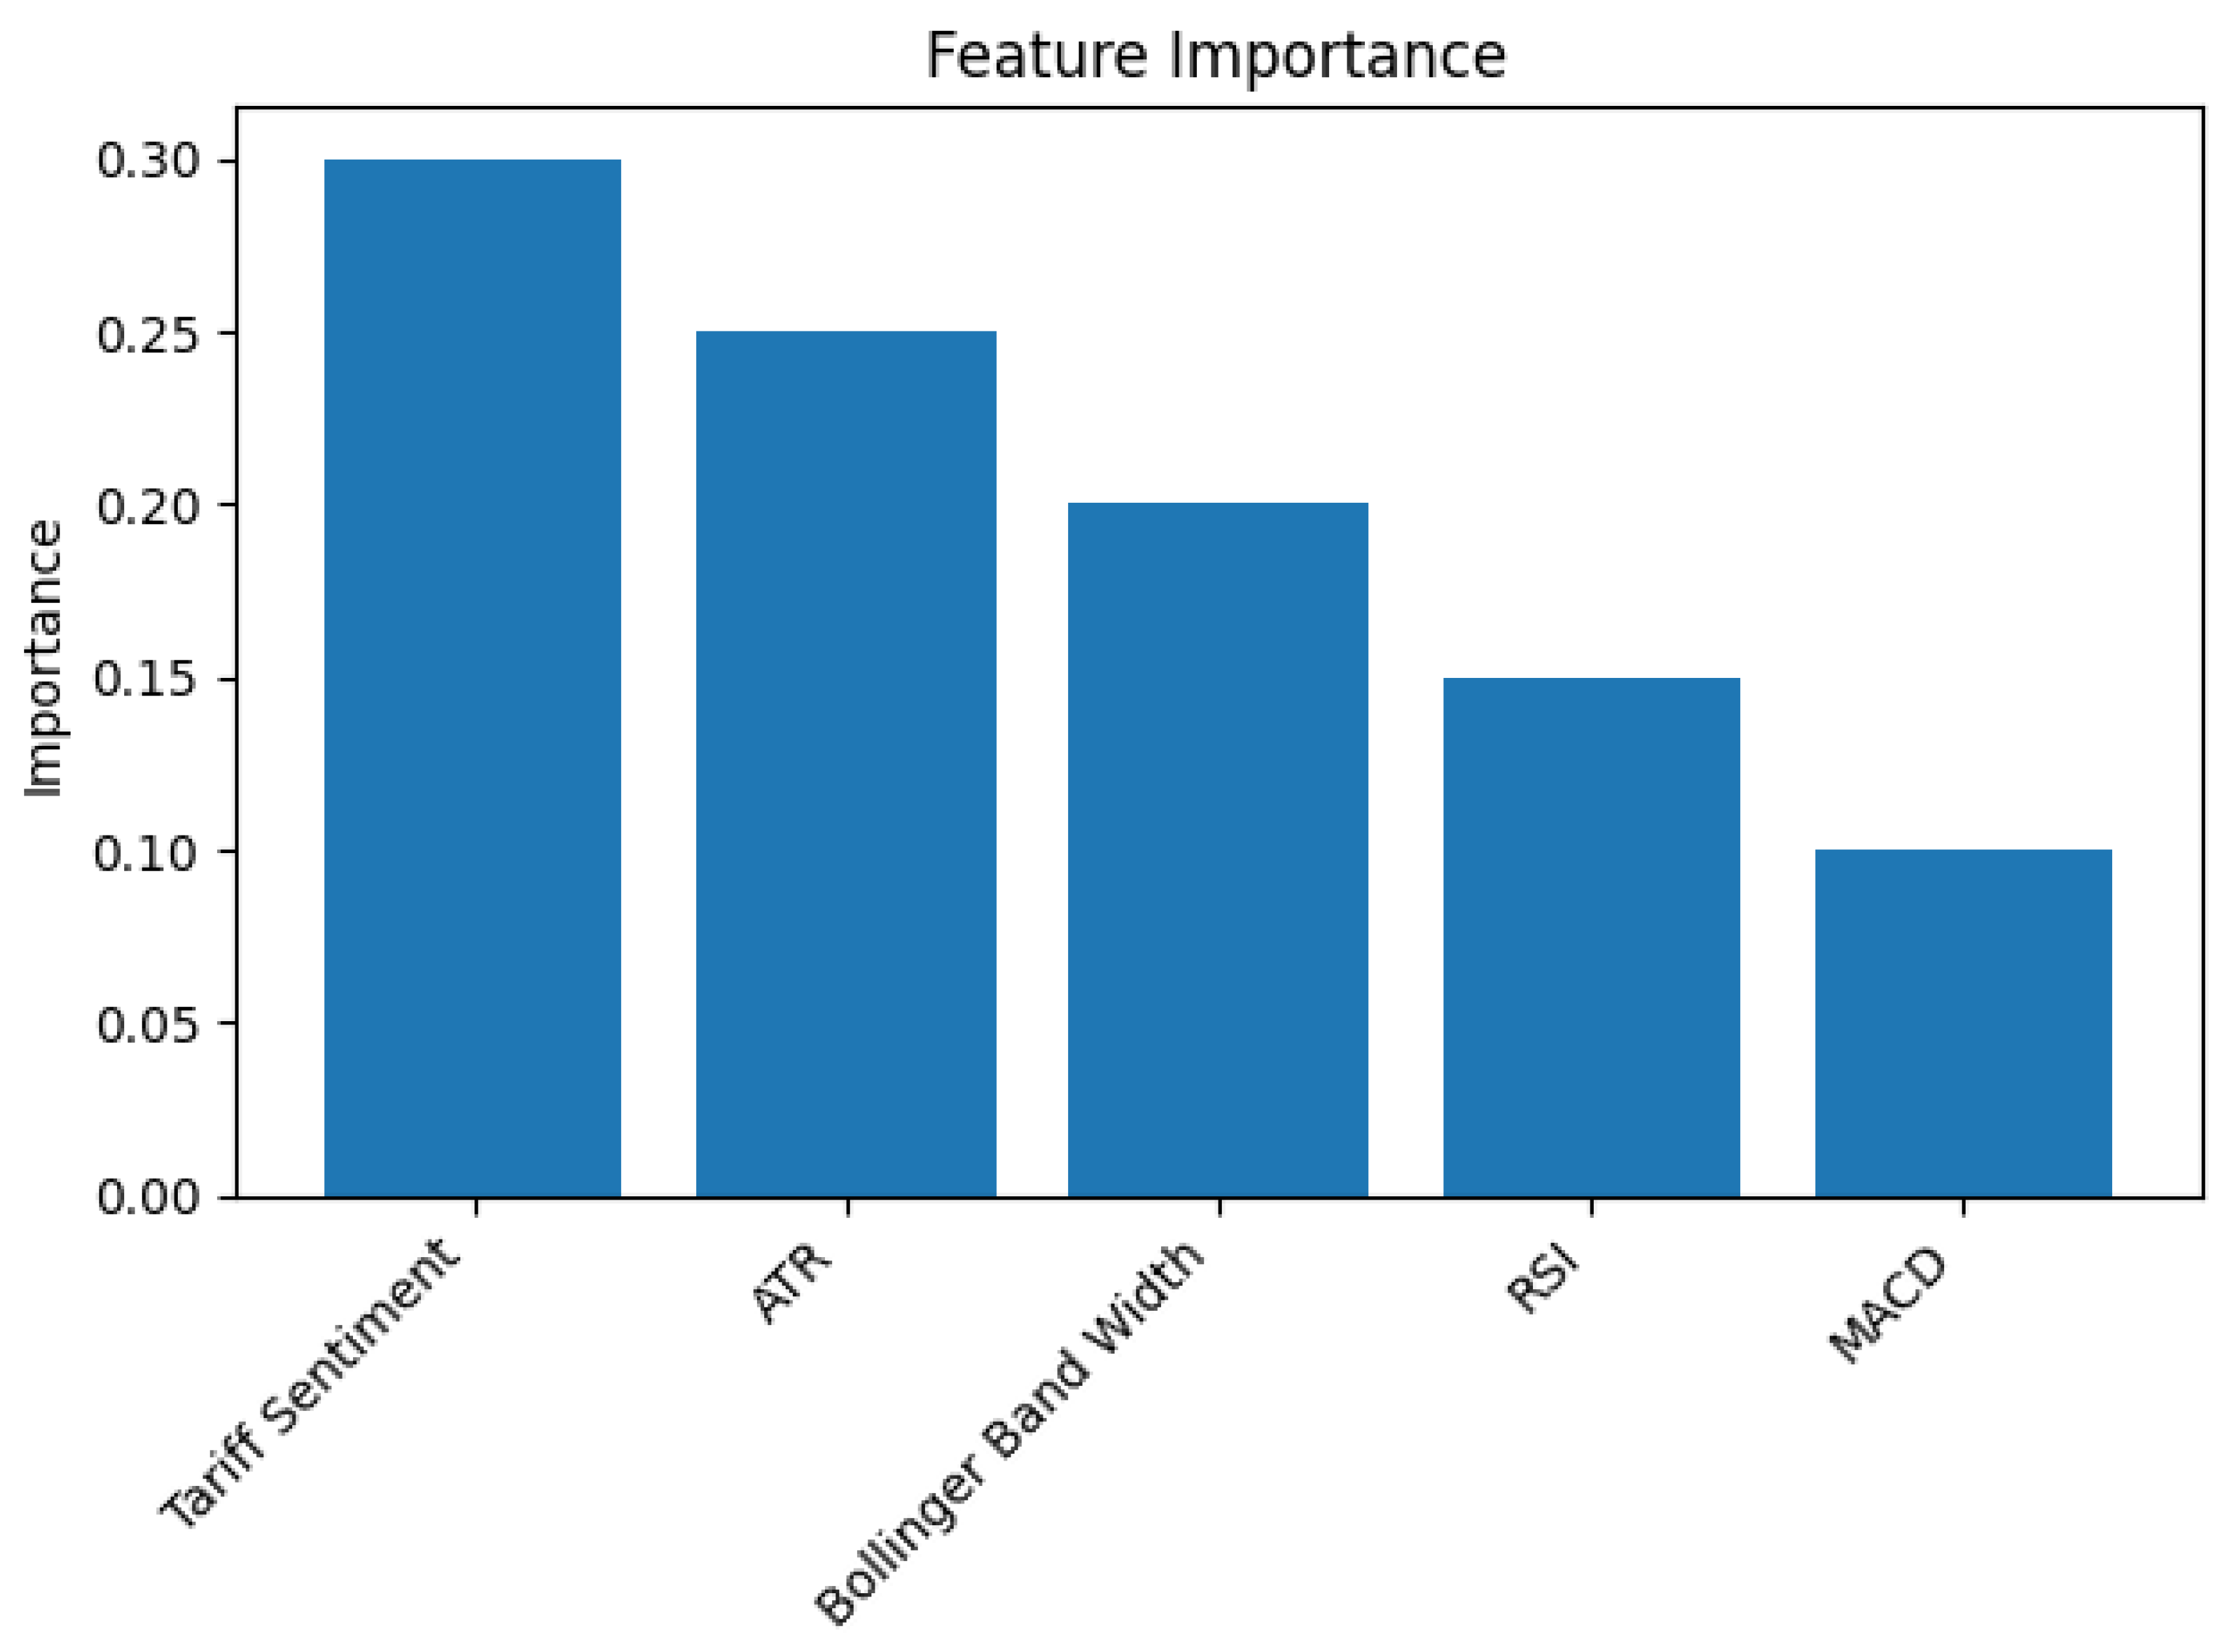
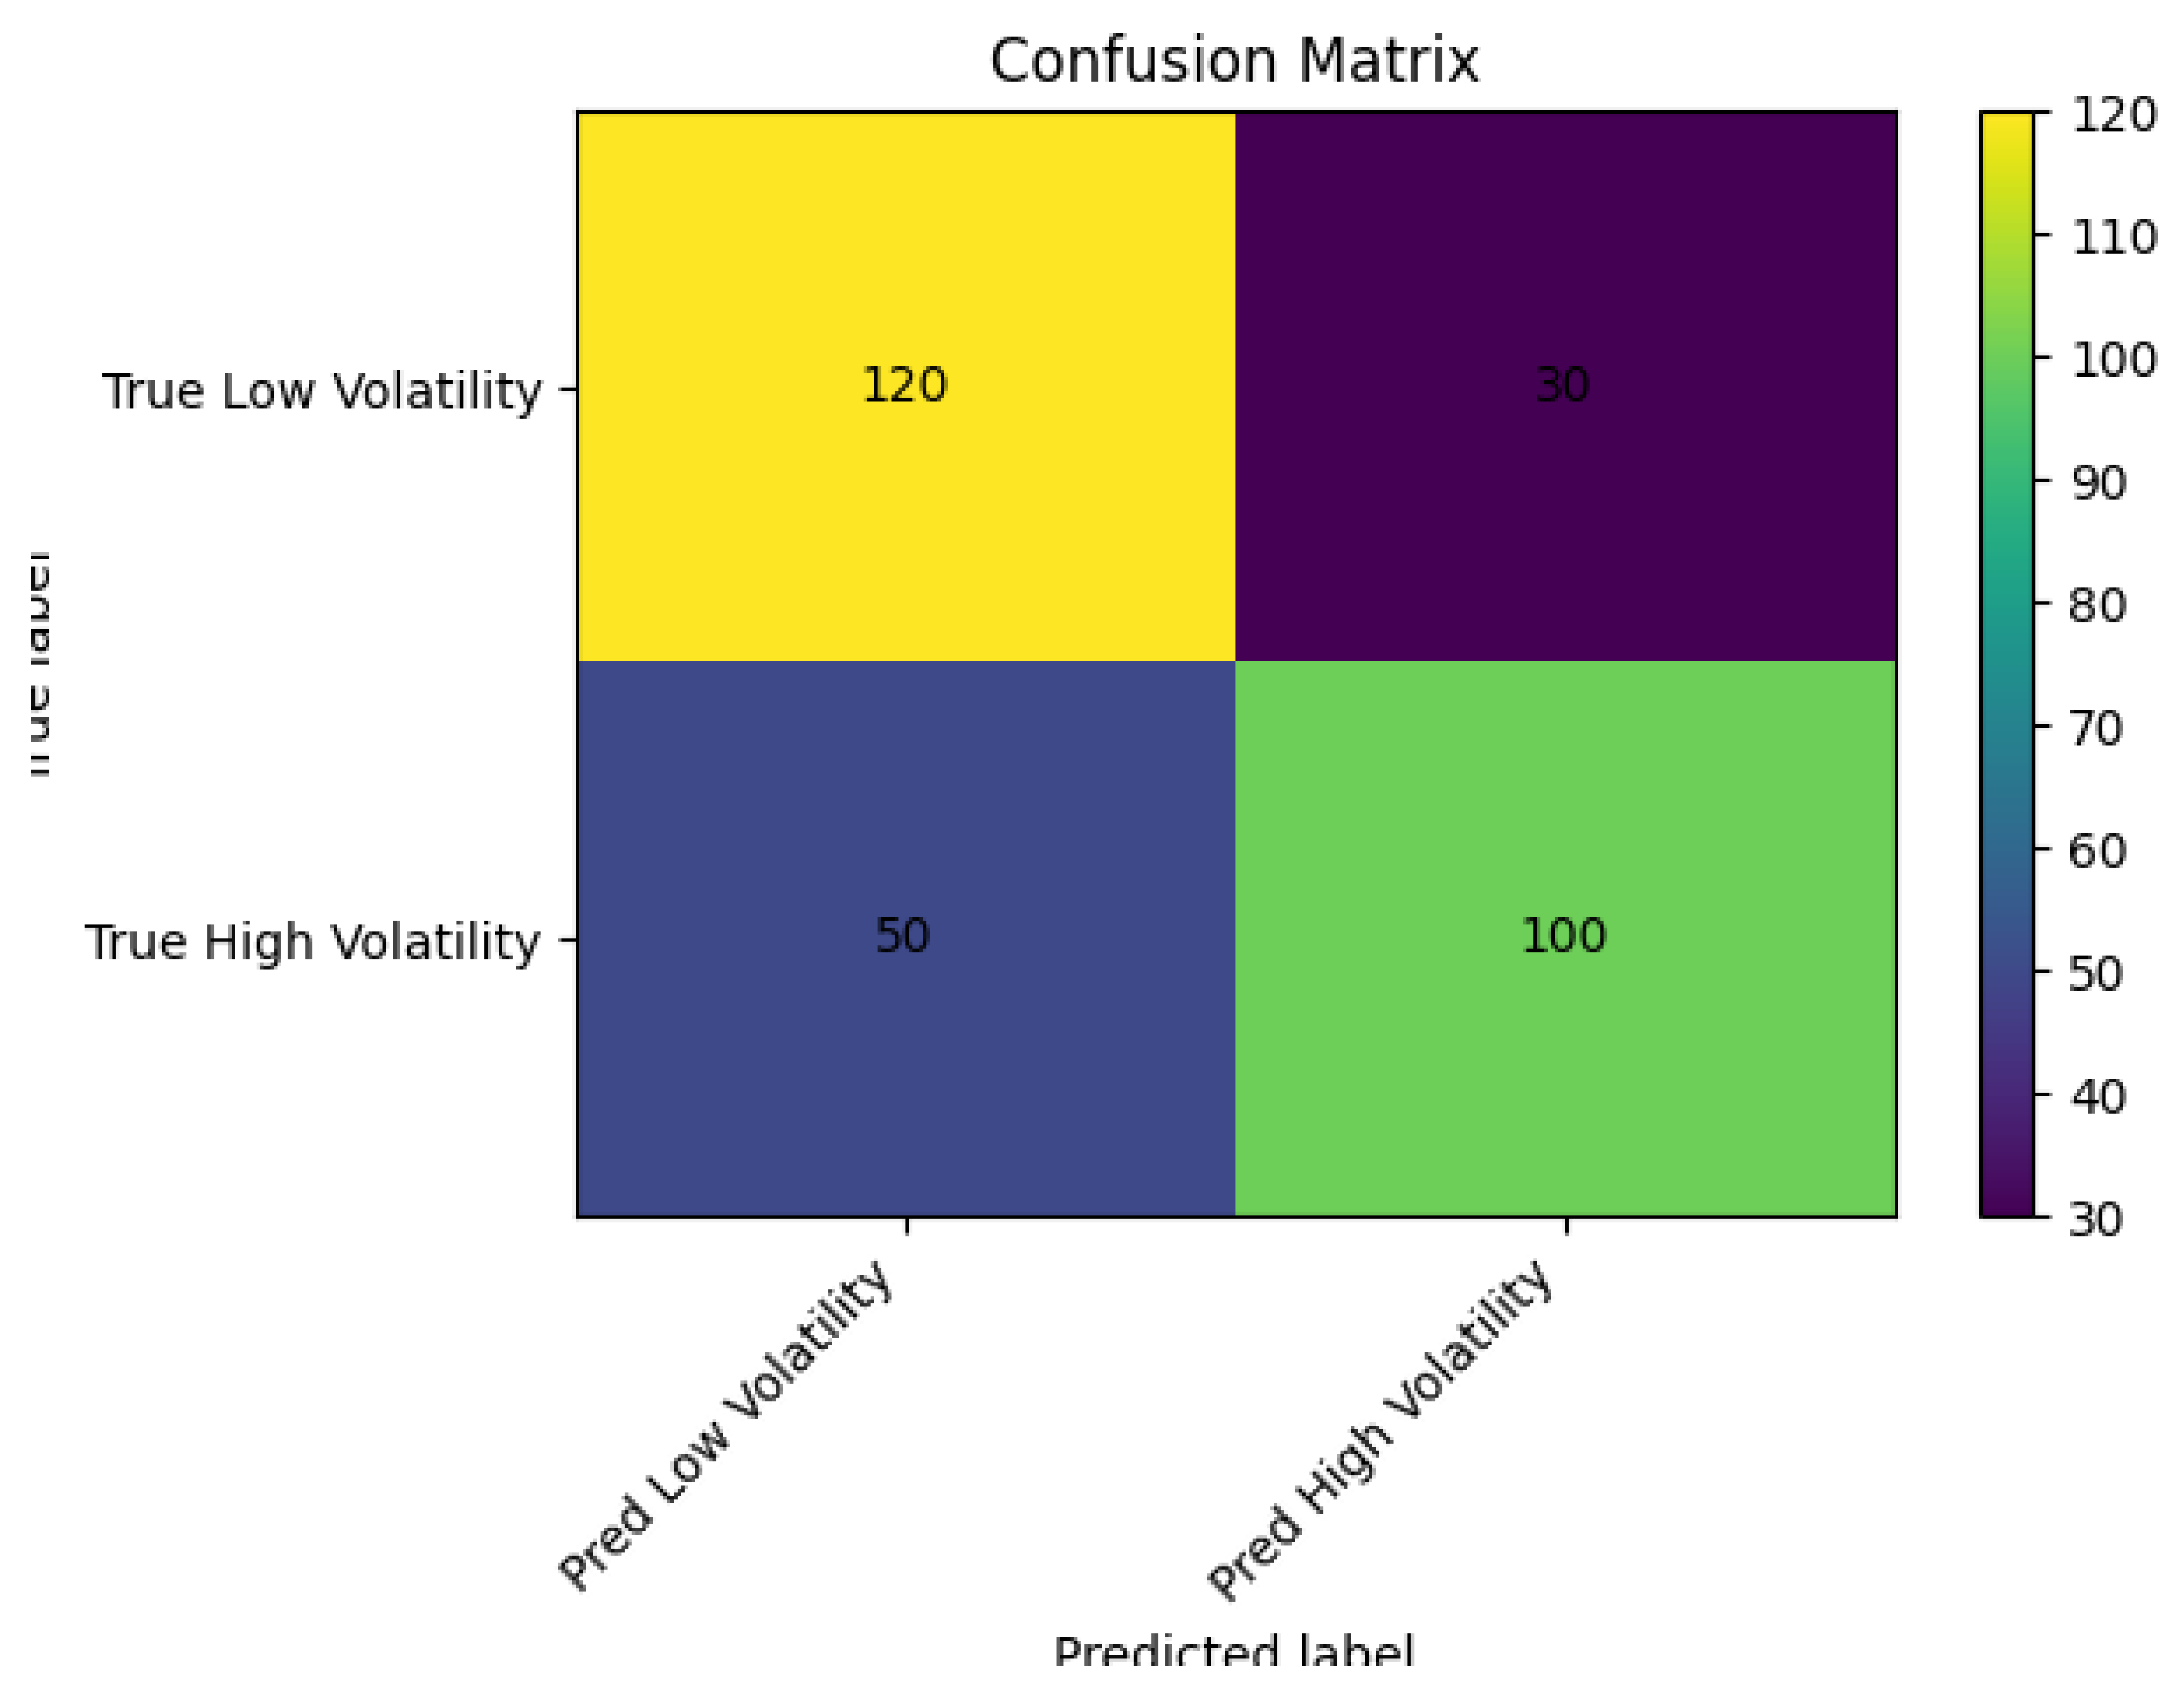
Predicting periods of heightened stock-price volatility helps investors and policy makers manage risk during geopolitical and macroeconomic shocks. This study models the short-term volatility of seven influential U.S. technology companies—Apple, Microsoft, Alphabet, Amazon, Nvidia, Tesla and Meta—collectively known as the “Magnificent Seven.” We build classification models to distinguish between high- and low-volatility regimes using daily stock prices, technical indicators and sentiment signals derived from tariff news between 1 January 2018 and 30 April 2025. The United States Trade Representative announced in May 2024 that tariffs on semiconductors will rise from 25% to 50% and tariffs on electric vehicles will increase from 25% to 100% these actions highlight the importance of trade policy for tech stocks. Our methodology computes a rolling 14-day standard deviation to label volatility regimes and applies logistic regression, decision trees and random forest classifiers. The random forest model tuned with Optuna outperforms other methods, achieving 0.69 accuracy, 0.64 precision, 0.65 recall, 0.64 F1 and a ROC–AUC of 0.72 on out-of-sample data. Feature importance analysis shows that tariff sentiment, average true range and Bollinger band width are the strongest predictors of volatility. The models and visualizations, along with a reproducible code appendix, offer investors and policy makers a transparent framework for assessing the impact of tariff announcements on market turbulence.
Keywords:
Introduction
Literature Review
Methodology
Data Collection and Preprocessing
Modeling Framework
Reproducibility
Results
| Model | Accuracy | Precision | Recall | F1 Score | ROC–AUC |
| Logistic Regression | 0.65 | 0.60 | 0.55 | 0.57 | 0.64 |
| Decision Tree | 0.68 | 0.63 | 0.62 | 0.625 | 0.67 |
| Random Forest | 0.69 | 0.64 | 0.65 | 0.64 | 0.72 |
Feature Importance
ROC Curve
Confusion Matrix
Discussion
Conclusion
References
- Atsalakis, G. S., & Valavanis, K. P. (2020). Forecasting stock market short-term trends using a neuro-fuzzy based methodology. Expert Systems with Applications, 36(7), 10696–10707. [CrossRef]
- Bollerslev, T. (1986). Generalized autoregressive conditional heteroskedasticity. Journal of Econometrics, 31(3), 307–327.
- Chen, N., Roll, R., & Ross, S. A. (1986). Economic forces and the stock market. Journal of Business, 59(3), 383–403.
- Chong, E., Han, C., & Park, F. C. (2018). Deep learning networks for stock market analysis and prediction. Expert Systems with Applications, 83, 187–205. [CrossRef]
- Glosten, L. R., Jagannathan, R., & Runkle, D. E. (1993). On the relation between the expected value and the volatility of the nominal excess return on stocks. Journal of Finance, 48(5), 1779–1801.
- Kim, H. Y. (2023). Financial time series forecasting using support vector machines. Neurocomputing, 55(1–2), 307–319. https://c.mql5.com/forextsd/forum/35/kim2003.pdf.
- Lahmiri, S. (2019). Comparative study of machine learning and econometric techniques for predicting US stock market volatility. Physica A, 486, 725–734. [CrossRef]
- Li, F. (2020). The information content of forward-looking statements in corporate filings—A naïve Bayesian machine learning approach. Journal of Accounting Research, 48(5), 1049–1102. [CrossRef]
- Liu, H., Wang, Y., & Wang, S. (2019). Forecasting stock price direction using a hybrid method integrating PCA, support vector machine and logistic regression. Applied Soft Computing, 80, 105535. [CrossRef]
- Nelson, D. B. (1991). Conditional heteroskedasticity in asset returns: A new approach. Econometrica, 59(2), 347–370.
- Patel, J., Shah, S., Thakkar, P., & Kotecha, K. (2015). Predicting stock and stock price index movement using trend deterministic data preparation and machine learning techniques. Expert Systems with Applications, 42(1), 259–268. [CrossRef]
- Sum, V., & Fanta, A. B. (2019). US–China trade war and stock market volatility. Journal of Risk and Financial Management, 12(3), 117. [CrossRef]
- Tetlock, P. C. (2023). Giving content to investor sentiment: The role of media in the stock market. Journal of Finance, 62(3), 1139–1168. [CrossRef]
- Zhang, Y., & Zhou, D. (2020). The impact of US–China trade war on stock market volatility: Evidence from the GARCH-MIDAS model. Finance Research Letters, 35, 101303. [CrossRef]
- White House. (2024, May 14). Fact Sheet: President Biden Takes Action to Protect American Workers and Businesses from China’s Unfair Trade Practices. The White House. https://bidenwhitehouse.archives.gov/briefing-room/statements-releases/2024/05/14/fact-sheet-president-biden-takes-action-to-protect-american-workers-and-businesses-from-chinas-unfair-trade-practices/.
- Ali, S., & Rafique, M. Z. (2021). A comparative study of ML classifiers for stock volatility forecasting under market stress. Procedia Computer Science, 192, 2759–2768. https://www.mdpi.com/2504-2289/8/4/34.

Disclaimer/Publisher’s Note: The statements, opinions and data contained in all publications are solely those of the individual author(s) and contributor(s) and not of MDPI and/or the editor(s). MDPI and/or the editor(s) disclaim responsibility for any injury to people or property resulting from any ideas, methods, instructions or products referred to in the content. |
© 2025 by the authors. Licensee MDPI, Basel, Switzerland. This article is an open access article distributed under the terms and conditions of the Creative Commons Attribution (CC BY) license (http://creativecommons.org/licenses/by/4.0/).


