1. Introduction
The analysis of extreme rainfall and the construction of Intensity–Duration–Frequency (IDF) curves constitute a central component in the planning and design of hydrotechnical infrastructure, sewer networks, urban retention systems, and flood protection measures. IDF relationships allow for the estimation of the maximum rainfall intensity corresponding to a given duration and return period, thus providing a rational basis for hydraulic design.
Traditionally, the development of IDF curves has been based on univariate probability distributions [
1,
2] (e.g., Gumbel, Pearson III, Log-Normal) and on the assumption of stationarity in the rainfall process. However, recent observations indicating changes in rainfall regimes and an increase in the frequency and magnitude of extreme events suggest the need to reconsider these assumptions. In this context, the Generalized Extreme Value (GEV) distribution provides a unified and flexible framework capable of describing Gumbel-type (zero shape parameter) as well as Fréchet- or Weibull-type behaviors, depending on the value of the shape parameter [
3].
In recent years, growing interest has been directed toward parameter estimation methods that rely on explicit analytical relationships, thus avoiding traditional iterative procedures (such as those based on maximum likelihood or nonlinear numerical optimization). These explicit formulations—derived using the method of ordinary moments, L-moments, or K-moments [
4,
5], offer an efficient solution for engineering applications where fast and transparent implementation is required.
Furthermore, the emergence of non-stationary GEV models [
6,
7,
8], in which one or more parameters (typically the location or scale parameter) are expressed as functions of time or climatic covariates, has enabled a more realistic assessment of hydrological risk by accounting for the observed climatic variability of recent decades. This study aims to integrate these concepts into a unified framework for deriving both stationary and non-stationary IDF curves.
2. Materials and Methods
2.1. Statistical Analysis of Extreme Precipitation
The input data consist of annual maximum precipitation series for standardized durations (5, 10, 15, 30, 60, 120, 360, 720, and 1440 minutes), obtained either from pluviographic records or derived from daily time series using temporal disaggregation methods. For each duration, frequency analysis is performed using several candidate probability distributions: Gumbel, Pearson III [
9], Log-Normal, and GEV [
3].
The parameters of these distributions can be estimated using the following approaches:
- -
the method of ordinary moments (MOM) [
3];
- -
the method of L-moments [
3,
9];
- -
the Maximum Likelihood Estimation (MLE) method;
- -
The Least Squares Method (LSM)
- -
the method of K-moments [
4,
5];
- -
explicit approximate relationships for distributions, derived from rational or logarithmic regressions between the coefficients of variation, skewness, and the shape/scale parameters.
These explicit formulations simplify the computational process, allowing for the rapid generation of IDF curves without the need for iterative algorithms.
2.2. Derivation of IDF Curves
For each duration (d), the rainfall intensity is determined as [
1,
2]:
where
represents the maximum precipitation associated with the return period
.
The IDF relationship is modeled in a parametric form such as:
or, in simplified form, through log–log linear expressions:
where the coefficients
are calibrated for each station or climatic region.
2.3. Non-Stationary GEV Models
To capture temporal trends, the GEV distribution is extended as [
6,
7,
8]:
where the parameters
and
are time-dependent functions:
while
remains constant or may also vary. Parameter estimation was performed using conditional maximum likelihood and simplified analytical relationships.
In the scientific literature and international standards, the relationships can be grouped into several categories: empirical, semi-empirical (with regional parameters), and theoretical (based on probability distributions).
Below is a complete and classified synthesis, including the most commonly used formulas for developing IDF curves.
2.3.1. Classical Empirical Relationships (Power-Law or Rational Form)
These are based on the direct correlation of the observed values of intensity, duration, and frequency.
Sherman [10]:
where,
is intensity, (mm/min or mm/h);
is duration, [min or h];
are empirical parameters dependent on the climatic zone.
This is one of the most commonly used relationships for IDF curves in log–log linear form.
or in logarithmic form:
A simple form frequently used in earlier studies; suitable for short durations (< 60 min).
Similar to the Sherman formula but includes calibrations for different duration ranges.
where the coefficients
and
are determined for each return period
, and can then be expressed as functions of
:
Chow [2]:
where,
is the frequency factor associated with the return period, and
are the hydrological parameters of the site.
2.3.2. Regional Relationships (Romania)
In Romania, the maximum intensity is often expressed as follows:
where
are regionally calibrated empirical parameters, and
is the return period (years).
Log-polynomial forms
These relationships are obtained through multiple nonlinear regressions, ensuring an excellent fit over wide ranges of duration and frequency.
2.3.3. Theoretical Relationships (Based on Probability Distributions)
In these cases, the intensity is derived from the theoretical distribution of the maximum precipitation.
General GEV model [6,7,8]:
where
may depend on duration through logarithmic scaling relationships:
Gumbel model (a particular case of the GEV distribution) [6,7,8]:
Log-Pearson III model [2]:
where
depends on the coefficient of skewness
and on
, while:
2.4. Performance and Uncertainty Assessment
The goodness of fit of the distributions is tested using statistical indicators (Kolmogorov–Smirnov, Anderson–Darling, RMSE) and through the analysis of parametric uncertainties. Special attention is given to the sensitivity of the IDF curves to the chosen estimation method and to long-term climatic variability.
3. Case Study
To illustrate the applicability and methodological differences among the main parameter estimation methods for extreme value distributions used in the development of IDF curves, a set of synthetic annual maximum precipitation series was constructed.
The synthetic series were generated for standardized durations ranging from 5 to 1440 minutes, resulting in a total of 13 series, each representing 30 years of data. The annual maximum values (in mm) were simulated using a reference Gumbel distribution (μ and σ varying with log(d)) to reproduce the natural increase in maximum precipitation with event duration. This approach ensures statistical consistency across durations while allowing a comparative assessment of the estimation methods under identical data conditions.
The series were used as a common basis for four variants of statistical fitting, all corresponding to the Gumbel distribution, as well as for an additional variant based on the GEV distribution.
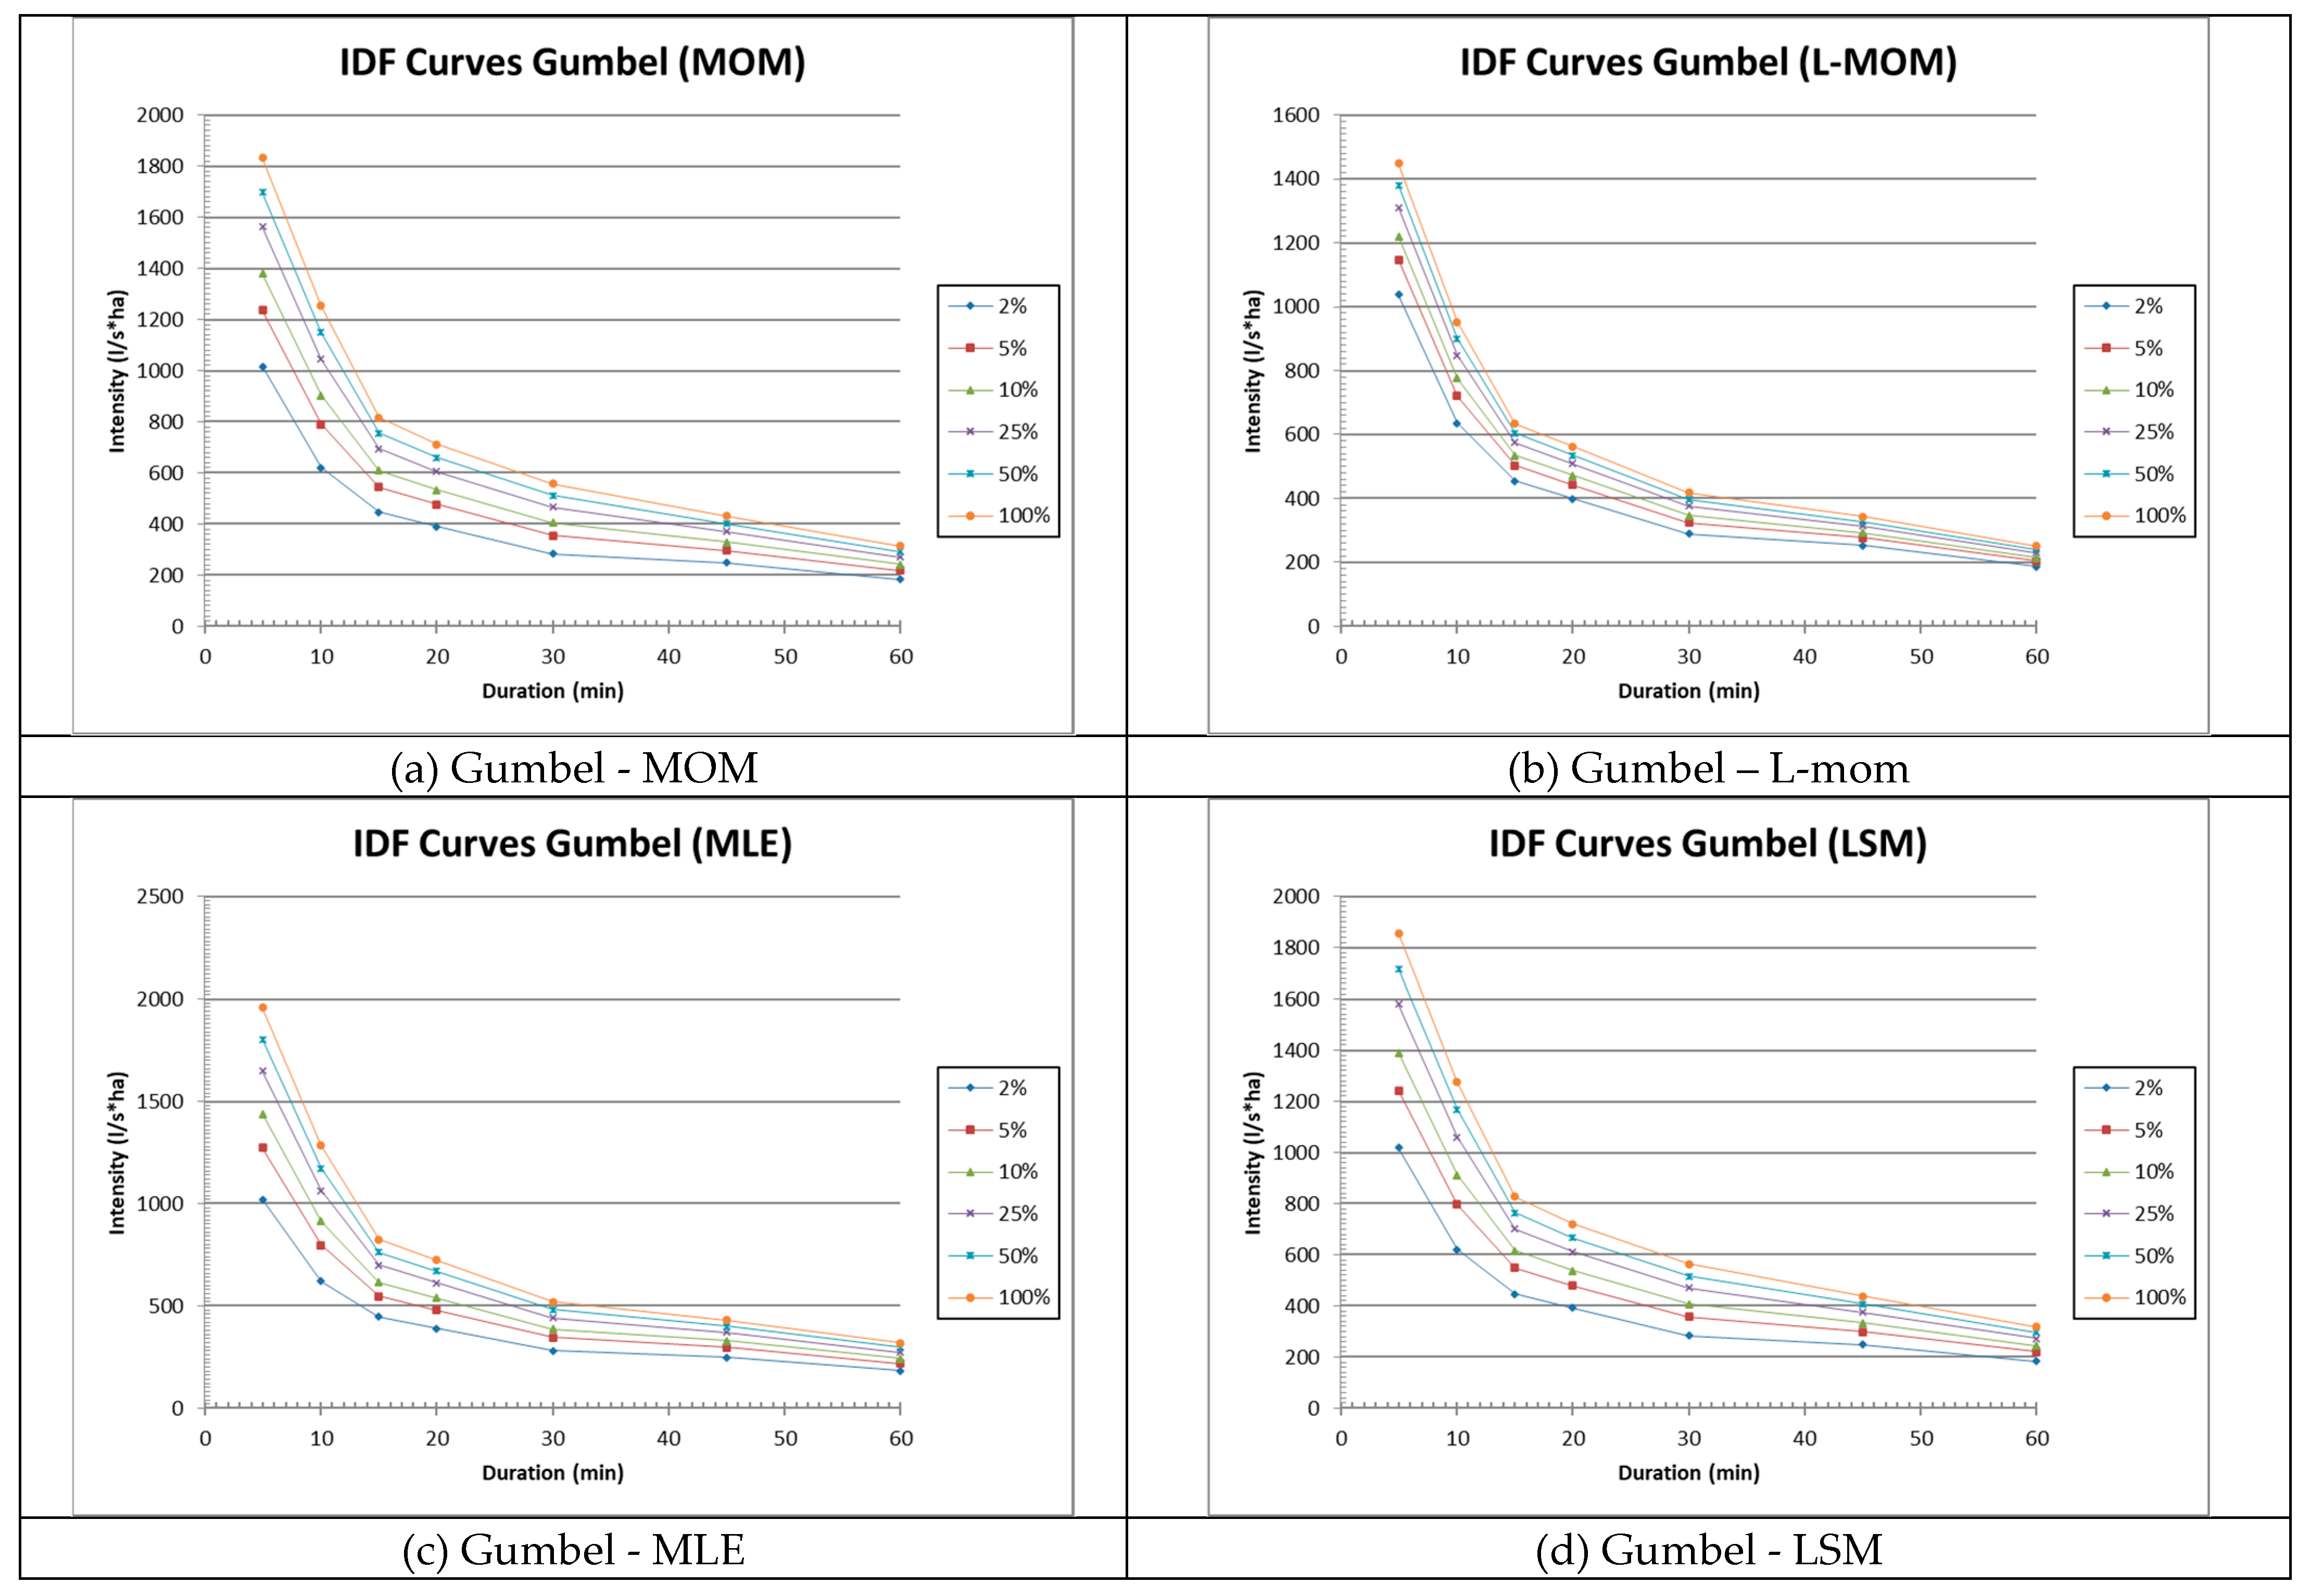
Figure 1 presents the fitted curves for the Gumbel distribution using the MOM, L-moments, MLE, and LSM parameter estimation methods.
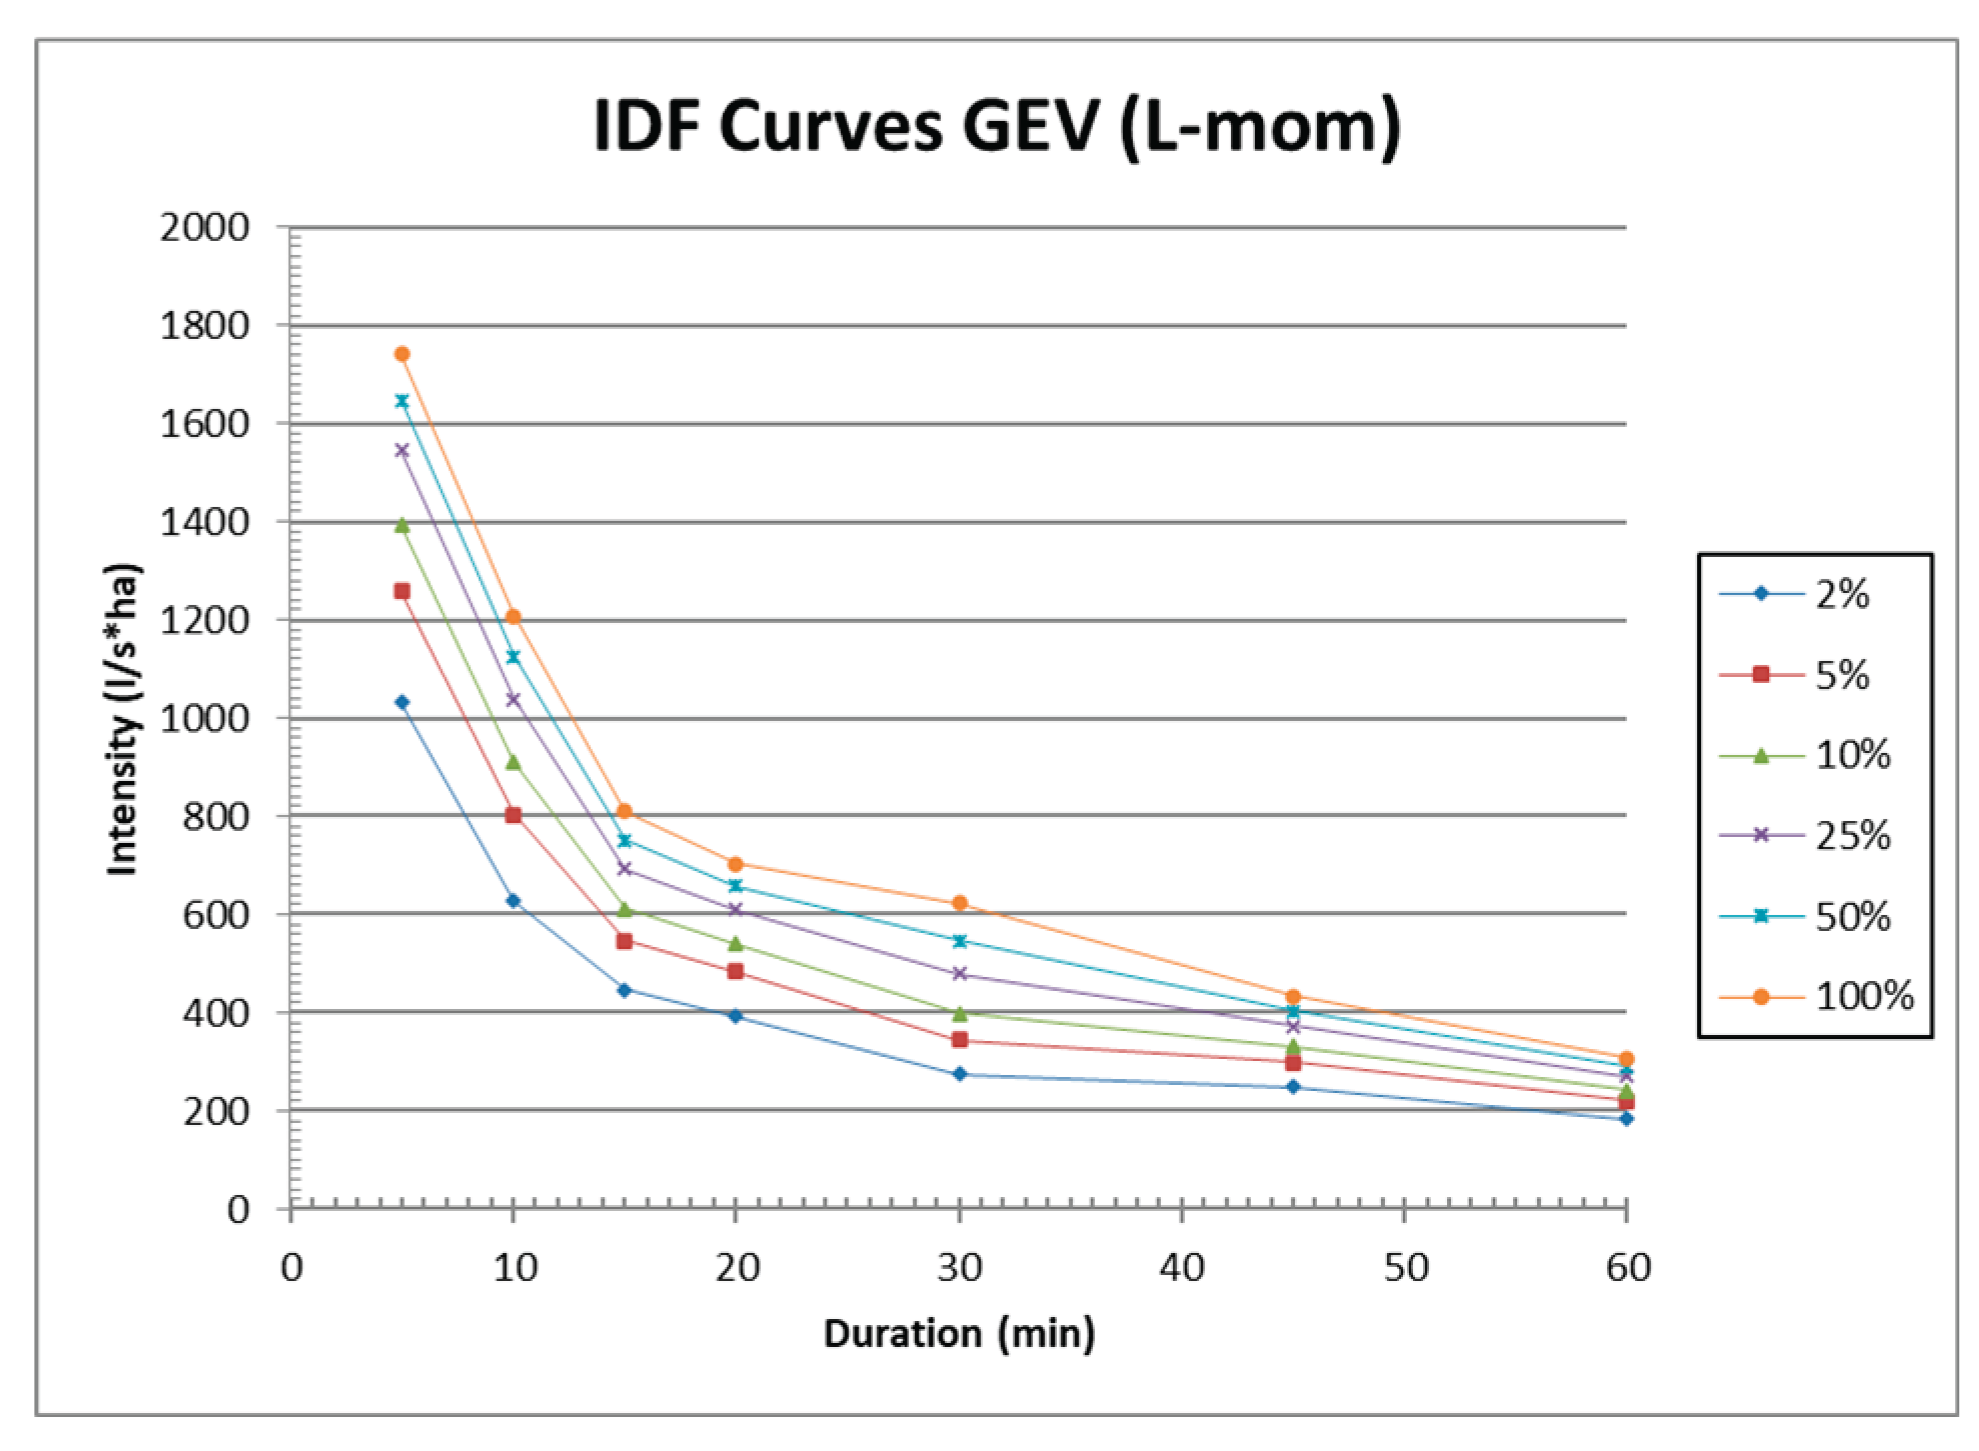
Figure 2 provides a comparative presentation of the results obtained with the GEV distribution—a three-parameter, more advanced distribution capable of calibrating higher-order moments. The L-moments method was chosen for its robustness, as it has been demonstrated in numerous specialized studies to be reliable and less sensitive to variations in the length of the available data series.
4. Discussions
The results presented highlight a significant diversity of methods used in the scientific literature for determining Intensity–Duration–Frequency (IDF) relationships. The comparative analysis of empirical, semi-empirical, and theoretical formulations showed that, although empirical models (such as those of Talbot, Sherman, Bernard, or Montana) remain widely applied in engineering practice due to their simplicity, they are only valid over limited temporal ranges and do not provide robust extrapolations.
Theoretical probability distributions, particularly the Generalized Extreme Value (GEV) distribution, offer a more rigorous framework for the statistical characterization of maximum precipitation values, as they can capture the structural variability of the phenomenon.
The flexibility of the GEV shape parameter allows the model to adapt to different climatic conditions and reduces dependence on local empirical adjustments. Furthermore, the analysis of explicit relationships for determining GEV parameters, derived using methods such as MOM, L-moments, or K-moments, demonstrates their potential to replace traditional iterative procedures, simplifying practical implementation without significant loss of accuracy.
The results show minor differences between the MOM, L-moments, and LS methods (on the order of 3–8% on average for T ≤ 50 years). However, the MLE and GEV L-moments methods yield slightly higher values for large return periods (T > 50 years), due to their greater sensitivity to the distribution tail.
The GEV L-moments method proved to be the most stable and theoretically consistent, making it recommended for modern hydrological analyses and applications under conditions of climatic variability.
An essential direction of development identified in the literature is the integration of non-stationarity into IDF analysis by introducing the temporal dependence of the location and scale parameters of the GEV distribution. This approach enables the capture of observed trends in extreme rainfall series and aligns with recent global and regional climatic observations. Non-stationary GEV models may thus represent a natural evolution of classical IDF curves, offering a dynamic probabilistic perspective on maximum rainfall intensities.
In addition, the centralization and comparison of various existing explicit formulations contribute to a better standardization of the IDF methodology, allowing the construction of regional databases and the intercomparison between areas with different pluviometric characteristics. This approach is particularly useful for developing generalized or scaled IDF curves that can be applied in regions lacking detailed pluviographic data.
5. Conclusions
The diversity of IDF formulations reflects both the evolution of empirical hydrology and the current need to integrate theoretical models. Simple power-law or rational relationships (Talbot, Bernard, Sherman, Montana) provide a solid engineering foundation but must be complemented by theoretical models to ensure an accurate representation of extremes.
The GEV distribution represents the most robust theoretical framework for modeling maximum values, offering a continuous description between the Gumbel, Fréchet, and Weibull types. The use of explicit relationships for parameter estimation (via L- or K-moments) facilitates practical application and eliminates the need for complex iterative solutions.
Non-stationary GEV models constitute a necessary direction of development in the context of climate change, enabling the inclusion of temporal trends within the structure of IDF curves. This approach allows the continuous updating of relationships in accordance with observed climatic changes.
Generalized explicit relationships for IDF curves can become standardized tools in applied hydrology, enabling their rapid integration into software, GIS applications, and design models. They contribute to reducing uncertainty and increasing the transparency of the derivation process.
Overall, this study emphasizes the importance of a unified statistical analysis framework for the derivation of IDF curves, one that integrates both the theoretical aspects of extreme-value distributions and the practical applicability of explicit relationships.
References
- Grimaldi, S.; Kao, S.-C.; Castellarin, A.; Papalexiou, S.-M.; Viglione, A.; Laio, F.; Aksoy, H.; Gedikli, A. Statistical Hydrology. In Treatise on Water Science; Elsevier: Oxford, UK, 2011; Volume 2, pp. 479–517.
- Chow, V.T.; Maidment, D.R.; Mays, L.W. Applied Hydrology; McGraw-Hill, Inc.: New York, NY, USA, 1988; ISBN 007-010810-2.
- Anghel, C.G.; Ianculescu, D. Application of the GEV Distribution in Flood Frequency Analysis in Romania: An In-Depth Analysis. Climate 2025, 13, 152. [CrossRef]
- Koutsoyiannis, D. Knowable moments for high-order stochastic characterization and modelling of hydrological processes. Hydrol. Sci. J. 2019, 64, 19–33. [CrossRef]
- Koutsoyiannis, D. Knowable Moments in Stochastics: Knowing Their Advantages. Axioms 2023, 12, 590. [CrossRef]
- De Paola, F.; Giugni, M.; Pugliese, F.; Annis, A.; Nardi, F. GEV Parameter Estimation and Stationary vs. Non-Stationary Analysis of Extreme Rainfall in African Test Cities. Hydrology 2018, 5, 28. [CrossRef]
- Razi Ghalavand, M.; Farajzadeh, M.; Ghavidel Rahimi, Y. Modeling Return Levels of Non-Stationary Rainfall Extremes Due to Climate Change. Atmosphere 2025, 16, 136. [CrossRef]
- Khan, M.U.; Ijaz, M.W.; Iqbal, M.; Aziz, R.; Masood, M.; Tariq, M.A.U.R. Impact Evaluation Using Nonstationary Parameters for Historical and Projected Extreme Precipitation. Water 2023, 15, 3958. [CrossRef]
- Anghel, C.-G.; Ianculescu, D. An In-Depth Statistical Analysis of the Pearson Type III Distribution Behavior in Modeling Extreme and Rare Events. Water 2025, 17, 1539. [CrossRef]
- Fathy, Ismail & Negm, Abdelazim & Elfiky, Magid & Nassar, Mohamed & El-Sayed, Eman. (2014). Intensity duration frequency curves for Sinai Peninsula, Egypt. 2.
- Prerana Chitrakar, Ahmad Sana, Sheikha Hamood Nasser Almalki, Regional distribution of intensity–duration–frequency (IDF) relationships in Sultanate of Oman.
- Journal of King Saud University - Science, Volume 35, Issue 7, 2023, 102804, ISSN 1018-3647. [CrossRef]
- Badou, Djigbo & Hounkanrin, José & Hounkpe, Jean & Sintondji, Luc & Lawin, Agnide Emmanuel. (2023). Assessing the Return Periods and Hydroclimatic Parameters for Rainwater Drainage in the Coastal City of Cotonou in Benin under Climate Variability. Advances in Meteorology. 2023. 1-10. [CrossRef]
|
Disclaimer/Publisher’s Note: The statements, opinions and data contained in all publications are solely those of the individual author(s) and contributor(s) and not of MDPI and/or the editor(s). MDPI and/or the editor(s) disclaim responsibility for any injury to people or property resulting from any ideas, methods, instructions or products referred to in the content. |
© 2025 by the authors. Licensee MDPI, Basel, Switzerland. This article is an open access article distributed under the terms and conditions of the Creative Commons Attribution (CC BY) license (http://creativecommons.org/licenses/by/4.0/).