Submitted:
17 October 2025
Posted:
20 October 2025
You are already at the latest version
Abstract
Projected climate change in Slovakia is expected to significantly influence temperature and moisture conditions in agricultural production, as well as phenological patterns and soil properties. These shifts may reduce crop yields in areas already constrained by summer heat, enhance soil evaporation, and increase drought risk. The objective of this study was to assess and generate updated spatial outputs of vegetation zones and agricultural land. Analysis of the past 30 years revealed both earlier onsets and delayed endings of the growing season. Projections indicate that by 2091–2100, the great growing season will lengthen by approximately 25–30 days, and the main growing season by about 20 days relative to the present. Results suggest that extended growing seasons will encompass larger areas and gradually shift to higher altitudes. The 220–240-day category of the great growing season currently dominates (1.7–2.3 million ha), while durations exceeding 260 days, absent in 1971–1980, are expected to expand to about 55,000 ha by 2100. For the main growing season, the 160–190-day category remains prevalent (≈2.5 million ha), with only moderate future increases expected up to 220 days. Longer durations will likely remain limited, covering less than 50,000 ha.
Keywords:
climate change
; vegetation zones
; areal extent
1. Introduction
The issue of climate change is one of the most frequently discussed issues today. The efforts of the whole society to adapt to these changes as well as the efforts to mitigate the ongoing climate change are therefore gaining momentum [1]. In the last decade, addressing the impacts of climate change has moved from the scientific to the social and political arena, as well as to the practical application arena. This situation calls for coordination of resources and activities, particularly at national level [2].
Agriculture is strongly influenced by external environmental factors, particularly soil and climate conditions. Land use depends not only on local natural conditions but is also influenced by several other factors. The amount of agricultural land in use has been decreasing over the long term [3].
Agriculture is very sensitive to climate variability and weather extremes such as droughts, severe storms, and floods. Human activity has already affected chemical and physical atmospheric properties such as temperature, precipitation, carbon dioxide (CO2) and ground-level ozone concentrations, and this trend is expected to continue [4]. Crop production may benefit from a warmer climate, but increases in drought, flooding and heat will pose a challenge for growers. Global climate change may make some regions unsuitable for crop production [5].
Changes in temperature, rainfall and other environmental factors are altering the timing of plant life, i.e., the onset of phenophrases and thus the length of phenophase intervals and entire growing seasons of individual crops [6]. This scenario is based on the predicted basic indicators of agro-climatic conditions of a large growing season, such as the increase in the sum of daily temperatures. For growing seasons bounded by physiologically significant temperatures an acceleration of the onset and a delay of the termination of the phenophases shall apply [7].
In general, there is a general decline in all three water sources: surface, groundwater, and soil [8]. Based on an overall assessment of the hydrological situation in Slovakia over the last pentad, it can be stated that the extremes of runoff have partially increased, drier summer and autumn months have been recorded, and winter months have increased runoff compared to normal [9].
2. Materials and Methods
Temperature is one of the basic living conditions of plants as it determines and influences their basic life functions such as nutrient uptake, transpiration, photosynthesis, respiration and others.
The life of cultivated plants is only possible within a certain temperature range, the upper and lower limits of which, the so-called “critical temperatures”, are determined by the anatomical structure of the plant body and the physiological processes taking place in its organs. The temperature range at which plants can develop and grow well varies. It depends on the plant species and the areas in which they grow and from which they originate. In temperate latitudes, plants have a wide temperature range, with the smallest temperature range in the tropics and the lowest temperatures that plants in the arctic or mountain zone can tolerate. Between the extremes there is a narrower range of temperatures that best suits the requirements of the organism at a given stage of development. These are the optimum temperatures or the optimum temperature range. In general, for most cultivated plants, the minimum temperature can be 0,0-5,0 °C, the optimum 15,0 - 30,0 °C and the maximum 35,0 - 42,0 °C.
The timing of plant life-history phenophases is mainly influenced by the energy and water regimes of the environment. Changes in temperature, rainfall and other environmental factors alter the onset and termination dates of the phenophases and thus the length of the phenophase intervals and the entire growing seasons of the crops.
Meteorological data for the task (values of average monthly temperatures) for the reference time series 1961-2010 were provided by the Slovak Hydrometeorological Institute in Bratislava. The onsets (in spring) and offsets (in autumn) of the growing season were analyzed:
- the great growing season (GGS), bounded by the onset and termination of days with average daily temperature T ≥ 5,0 °C,
- the main growing season (MGS), bounded by the onset and cessation of days with an average daily temperature T ≥ 10,0 °C,
For the onset and termination of the growing season of the analyzed vegetable species, air temperatures, T ≥ 5,0 °C, T ≥ 10,0 °C, were determined based on phenological observations.
For the basic analyses of the phenological conditions of vegetables in Slovakia, 100 stations were selected throughout the territory of Slovakia (Figure 1).
The change of the growing season of the analyzed vegetable species was determined by calculating the onset and termination of the growing season (according to relations (1), (2)) and was analyzed from the average daily temperature for the years 1961-2015, where subsequently the forecasts to the decades 2011-2020, 2041-2050, 2071-80 and 2091-2100 were determined in the form of map outputs.
The onset and termination of the defined temperatures were calculated according to formulas (1) and (2).
Onset of temperatures: , (days) (1)
Ending temperatures: , (days) (2)
where:
- onset temperature in °C,
- termination temperature in °C,
- the nearest average monthly temperature above the starting or ending temperature in °C,
- the nearest average monthly temperature below the starting or ending temperature in °C,
R - the difference in days between the middle of months with an average temperature and an average temperature, can be expressed as an average number,
- the difference in days between the middle of the month with the temperature and the date of onset of the temperature,
- the difference in days between the middle of the month with the temperature and the end date of the temperature.
For the processing of map outputs, we chose the ArcGIS pro software from ESRI. This modular software is ideal for collecting, analyzing, and visualizing geographic information. [10]
The processing of map outputs was preceded by the preparation of input data. Each meteorological station had its position defined in XYZ coordinates. When loading into the ArcGis environment, the coordinates were transformed so that the resulting point vector model (*.shp) was placed in the S-JTSK coordinate system. This is how we obtained the exact location of meteorological stations in Slovakia.
When we obtained the location of these stations, it was necessary to assign to them the calculated lengths of the vegetation periods in the individual decades under investigation. We prepared the data on the lengths of the growing seasons in the MS Excel environment and then assigned them to the individual meteorological stations according to the serial number.
Since the location of meteorological stations mostly forms an irregular network, it was necessary to find out data for the entire territory of Slovakia. Because of this, we proceeded to interpolation. To interpolate unknown values, we used the Topo to Raster interpolation method. This method is based on ANUDEM version 4.6.3. This interpolation method combines IDW, Kriging and Spline interpolation methods. [11] By interpolation, we obtained data for the entire territory of Slovakia and for each examined decade.
Subsequently, according to the histogram for each period, we reclassified the individual categories of the length of the growing seasons.
Since the goal was to find out the differences in the lengths of the growing seasons in the individual investigated decades on the agricultural land, it was necessary to eliminate from the obtained data positions that would negatively distort the resulting values. Therefore, we used a digital relief model to delineate the areas whose altitude was higher than 800 meters above sea level. Subsequently, these areas were not even included in the calculations and form empty areas in the resulting map outputs.
When we had all the data processed into a graphic form, we used the print view to assign a scale, northing and a legend to the maps, where the individual categories shown in the maps are defined. We exported the resulting map assembly to JPEG format.
3. Results
This chapter analyses the impact of climate change on the length of the growing season to the reference period of 1961-2015 and possible changes to the time horizons of 2011-2020, 2041-50, 2071-80, 2091-2100.
The time course of plant life history - phenophases is mainly influenced by temperature and water. The change of energy and water balance characteristics in Slovakia changes the onset of phenophases and thus the length of phenophase intervals and entire crop growing seasons.
For the growing season bounded by physiologically significant temperatures, there is generally a delay in the onset, a delay in the termination and hence an increase in the length of the growing season.
A Great growing season, bounded by the onset and termination of days with an average daily temperature T ≥ 5,0 °C. The map outputs (Figure 2 a) – i)) show that the length of the great growing season has changed significantly over the period 1961-2000. For the decade 1961-70, the length of the major growing season was 240-245 days in the Danube Plain. In the next two decades there was an increase of 5 days and in 1991-2000 the length (GGS) reached 250-255 days, an increase of 10 days. Significant changes also begin to appear in the projections for 2011-2100 (Figure 6.5 and 6.9), when the length of the growing season towards the 2100 horizon has reached a value of 280-285 days in the south-west of Slovakia. This projected increase compared to the present (2001-2010) is an average of 25-30 days and compared to the decade 1961-70 it is even an increase of 35-40 days in the most fertile part of Slovakia.
The main growing season, bounded by the onset and termination of days with an average daily temperature T ≥ 10,0 °C. Looking at the map outputs (Figure 3 a) – d)), it is evident that over the period 1961-2000 the length of the main growing season (185-190 days for southern Slovakia) did not change significantly, with the exception of the cold decade of 1971-80 (a decrease of 10 days was recorded in this period). More significant changes begin to appear in the period 2001-2020 (Figure 3 e) and Figure 3 f)), when the length of the growing season increased by 5 days. There is a warming trend in the following decades, which is also reflected in the projections of the map outputs. Compared to other decades over the 1961-1990 period, the main growing season increases by 10 days towards the 2041-2050 horizon (Figure 3 g)). Towards the decade 2071-2080 (Figure 3 h)), the main growing season will increase to a value of 200-205 days and towards the 2100 horizon to a value of 205-210 days. Compared with 1961-1990 to the decade 2091-2100 (Figure 3 i)), this is a projected increase of 20 days on average, and compared with the coldest decade, it is an increase of even 30-35 days.
The great growing season was reclassified into five classes based on the number of days in each decade compared, with a spacing of 20 days between each category. The intervals were up to 200 days, 200-220 days, 220-240 days, 240-260 days, and over 260 days. The comparison shows that while the length of the large growing season of up to 200 days was approximately 170,000 ha in the cool decade 1970-1980, these areal areas are expected to decrease in the predicted decades after 2100 (Figure 4). Conversely, as the length of the growing season increases into the future, individual acreages are expected to increase. For the cool decade, a decrease in area is observed, with no length above 260 days occurring in this period. In 2100, approximately 555000 ha are expected to have a large growing season duration of over 260 days. The median length at which approximately the same areal areas have been recorded is between 220 and 240 days. Here, the areas are in the order of 1 700000 to 2 200000 ha for all decades compared.
For the Main Growing Season, when the average temperature is above 10,0 °C, the individual decades have also been reclassified into five classes with a 30-day spacing. The intervals of days were designed based on a histogram, with the first interval covering a period of up to 160 days. Then there are intervals of 160-190 days, 190-220 days, 220-250 days and above 250 days. It can be seen from the comparison (Figure 5) that in the past the period of up to 160 days occurred over a larger area than at present, namely 1 600 000 ha, representing 38,0% of the total area. Periods of more than 250 days are no longer present in the cold season, but for other periods they can be expected to cover an area of around 30 000 ha. The 160–190-day interval has the largest areal extent in all decades compared. This length of the main growing season is expected over an area of approximately 2 500 000 to 3 500 000 ha. This interval covers approximately 60-70% of the area.
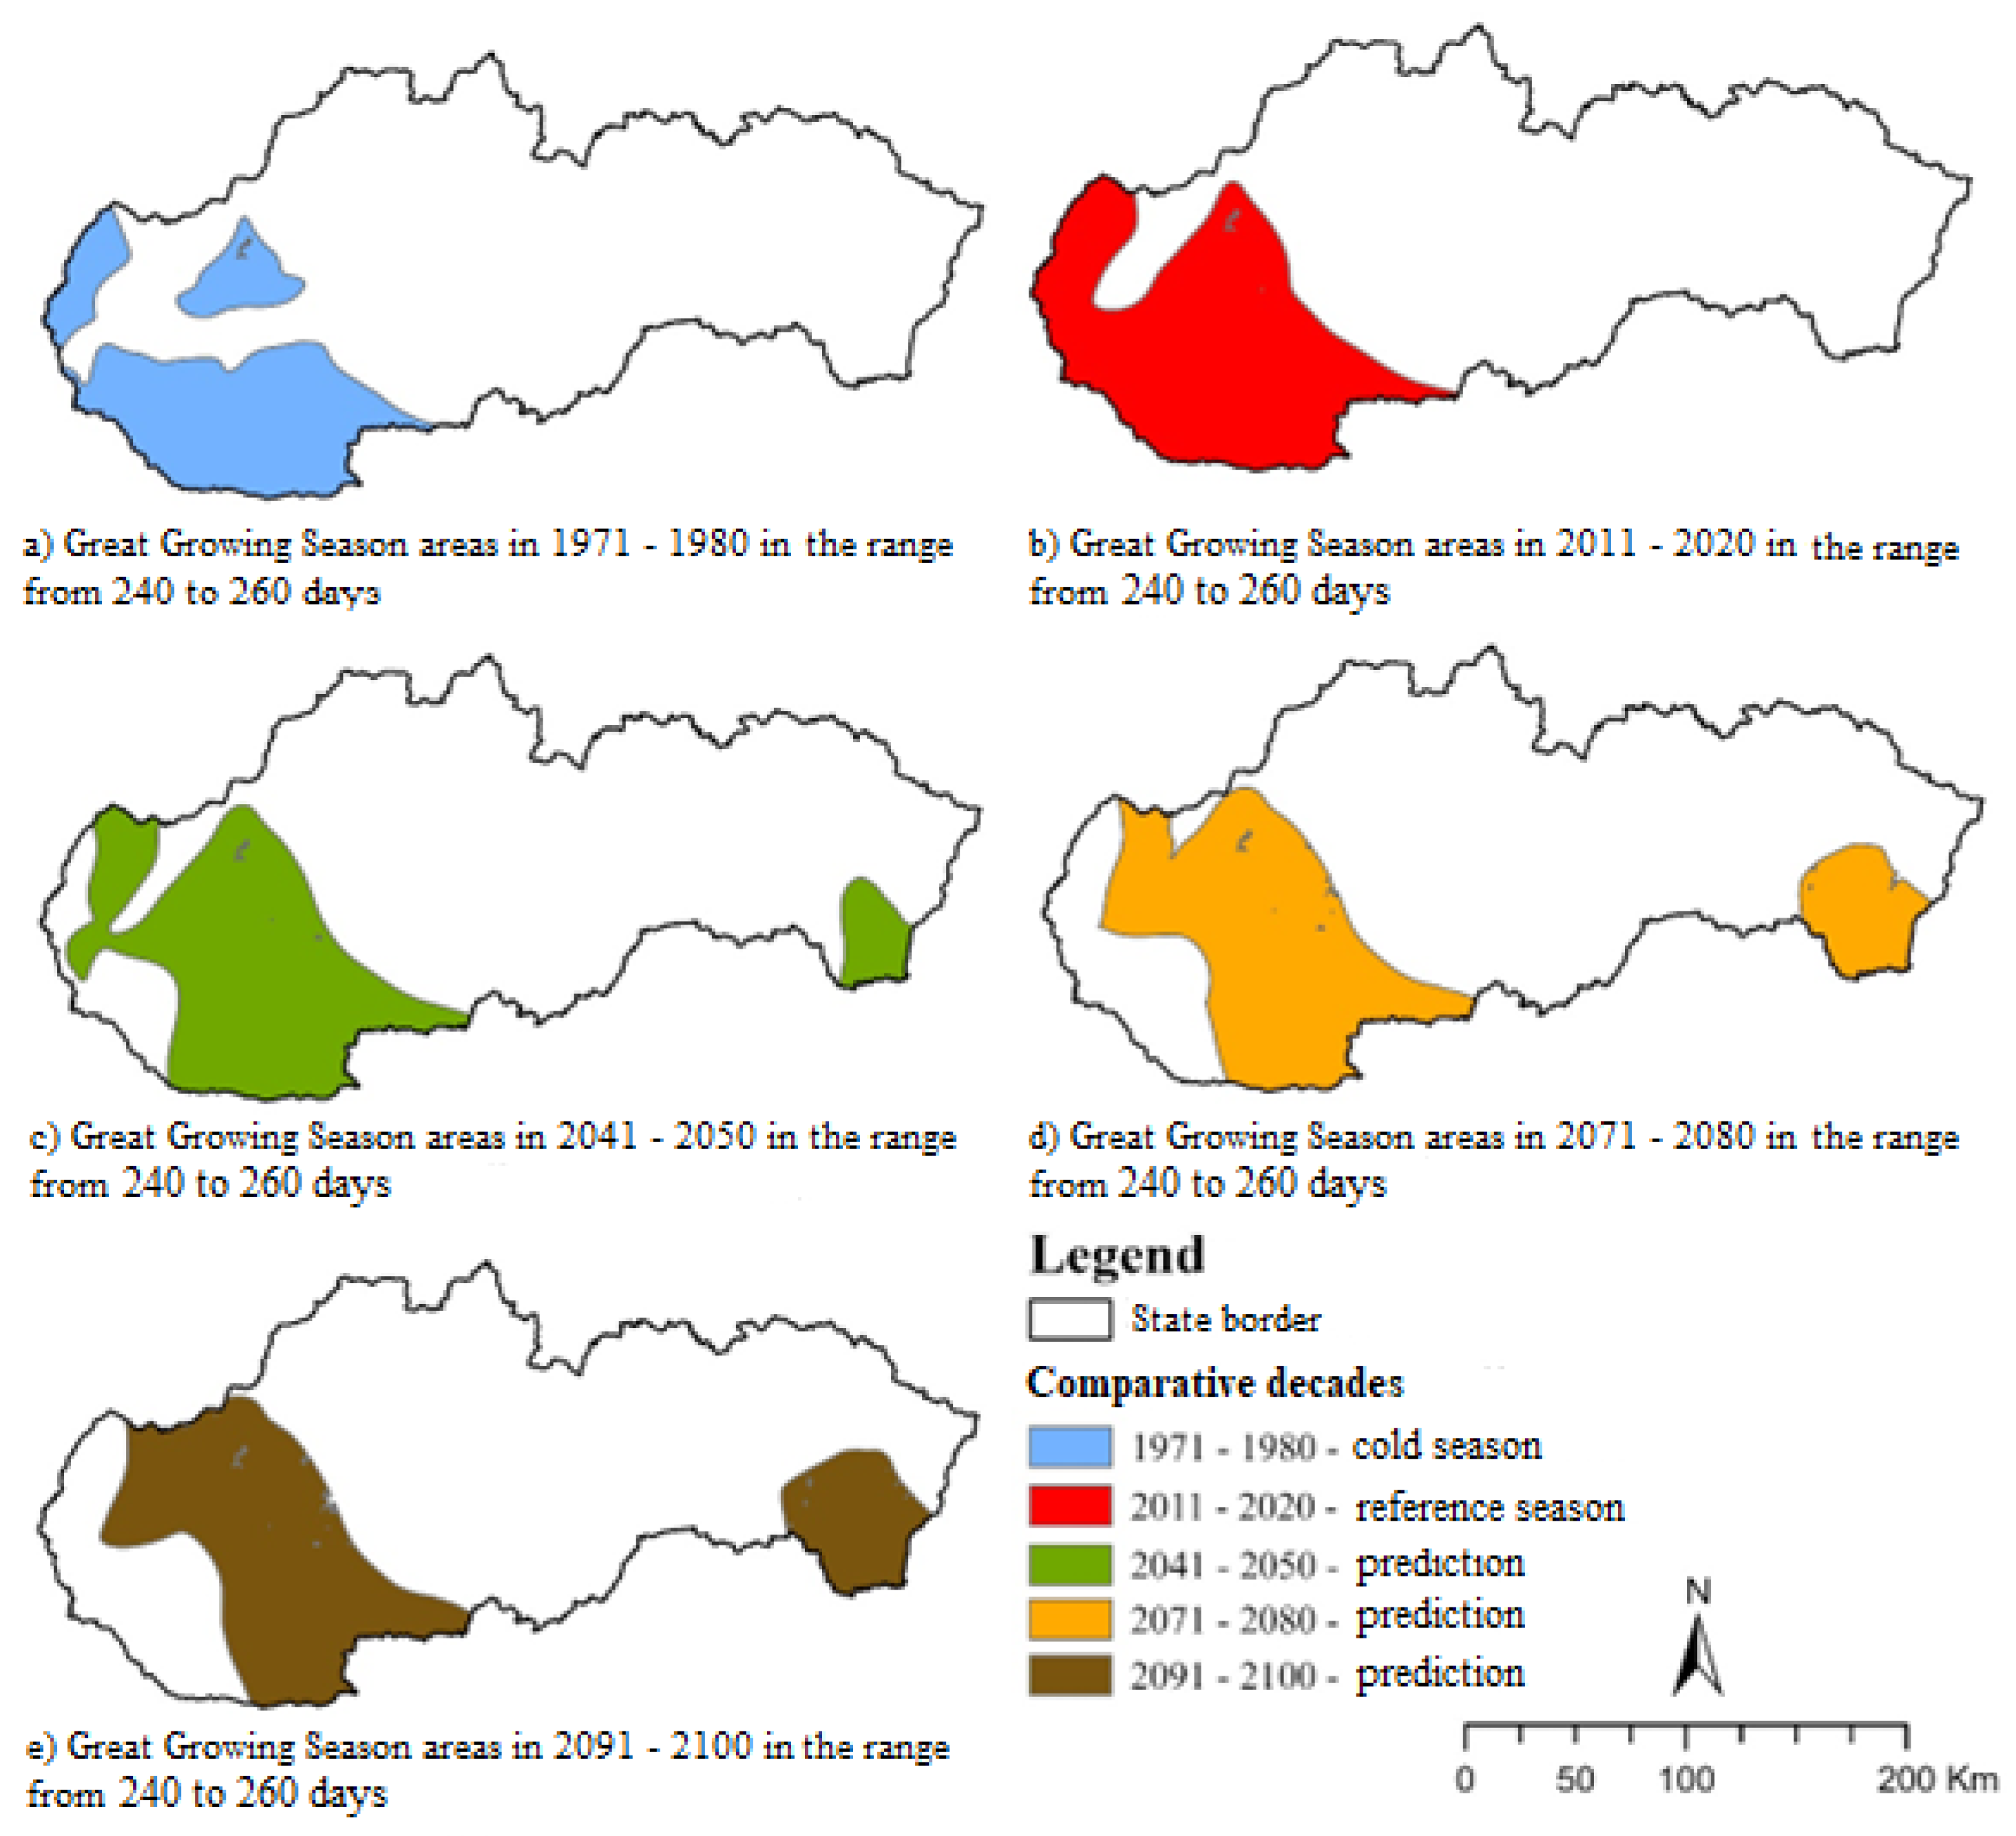
Figure 6, Figure 7 and Figure 8 show a comparison of the change in area of each of the specified day intervals for the Great Growing Season. While in the past shorter durations of the Great Growing Season (200-220 days) were represented over larger areas, these areas are expected to decrease in the future. This shorter duration is found in the Orava region, the Low Tatras and extends as far south as the Rožňava basin and as far east as the Bukovské vrchy. The mean length of the Great growing season (220-240 days) is approximately the same in all the decades compared. These areas stretch in a belt from the north-west from the Trenčianska and Ilava basins towards the Rožňava basin. In the east, this length is expected to follow an arc, the axis of which is formed by the Slanské vrchy, Ondavská vrchovina and Laborecká vrchovina. The longest duration of the Great Growing Season (240-260 days) is expected only in the Danubian and East Slovak Lowlands. Figure 8 shows that such a long Great growing season did not occur in the past in the East-Slovak Lowlands; on the contrary, at that time it was only in the south-western part of the Danube Lowlands.
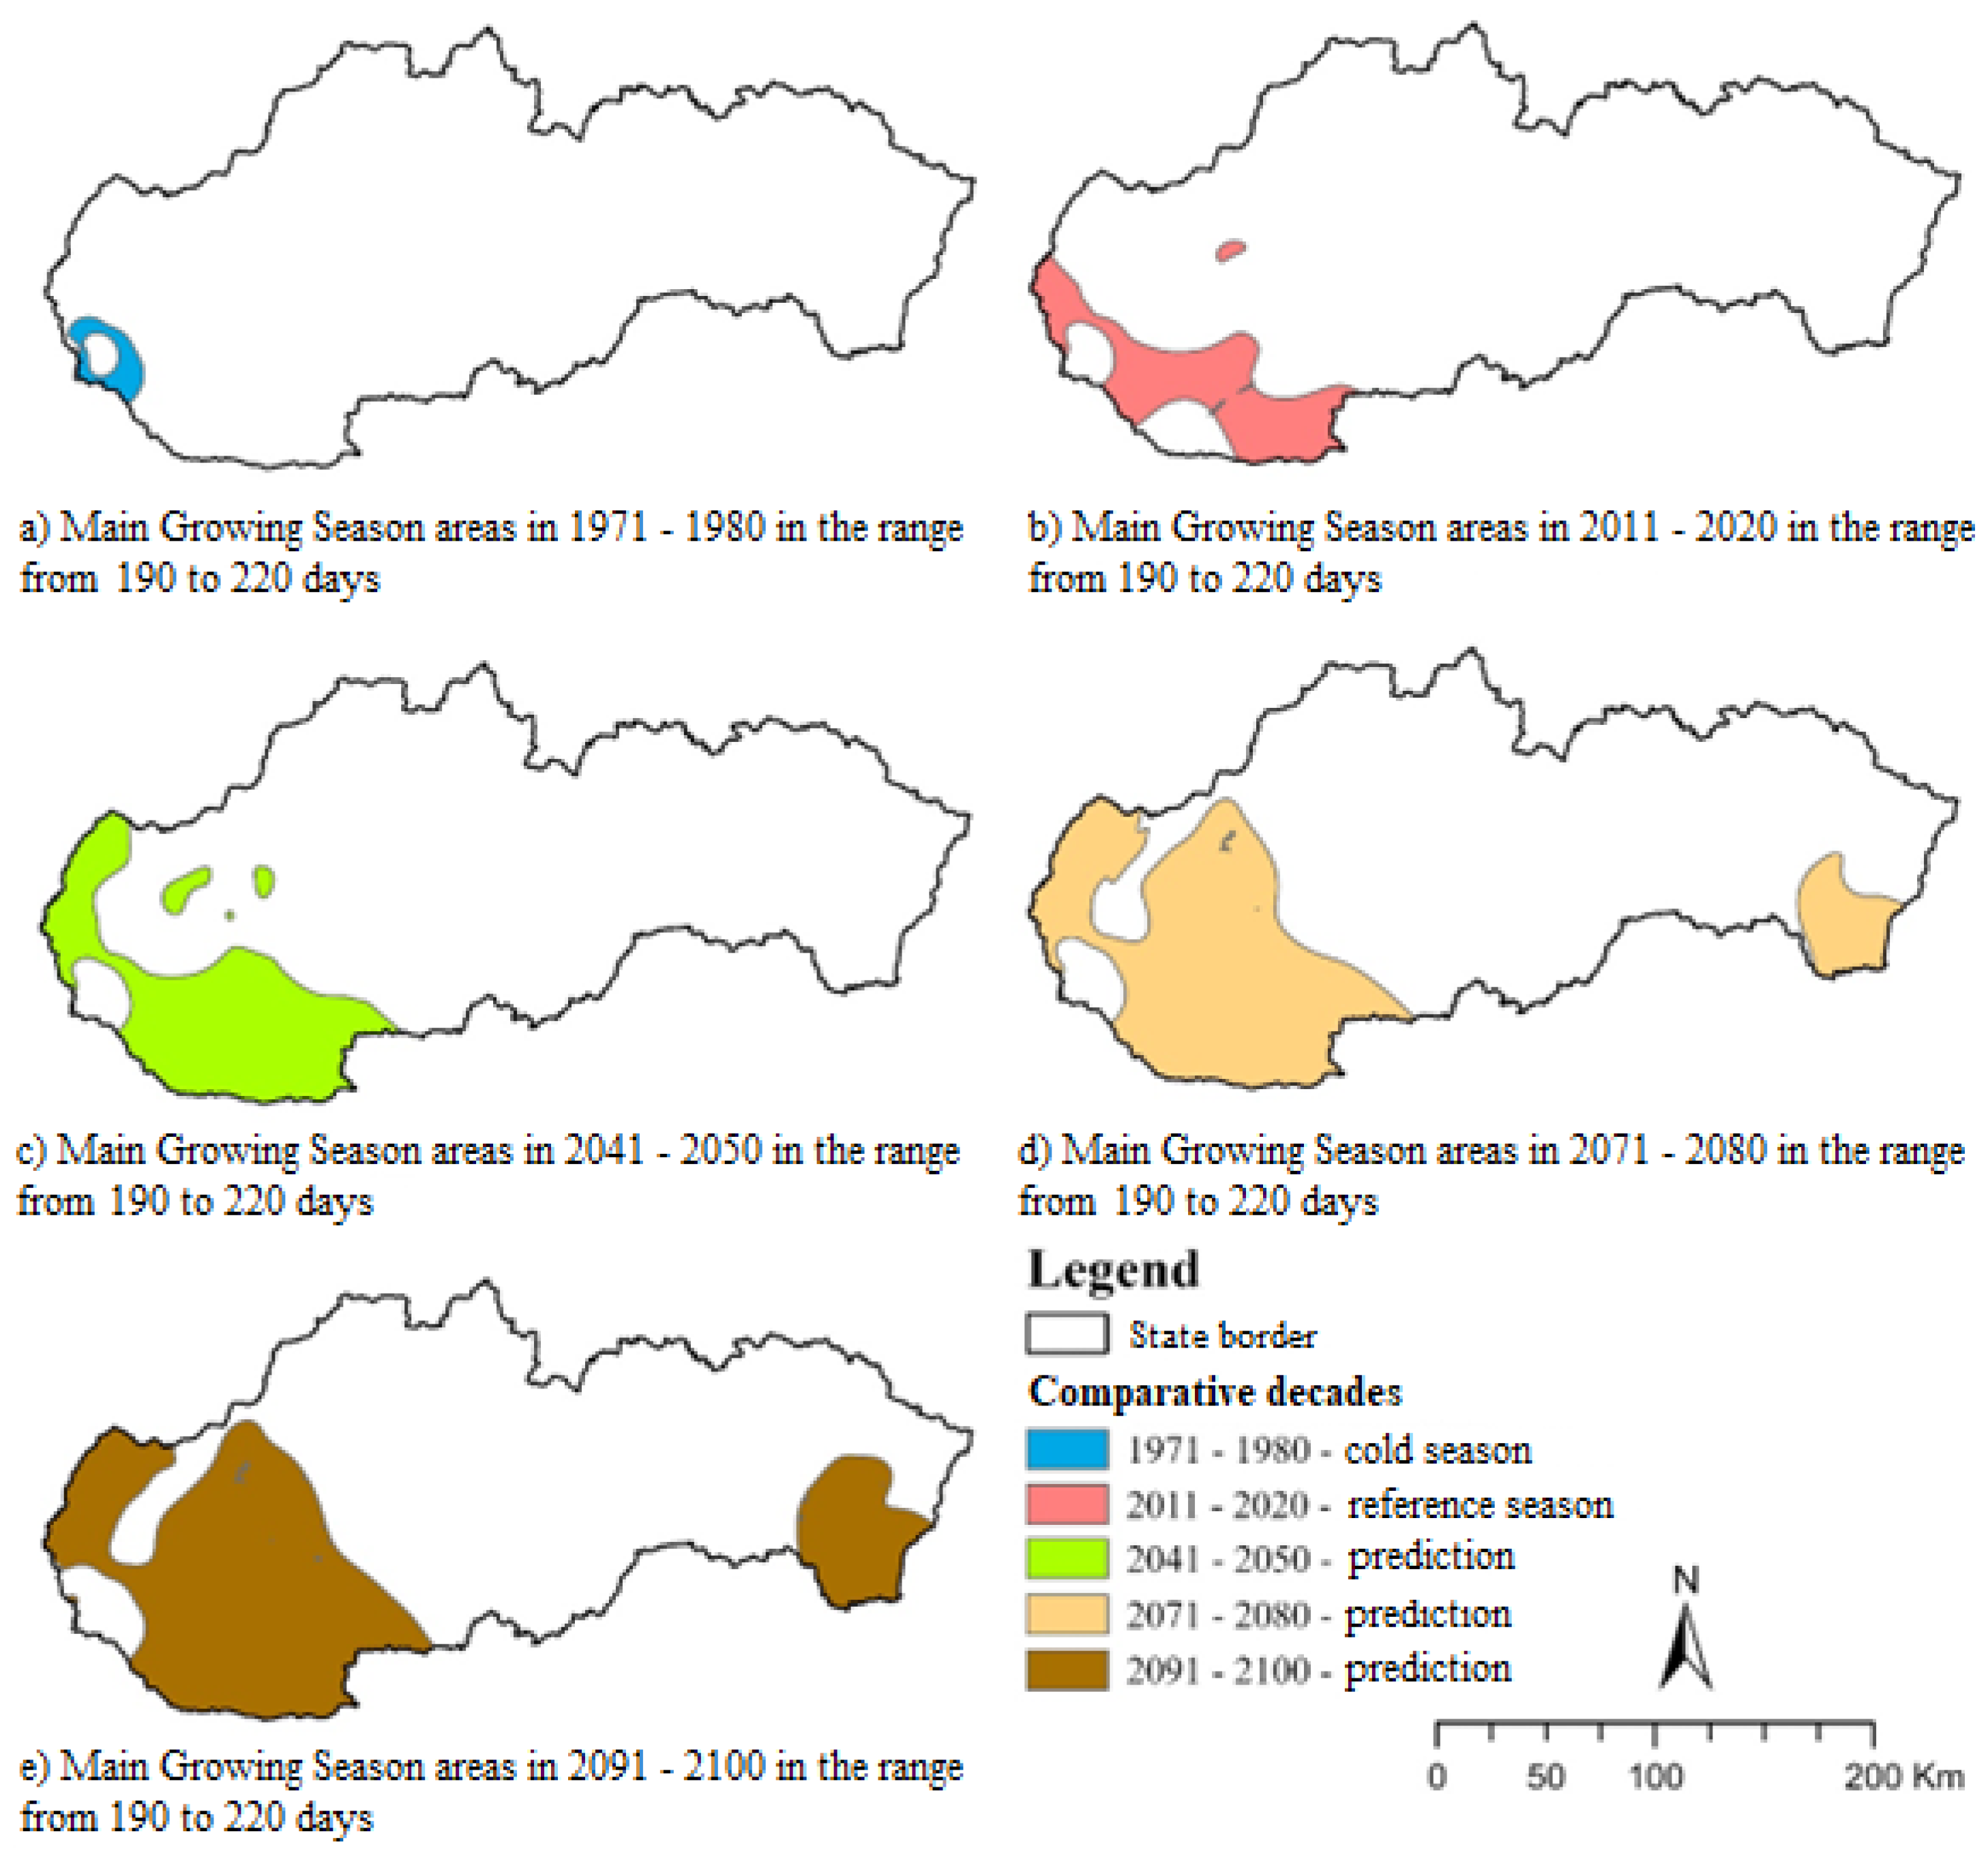
The main growing season is characterized by the onset of temperatures T > 10.0 °C. Figure 9 clearly shows that in the past the length of this period in the northern half of the area was up to 160 days. In Figure 9(b) to Figure 9(e) it can be seen that in the future the areas where lengths of up to 160 days occur are expected to decrease. In the last decade (2091-2100), this length of the main growing season will only occur in the area around the High Tatras and Spišská Nová Ves. The median length of this period (160-190 days) occurs in approximately the same area in all decades under study. However, it is clear from the maps in Figure 10(a) to (e) that while in the past this length was more likely to occur in the southern and south-western parts of the area, in the future these areas will shift northwards as far as the border with Poland. In later decades, this mean longitude (160-190 days) will not occur in the Danube Lowlands. The longest duration (190-220 days) is expected only in the south-western part of the Danube Lowlands. In the past, such a long period occurred only in the vicinity of Bratislava. In the future, this duration is expected to extend northwards and north-eastwards from Bratislava and eastwards over the area of the East-Slovak Lowlands.
Figure 9.
Areas of Main growing season in range up to 160 days in each decade.
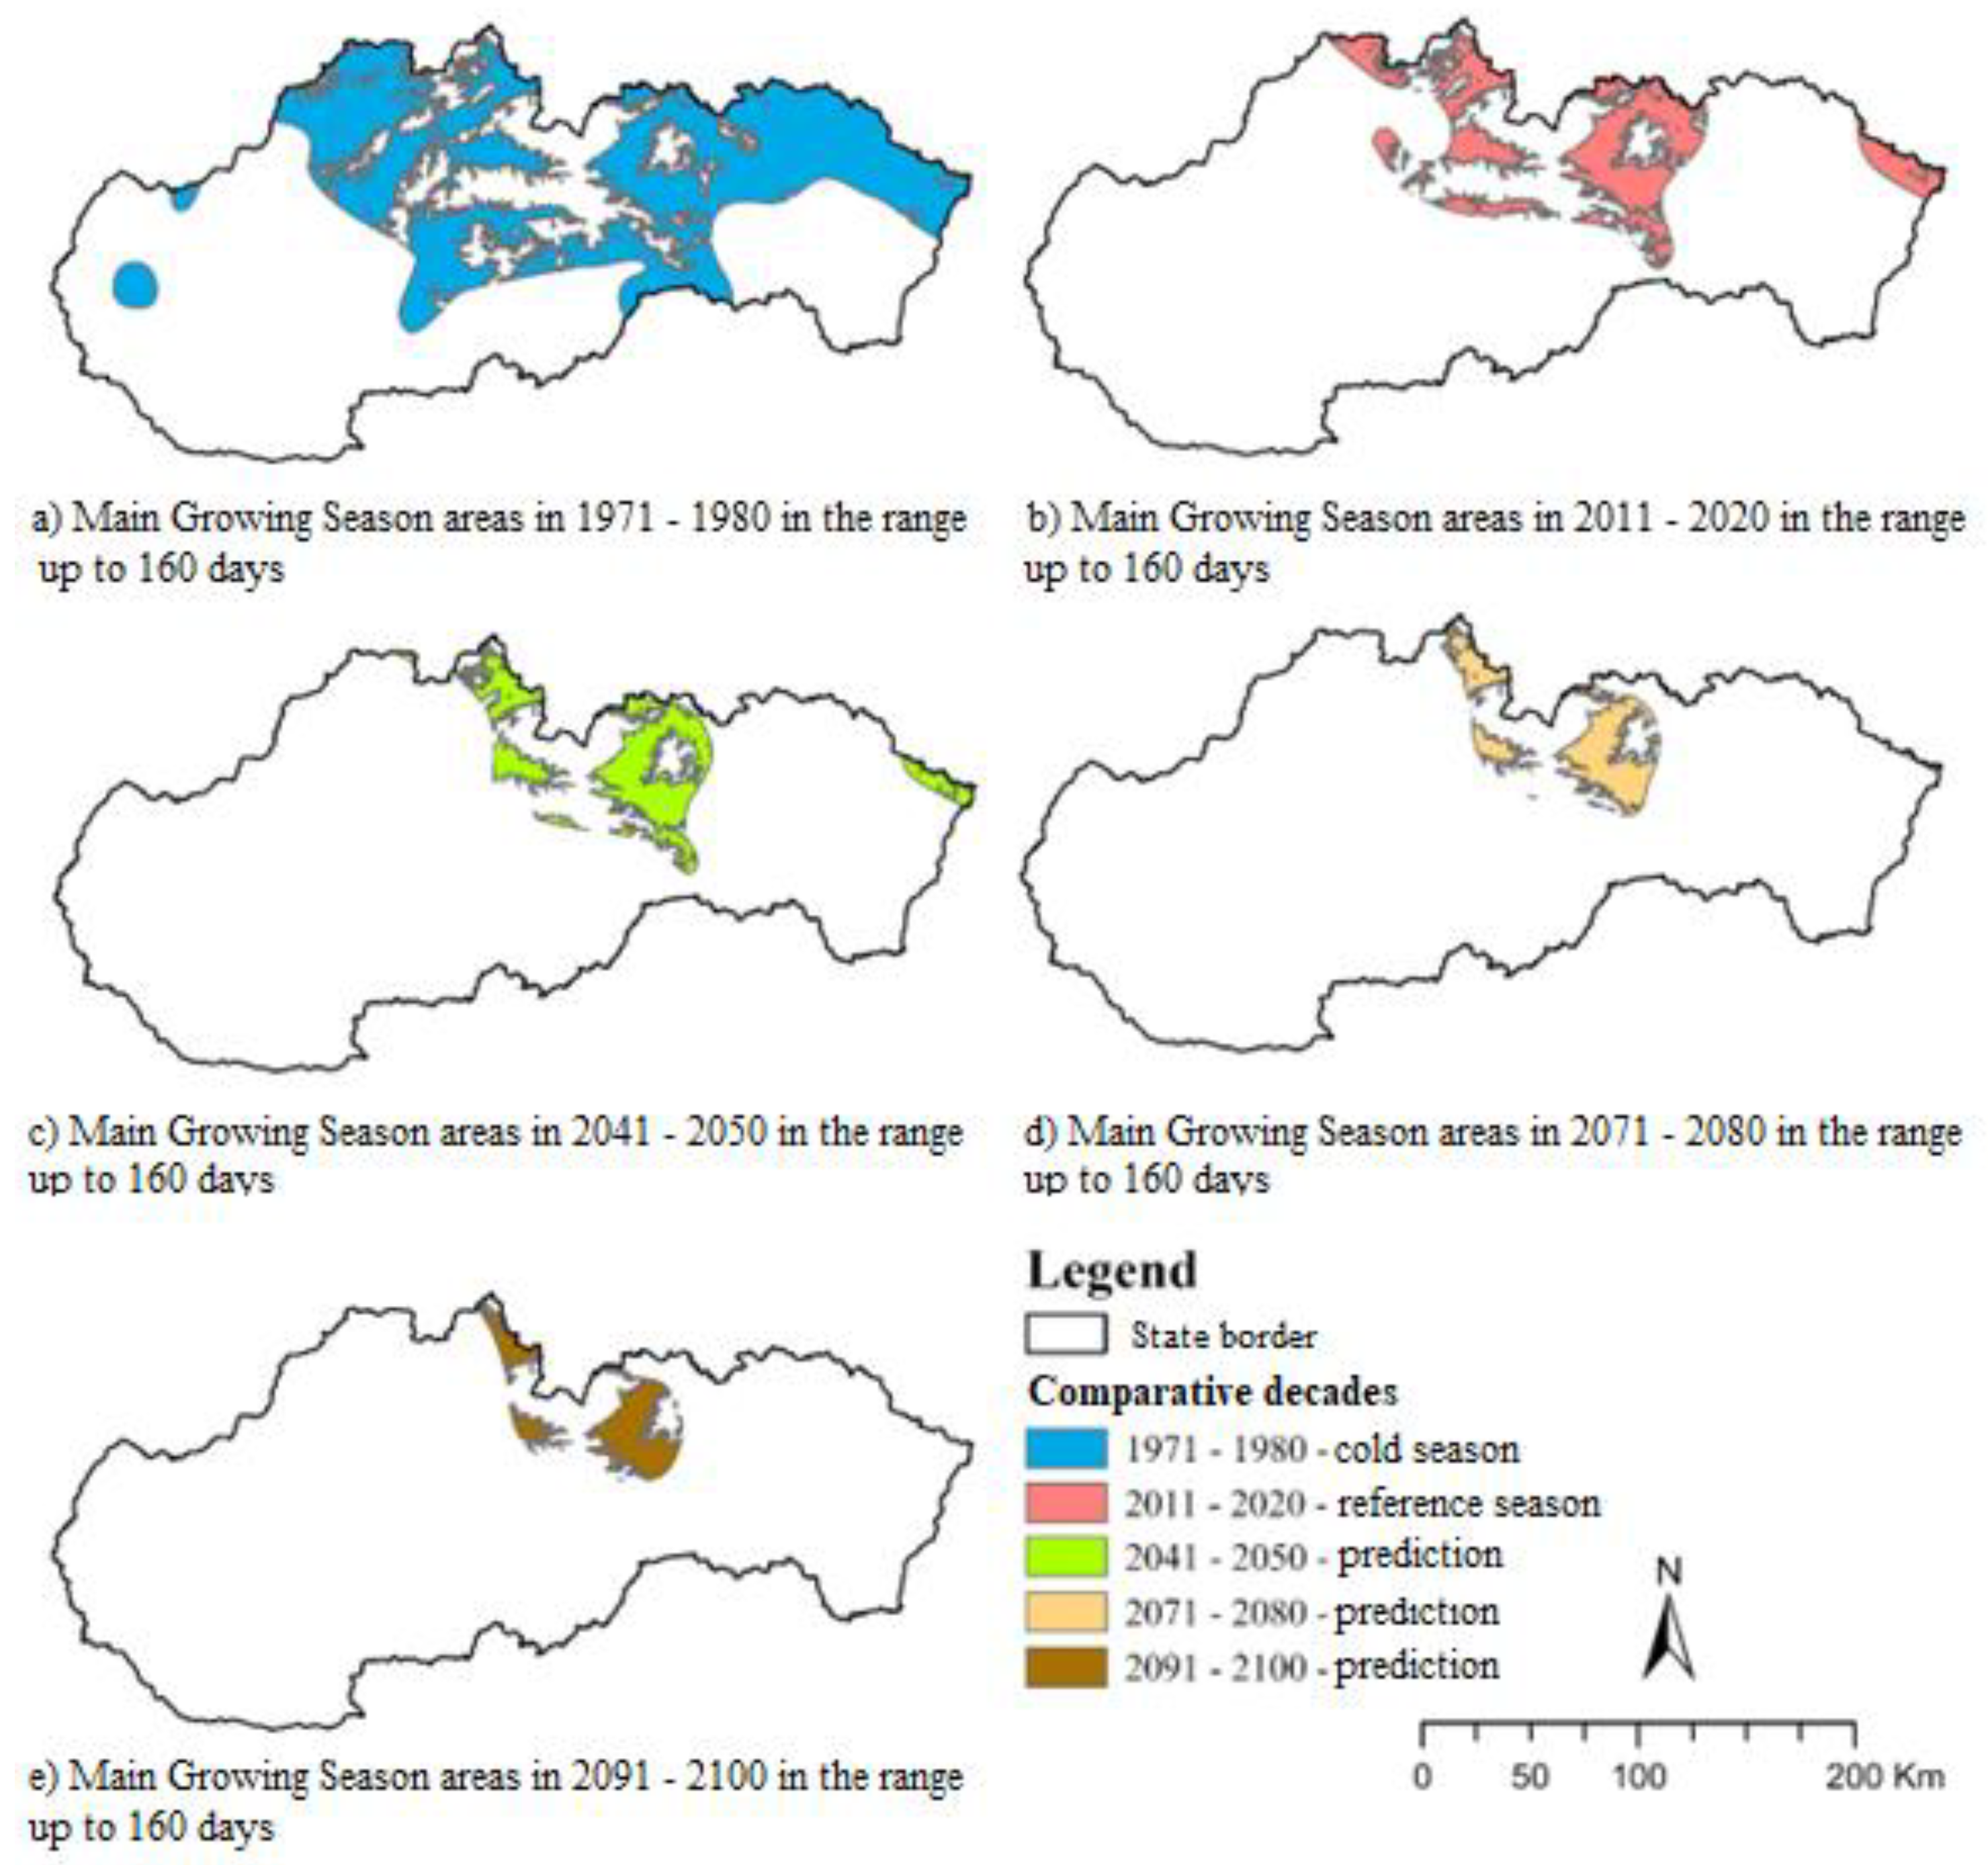
Figure 10.
Areas of Main growing season in range from 160 to 190 days in each decade (mean length).
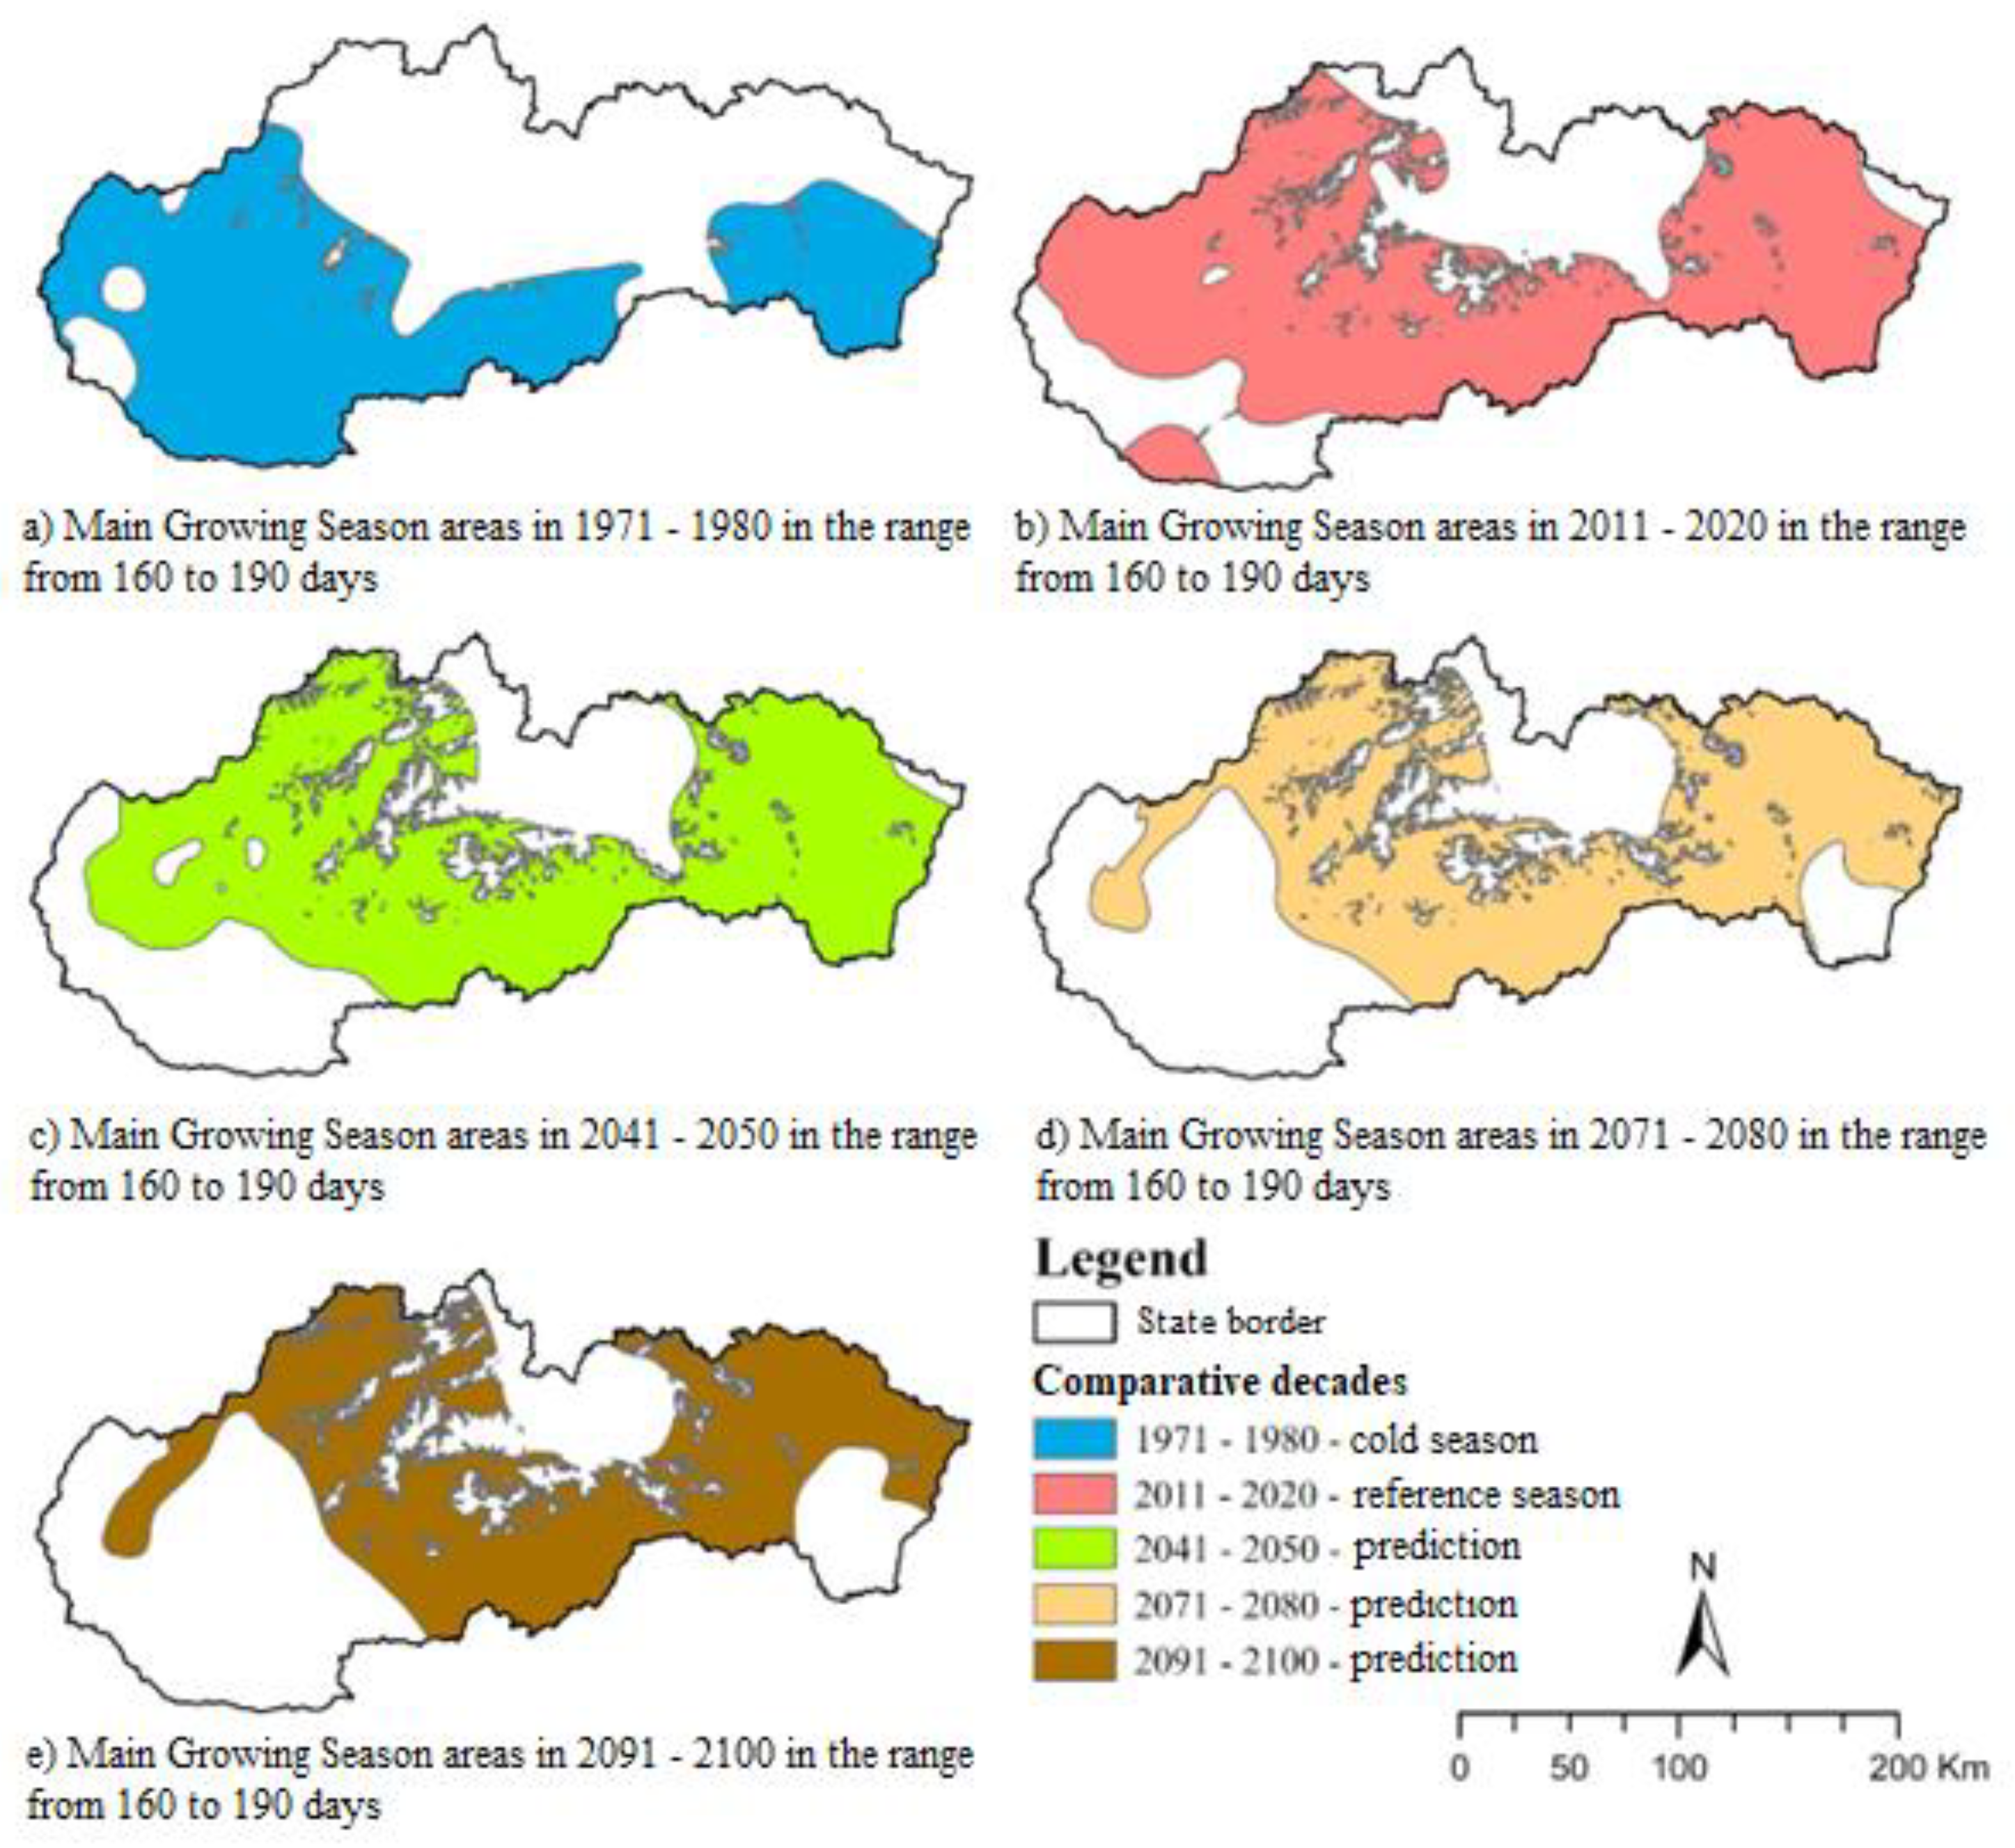
Figure 11.
Areas of Main growing season in range from 190 to 220 days in each decade.
4. Discussion
The results presented here are consistent with findings in other papers focusing on the impact of climate change on the change in onset and termination of the growing season.
According to Valšíková-Frey et al. (2011) [12], the Hurbanovo site is projected to have a delay in sowing of about 26 days for fruit and brassicas, 41 days for root and bulb vegetables, and a delay in harvesting of about 17 days for fruit and bulb vegetables, 10 days for brassicas and 12 days for root vegetables by the year 2075 compared to the present.
According to Spanik et al. (2007) [13], who analyzed the change in growing season of selected fruiting (tomato and bell pepper), brassica (white cabbage), and root (carrot, carrot, and turnip) vegetables grown under field conditions from sowing in response to climate change under the scenarios of the Canadian Climate Center Model (CCCM) 2000 global general circulation model (GCM 2000) scenarios in their work. The analyses show a 21-26% increase in the growing season to 2075 for the analysed species of greenery at the Hurbanovo and Liptovský Hrádok sites.
Christiansen E. Daniel et al (2011) [14] in their work investigated the change in growing season length caused by climate change. The research was conducted at 14 experimental sites evenly distributed across eleven states in the USA. Climate conditions between 2001 and 2099 were modelled based on input data. The authors report that the growing season is expected to lengthen by an average of 27 to 47 days in all study areas. Furthermore, an earlier onset of emergence and flowering is expected in all areas, as well as a later end of the growing season in autumn.
In 2018, Sarraf Sari Behroz et al. (2018) [15] conducted a study where they tried to predict future developments based on the climatic conditions to date. They also tried to find out how the length of the growing season in Iran will increase. Daily meteorological data were obtained from 43 synoptic stations. These data show the evolution of meteorological indices for the period 1981 to 2010. Based on these data, the trend for the next 85 years was estimated. The results confirmed that by 2100, the growing season is expected to be extended by an average of 27 days in the territory of Iran. Also, the onset of the growing season is expected to be earlier and the end of the growing season later in most of the territory. In addition to an increase in the length of the growing season, minimum and maximum daily and monthly temperatures are expected to increase.
Ebru E. Arslantaş and Ercan Yeşilırmak in their 2020 [16] study evaluated changes in growing season length in Western Anatolia, Turkey. They had meteorological data from 35 stations for the period 1966-2015. It was found that the elevation of the stations strongly influences the beginning, end, and length of the growing season. The areas with lower elevation have earlier onset of growing season and later termination. Conversely, as altitude increases, the growing season starts later and ends earlier. At a threshold of 5 °C, the length of the growing season was extended by 12 days, of which the onset was delayed by 7.3 days. At 10 °C, the start was delayed by 10.5 days and the end by 6.2 days, resulting in an increase in the length of the growing season of up to 15.9 days.
5. Conclusions
In this paper, the variation of the Great growing season (GGS), the main growing season (MGS), bounded by the onset and termination of days with mean daily temperature TGGS ≥ 5,0 °C and TMGS ≥ 10,0 °C, is analyzed.
Agroclimatic analyses have shown that over the last 30 years there has been an earlier onset of the growing season in spring, but also a delay. For the major growing season, the growing season is projected to increase by an average of 25-30 days towards the 2091-2100 horizon compared to the present, and for the main growing season by an average of 20 days.
The results suggest that a longer length of the main and major growing seasons can be expected on larger areas in the future. In addition to the lengthening of growing seasons, individual areas are also expected to shift to higher altitudes. For the great growing season, the category representing a period of 220-240 days is the largest in all the decades studied. This length of the long growing season occurs over an area of approximately 1 700 000 - 2 300 000 ha. It should be noted that lengths above 260 days did not occur in 1971-1980. On the other hand, the areas where this length occurs are expected to increase in the future. In 2100, for example, this will be as high as 55 000 ha.
The main growing season has the largest representation in the 160-190 day category. This length was present in 1971-1980 on an area of approximately 2 500 000 ha. Approximately the same area will be covered in 2100. An increase in area is expected in the future only for lengths of up to 220 days. A length of more than 220 days in the main growing season will only occur on negligible areas of up to 50 000 ha.
The achieved results and map outputs can be applied as background material for adaptation measures, in agronomic practice, breeding plans, building irrigation systems, crop protection and nutrition, etc. of the analyzed vegetable species.
Author Contributions
Conceptualization, D.I. and Č.J.; methodology, D.I. and Č.J.; software, M.M:; validation, D.I., T.A. and B.Z.; formal analysis, T.A..; investigation, D.I.; resources, Č.J., T.A. and M.M.; data curation, M.M..; writing—original draft preparation, D.I.; writing—review and editing, Č.J. and B.M.; visualization, M.M.; supervision, Č.J.; project administration, Č.J. and D.I.; funding acquisition, Č.J. All authors have read and agreed to the published version of the manuscript.
Funding
This research was funded by THE CULTURAL AND EDUCATIONAL GRANT AGENCY, grant number KEGA 026SPU-4/2023.
Institutional Review Board Statement
Not applicable
Informed Consent Statement
Not applicable
Data Availability Statement
The data that support the findings of this study are available on request from the corresponding author.
Conflicts of Interest
The authors declare no conflicts of interest.
References
- Muchová, Z.; Tárniková, M. Land cover change and its influence on the assessment of the ecological stability. Appl. Ecol. Environ. Res. 2018, 16, 2169–2182. [Google Scholar] [CrossRef]
- Bąk B., Łabędzki L. Thermal conditions in Bydgoszcz Region in growing seasons of 2011–2050 in view of expected climate change. Journal of Water and Land Development 2014, No. 23 (X–XII) p. 21–29. [CrossRef]
- Sabella, E.; Aprile, A.; Negro, C.; Nicoli, F.; Nutricati, E.; Vergine, M.; Luvisi, A.; De Bellis, L. Impact of climate change on durum wheat yield. Agronomy 2020, 10, 793. [Google Scholar] [CrossRef]
- Magugu J.W., Feng S., Huang Q, Zhang Y., West G.H. Analysis of future climate scenarios and their impact on agri-culture in eastern Arkansas, United States. Journal of Water and Land Development 2018, No. 37 (IV–VI) p. 97–112. [CrossRef]
- Bakkenes M., Alkemade R.M., Ihle F., Leeman R., Latour J.B. Assessing effects of forecasted climate change on the diversity and distribution of European higher plants for 2050. Global Change Biology. 2002, Vol. 8 p. 390–407. [CrossRef]
- Čimo, J., Aydin, E., Šinka, K., Tárník, A., Kišš, V., Halaj, P.,Toková, L., - Kotuš, T. Change in the Length of the Vegetation Period of Tomato (Solanum lycopersicum L.), White Cabbage (Brassica oleracea L. var. capitata) and Carrot (Daucus carota L.) Due to Climate Change in Slovakia. Agronomy-Basel 2020, ISSN 2073-4395 online, vol. 10, iss. 8, article number 1110, [14 s.]. [CrossRef]
- Molnárová, J., Čimo, J., Špánik, F. The agroclimatical analysis of production process of spring barley. In Analele Universitatii din Oradea 2010, ISSN 1583-4301, vol. 9, s. 639-661.
- Pretel J., Metelka L., Novický O., Daňhelka J., Rožnovský J., Janouš D. Refinement of existing estimates of climate change impacts in the water management, agriculture and forestry sectors and proposals for adaptation measures. Final Report on the Solution of the R&D Project SP/1a6/108/07 in the years 2007–2011 2011, Praha, Czech Republic. ČHMÚ.
- SHMU: Climatic conditions of the Slovak Republic. Available online: https://www.shmu.sk/sk/?page=1064 (accessed on 16 October 2025).
- Šinka K., Muchová Z., Konc Ľ. Geographic information systems in spatial planning 2015, SAU, Nitra. ISBN 978-80-552-1444-3.
- ESRI: How Topo to Raster works. https://desktop.arcgis.com/en/arcmap/latest/tools/spatial-analyst-toolbox/how-topo-to-raster-works.htm (accessed on 16.10.2025). (accessed on day month year).
- Valšíková M., Čimo J., Špánik F. Horticulture in conditions of climate change. Meteorological journal 2011, Vol. 14. No. 2 p. 69–72.
- Špánik, F., Valšíková-Frey, M., Čimo, J., Change in the temperature security of basic types of vegetables in conditions of climate change. Acta horticulturae et regiotecturae 2007, ISSN 1335-2563, 2007, vol. 10, No. 2, p. 42-45.
- Christiansen, D. E., Markstrom, S. L., Hay, L. E. 2011. Impacts of Climate Change on the Growing Season in the United States. Earth Interactions 2011, 15(33), 1-17. [CrossRef]
- Sarraf, B. S., Khorshiddost, A. M., MahmoudI, P., Daraei, M. Impacts of climate change on the growing season in the Iran. Italian Journal of Agrometeorology 2018, No. 3. [CrossRef]
- Arslantas¸ E.E., Yes¸ilırmak E. Changes in the climatic growing season in western Anatolia, Turkey. Meteorol. Appl. 2020, 27:e1897. [CrossRef]
Figure 1.
Network of meteorological stations of SHMI.
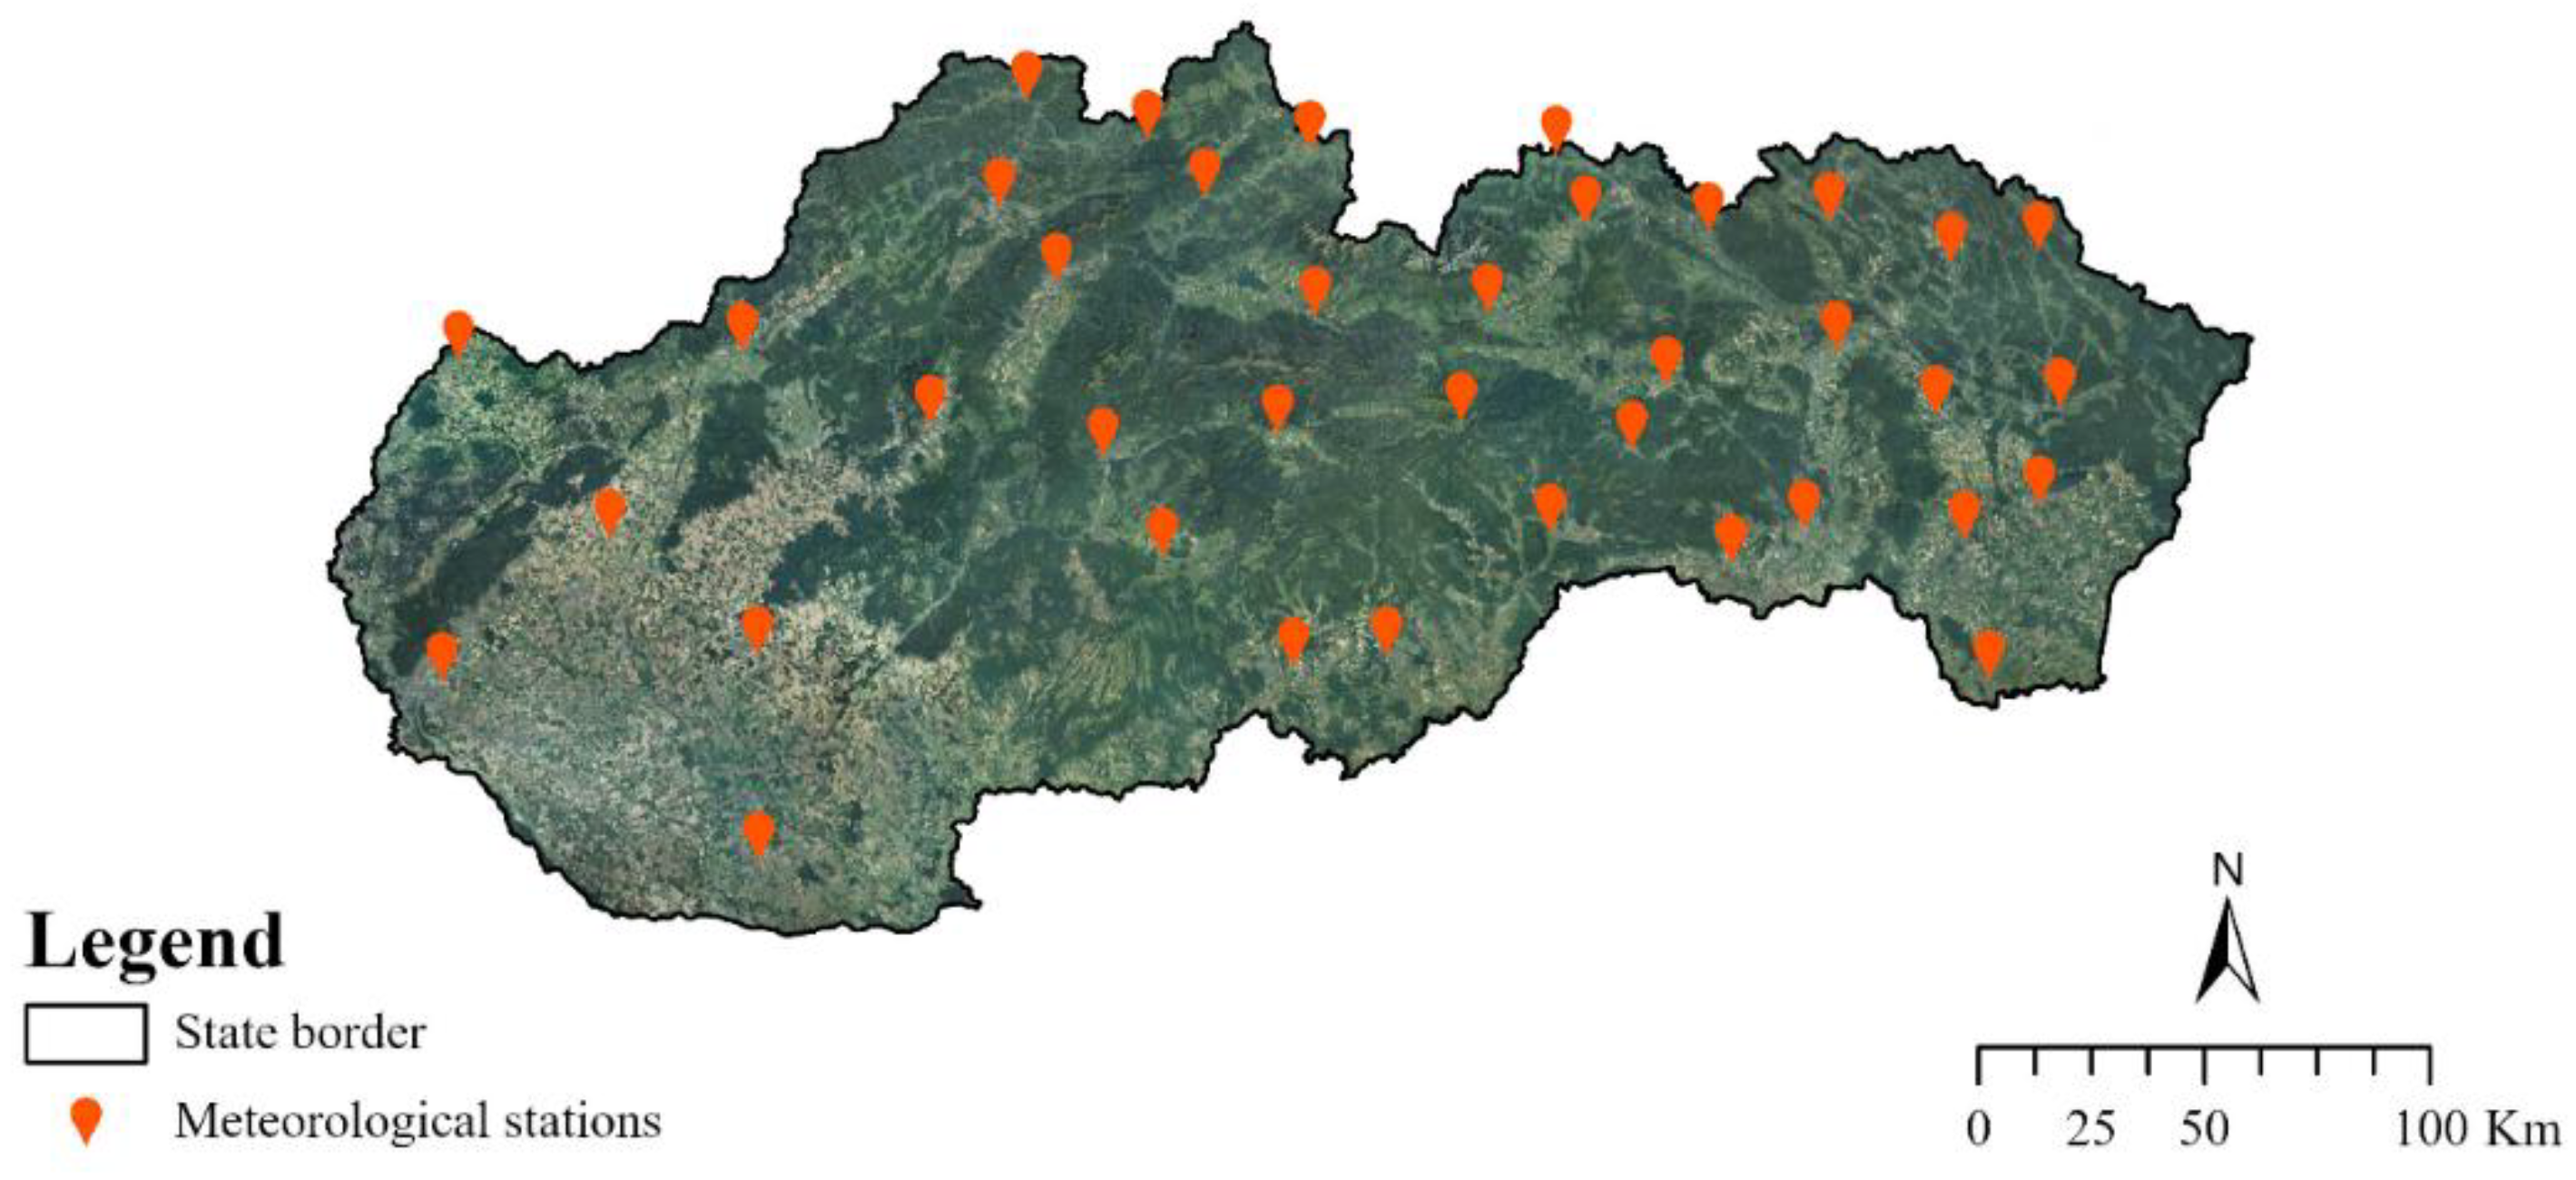
Figure 2.
Duration of Great growing season in each decade.
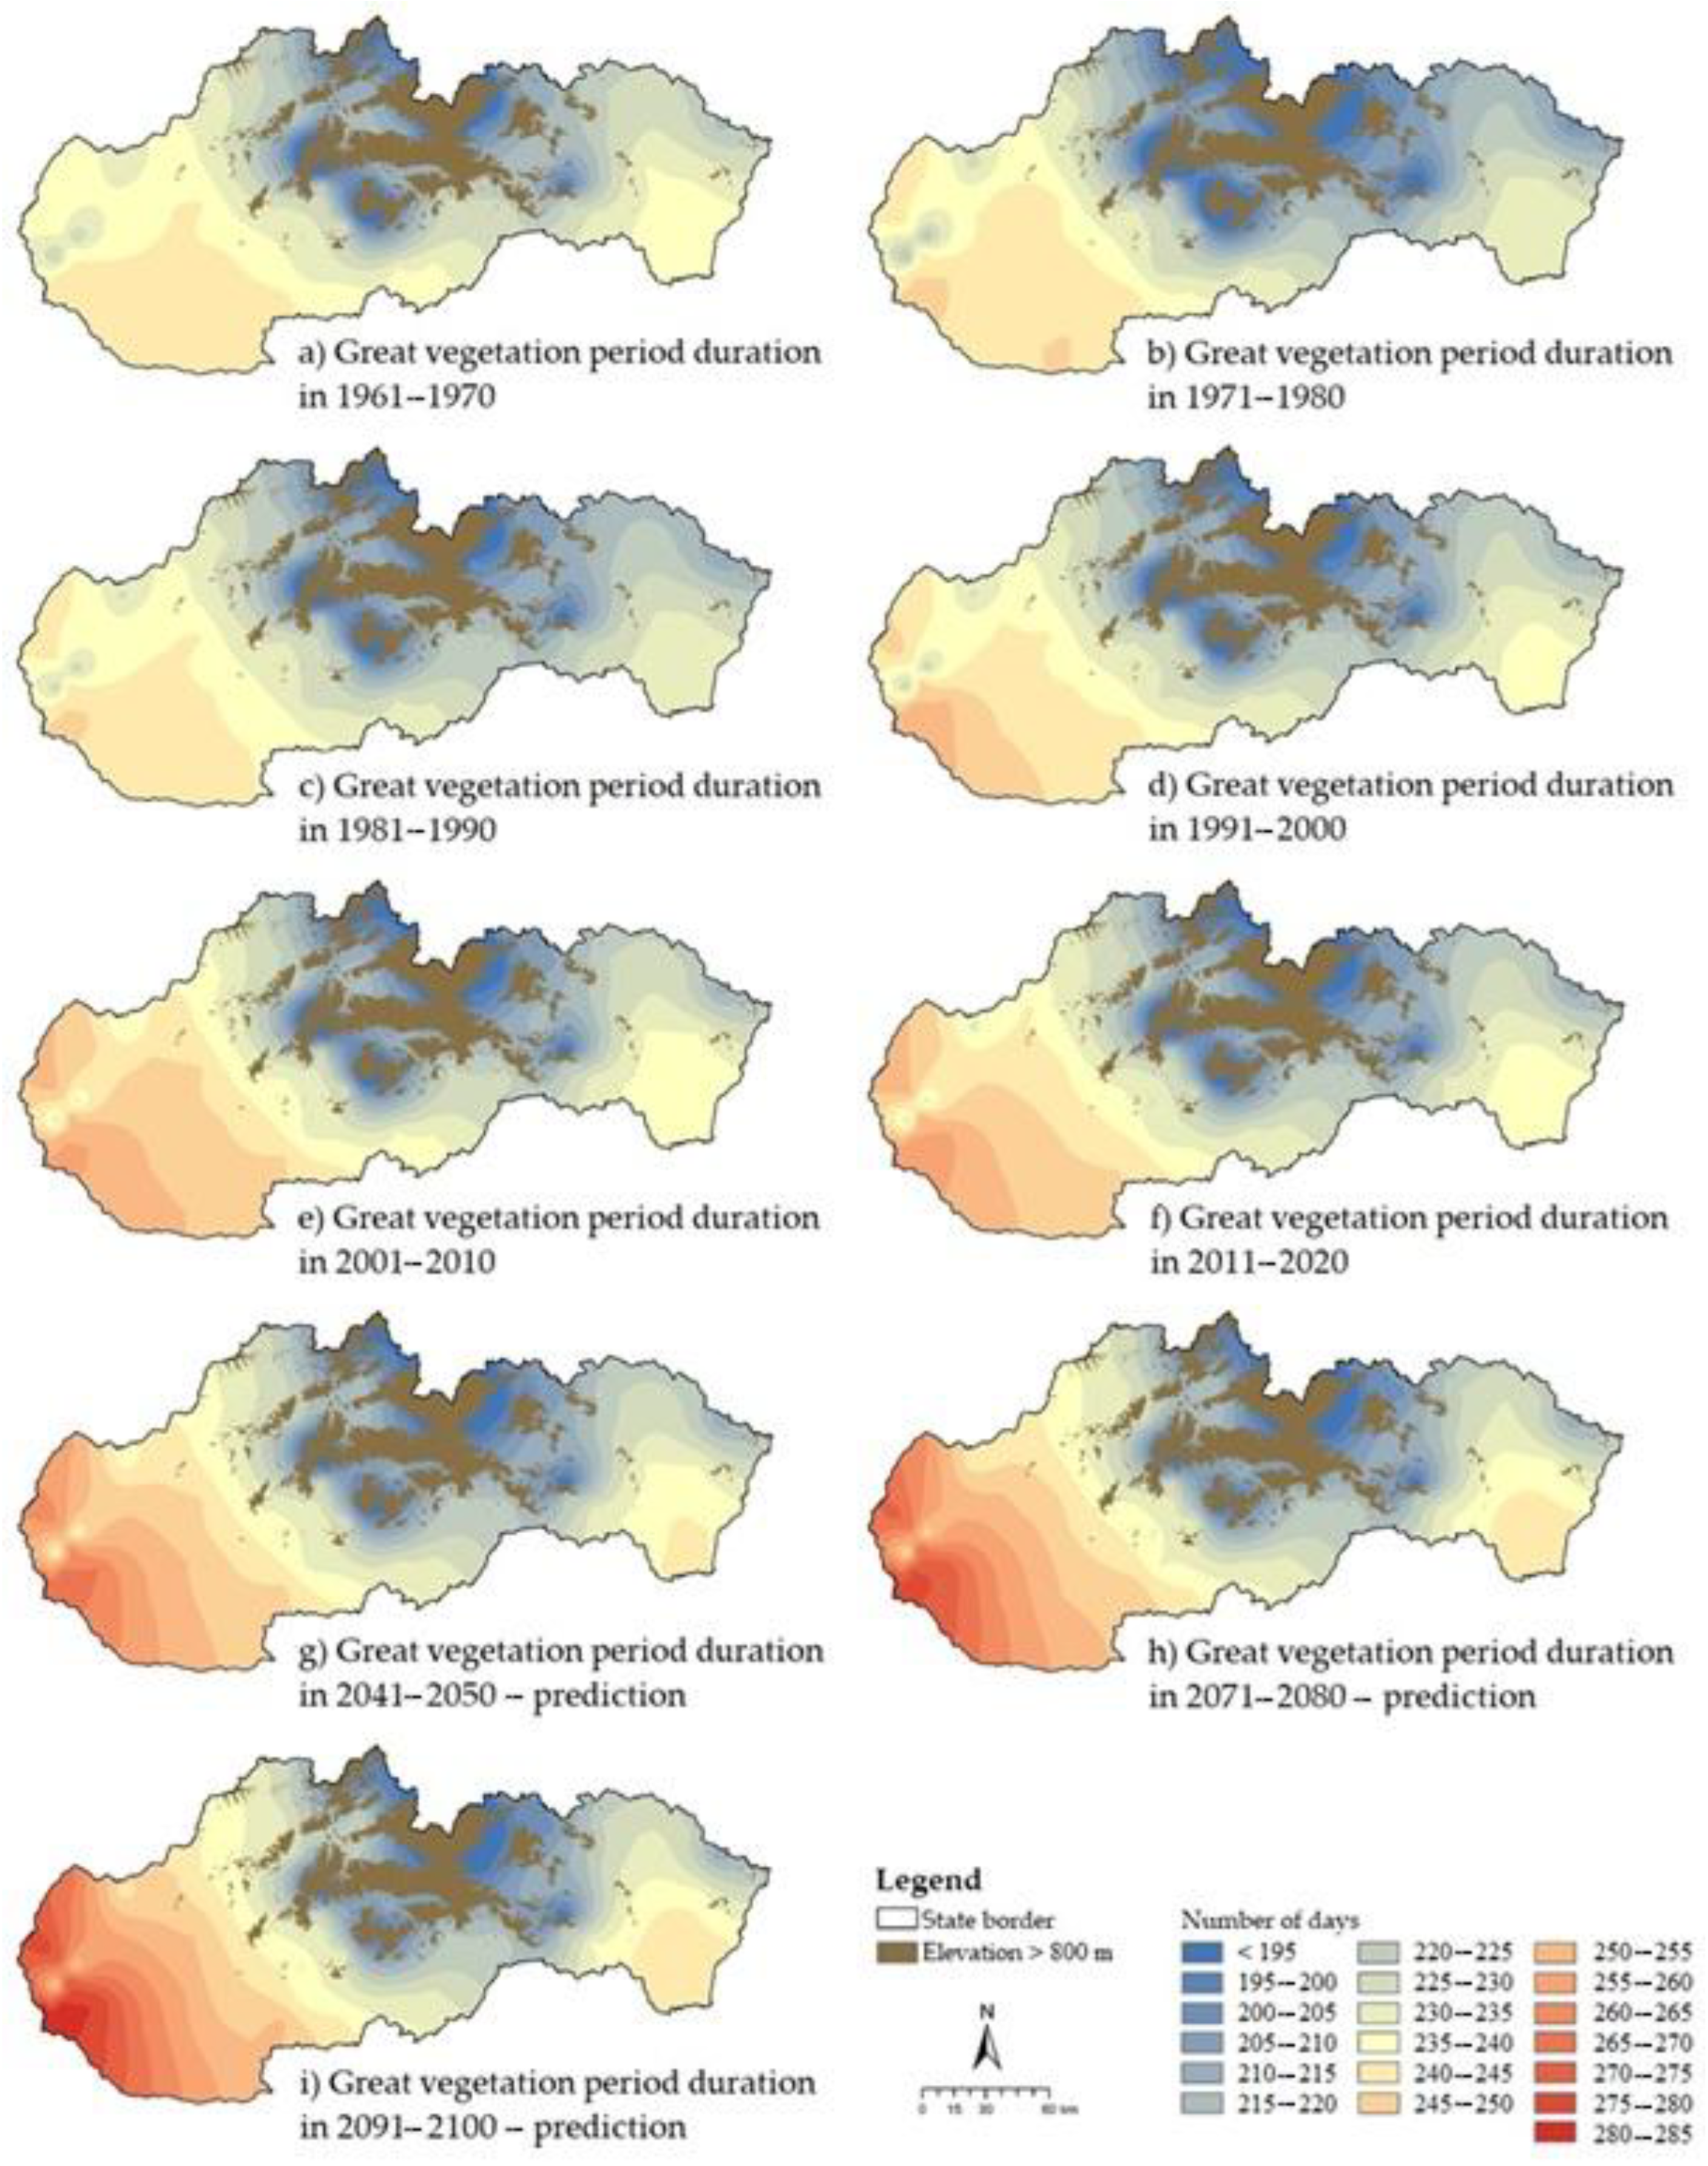
Figure 3.
Duration of Main growing season in each decade.
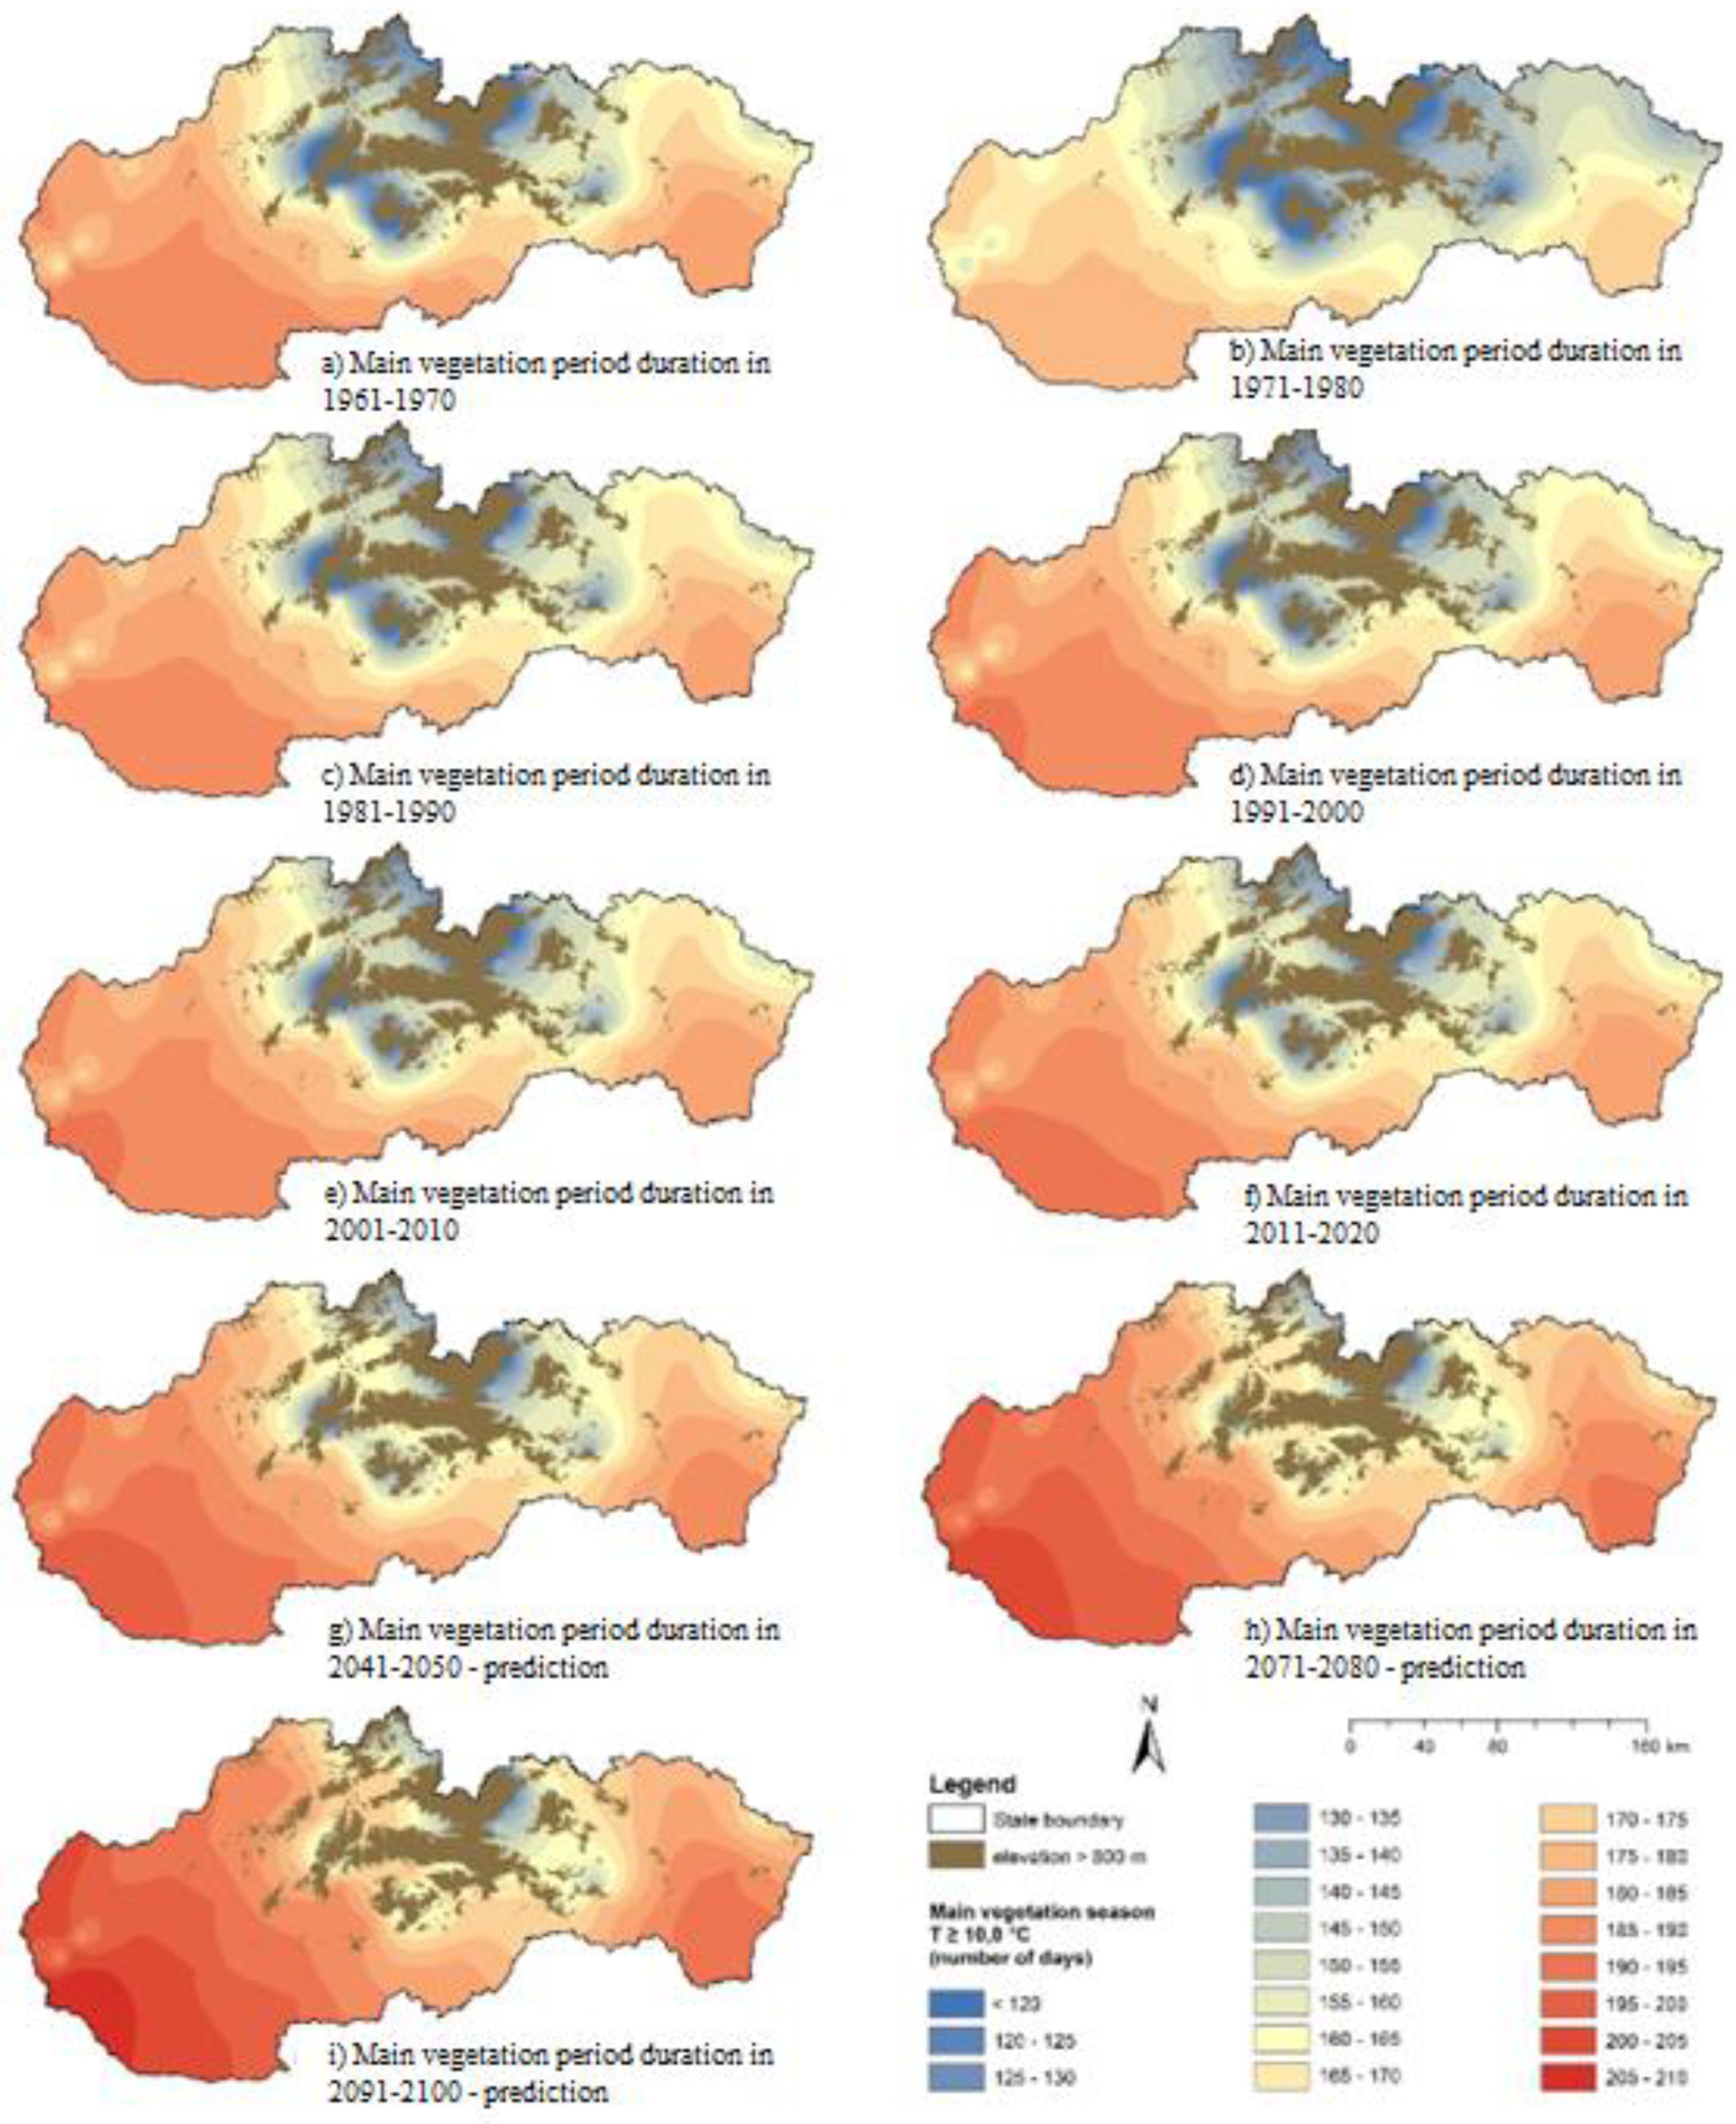
Figure 4.
Acreage representation of the Great Growing Season in each day interval.
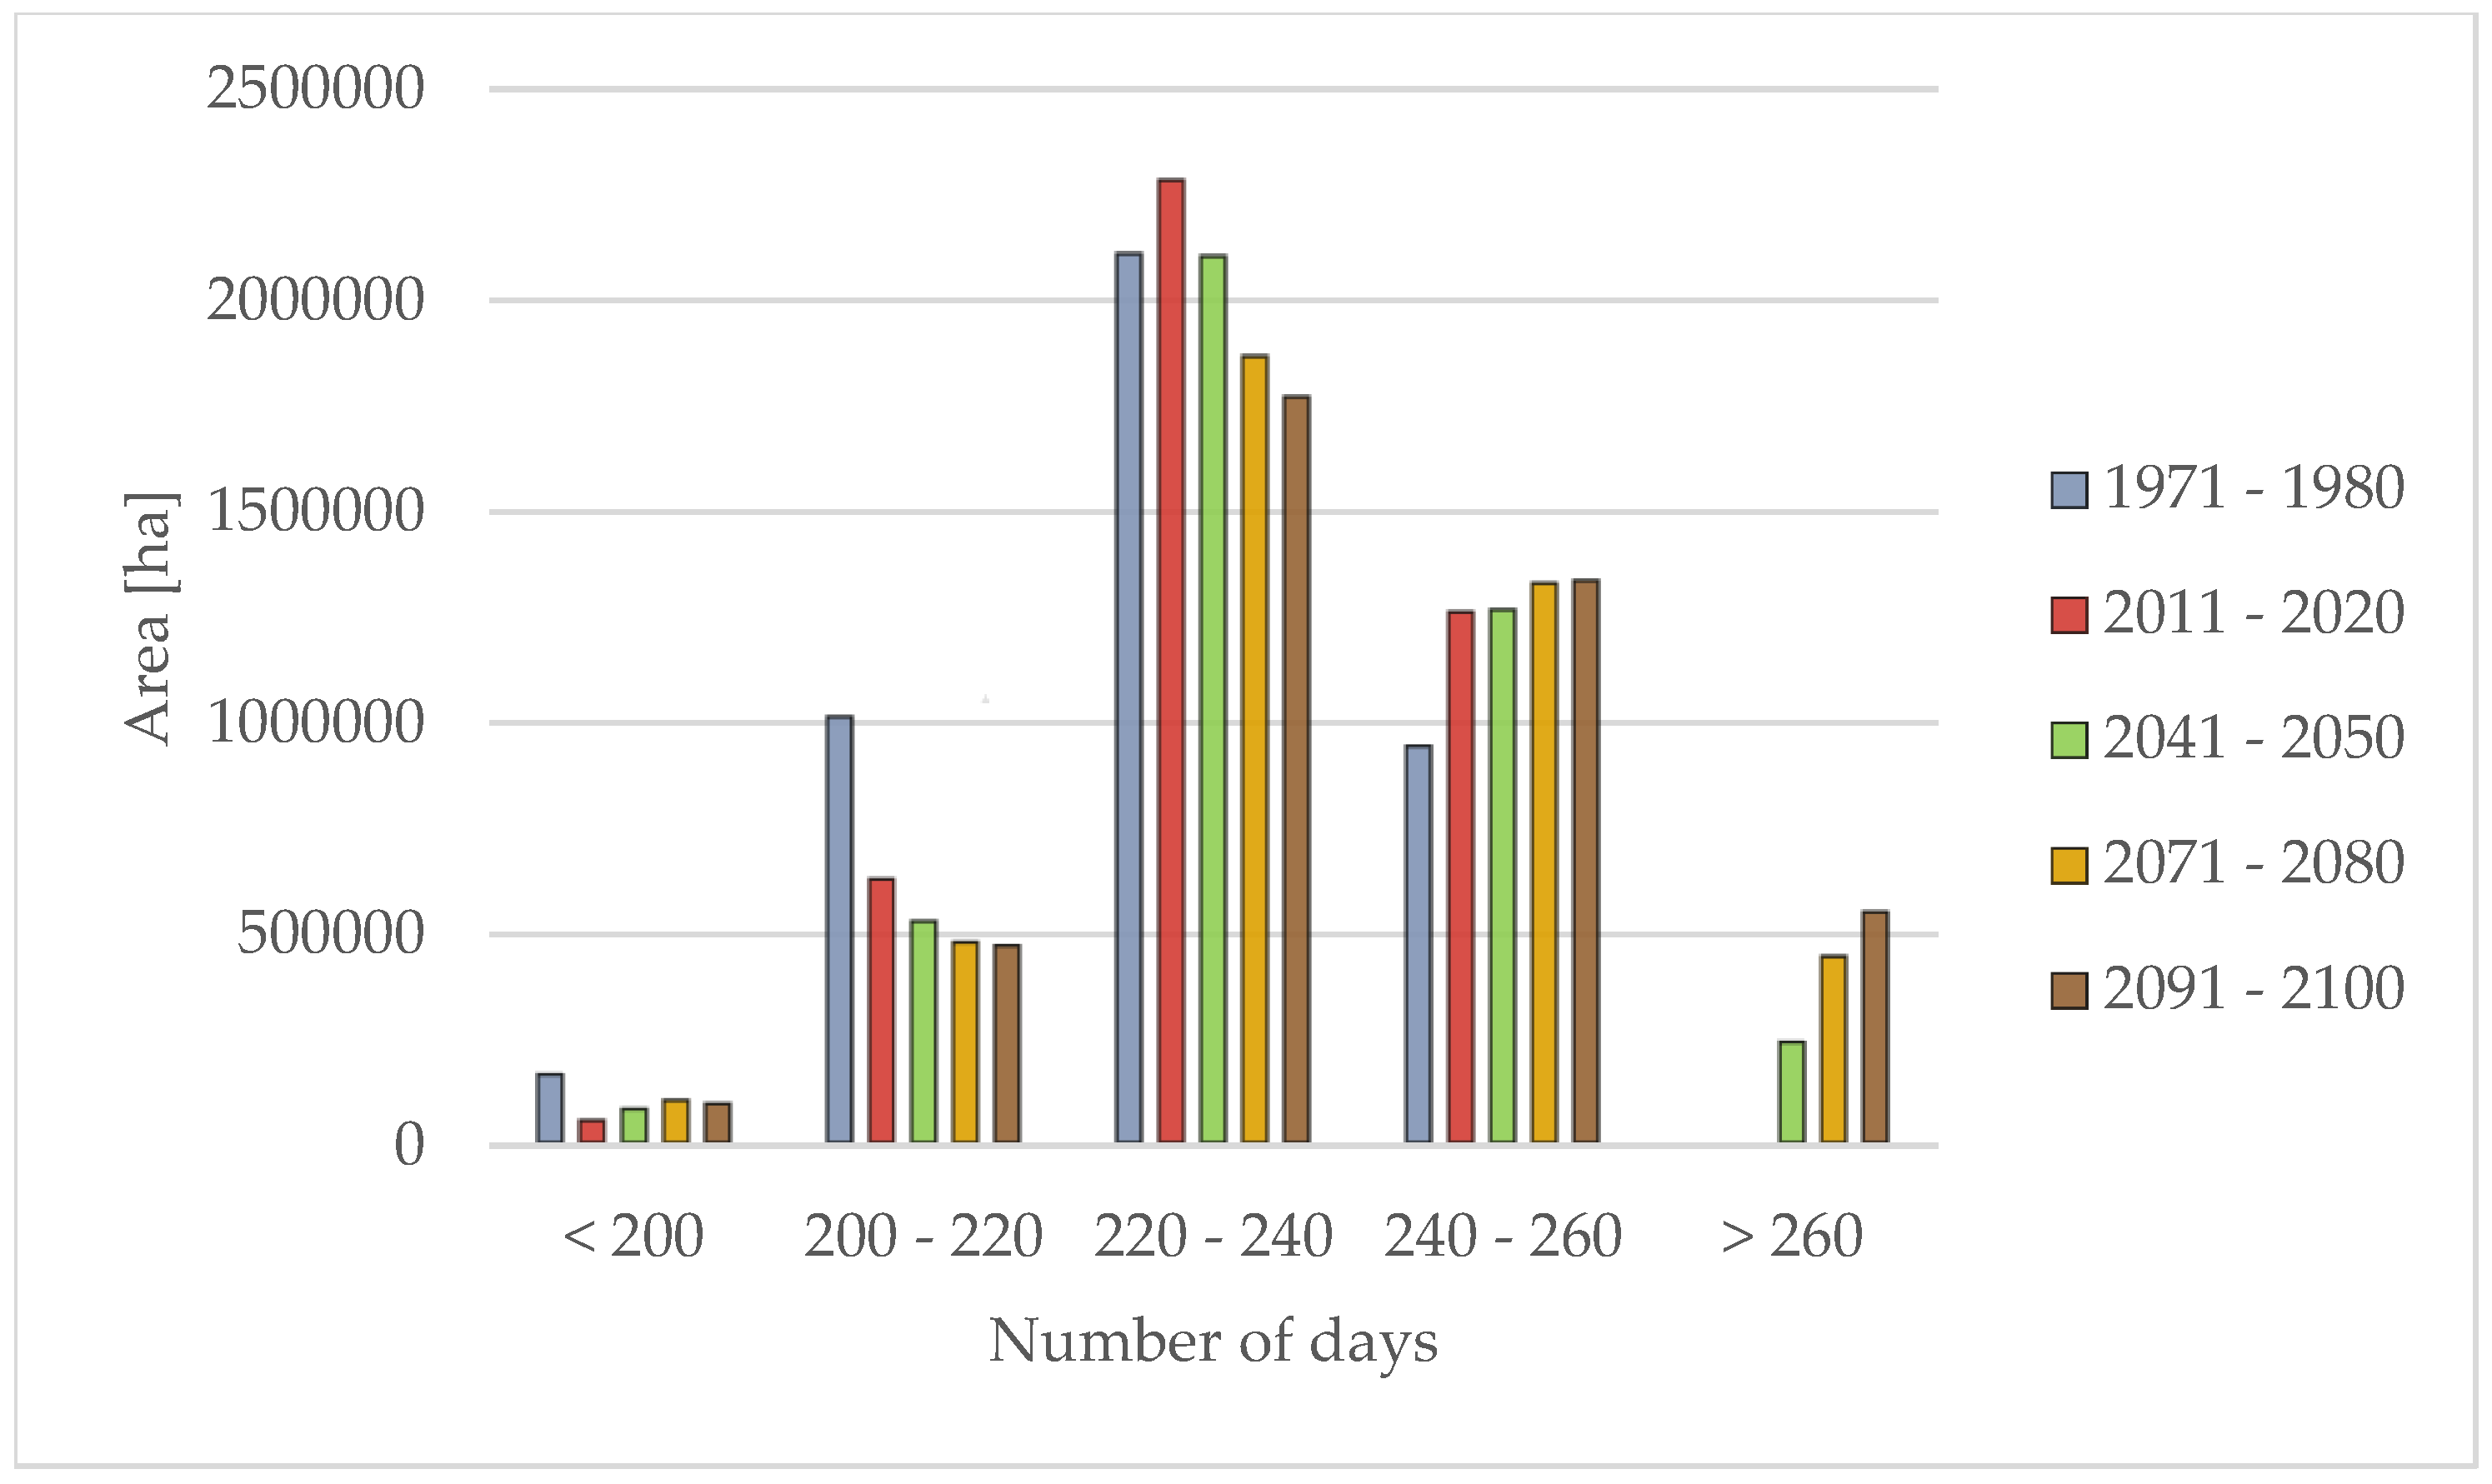
Figure 5.
Acreage representation of the Main Growing Season in each day interval.
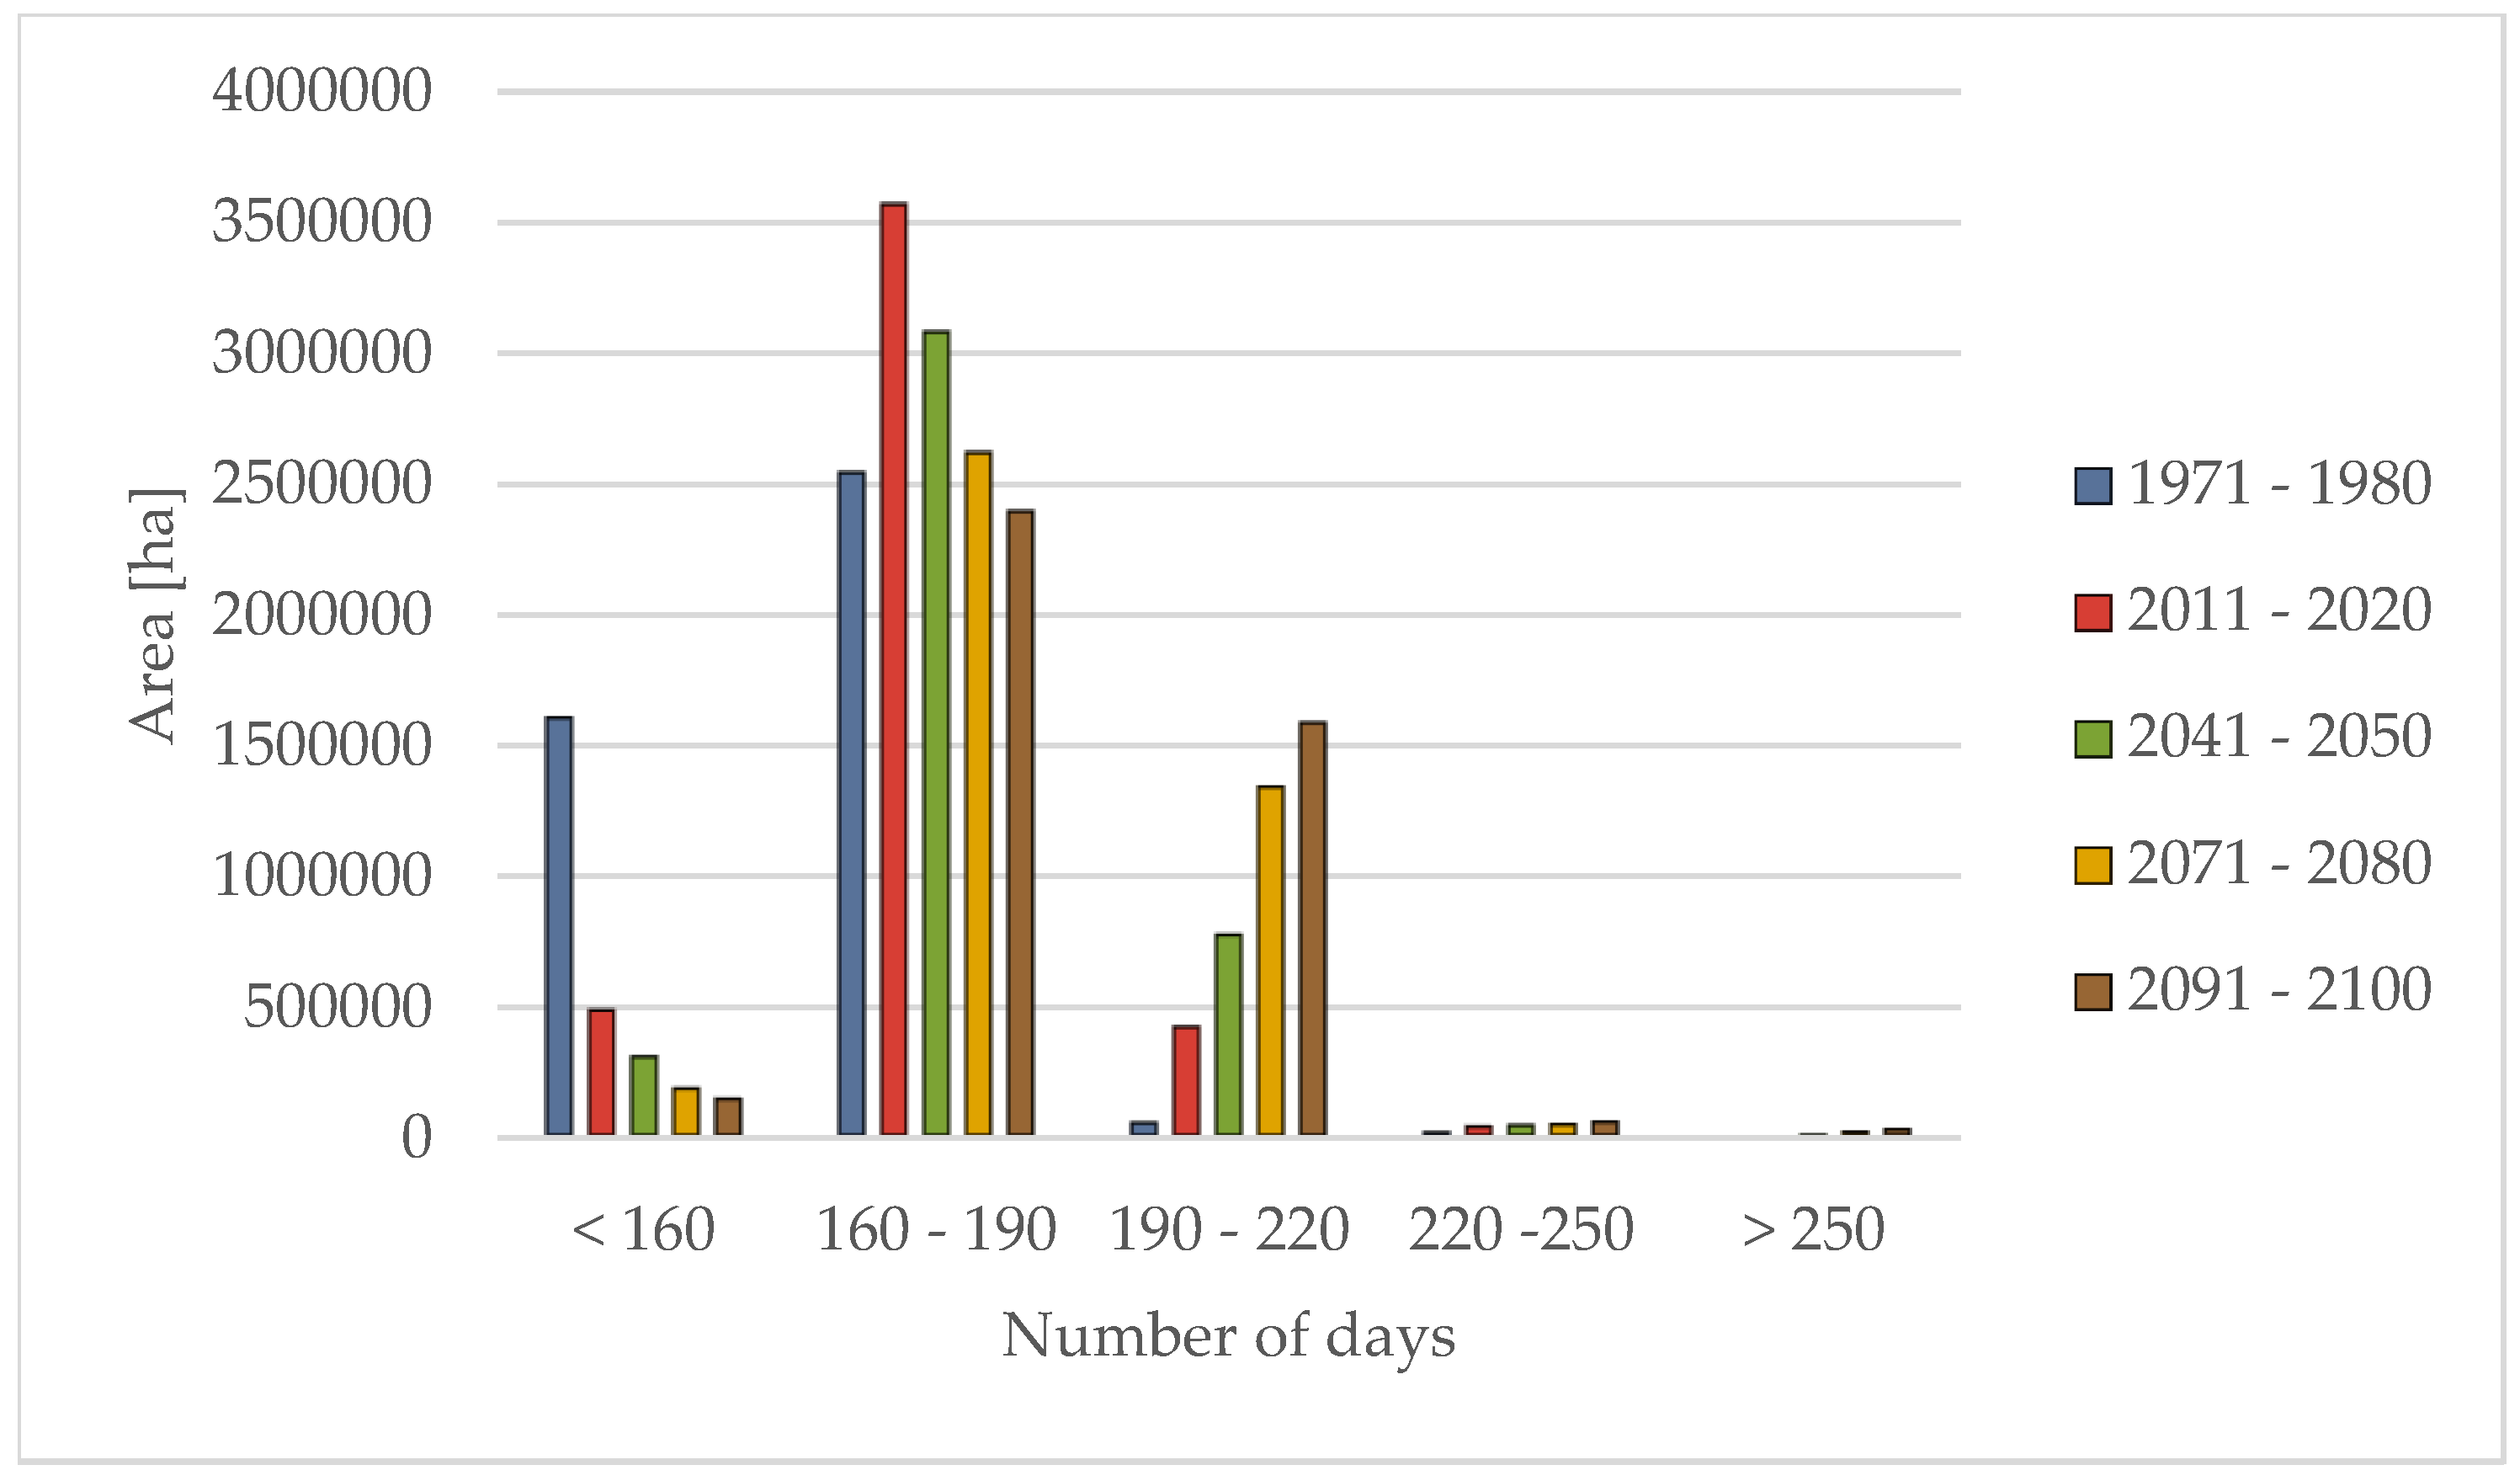
Figure 6.
Areas of Great growing season in range from 200 to 220 days in each decade.
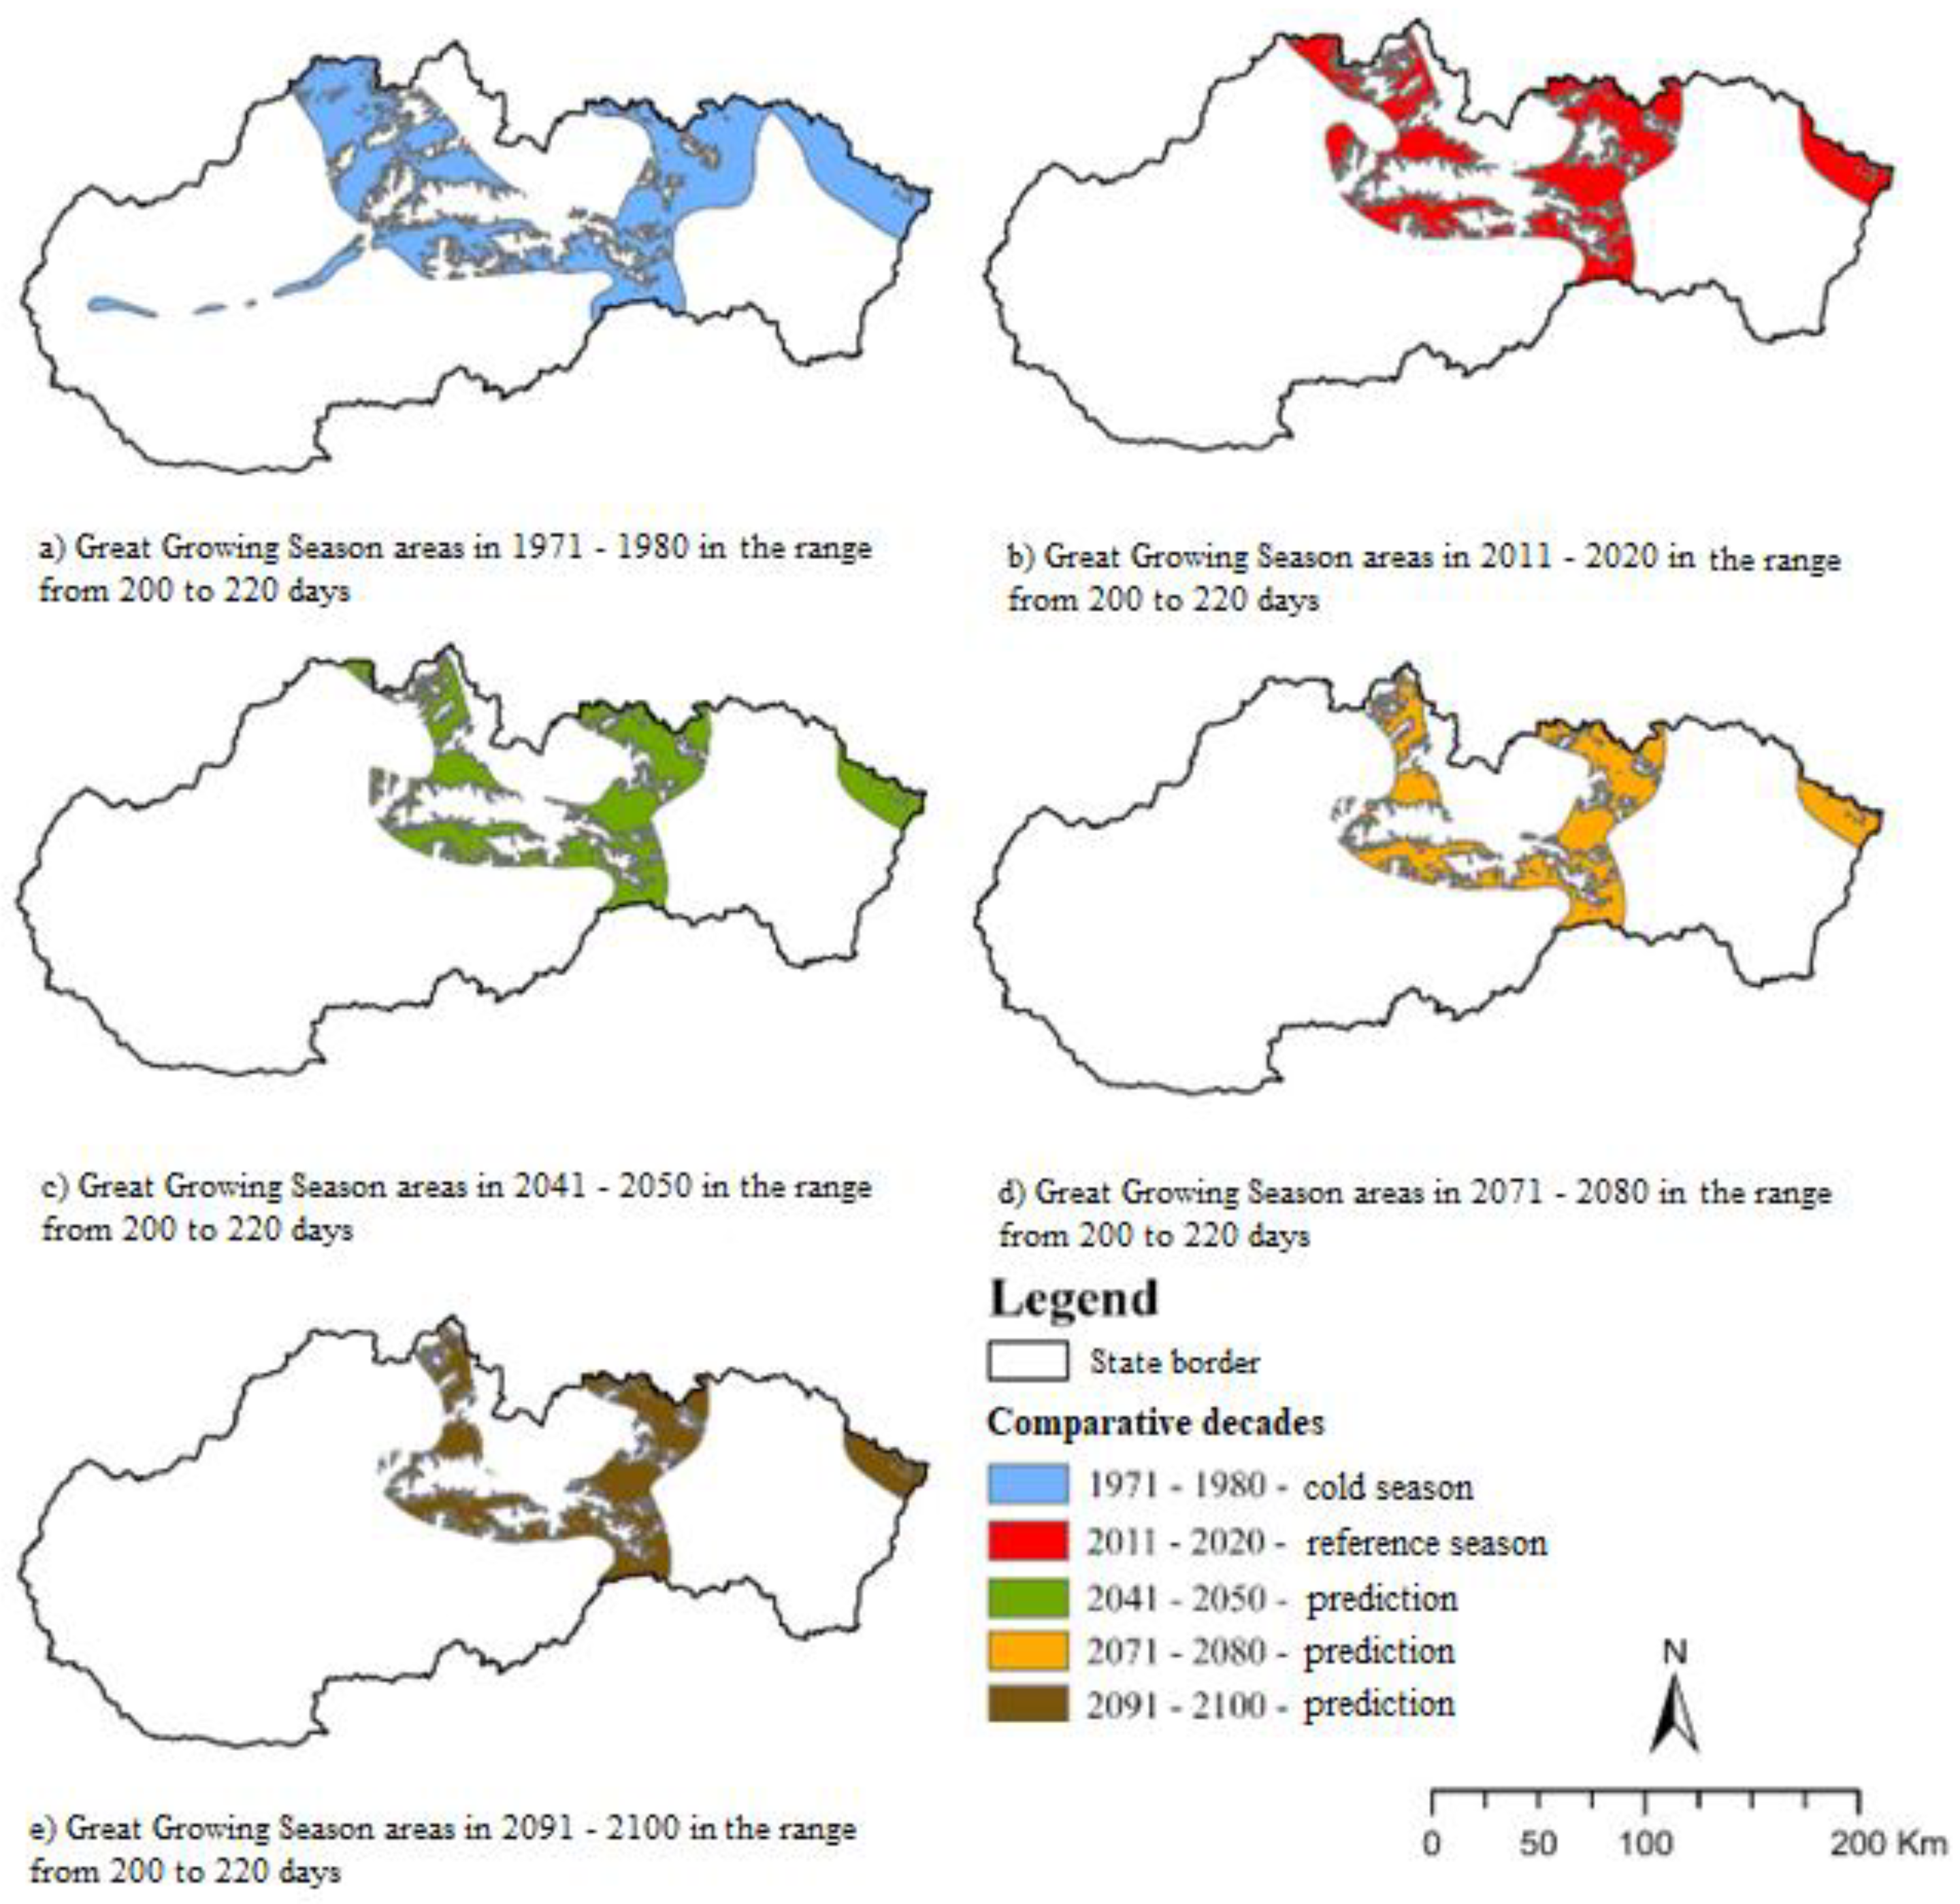
Figure 7.
Areas of Great growing season in range from 220 to 240 days in each decade (mean length).
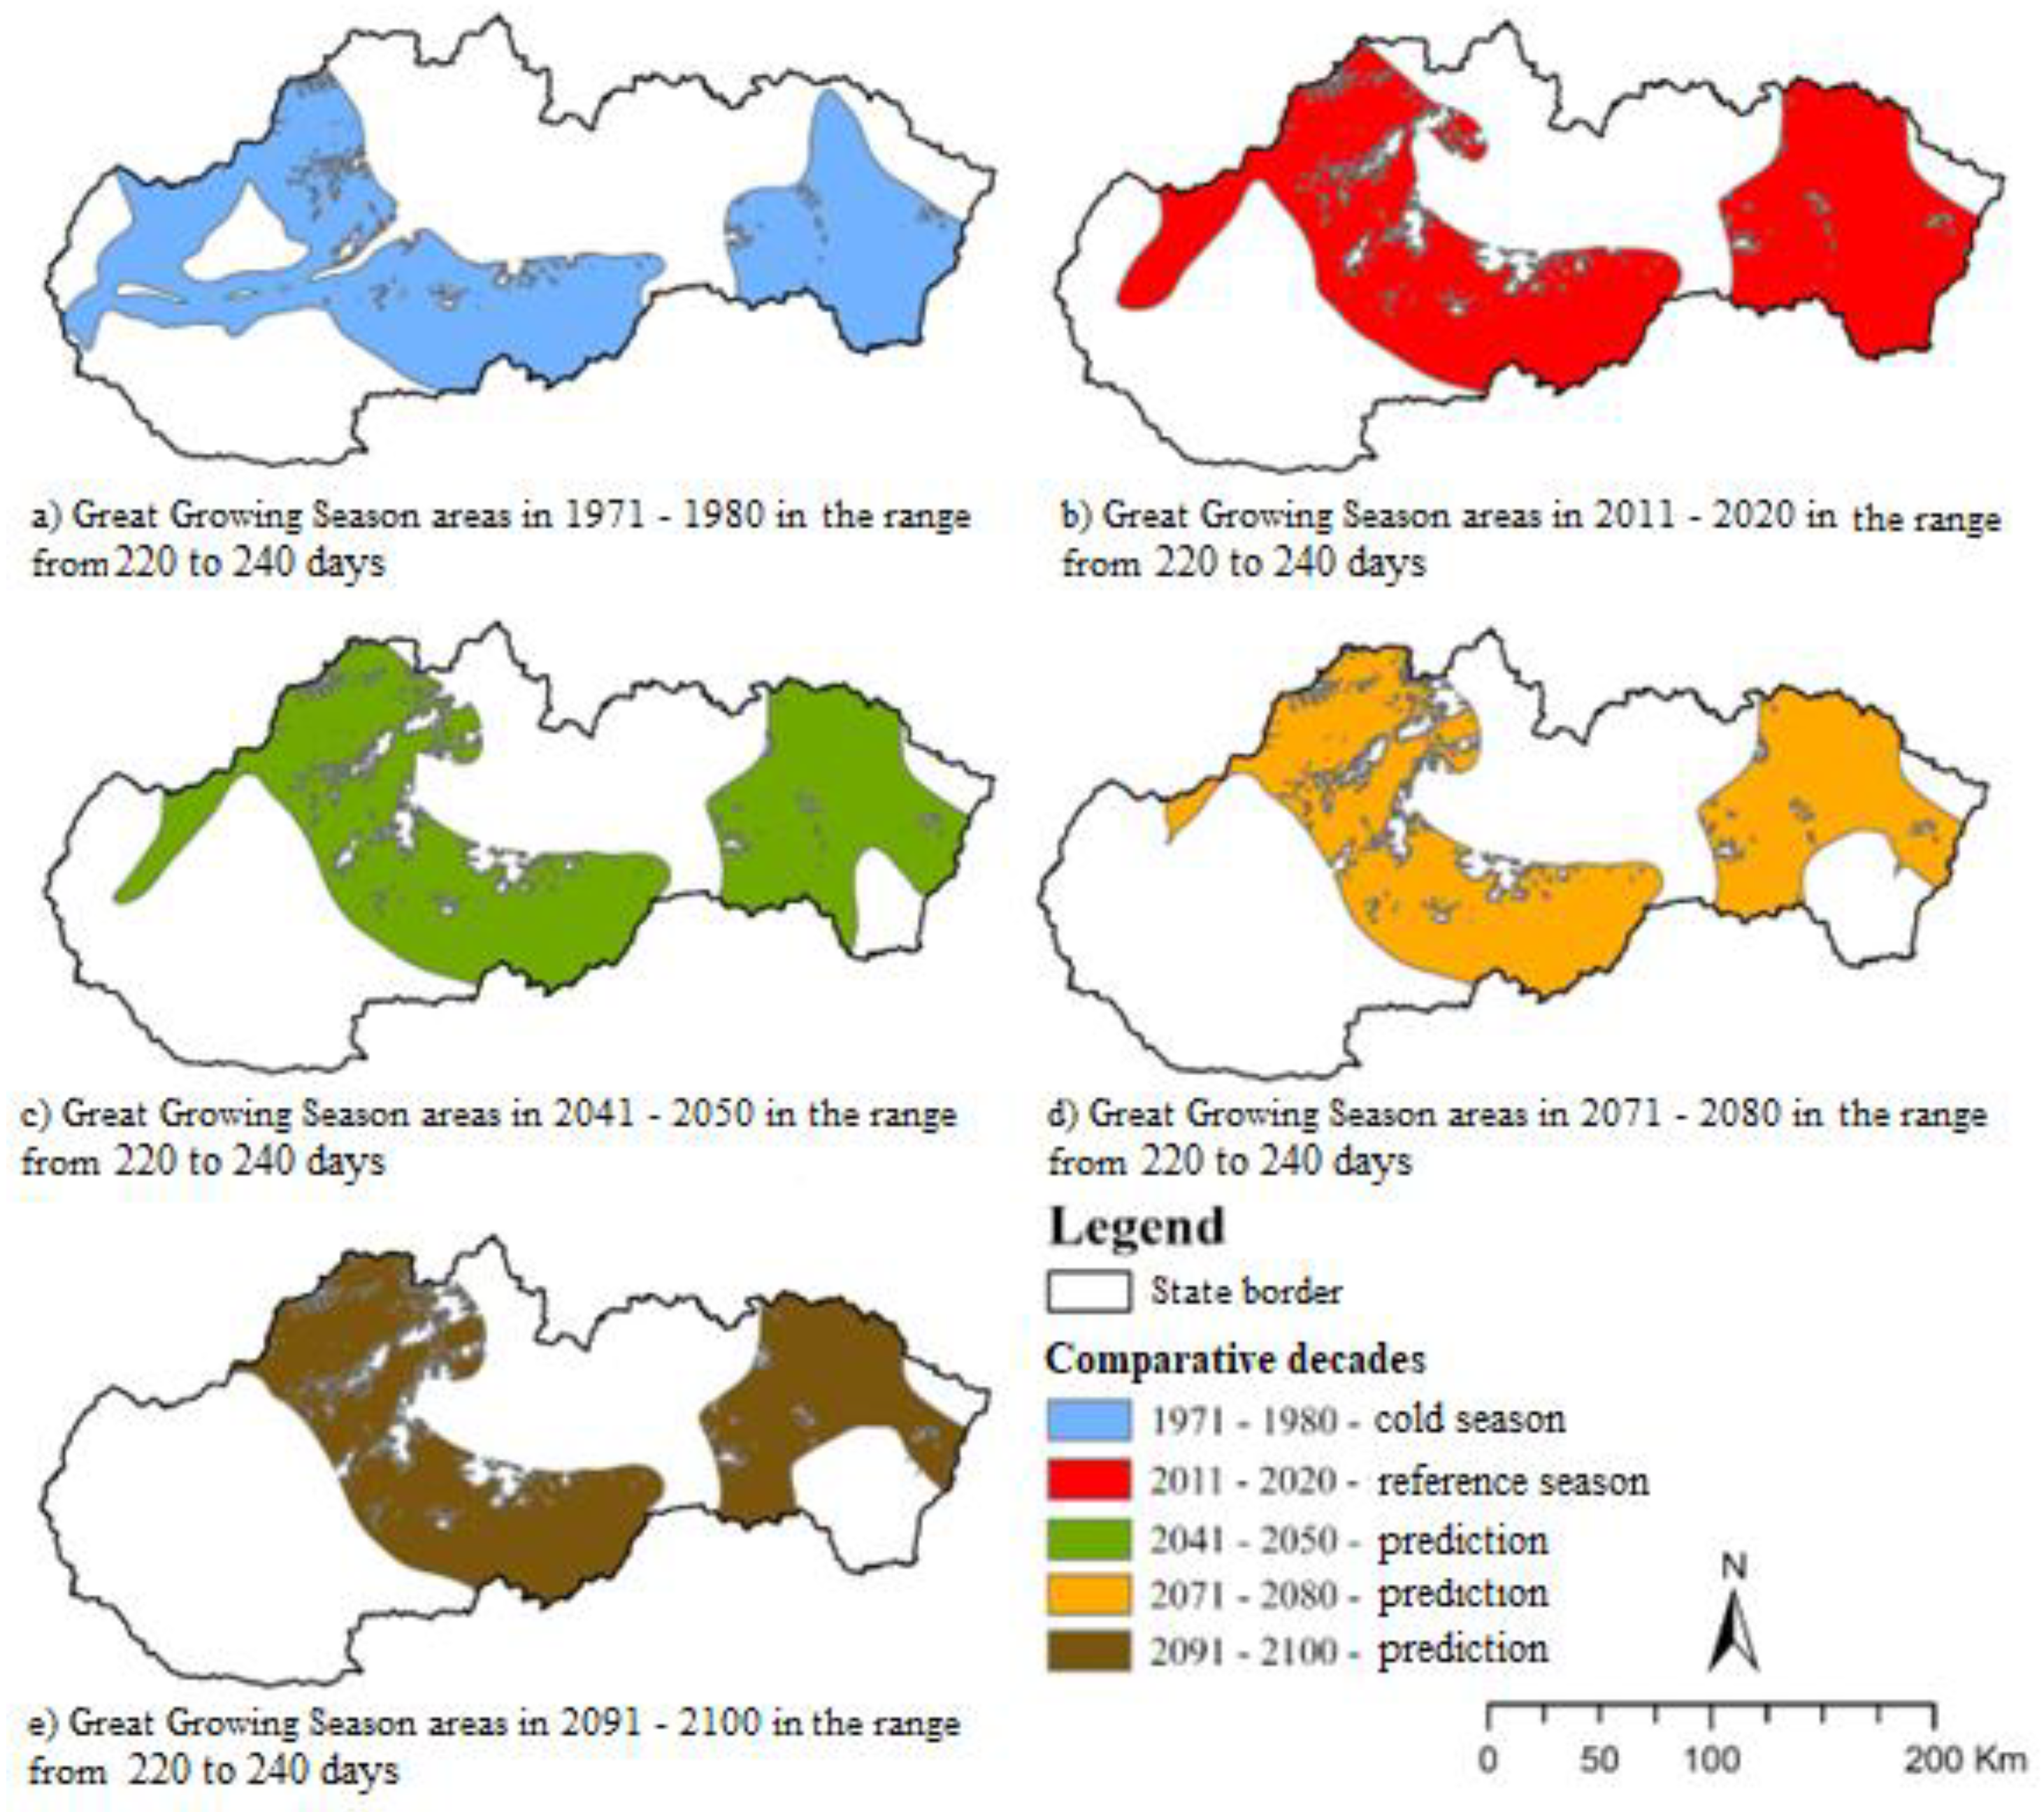
Figure 8.
Areas of Great growing season in range from 240 to 260 days in each decade.
Disclaimer/Publisher’s Note: The statements, opinions and data contained in all publications are solely those of the individual author(s) and contributor(s) and not of MDPI and/or the editor(s). MDPI and/or the editor(s) disclaim responsibility for any injury to people or property resulting from any ideas, methods, instructions or products referred to in the content. |
© 2025 by the authors. Licensee MDPI, Basel, Switzerland. This article is an open access article distributed under the terms and conditions of the Creative Commons Attribution (CC BY) license (http://creativecommons.org/licenses/by/4.0/).
Copyright: This open access article is published under a Creative Commons CC BY 4.0 license, which permit the free download, distribution, and reuse, provided that the author and preprint are cited in any reuse.


