
Submitted:
29 June 2023
Posted:
30 June 2023
You are already at the latest version
Abstract
Cropland area is closely related to food production. More previous focuses were paid on impacts of extreme events on food production, but less on cropland dynamics. This study took the Farming-Pastoral Ecotone of Northern China (FPEN) as a case area, to investigate its cropland area dynamics and driving factors in view of perspectives of extreme events, environmental conditions, socioeconomic development, urban expansion, and ecological construction. We used ridge regression approach to quantify contributions of these drivers to cropland area dynamics. Results showed that cropland area increased significantly at a rate of 333.5km2/a during 1992−2020 and were spatially clustered in east of the FPEN. Impact extent and size each driving factor on cropland trend presented large spatiotemporal differences, but ecological construction (EC) had overall the greatest impact on cropland area changes, followed by urban expansion (UE). In comparison, TL10p has the smallest. UE-dominated areas increased 41.9% since 2010s, but still less than EC. Furthermore, we found that extreme events effects on cropland area trend evidently increased. Particularly, TH90p displayed the most increase (~99.4%). Cropland area changes dominated by extreme temperature events in 2010−2020 increased nearly six times than that in 1992−2010. These findings suggest that increasing impacts of extreme weather events on cropland area changes should be cautioned.
Keywords:
Cropland area trend
; Contribution rate
; Ridge regression model
; Extreme events
; Ecological construction
; Urban expansion
1. Introduction
In the context of the climatic warming and growing global population, global agriculture development sustainability and food security are facing large challenges [1]. As an irreplaceable food production physical carrier, cropland area is closely related to food security, plays an important role in maintaining food security and stabilizing domestic food supply [2,3]. However, studies related to predicting impacts of various factors on grain yield have received more focuses over the past decades, but less attentions on the cropland area trend and its driving factors [4,5,6,7]. Therefore, clarifying the drivers of cropland change can enrich the connotation and theoretical basis of driver research of cropland dynamics. Additionally, it could provide valuable references for cropland utilization, management, and conservation.
The driving mechanism of cropland area trend is a complex issue that is forcing by multiple drivers of nature and human activities, such as climate, environmental conditions, socioeconomic development, urban expansion and ecological construction [8,9,10]. Urban expansion is generally regarded as the dominant driver of cropland area decrease [11,12,13]. In the past decades, half of decreased cropland was used for urban expansion [14]. Ecological construction represents expand of ecological land, such as forests and grasslands in a region, is another key factor affecting the cropland area [15]. It has been proven the major reasons for cropland decrease in fragile ecological areas [14,15]. Some studies have explored the relationships between cropland area trend and the environmental conditions and socioeconomic development in recent years [16,17]. For example, by analyzing relationships between the cropland area and the environmental conditions, Zhong, et al. [18] found that cropland area decreased along with elevation gradient increase during 1999−2006. Wang, et al. [19] selected fifteen drivers, collecting from the perspectives of cropland status, environmental conditions and socioeconomic development, to assess impacts of cropland expansion, and they found that all of these drivers had large impacts on cropland area trend at different spatial and temporal scales.
In addition, climatic change and increasingly frequency of extreme events are also one of the drivers on the cropland area trend [20,21,22]. It is projected that climatic change may reduce China's cropland area by 2.09~25.51% by the end of this century [23]. A study from Shi, et al. [24] reported that climatic warming trends facilitated the cropland area increase in arid and semi-arid regions, yet drying trends did not limit cropland area increase. Similarly, Zaveri, Russ and Damania [10] reported that dry anomalies lead to an increase in cropland area, and estimated that dry-induced cropland expansion rate accounted for ~9% of the cropland expansion rate. In addition, recent studies showed that the extreme events usually had more impacts on agriculture than their average [25,26]. And extreme heat events have a long-lasting impact on reducing cropland area [23]. However, previous studies related to predicting impacts of nature and human activities on cropland area trend have received the highly focuses at the past decades, but less attentions have been focused on how climatic change and extreme weather events altered the spatial extent and trends of croplands [20,27].
The Farming-pastoral ecotone of northern China (FPEN) where extreme events occur frequently is particularly fragile to human activities and climate change [28,29]. In recent years, the quantity and spatial distribution of cropland have changed dramatically under the influence of climatic change and human activities [30]. Due to its coverage of typical geographical features such as the Northeast plain, the Inner Mongolia Plateau and the Loess Plateau, as well as substantial regional variations in policies and climate, this region provides a natural experimental setting for studying the spatiotemporal characteristics of cropland area changes and the driving factors. Therefore, the aims of this study, using FPEN as an example, are: (1) to quantify the relative contributions of extreme events, environment conditions, socioeconomic development, urban expansion and ecological construction on change in cropland area, (2) to clarify the differences in contribution of driving factors before and after the turning point (TP), and (3) to determine the dominant driver of cropland area trend and the divergent driver contributions between 1992−2010 and 2010−2020 at the county-scale.
2. Data and methods
2.1. Study area
FPEN is a typical coupling zone of farming and livestock-grazing [31,32]. The cropland and grassland area accounted for ~73.9% of FPEN, of which the cropland area was ~20.2×10⁴ km2 (Figure 1a). Its terrain is complex and diverse, which is low in the northeast and high in the southwest. The region has a temperate continental monsoon climate, with rainfall considerably affected by the summer monsoon, predominantly in summer, and the average annual precipitation of 250~600mm (Figure 1d). The average annual temperature is 6.8℃ (Figure 1c).
Considering the large differences in climate, environment and policies in the study area, we subdivided FPEN into three regions. (1) Eastern region: locating in the east of the study area, it belongs to the Northeast China Plain. The average annual precipitation of ~468.2mm, and the average annual temperature is 5.8℃. Eastern of FPEN has abundant black soil resources, and flat terrain, which provides good conditions for agricultural activities and mechanized production. Also, China's main commercial grain production base and a key implementation region for cropland protection policies [28,29]. (2) Central region: locating in the center of the study area, connecting Inner Mongolia Plateau and Loess Plateau. The average annual precipitation of 551.0mm, and the average annual temperature is 7.5℃. The terrain in central region is complex and diverse, and areas of cropland and grassland are the largest (Figure 1a). Due to the prominent problems of land and environmental degradation, it has become a key ecological reserve in China [33]. (3) Western region: locating in the west of the study area, it belongs to the Loess Plateau. The annual precipitation and temperature are higher than eastern, is 600.8 mm and 7.4℃, respectively. Western region has low vegetation coverage, severe soil erosion and a particularly fragile ecological environment. Like central region, western is also a key implementation area for ecological projects such as the “Grain for Green” Project.
Figure 1.
Location maps of the FPEN. a) land use/land cover map in 2020, b) Elevation of the FPEN, c) and d) averaged annual mean temperature and total precipitation during 1992−2020.
Figure 1.
Location maps of the FPEN. a) land use/land cover map in 2020, b) Elevation of the FPEN, c) and d) averaged annual mean temperature and total precipitation during 1992−2020.
2.2. Data and processing
The data used in this study included land use/land cover data, meteorological data, drought index data, volumetric soil water data, net primary productivity data, population data, and nighttime light index data.
The land use/land cover data were obtained from the European Space Agency (ESA). We grouped land use/land cover data into six categories: croplands, forests, grasslands, water body, built-up land, and bare land, according to the International Geosphere-Biosphere Programme (IGBP) and Chinese Academy of Science classification system. To analyze spatial changes of land use area, we counted the sum area of croplands, and sum area of forests and grasslands, and urban area within each 9km × 9km grid cell. Specially, for the mosaic croplands (>50%) in the IGBP classification system, we only counted half the area for croplands. In addition, the sum of forests and grasslands areas is considered in our research as ecological land area, and the area of built-up land as construction land area.
Meteorological data and volumetric soil water data were all derived from the European Centre for Medium Range Weather Forecasts (ECMWF) Reanalysis ERA5 dataset. Here, daily maximum and minimum temperature and annual average temperature were calculated using the hourly maximum and minimum 2m temperature data, the monthly average temperature data, respectively. Daily precipitation and annual precipitation were computed using the hourly precipitation data. Subsequently, the daily maximum and minimum temperature, precipitation were used to estimate extreme climate indices. Yearly volumetric soil water and potential evaporation were calculated using the hourly volumetric soil water data of soil layer 1(0~7cm) and potential evaporation data. Drought index data, daily evapotranspiration deficit index (DEDI), obtained from the study of Zhang, et al. [34]. The DEDI calculated based on daily ERA5 product, and defined as the standardized deficit of difference between actual and potential evapotranspiration. DEDI not only considered the aggravating effect of warming on the severity of drought, but also reflects the degree of impact of drought on vegetation and soil moisture in time. More important it was extremely sensitive to agricultural drought [35]. Thus, compared with other commonly used drought indices, such as Standardized Precipitation Index (SPI) and Standardized Precipitation Evapotranspiration Index (SPEI), DEDI is more suitable for analyzing the impact of drought on the cropland area trend under climate warming [36]. The yearly net primary productivity data is derived from United States Geological Survey (USGS) MOD17A3HGF dataset.
The population data are collected from the Land Scan, which is the available and fine resolution global population data. We retrieved the annual nighttime light index data from the study of Li, et al. [37]. This annual data is generated by inter-correcting nighttime light index data from different satellites using a sigmoid function and derived relationship. It was verified that the corrected nighttime light index data showed a good consistency and was superior to other nighttime light index data in terms of the temporal consistency. In addition, the data also showed good agreements with the temporal trends of socioeconomic activities.
In order to maintain spatial consistency, all the data in this research, except the population, were resampled to a spatial resolution of 9km using a bilinear resampling algorithm. For the population data, we counted population of 9km × 9km. Details of the data used in this study can be found in Table A1. In addition, for some vacant time series we replace them with the most recent year, for example, the population data in 1999 was replaced by that in 2000.
2.3. Methods
2.3.1. Main research framework
In this study, we quantified impacts of driving factors on cropland area trend at the county scale, and compared the differences in the contribution of driving factors before and after the TP. The main research framework is illustrated in Figure 2, which incorporated four steps:
(1) Spatial-temporal change analysis. We estimated the spatiotemporal dynamics of cropland area from 1992 to 2020 by using the trend analysis approach and detected its time series TP by the piecewise regression approach.
(2) Driver factors determination. We quantified the correlation between cropland area and drivers using the Pearson correlation analysis at the county-scale, and judged whether put initial driving factors into the ridge regression model by considering the correlation coefficient R values and the ratio of significant area to total area.
(3) Relative contribution of drivers. We put the filtered factors and cropland area into the ridge regression model, tested accuracy of model based on the RMSE, R2 and RMSE/mean (Appendix A Eq.2~4, Figure 5), and finally get the relative contribution.
And (4) differences in contribution of driving factors before and after the TP. We took the TP obtained in step (1) as a node, the relative contribution value of the driving factors before and after the TP, and their relative changes were calculated, respectively. Finally, we visualized the spatial distribution of the dominant and biggest changes driver at the county-scale.
Figure 2.
The main research framework of this study. Note: the statistical significance level is 0.05 (p<0.05) in this study.
Figure 2.
The main research framework of this study. Note: the statistical significance level is 0.05 (p<0.05) in this study.
2.3.2. Initial driver factors selection and driver factors determination
Previous studies have shown that the potential driving factors that could affect the cropland area change were grouped into five categories: extreme events, environmental conditions, socioeconomic development, urban expansion and ecological construction (Table A2) [16,17,19,22].
Environmental conditions are represented from the perspective of meteorology, soil, and grain production situation using Annual average temperature, annual precipitation, potential evapotranspiration (PET), volumetric soil water, and net primary productivity (NPP), respectively [29,38,39]. These factors are closely related to grain growth and development, which in turn affects the change of cropland area [19,22]. In addition, extreme events could be largely responsible for altering cropland area due to a dramatic increase in the frequency and intensity of extreme events under climate change [10,23,25,40,41]. Therefore, the climate extremes index (covering extreme high temperature, extreme low temperature, extreme precipitation, and drought) also contained in our research.
Due to unavailability of continuous socioeconomic data at the grid scale, we predominantly considered two types of socioeconomic factors, namely population and satellite-based nighttime light index (NTL) data [8]. The areas of construction land and ecological land represent urban expansion and ecological construction in this study, respectively [15].
To further confirm whether the driving factors in Table A2 can reasonably explain the cropland area trend, before estimating the relative contribution of driving factors on cropland area, we screened out the driving factors that had stronger relative (R > 0.4) at first. Meanwhile, we also erased the driving factors that the ratio of significant area to total area was less than 20%, due to the spatial heterogeneity. Their significant was judged with the help of F-statistic test. The Pearson correlation analysis formula is as follows:
where i is the county of FPEN; cp is the cropland area of i county; X is the driving factors of i county; is the covariance of cropland area and driving factors at the county-scale; and is the standard deviations of cropland area and driving factors, respectively; is the correlation coefficient of cropland area and driving factors at the county-scale. is always between -1 and 1. If , means there are the perfect positive linear correlation between cropland area and driving factors. If , indicates perfect negative linear correlation between cropland area and driving factors. While implies no linear correlation. Additionally, an α-level of 0.05 is used as the threshold of statistical significance in our research. While , means is significant.
2.3.3. Extreme climate index calculation
We selected four indices, including extreme high temperature, extreme low temperature, extreme drought and extreme precipitation, to describe the extreme climate as they were closely related to cropland area change/agricultural production in FPEN. These indices were calculated by referring to the definition of climate extremes by the Expert Team on Climate Change Detection and Indices (ETCCDI) [42,43]. In addition, to keep the unit of drought indices consistent with others, we compute the annual frequency of drought (D20p) based on DEDI using the same method as ETCCDI. Detailed calculation method is shown in Table A3.
2.3.4. Trend analysis
Linear regression was used to estimate the spatial-temporal trends of annual driving factors and cropland area [44]. Their significant was judged by F-statistic test in this study. Trend formula is as follows:
where n is study coverage time; represents the value of driving factors/cropland area in year t; is the slope value of this factor. Additionally, if is positive, it means that increases over time. The larger || is, the more obvious the increasing trend is. Otherwise, it will decrease over time.
2.3.5. Turing point (TP) detection
A piecewise linear regression model was used to identify the TP of the cropland area from 1992 to 2020 [45], and its significant was judged by F-statistic test. The piecewise linear regression model is as follows:
where y is the cropland area; t is the year; is the identified TP; is intercept; and are the value of trends before and after the TP, respectively; and ε is the residual errors. Least squares method is used to compute coefficients, such as , , . In this study, we determined TP by multiple iterations [46,47]. Specifically, firstly, we limited points to between 1996 and 2016, to ensure that the time series before and after the point is greater than or equal to 5 years. Then, we used multiple fitted linear iterations to obtain the point where had minimized residual value square sum of the both sides. Finally, we used F- statistic test to judge whether the trend of time series on both sides of the point is significant. If it passes the significance test (p<0.05), this point is regarded as the TP of cropland area changes.
2.3.6. Ridge regression model
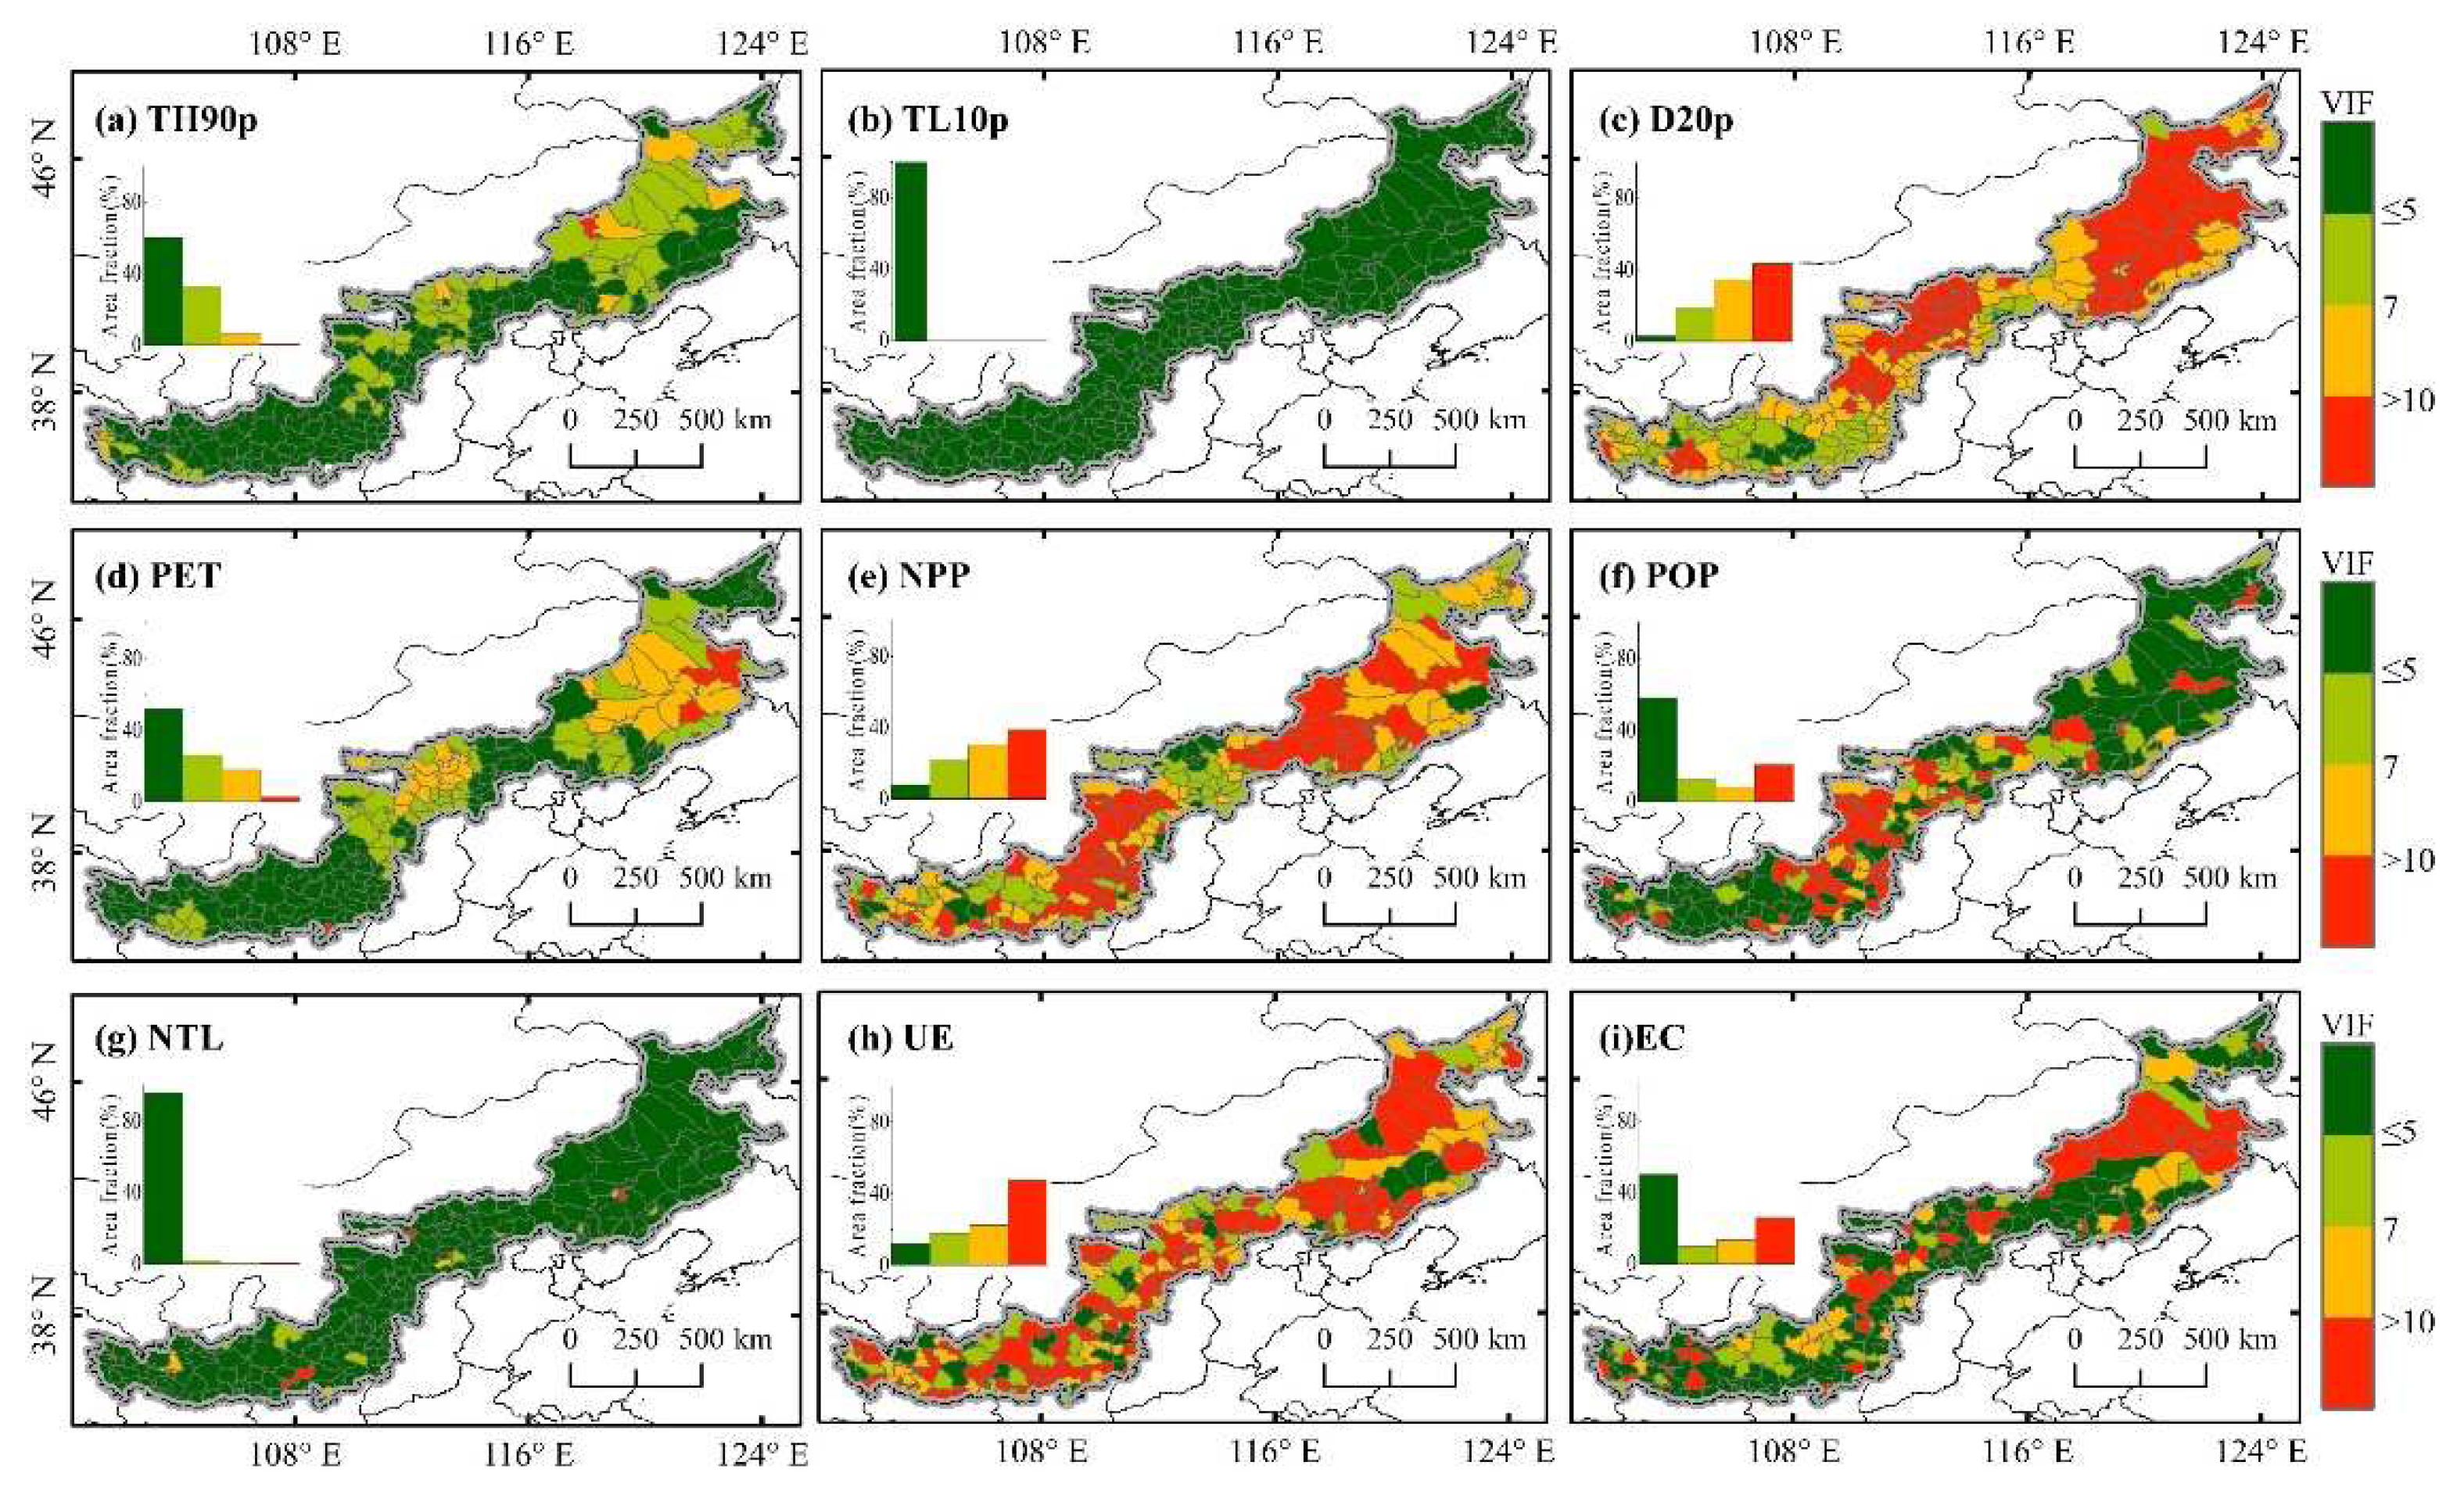
The ridge regression model was designed to solve the problem of multi-collinearity between independent variables [48,49,50]. Compared to the traditional multiple linear regression, ridge regression is more tolerant of ill-conditioned data. This study involved nine variables, and the results of factor inflation factor (VIF) test showed that there was multi-collinearity (VIF≥10) between driving factors (Figure A1). The ridge regression model is expressed as follows:
where is cropland area of spatial-temporal standardized, is regression coefficient, X is a 2-dimensional matrix of spatial-temporal standardized driving factors. Detailed calculation method of spatial-temporal standardized is shown in Methods Section of the Appendix A [Eq. 1]. k is the ridge parameter. The principle of selecting the value of k: if k = k0, the of driving factors tends to be stable, k0 will be ridge parameter. In our research, k is 1.
To account for the long-term trend in the effects of drivers on cropland area, we multiplied the ridge regression coefficients by the trend of the corresponding drivers in order to characterize the contribution of drivers for cropland area trends. The contribution of the driving factor to the cropland area is expressed as follows:
The relative contribution is:
where is the spatial-temporal standardized of driving factors trends; represents relative contribution of driving factors to trends of cropland area, the positive and negative of indicate the positive and negative effects of , its value larger is impact greater.
The accuracy of the simulated results evaluated using three metrics [root-mean-square error (RMSE), coefficient of determination (R2), and RMSE/mean]. Detailed calculation method is shown in Methods Section of the Appendix A [Eq. 2 ~ 4].
3. Results
3.1. Spatial-temporal dynamics of cropland area
The cropland area significantly increased at a rate of ~ 333.5km2/a in FPEN during 1992−2020 (p<0.05). The area increased from 19.5×10⁴km2 in 1992 to 20.2×10⁴km2 in 2020 (Figure 3c). Regionally, cropland area of the eastern region continued to increase in the entire period with a growth rate of ~357.3km2/a (p<0.01, Figure 3d). The cropland area in the central region clearly showed two distinct opposite trends before and after 2005 (Figure 3e). Firstly, the cropland area increased significantly from 1992 to 2005, and the growth rate was ~74.2km2/a (p<0.01). Then, at the stage of 2005−2020, its area significantly decreased at a rate of 91.4 km2/a (p<0.01). Its total area finally decreased 765.9km2 during 1992−2020. The cropland area of western region showed a significantly decreasing trend (p<0.05). The entire cropland loss area is 875.2 km2 from 1992 to 2020 (Figure 3f). Spatially, the increased cropland area of the entire FPEN focused on the eastern region, the significant increased area was 14.13×10⁴km2 (p<0.05), particularly in the eastern part of Inner Mongolia. The decreased cropland area primarily in the central and western regions, its significant increased and decreased trend areas were 16.08×10⁴km2 and 22.38×10⁴km2, respectively (Figure 3a).
In FPEN, ~38.90% of cropland had a significant TP (p<0.01, Figure 3b). The TP of the cropland area mainly occurred after 2010, accounting for ~24.85% of FPEN (63.88% of entire TP regions). The pixels of croplands having TP before 2000 only accounted for ~1.55% of FPEN. Through overlay analysis of the cropland area trend and TP, we found that there were more prone to TP after 2010, if the cropland area exhibited a significant decreasing trend in pixel scale. Therefore, we speculated that there might be large differences in the impact of driving factors on the cropland area trend around 2010.
Figure 3.
Spatiotemporal dynamics of cropland area from 1992 to 2020, (a) the trend of cropland area, (b) the turning points of cropland area changes, and (c-f) cropland area changes of the FPEN and three sub-regions.
Figure 3.
Spatiotemporal dynamics of cropland area from 1992 to 2020, (a) the trend of cropland area, (b) the turning points of cropland area changes, and (c-f) cropland area changes of the FPEN and three sub-regions.
3.2. Selecting driving factors based on the ridge regression model
This study used the Pearson analysis to quantify the correlations between driving factors and cropland area in FPEN (Figure 4a~m). The results showed that the mean absolute of correlation coefficient between all driving factors with cropland area was greater than 0.4. Among them, the mean absolute of the correlation coefficients of EC and UE were much higher than other factors (R values of ~0.9 and 0.8, respectively). At the significance level of 0.05, the area where the cropland area was significantly correlated with socioeconomic development, urban expansion and ecological construction all exceeded 50% of FPEN. On the contrary, except for NPP, the area of significant correlation between environmental conditions and extreme events with cropland area were all less than 50% of FPEN, of which the annual average temperature, annual precipitation, volumetric soil water and annual frequency of extreme precipitation were significantly correlated with cropland area in less than 20% of FPEN (Figure 4c, e, f and h). Due to spatial heterogeneity, the small range significant correlation cannot clearly explain the reason for the cropland area trend in the entire FPEN. Thus, the annual average temperature, annual precipitation, Annual frequency of extreme precipitation and volumetric soil water were excluded from the follow-up study.
Figure 4.
The Pearson correlation coefficients between cropland area and corresponding driving factors (a) ~ (m), and boxplots for correlation coefficient absolute of each driving factors (n).
Figure 4.
The Pearson correlation coefficients between cropland area and corresponding driving factors (a) ~ (m), and boxplots for correlation coefficient absolute of each driving factors (n).
3.3. Factor attributions of cropland area trends at the county scale
3.3.1. Relative contributions of driving factors to cropland area trends
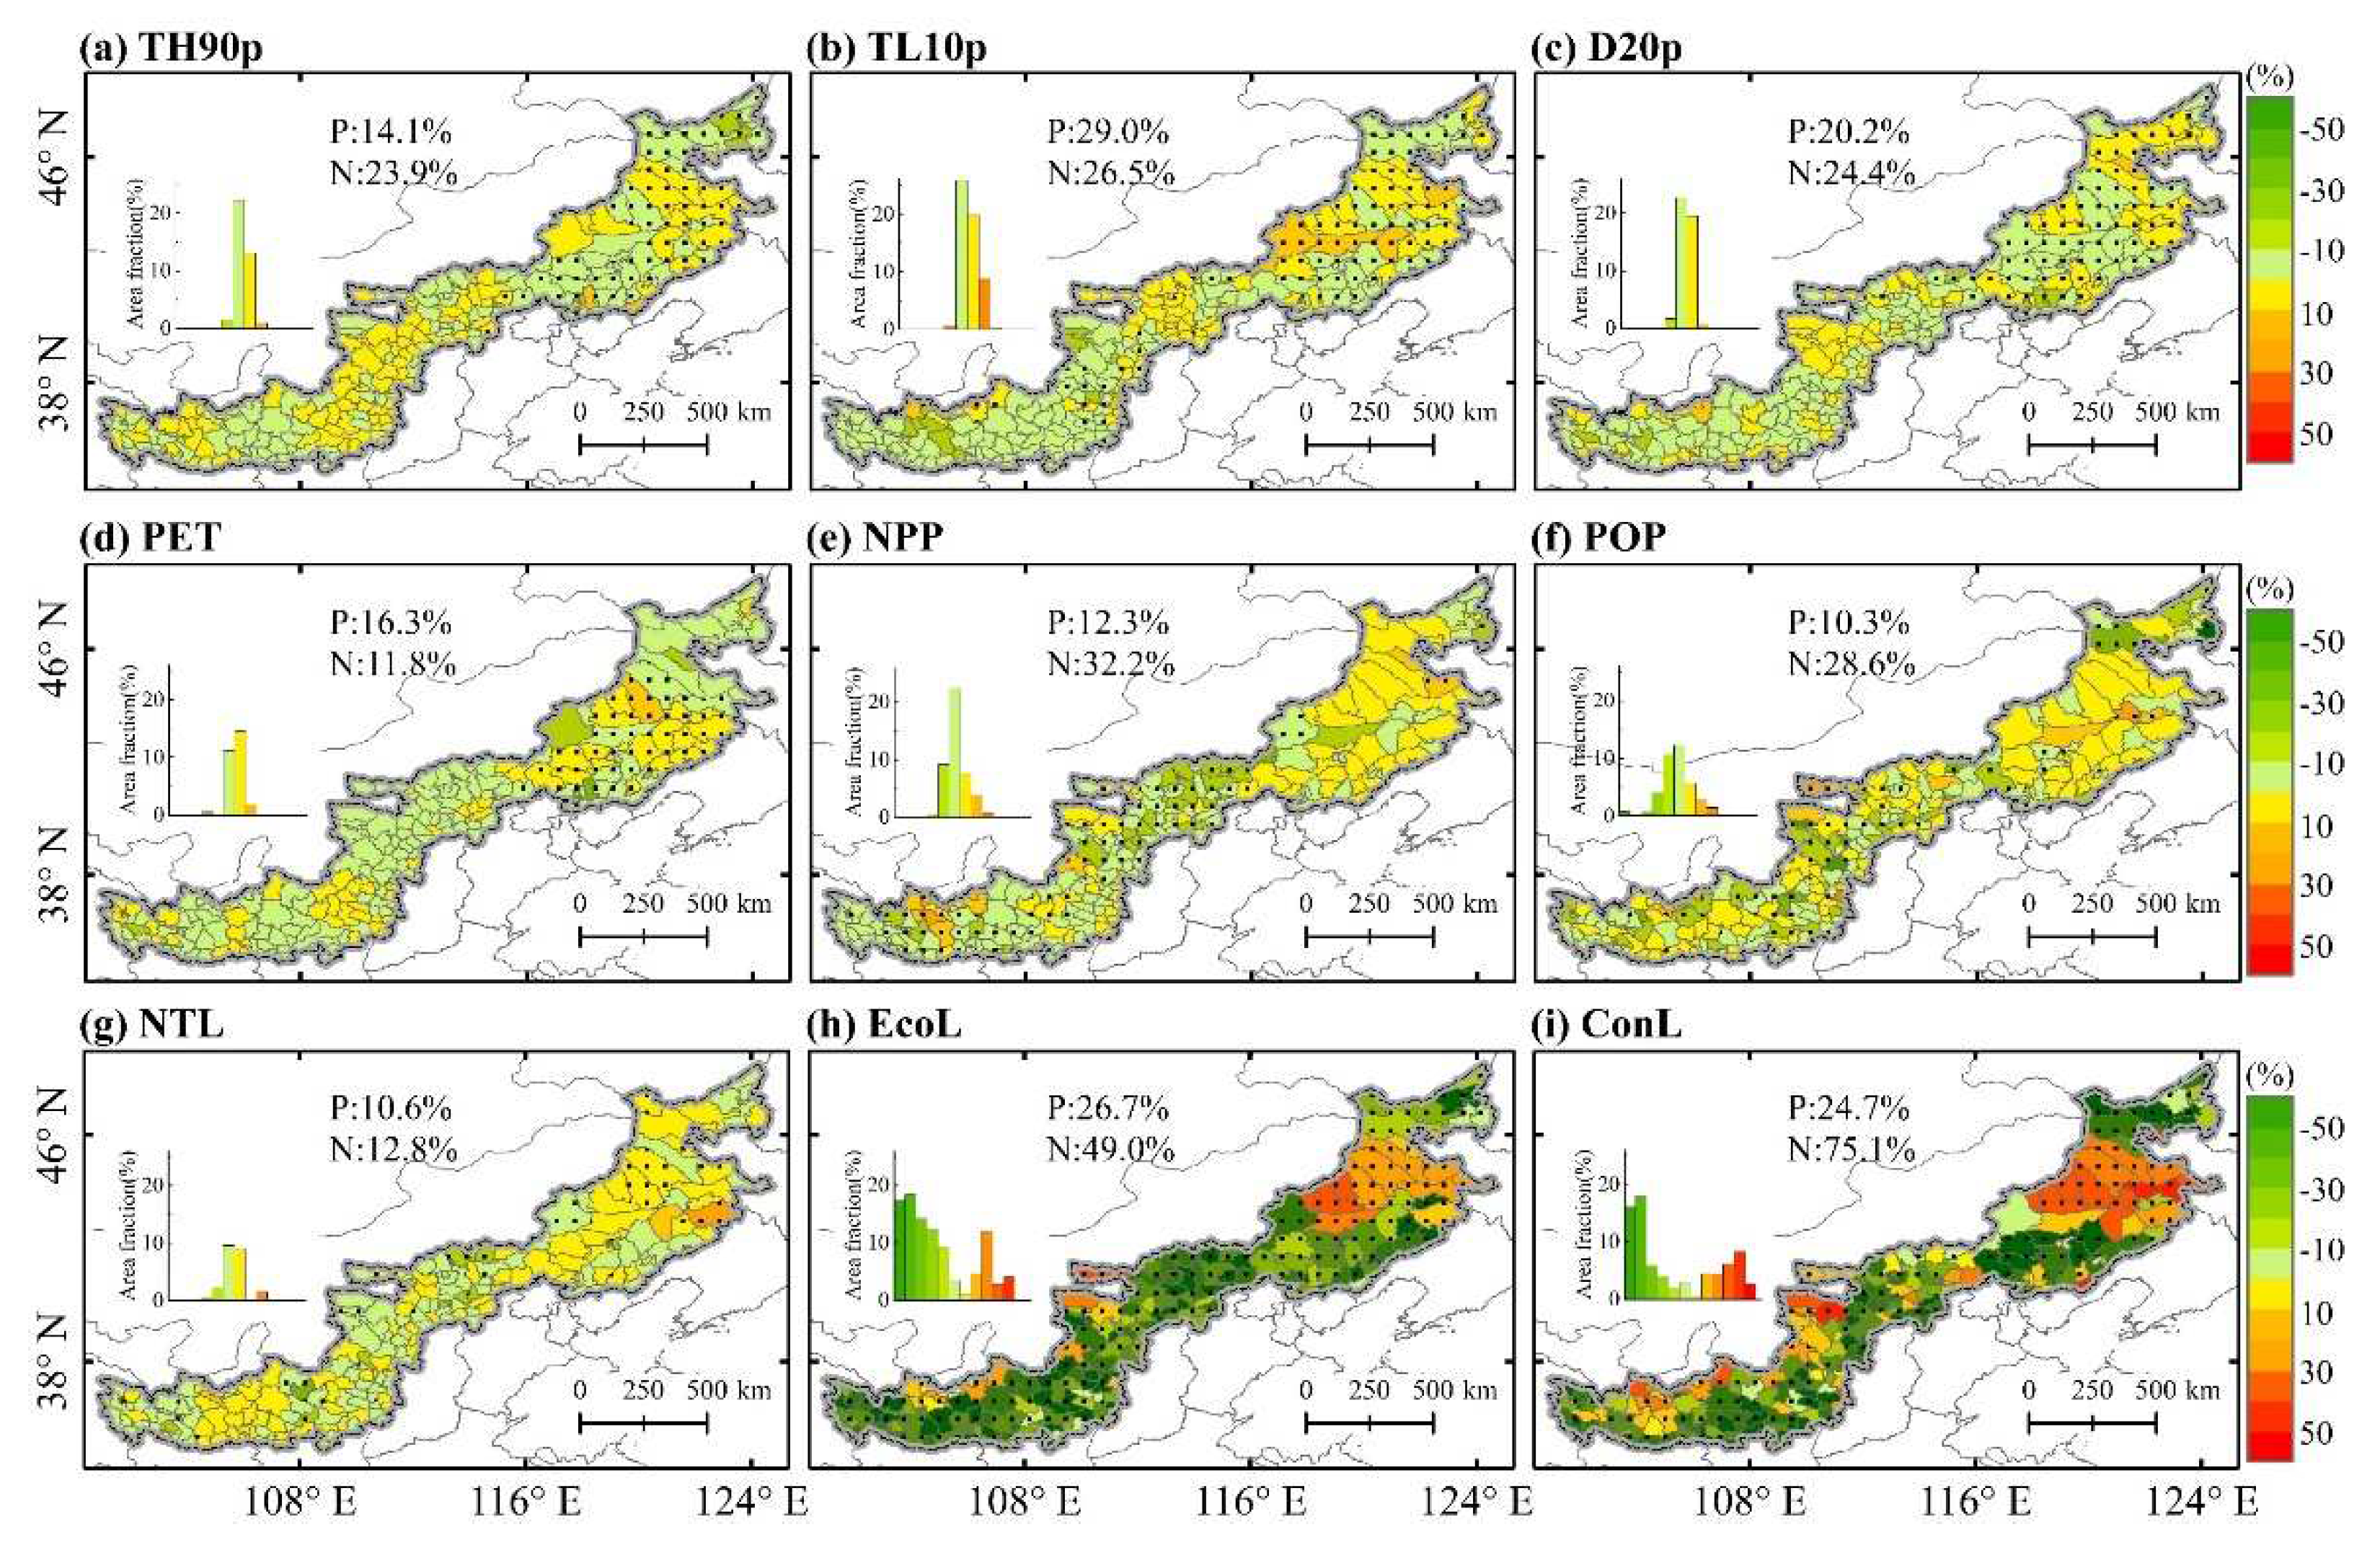
This study compared the simulated cropland and satellite-drived cropland area in entire FPEN and its each county. We found that the simulated cropland area agreed well with the satellite-drived cropland area. Generally, R2 is 0.99 and RMSE is 204.3. Of which, regions with R2 ≥0.9 accounted for ~90% of FPEN (Figure A5), indicating the model was robust and suitable for further investigating cropland area trend and the driving factor’s contributions. Table 1 summarizes the relative contributions absolute of the driving factors across the FPEN and three subresions. Generally, EC was the greatest contributor to the cropland area trend from 1992 to 2020 in FPEN, and followed by UE. Their relative contributions absolute values were 40.3% and 39.3%, respectively. In contrast, TL10p was the minimal contributor to the cropland area trend. Its relative contribution absolute was 1.3%. Regionally, the impact of TH90p, D20p, NPP and NTL on cropland area trend in the eastern region was slightly larger than that in the central and western regions. Their relative contribution absolute values were 1.8%, 2.3%, 10.4% and 4.1%, respectively. The influences of population and UE on cropland area trend in the central region was slightly higher than in the eastern and western regions. Their relative contribution absolute values were 7.3% and 40.0%. Furthermore, we also discovered that PET and EC had relatively greater impacts on the cropland area trend in the western region. These findings illustrate that cropland area trends in different regions performed spatial heterogeneity of driving factors.
Spatially, the impacts of TH90p, PET, NTL and EC on the cropland area trend were mainly positive, accounted for 39.5%, 58.8%, 42.3%, and 49.8% of FPEN, respectively (Figure 5a, d, g, and i, p<0.05). On the contrary, the impacts of TL10p, D20p, NPP, population and UE on the cropland area trends were mainly negative, accounted for 51.5%, 41.4%, 39.0%, 47.8% and 73.9% of FPEN, respectively (Figure 5b, c, e, f, and h, p<0.05).
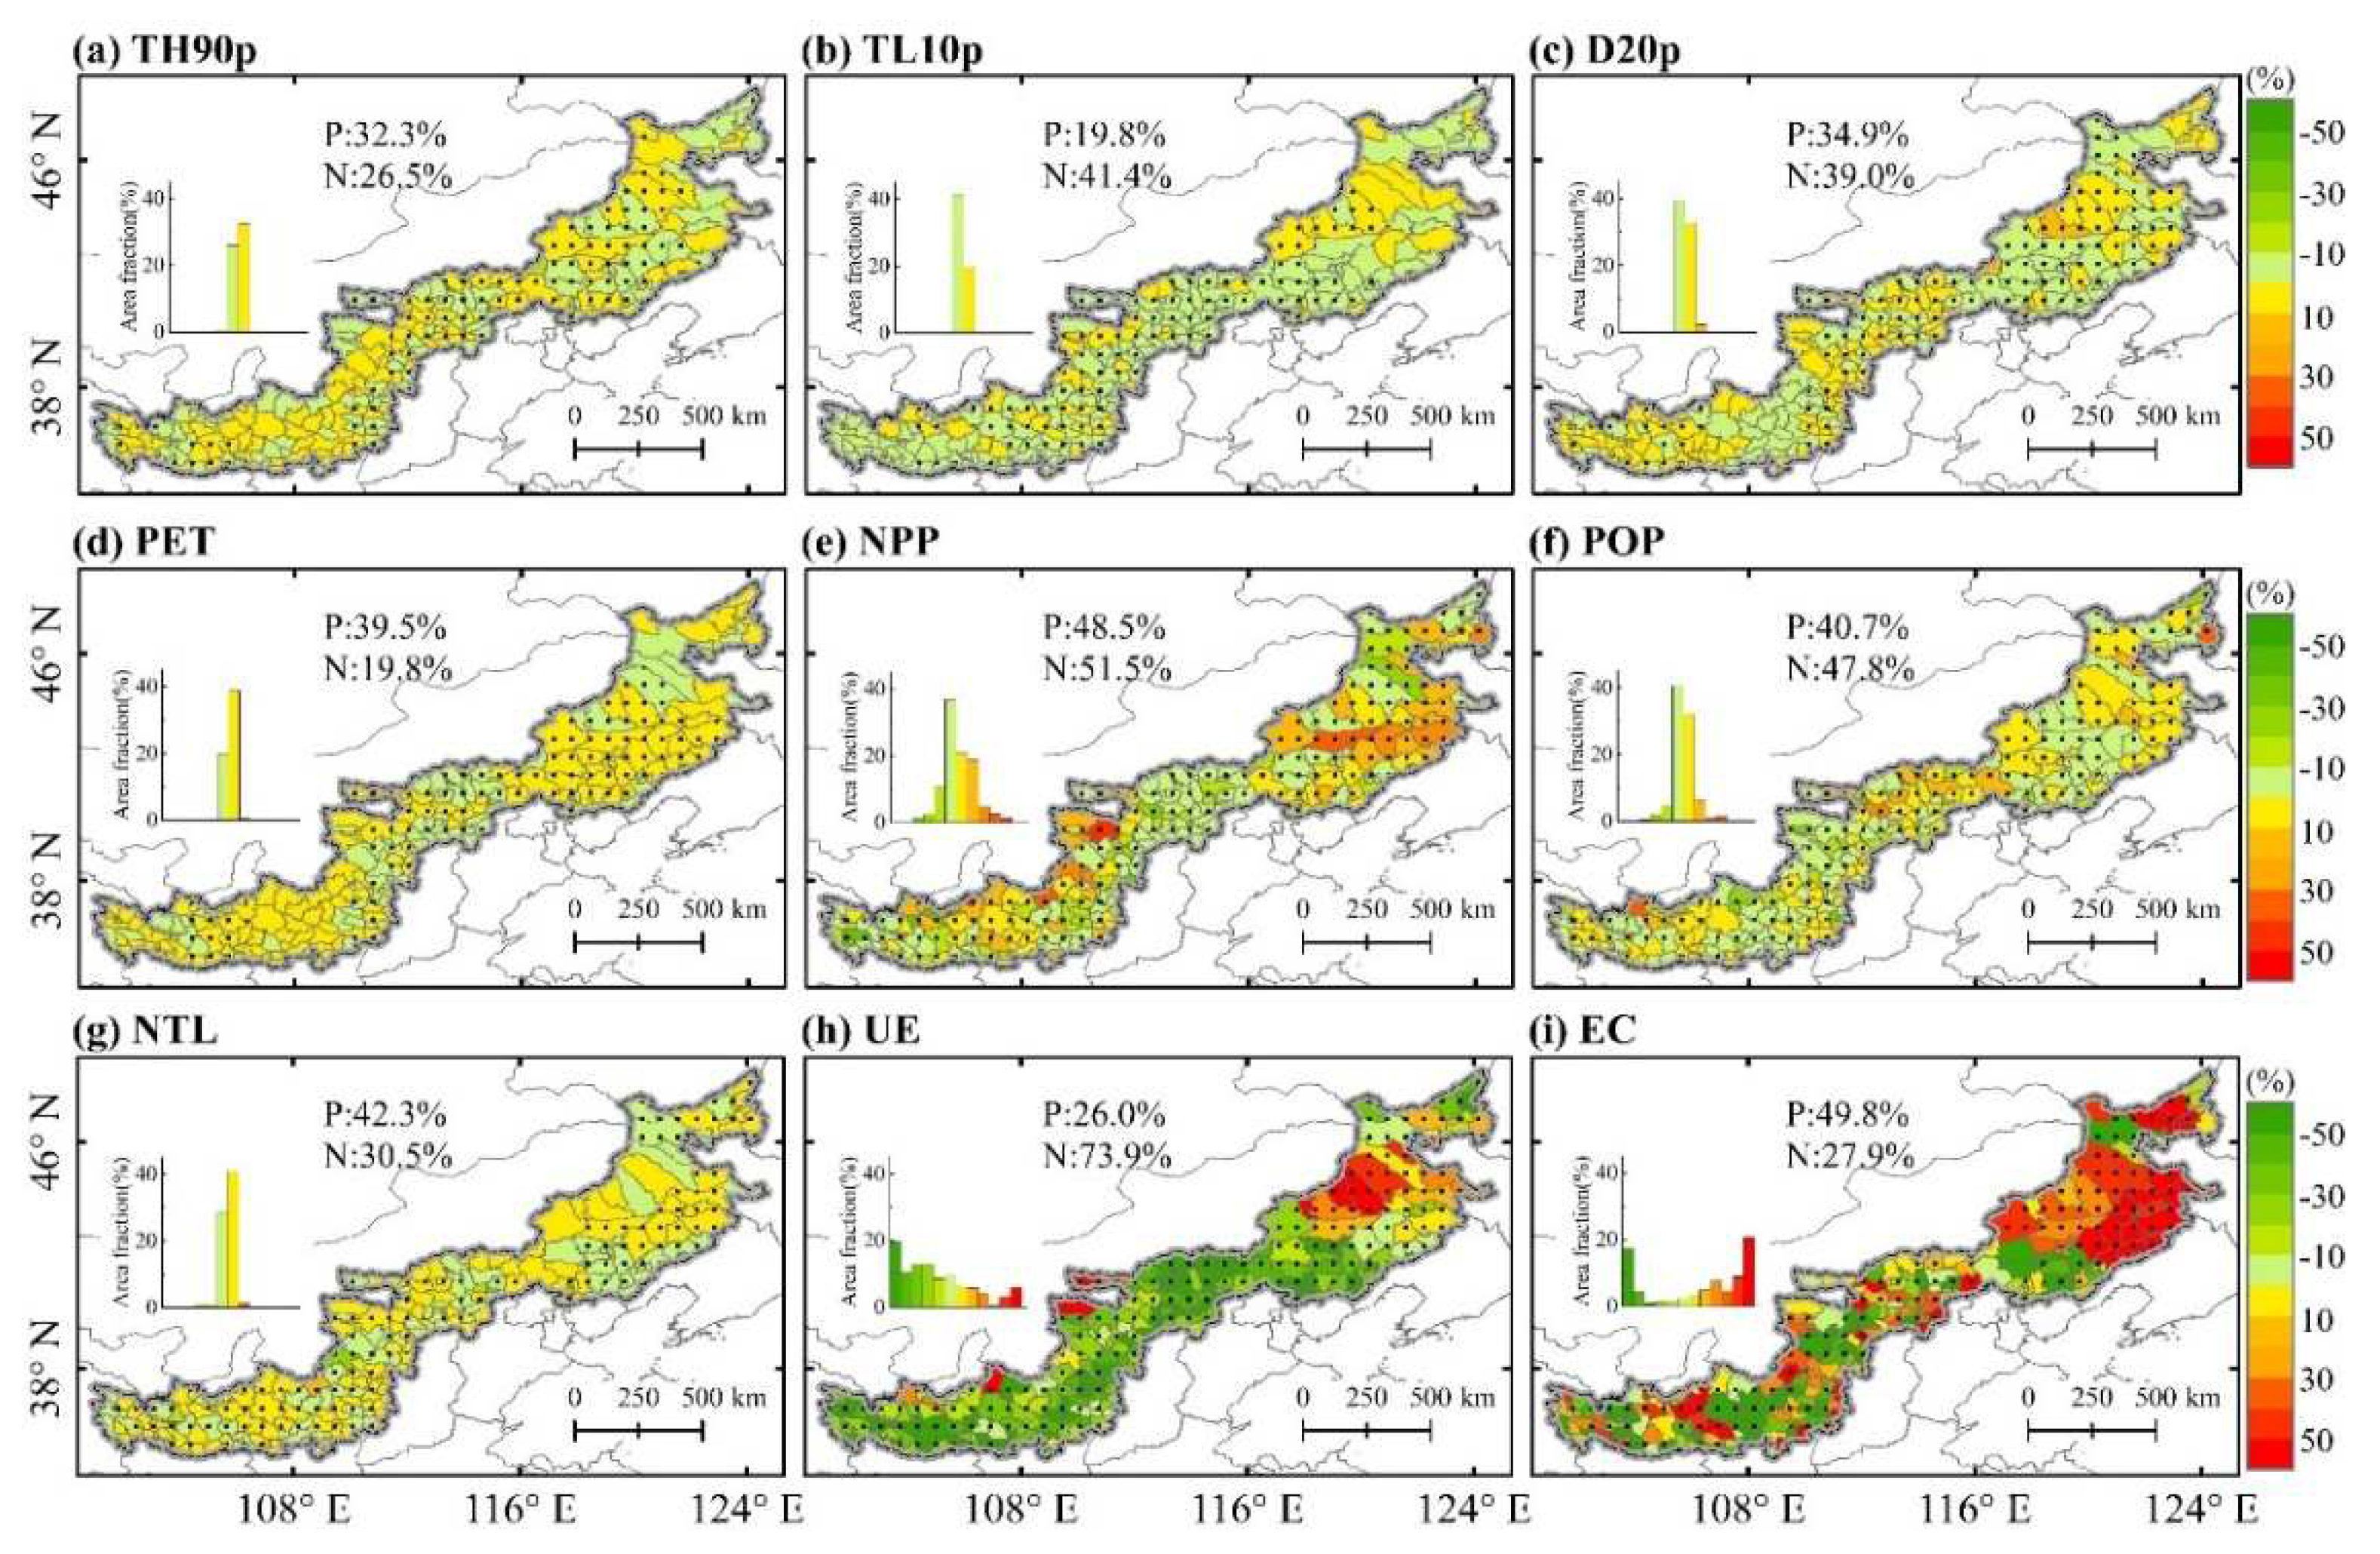
Figure 5.
Relative contributions of driving factors to trend in cropland area during 1992−2020. Note: The black dots in the graph indicating the trend of drivers significantly at the confidence level of 0.05.
Figure 5.
Relative contributions of driving factors to trend in cropland area during 1992−2020. Note: The black dots in the graph indicating the trend of drivers significantly at the confidence level of 0.05.
3.3.2. The relative contribution changes of driving factors
According to 3.1.1., we found that the TP years of cropland area in FPEN were mainly concentrated on after 2010. To spatial calculate and compare the relative contribution absolute of drivers factors, we thus took the year of 2010 as the node. The entire period was divided into two parts, i.e., the period of 1992−2010 and 2010−2020 (Figure 6, Figure A7, Figure A8). The relative contribution absolute values of TH90p, TL10p, D20p, PET, population, NTL and UE from 2010−2020 were higher than those from 1992−2010. Among them, the contribution value of TH90p had the most increase (~99.4%), mainly from the positive contribution increased (Figure A6). Contrastly, the relative contribution absolute of NPP and EC were decreased ~33.8% and ~10.3%, respectively, mainly due to the positive contribution decreased (Figure A6).
Spatially, the relative contribution absolute values of TH90p, TL10p, andUE increased evidently in more than half of the study area (Figure 6a, b and h). Among them, the increased contribution of TH90p could be found in the eastern region, while TL10p and UE mainly in the eastern and central regions. On the contrary, the relative contribution absolute of D20p, PET, NPP, population, NTL and EC decreased significantly in most regions from 1992–2010 to 2010–2020 (Figure 6c ~ g and i). Among them, NPP performed the largest decreased area, accounting for ~70.2%, and followed by EC (62.0%).
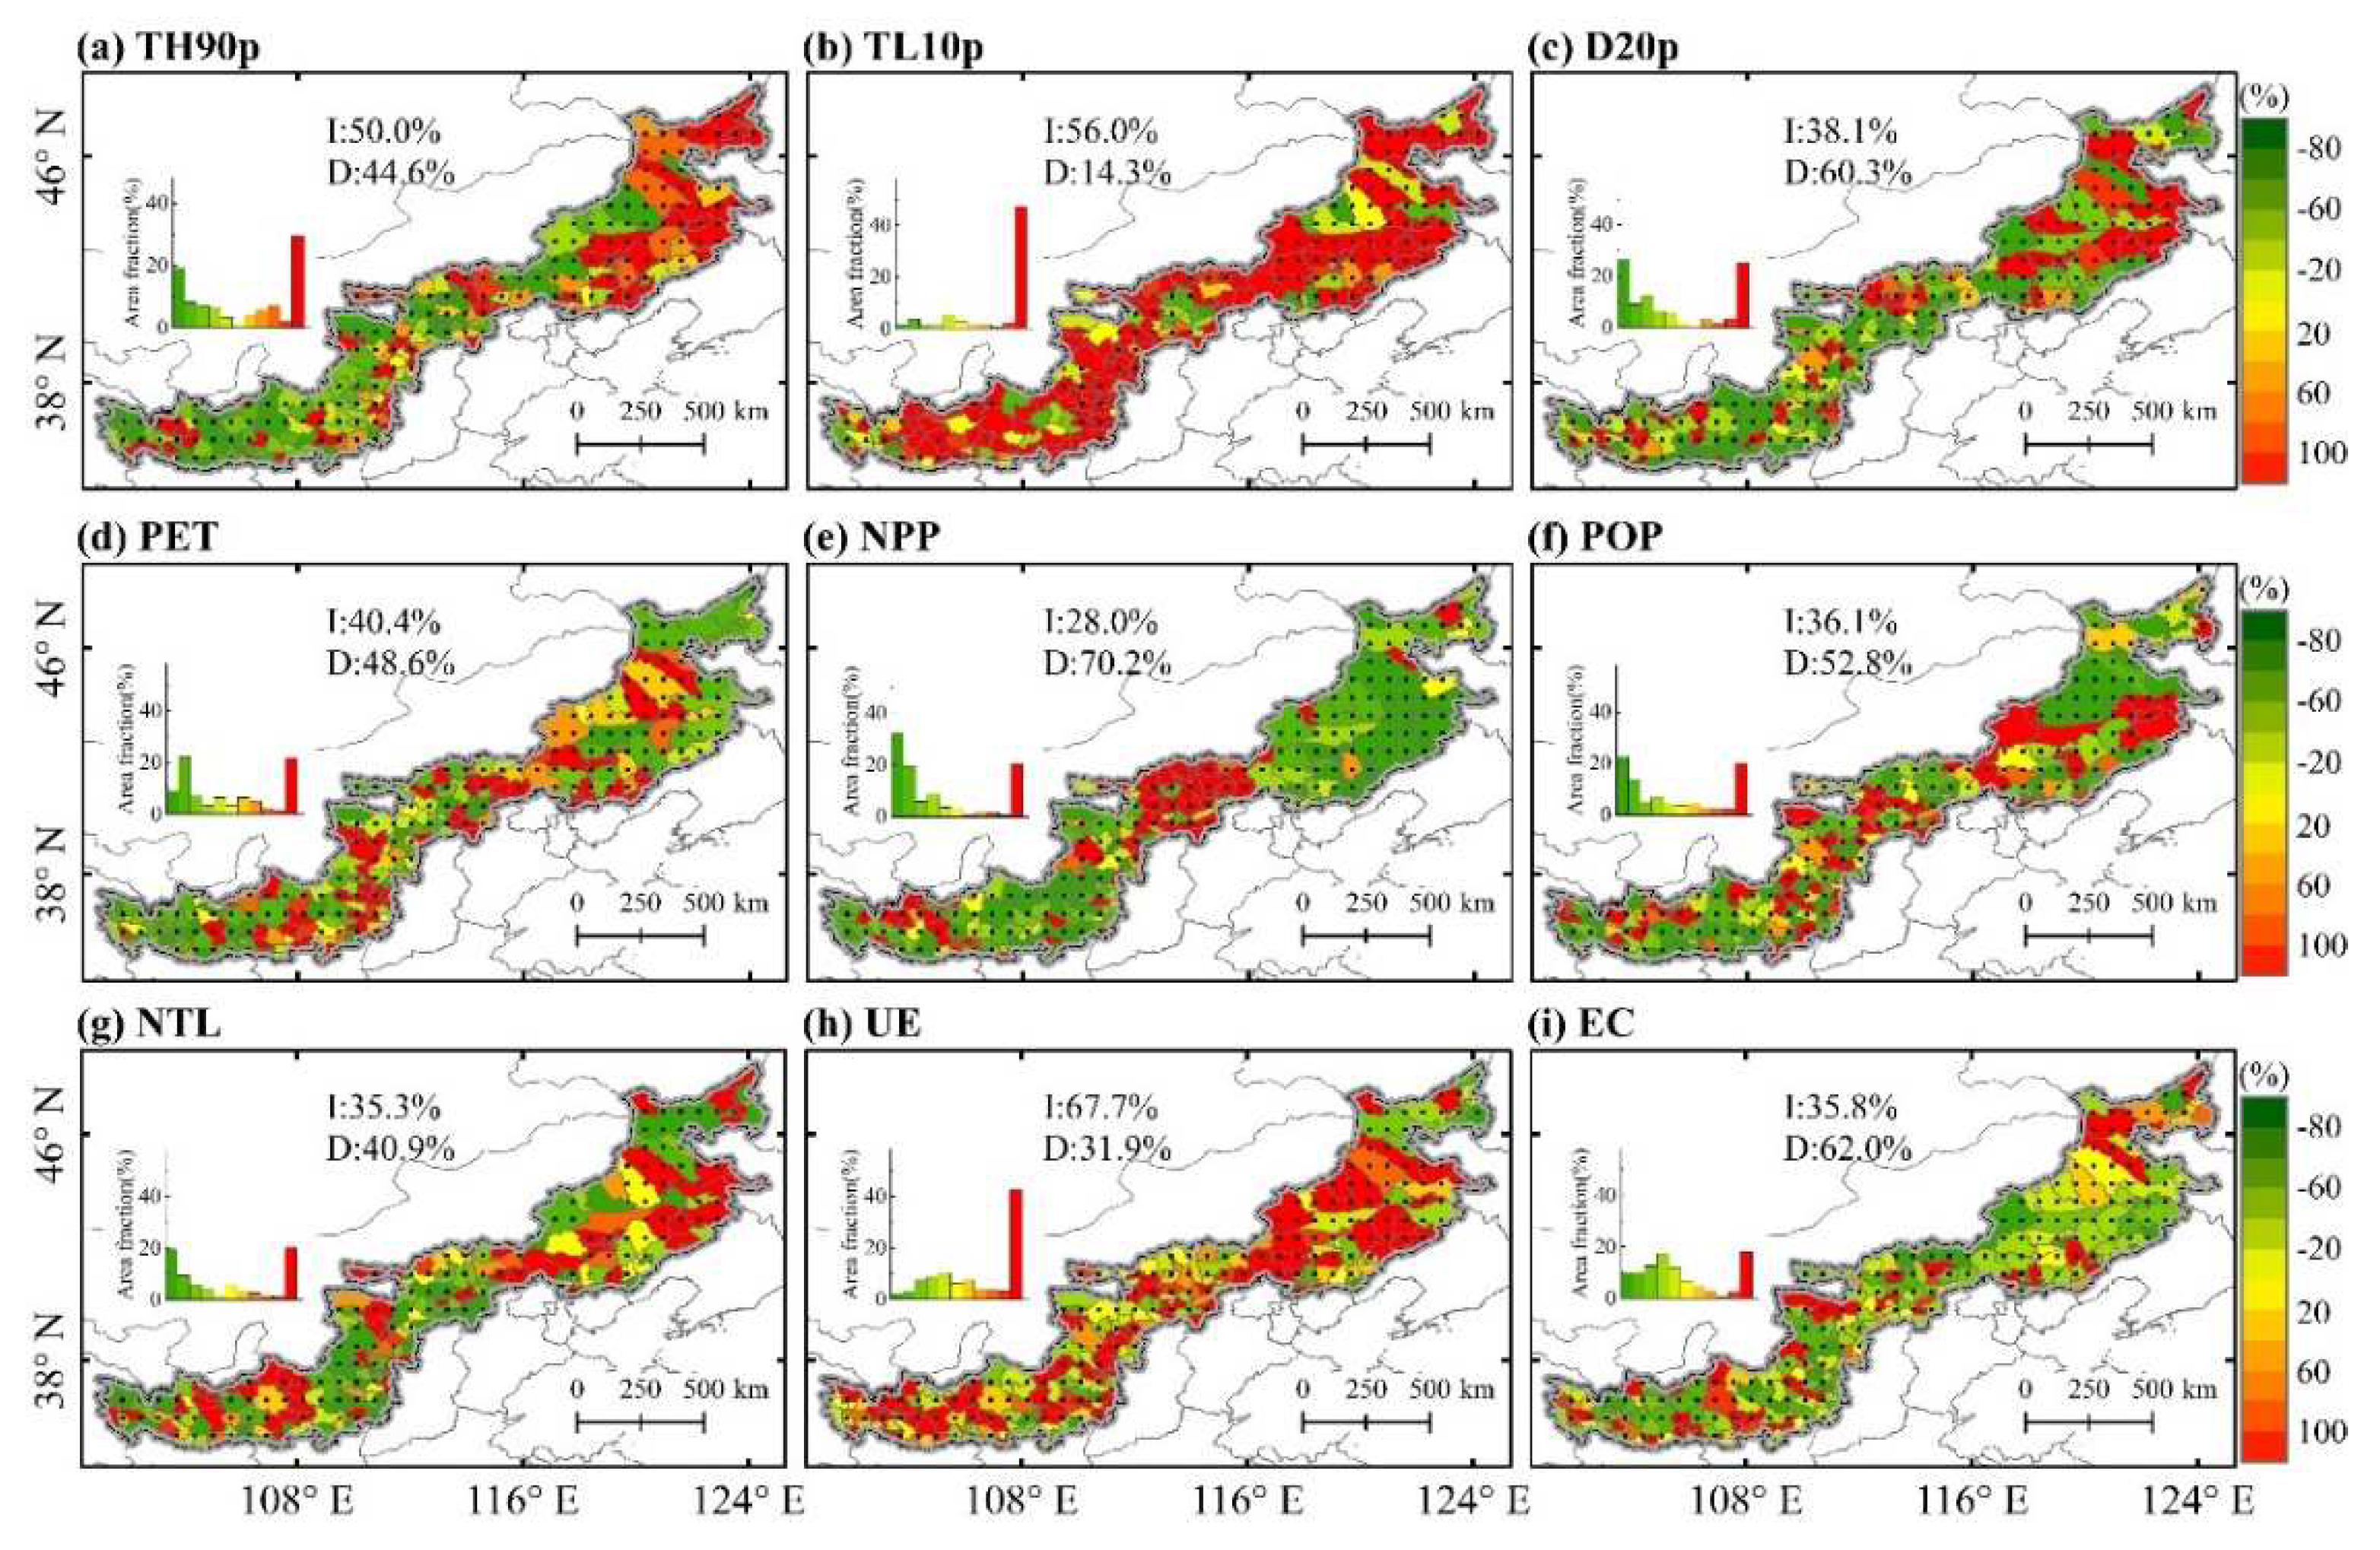
Figure 6.
The relative changes of relative contribution absolute values of driving factors before and after 2010. Note: The black dots in the graph indicating the trend of both sides of the driver in 2010 is significant or either side is significant at the 0.05 confidence level. I: the significantly increased trends, and D: the significantly decreased trends.
3.3.3. Dominance drivers and corresponding changes at the county scale
The relative contribution absolute values were used to determine the dominant factor at the county scale. We found that the dominance areas of PET, TH90p, TL10p, population and UE were increasing over time, but other factors were decreasing (Figure 7a~c). In the whole study period (1992−2020), the dominance of environment conditions, socioeconomic development, urban expansion and ecological construction covered 5.4%, 2.3%, 39.5% and 52.7% of FPEN, respectively (Figure 7a). In 1992−2010, the dominated area of ecological construction was the largest, accounted for 63.0% of FPEN (Figure 7b). Followed by urban expansion, accounted for 30.0% of FPEN (Figure 7b). Environmental and socioeconomic factors only accounted for 4.9% and 1.9% of FPEN, respectively (Figure 7b). The smallest was extreme events factors, only covered 0.2% of FPEN (Figure 7b). In 2010−2020, the dominated areas of ecological construction and environmental factors (mainly due to the decreased areas dominated by NPP) decreased ~16.1% and ~88.2%, respectively (Figure 7c). On the contrary, the dominated areas of socioeconomic factors and urban expansion increased ~35.2% and 41.9%, respectively (Figure 7c). Furthermore, we found that the area dominated by extreme events factors in 2010−2020 was about six times the area dominated in 1992−2010, mainly owing to the increased areas dominated by TH90p and TL10p (Figure 7c).
To further examine changes in driver contribution, we used the relative changes of driver contribution in the two periods to identify the factors with the largest change at the county scale (Figure 7d). The results showed that counties firstly led by extreme events, socioeconomic, urban expansion, environmental conditions, and ecological construction covered 43.0%, 16.9%, 15.6%, 13.3% and 10.7% of FPEN, respectively. Individually, the area of TL10p with the biggest change was higher than other factors, accounting for 22.2% of FPEN, mainly located in the eastern and central regions.
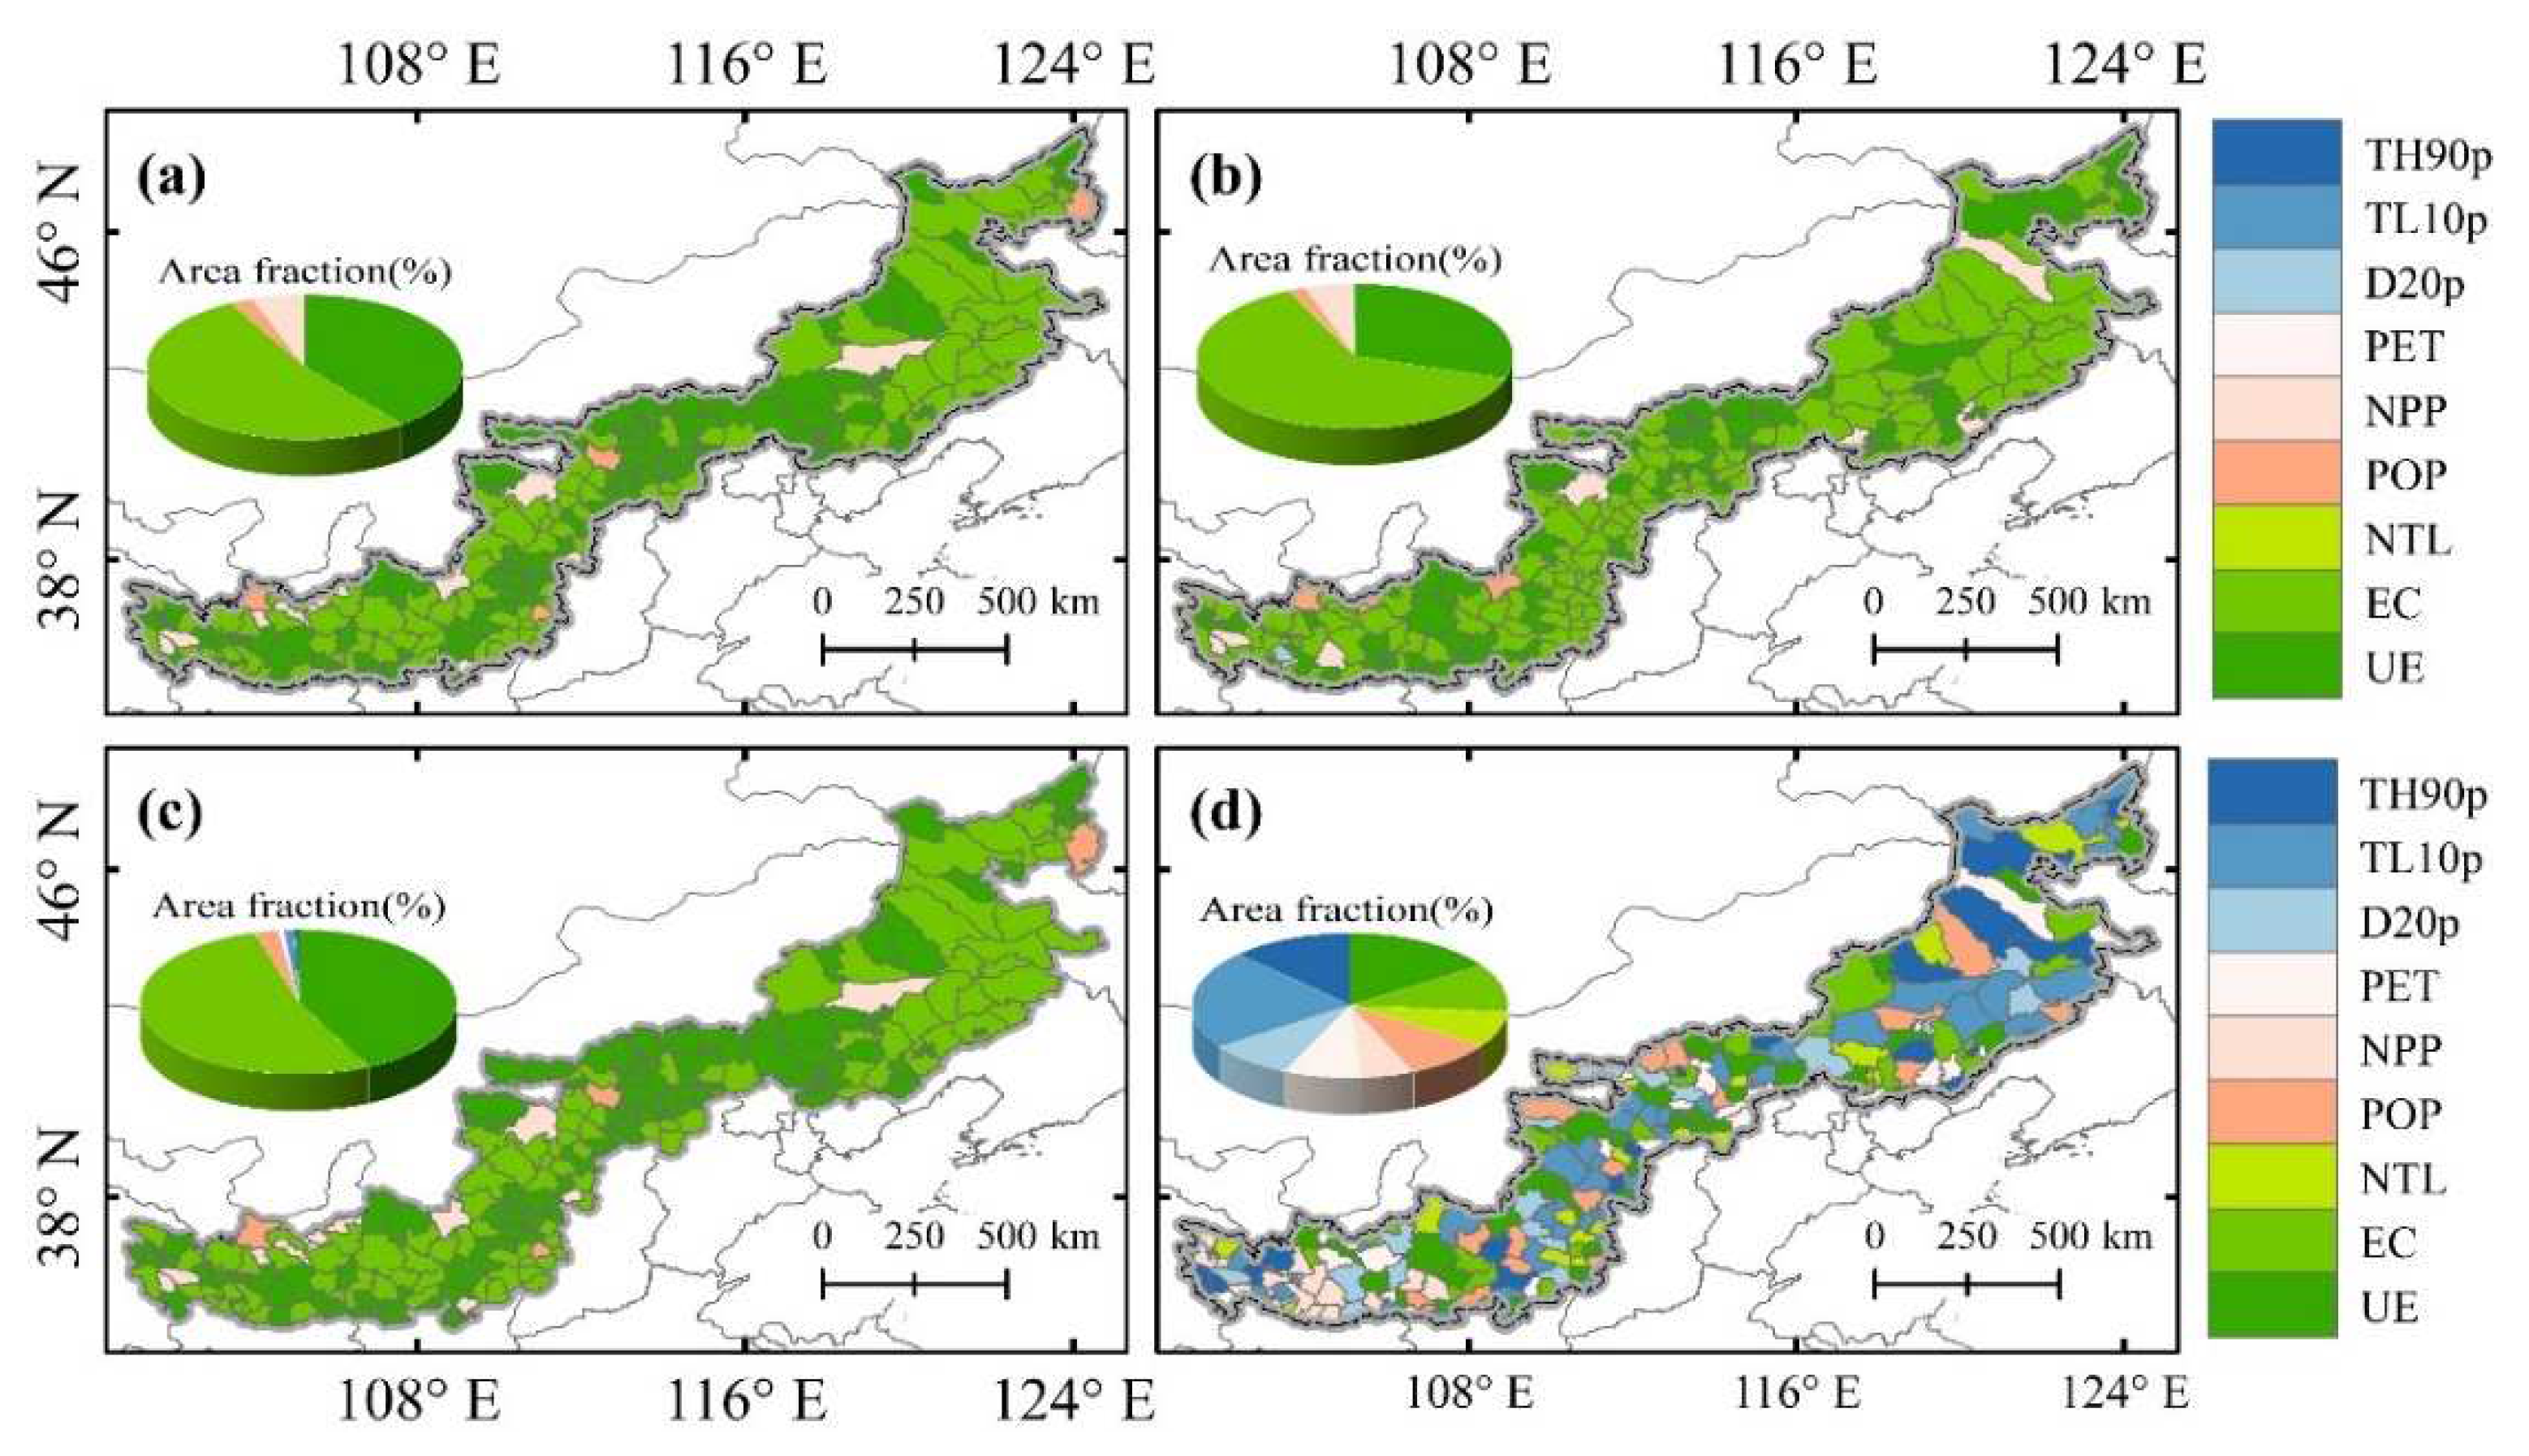
Figure 7.
The dominant drivers of cropland area trend in the three intervals (a ~ c) and the drivers with the largest relative contribution change between 1992−2010 and 2010−2020 (d) at the county scale.
Figure 7.
The dominant drivers of cropland area trend in the three intervals (a ~ c) and the drivers with the largest relative contribution change between 1992−2010 and 2010−2020 (d) at the county scale.
4. Discussion
4.1. Understanding impacts of driving factors on cropland trends
This study quantified the impacts of extreme events, environment conditions, socioeconomic development, urban expansion and ecological construction on cropland area trend. Overall, our research clarifies that the cropland area trend was dominated by ecological construction and urban expansion. It is consistent with previous studies [11,13,14,51,52]. However, interestingly, we found that while the impact of EC on cropland area trend had decreased (principally due to positive contribution decreased), although EC remained the dominant factor on cropland area trend in most of the study area (dominant area exceeded 50% of FPEN). There are two possible reasons. First, largely successful of the ecological restoration programs implemented in FPEN, making the most croplands converted to ecological land (forests and grasslands) during the past two decades [14,52,53]. Second, less economic development makes the amount of croplands converted to construction land lower than that ecological land in FPEN [14,54,55]. Other factors, such as the vulnerable ecosystem and water scarcity, may have hindered further expansion of cropland into forests and grasslands, leading to a decrease in the contribution of EC [56,57]. Additionally, rapid urbanization and industrialization resulting in more agricultural labor force far away from croplands, may also be an important factor contributing to the decline in the influence of EC [12]. Furthermore, our results also showed that the dominant area of UE increased while EC decreased.
Although climate change and extreme events have been regarded as important drivers for the cropland area changes under global warming, they are still rarely mentioned in previous studies, particularly in exploring the driving mechanism of cropland area change [20,27]. Therefore, we estimated the contribution of indices related to climatic change and extreme events on cropland area. We found that the cropland area is highly correlated to all the climate factors involved in this paper (R>0.4, p<0.05). However, areas of significantly correlated with basic climate variables required by vegetation growth and development, such as temperature and precipitation, were very small (Figure 4e and f). In contrast, the area of extreme events was much larger (Figure 4 a, b and d). This indicates that the extreme events largely broader threaten agricultural activities in FPEN. Moreover, we found that regardless of the positive or negative contributions of TH90p and TL10p on cropland area trend, their values increased in most regions of FPEN (Figure 7a~b). Indicates that extreme temperature events are more closely related to cropland area trend in the context of climatic warming [23]. Unlike Zaveri, Russ and Damania [10], we found that drought remains one of a vital factors to limiting the cropland expansion in FPEN. This situation illustrated that although coverage and intensity of irrigation facilities increased in the past few years, yet they had a little effect on offsetting the negative effects of drought on croplands [23]. This may be caused by an increased trend of D20p (trend of D20p from 0.02 days/a in 1992−2010 to 0.03 days/a in 2010−2020, Figure A2c). Extreme precipitation event is an exception, the area of significant correlation between annual extreme precipitation and cropland area in FPEN is small (Figure 4c, p<0.05), possibly due to few areas of significant trend of annual extreme precipitation in spatial extent (significant trend of annual extreme precipitation accounted for 6.3% of FPEN, Figure 4Ac, p<0.05). Overall, these results directly demonstrate that impacts of extreme events, especially extreme temperature, on cropland area trend than average climate change in FPEN.
4.2. Policy recommendations
Although the existing cropland protection policies have a positive impact on the stability or increase of cropland area, there are great uncertainties in the future [3,58]. However, the increasing gradually negative contributions of extreme events, environmental conditions, economic development, and policies factors could be not neglected. According to the results, this study provides the following four aspect suggestions: (1) strengthen intensive land utilization. Reduce the cropland loss caused by the construction land expansion. Improve requirement of cropland protection policies, and strictly limit the conversion of high-quality cropland to other uses [58]. (2) Vigorously promote sustainable agricultural intensification, reduce pesticide and fertilizer use, and adopt intercropping/fallow forms of farming [59]. It could help increase food production while avoiding the ecological environment degradation of FPEN due to intensive intensification. (3) Increase financial investment related to agriculture, implement targeted agricultural payment policies, and attract large, medium and small agricultural enterprises to participate in local agricultural development [21]. At the same time, the land managers are suggested to raise appropriately prices of agricultural products to ensure farmers' income, promote motivate farmers to engage in agricultural activities and maintain or increase appropriately cropland areas in FPEN in the future [19]. (4) Accelerate development of agricultural science and technology, such as, promoting climate-smart agriculture, better coping with the impact of climate change and extreme events on food production, and reducing the risk of cropland loss caused by unfavorable climatic conditions [60].
Furthermore, considering the different climatic and environmental conditions in FPEN, The above recommendations should be precisely implemented according to location conditions [19]. For example, eastern region has abundant black soil resources and flat terrain. Intensive agriculture should be vigorously developed, increased financial investment, and appropriately increased area of cropland. On the contrary, in the central and western with a relatively vulnerable ecological environment, we should promote drought-resistant, heat-resistant and cold-resistant crops under the premise of ensuring the existing croplands, while avoiding large-scale expansion of cropland.
4.3. Limitations of this study
In this study, we only considered the effect of frequency of extreme events on cropland area trend. However, cropland area trend is also affected by other features of extreme events, such as duration, intensity and areal extent. Additionally, lag effects between driving factors and cropland area trend were not considered in this study. More importantly, although we tried to explore the impacts of drivers on cropland area trend from as many perspectives as possible in this study, we still cannot take into account all relevant factors. Besides, the interactions among drivers were not considered in this study. Therefore, we will focus on addressing the above issues in future work.
5. Conclusions
This study analyzed the spatiotemporal dynamics of cropland area and its driving factors during 1992−2020, and quantified the impacts of these drivers on cropland area trend in three periods (1992−2020, 1992−2010, and 2010−2020). We found that cropland changes showed spatial heterogeneity. Increased cropland areas mainly were located in the eastern region, while decreased focused on the central and western regions. Yet the total cropland area showed a significant increasing trend with 333.5km2/a (p<0.05) in FPEN during 1992−2020. The results of ridge regression analyses presented that ecological construction and urban expansion dominated cropland area change in FPEN. Ecological construction was always the largest contributor, even though relative contributions of EU increased 33.7% during 2010−2020. At the same time, extreme events effects on cropland area trend evidently increased, and TH90p was the largest ~99.4%, largely due to increased frequency of extreme weather events under climatic warming. Importantly, the dominant area of extreme events in 2010−2020 increased about six times compared to that in 1992−2010. TH90p and TL10p are the first two dominant extreme climatic factors. Also, we found that impacts of socioeconomic factors on cropland area trend increased. Thus, it is necessary to consider extreme weather events in future related studies. It could help us better understand cropland area trend and maintain food security under climatic warming.
Author Contributions
Conceptualization, Wencun Zhou and Zhengjia Liu. Methodology, Wencun Zhou and Zhengjia Liu. Software, Wencun Zhou and Zhengjia Liu. Writing – original draft preparation, Wencun Zhou. Writing – review, editing and revision, Wencun Zhou, Zhengjia Liu.
Funding
This study is funded by the National Natural Science Foundation of China (Grant No. 41971218), the “Kezhen and Bingwei” Young Scientist Program of IGSNRR (Grant No. 2022RC001) for Z. Liu and the Strategic Priority Research Program of the Chinese Academy of Sciences (Grant No. XDA23070302).
Acknowledgments
We thank the European Space Agency (ESA) (https://www.esa.int/), European Centre for Medium Range Weather Forecasts (ECMWF) (https://www.ecmwf.int/), United States Geological Survey (USGS) (https://www.usgs.gov/), and Land Scan (https://landscan.ornl.gov/). The special thanks are given to Xia Zhang and Xuecao Li for sharing the drought index and nighttime light data, and Huimin Zhong, Fangxin Chen and Xueqi Liu for valuable suggestions in improving this manuscript.
Conflicts of Interest
The authors declare that they have no known competing financial interests or personal relationships that could have appeared to influence the work reported in this paper.
Abbreviation
| Abbreviation | Full name |
| TH90p | Annual frequency of extreme high temperature |
| TL10p | Annual frequency of extreme low temperature |
| D20p | Annual frequency of drought |
| PET | Potential evaporation |
| NPP | Net primary productivity |
| NTL | Nighttime light index |
| UE | Urban expansion |
| EC | Ecological construction |
Appendix A
1. Method
The spatial-temporal standardized of variables means that variables are standardized at the same time in both temporal and spatial dimensions. The spatial-temporal can make the relative contribution of the driving factors comparable in spatial, meanwhile, to reflect the trend of cropland area caused by per unit change of driving factors. This method enables us to analyze the relative contribution of driving factors to the trend of cropland area at the county-scale. Eq. 1 is used to compute variables of spatial-temporal standardized, respectively.
where represent the deviation standardization time series of j variable in i county (have 9 variables and 245 counties in this study); and are the maximum and minimum value of , respectively.
To evaluate the accuracy of the simulated results, we calculated three metrics, including root-mean-square error, RMSE and coefficient of determination R2 and RMSE/mean, for each partition and county (Figure A4). Formulas is as follows:
where and are the historical and simulated cropland area in the year i (from 1992 to 2020) in j country (0<j≤245), respectively. is the average of from 1992 to 2020.
Appendix B
1. Figure
Figure A1.
The VIF scores of filtered driving factors at county-scale.
The extreme events, environmental conditions, socioeconomic development, construction land area and ecological land area changed considerably in FPEN from 1992 to 2020 (Figure A2a~i, Figure A3a~d, Figure A4a~m). For climate, AAT increased significantly at the rate of 0.03℃/a (p<0.05), and AP decreased significantly at the rate of -2.8mm/a (p<0.05) in FPEN during 1992–2020, indicating the FPEN has experienced extensive warming-drying change ((Figure A3a~b, (Figure A4c and e). At the same time, the frequency of extreme events had also changed. TH90p and D20p had significant increasing trends (0.65 days/a and 1.22 days/a, p<0.05), mainly distribution in the eastern and central regions (Figure A2a and c, Figure A4a and f). On the contrary, the TL10p was significantly decreased with 0.76 days/a (p<0.05) (Figure A3b, Figure A4b). Throughout FPEN, R95p changed very little, although it decreased with -0.02 days/a, was not significant (Figure A3c, Figure A4d).
PET and NPP increased significantly at the rate of 2.7 mm/a and 6.6 gC/m2/a, respectively (p<0.05, (Figure A2d and e). In contrast, SWV did not change significantly, and decreasing only by 0.03 mm3 from 1992 to 2020. Especially, the change of SWV showed distinct stages with opposite trend before and after 2006, and increasing from 1992 to 2006 and decreasing from 2006 to 2020 ((Figure A3d). This situation may be caused by the increase in FPEN irrigated agriculture [61]. Spatially, the areas with a significant increase in PET accounted for ~60.9% of FPEN, principally distributed in large parts of eastern and central. Except for some parts of eastern, where NPP exhibited a significant decreasing, most of remaining areas were dominated with significant increase, the areas of significant increase ~95.3% of FPEN (Figure A4g and h). The area of SWV with significant reduced accounted for ~44.8% of FPEN, mostly distributed in a high proportion of forestlands (Figure 1a and Figure A4i).
POP and NTL increased significantly at a rate of 12.1×10⁴per/a and 0.19DN/a, respectively (p<0.05, Figure A2f and g). Spatially, POP increase showed the characteristics of aggregation, mainly in central. Except for eastern, NTL showed a significant increase trend in most regions (p<0.05), and the significant increase in area accounts for ~74.6% of FPEN (Figure A4j and k).
UE decreased from 45.2×10⁴km2 in 1992 to 44.1×10⁴km2 in 2020 in FPEN, a significantly trend increased with ~434.7km2/a (p<0.05, Figure A2h). UE in the study area expanded at a rate of 165.8km2/a from 1992 to 2020, and the significantly increased area accounted for ~12.54% of FPEN (Figure A2i, Figure A4m). In the eastern, the loss of EC was the largest (the loss area was ~1.1×10⁴km2), and the significantly trend decreased area accounts for ~33.34% of FPEN. The EC in most areas of central and western was mainly expanded, with a significant expansion area of 106.65km2 and 278.46km2, respectively (Figure A4l).
Figure A2.
Time series of filtered driving factors by Pearson correlation analysis during 1992−2020.
Figure A2.
Time series of filtered driving factors by Pearson correlation analysis during 1992−2020.
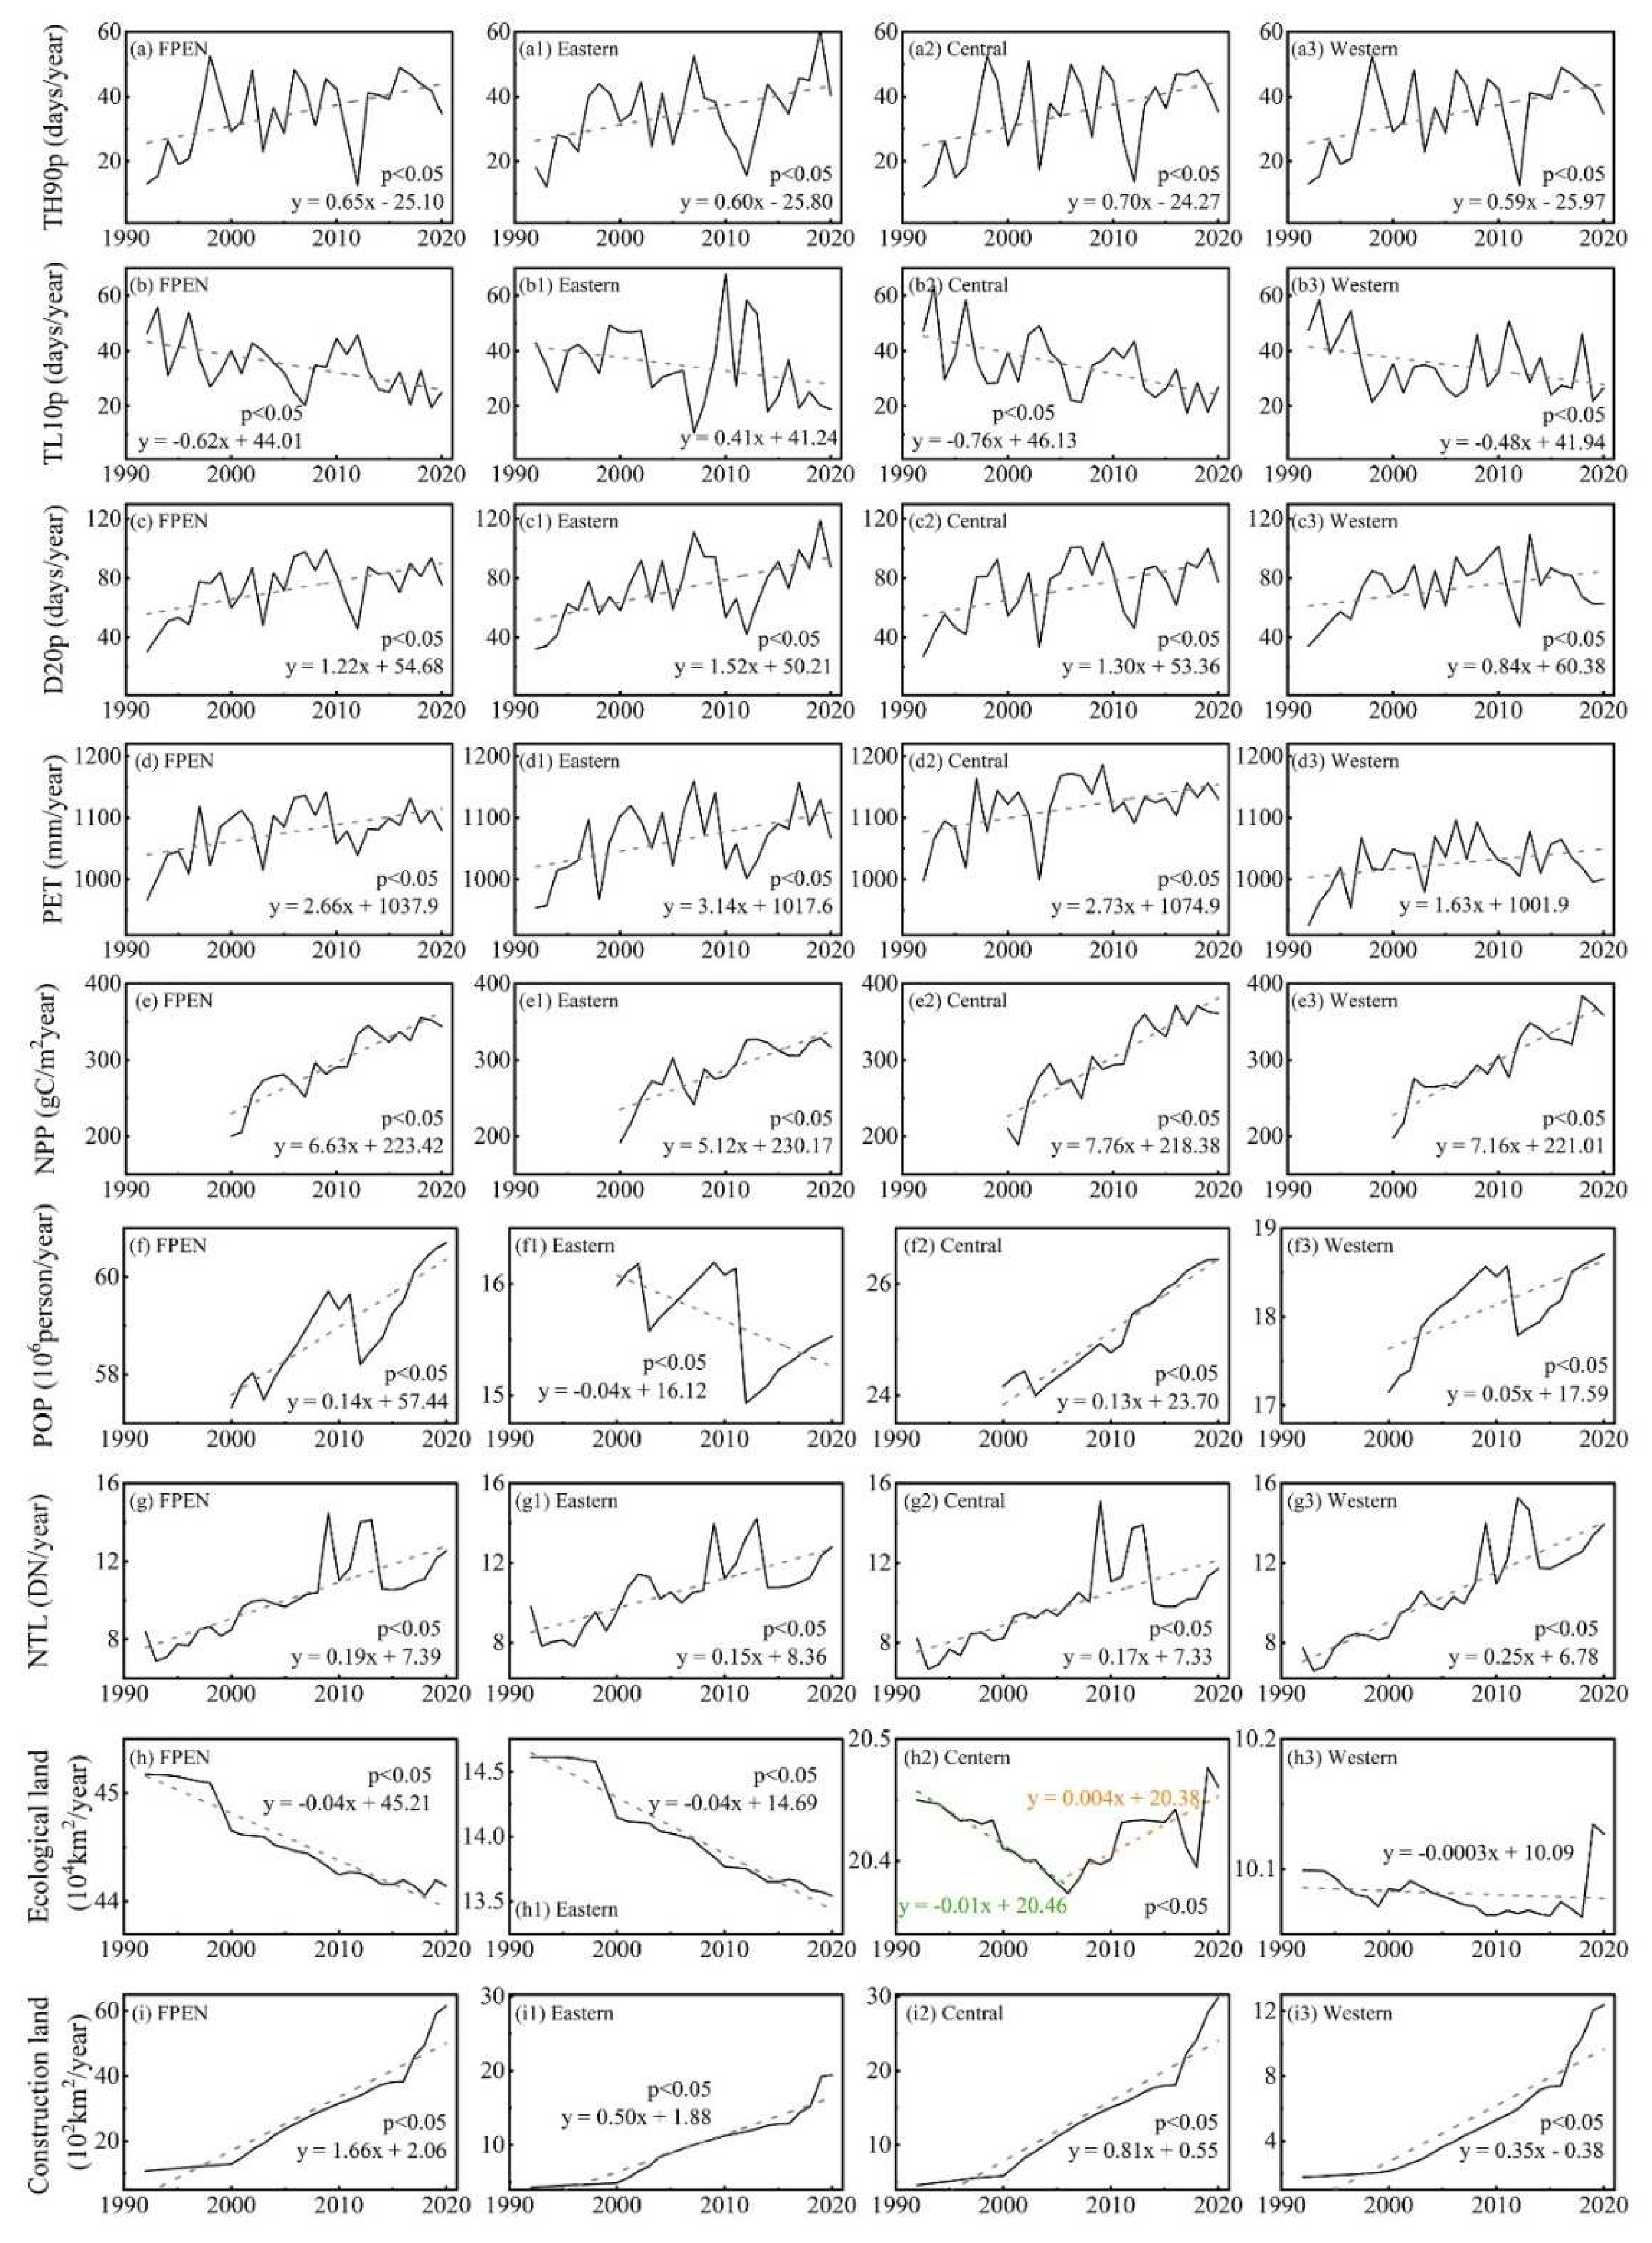
Figure A3.
Time series of driving factors with significantly correlated areas < 20% during 1992−2020.
Figure A3.
Time series of driving factors with significantly correlated areas < 20% during 1992−2020.
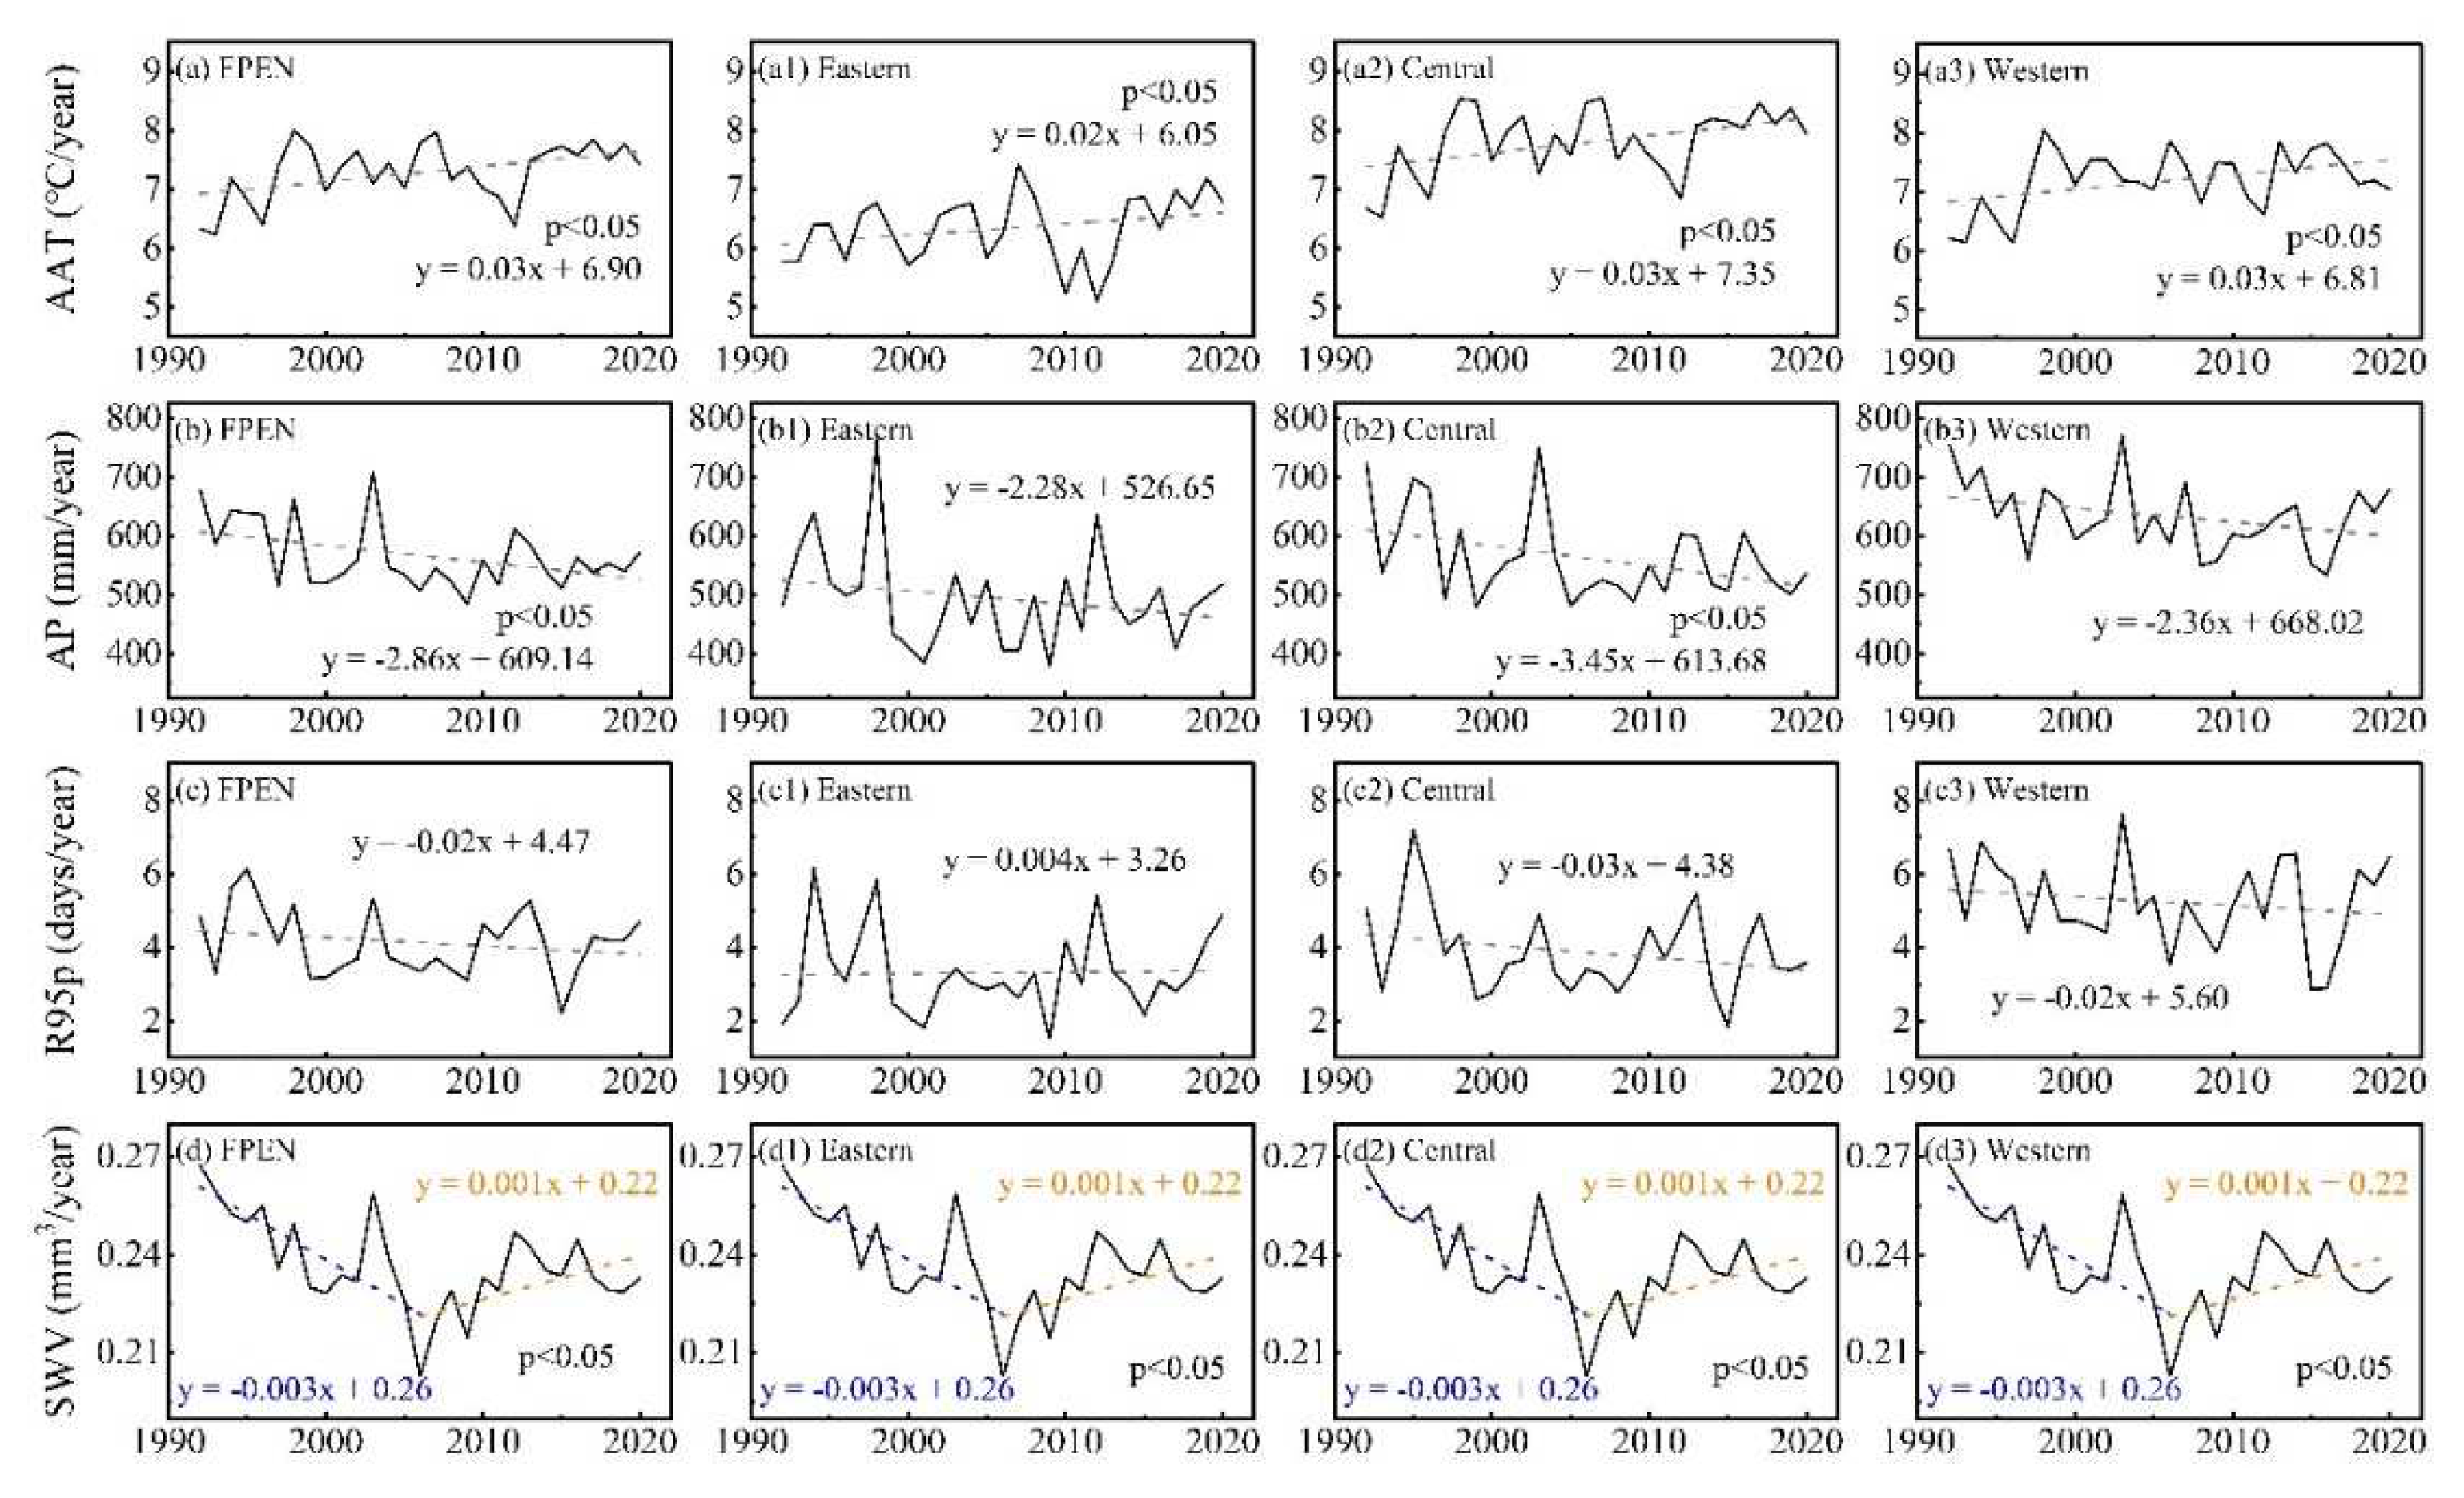
Figure A4.
Trends of driving factors in FPEN from 1992 to 2020. Spatial distribution of driving factors trend (a) ~ (m), mean trend of driving factors (n).
Figure A4.
Trends of driving factors in FPEN from 1992 to 2020. Spatial distribution of driving factors trend (a) ~ (m), mean trend of driving factors (n).
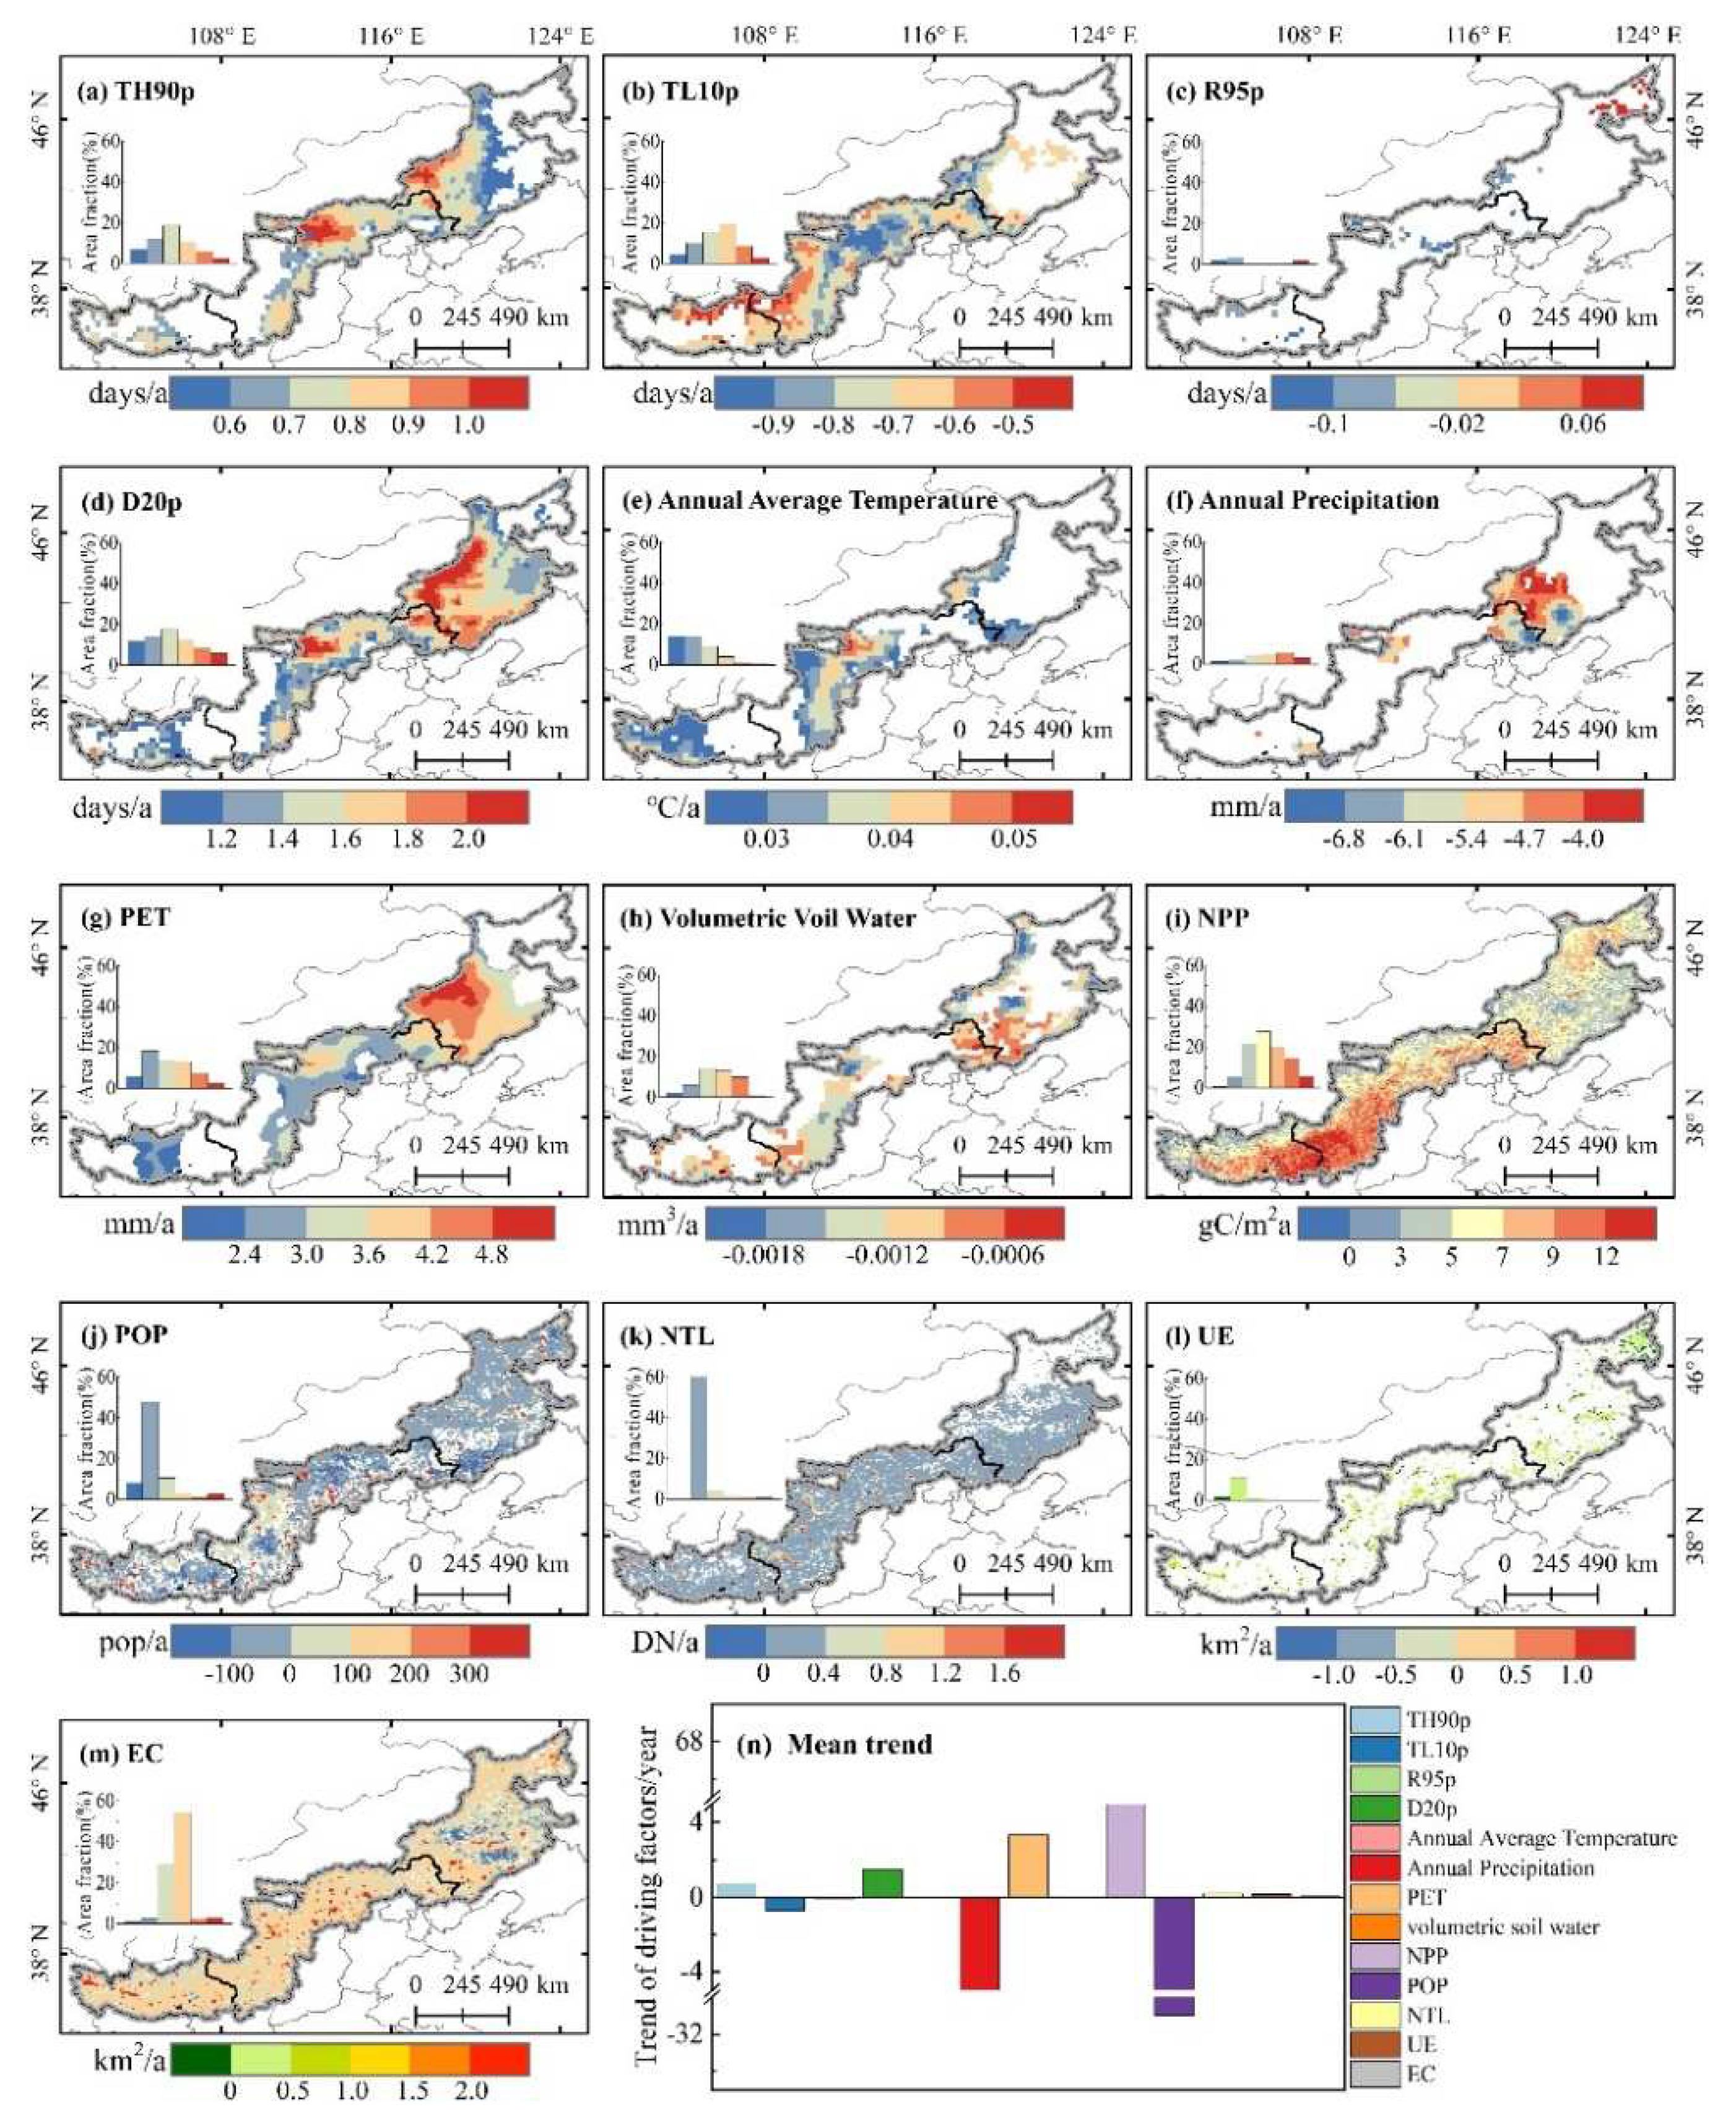
Figure A5.
Comparison between simulated by ridge regression and historical cropland area for each partition and county during 1992−2020.
Figure A5.
Comparison between simulated by ridge regression and historical cropland area for each partition and county during 1992−2020.
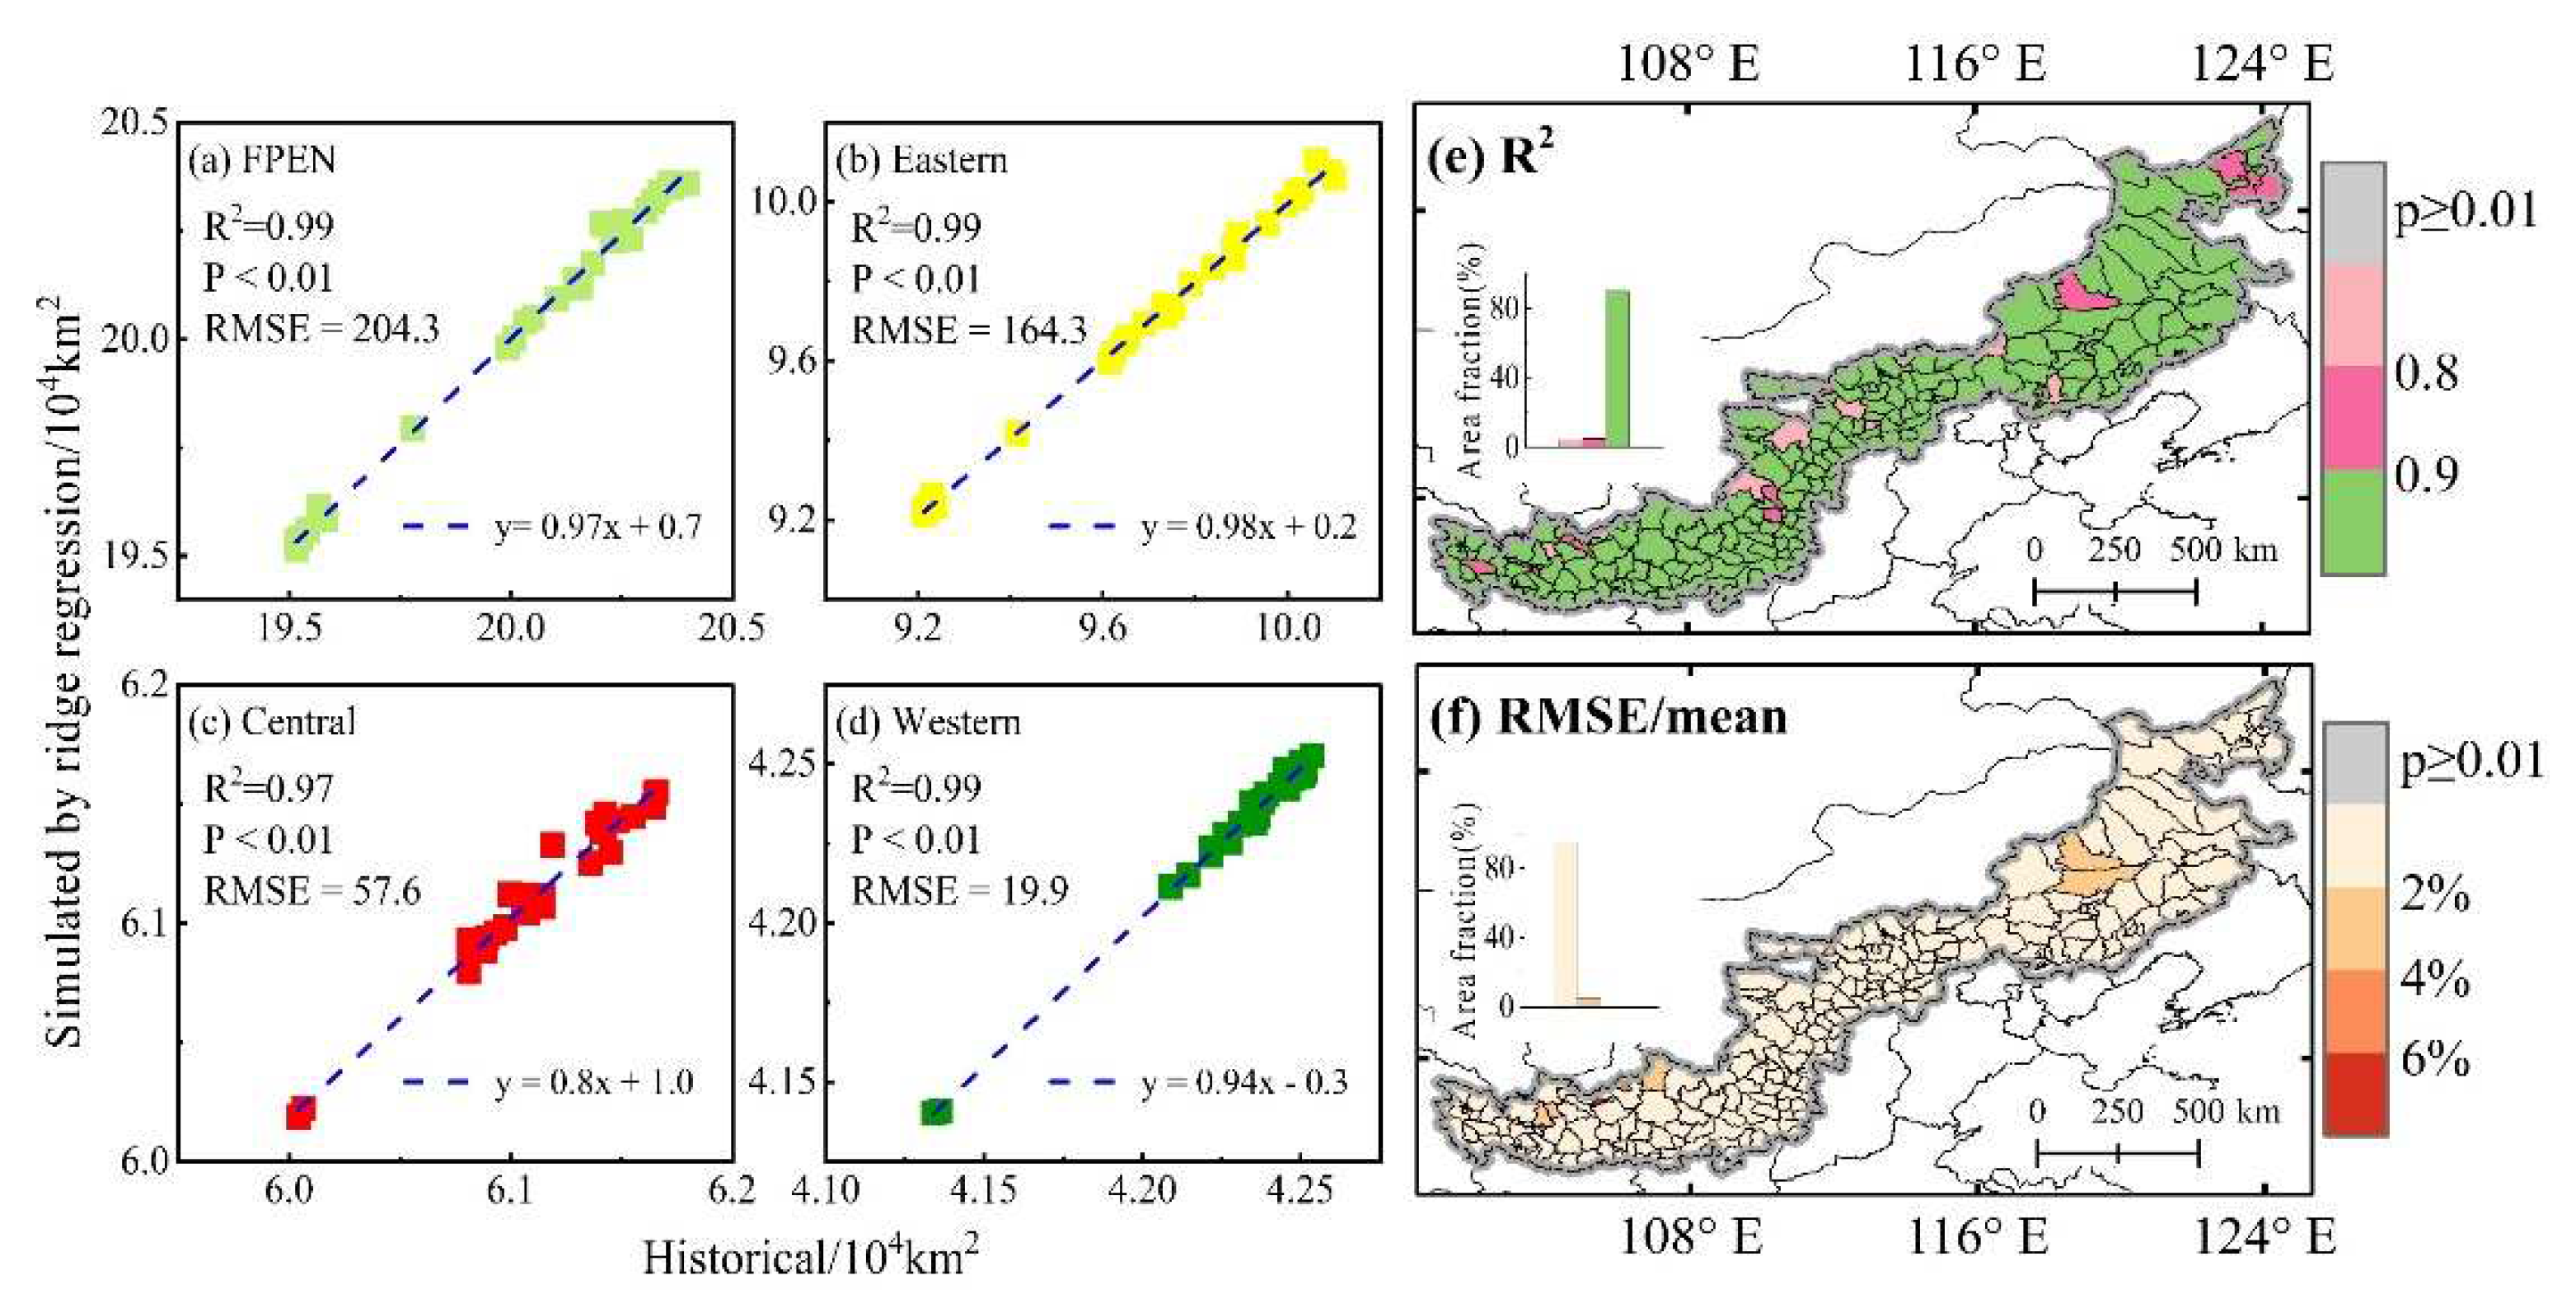
Figure A6.
Contribution difference of driving factors between 1992−2010 and 2010−2020. (a) Absolute contribution difference of driving factors between 1992−2010 and 2010−2020, (b) positive absolute contribution difference of driving factors between 1992−2010 and 2010−2020, (c) negative absolute contribution difference of driving factors between 1992−2010 and 2010−2020.
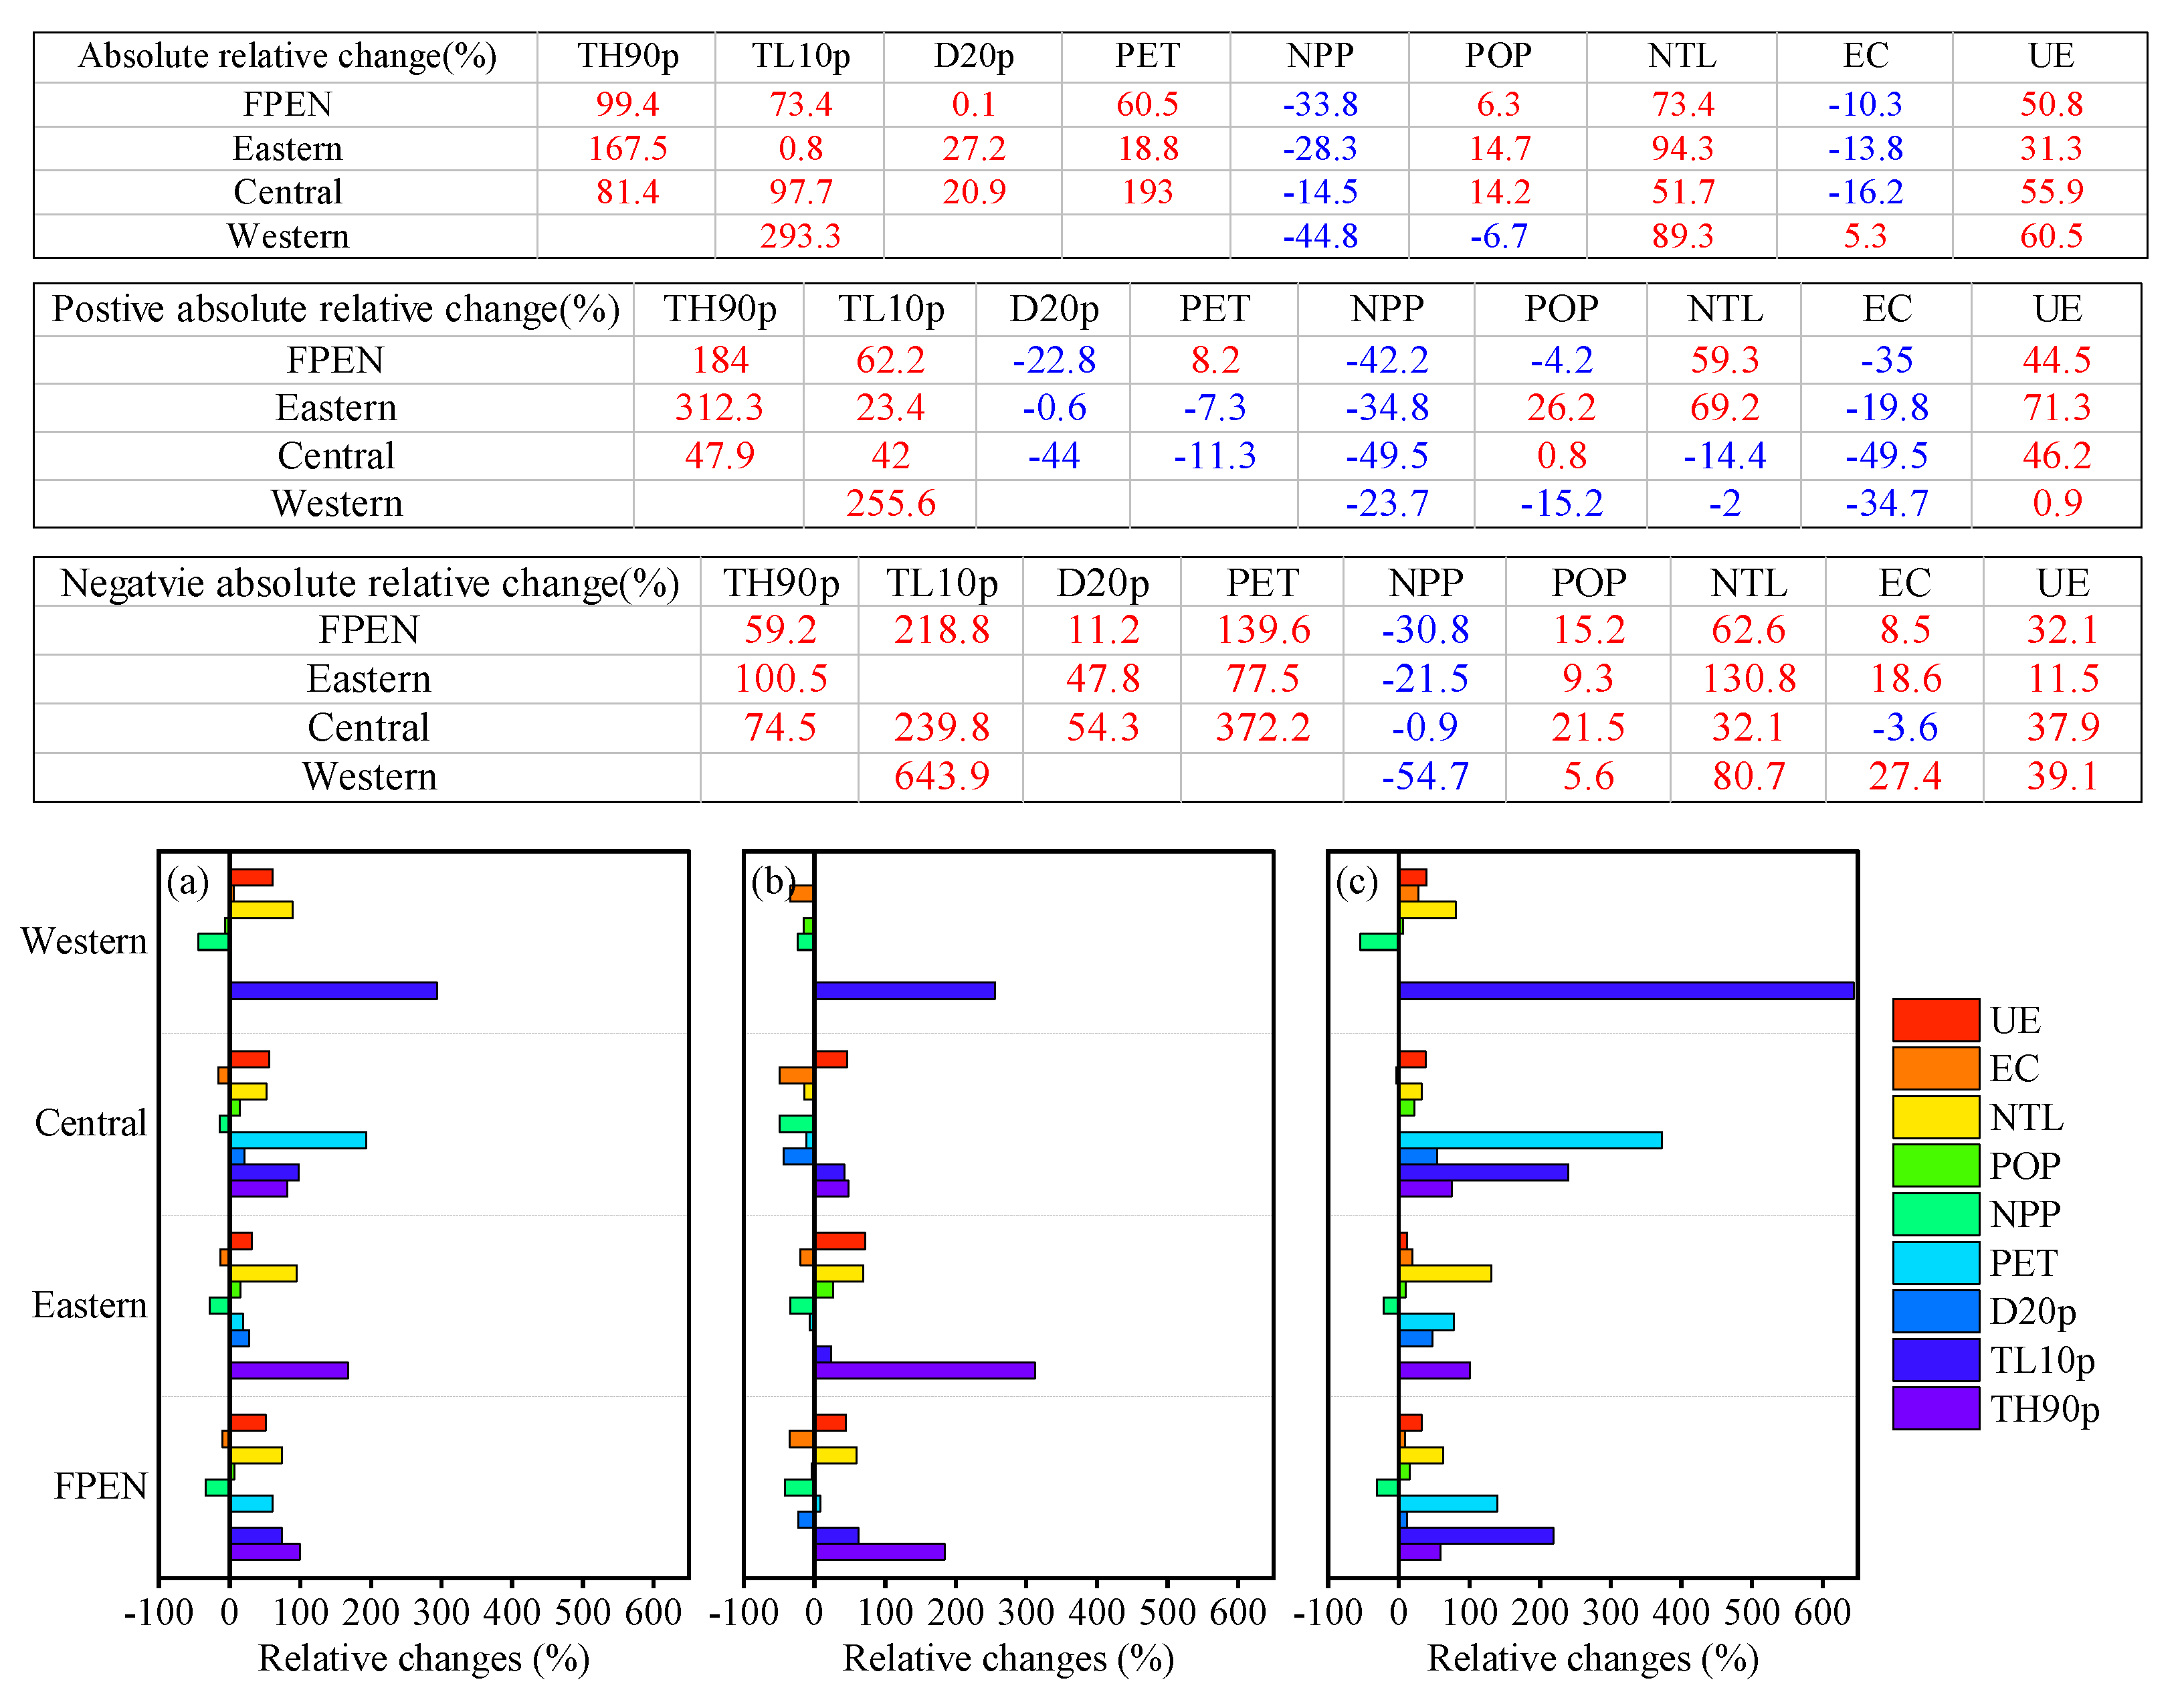
Figure A7.
Relative contributions of driving factors to trend in cropland area during 1992−2010.
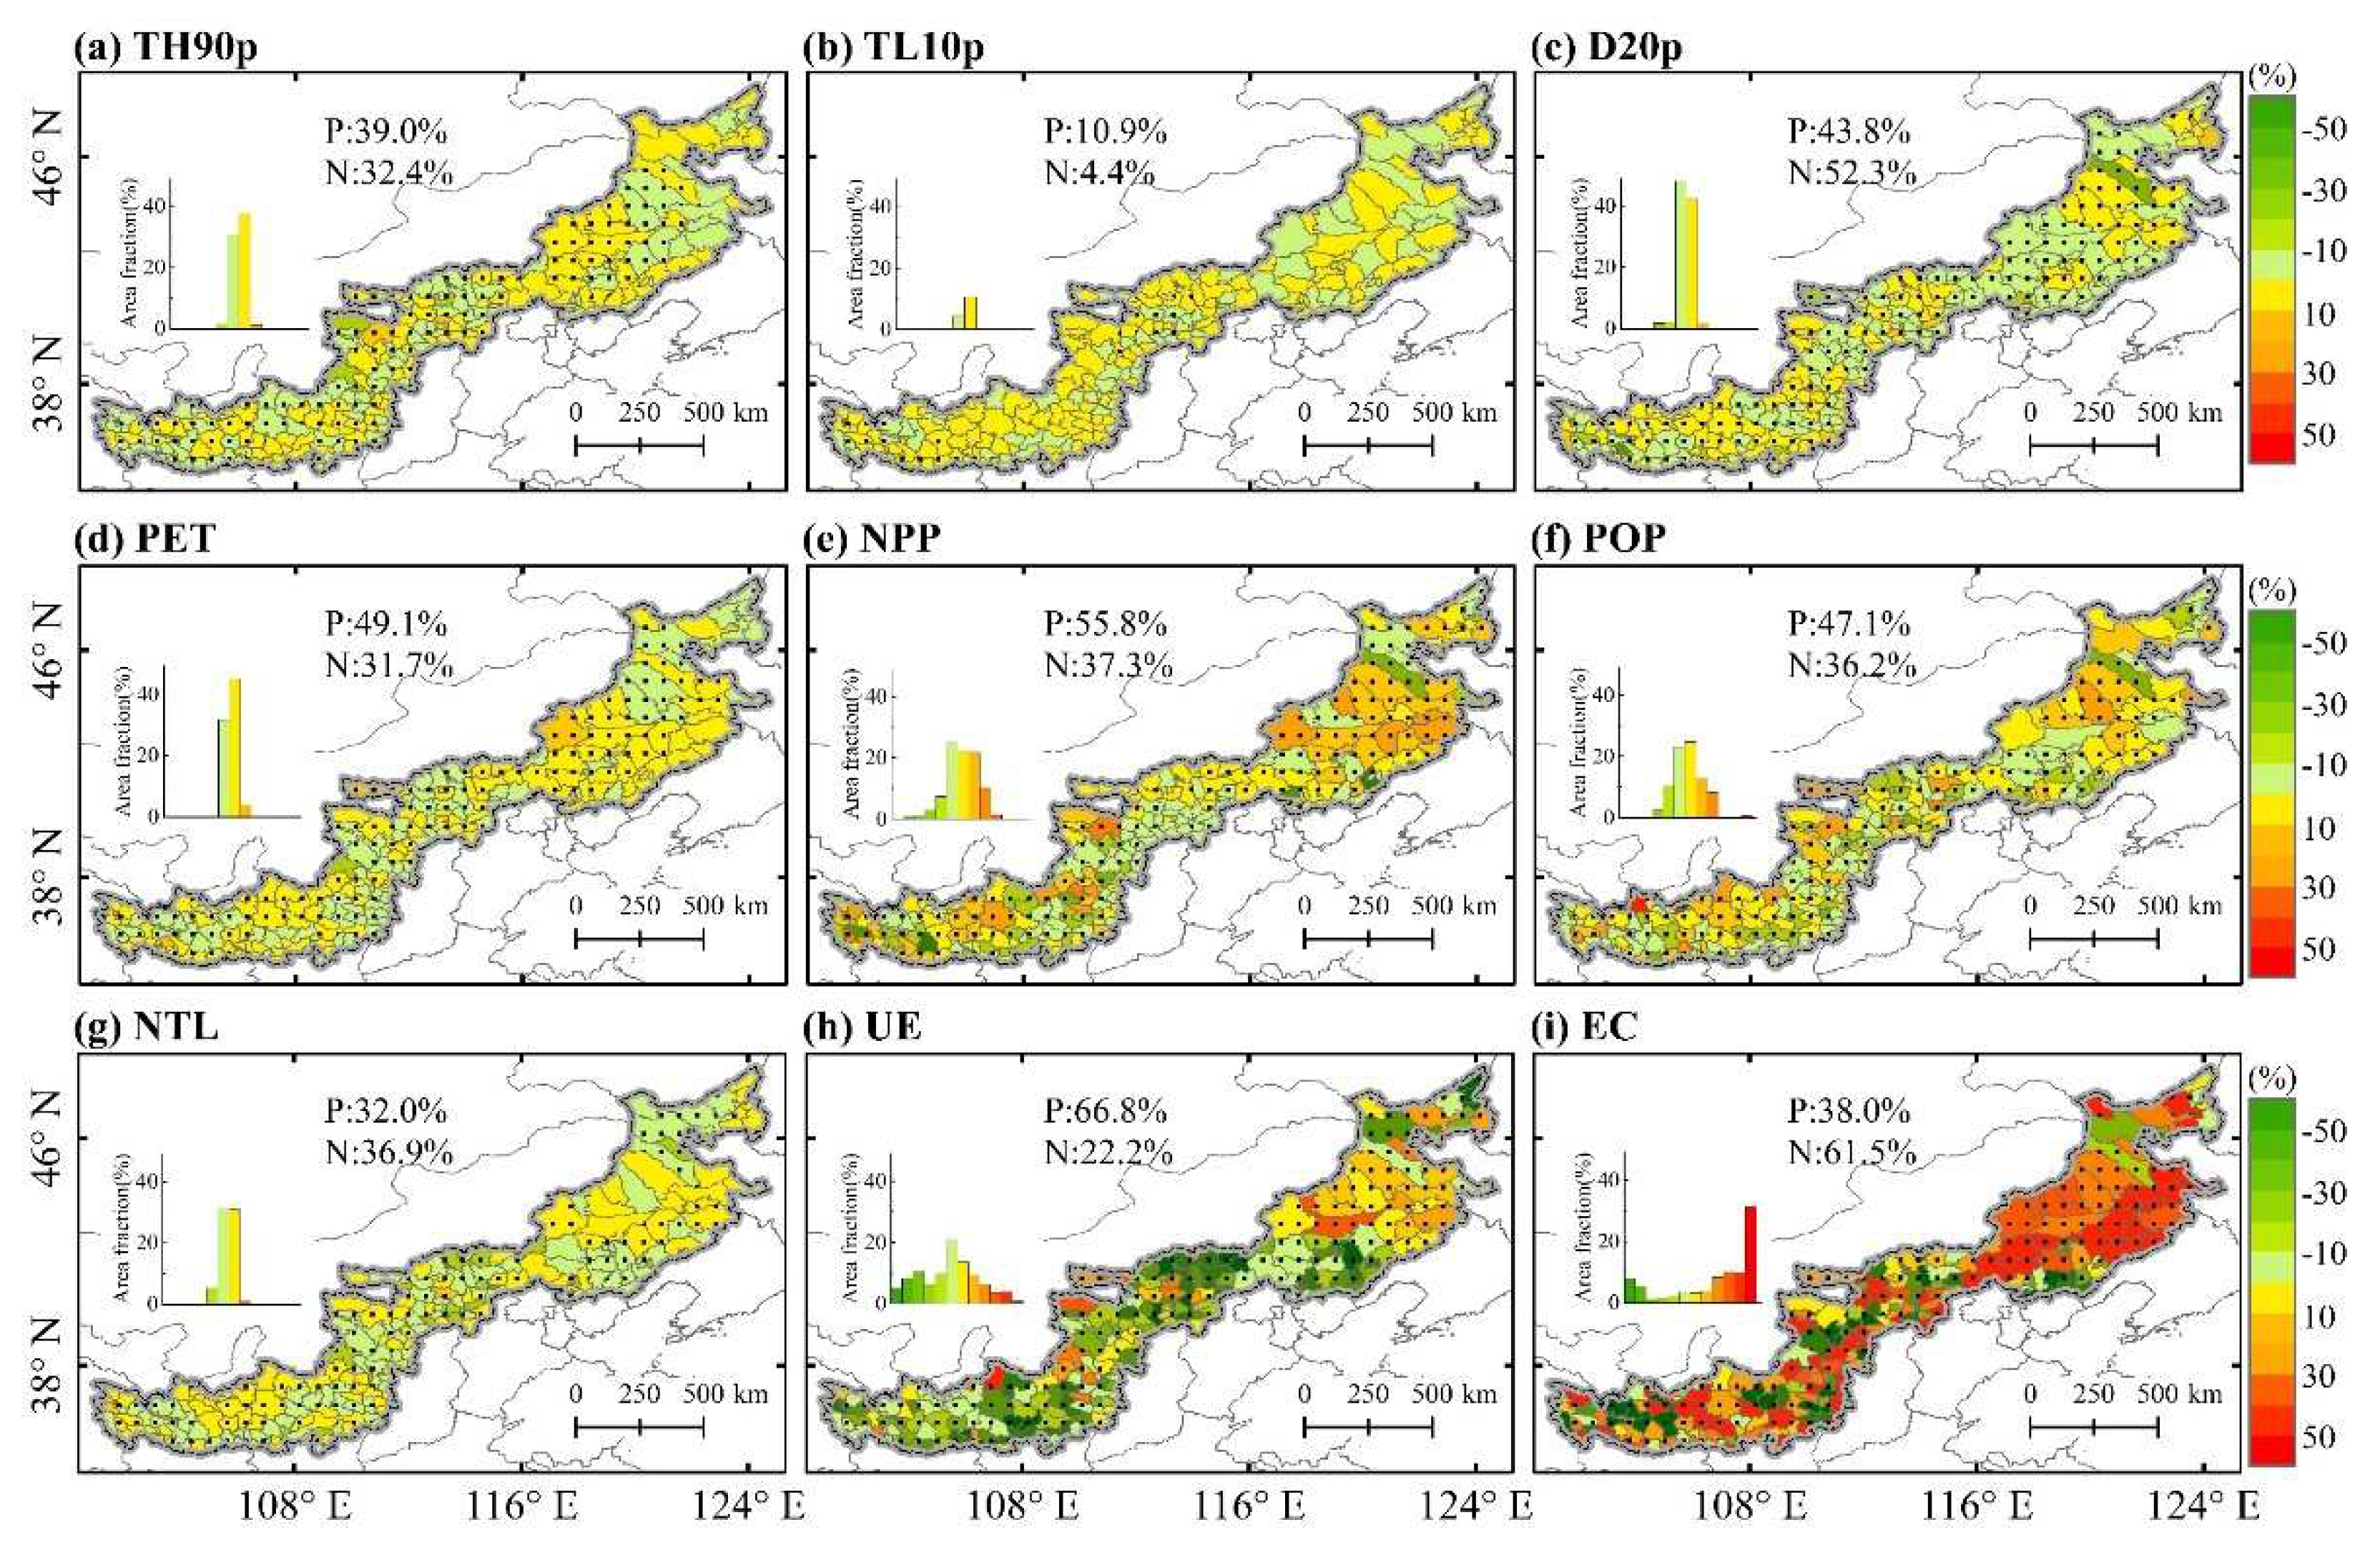
Figure A8.
Relative contributions of driving factors to trend in cropland area during 2010−2020.
2. Table

Table A1.
The relative contribution absolute values of the driving factors across the FPEN and three sub-regions during 1992−2020.
Table A1.
The relative contribution absolute values of the driving factors across the FPEN and three sub-regions during 1992−2020.
| Data types | Period | Spatial resolution | Temporal resolution | Data source |
|---|---|---|---|---|
| Land use/land cover | 1992−2020 | 300m | yearly | ESA/CCI viewer (ucl.ac.be) |
| Maximum and minimum 2m temperature | 1992−2020 | 0.25° | hourly | ERA5 hourly data on single levels from 1979 to present (copernicus.eu) |
| 2m-temperature | 1992−2020 | 0.25° | monthly | ERA5 monthly averaged data on single levels from 1979 to present (copernicus.eu) |
| Precipitation | 1992−2020 | 0.25° | hourly | ERA5 hourly data on single levels from 1979 to present (copernicus.eu) |
| Potential evaporation | 1992−2020 | 0.1° | hourly | ERA5-Land monthly averaged data from 1950 to present (copernicus.eu) |
| Volumetric soil water layer 1 | 1992−2020 | 0.25° | hourly | ERA5 hourly data on single levels from 1979 to present (copernicus.eu) |
| Nighttime light | 1992−2020 | 30″ | yearly | Harmonization of DMSP and VIIRS nighttime light data from 1992−2020 at the global scale (figshare.com) |
| Population | 2000−2020 | 30″ | yearly | LandScan Datasets | LandScan™ (ornl.gov) |
| Net primary productivity | 2000−2020 | 500m | yearly | LP DAAC - MOD17A3HGF (usgs.gov) |
| Daily Evapotranspiration Deficit Index | 1992−2020 | 0.25° | daily | http://www.dx.doi.org/10.11922/sciencedb.00906 |
Table A2.
The categories of driving factors for cropland area trend.
| Categories | driving factors |
|---|---|
| Environmental conditions | Annual average temperature |
| Annual precipitation | |
| Potential evapotranspiration | |
| Volumetric soil water | |
| Net primary productivity | |
| Extreme events | Annual frequency of extreme high temperature |
| Annual frequency of extreme low temperature | |
| Annual frequency of drought | |
| Annual frequency of extreme precipitation | |
| Socioeconomic development | Sum of population |
| Annual average nighttime light | |
| Urban expansion | Construction land area |
| Ecological construction | Ecological land area |
Table A3.
Definition of extreme climate and drought indices based on daily data in this study.
| Indices | Attributes | Definition | Units |
|---|---|---|---|
| TH90p | Extreme high temperature | Count of days per each year where THij>Tmax90p. THij is the daily maximum temperature on day i in year j. Tmax90p is the 90th percentile centered on i in a five days window of daily maximum temperature during 1992−2020. | Days |
| TL10p | Extreme low temperature | Count of days per each year where TLij>Tmin10p. TLij is the daily minimum temperature on day i in year j. Tmin10p is the 10th percentile centered on i in a five days window of daily minimum temperature during 1992−2020. | Days |
| R95p | Extreme precipitation | Count of days per each year where Rij >R95p. Rij is the daily precipitation (Rij≥1mm) on day i in year j. R95p is the 95th percentile during 1992−2020. | Days |
| D20p | Drought (DEDI) | Count of days per each year where Dij>D20p. Dij is the daily DEDI on day i in year j. D20p is the 20th percentile centered on i in a five days window of daily DEDI during 1992−2020. | Days |
References
- Foley, J.A.; Ramankutty, N.; Brauman, K.A.; Cassidy, E.S.; Gerber, J.S.; Johnston, M.; Mueller, N.D.; O’Connell, C.; Ray, D.K.; West, P.C.; et al. Solutions for a cultivated planet. Nature 2011, 478, 337–342. [Google Scholar] [CrossRef] [PubMed]
- Cheng, C.; Liu, Y.; Liu, Y.; Yang, R.; Hong, Y.; Lu, Y.; Pan, J.; Chen, Y. Cropland use sustainability in Cheng–Yu Urban Agglomeration, China: Evaluation framework, driving factors and development paths. Journal of Cleaner Production 2020, 256, 120692. [Google Scholar] [CrossRef]
- Wang, Y.; Li, X.; He, H.; Xin, L.; Tan, M. How reliable are cultivated land assets as social security for Chinese farmers? Land Use Policy 2020, 90, 104318. [Google Scholar] [CrossRef]
- Lal, R. Soil Carbon Sequestration Impacts on Global Climate Change and Food Security. Science 2004, 304, 1623–1627. [Google Scholar] [CrossRef]
- Wheeler, T.; von Braun, J. Climate Change Impacts on Global Food Security. Science 2013, 341, 508–513. [Google Scholar] [CrossRef]
- Abbas, G.; Ahmad, S.; Ahmad, A.; Nasim, W.; Fatima, Z.; Hussain, S.; Rehman, M.H.u.; Khan, M.A.; Hasanuzzaman, M.; Fahad, S.; et al. Quantification the impacts of climate change and crop management on phenology of maize-based cropping system in Punjab, Pakistan. Agricultural and Forest Meteorology 2017, 247, 42–55. [Google Scholar] [CrossRef]
- Pan, J.; Chen, Y.; Zhang, Y.; Chen, M.; Fennell, S.; Luan, B.; Wang, F.; Meng, D.; Liu, Y.; Jiao, L.; et al. Spatial-temporal dynamics of grain yield and the potential driving factors at the county level in China. Journal of Cleaner Production 2020, 255, 120312. [Google Scholar] [CrossRef]
- Eigenbrod, F.; Beckmann, M.; Dunnett, S.; Graham, L.; Holland, R.A.; Meyfroidt, P.; Seppelt, R.; Song, X.-P.; Spake, R.; Václavík, T.; et al. Identifying Agricultural Frontiers for Modeling Global Cropland Expansion. One Earth 2020, 3, 504–514. [Google Scholar] [CrossRef]
- Bahar, N.H.A.; Lo, M.; Sanjaya, M.; Van Vianen, J.; Alexander, P.; Ickowitz, A.; Sunderland, T. Meeting the food security challenge for nine billion people in 2050: What impact on forests? Global Environmental Change 2020, 62, 102056. [Google Scholar] [CrossRef]
- Zaveri, E.; Russ, J.; Damania, R. Rainfall anomalies are a significant driver of cropland expansion. Proceedings of the National Academy of Sciences 2020, 117, 10225–10233. [Google Scholar] [CrossRef]
- Tu, Y.; Chen, B.; Yu, L.; Xin, Q.; Gong, P.; Xu, B. How does urban expansion interact with cropland loss? A comparison of 14 Chinese cities from 1980 to 2015. Landscape Ecology 2021, 36, 243–263. [Google Scholar] [CrossRef]
- Bren d’Amour, C.; Reitsma, F.; Baiocchi, G.; Barthel, S.; Güneralp, B.; Erb, K.-H.; Haberl, H.; Creutzig, F.; Seto, K.C. Future urban land expansion and implications for global croplands. Proceedings of the National Academy of Sciences 2017, 114, 8939–8944. [Google Scholar] [CrossRef] [PubMed]
- Khor, N.; Arimah, B.; Otieno, R.O.; Oostrum, M.v.; Mutinda, M.; Martins, J.O. World Cities Report 2022: Envisaging the Future of Cities. UN-Habitat 2022.
- Liu, J.; Kuang, W.; Zhang, Z.; Xu, X.; Qin, Y.; Ning, J.; Zhou, W.; Zhang, S.; Li, R.; Yan, C.; et al. Spatiotemporal characteristics, patterns, and causes of land-use changes in China since the late 1980s. Journal of Geographical Sciences 2014, 24, 195–210. [Google Scholar] [CrossRef]
- Liu, G.; Zhang, F. How do trade-offs between urban expansion and ecological construction influence CO2 emissions? New evidence from China. Ecological Indicators 2022, 141, 109070. [Google Scholar] [CrossRef]
- Uisso, A.M.; Tanrıvermiş, H. Driving factors and assessment of changes in the use of arable land in Tanzania. Land Use Policy 2021, 104, 105359. [Google Scholar] [CrossRef]
- Zhou, Y.; Li, X.; Liu, Y. Land use change and driving factors in rural China during the period 1995-2015. Land Use Policy 2020, 99, 105048. [Google Scholar] [CrossRef]
- Zhong, T.; Huang, X.; Zhang, X.; Wang, K. Temporal and spatial variability of agricultural land loss in relation to policy and accessibility in a low hilly region of southeast China. Land Use Policy 2011, 28, 762–769. [Google Scholar] [CrossRef]
- Wang, L.; Zhang, S.; Xiong, Q.; Liu, Y.; Liu, Y.; Liu, Y. Spatiotemporal dynamics of cropland expansion and its driving factors in the Yangtze River Economic Belt: A nuanced analysis at the county scale. Land Use Policy 2022, 119, 106168. [Google Scholar] [CrossRef]
- Liu, Z.; Liu, Y.; Wang, J. A global analysis of agricultural productivity and water resource consumption changes over cropland expansion regions. Agriculture, Ecosystems & Environment 2021, 321, 107630. [Google Scholar] [CrossRef]
- Zhong, H.; Liu, Z.; Wang, J. Understanding impacts of cropland pattern dynamics on grain production in China: An integrated analysis by fusing statistical data and satellite-observed data. Journal of Environmental Management 2022, 313, 114988. [Google Scholar] [CrossRef]
- Gao, J.; Liu, Y. Climate warming and land use change in Heilongjiang Province, Northeast China. Applied Geography 2011, 31, 476–482. [Google Scholar] [CrossRef]
- Wang, J.; Zhang, J.; Zhang, P. Rising temperature threatens China’s cropland. Environmental Research Letters 2022, 17, 084042. [Google Scholar] [CrossRef]
- Shi, W.; Tao, F.; Liu, J.; Xu, X.; Kuang, W.; Dong, J.; Shi, X. Has climate change driven spatio-temporal changes of cropland in northern China since the 1970s? Climatic Change 2014, 124, 163–177. [Google Scholar] [CrossRef]
- Cui, L.; Wang, L.; Qu, S.; Singh, R.P.; Lai, Z.; Yao, R. Spatiotemporal extremes of temperature and precipitation during 1960–2015 in the Yangtze River Basin (China) and impacts on vegetation dynamics. Theoretical and Applied Climatology 2019, 136, 675–692. [Google Scholar] [CrossRef]
- You, Q.; Kang, S.; Aguilar, E.; Pepin, N.; Flügel, W.-A.; Yan, Y.; Xu, Y.; Zhang, Y.; Huang, J. Changes in daily climate extremes in China and their connection to the large scale atmospheric circulation during 1961–2003. Climate Dynamics 2011, 36, 2399–2417. [Google Scholar] [CrossRef]
- Iizumi, T.; Ramankutty, N. How do weather and climate influence cropping area and intensity? Global Food Security 2015, 4, 46–50. [Google Scholar] [CrossRef]
- Tian, J.; Wang, B.; Zhang, C.; Li, W.; Wang, S. Mechanism of regional land use transition in underdeveloped areas of China: A case study of northeast China. Land Use Policy 2020, 94, 104538. [Google Scholar] [CrossRef]
- Liu, Y.; Liu, X.; Liu, Z. Effects of climate change on paddy expansion and potential adaption strategies for sustainable agriculture development across Northeast China. Applied Geography 2022, 141, 102667. [Google Scholar] [CrossRef]
- Chen, X.; Jiang, L.; Zhang, G.; Meng, L.; Pan, Z.; Lun, F.; An, P. Green-depressing cropping system: A referential land use practice for fallow to ensure a harmonious human-land relationship in the farming-pastoral ecotone of northern China. Land Use Policy 2021, 100, 104917. [Google Scholar] [CrossRef]
- Shi, W.; Liu, Y.; Shi, X. Contributions of climate change to the boundary shifts in the farming-pastoral ecotone in northern China since 1970. Agricultural Systems 2018, 161, 16–27. [Google Scholar] [CrossRef]
- Chen, W.; Li, A.; Hu, Y.; Li, L.; Zhao, H.; Han, X.; Yang, B. Exploring the long-term vegetation dynamics of different ecological zones in the farming-pastoral ecotone in northern China. Environ Sci Pollut Res Int 2021, 28, 27914–27932. [Google Scholar] [CrossRef] [PubMed]
- Fan, F.; Liang, C.; Tang, Y.; Harker-Schuch, I.; Porter, J.R. Effects and relationships of grazing intensity on multiple ecosystem services in the Inner Mongolian steppe. Science of The Total Environment 2019, 675, 642–650. [Google Scholar] [CrossRef] [PubMed]
- Zhang, X.; Y, D.; J, D.; D, J.; Z, M. A daily drought index based on evapotranspiration and its application in regional drought analyses. Science China Earth Sciences 2021, 65, 317–336. [Google Scholar] [CrossRef]
- Zhang, X.; Li, M.; Ma, Z.; Yang, Q.; Lv, M.; Clark, R. Assessment of an Evapotranspiration Deficit Drought Index in Relation to Impacts on Ecosystems. Advances in Atmospheric Sciences 2019, 36, 1273–1287. [Google Scholar] [CrossRef]
- Kim, D.; Rhee, J. A drought index based on actual evapotranspiration from the Bouchet hypothesis. Geophysical Research Letters 2016, 43, 10,277-210,285. [CrossRef]
- Li, X.; Zhou, Y.; Zhao, M.; Zhao, X. A harmonized global nighttime light dataset 1992–2018. Scientific Data 2020, 7, 168. [Google Scholar] [CrossRef]
- Liu, X.; Liu, Y.; Liu, Z.; Chen, Z. Impacts of climatic warming on cropping system borders of China and potential adaptation strategies for regional agriculture development. Science of The Total Environment 2021, 755, 142415. [Google Scholar] [CrossRef]
- Schauberger, B.; Archontoulis, S.; Arneth, A.; Balkovic, J.; Ciais, P.; Deryng, D.; Elliott, J.; Folberth, C.; Khabarov, N.; Müller, C.; et al. Consistent negative response of US crops to high temperatures in observations and crop models. Nature Communications 2017, 8, 13931. [Google Scholar] [CrossRef]
- Frank, D.; Reichstein, M.; Bahn, M.; Thonicke, K.; Frank, D.; Mahecha, M.D.; Smith, P.; van der Velde, M.; Vicca, S.; Babst, F.; et al. Effects of climate extremes on the terrestrial carbon cycle: concepts, processes and potential future impacts. Global Change Biology 2015, 21, 2861–2880. [Google Scholar] [CrossRef]
- Ortiz-Bobea, A.; Ault, T.R.; Carrillo, C.M.; Chambers, R.G.; Lobell, D.B. Anthropogenic climate change has slowed global agricultural productivity growth. Nature Climate Change 2021, 11, 306–312. [Google Scholar] [CrossRef]
- Powell, J.P.; Reinhard, S. Measuring the effects of extreme weather events on yields. Weather and Climate Extremes 2016, 12, 69–79. [Google Scholar] [CrossRef]
- Alidoost, F.; Su, Z.; Stein, A. Evaluating the effects of climate extremes on crop yield, production and price using multivariate distributions: A new copula application. Weather and Climate Extremes 2019, 26, 100227. [Google Scholar] [CrossRef]
- Liu, Z.; Wang, J.; Wang, X.; Wang, Y. Understanding the impacts of ‘Grain for Green’ land management practice on land greening dynamics over the Loess Plateau of China. Land Use Policy 2020, 99, 105084. [Google Scholar] [CrossRef]
- Li, Y.; Liu, H.; Zhu, X.; Yue, Y.; Xue, J.; Shi, L. How permafrost degradation threatens boreal forest growth on its southern margin? Science of The Total Environment 2021, 762, 143154. [Google Scholar] [CrossRef] [PubMed]
- Tomé, A.R.; Miranda, P.M.A. Piecewise linear fitting and trend changing points of climate parameters. Geophysical Research Letters 2004, 31. [Google Scholar] [CrossRef]
- Wolleswinkel-van den Bosch, J.H.; van Poppel, F.W.A.; Tabeau, E.; Mackenbach, J.P. Mortality decline in The Netherlands in the period 1850–1992: A turning point analysis. Social Science & Medicine 1998, 47, 429–443. [Google Scholar] [CrossRef]
- Xie, S.; Mo, X.; Hu, S.; Liu, S. Contributions of climate change, elevated atmospheric CO2 and human activities to ET and GPP trends in the Three-North Region of China. Agric. For. Meteorol. 2020, 295, 108183. [Google Scholar] [CrossRef]
- Pei, T.; Wu, X.; Li, X.; Zhang, Y.; Shi, F.; Ma, Y.; Wang, P.; Zhang, C. Seasonal divergence in the sensitivity of evapotranspiration to climate and vegetation growth in the Yellow River Basin, China. Journal of Geophysical Research: Biogeosciences 2017, 122, 103–118. [Google Scholar] [CrossRef]
- Hoerl, A.E.; Kennard, R.W. Ridge Regression: Biased Estimation for Nonorthogonal Problems. Technometrics 1970, 12, 55–67. [Google Scholar] [CrossRef]
- Liu, J.; Zhang, Z.; Zhuang, D.; Wang, Y.; Zhou, W.; Zhang, S.; Li, R.; Jiang, N.; Wu, S. A study on the spatial-temporal dynamic changes of land-useand driving forces analyses of China in the 1990s. Geographical Research 2003, 22, 1–12. [Google Scholar] [CrossRef]
- Chen, C.; Park, T.; Wang, X.; Piao, S.; Xu, B.; Chaturvedi, R.K.; Fuchs, R.; Brovkin, V.; Ciais, P.; Fensholt, R.; et al. China and India lead in greening of the world through land-use management. Nature Sustainability 2019, 2, 122–129. [Google Scholar] [CrossRef] [PubMed]
- Hou, M.; Zhong, S.; Xi, Z.; Yao, S. Does large-scale ecological restoration threaten food security in China? A moderated mediation model. Ecological Indicators 2022, 143, 109372. [Google Scholar] [CrossRef]
- Qiu, B.; Li, H.; Tang, Z.; Chen, C.; Berry, J. How cropland losses shaped by unbalanced urbanization process? Land Use Policy 2020, 96, 104715. [Google Scholar] [CrossRef]
- Cao, S.; Lv, Y.; Zheng, H.; Wang, X. Challenges facing China's unbalanced urbanization strategy. Land Use Policy 2014, 39, 412–415. [Google Scholar] [CrossRef]
- Feng, X.; Fu, B.; Piao, S.; Wang, S.; Ciais, P.; Zeng, Z.; Lü, Y.; Zeng, Y.; Li, Y.; Jiang, X.; et al. Revegetation in China’s Loess Plateau is approaching sustainable water resource limits. Nature Climate Change 2016, 6, 1019–1022. [Google Scholar] [CrossRef]
- Liu, X.; Liu, Y.; Wang, Y.; Liu, Z. Evaluating potential impacts of land use changes on water supply–demand under multiple development scenarios in dryland region. Journal of Hydrology 2022, 610, 127811. [Google Scholar] [CrossRef]
- Song, W.; Pijanowski, B.C. The effects of China's cultivated land balance program on potential land productivity at a national scale. Applied Geography 2014, 46, 158–170. [Google Scholar] [CrossRef]
- Yang, B.; Wang, Z.; Zou, L.; Zou, L.; Zhang, H. Exploring the eco-efficiency of cultivated land utilization and its influencing factors in China's Yangtze River Economic Belt, 2001–2018. Journal of Environmental Management 2021, 294, 112939. [Google Scholar] [CrossRef]
- Ngoma, H.; Pelletier, J.; Mulenga, B.P.; Subakanya, M. Climate-smart agriculture, cropland expansion and deforestation in Zambia: Linkages, processes and drivers. Land Use Policy 2021, 107, 105482. [Google Scholar] [CrossRef]
- Chen, X.; Wang, F.; Jiang, L.; Huang, C.; An, P.; Pan, Z. Impact of center pivot irrigation on vegetation dynamics in a farming-pastoral ecotone of Northern China: A case study in Ulanqab, Inner Mongolia. Ecological Indicators 2019, 101, 274–284. [Google Scholar] [CrossRef]
Table 1.
The relative contribution absolute values of the driving factors across the FPEN and three sub-regions during 1992−2020.
Table 1.
The relative contribution absolute values of the driving factors across the FPEN and three sub-regions during 1992−2020.
| Relative contributions absolute (%) | TH90p | TL10p | D20p | PET | NPP | Pop | NTL | UE | EC |
|---|---|---|---|---|---|---|---|---|---|
| FPEN | 1.5 | 1.3 | 2.1 | 2.0 | 9.1 | 6.8 | 3.8 | 39.3 | 40.3 |
| Eastern | 1.8 | 1.4 | 2.3 | 2.6 | 10.4 | 6.1 | 4.1 | 37.6 | 38.0 |
| Central | 1.5 | 1.2 | 2.1 | 1.5 | 8.2 | 7.3 | 3.6 | 40.0 | 40.6 |
| western | 1.2 | 1.4 | 1.8 | 3.7 | 9.4 | 6.3 | 3.9 | 39.2 | 41.7 |
Disclaimer/Publisher’s Note: The statements, opinions and data contained in all publications are solely those of the individual author(s) and contributor(s) and not of MDPI and/or the editor(s). MDPI and/or the editor(s) disclaim responsibility for any injury to people or property resulting from any ideas, methods, instructions or products referred to in the content. |
© 2023 by the authors. Licensee MDPI, Basel, Switzerland. This article is an open access article distributed under the terms and conditions of the Creative Commons Attribution (CC BY) license (http://creativecommons.org/licenses/by/4.0/).
Copyright: This open access article is published under a Creative Commons CC BY 4.0 license, which permit the free download, distribution, and reuse, provided that the author and preprint are cited in any reuse.


