
Submitted:
16 October 2025
Posted:
17 October 2025
You are already at the latest version
Abstract
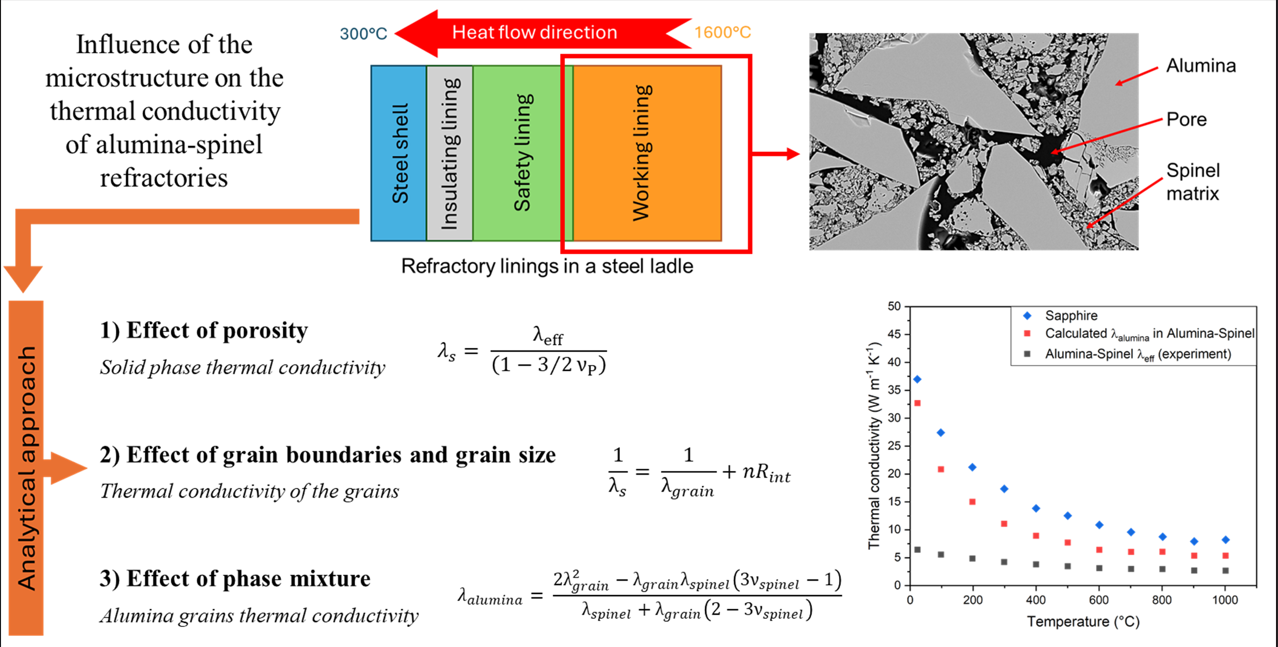
Alumina-spinel refractory bricks, composed of 86 wt.% alumina phase and 13 wt.% MgAl2O4 spinel phase, are used in steel making ladles due to their ability to resist chemical attack and thermal shock. Thermal shock resistance is determined, in part, by the thermal conductivity of the material. Measurements of thermal conductivity were made with the laser flash technique from 20 °C to 1100 °C. Analysis of the influence of the microstructure on the thermal conductivity of the alumina-spinel refractory bricks was based on simplified analytical relations and validated by comparing the behaviour with four different alumina model materials. A model of thermal resistors in series was used to describe the combined effect of grains and grain boundaries on the solid phase conductivity whereas the effect of porosity was calculated with Landauer’s relation. Though the overall conductivity of the refractory brick was evaluated as 6.5 W m-1 K-1 at room temperature, the thermal conductivity of the alumina grains was deduced to be 33 W m-1 K-1, close to that of single crystal sapphire at 36 W m-1 K-1. The strongly attenuated conductivity of alumina-spinel refractory is explained by the roles of porosity, grain boundary thermal resistance and the spinel phase thermal conductivity.
Keywords:
thermal properties
; microstructure
; refractory materials
1. Introduction
The functions of a refractory material, as well as for any kind of material, are strongly dependent on their solid phase composition and microstructure since these determine their properties [1]. For instance, a porous material is generally characterized by a very low thermal conductivity value which makes it suitable for all the applications in which the reduction of heat losses is the main requirement. On the contrary, dense materials are normally used for their superior resistance to corrosion and thermal shock. Therefore, to understand the behaviour and the properties of any material, it is fundamental to identify its crystal structure and microstructure. This relationship between structure/microstructure and properties is a key element of materials science and engineering [1].
Structure in general can be considered at several levels, all of which will influence the final behaviour. For instance, the electronic configuration affects properties such as electrical conductivity and magnetic behaviour [1]. The arrangement of atoms or ions in a solid phase determines whether it is crystalline or amorphous. These situations yield different behaviours even if the chemical composition is similar. In refractory ceramics, the microstructure typically consists of the presence of many grains, possibly more than one solid phase, pores and impurities. The amount, size, shape and orientation of such features can play a key role in many of the macroscopic properties of these materials, such as mechanical strength and thermal conductivity [1].
The microstructure of a refractory material is essentially the result of three main steps: 1) selection of the raw materials; 2) forming method; and 3) heat treatment. Furthermore, refractories can consist of a mixture of two or more phases. Each of them has a specific set of properties and will react in a specific way, which can be predicted using phase diagrams. Therefore, the properties of the final product will depend on the kinds of raw materials used [2]. However, also the forming process and the firing cycle have a great impact. Once the powders are selected and mixed, they are compacted together to form the “green body”. This step is normally made by pressing to create the initial adhesion between the particles. Higher pressing force leads to reduced porosity up to a packing limit. Usually, a ceramic “green body” contains around 40 - 50% of porosity [3]. The final step is the firing process, which is fundamental to create the solid contacts between the particles (mechanical strength) and give to the material the final properties and dimensions. Depending on the need to have a dense or a porous material, the heat treatment could be respectively the classical sintering temperature (about 200 – 300 °C below the melting point of the compound) or just the minimum temperature to guarantee a minimum mechanical strength [2].
Thus, a better understanding of the relationship between the properties and the microstructure can help refractory producers to improve industrial processes, to predict the behaviour of the material in service and to develop new products. However, it is important to highlight that refractories are very complicated materials, and it is not always easy to understand this relationship. Therefore, the purpose of this work is to elucidate the contribution of each feature in the microstructure, such as porosity, grain boundaries, grain sizes and presence of a second phase, to the overall thermal conductivity in the case of alumina-spinel bricks by comparison of their behaviour to model materials with comparable composition and characteristics. The analysis will be made using a simplified approach based on analytical relations to describe the effects of the microstructure and hence to estimate the grain thermal conductivity. Contributions of radiation heat transfer across large pores (> 0.1 mm) and within semi-transparent crystallites to the "apparent" thermal conductivity have been neglected. This is because of the pore size, the presence of grain boundaries in these materials and the temperature range of measurements [4,5].
2. Materials and Methods
2.1. Materials
The study was devoted to alumina-spinel bricks, which are composed of 94 wt.% of alumina, 5 wt.% of magnesia and 1 wt.% of other oxides.
The SEM micrograph in Figure 1 shows the presence of alumina aggregates of different sizes, a fine matrix of spinel phase and pores both in the grains and in the matrix. When magnesia and alumina are heated together, they react to form a spinel phase (MgAl2O4) in the middle. The new phase offers a good combination of physical and chemical properties such as high refractoriness (melting point of the spinel is around 2135 °C), high mechanical strength, and high resistance to chemical attack [6]. Due to these characteristics, they are used in the working lining of the steel ladle wall. This layer is in contact with the hot liquid steel and thus, it needs to resist high temperatures (around 1650 °C) and a corrosive environment.
Since refractories are very complicated ceramic materials, and it is not always easy to understand the relationship between the microstructure and the thermal properties, in the current work the analysis was made by comparing the behaviour of alumina-spinel bricks (94 wt.% alumina) with the behaviour of four alumina model materials (> 99 wt.% alumina) with differences in the microstructural characteristics. Table 1 summarizes the major characteristics of each investigated material.
The Alumina TM-DA samples were made at NITech (Japan) using the pulse electric current sintering method (PECS). This innovative technique has the advantage to produce almost fully dense materials in shorter times and lower furnace temperatures than a conventional electric furnace [7], keeping grain growth to a minimum. The samples were sintered in a furnace at 1200 °C for 5 min with a heating rate of 100 K/min and subjected to a uniaxial pressure of 100 MPa.
Figure 2 shows an example of the microstructure of Alumina TM-DA samples. It is possible to observe the presence of small grains (0.15 μm to 0.5 μm) homogeneously distributed without much porosity.
2.2. Methods
The thermal conductivity values were evaluated using the laser flash method [9,10]. This technique developed by Parker et al. in 1961 [11] measures the thermal diffusivity of a solid by sending a short duration light energy pulse to impact on the front face of a sample held at a given temperature. Then, an infrared detector records the temperature evolution on the back face as a function of time. The evaluation of the thermal diffusivity (α) from the temperature - time behaviour can be performed with different models such as those of Parker [11], Cape-Lehman [12], Degiovanni [13] or Mehling [14]. In this study, we have mainly used Cape-Lehman model, which takes into account heat losses through the sample boundaries during experimental tests. However, for high temperature measurements, when a direct radiative heat transfer between sample faces was observed, the Mehling analysis was used to account for this signal perturbation.
The measurements were carried out up to 1000 °C with a heating rate of 5 K/min in an argon atmosphere using a Netzsch LFA 427 Laser-flash device. For each temperature, the values correspond to an average of three consecutive measurements. The tests were repeated twice using two different samples, which exhibited a difference in thermal conductivity of less than 1%. The accuracy of this method is taken to be ±3% [9,10].
Once the thermal diffusivity is evaluated, the thermal conductivity (λ) can then be calculated using the following equation:
where λ is the thermal conductivity [W m-1 K-1], α the thermal diffusivity [m2 s-1], the bulk density [kg m-3] and Cp the specific heat capacity [J kg-1 K-1]. The value of Cp can be estimated using the rule of mixtures and data for simple components:
where mi is the percentage in mass of each compound and Cpi the specific heat of each component i [15].
3. Results and Discussions
3.1. Evolution of the Thermal Conductivity with the Temperature
Figure 4 plots the thermal conductivity of Alumina-Spinel sample as a function of the temperature. Repeating the run with a second sample of alumina-spinel refractory exhibited differences in values of thermal conductivity of less than 1%.
The graph shows that the thermal conductivity decreases with the increase of the temperature: λeff changes from 6.5 W m-1 K-1 at room temperature to 3 W m-1 K-1 at 1000 °C. To explain this trend, consider that in ceramic materials, the thermal conductivity is determined by scattering of phonons through inelastic collisions. In analogy with the kinetic theory of gases following Debye’s initial approach [16], Klemens describes this property in terms of an integral over the vibrational frequencies ω [17]:
where λ is the thermal conductivity, Cv the specific heat at constant volume, ν the elastic wave velocity, l the mean free path of lattice vibrations and ωD the Debye frequency.
For alumina ceramics or in the single crystal form (sapphire), heat is essentially transported by lattice vibrations. The amplitude of these vibrations relates to the number of phonons which occupy the mode ω. Increase of these vibrational amplitudes with temperature means that also the probability of phonon-phonon scattering is higher. Thus, the mean free path for the lattice vibrations l(ω), decreases with the increase of temperature and consequently, the thermal conductivity decreases.
However, in such ceramic materials, it is important to also examine the polycrystalline aspect. Phonons can interact not only with other phonons, but also with grain and pore boundaries and other defects. All these “imperfections” will act as scattering sites reducing the mean free path. These interactions of the phonons with the microstructure can explain the differences exhibited in Figure 5. The graph shows, in fact, that for all the investigated materials, the thermal conductivity values decrease with the increase of the temperature due to the increase of the phonon-phonon scattering mechanism. However, the values are quite different from each other despite that they are all alumina-based materials. At room temperature, for instance, λeff varies from 36 W m-1 K-1 in the case of Sapphire to 5.8 W m-1 K-1 for the Alumina AKP30-1300 sample. The Sapphire sample is a single crystal, and thus it has only external boundaries. On the contrary, all the other samples are polycrystalline materials with different porosities, different grain sizes and consequently different numbers of grain boundaries crossing the heat path (Table 1).
3.2. Effect of the Porosity
The influence of the porosity can be studied by considering a mixture of two phases, in which the pores correspond to one of the phases: with the increase of the pore volume fraction (νp), the effective thermal conductivity of the material (λeff) decreases due to the low thermal conductivity of the gas. Figure 6 illustrates the thermal conductivity variations with porosity, based on analytical models with different assumptions for the porous phase arrangement in the solid matrix. The Maxwell – Eucken relation assumes that the pores are isolated spherical inclusions in the solid which describes a closed porosity behaviour [18], whereas the Landauer’s relation takes into account the open nature of the porosity [19] for values of νp > 0.15. This is revealed by the divergence of the two curves at νp = 0.15.
It is tempting to think that a material with higher pore volume fraction exhibits a lower thermal conductivity, but this is correct only if the thermal conductivity of the solid phase is the same. For instance, the Alumina-Spinel brick sample has a porosity of 19%, like that of Alumina AKP30-1450 (Table 1) but the thermal conductivity values are quite different. Figure 5 shows that the Alumina-Spinel sample (black points) has a thermal conductivity closer to that of Alumina AKP30-1300 (magenta points), even if this material has almost twice the amount of the porosity (38%). Therefore, the results imply that the materials have different solid phase thermal conductivity values.
To verify this hypothesis, Landauer’s relation was used to estimate the thermal conductivity of the polycrystalline solid phase without the effect of the porosity [19,20]:
where λp is the thermal conductivity of pore phase and λs the thermal conductivity of the solid phase. Considering that λp ≪ λs, equation 4 was simplified using λp = 0:
Equation 5 was then re-expressed as:
to evaluate the thermal conductivity for equivalent 100% dense ceramics. The results are presented in Figure 7.
The graph confirms that the materials have different values of thermal conductivity for the solid phase. Furthermore, the estimated values are still significantly less than that of Sapphire (36 W m-1 K-1). For instance, at room temperature λs varies from 27 W m-1 K-1 in the case of Alumina AKP30-1450 to 9 W m-1 K-1 in the case of the Alumina-Spinel sample.
3.3. Effect of the Grain Boundaries and Grain Size
Grain boundaries are disordered regions, which act as scattering sites reducing the mean free path. They can be considered as Kapitza resistances which cause a localized temperature drop at the interface [8,21]. The overall thermal conductivity can then be described using equation 7 as grain boundary thermal resistances in series with the grains:
where λs is the thermal conductivity of the polycrystalline material after removing the effect of the porosity, λgrain is the thermal conductivity of the grains, n the number of grain boundaries per unit length and Rint the average grain boundary thermal resistance. This equation handles the effect of two grain size mechanisms: i) the presence of grain boundaries crossing the heat path given by the second term of the right-hand side in equation 7 and ii) the effect of finite grain size which can alter the grain conductivity in the first term of the right-hand side in equation 7. If the grains are small, the number (n) of grain boundaries increases and thus, the thermal conductivity of the polycrystalline material decreases. Furthermore, if the grains are very small, the hypothesis of an ideal infinite lattice is no longer valid and this cuts off all the low frequency long wavelength phonons, which cannot contribute to the thermal conductivity of the crystallite (λgrain) [2,8].
These effects can explain the difference between Sapphire and Alumina TM-DA as well as between Alumina AKP30-1300 et Alumina AKP30-1450 shown in Figure 7. We have then used a method to separate the two contributions in equation 7 and estimate the grain thermal conductivity [8] with the advantage that exact knowledge of the average grain size is not actually required. For this the phonon-phonon interaction is assumed to be the dominant mechanism, and that the thermal resistivity attributed to the grains is linear in the temperature range 500 K – 1000 K represented by the term aT. This yields equation 8 which is exploited to deduce the effect of grain boundaries as Kapitza resistances and then grain size on grain conductivity at, for example, 300 K:
Figure 8 shows that the thermal resistivity values of all the alumina-based materials are above the values of Sapphire. The differences shown on the y-axis by extrapolation to T = 0 K can be attributed to the total thermal resistance of the grain boundaries (nRint), taken to be constant with temperature.
By removing this contribution to equation 7, it is possible to evaluate the thermal conductivity of the grains (λgrain), as shown in Figure 9.
Figure 9a reveals that the calculations of grain conductivity for Alumina TM-DA and Alumina AKP30-1450 yield values which are almost identical to those of the Sapphire single crystal (36 W m-1 K-1 at room temperature). For the Alumina AKP30-1300, there is a slight difference, which might be linked to an imperfect evaluation of pore volume fraction for this sample, or to the effect of finite grain size inhibiting the grain conductivity. In fact, Alumina AKP30-1300 has the smallest grain size (Table 1), approximately 0.3 μm.
The situation is different for the refractory material (Figure 9b). The curve is significantly less than that of Sapphire. But this can be linked to the presence of a second phase.
3.4. Effect of Phase Mixture
Alumina-spinel refractory bricks contain approximately 86 wt.% alumina and 13 wt.% spinel (MgAl2O4). To evaluate the influence of the spinel phase on the combined thermal conductivity, samples, where the spinel phase is predominant (88 wt.% spinel and 12 wt.% alumina), were prepared at RWTH Aachen University from the alumina rich Magnesium Aluminate spinel powder denoted AR78. This powder is a raw material typically used for the fabrication of alumina-spinel bricks. After uniaxial pressing of the dry powder, sintering at 1600 °C for 6 h yielded specimens with dimensions of 10 mm in diameter and 2 mm thick.
These samples were measured with the laser flash method up to 1100 °C revealing a steady decrease of the thermal conductivity with temperature (Figure 10, black points) attributed to the increase of phonon-phonon scattering. More refined values for the spinel phase thermal conductivity were then obtained in the following way.
The experimental results showed an overall thermal conductivity of 9.3 W m-1 K-1 at room temperature including the effect of 20% of porosity. Thus, equation 6 was used to calculate the thermal conductivity of the solid phases (λs) equal to 13.3 W m-1 K-1 at room temperature. For a mixture of two solid phases, solving Landauer’s relation [19] for the thermal conductivity of the spinel phase (λspinel) gave:
where λalumina and νalumina are respectively the thermal conductivity and the volume fraction of the alumina grains. Using the proportion above for AR78 and a value for λalumina = 36 W m-1 K-1, equation 9 gives λspinel = 11.4 W m-1 K-1 at room temperature (Figure 10, red points).
These results are fairly similar to those in the literature: for stochiometric spinel, Braulio et al. [22] found values from 15 W m-1 K-1 at room temperature to 5 W m-1 K-1 at 1000 °C, while Ni et al. [23] calculated with molecular dynamics values from 9 W m-1 K-1 at room temperature to 5.5 W m-1 K-1 at 1000 °C.
Finally, the evaluated data for λspinel were used to estimate the thermal conductivity of the alumina grains (λalumina) in the Alumina-Spinel refractory sample in a similar way with a modified form of equation 9:
where λgrain now refers to the points in Figure 9b (black squares), which were already corrected for porosity and grain boundary effects. The results of equation 10 are shown in Figure 11.
It can be pointed out that even if the calculated values for the alumina grains in the refractory brick are still apart from those of the Sapphire single crystal, they are much closer than the original measured values (Figure 4). For instance, at room temperature the measured overall thermal conductivity of the refractory material is 6.5 W m-1 K-1 whereas with the analysis, taking into account the microstructure, the alumina grains are evaluated with a value of 33 W m-1 K-1. Given that the thermal conductivity of the sapphire is 36 W m-1 K-1 at room temperature, this means that the difference between the Sapphire sample and the alumina grains in the Alumina-Spinel refractory sample is within 12%. Remaining differences could be assigned to the presence of other minor phases or small fractions of impurities modifying the conductivity of alumina. Popov et al. [24] demonstrated that small quantities of Cr and Ti, which substitute into the Al2O3 lattice, inhibit conduction. The other possibility is that Landauer’s relation exploited in equation 10 may not describe perfectly the geometrical distribution of the two solid phases in the refractory brick; especially since the spinel phase constitutes a fine matrix surrounding the large alumina grains.
4. Conclusions
The thermal conductivity and other physical properties of a material can be strongly modulated by the microstructure. Therefore, understanding of the relationship between the microstructure and the material’s properties is fundamental for predicting the behaviour of refractory materials in service conditions. This paper presents a straightforward analytical approach to describe the modulation of thermal conductivity by:
- the pore phase using Landauer’s relation,
- the grain boundary thermal resistance by assuming it acts in series with the thermal resistance of the grains,
- a second solid phase using again Landauer’s relation for a mixture of two phases.
The approach has been applied to the case of alumina-spinel refractory bricks, containing approximately 86 wt.% alumina and 13 wt.% spinel (MgAl2O4). Given the complexity of the refractory and its microstructure, simpler alumina model ceramic materials with variations in porosity and grain size were also tested by measurement of the macroscopic thermal conductivity. Values at room temperature varied from 6.5 W m-1 K-1 for the refractory brick to 36 W m-1 K-1 for a single crystal of sapphire. However, by successively removing the effects of porosity, grain boundary thermal resistance and in the case of the alumina-spinel refractory also the mixture of two solid phases, the thermal conductivity of the alumina grains was deduced to be 35 – 36 W m-1 K-1 for the alumina model ceramics and 33 W m-1 K-1 for the alumina-spinel refractory.
Author Contributions
Investigation, data curation, and writing - original draft preparation, D.V.; resources and sample preparation, H.U.M., I.K. and S.H.; writing - review and editing D.S.S., and B.N.-A.; supervision, D.S.S., B.N.-A., and N.T.-D. All authors have read and agreed to the published version of the manuscript.
Funding
This work was supported by the funding scheme of the European Commission, Marie Skłodowska-Curie Actions Innovative Training Networks in the frame of the H2020 European project ATHOR - Advanced THermomechanical multiscale mOdelling of Refractory linings - 764987 Grant.
Institutional Review Board Statement
Not applicable.
Informed Consent Statement
Not applicable.
Data Availability Statement
All data will be made available upon request.
Acknowledgments
We would like to express our sincere gratitude to RHI-Magnesita (Austria) for donating the refractory materials that made this study possible. We also gratefully acknowledge RWTH Aachen University (Germany) and NITech (Japan) for their support with sample preparation and the SEM micrographs, which significantly contributed to a more comprehensive interpretation of the results.
Conflicts of Interest
The authors declare no conflicts of interest. The funders had no role in the design of the study; in the collection, analyses, or interpretation of data; in the writing of the manuscript; or in the decision to publish the results.
References
- C.B. Carter, M.G. Norton, Ceramic materials: science and engineering, 2nd ed., Springer New York, NY, 2013.
- D. Vitiello, Thermo-physical properties of insulating refractory materials, Thesis, University of Limoges, 2021.
- D.S. Smith, J. Martinez Dosal, S. Oummadi, D. Nouguier, D. Vitiello, A. Alzina, B. Nait-Ali, Neck formation and role of particle-particle contact area in the thermal conductivity of green and partially sintered alumina ceramics, J. Eur. Ceram. Soc. 42 (2022) 1618–1625. [CrossRef]
- D.W. Lee, W.D. Kingery, Radiation Energy Transfer and Thermal Conductivity of Ceramic Oxides, J. Am. Ceram. Soc. 43 (1960) 594–607. [CrossRef]
- G. Routschka, H. Wuthnow, Thermal conductivity, in: Handb. Refract. Mater. Des. | Prop. | Testings, 5th ed., Vulkan-Verlag, 2011: pp. 322–326.
- C.A. Schacht, Refractories Handbook, Marcel Dekker, Inc, 2004.
- Z.A. Munir, D. V. Quach, M. Ohyanagi, Electric current activation of sintering: A review of the pulsed electric current sintering process, J. Am. Ceram. Soc. 94 (2011) 1–19. [CrossRef]
- D.S. Smith, F. Puech, B. Nait-Ali, A. Alzina, S. Honda, Grain boundary thermal resistance and finite grain size effects for heat conduction through porous polycrystalline alumina, Int. J. Heat Mass Transf. 121 (2018) 1273–1280.
- ASTM International, Standard Test Method for Thermal Diffusivity by the Flash Method 1, ASTM E1461 - 13. (2013) 1–11.
- D. Vitiello, B. Nait-Ali, N. Tessier-Doyen, T. Tonnesen, L. Laím, L. Rebouillat, D.S. Smith, Thermal conductivity of insulating refractory materials: Comparison of steady-state and transient measurement methods, Open Ceram. 6 (2021) 100118.
- W.J. Parker, R.J. Jenkins, C.P. Butler, G.L. Abbott, Flash method of determining thermal diffusivity, heat capacity, and thermal conductivity, J. Appl. Phys. 32 (1961) 1679–1684. [CrossRef]
- J.A. Cape, G.W. Lehman, Temperature and finite pulse-time effects in the flash method for measuring thermal diffusivity, J. Appl. Phys. 34 (1963) 1909–1913. [CrossRef]
- A. Degiovanni, M. Laurent, Une nouvelle technique d’identification de la diffusivité thermique pour la méthode « flash », Rev. Phys. Appliquée. 21 (1986) 229–237.
- H. Mehling, G. Hautzinger, O. Nilsson, J. Fricke, R. Hofmann, O. Hahn, Thermal diffusivity of semitransparent materials determined by flash laser method applying a new analytical model, Int. J. Thermophys. 19 (1998) 941–949. [CrossRef]
- D. Günther, F. Steimle, Mixing rules for the specific heat capacities of several HFC-mixtures, Int. J. Refrig. 20 (1997) 235–243. [CrossRef]
- P. Debye, Kinetic Theory of Matter and Electricity, in: Gottinger Wolfskehlvortrage. B. G. Teubner, Leipzig Berlin, 1914.
- P.G. Klemens, Heat conduction in solids by phonons, Thermochim. Acta. 218 (1993) 247–255. [CrossRef]
- J.Z. Xu, B.Z. Gao, F.Y. Kang, A reconstruction of Maxwell model for effective thermal conductivity of composite materials, Appl. Therm. Eng. 102 (2016) 972–979. [CrossRef]
- R. Landauer, The electrical resistance of binary metallic mixtures, J. Appl. Phys. 23 (1952) 779–784. [CrossRef]
- D.S. Smith, A. Alzina, J. Bourret, B. Nait-Ali, F. Pennec, N. Tessier-Doyen, K. Otsu, H. Matsubara, P. Elser, U.T. Gonzenbach, Thermal conductivity of porous materials, J. Mater. Res. 28 (2013) 2260–2272.
- P.K. Schelling, S.R. Phillpot, P. Keblinski, Kapitza conductance and phonon scattering at grain boundaries by simulation, J. Appl. Phys. 95 (2004) 6082–6091. [CrossRef]
- M.A.L. Braulio, M. Rigaud, A. Buhr, C. Parr, V.C. Pandolfelli, Spinel-containing alumina-based refractory castables, Ceram. Int. 37 (2011) 1705–1724.
- C. ming Ni, H. wei Fan, X. dong Wang, M. Yao, Thermal conductivity prediction of MgAl2O4: a non-equilibrium molecular dynamics calculation, J. Iron Steel Res. Int. 27 (2020) 500–505. [CrossRef]
- P.A. Popov, V.D. Solomennik, P. V. Belyaev, L.A. Lytvynov, V.M. Puzikov, Thermal conductivity of pure and Cr3+ and Ti3+ doped Al2O3 crystals in 50-300 K temperature range, Funct. Mater. 18 (2011) 476–480.
Figure 1.
SEM micrograph of an Alumina-Spinel brick. The microstructure is composed of alumina grains of different sizes (the biggest size is ~ 3 mm) and a fine spinel matrix. The image was taken at GHI-RWTH (Germany).
Figure 1.
SEM micrograph of an Alumina-Spinel brick. The microstructure is composed of alumina grains of different sizes (the biggest size is ~ 3 mm) and a fine spinel matrix. The image was taken at GHI-RWTH (Germany).
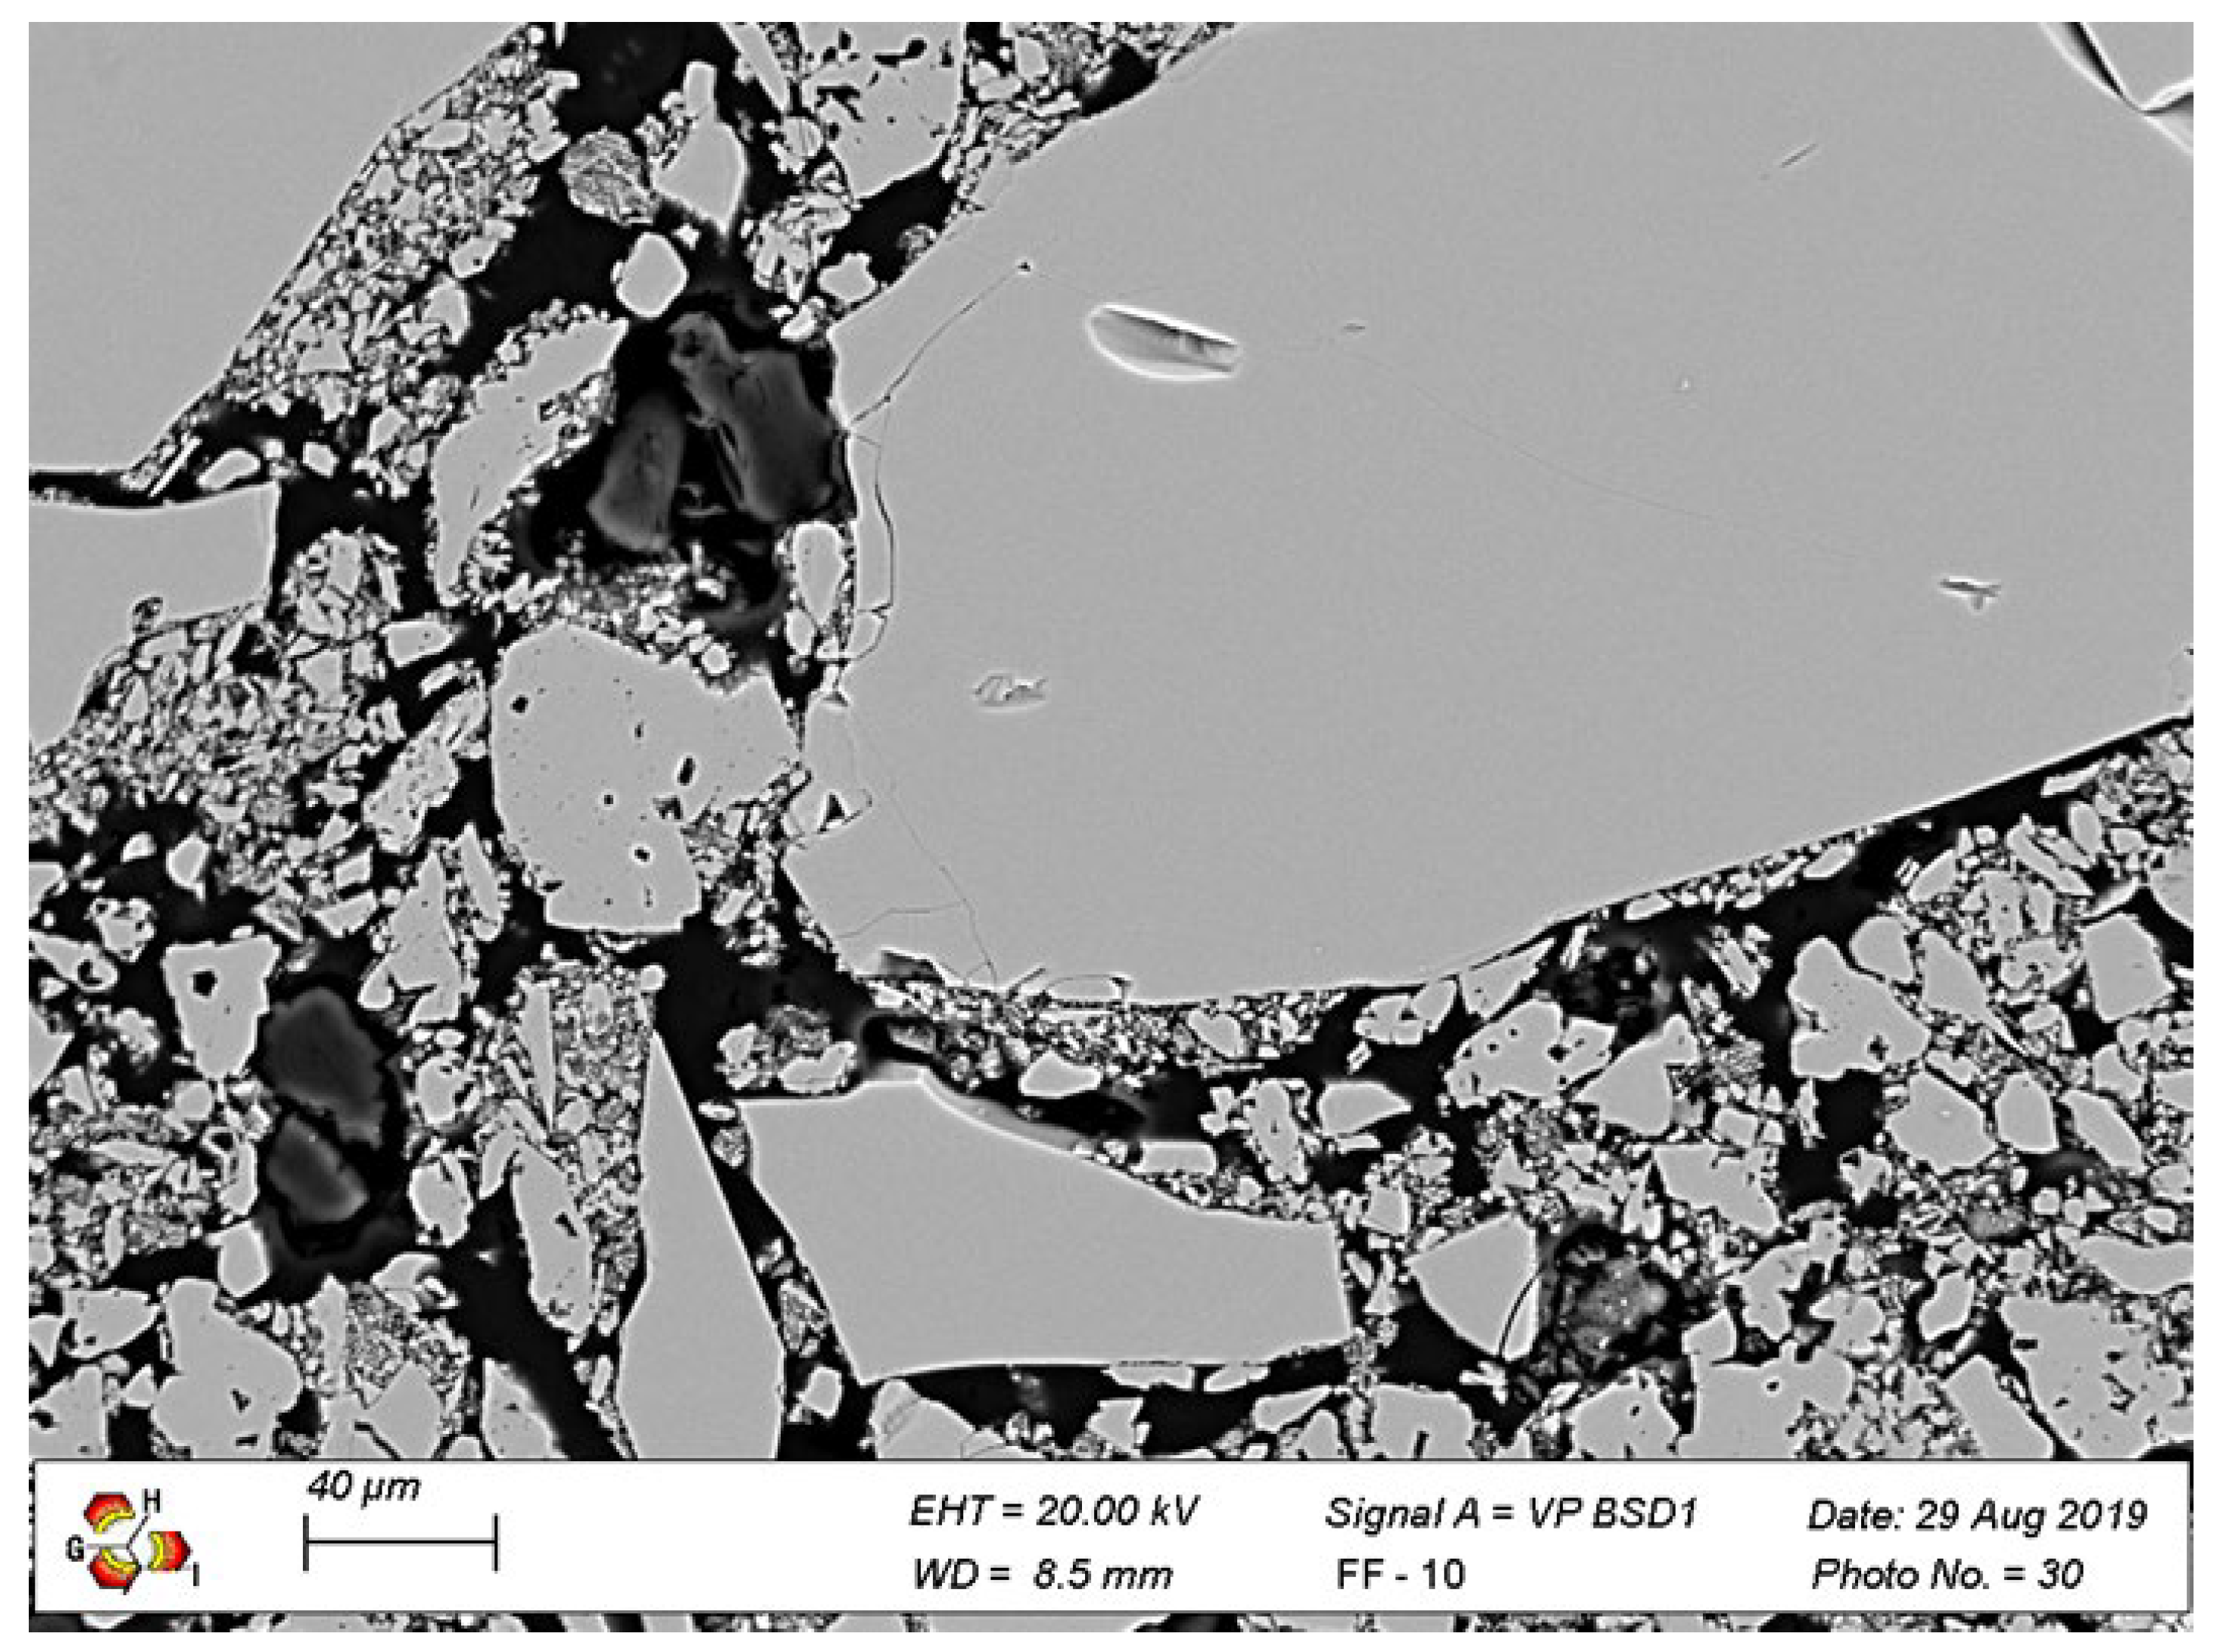
Figure 2.
SEM micrograph of Alumina TM-DA. The image was taken at NITech (Japan).
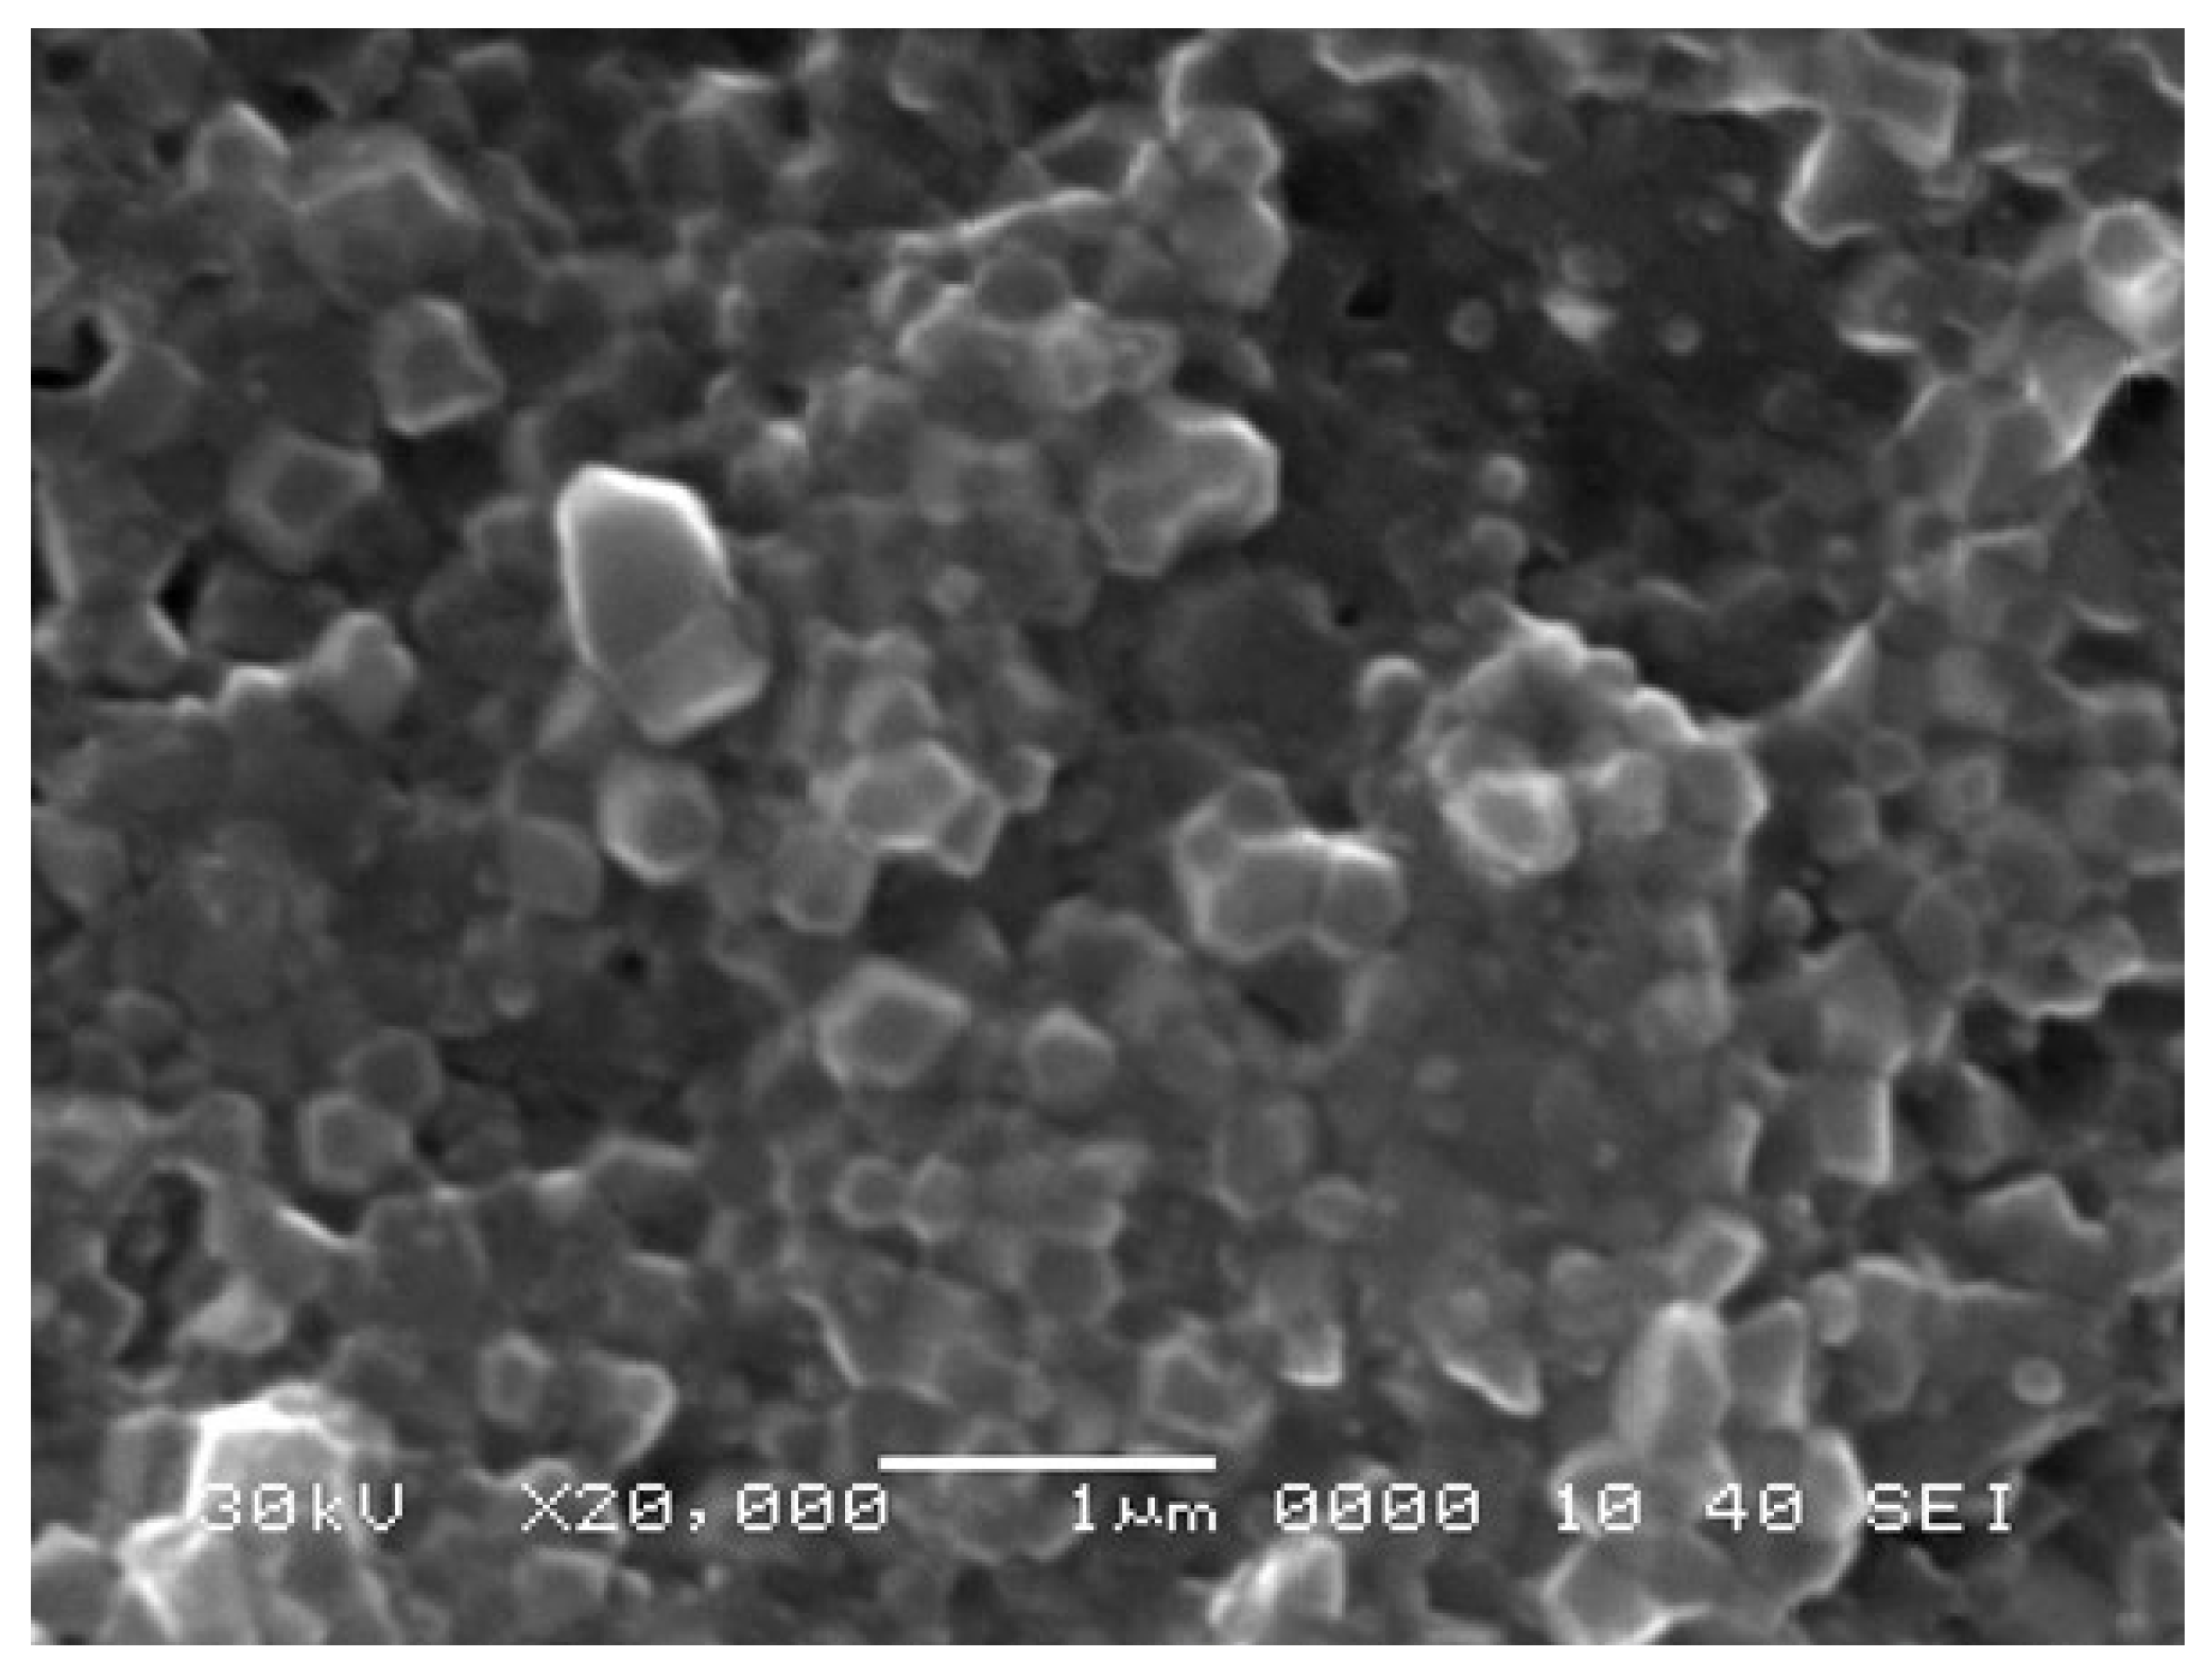
Figure 3.
SEM micrographs of Alumina AKP30-1300 (a) and Alumina AKP30-1450 taken at IRCER [8].
Figure 3.
SEM micrographs of Alumina AKP30-1300 (a) and Alumina AKP30-1450 taken at IRCER [8].
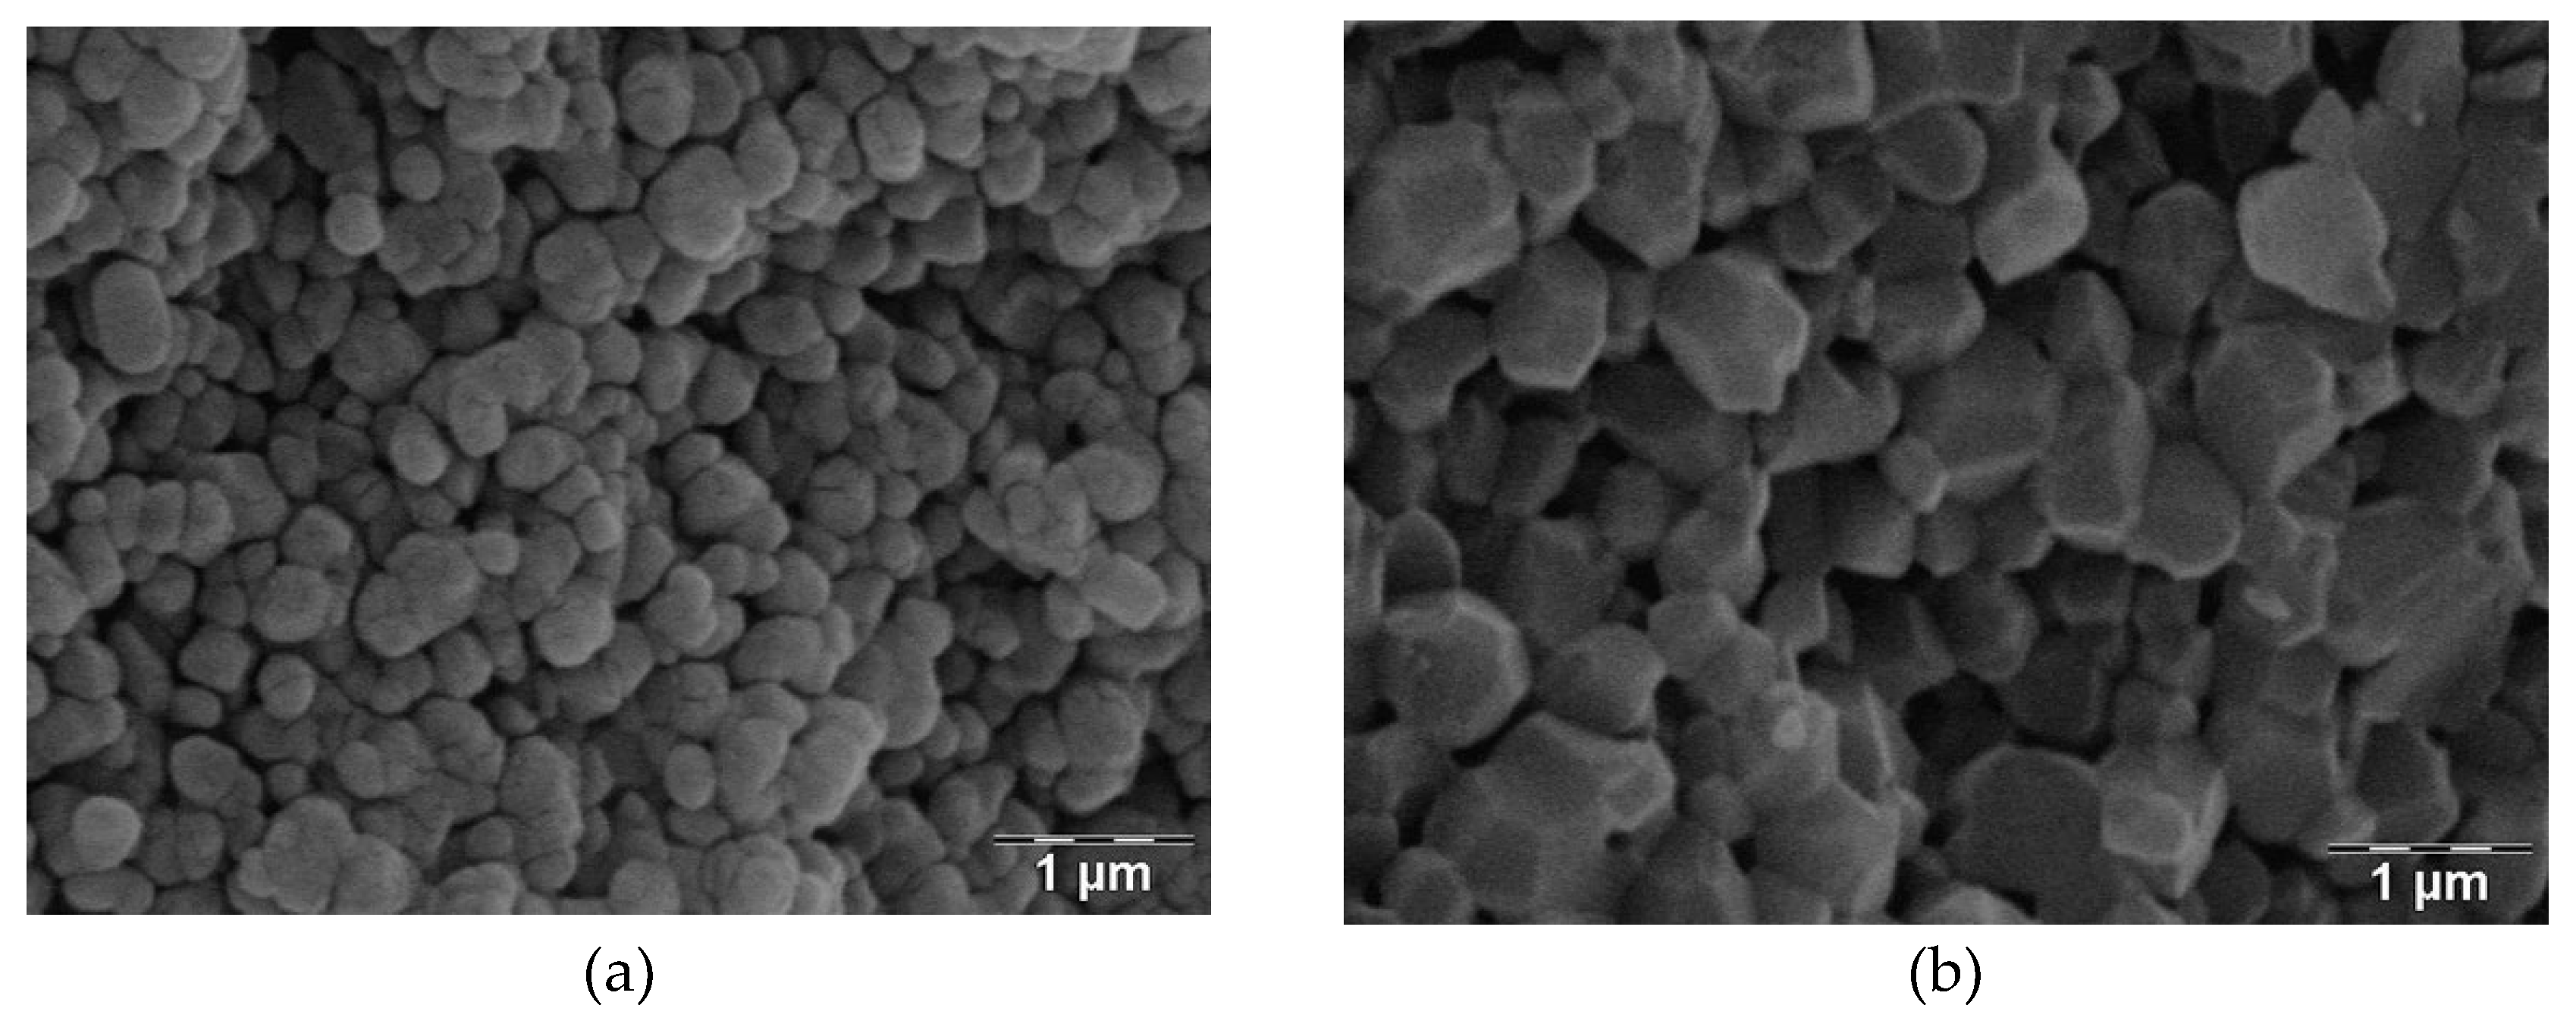
Figure 4.
Thermal conductivity (λeff) as a function of the temperature for an Alumina-Spinel refractory sample.
Figure 4.
Thermal conductivity (λeff) as a function of the temperature for an Alumina-Spinel refractory sample.
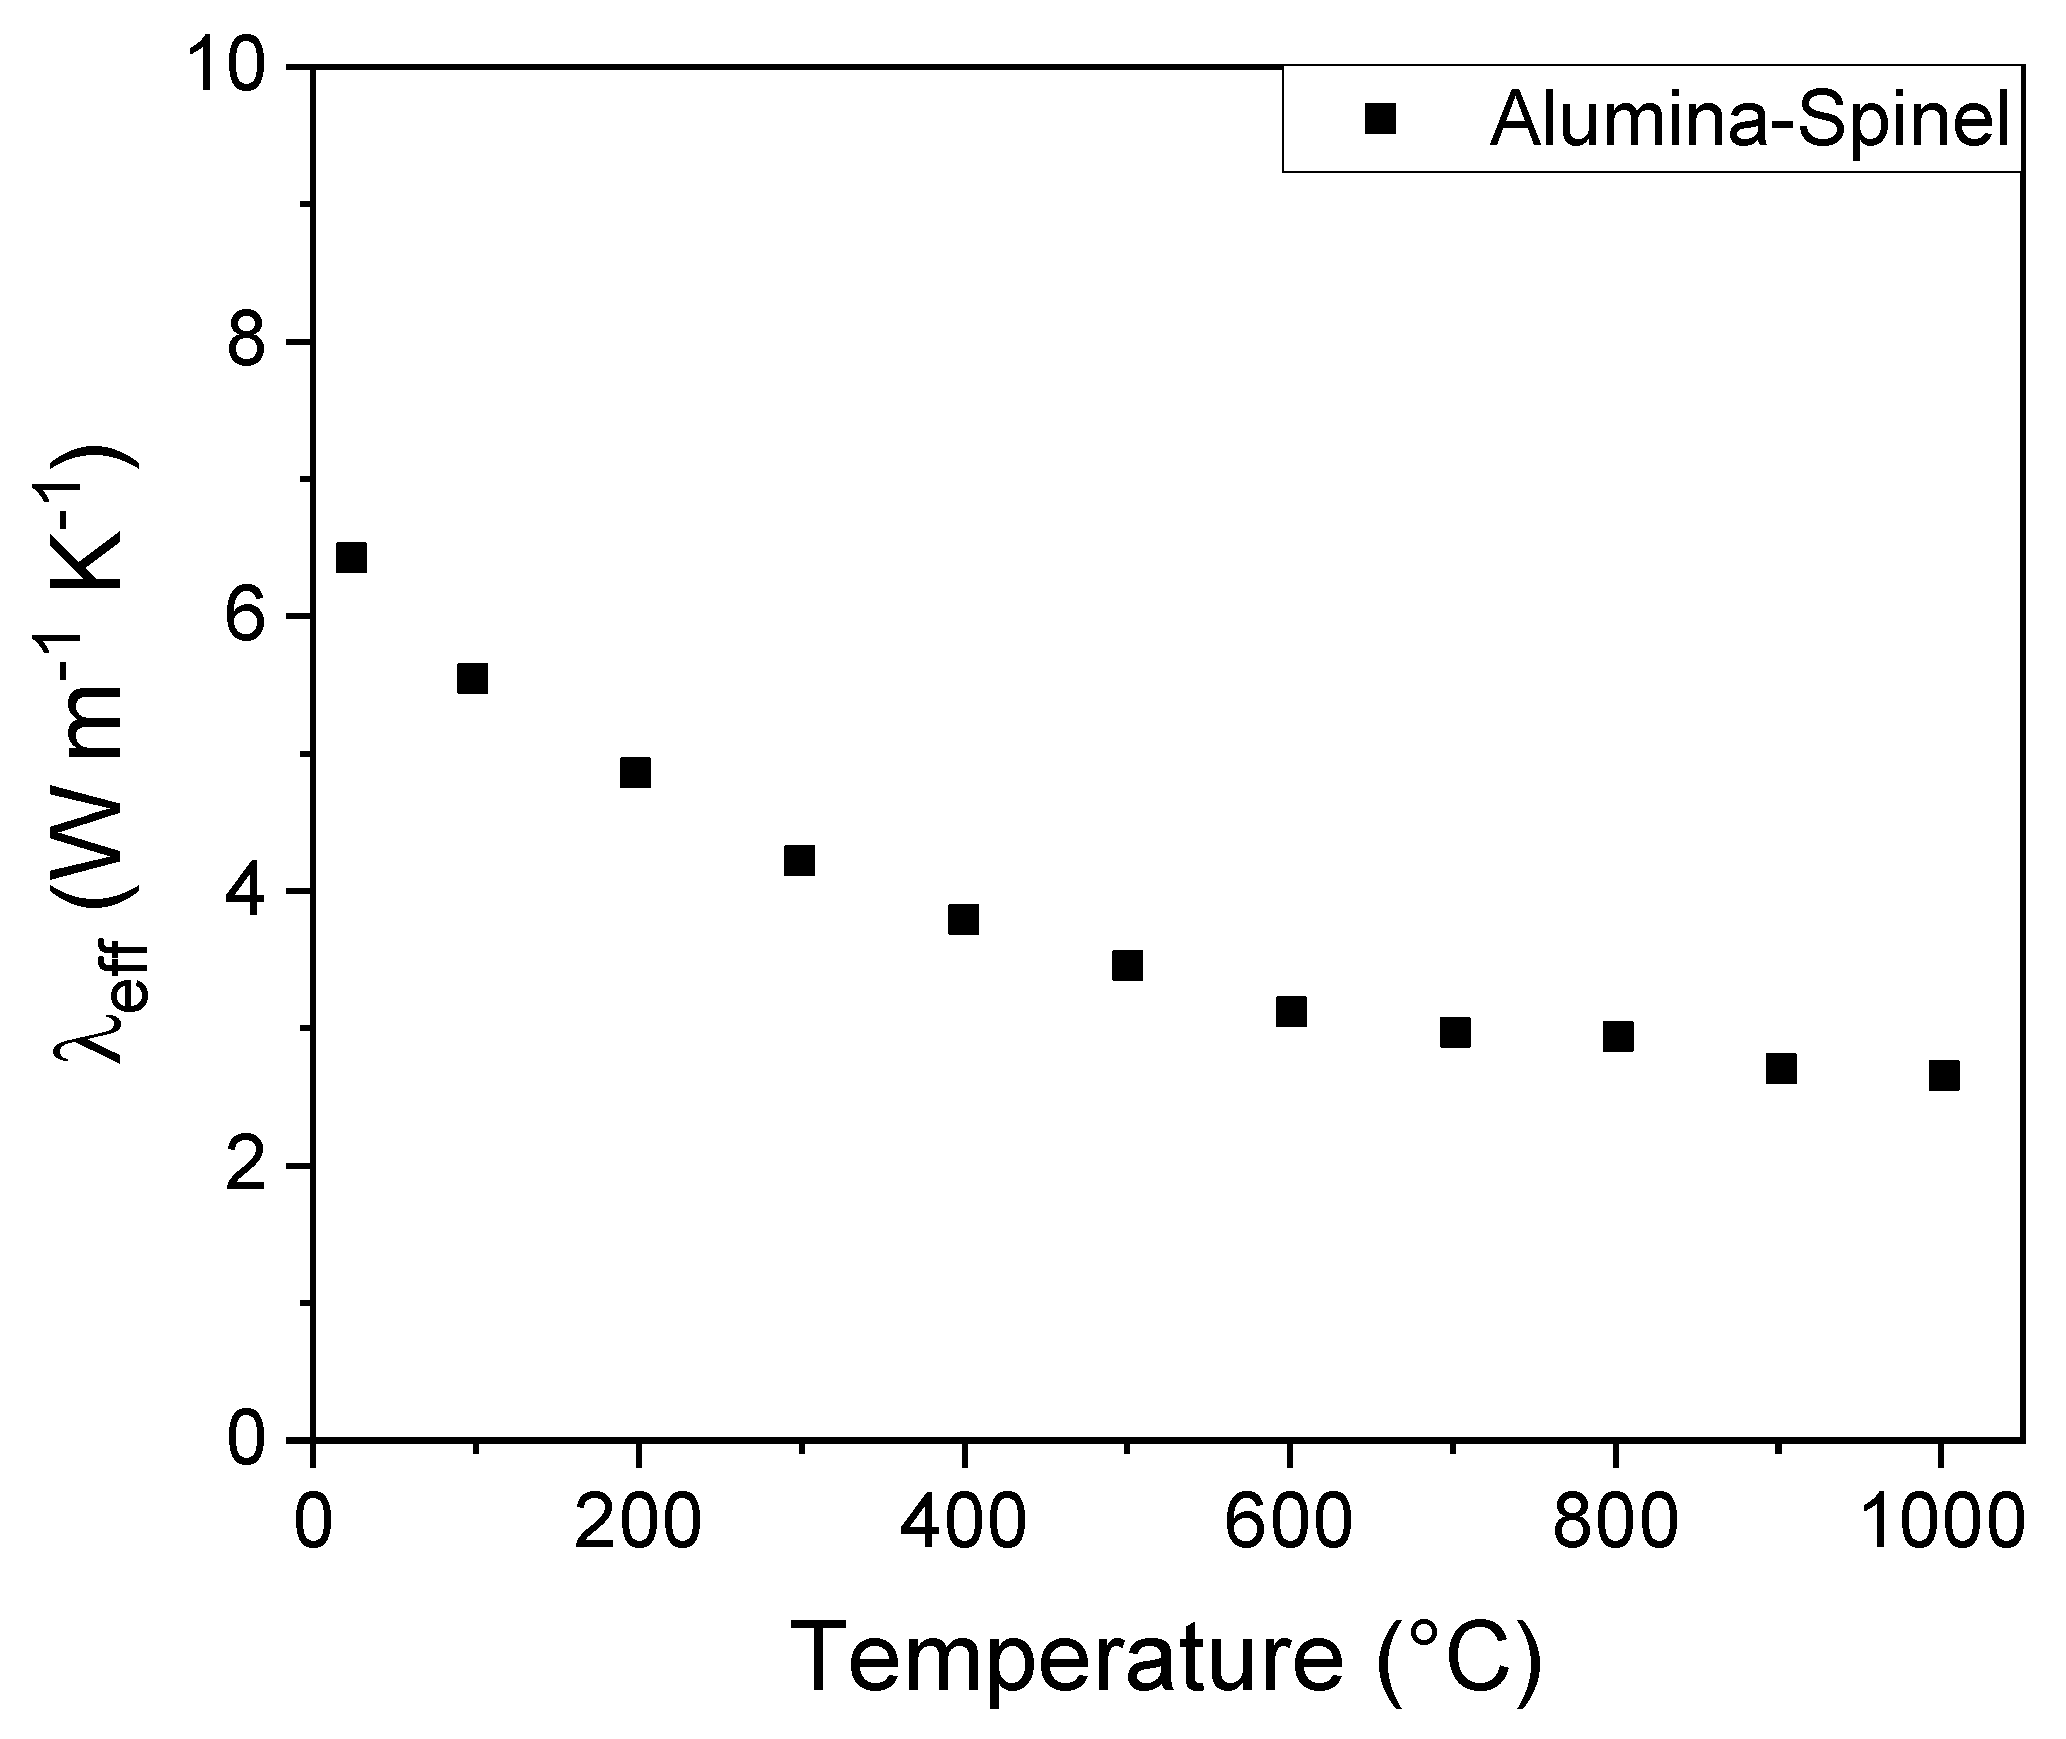
Figure 5.
Thermal conductivity (λeff) as a function of the temperature of five alumina-based materials: four model materials (Sapphire, Alumina TM-DA, Alumina AKP30-1450 and Alumina AKP30-1300) and one refractory material (Alumina-Spinel).
Figure 5.
Thermal conductivity (λeff) as a function of the temperature of five alumina-based materials: four model materials (Sapphire, Alumina TM-DA, Alumina AKP30-1450 and Alumina AKP30-1300) and one refractory material (Alumina-Spinel).
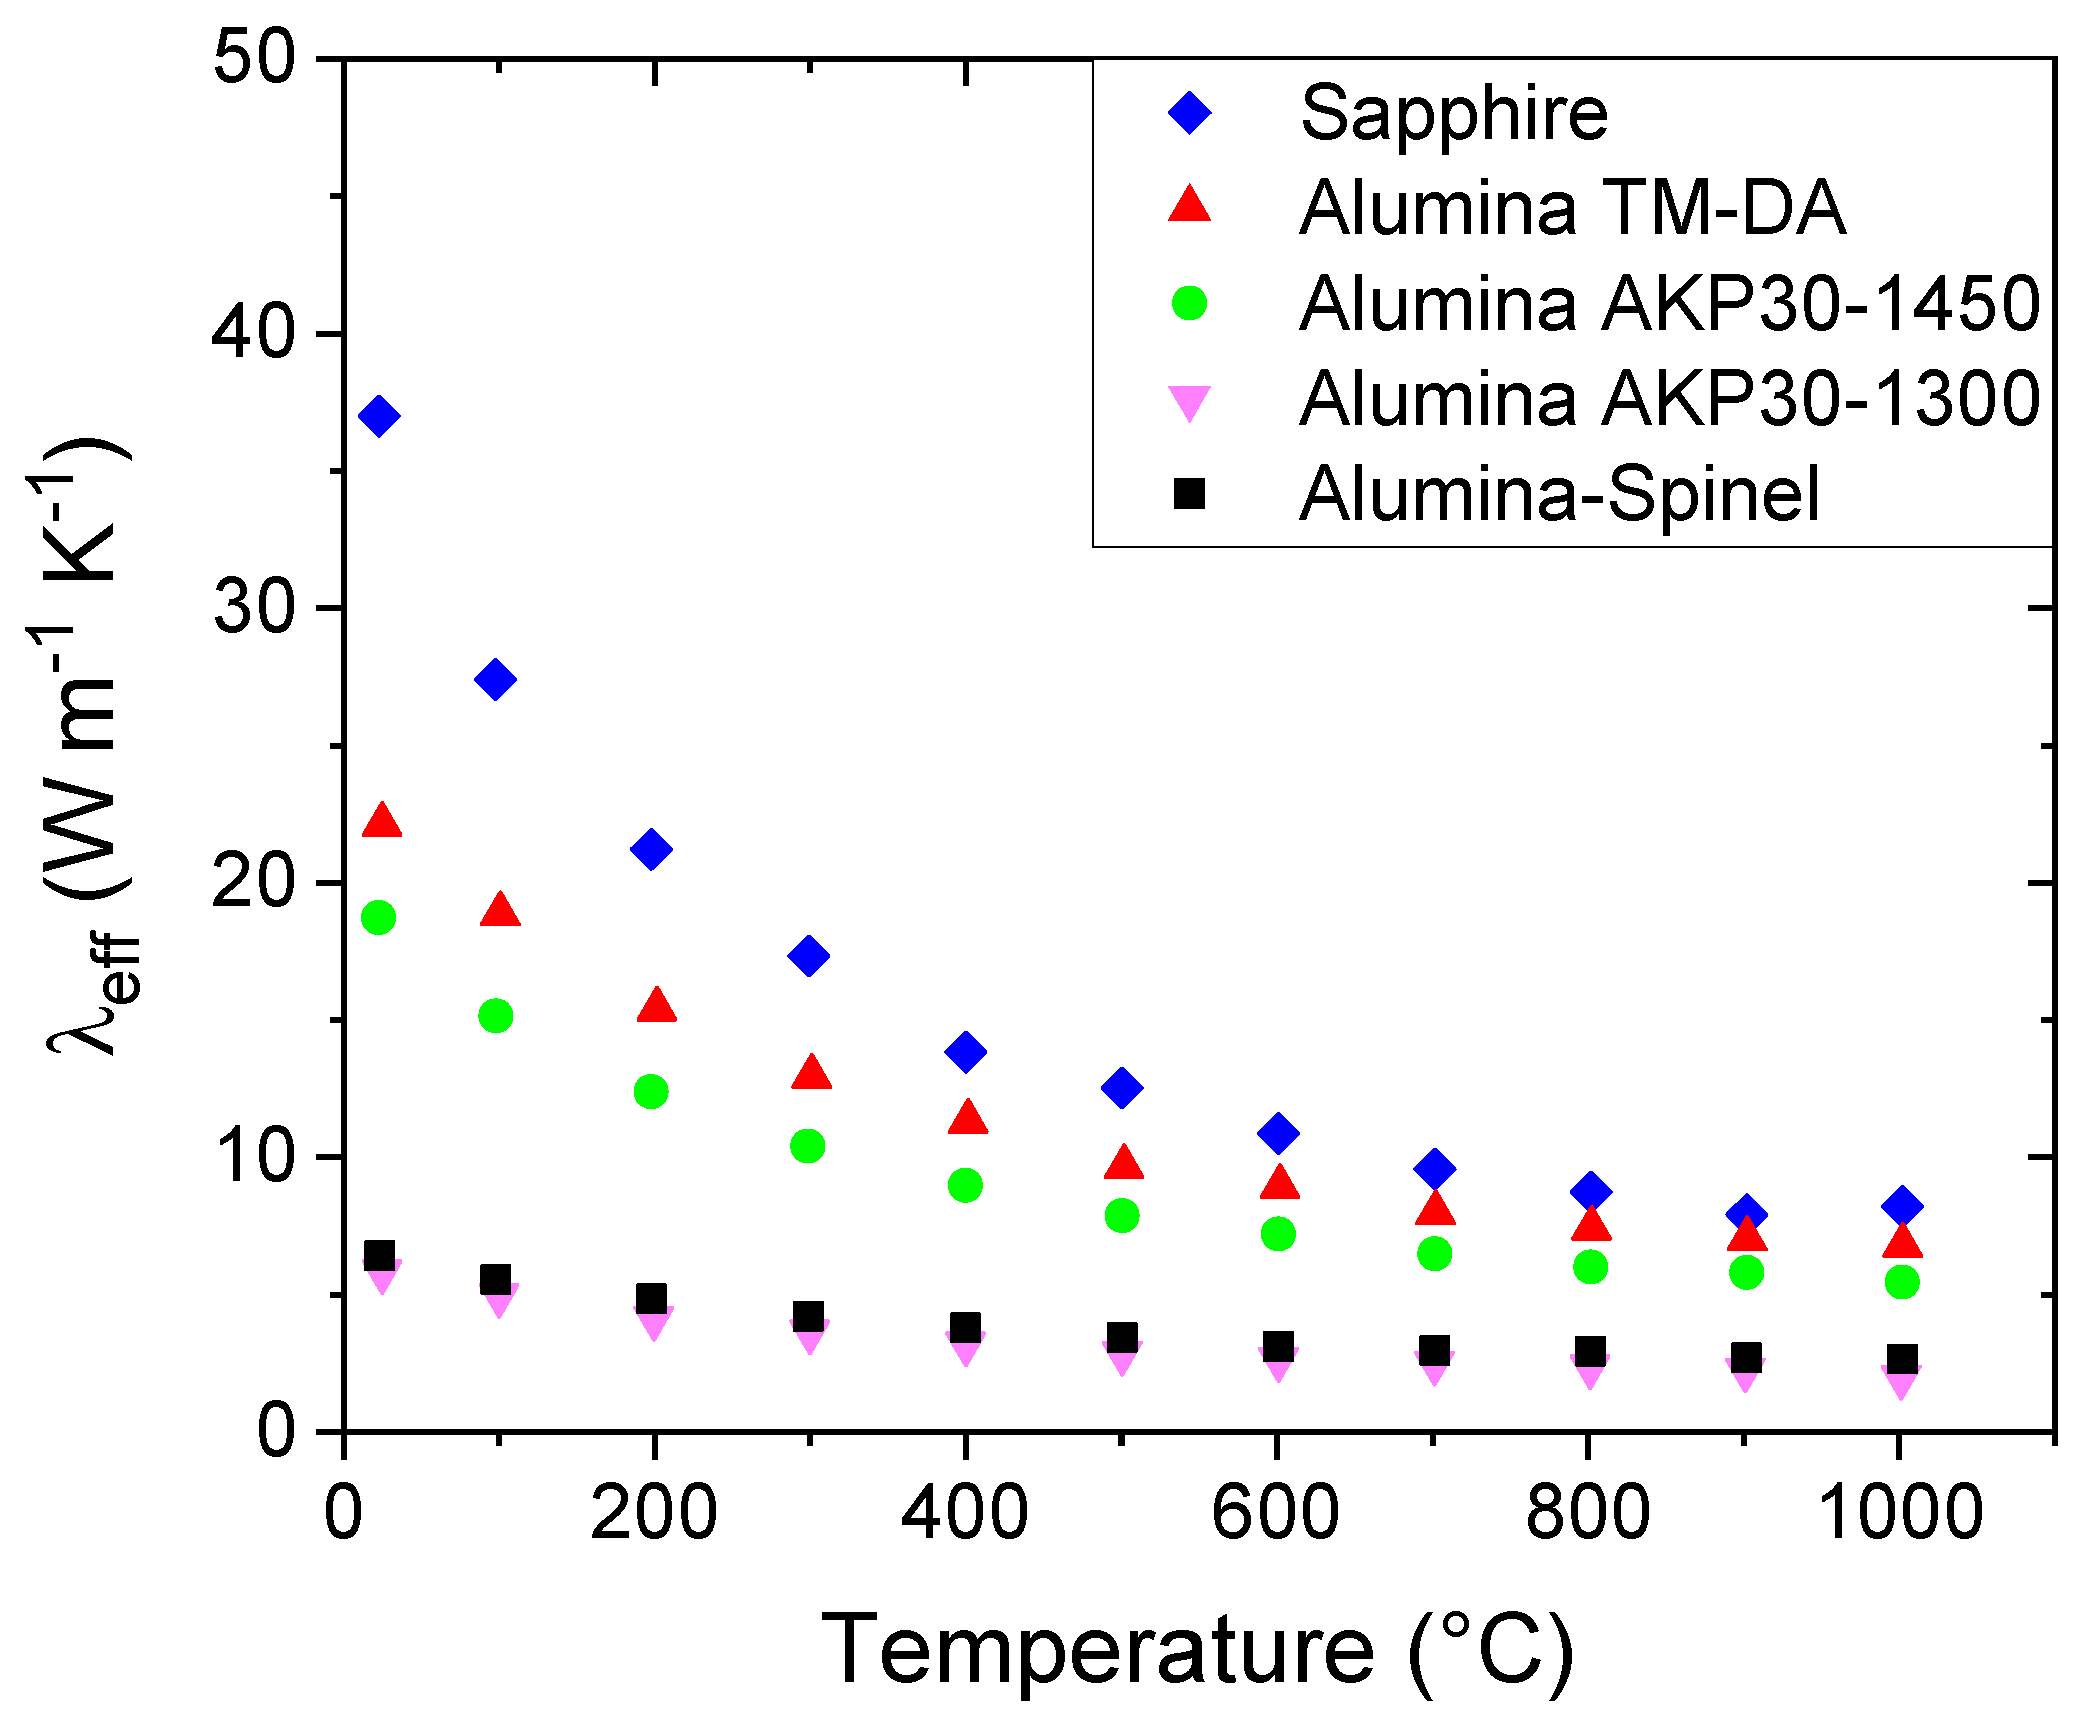
Figure 6.
Predicted values of effective thermal conductivity of a hypothetical material (fully dense = 1 W m-1 K-1) as a function of the pore volume fraction using different relations.
Figure 6.
Predicted values of effective thermal conductivity of a hypothetical material (fully dense = 1 W m-1 K-1) as a function of the pore volume fraction using different relations.
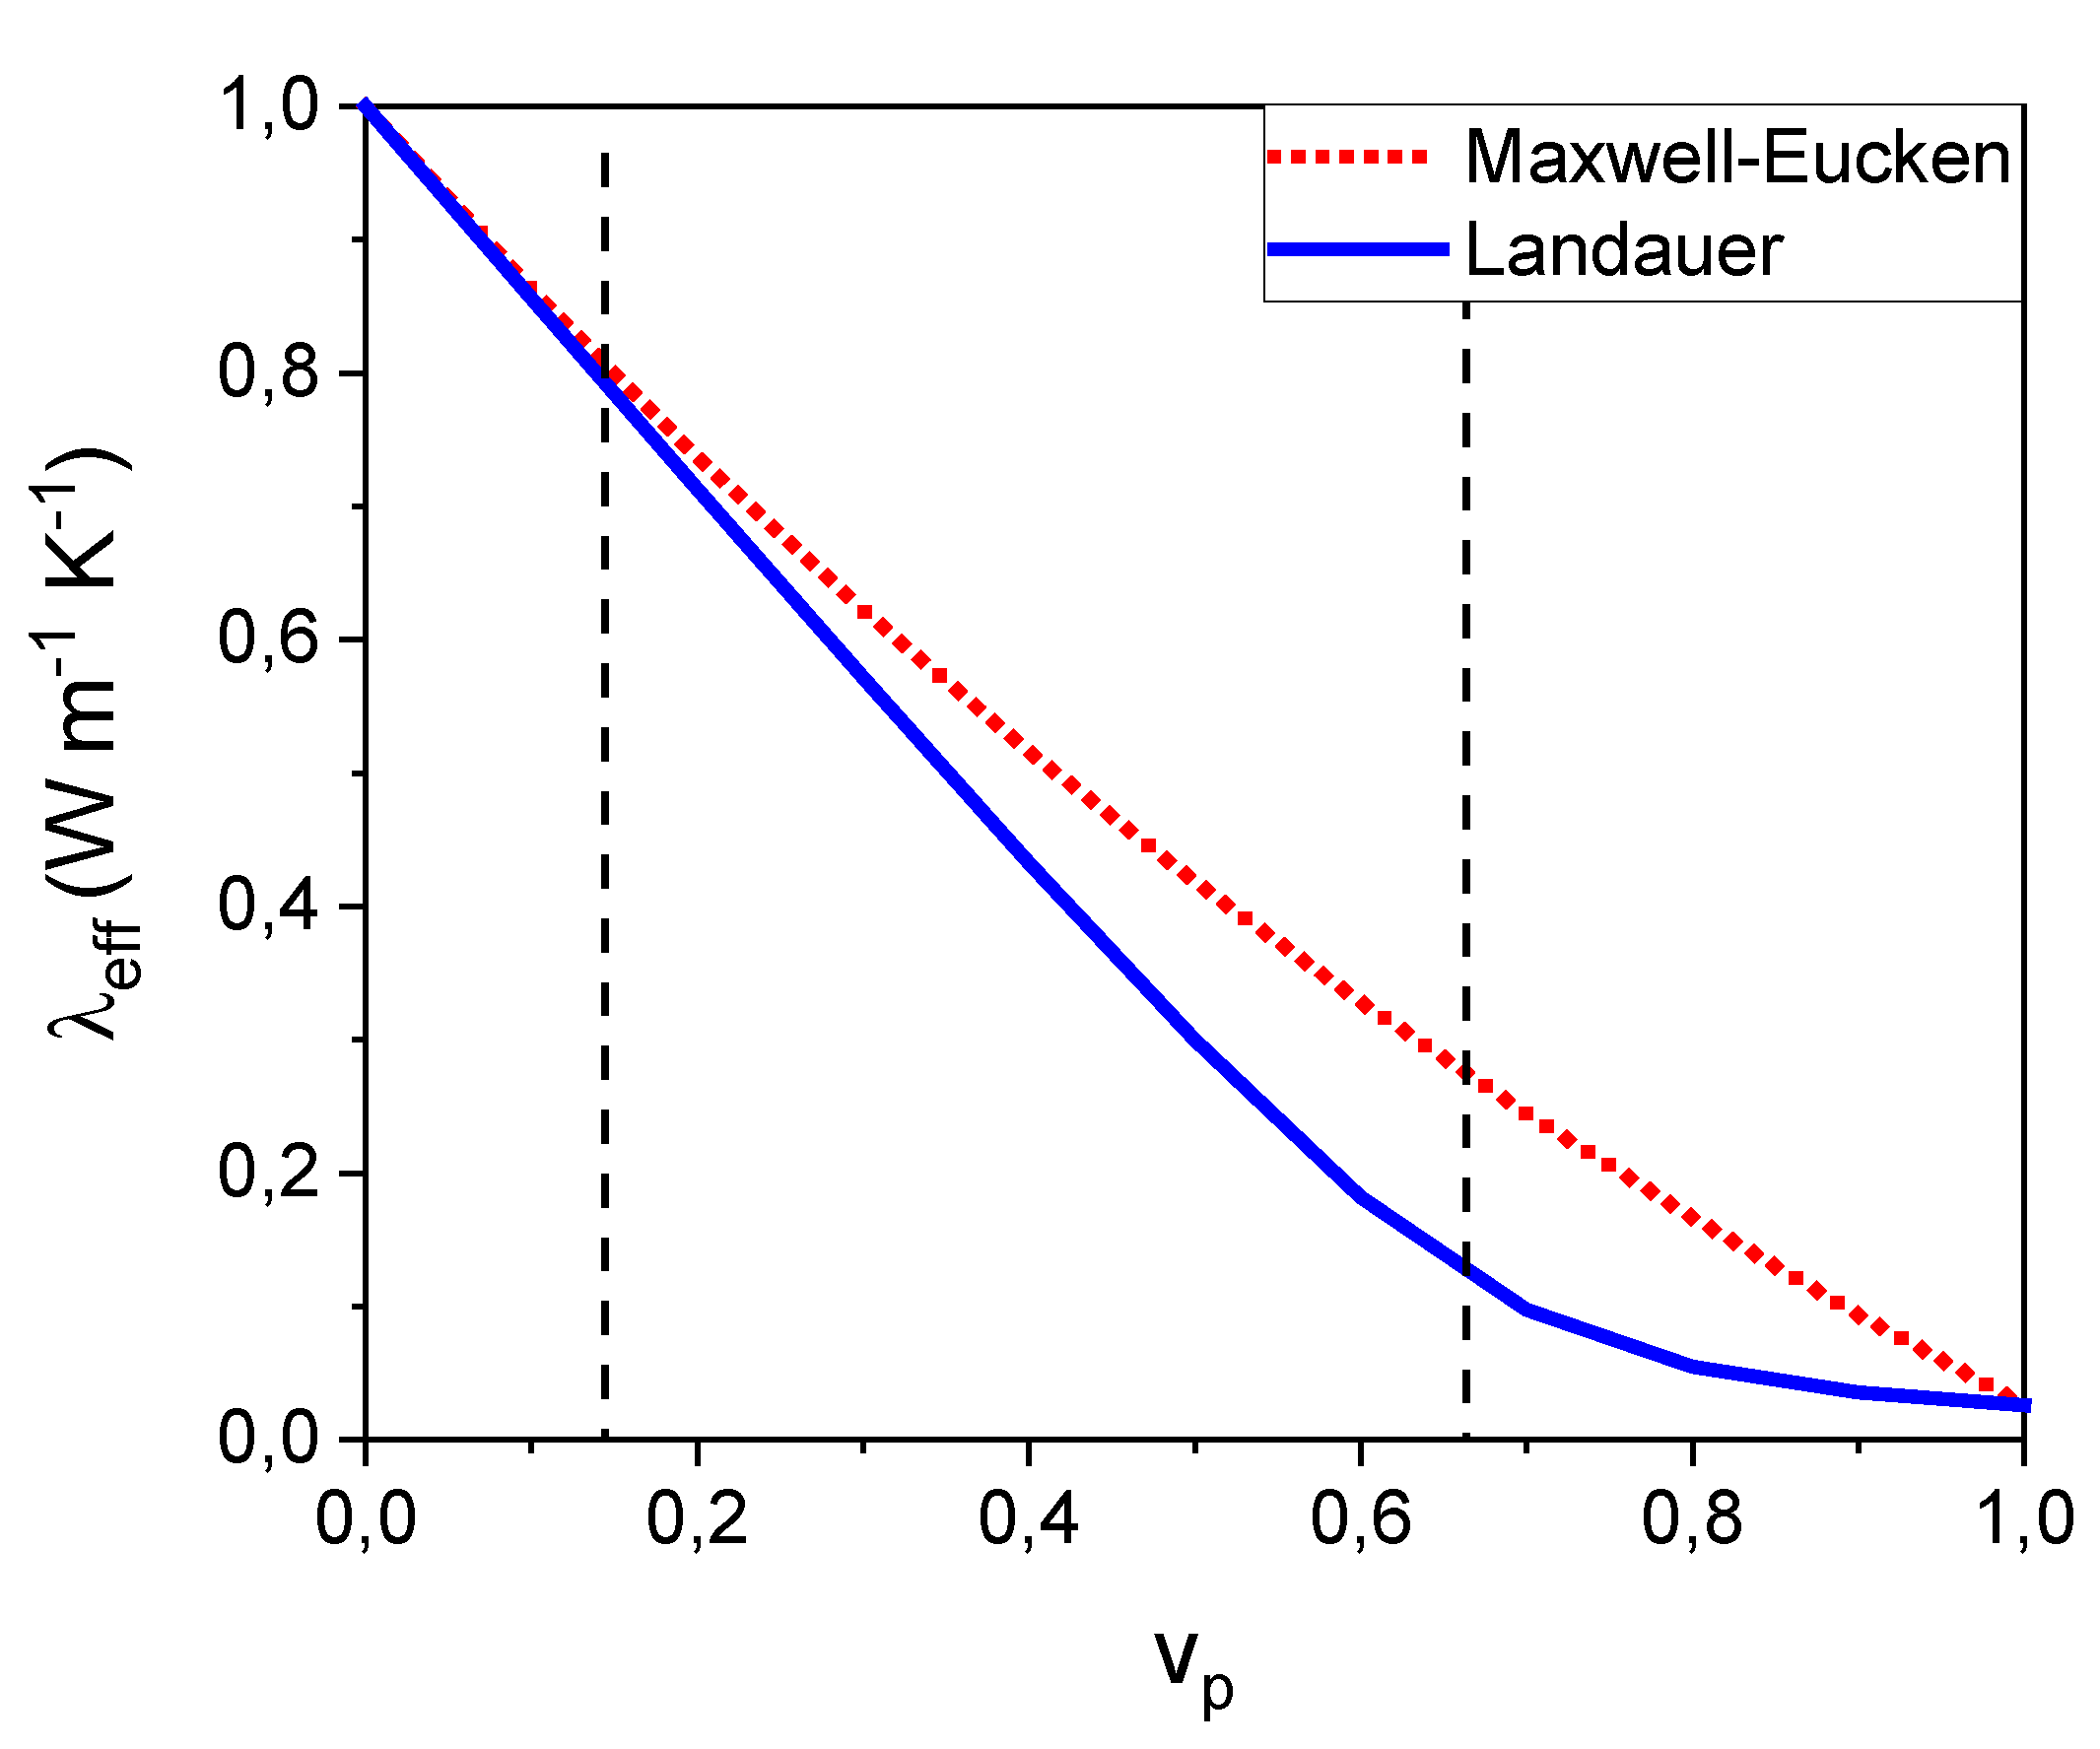
Figure 7.
Calculated thermal conductivity values for equivalent 100% dense ceramics as a function of the temperature. The effect of porosity was corrected using equation 6.
Figure 7.
Calculated thermal conductivity values for equivalent 100% dense ceramics as a function of the temperature. The effect of porosity was corrected using equation 6.
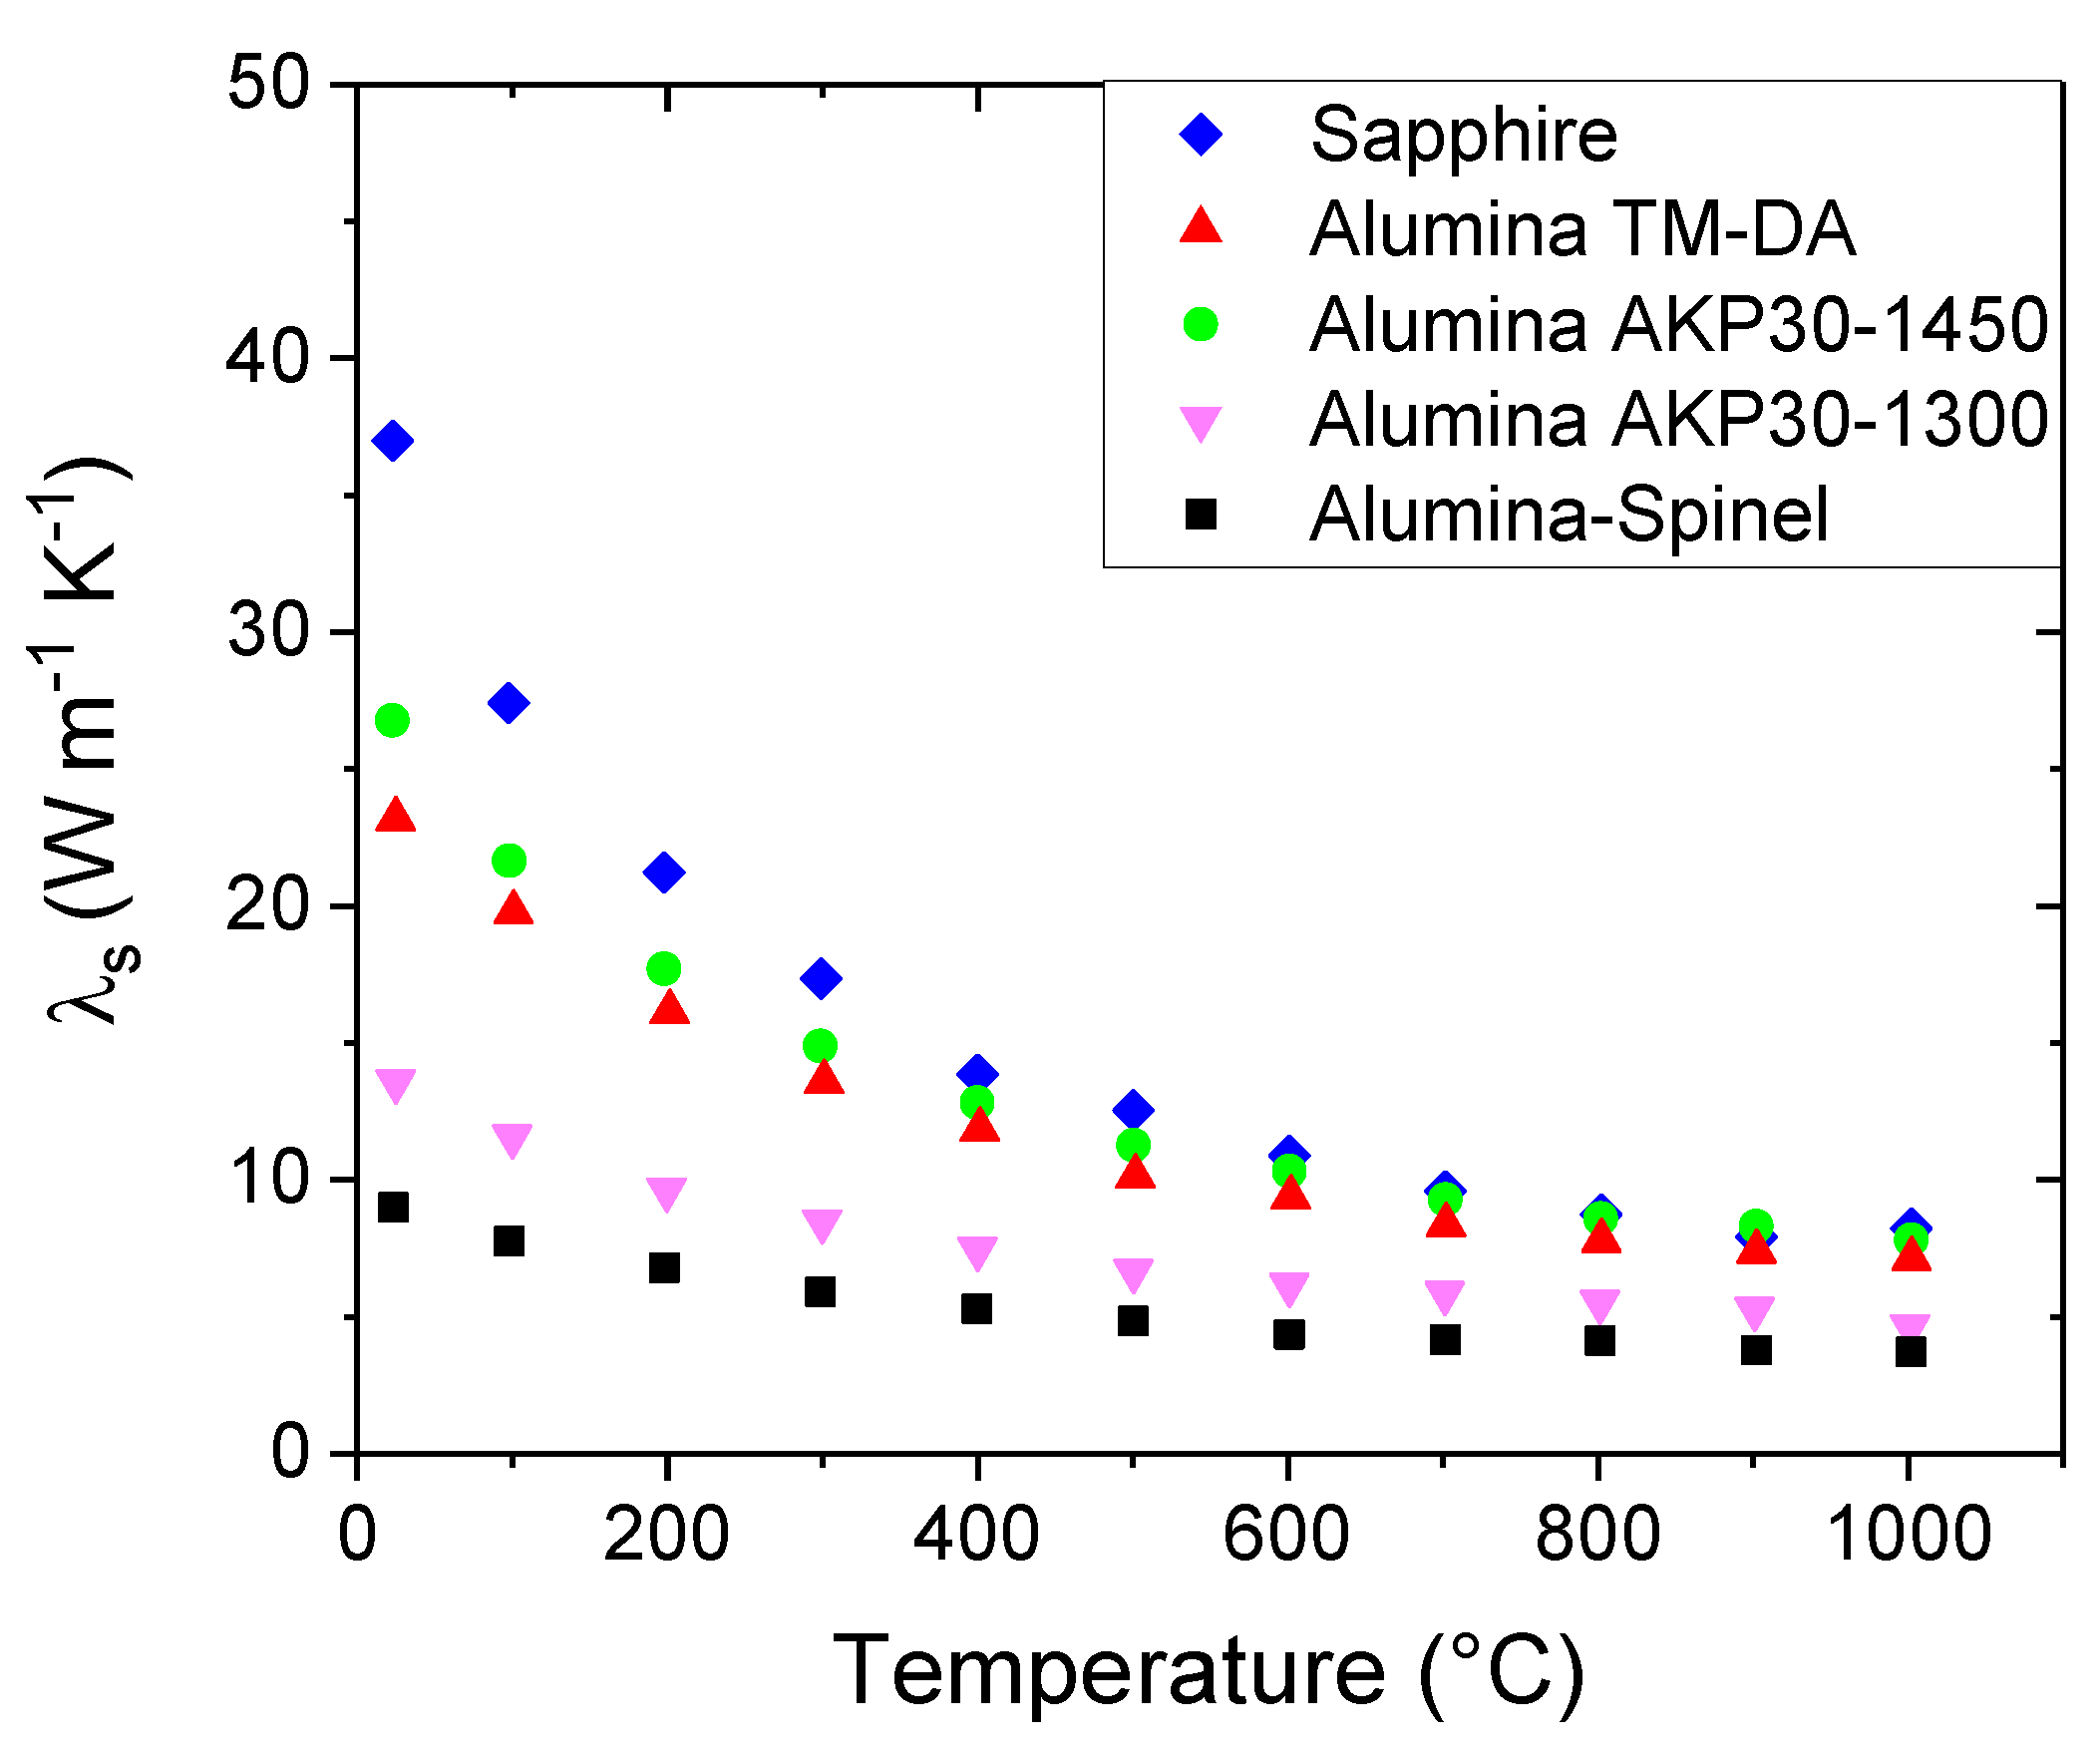
Figure 8.
Thermal resistivity values as a function of the temperature for four alumina model materials (Sapphire, Alumina TM-DA, Alumina AKP30-1450 and Alumina AKP30-1300) and one refractory material (Alumina-Spinel).
Figure 8.
Thermal resistivity values as a function of the temperature for four alumina model materials (Sapphire, Alumina TM-DA, Alumina AKP30-1450 and Alumina AKP30-1300) and one refractory material (Alumina-Spinel).
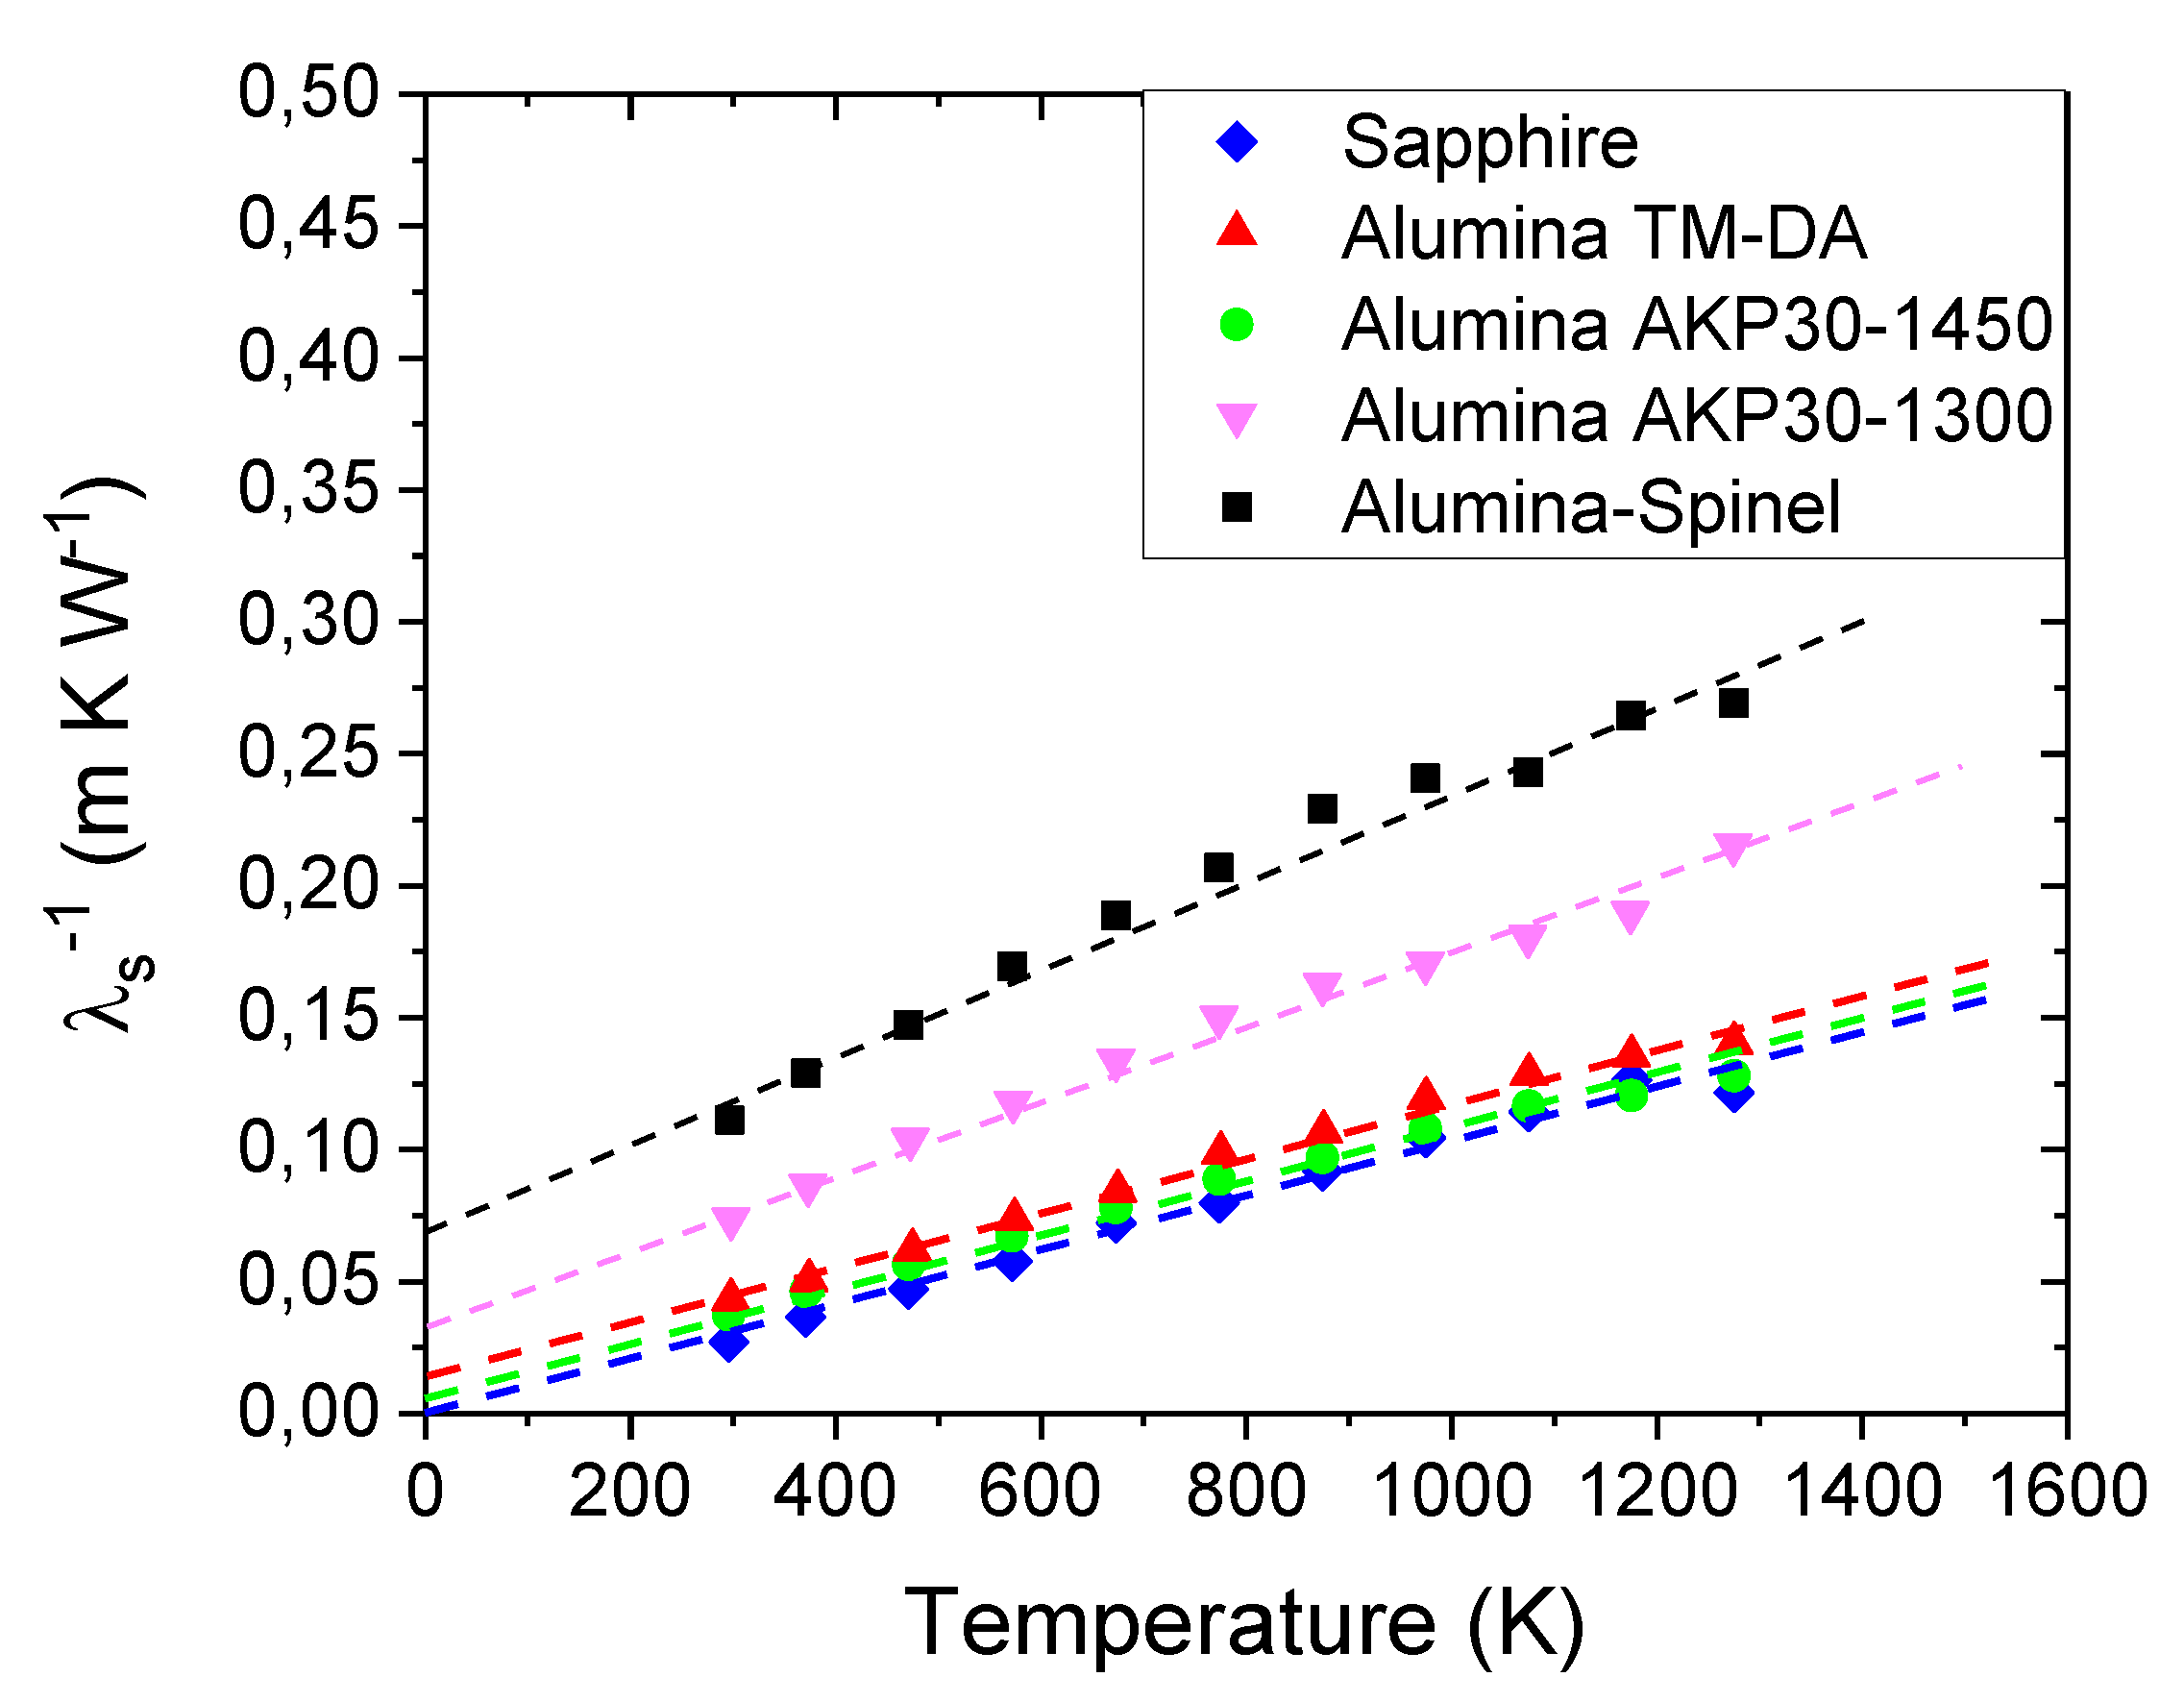
Figure 9.
Calculated values of grain thermal conductivity as a function of the temperature for the Alumina ceramics (a) and the Alumina-Spinel refractory sample (b) compared to Sapphire.
Figure 9.
Calculated values of grain thermal conductivity as a function of the temperature for the Alumina ceramics (a) and the Alumina-Spinel refractory sample (b) compared to Sapphire.
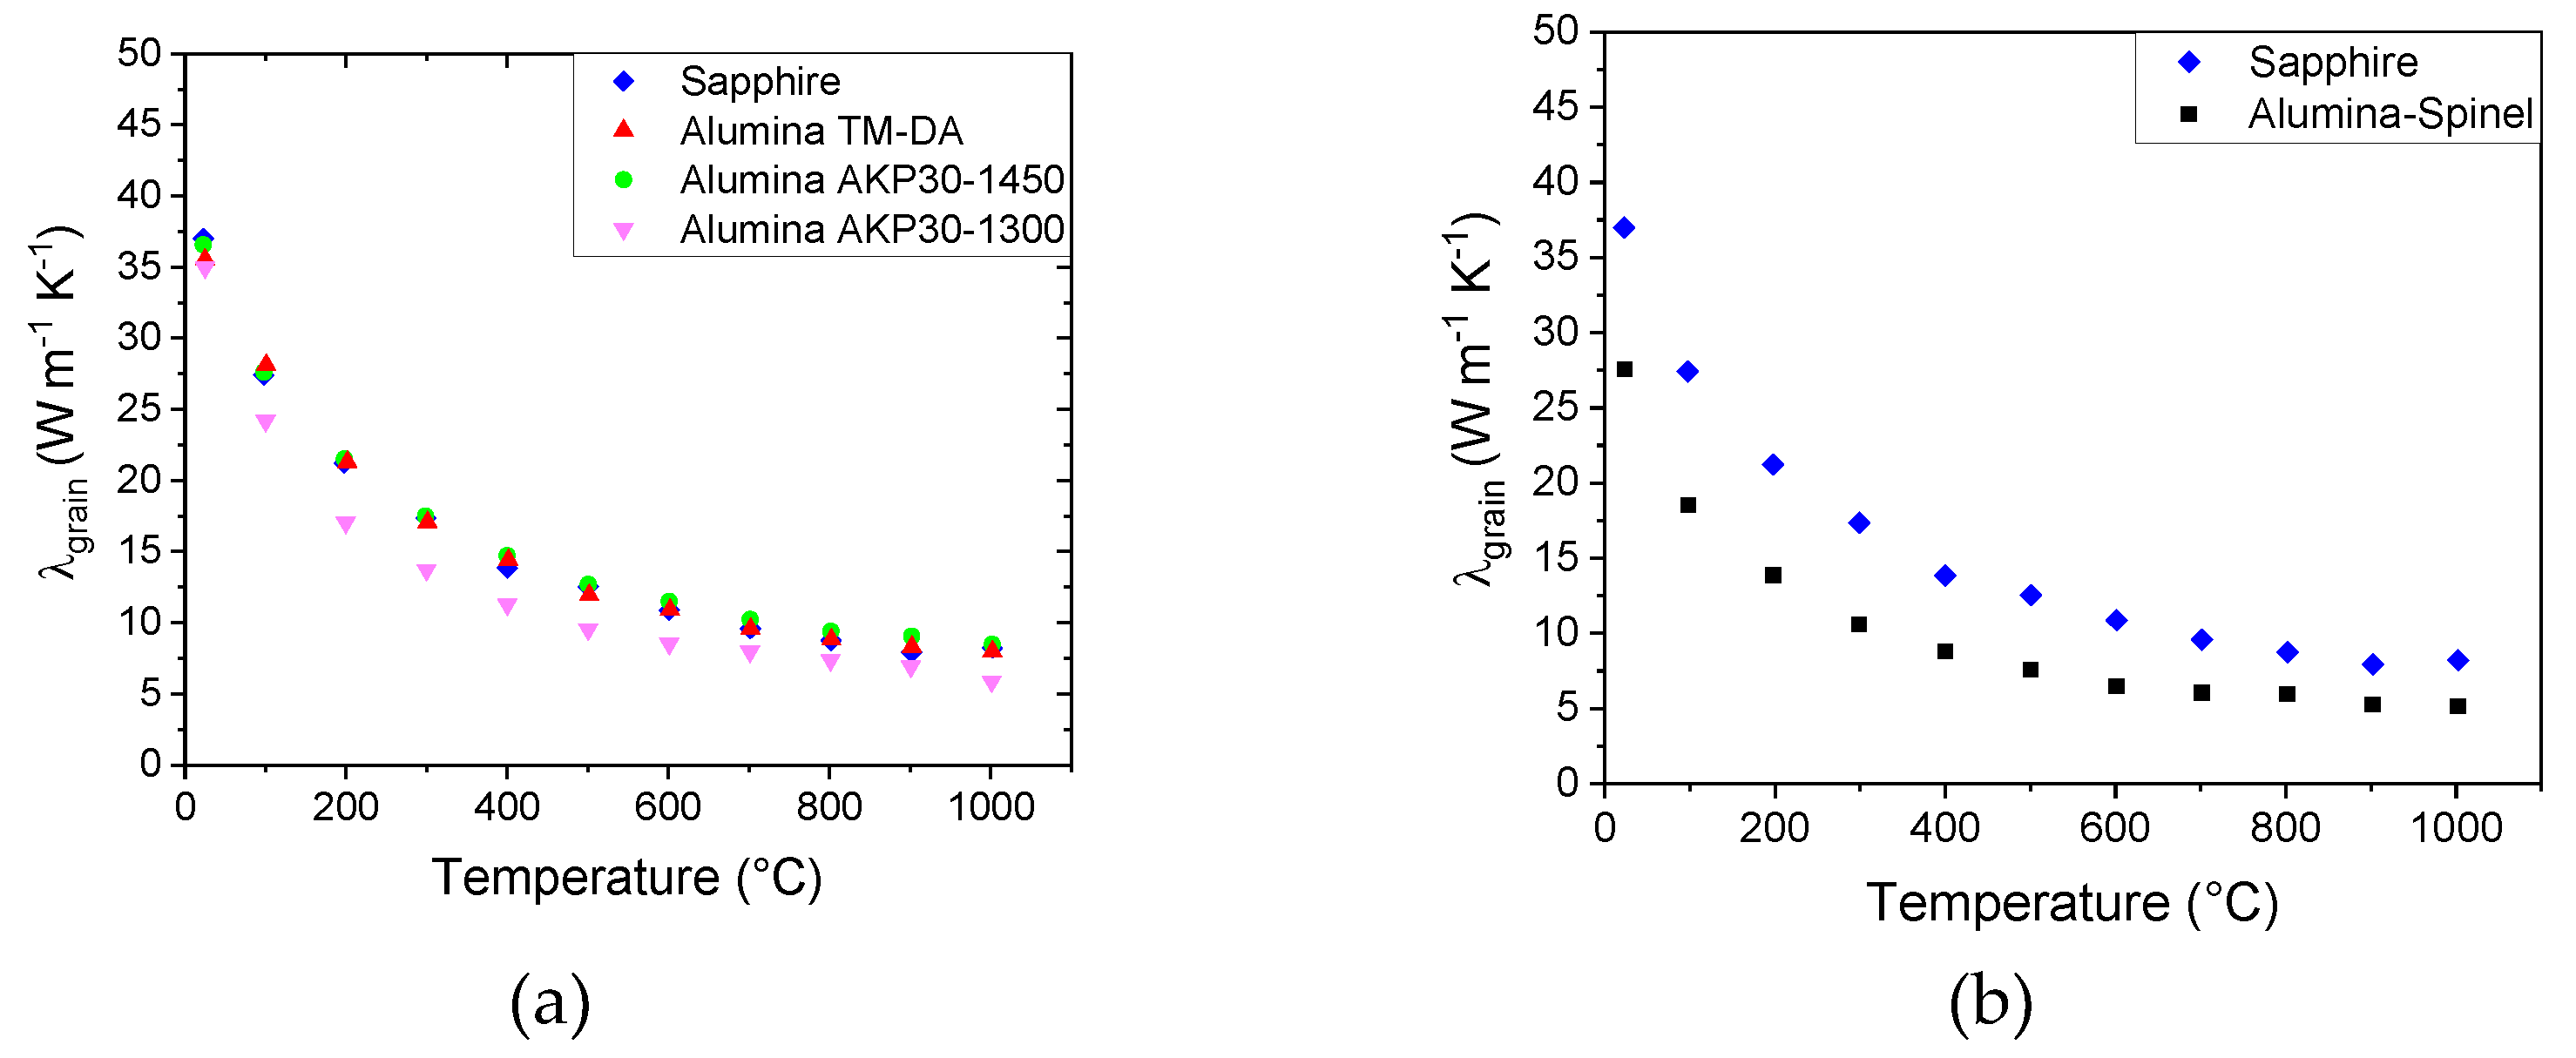
Figure 10.
The black points show the experimental results of the thermal conductivity as a function of temperature made on the spinel samples prepared at RHWT Aachen University using the AR78 powder, while the red points are the thermal conductivity of the spinel phase as a function of the temperature [2].
Figure 10.
The black points show the experimental results of the thermal conductivity as a function of temperature made on the spinel samples prepared at RHWT Aachen University using the AR78 powder, while the red points are the thermal conductivity of the spinel phase as a function of the temperature [2].
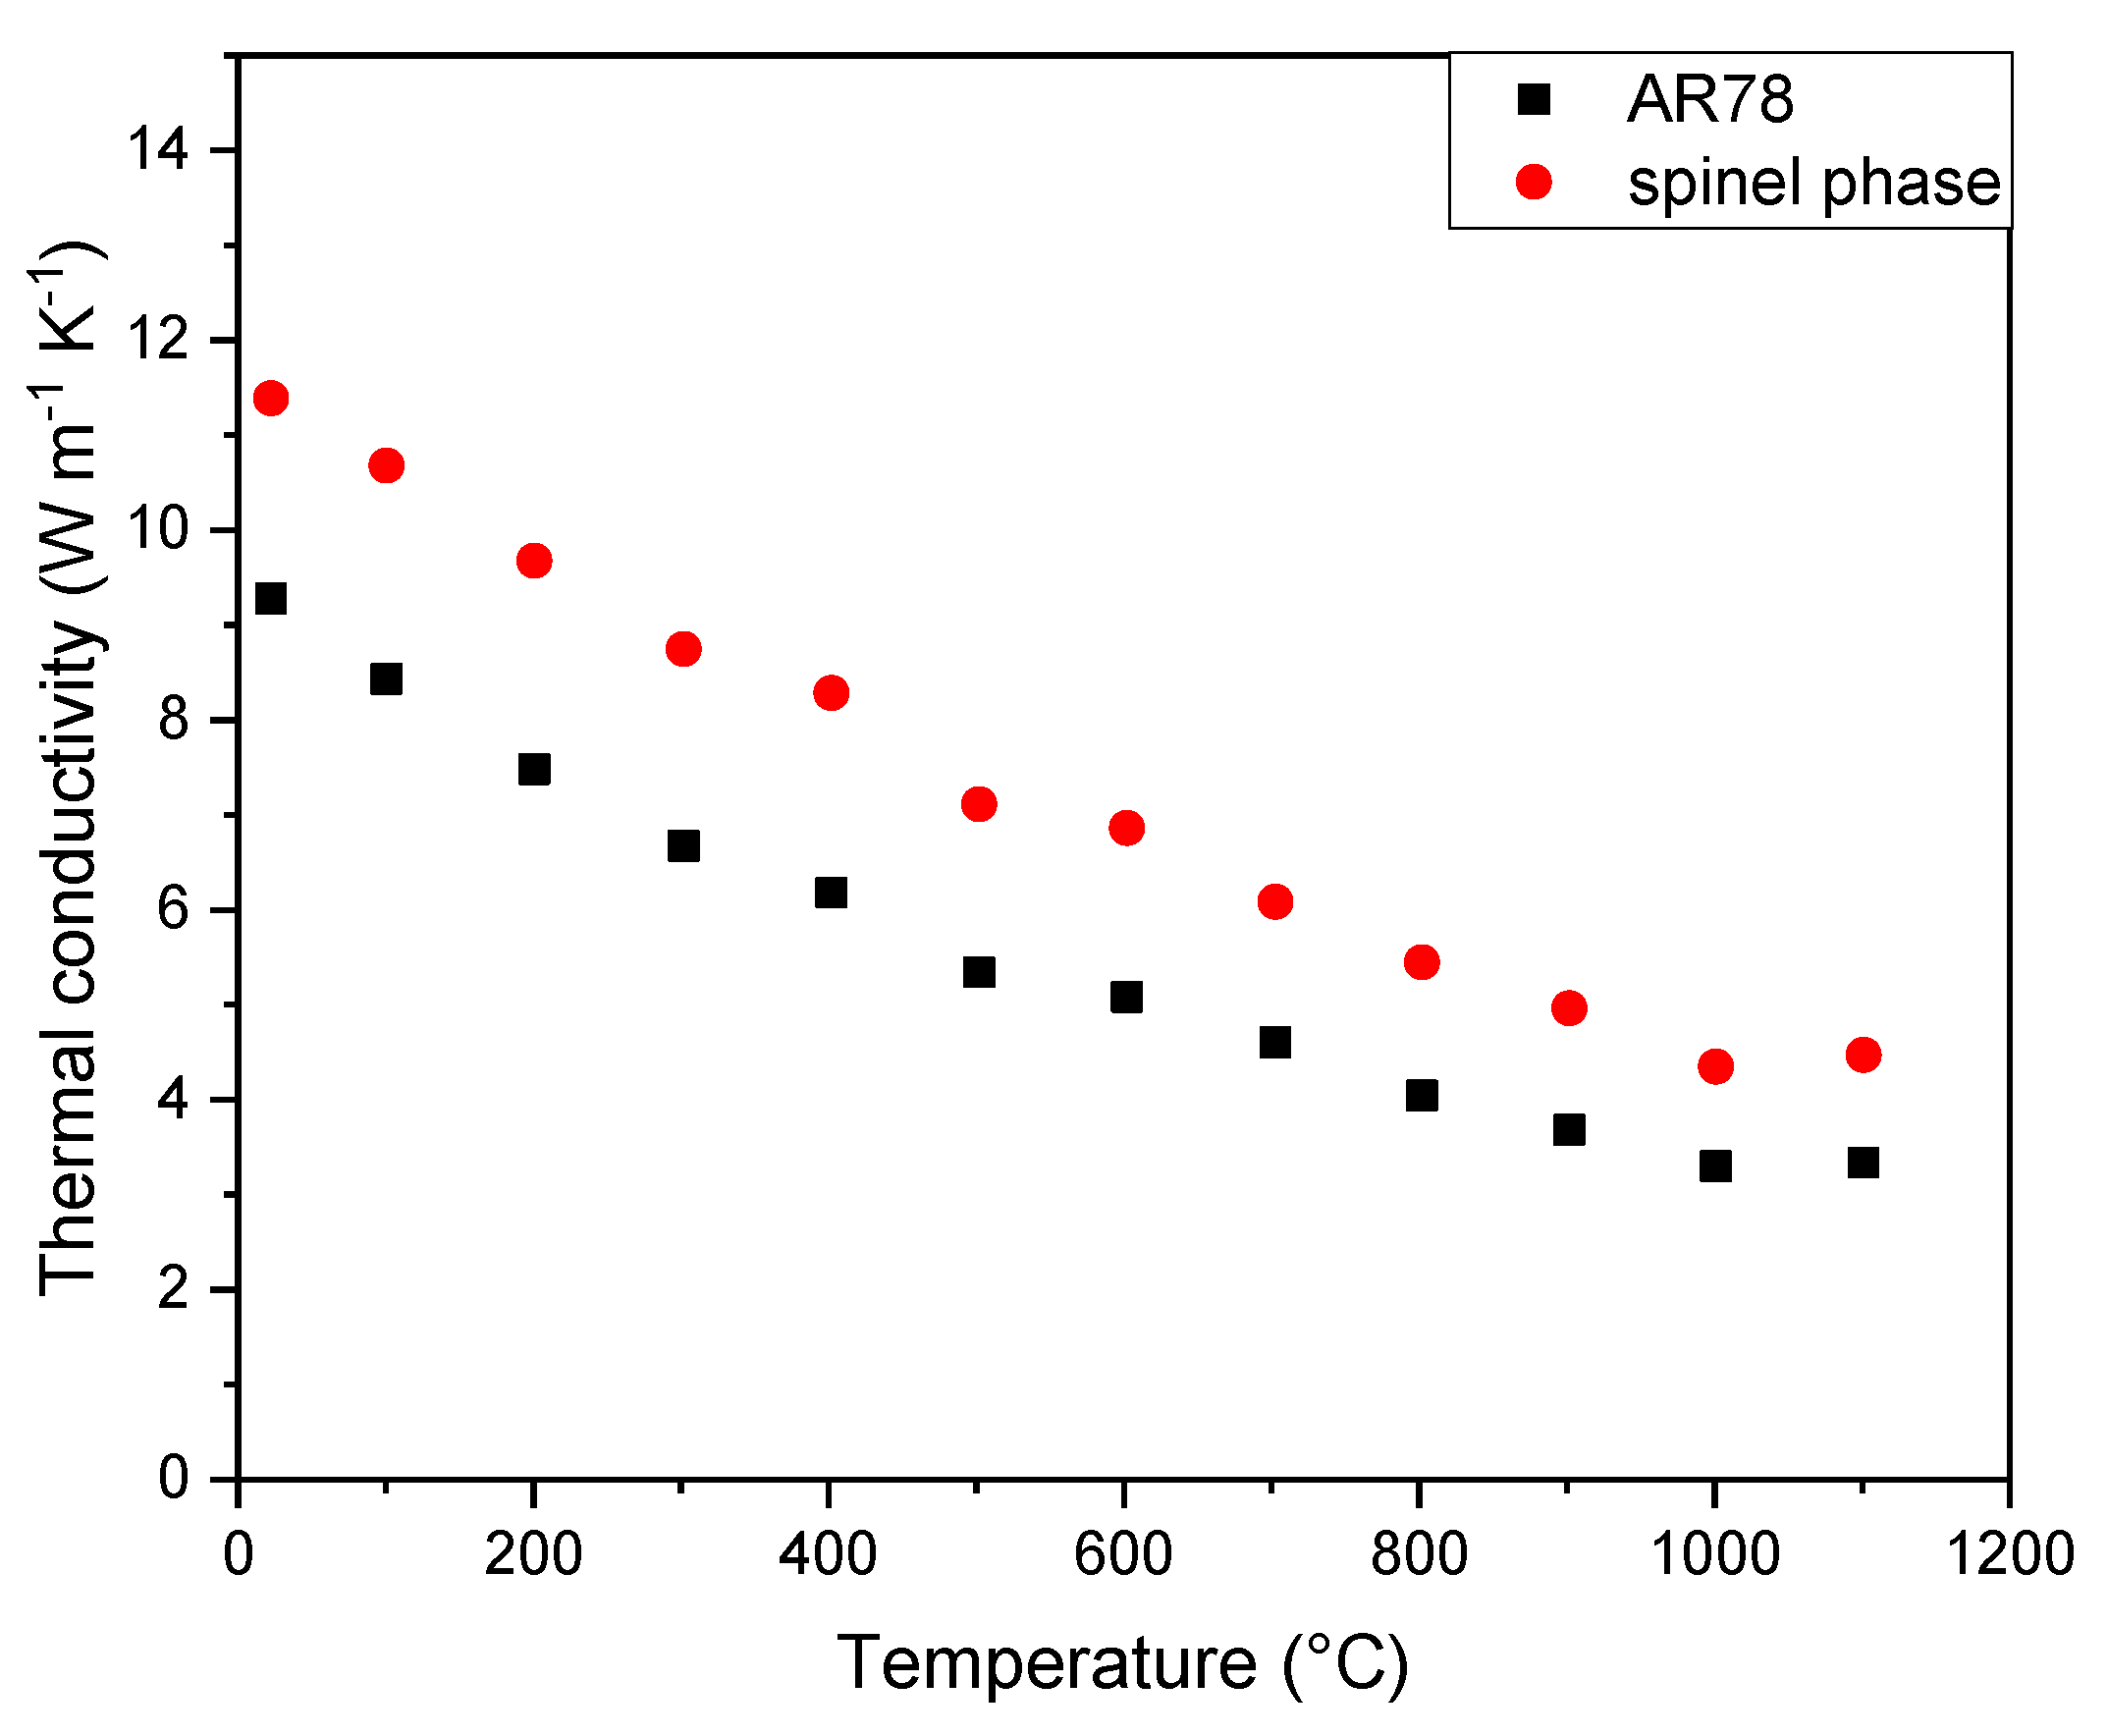
Figure 11.
Thermal conductivity of the alumina grains in the Alumina-Spinel sample as a function of the temperature after corrections for the microstructural effects (porosity, grain boundaries and the second phase) compared to the Sapphire sample.
Figure 11.
Thermal conductivity of the alumina grains in the Alumina-Spinel sample as a function of the temperature after corrections for the microstructural effects (porosity, grain boundaries and the second phase) compared to the Sapphire sample.
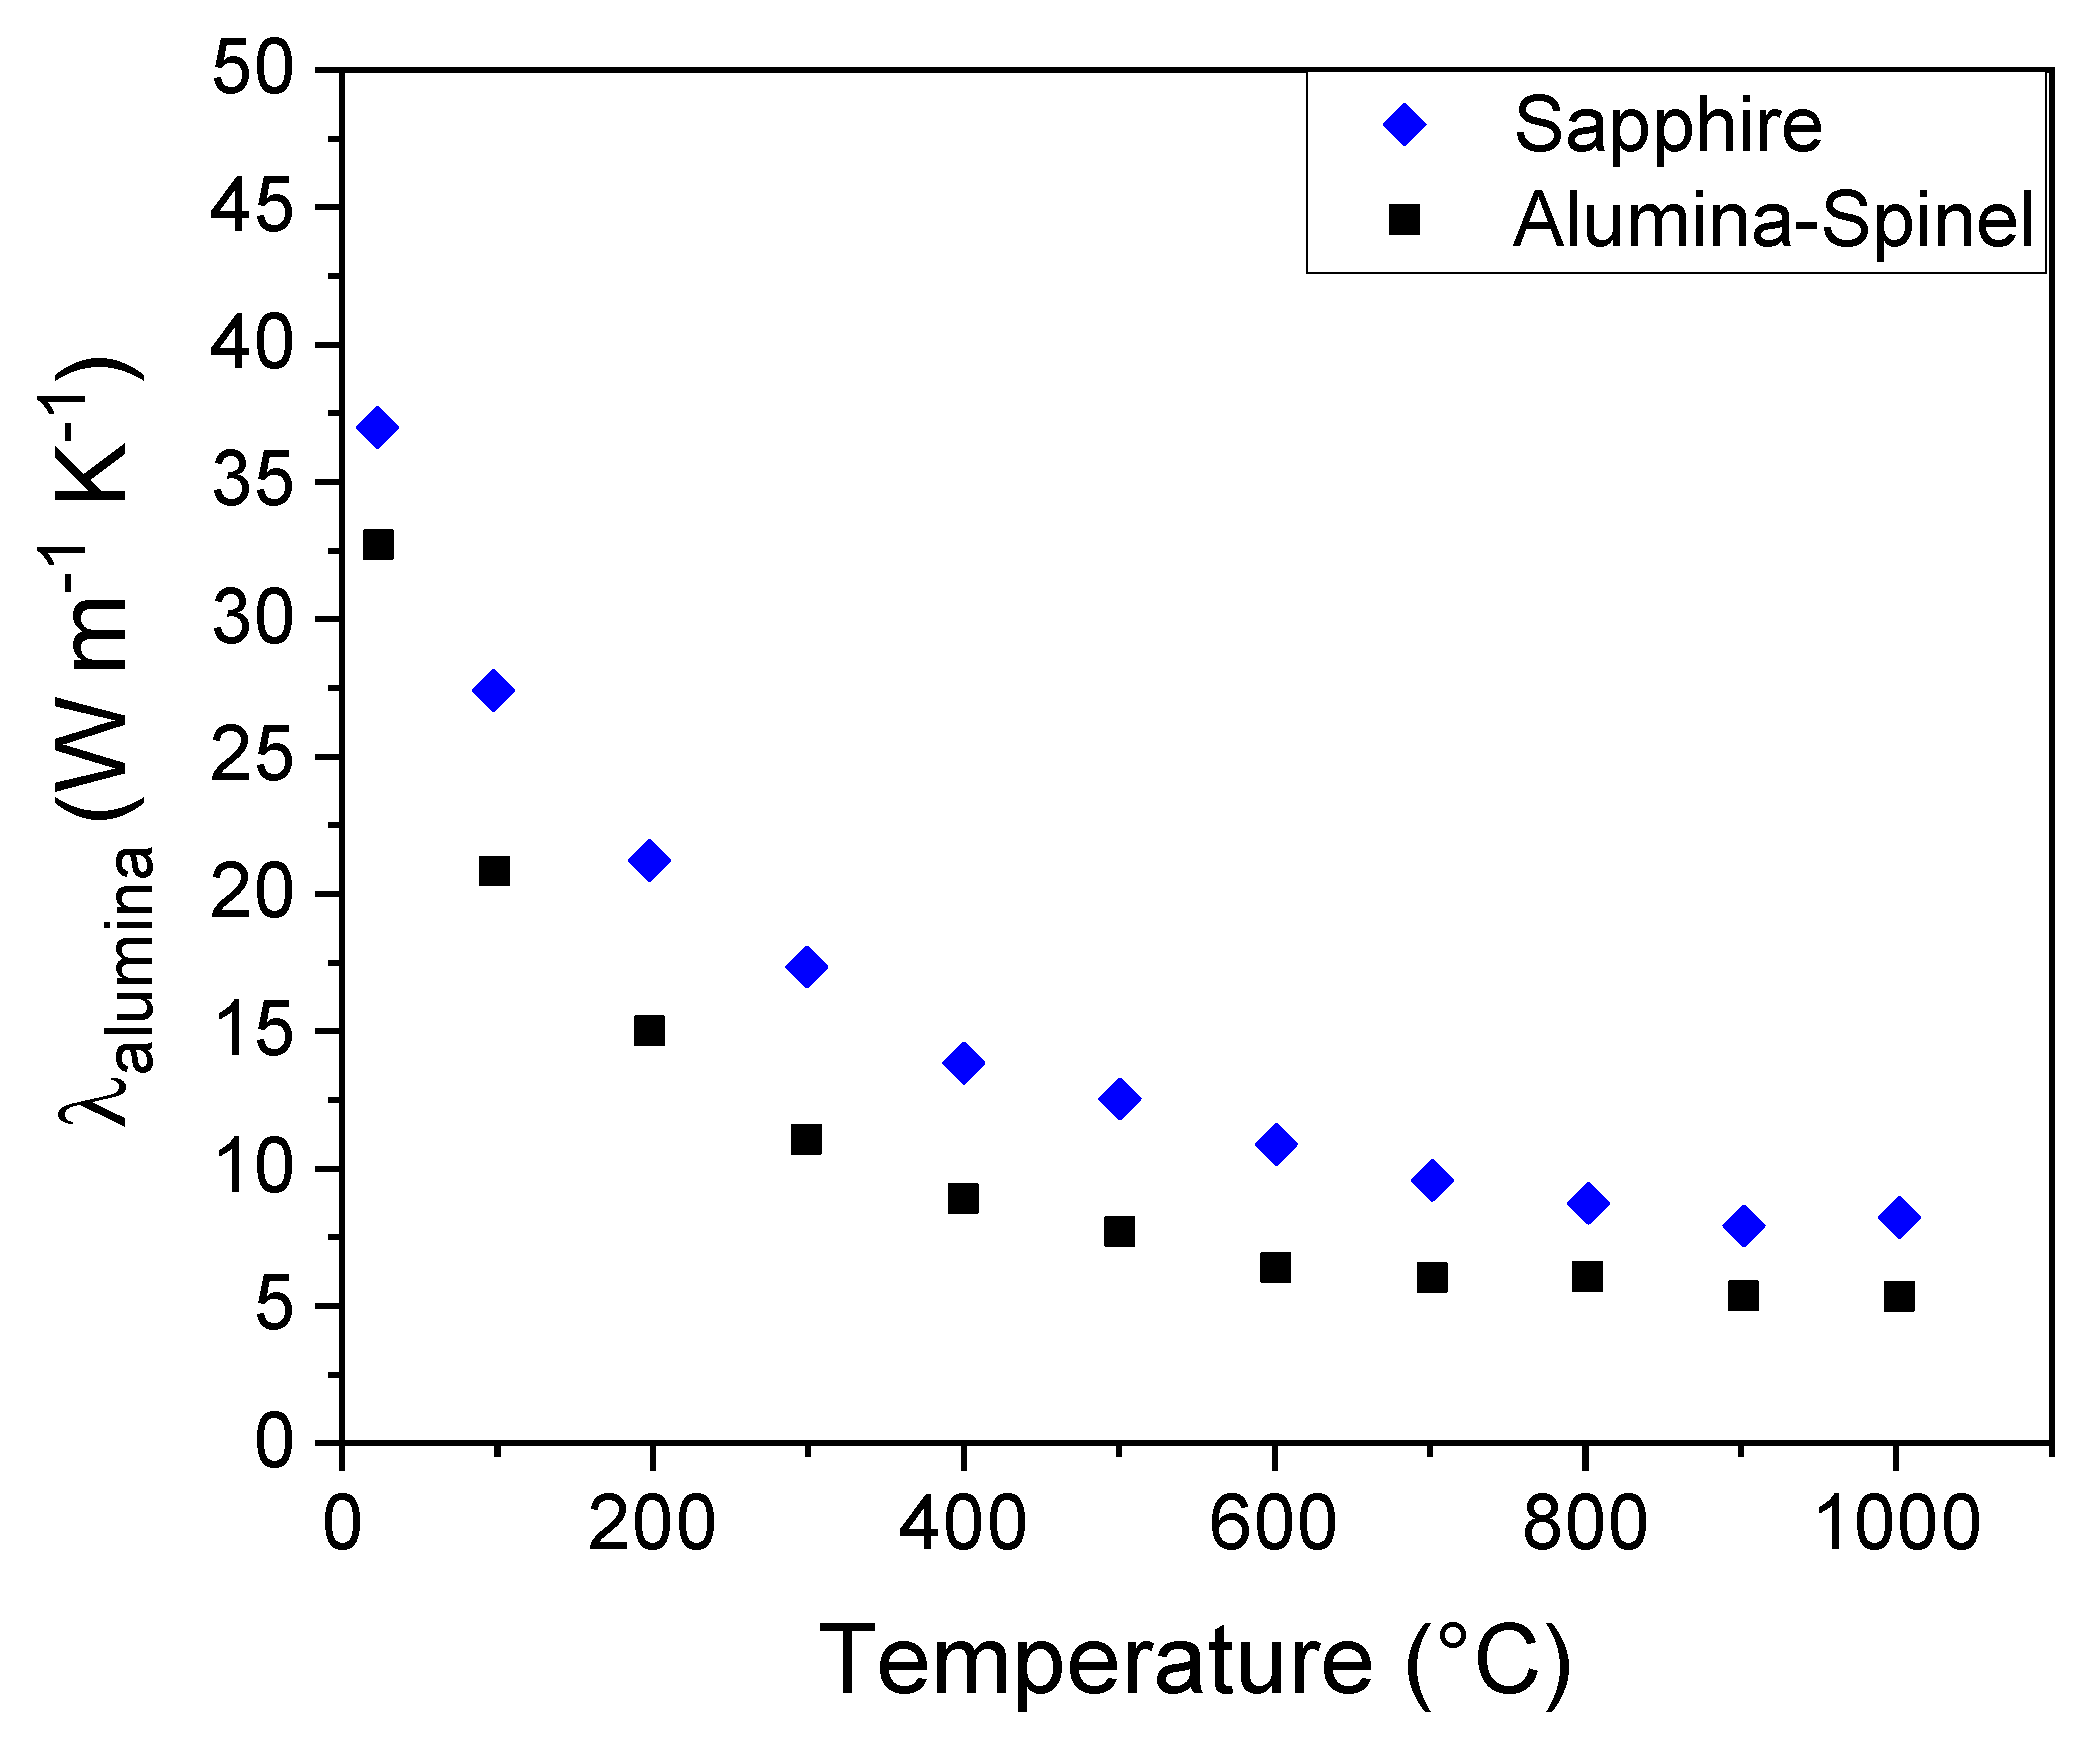

Table 1.
Summary of the porosity, average grain size and sintering temperature of five alumina-based materials: one refractory material (Alumina-Spinel) and four model materials.
Table 1.
Summary of the porosity, average grain size and sintering temperature of five alumina-based materials: one refractory material (Alumina-Spinel) and four model materials.
| Sample Designation |
Materials | Porosity (%) |
Average grain size (μm) | Sintering temperature (°C) |
|---|---|---|---|---|
| Alumina-Spinel | Refractories | 19 | - | - |
| Sapphire | Model materials |
0 | Single crystal | - |
| Alumina TM-DA | 3 | 0.15 - 0.5 | 1200 | |
| Alumina AKP30-1450 | 20 | 0.45 | 1450 | |
| Alumina AKP30-1300 | 38 | 0.30 | 1300 |
Disclaimer/Publisher’s Note: The statements, opinions and data contained in all publications are solely those of the individual author(s) and contributor(s) and not of MDPI and/or the editor(s). MDPI and/or the editor(s) disclaim responsibility for any injury to people or property resulting from any ideas, methods, instructions or products referred to in the content. |
© 2025 by the authors. Licensee MDPI, Basel, Switzerland. This article is an open access article distributed under the terms and conditions of the Creative Commons Attribution (CC BY) license (http://creativecommons.org/licenses/by/4.0/).
Copyright: This open access article is published under a Creative Commons CC BY 4.0 license, which permit the free download, distribution, and reuse, provided that the author and preprint are cited in any reuse.