
Submitted:
14 October 2025
Posted:
15 October 2025
You are already at the latest version
Abstract
Obstructive Sleep Apnea (OSA) is associated with several comorbidities, including renal dysfunction, which may improve with C-PAP therapy. Sleep fragmentation and nocturnal hypoxia in OSA have been hypothesized to contribute to carcinogenesis, particularly affecting hypoxia-sensitive urinary tract cells. The aim of the present study was to assess cancer prevalence in OSA patients and explore clinical profiles of those with urinary tract cancer. We retrospectively analyzed 50 OSA patients with cancer from the Vercelli Hospital Registry. Cancer diagnoses were collected at the time of OSA diagnosis, prior to C-PAP initiation. 70% of patients were male. Among OSA-cancer patients, 34% had urinary tract cancer (88% males, p<0.05), followed by breast (14%), colorectal (12%), lung (10%), laryngeal and skin (8%), intracranial (6%), hematologic and parotid (4%), and others (2%). 10% had multiple cancer sites. Hierarchical clustering revealed a distinct profile: urinary tract cancer associated with better respiratory indices, frequent hypertension and higher C-PAP compliance. Our findings show a higher prevalence of urinary tract cancer in male OSA patients, suggesting a possible link between OSA-related hypoxia and carcinogenesis. This supports increased clinical surveillance and further research into whether OSA is a modifiable cancer risk factor. PAP therapy may offer protective benefits.
Keywords:
Obstructive Sleep Apnea
; urinary tract cancer
; intermittent hypoxia
; chronic renal failure
; comorbidities
1. Introduction
Obstructive Sleep Apnea (OSA) can be associated with different comorbidities including metabolic, cardiovascular and renal diseases [1,2]. Some authors suggested that sleep fragmentation and nocturnal hypoxia in OSA patients may lead to carcinogenesis [3]. In particular, urinary tract cells are sensitive to hypoxia, and they might be affected by nocturnal intermittent oxygen desaturation. Decreased renal function was found to be associated with OSA, especially if other comorbidities are present [4] and previous studies on the effects of OSA treatment with Continuous Positive Airway Pressure (C-PAP) therapy have shown a slowing in renal injury [5,6] or improvements in renal function [7,8]. The association between OSA and cancer has been explored in epidemiological and clinical studies indicating that intermittent hypoxia may increase cancer risk and poses OSA as a recognized risk factor for cancer though no definitive evidence is available [9,10,11]. The aim of the present study was to assess the prevalence and distribution of neoplastic diseases in a cohort of adult patients with OSA enrolled in the Vercelli Hospital Registry from 2015, and to characterize the clinical profiles of individuals diagnosed with urinary tract malignancies.
2. Materials and Methods
2.1. Study Design and Setting
We conducted a retrospective, observational, single-center cohort study involving 50 consecutive adult patients diagnosed with OSA and coexisting cancer, enrolled from 2015 in the Vercelli Registry at the Respiratory Unit of S. Andrea Hospital (Department of Traslational Medicine, University of Eastern Piedmont). OSA diagnosis was confirmed by polysomnographic evaluation. Patients were stratified based on cancer type, with a specific focus on urinary tract malignancies versus non-urinary tract cancers, to characterize clinical profiles. All participants provided written informed consent prior to data collection and analysis. The study protocol was approved by the Institutional Ethics Committee and conducted in accordance with the principles of the Declaration of Helsinki.
2.2. Patients and Samples
Inclusion criteria consisted of adult patients (age >18 years) with a confirmed diagnosis of OSA according to the American Academy of Sleep Medicine (AASM) guidelines [12]. For each patient, we collected comprehensive anthropometric and clinical data including: age, sex, body mass index (BMI), smoking status (current or former), cardiovascular, respiratory and metabolic comorbidities, polysomnographic data at baseline including apnea-hypopnea index (AHI), oxygen desaturation index (ODI), median nocturnal oxygen saturation, time spent below 90% oxygen saturation (t90), pulmonary function testing (PFTs) assessed through spirometry. OSA diagnosis was established using overnight polysomnography (Embletta™ and Vitalnight™, Natus Medical Inc., Pleasanton, CA, USA). All patients underwent PFTs, including measurements of forced expiratory volume in one second (FEV₁), forced vital capacity (FVC), and the FEV₁/FVC ratio. Tests were performed in accordance with the American Thoracic Society/European Respiratory Society (ATS/ERS) guidelines [13]. Spirometry and maximal flow–volume curves were obtained using a pneumotachograph with volume integrator (1070 MGC; CAD/Net system; Medical Graphics Corporation, St. Paul, MN, USA) [14]. The diagnosis of neoplastic disease was retrospectively retrieved from anamnestic records in the Vercelli Hospital Registry, collected at the time of OSA diagnosis and prior to initiation any PAP therapy. For the purpose of analysis, urinary tract cancers included prostate, bladder, and kidney malignancies, based on corresponding ICD codes. Detailed clinical and demographic characteristics of the study population are summarized in Table 1.
2.3. Statistical Analysis
Descriptive statistics were performed for all variables in the cohort. Continuous variables were summarized as mean ± DS, while categorical variables were reported as absolute frequencies and percentages. Comparative analyses between groups were conducted using the Wilcoxon–Kruskal–Wallis test for non-parametric continuous data. For categorical variables, the Pearson chi-square test was applied, or the Fisher’s Exact Test when expected cell counts were below threshold. To explore latent associations and characterize clinical profiles of patients with OSA and urinary tract cancer, we performed a factorial analysis of mixed data (FAMD) for heterogeneous clinical data (i.e. tumor type, compliance, hypertension, and respiratory function indices, AHI, ODI) followed by a Multiple Correspondence Analysis (MCA). These techniques allowed for dimensionality reduction of the dataset and identification of homogeneous clinical clusters. The scree plot was used to visualize the percentage of explained variance for each component. The first three dimensions were retained for interpretation, as they collectively explained 46.43% of the total variance (Dim.1: 22.20%, Dim.2: 14.13%, Dim.3: 10.11).
3. Results
We analyzed 50 OSA patients of whom 34% (17/50) had urinary tract cancer and 66% (33/50) had other malignancies. To better characterize the cohort, patients were stratified into two subgroups: urinary tract cancer (X0) and non-urinary tract cancer (X1). The cohort was predominantly male (70%), with a mean age of 68 years. Notably, urinary tract cancers were significantly more prevalent in males (88%) than females (12%) (p = 0.043).
The mean BMI was 29, indicating overweight status, and 75% of patients were current or former smokers, with no significant differences between groups. Cardiovascular comorbidities were present in 90% of patients, including hypertension, arrhythmias, ischemic heart disease, and hypercholesterolemia. This aligns with known bidirectional associations between OSA and cardiovascular disease, although no significant differences were observed between subgroups.
All patients had moderate-to-severe OSA (AHI >15), with a mean AHI of 32. No significant differences were found between groups in baseline OSA indices (AHI, ODI, t90), and mean nocturnal oxygen saturation was 93%. Most patients (76%) were treated with C-PAP, but the retrospective design limits conclusions on its impact on cancer progression.
Pulmonary function tests revealed no airway obstruction (mean FEV₁/FVC = 81%). Mean predicted FEV₁ was 2.5 L/sec (88%) and FVC was 3.1 L/sec (87%). Patients with non-urinary cancers showed a mild but significant reduction in FEV₁ and FVC (p = 0.010 and 0.006), likely due to thoracic surgeries in lung cancer cases.
Cancer types included genitourinary tract (34%, mainly prostate), breast (14%), colorectal (12%), lung (10%), laryngeal and skin (8% each), intracranial (6%), hematologic and parotid (4% each), and others (2%) (Figure 1). Interestingly, 10% of patients presented more than one site neoplasia, i.e., prostate and skin basal cell carcinoma, or prostate and colorectal cancer suggesting a possible oncological vulnerability in this population. (Figure 2).
The FAMD revealed a distinct profile associated with genitourinary cancer in OSA patients. Specifically, the first three factorial dimensions grouped patients with urinary tract malignancies, suggesting a strong association between OSA and genitourinary cancer. (Figure 3). We visualized the distribution of both variables and individuals across these dimensions to identify meaningful clinical clusters and the resulting dendrogram suggested a two-cluster result, which was confirmed by visual inspection of the factor map: Cluster 1 included patients with non-urinary cancer (X0), characterized by lower respiratory function, reduced C-PAP compliance, and higher prevalence of pulmonary tumors; Cluster 2 grouped patients with urinary cancer (X1), showing better respiratory indices, higher compliance to C-PAP therapy, male sex, and frequent comorbid hypertension. This stratification allowed us to distinguish clinically meaningful profiles and supported the hypothesis of a specific association between OSA and genitourinary malignancies. (Figure 4).
4. Discussion
In this study, we investigated the prevalence and distribution of neoplasms in OSA patients with a particular focus on genitourinary tract cancer. Our multivariate analysis revealed a significantly higher prevalence of urinary tract malignancies among male patients with moderate-to-severe OSA (34%), compared to only 12% in females (p < 0.001). This subgroup was predominantly composed of overweight individuals (mean BMI: 39), with a high proportion of current or former smokers (75%) and co-affected by cardiovascular comorbidities, particularly hypertension (100%).
The relationship between OSA and cancer has been explored with increasing attention in recent years. Epidemiological studies suggest that OSA may influence not only cancer incidence but also tumor type and aggressiveness [9,15,16]. However, meta-analyses exploring the association between OSA and overall cancer risk have yielded conflicting results, likely due to heterogeneity in cancer types and OSA severity across cohorts [17,18]. Recent research suggested an association between OSA and a higher risk of kidney and bladder cancer [19].
Experimental evidence supports the role of intermittent hypoxia—a hallmark of OSA—as a key driver of tumorigenesis. Hypoxia-inducible factors (HIF-1α and HIF-2α) are upregulated under intermittent hypoxic conditions and have been implicated in the progression of bladder, prostate, and renal cancers [20,21,22]. In clear cell renal cell carcinoma, the loss of von Hippel-Lindau tumor suppressor proteins exacerbates HIF accumulation, promoting angiogenesis and tumor growth [23]. Additionally, intermittent hypoxia may increase VEGF and NF-κB expression, further enhancing pro-angiogenic and inflammatory pathways [24].
Beyond hypoxia, sleep fragmentation—another core feature of OSA—activates the sympathetic nervous system, leading to increased production of reactive oxygen species (ROS) and immune dysregulation [25,26,27]. These mechanisms collectively contribute to chronic inflammation, impaired immune surveillance, and enhanced tumor proliferation and angiogenesis [28,29].
Our findings align with previous reports suggesting that urinary tract tissues are particularly sensitive to intermittent hypoxia and oxygen desaturation during sleep [30]. Repetitive airway obstruction and nocturnal hypoxia may trigger systemic pathophysiological responses that promote carcinogenesis. Several studies have also linked short sleep duration and poor sleep quality to increased cancer risk [3,31,32]. Recent meta-analysis confirmed a correlation between OSA severity and cancer incidence, reinforcing the hypothesis that chronic intermittent hypoxia may contribute to tumor initiation and progression [31,32].
In our cohort, breast cancer (14%) and colorectal cancer (12%) were also frequently observed. These findings are consistent with data from the ESADA study, which reported a higher prevalence of breast and urinary tract cancers in OSA patients [3]. However, a notable divergence emerged in gender distribution: while ESADA found increased cancer prevalence in European females with OSA and nocturnal hypoxia, our registry data revealed a predominance of urinary tract cancers in males. This discrepancy may reflect population-specific differences or methodological variations in OSA characterization.
Interestingly, 10% of OSA patients with cancer in our cohort presented with multiple primary neoplasms, such as prostate and colorectal cancer or prostate and skin basal cell carcinoma. This observation raises the possibility of a broader oncological vulnerability in OSA patients, particularly those with genitourinary involvement.
Finally, our analysis showed a clear separation between two groups of patients: the non-genitourinary group of patients (e.g. lung, breast, colorectal) characterized by more compromised respiratory function, lower adherence to C-PAP therapy, and a higher incidence of lung neoplasm and the genitourinary group with better respiratory indices, high compliance with C-PAP, and frequently coexisting cardiovascular comorbidities. This supports the hypothesis of a different cancer distribution in OSA patients, potentially linked to underlying pathophysiological mechanisms.
Taken together, our data support the hypothesis of a bidirectional relationship between OSA and cancer, with intermittent hypoxia and sleep fragmentation acting as potential mediators of tumorigenesis. Further studies are warranted to clarify the impact of OSA on cancer incidence, progression, and outcomes—particularly in genitourinary malignancies—and to assess whether positive airway pressure (PAP) therapy may mitigate these risks [3,33].
Understanding the differential impact of OSA on specific cancer types may inform targeted surveillance strategies and improve risk stratification in clinical practice.
The main limitation of the present study is the relatively small sample size of the group which may reduce the statistical power and generalizability of the findings. Adjustment was not made for important confounders of cancer risk, such as genetic predisposition, physical activity levels, occupational exposures, and dietary habits. Importantly, we did not observe a statistically significant association between OSA and cancer in female patients. This contrasts with findings from larger cohorts, such as the ESADA study, which reported a higher cancer prevalence in women with OSA and nocturnal hypoxia. The discrepancy may be explained by several factors, including cancer subtype distribution, hormonal influences on tumor biology and immune modulation, gender-specific patterns of smoking and environmental exposure, which were not evaluated. Moreover, our study did not assess cancer incidence rates, limiting our ability to determine whether OSA is associated with an increased risk of developing cancer over time. Longitudinal studies are needed to clarify whether OSA contributes to cancer onset, progression, or mortality, particularly in relation to genitourinary neoplasm. Future research should aim to include larger, gender-balanced cohorts, incorporate prospective designs, and adjust for lifestyle and genetic factors to better elucidate the potential causal relationship between OSA and cancer incidence.
5. Conclusions
Our results are consistent with a higher prevalence of urinary tract and breast cancer in OSA patients. In particular, in our study, a significant increase in prevalence of urinary tract cancer was seen in male patients; a hierarchical clustering analysis revealed a distinct profile: urinary tract cancer associated with better respiratory indices, frequent hypertension and higher C-PAP compliance. this data requires further studies to evaluate if there is an interlink between sleep apneas, night hypoxia, sleep fragmentation and urinary tract carcinogenesis. This may have also therapeutical implications that need to be addressed (i.e., PAP therapy effects). Studies on incidence and different cancer sites are required to clarify if there is a bidirectional link with OSA and cancer; OSA, in fact, may represent a risk factor for cancer, and, on the other hand, cancer may lead to the development of OSA (i.e., breast cancer, for hormonal suppression). If these data will be confirmed, then it would be very important to assess the effects of OSA treatment.
Author Contributions Conceptualization, B.R. and P.P.; methodology, P.P.; software, D.A.; validation, B.R., P.P., F.C., and D.A.; formal analysis, D.A.; investigation, B.R.; resources, P.P.; data curation, B.R., P.P., F.C., and D.A.; writing—original draft preparation, B.R., P.P., F.C. and M.M.; writing—review and editing, M.M.; visualization, B.R.; supervision, M.M. All authors have read and agreed to the published version of the manuscript.
Funding
This research received no external funding
Institutional Review Board Statement
The study was conducted in accordance with the Declaration of Helsinki, and the protocol was approved by the Institutional Review Board CE 67/20.
Informed Consent Statement
Informed consent was obtained from all subjects involved in the study.
Data Availability Statement
Dataset is available upon reasonable request
Conflicts of Interest
The authors declare no conflicts of interest.
References
- Gleeson M, McNicholas W.T. Bidirectional relationships of comorbidity with obstructive sleep apnoea. Eur Respir Rev 2022; 31: 210256. [CrossRef]
- Bonsignore, M. R, Baiamonte P, et al. Obstructive sleep apnea and comorbidities: a dangerous liaison. Respiratory Medicine 2019; 14:8. [CrossRef]
- Pataka A, Bonsignore MR, et al. OSA and cancer prevalence – data from the ESADA study. ERJ. 2019, 20 June: 53(6). pii: 1900091. [CrossRef]
- Loffler K, Heeley E, et al. Effect of Obstructive Sleep Apnea treatment on renal function in patients with cardiovascular disease. Am J Respir Crit Care Med 2017. [CrossRef]
- Nicholl DDM, Ahmed SB, et al. Declining kidney function increases the prevalence of sleep apnea and nocturnal hypoxia. Chest 2012; 141: 1422–1430.
- Marrone O, Cibella F, et al. Estimated glomerural filtration rate (Egfr) changes after obstructive sleep apnea (OSA) treatment by positive air way pressure: data from the European Sleep Apnea Database (ESADA). Eur Respir J 2017 50:PA4733. [CrossRef]
- Pochetti P, Azzolina D, et al. Interrelationship among Obstructive Sleep Apnea, Renal Function and Survival: A cohort Study. Int J Environ Res Public Health 2020,17,4922. [CrossRef]
- Marrone O, Cibella F, et al. Fixed But Not Autoadjusting Positive Airway Pressure Attenuates the Time-Dipendent Decline in Glomerular Filatration Rate in Patients with OSA. Chest 2018. [CrossRef]
- Tan BKJ, Teo YH, et al. Association of obstructive sleep apnea and nocturnal hypoxemia with all-cancer incidence and mortality: a systematic review and meta-analysis. Journal of Clinical Sleep Medicine. 2022;18(5):1301–1310. [CrossRef]
- Cheng L, Guo H et al. Obstructive sleep apnea and incidence of malignant tumors: a metaanalysis. Sleep Medicine. 2021; 84-195e204.
- Gislason T, Gudmundsson EF et al. Obstructive sleep apnea and cancer- A nationwide epidemiological survey. European Respiratory Journal. 2016; 48: PA341; [CrossRef]
- Kapur, V.K.; Auckley, D.H.; et al. Clinical Practice Guideline for Diagnostic Testing for Adult Obstructive Sleep Apnea: An American Academy of Sleep Medicine Clinical Practice Guideline. J. Clin. Sleep Med. 2017, 13, 479–504. [Google Scholar] [CrossRef] [PubMed]
- Stanojevic, S.; Kaminsky, D.A.; et al. ERS/ATS technical standard on interpretive strategies for routine lung function tests. Eur. Respir. J. 2022, 60, 2101499. [Google Scholar] [CrossRef] [PubMed]
- Graham, B.L.; Steenbruggen, I.; et al. Standardization of spirometry 2019 update. An official American Thoracic Society and European Respiratory Society technical statement. Am. J. Respir. Crit. Care Med. 2019, 200, e70–e88. [Google Scholar] [CrossRef] [PubMed]
- Gozal D, Ham SA, et al. Sleep apnea and cancer: analysis of a nationwide population sample. Sleep. 2016;39(8):1493–1500.
- Almendros I, Gozal D. Intermittent hypoxia and cancer: elucidating the links and the therapeutic implications. Am J Respir Crit Care Med. 2018;198(5):618–620.
- Zhang X, Liu Y, et al. Obstructive sleep apnea and cancer risk: a systematic review and meta-analysis. Sleep Breath. 2020;24(3):1031–1038.
- Wang X, Ouyang Y, et al. Obstructive sleep apnea and cancer risk: a meta-analysis of cohort studies. Eur J Cancer Care. 2021;30(1):e13380.
- Yeo B.S.Y., Yap D.V.T., et al. The Association of Obstructive Sleep Apnea with Urological Cancer Incidence and Mortality—A Systematic Review and Meta-analysis. European Urology Focus, 2024, 10; 958-71. [CrossRef]
- Semenza GL. Hypoxia-inducible factors in physiology and medicine. Cell. 2012;148(3):399–408.
- Rankin EB, Giaccia AJ. Hypoxic control of metastasis. Science. 2016;352(6282):175–180.
- Krock BL, Skuli N, et al. Hypoxia-induced angiogenesis: good and evil. Genes Cancer. 2011;2(12):1117–1133.
- Kaelin WG Jr. The von Hippel-Lindau tumor suppressor protein and clear cell renal carcinoma. Clin Cancer Res. 2007;13(2 Pt 2):680s–684s.
- Gozal D, Almendros I, et al. Sleep apnea and cancer: the role of intermittent hypoxia and inflammation. Eur Respir J. 2014;44(5):1214–1227.
- Lavie L. Oxidative stress in obstructive sleep apnea and intermittent hypoxia—revisited—the bad ugly and good: implications to the heart and brain. Sleep Med Rev. 2015;20:27–45.
- Ryan S, Taylor CT, et al. Selective activation of inflammatory pathways by intermittent hypoxia in obstructive sleep apnea syndrome. Circulation. 2005;112(17):2660–2667.
- Yuan F, Hu Y, et al. A review of obstructive sleep apnea and lung cancer: epidemiology, pathogenesis, and therapeutic options. Front Immunol. 2024;15:1374236.
- Almendros I, Montserrat JM, et al. Intermittent hypoxia enhances cancer progression in a mouse model of sleep apnea. Am J Respir Crit Care Med. 2012;186(12):1235–1241.
- Cairns RA, Harris IS, et al. Regulation of cancer cell metabolism. Nat Rev Cancer. 2011;11(2):85–95.
- Srivali N, De Giacomi F. Does CPAP increase or protect against cancer risk in OSA: a systematic review and meta-analysis. Sleep Breath. 2025;29:175.
- Fang Y, Hu Y, et al. Obstructive sleep apnea and lung cancer: pathophysiological mechanisms and clinical implications. Front Immunol. 2024;15:1374236.
- Martinez-Garcia MA, Campos-Rodriguez F, et al. Cancer and obstructive sleep apnea: current evidence and future perspectives. Am J Respir Crit Care Med. 2021;203(1):11–20.
- Cao J, Wang Y, et al. Association between obstructive sleep apnea and cancer: a systematic review and meta-analysis. Sleep Med. 2022;91:1–9.
- Gozal D, Almendros I. The impact of CPAP therapy on cancer risk in OSA patients: myth or reality? Sleep Med Rev. 2023;62:101589.
Figure 1.
Distribution of cancer types among OSA patients by subgroup. Different neoplasms (e.g., lung, thyroid, parotid, laryngeal, intracranial, stomach) are well represented only in the X0 and combined groups, with total absence in the X1 group, suggesting a distinct clinical distribution. Notably, skin, breast, and colorectal cancers show overlapping presence in both X0 and X1 groups, suggesting shared clinical features. The X1 group displays a higher % in skin cancer, possibly reflecting distinct pathophysiological or demographic patterns. Data are expressed as percentage. X0 = non urinary tract cancer; X1= urinary tract cancer.
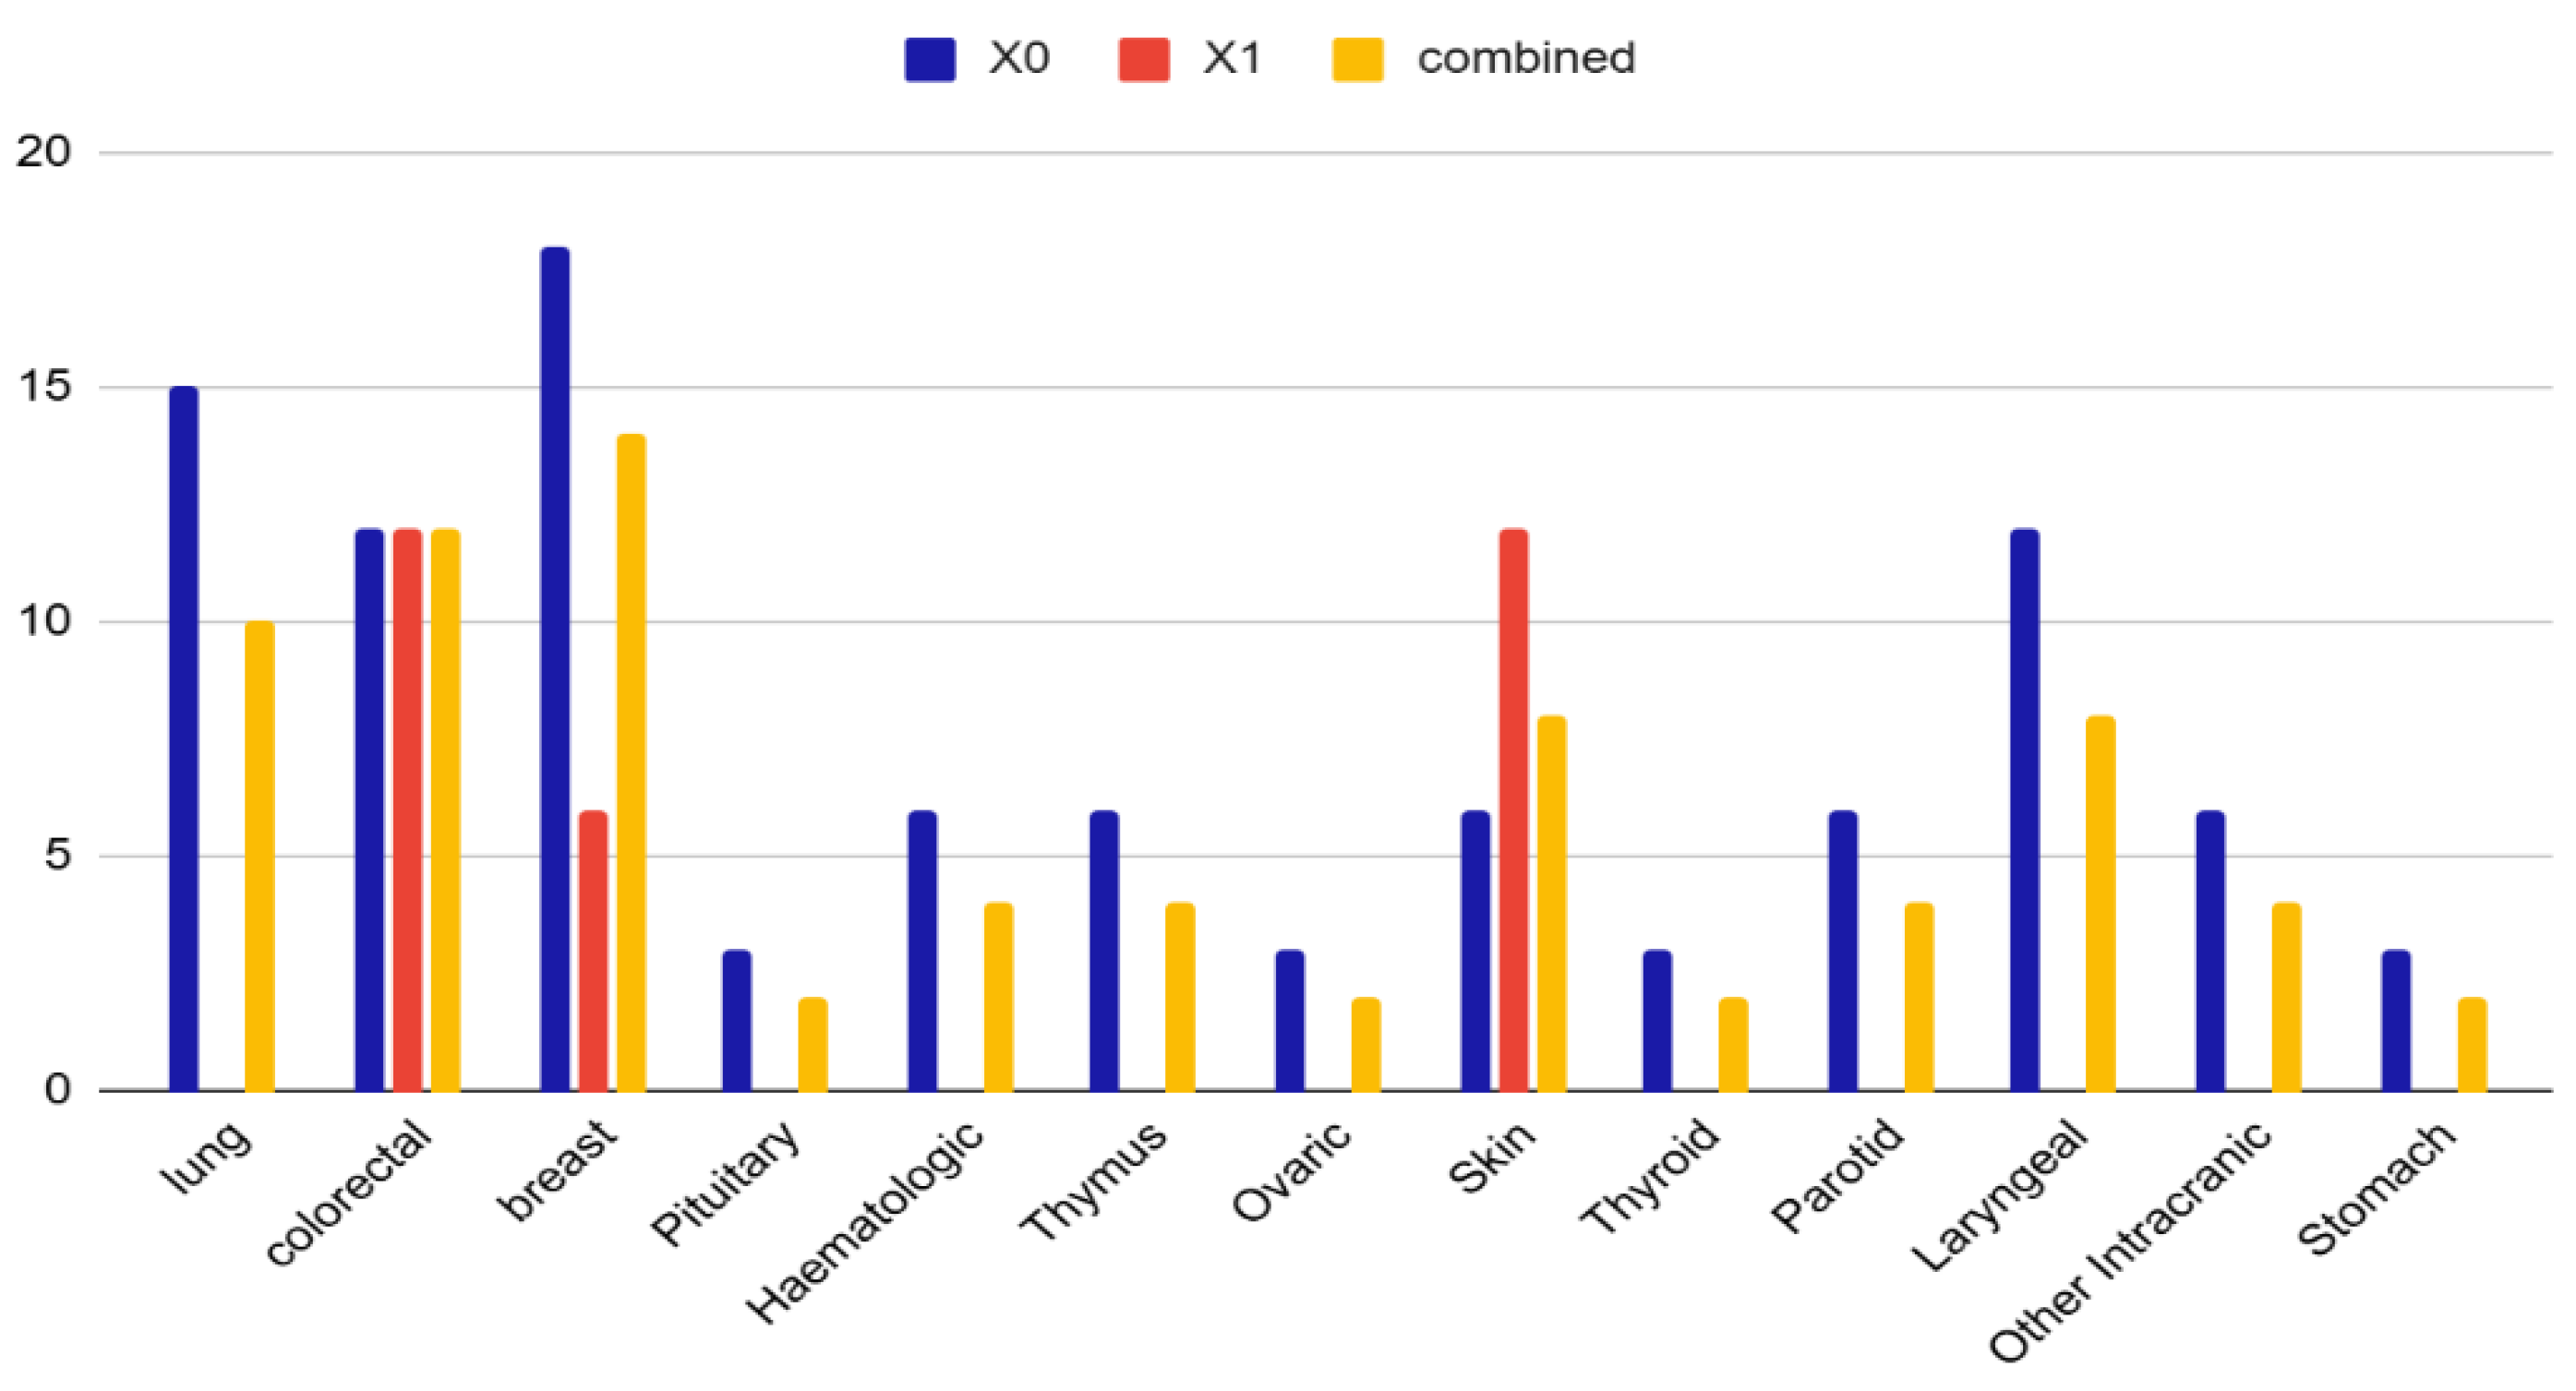
Figure 2.
Distribution of cancer site multiplicity in OSA patients by cancer type. Proportion of patients with a single cancer site (blue) versus multiple cancer sites (orange) across three categories: non-genitourinary cancers (X0), genitourinary cancers (X1), and the total cohort. Only patients in the X1 group presented a significant proportion of multiple neoplasms (~25%). In the overall cohort, single-site cancers accounted for 95%, while multiple-site cancers represented 10%, suggesting a possible oncological vulnerability in OSA patients with genitourinary malignancies (p=0.001). Data are expressed as percentage. X0 = non urinary tract cancer; X1= urinary tract cancer.
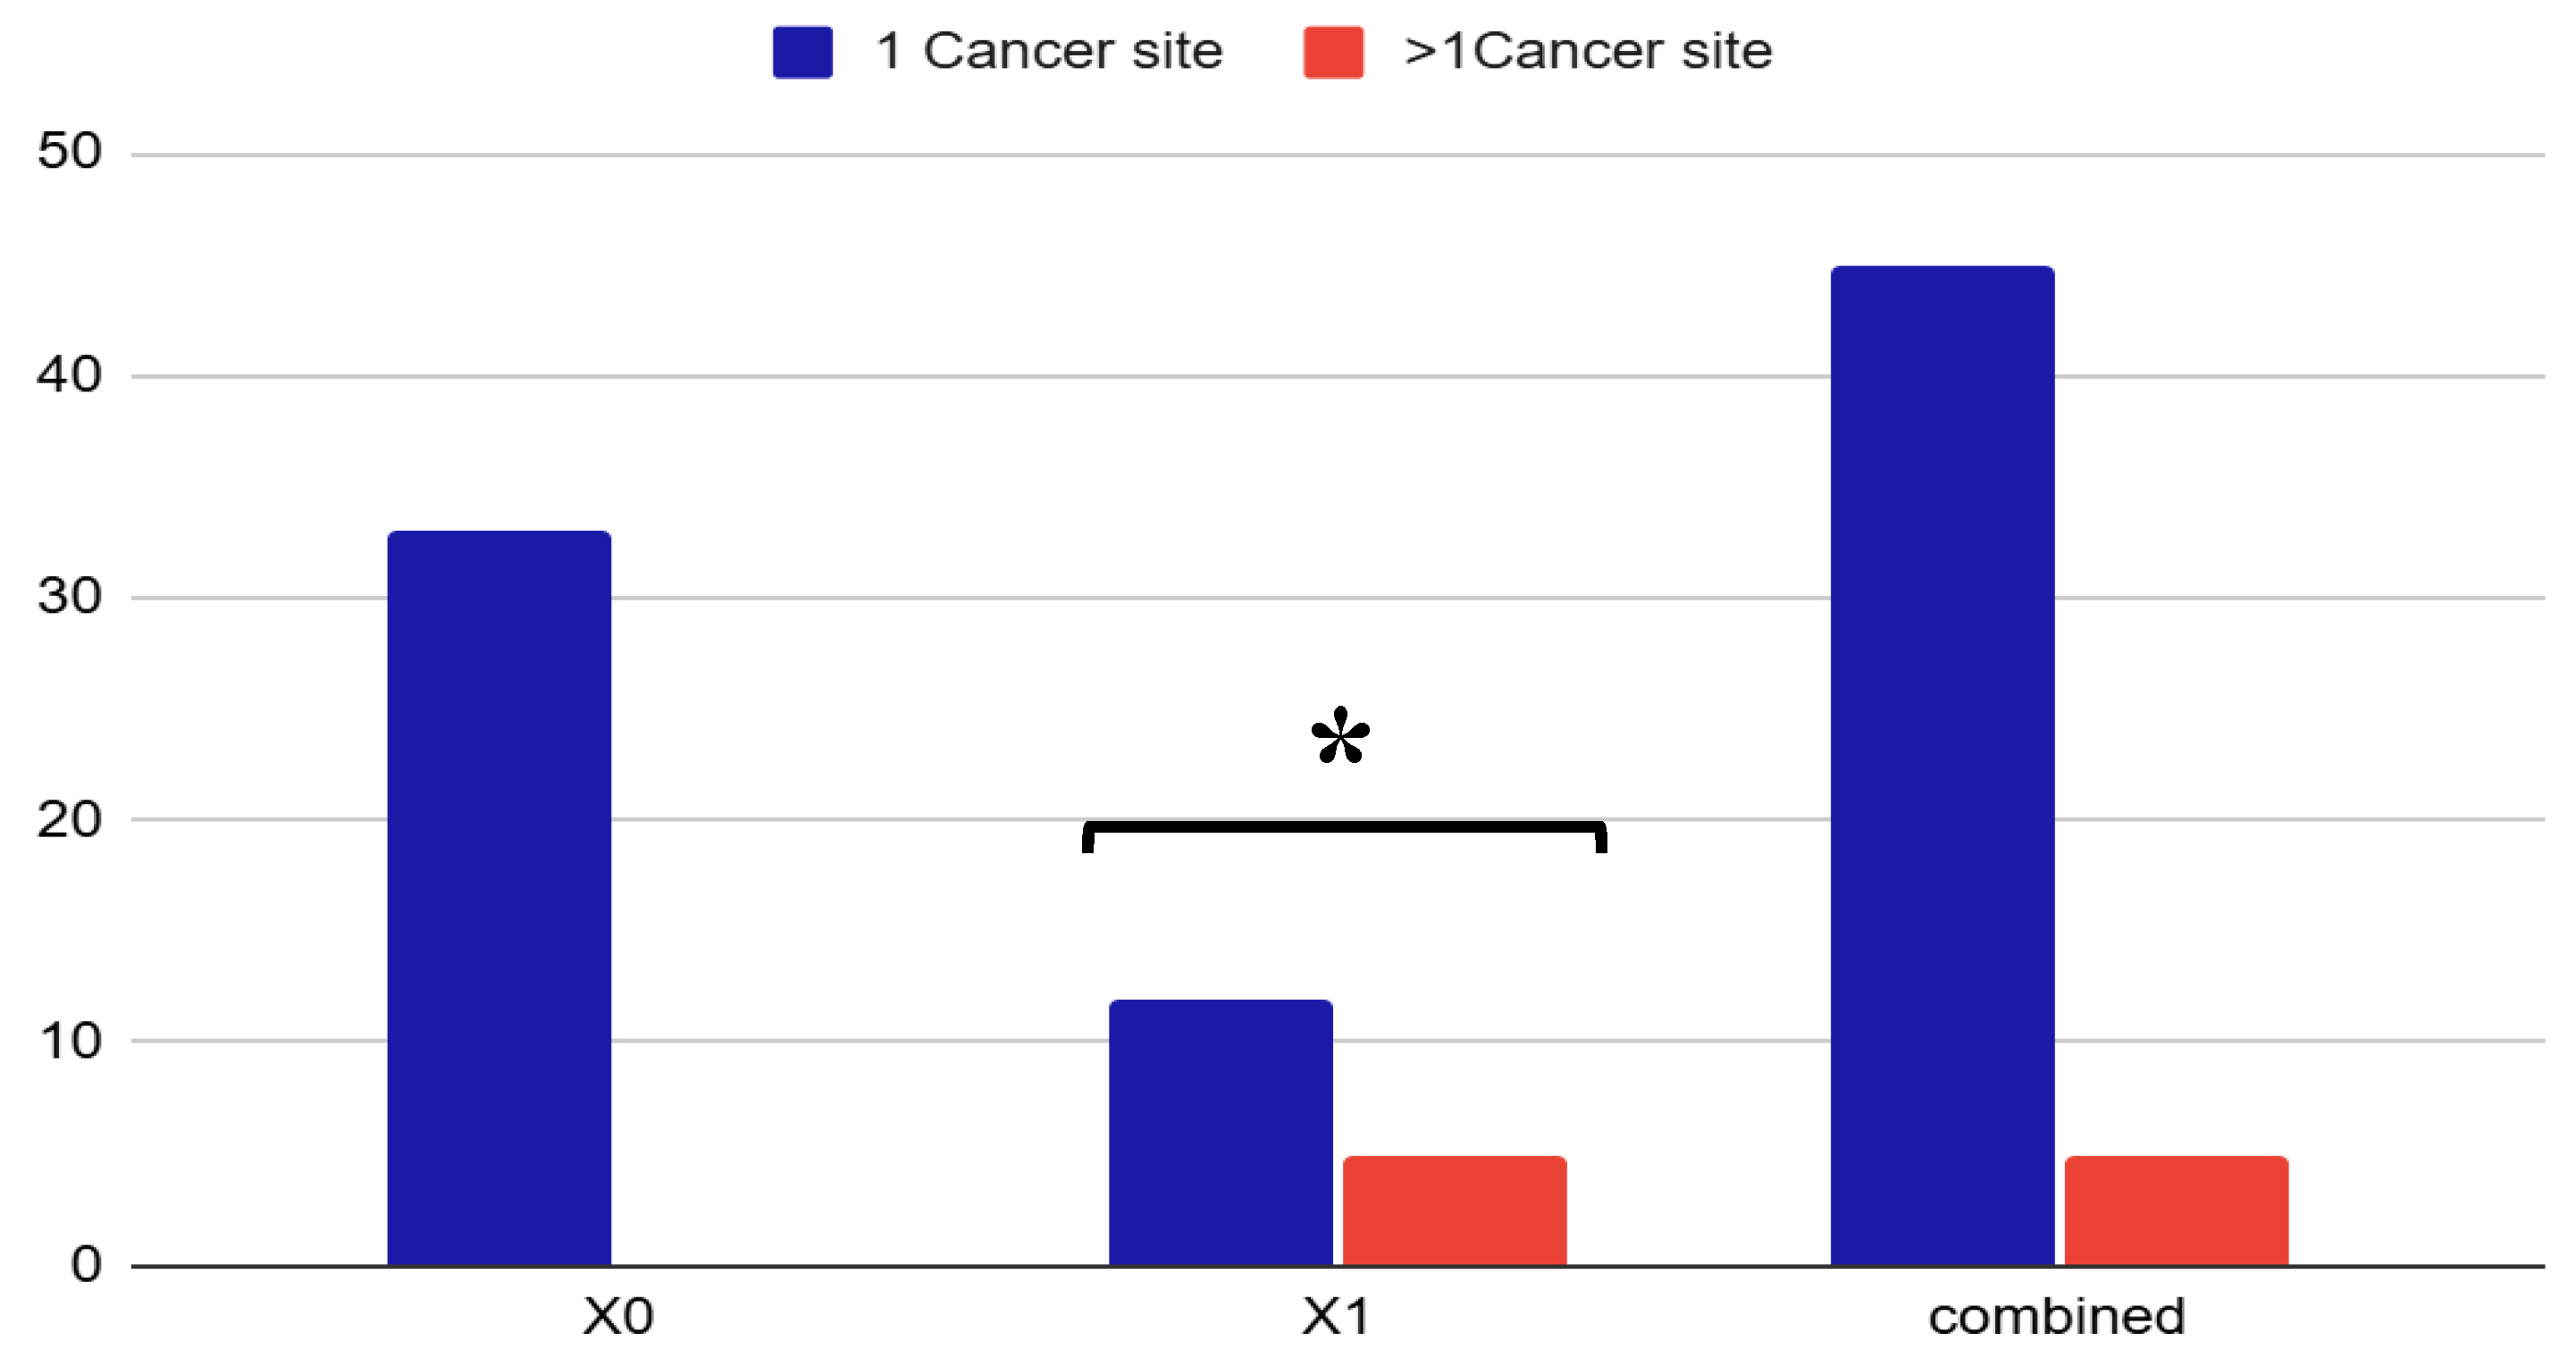
Figure 3.
Scree plot of the FAMD analysis. The graph shows the distribution of the variance explained by each component. The first three dimensions explain 46.43% of the total variability. Dimension 1 is strongly influenced by respiratory variables (FEV1, FVC, AHI, ODI) and age. Dimension 2 is associated with gender, allergies, BMI. Genitourinary cancer (X1) is well represented on Dim.1 and Dim.2.
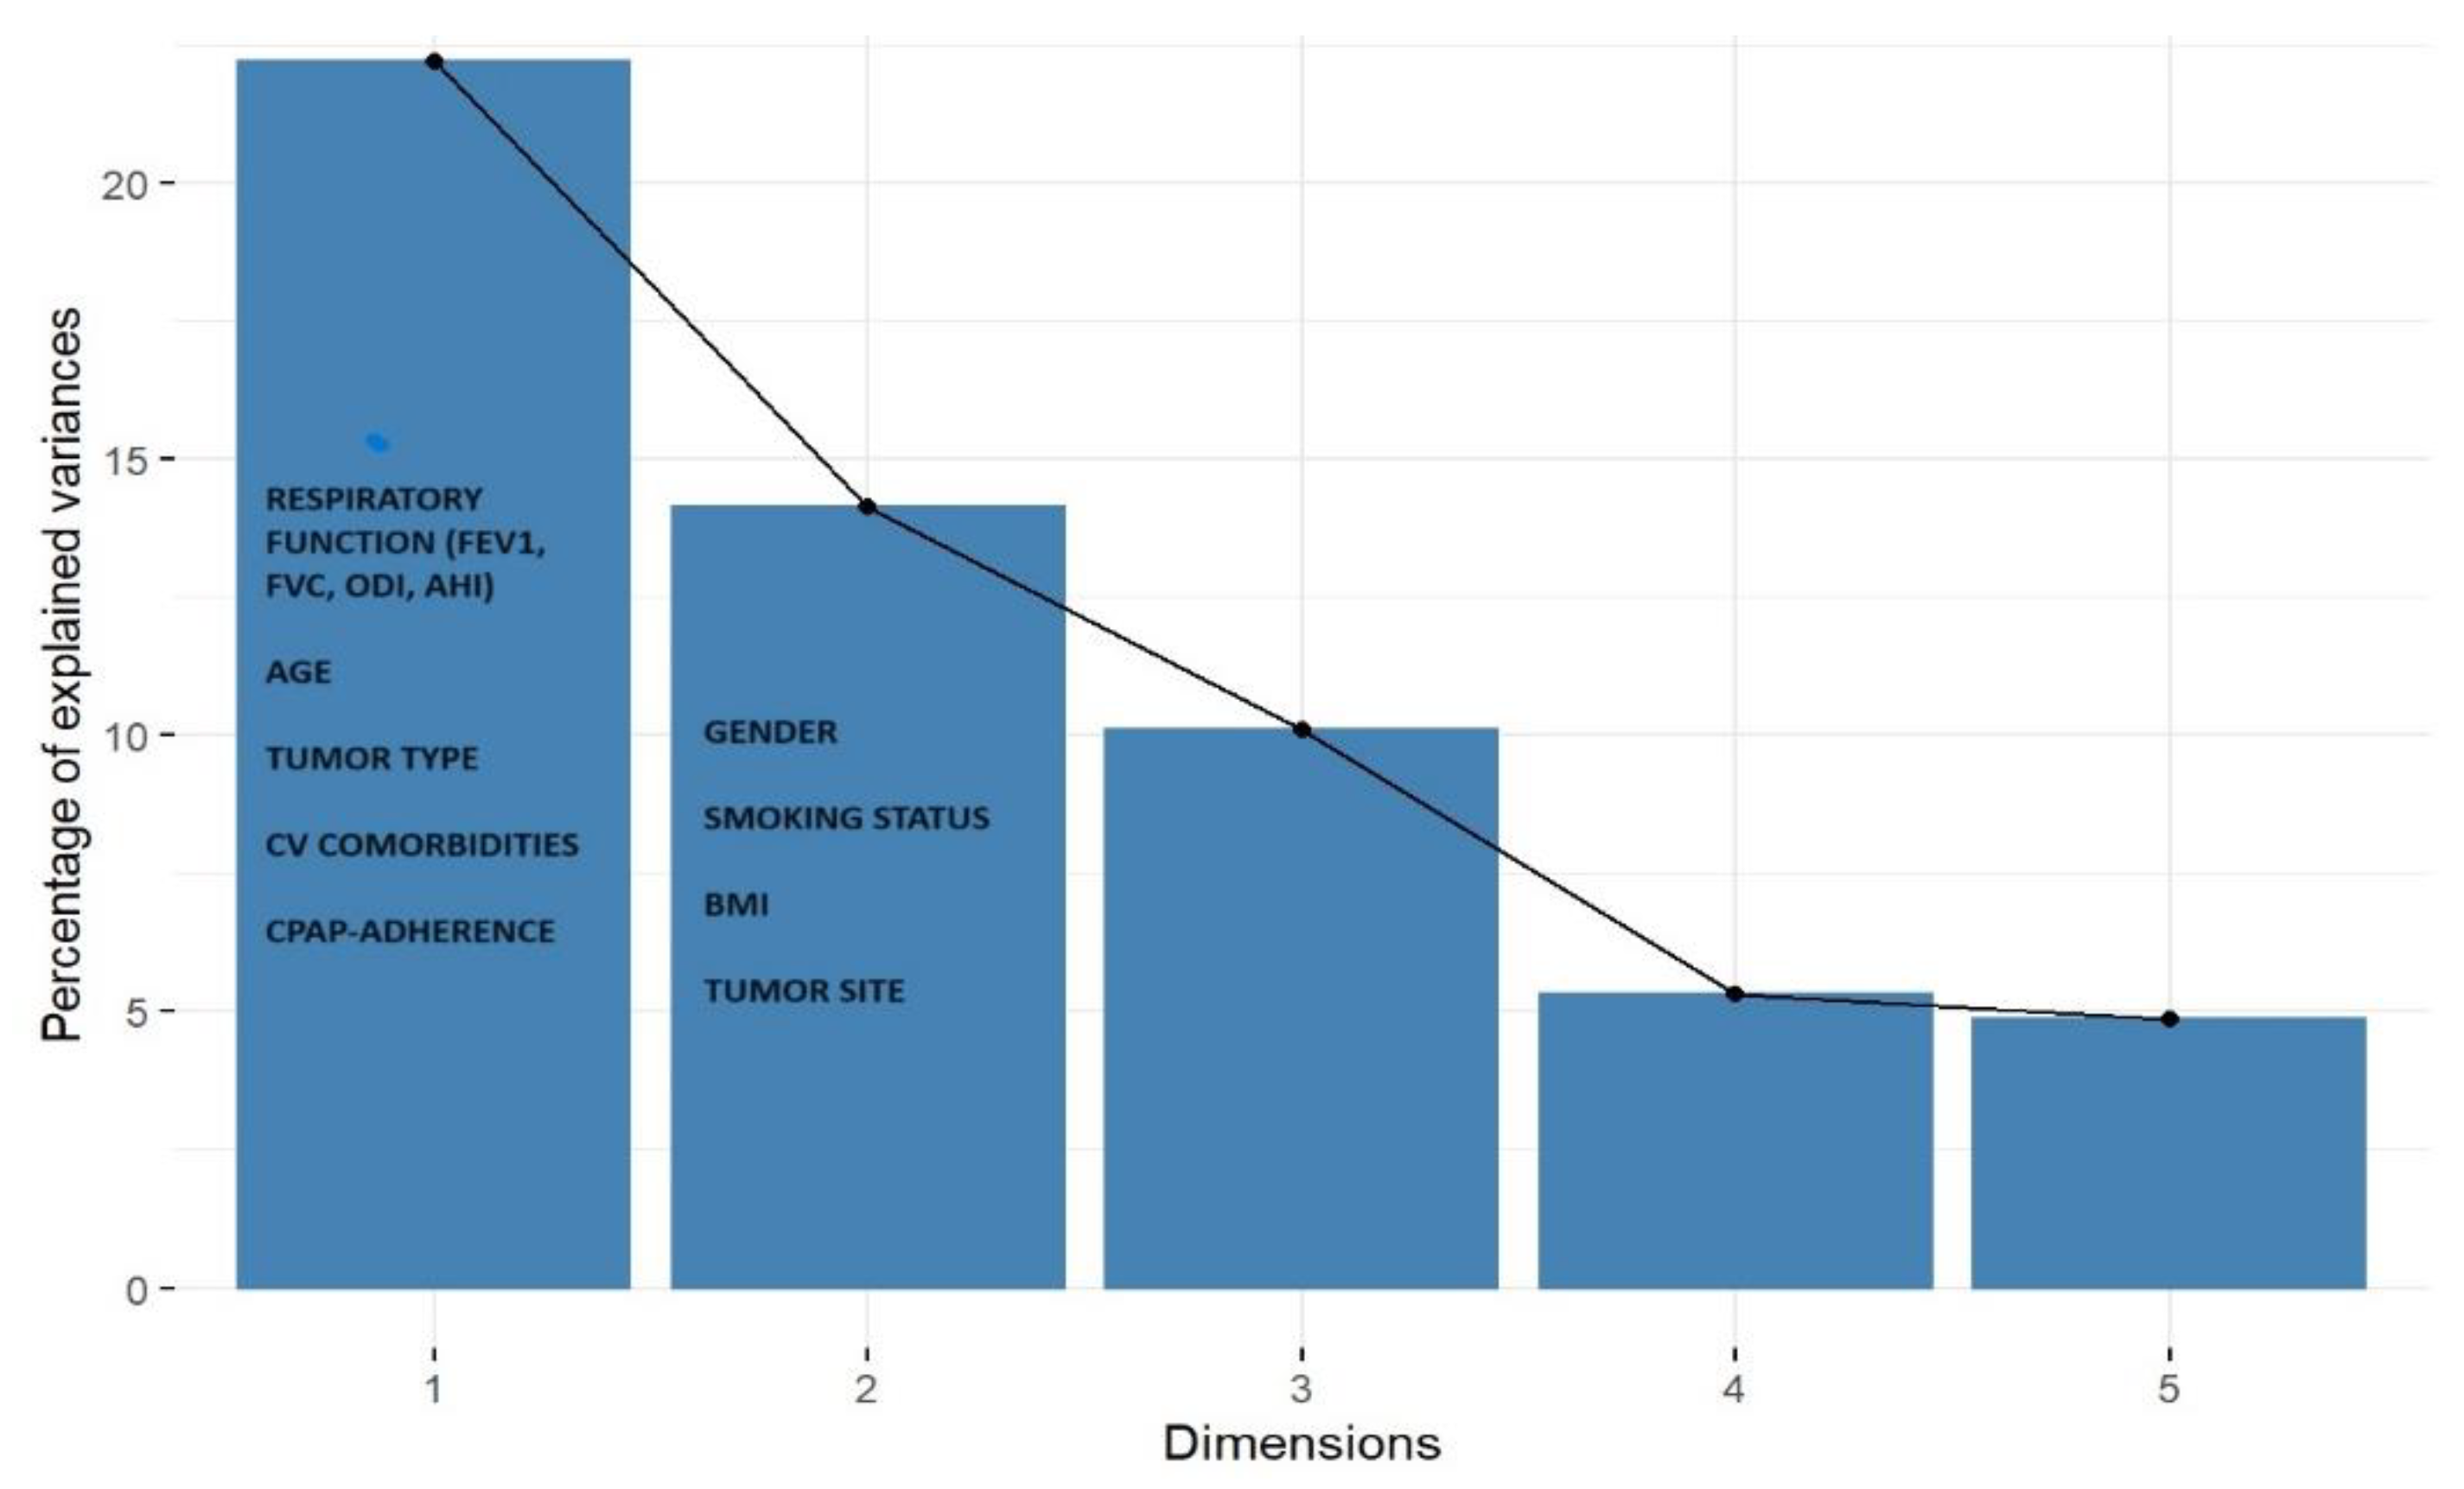
Figure 4.
Factor map of patients with OSA, distributed according to the first two dimensions of the FAMD analysis. The black points (Cluster 1) represent patients without urinary cancer (X0) while red points (Cluster 2) represent patients with urinary cancer (X1). The separation between the clusters highlights distinct clinical profiles, with Cluster 2 associated with hypertension, male sex, positive C-PAP compliance, and preserved respiratory function.
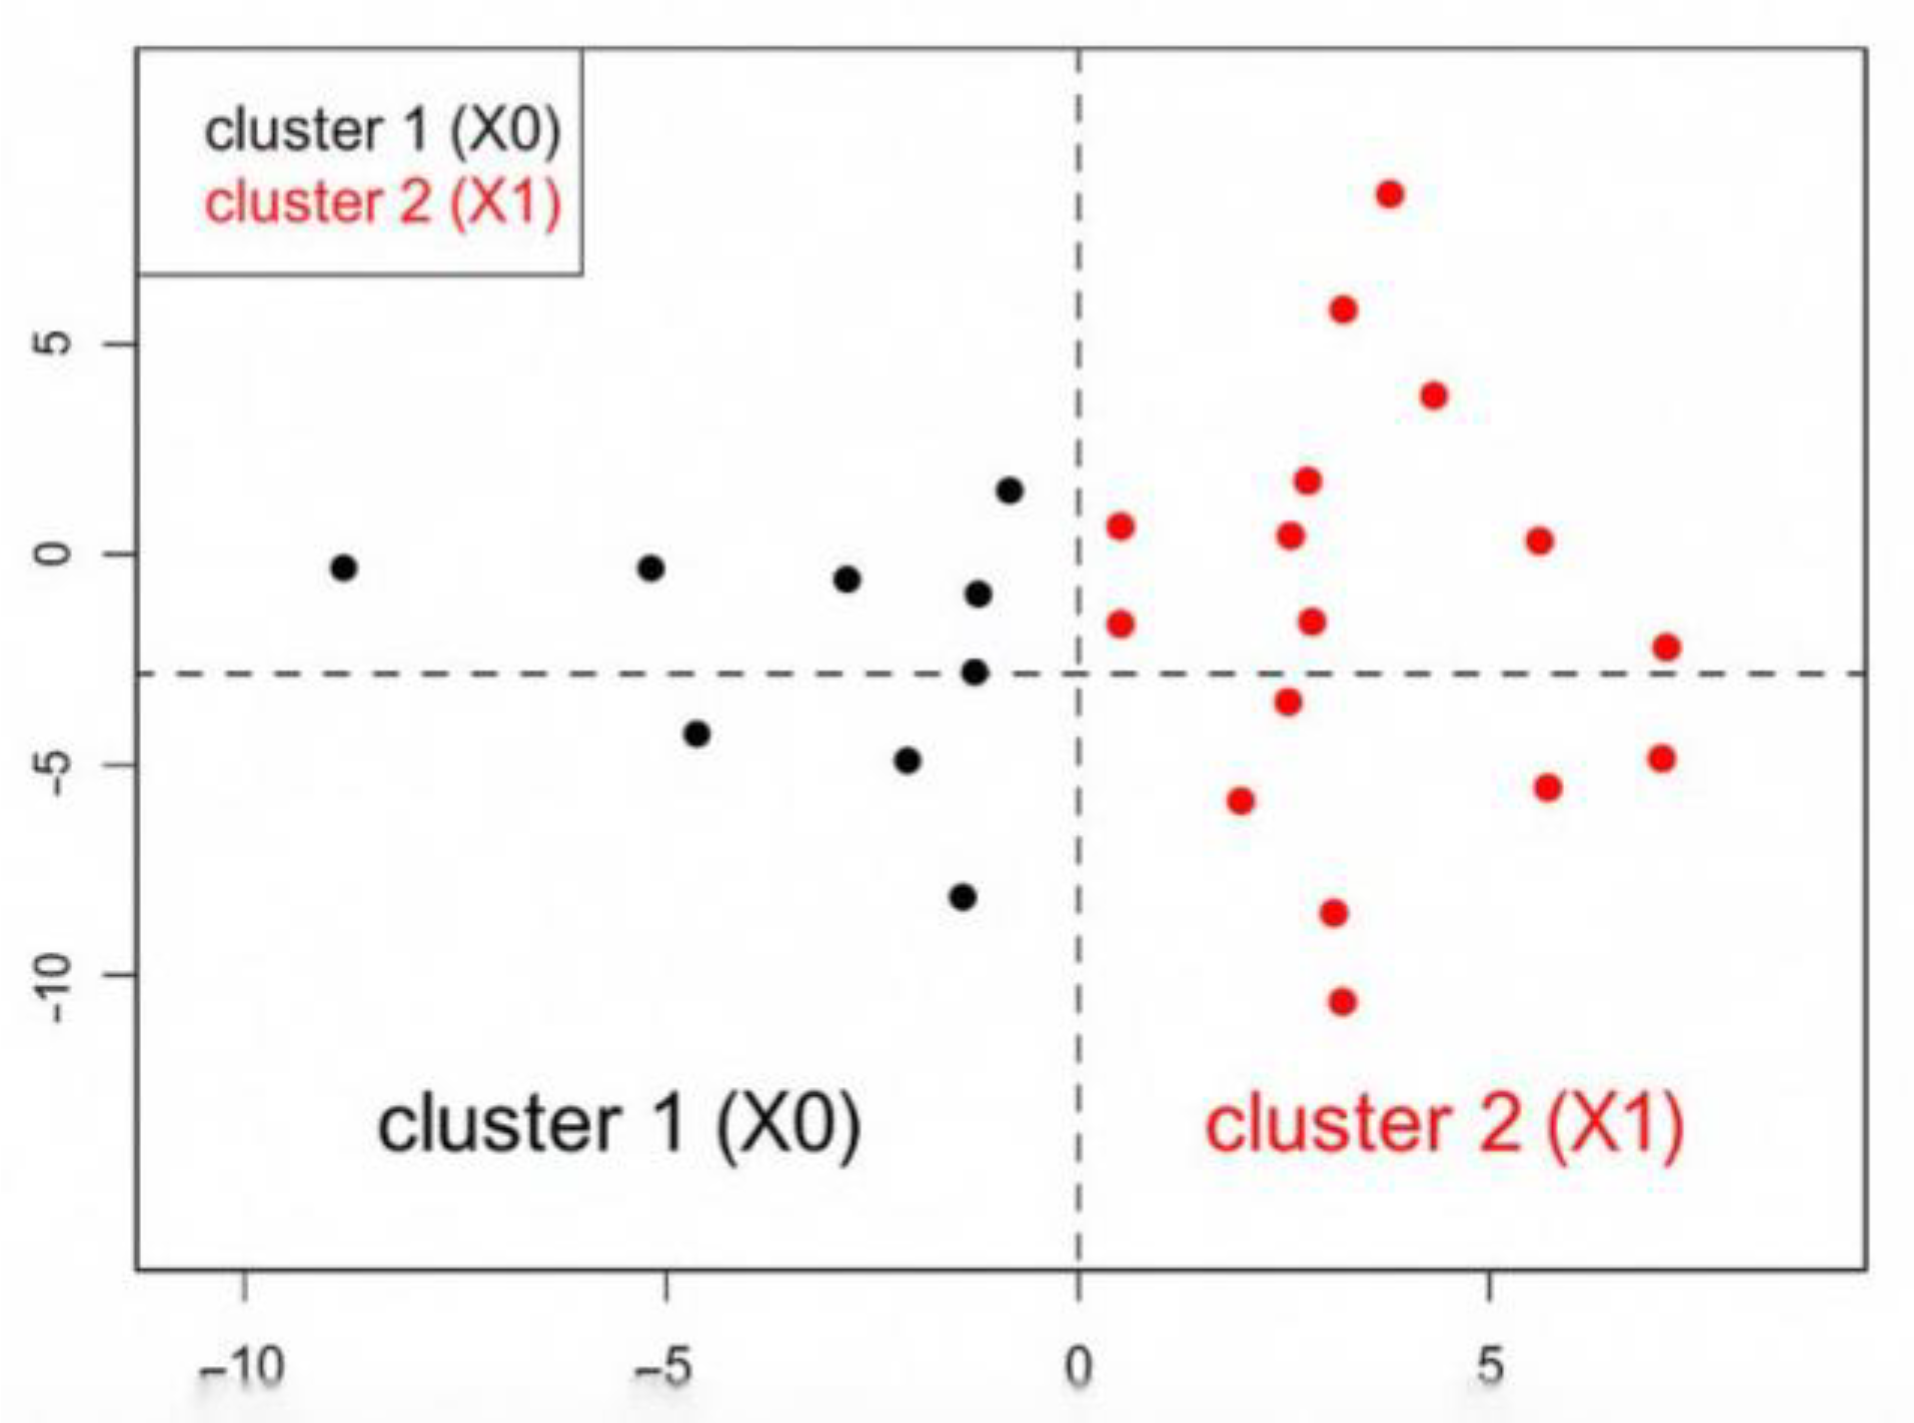

Table 1.
Main clinical characteristics of the whole study cohort and baseline descriptive statistics.
Table 1.
Main clinical characteristics of the whole study cohort and baseline descriptive statistics.
| Non-Urinary(X0) (n=33) |
Urinary(X1) (n=17) |
Combined (n=50) |
p-Value |
|
|---|---|---|---|---|
| Male sex, n (%) | 20 (61%) | 15 (88%) | 35 (70%) | 0.043 |
| Age (years) | - | - | 68.0 ± 7.0 | - |
| BMI (Kg/m^2) | - | - | 29.0 ± 4.0 | - |
| Smoking abitude, n (%) | 25 (76%) | 12 (73%) | 37 (74%) | ns |
| Allergy n (%) | 11 (32%) | 5 (30%) | 16 (32%) | ns |
| CV Disease n (%) | 28 (85%) | 17 (100%) | 45 (90%) | ns |
| C-PAP n (%) | 25 (76%) | 13 (77%) | 38 (76%) | ns |
| AHI | 37.0 ± 30.0 | 24.0 ± 15.0 | 32.0 ± 26.0 | ns |
| FEV1 (L/sec) | 2.3 ± 0.8 | 3.5 ± 1.0 | 2.5 ± 1.0 | 0.010 |
| FEV1 (%) | 84.0 ± 21.0 | 101.0 ± 9.0 | 88.0 ± 21.0 | ns |
| FVC (L/sec) | 2.8 ± 0.9 | 4.3 ± 1.0 | 3.1 ± 1.1 | 0.006 |
| FVC (%) | 84.0 ± 18.0 | 100.0 ± 8.0 | 87.0 ± 17.0 | ns |
| FEV1/FVC | 0.81 ± 0.11 | 0.81 ± 0.05 | 0.81 ± 0.09 | ns |
| ODI | 33.0 ± 26.0 | 22.0 ± 14.0 | 29.0 ± 23.0 | ns |
| t90 | 18.0 ± 25.0 | 6.0 ± 10.0 | 14.0 ± 21.0 | ns |
| Mean SpO2 | 94.0 ± 3.0 | 93.0 ± 2.0 | 93.0 ± 2.0 | ns |
Abbreviations: BMI = Body Mass Index; C-PAP=Continuous Positive Airway Pressure; n=number; AHI (Apnea-Hypopnea Index); ODI = Oxygen Desaturation Index; t90=time under 90% of Oxygen Saturation; FEV1=forced expiratory volume in one second; FVC=forced vital capacity; X0 = non urinary tract cancer; X1= urinary tract cancer.
Disclaimer/Publisher’s Note: The statements, opinions and data contained in all publications are solely those of the individual author(s) and contributor(s) and not of MDPI and/or the editor(s). MDPI and/or the editor(s) disclaim responsibility for any injury to people or property resulting from any ideas, methods, instructions or products referred to in the content. |
© 2025 by the authors. Licensee MDPI, Basel, Switzerland. This article is an open access article distributed under the terms and conditions of the Creative Commons Attribution (CC BY) license (http://creativecommons.org/licenses/by/4.0/).
Copyright: This open access article is published under a Creative Commons CC BY 4.0 license, which permit the free download, distribution, and reuse, provided that the author and preprint are cited in any reuse.


